Technical Guidance Note (Monitoring) Environmental ...
48
Technical Guidance Note (Monitoring) M9 Environmental monitoring of bioaerosols at regulated facilities Environment Agency January 2017 Version 1
Transcript of Technical Guidance Note (Monitoring) Environmental ...

Technical Guidance Note (Monitoring)
M9
Environmental monitoring of bioaerosols
at regulated facilities
Environment Agency January 2017
Version 1

Foreword
This technical guidance note is one of a series providing guidance on monitoring to regulators, process operators and those with interests in monitoring. It provides information on the monitoring of bioaerosols from stacks, open biofilters and in ambient air. It focuses on the following bioaerosol components:
the thermotolerant fungus, Aspergillus fumigatus
total mesophilic bacteria The general principles of the measurement methods may also be used to measure other types of bioaerosols.
Acknowledgements The support of Natural Resources Wales is gratefully acknowledged.
Feedback Any comments or suggested improvements to this technical guidance note should be emailed to our National Customer Contact Centre: [email protected].
Status of this technical note This technical note may be subject to review and amendment following its publication. The latest version can be found on our website at: www.mcerts.net.

Contents 1 Scope ........................................................................................................................... 1 2 Introduction ................................................................................................................. 1
2.1 What bioaerosols are ............................................................................................. 1 2.2 Sources of bioaerosols .......................................................................................... 1 2.3 Why bioaerosols are a concern ............................................................................. 2 2.4 Sampling bioaerosols ............................................................................................ 2
3 Sampling emissions from stacks ............................................................................... 3
3.1 Sampling location and sampling facilities ............................................................... 3 3.2 Sampling procedures ............................................................................................. 3 3.3 MCERTS accredited organisations ........................................................................ 5
4 Sampling emissions from open biofilters .................................................................. 5 5 Sampling ambient emissions ..................................................................................... 8
5.1 Introduction to sampling techniques and strategy .................................................. 8 5.2 Sample location strategy ....................................................................................... 9 5.3 Measurement and assessment of meteorological conditions ............................... 14 5.4 Number of samples ............................................................................................. 16 5.5 Sample time ........................................................................................................ 17 5.6 Sampling using impaction samplers ..................................................................... 17 5.7 Sampling using filters ........................................................................................... 21 5.8 Strengths and weaknesses of Andersen sampler and IOM personal sampler ...... 23
6 Laboratory preparation, culture and enumeration of colonies .............................. 25
6.1 Laboratory equipment, culture media and solutions ............................................. 25 6.2 Culturing colonies ................................................................................................ 27 6.3 Colony enumeration............................................................................................. 29 6.4 Data recording and reporting ............................................................................... 31
7 Data reporting and interpretation ............................................................................. 32
7.1 Approach to reporting .......................................................................................... 32 7.2 Reporting applicable to all methods ..................................................................... 32 7.3 Reporting emissions from stack sampling ............................................................ 32 7.4 Reporting emissions from biofilter sampling ......................................................... 33 7.5 Reporting emissions from ambient sampling ....................................................... 34 7.6 Measurement uncertainty .................................................................................... 35
Annex 1: Open biofilter sample strategy ......................................................................... 36 Annex 2A: Calculation of average wind speed and direction ........................................ 38 Annex 2B: Calculation of wind speed versus height above ground ............................. 39 Annex 3: Stack emissions monitoring report form ......................................................... 40 Annex 4: Biofilter emissions monitoring report form ..................................................... 41 Annex 5A: Ambient emissions monitoring report form ................................................. 42 Annex 5B: Meteorological report form for ambient emissions monitoring .................. 43 Annex 6: References ......................................................................................................... 44

M9: Environmental monitoring of bioaerosols at regulated facilities
M9, Version 1, January 2017 Page 1 of 45
1 Scope This technical guidance note has been produced to provide a standardised approach for monitoring bioaerosols. It is applicable to facilities that have both ambient and point source emissions. It has been developed to replace the 2009 standardised protocol for monitoring ambient bioaerosols at open compost facilities1, which we developed with the Association for Organics Recycling (now known as the Organics Recycling Group). Since 2009, the number of enclosed biowaste treatment facilities, which have point source emissions from stacks or biofilters, has continued to increase. Also, there have been various developments in approaches and techniques for bioaerosol monitoring. In order to take account of these changes, we agreed with the Organics Recycling Group that it was necessary to produce this technical note. The technical guidance note includes methods to measure point source emissions from a stack or biofilter, as well as methods to determine bioaerosol concentrations in ambient air downwind of a facility. Bioaerosol monitoring can have a role to play in environmental risk assessment, and in assessing whether the control measures in place at a facility are maintaining bioaerosols at acceptable levels. We will include bioaerosol monitoring requirements as an environmental permit condition, where appropriate. Although, this technical guidance note focuses on biological treatment of waste facilities, the principles of the measurement approaches can be applied to other types of facility.
2 Introduction 2.1 What bioaerosols are Bioaerosols are found naturally within the environment. They consist of airborne particles that contain living organisms, such as bacteria, fungi and viruses or parts of living organisms, such as plant pollen, spores and endotoxins from bacterial cells or mycotoxins from fungi. The components of a bioaerosol range in size from around 0.02 to 100 micrometres (µm) in diameter. A typical Aspergillus fumigatus spore, for example, is around 3µm in diameter. The size, density and shape of a bioaerosol will affect its behaviour, survivability and ultimately its dispersion in the atmosphere. 2.2 Sources of bioaerosols Composting, anaerobic digestion and mechanical biological treatment are the principal biological treatment technologies used in the UK to treat biowastes, such as garden, food and residual household wastes. These technologies depend on a large number of microorganisms to break down organic material in the wastes. Composting, for example, relies on bacteria, including spore-forming filamentous actinomycetes and fungi to produce a sanitised, stabilised, organic substrate that can be used on land or in horticulture (feedstock dependant). In composting, as the material breaks down it goes through different temperature dependent stages that are dominated by certain groups of bacteria and fungi. Bacteria are the most numerous group of microorganisms. Aspergillus fumigatus is a

M9: Environmental monitoring of bioaerosols at regulated facilities
M9, Version 1, January 2017 Page 2 of 45
mesophilic fungus that is thermotolerant and is present throughout the different stages of the breakdown process. The dependence on microorganisms to degrade the organic material, and the way in which the material is processed make biological treatment facilities a source of bioaerosols. 2.3 Why bioaerosols a concern The risks from bioaerosols have been reviewed for a number of years, which has led to reports that exposure to bioaerosols has been associated with human health effects2, 3, 4, 5. Adverse health effects have been observed in occupational settings involving exposure of workers to high concentrations of bioaerosols. Bioaerosol exposure has been identified with associations between respiratory and gastrointestinal illness at waste management facilities. Aspergillosis caused by exposure to the spores from Aspergillus fumigatus has been reported to give rise to a severe infection of the respiratory system and long term chronic respiratory conditions. In particular, people who have a suppressed immune system are at higher risk of developing infection. 2.4 Sampling bioaerosols Bioaerosols can be measured using a number of different techniques6, 7. This technical note describes the following techniques for sampling bioaerosols: Impaction The impaction method uses a single stage Andersen sampler, loaded with a Petri dish of appropriate media. This method uses inertial forces to collect microorganisms in the air. Air is drawn through the perforated holes in the sampling head at a constant rate, using a vacuum pump. The velocity of the air is determined by the diameter of the holes in the sampling head. When the air hits the collection surface it is forced to change direction. The inertia of the microorganisms prevents them from changing direction, which causes them to become impacted onto the Petri dish media. When a sufficient volume of air has been collected, the Petri dish is removed and incubated, without further treatment. Filtration
The filtration method uses an Institute of Occupational Medicine (IOM) sampling head. The method collects microorganisms by drawing a defined volume of air through a 25 millimetres (mm) porous polycarbonate or quartz filter with a typical pore size of 0.8µm. The collection efficiency of this process depends on the physical properties of the particle and the filter, and the flow rate of the air. When a sufficient volume of air has been sampled, the filter is removed and placed into a buffer for further processing. Impingement
The impingement method uses the same approach as impaction, except that particles are collected in a liquid rather than onto a solid medium. Sampled air is drawn through a narrow inlet tube into a small flask, containing the collection medium. This narrow tube accelerates the air towards the surface of the collection medium. When the air hits the surface of the

M9: Environmental monitoring of bioaerosols at regulated facilities
M9, Version 1, January 2017 Page 3 of 45
liquid, it changes direction abruptly, which results in suspended particles becoming impinged into the collection liquid. When a sufficient volume of air has been collected, the collection liquid is processed. Bioaerosols analysis is reported in colony forming units (CFUs). A CFU is the unit that results in the growth of one colony on the selective medium used to culture microorganisms before analysis. A CFU may represent a single microbial cell or spore, or cluster of cells or spores that behave as a single aerodynamic particle. The CFU result is divided by the volume of gas sampled to give a final result in colony forming units per cubic metre of air (CFU/m3).
3 Sampling emissions from stacks 3.1 Sampling location and sampling facilities Suitable measurement locations with measurement ports, a working platform and suitable access are necessary to carry out stack emissions measurements. These requirements should be planned when designing a new plant because they are usually very difficult to install after a plant has been built. Further information on sampling locations and facilities is given in European standard CEN 152598 and Technical Guidance Note M19. 3.2 Sampling procedures The sampling of bioaerosols from stack gas emissions should be carried out by an organisation that has MCERTS accreditation (see section 3.3) for VDI 4257 Part 210. This method is based on isokinetic sampling and impingement into a saline solution (see section 6). Isokinetic sampling is a measurement technique used to obtain a representative sample of particulates in stack gas emissions, so is applicable for sampling airborne bioaerosol particles. Further information on isokinetic sampling is provided in Technical Guidance Note M211. The impinger specified by VDI 4257 Part 2 has been tested for different microorganisms over a broad range of concentrations. It is designed for a specific range of flow rates 16 to 30 litres per minute (l/min). It consists of an inlet tube and a sampling vessel, which contains the saline solution (see Figure 3.1). VDI 4257 Part 2 provides the specifications for the design of the impinger. Only impingers that meet this design can be used. They are available for purchase or can be made by glass blowers. Procedures must be in place to maintain sterility of the sample and sample equipment. This should include protection of the equipment from rain because this has the potential to affect sterility. Once sampling has been completed, samples must be stored and transported to the analytical laboratory at 5°C ± 3°C for analysis, within 24 hours of sampling. The transportation conditions (temperature, duration) must be documented. The culture and

M9: Environmental monitoring of bioaerosols at regulated facilities
M9, Version 1, January 2017 Page 4 of 45
enumeration of Aspergillus fumigatus and total mesophilic bacteria should be carried out using the methods described in this technical note (see section 6). Figure 3.1: Impinger with saline solution used for stack emissions sampling of bioaerosols (note the sterilised aluminium foil is used to maintain sterility of the impinger before and after use)
The VDI method was validated on intensive pig farms, where the emissions tend to be at ambient moisture levels. When used to measure bioaerosol emissions from stacks that have a higher moisture content (that is typically >10% volume / volume), such as from biowaste facilities, a second impinger, which does not contain saline solution, may be added after the first impinger. The second impinger is added to capture liquid that may be carried over from the first impinger, due to condensation of moisture in the stack gas. When this occurs, the condensate in the impingers will increase the final volume of saline solution, which will increase the limit of detection of the method. Also, as the diameter of the stack increases the length of the sample probe used will increase, which means that a greater volume of rinse solution will be needed to rinse the probe after collecting the sample. This will increase the final volume of saline solution, which will increase the limit of detection of the method. The limit of detection of the method can be improved by filtering the saline solution before analysis, and then re-suspending the bioaerosols in a smaller volume of saline solution.
M9: Environmental monitoring of bioaerosols at regulated facilities
M9, Version 1, January 2017 Page 5 of 45
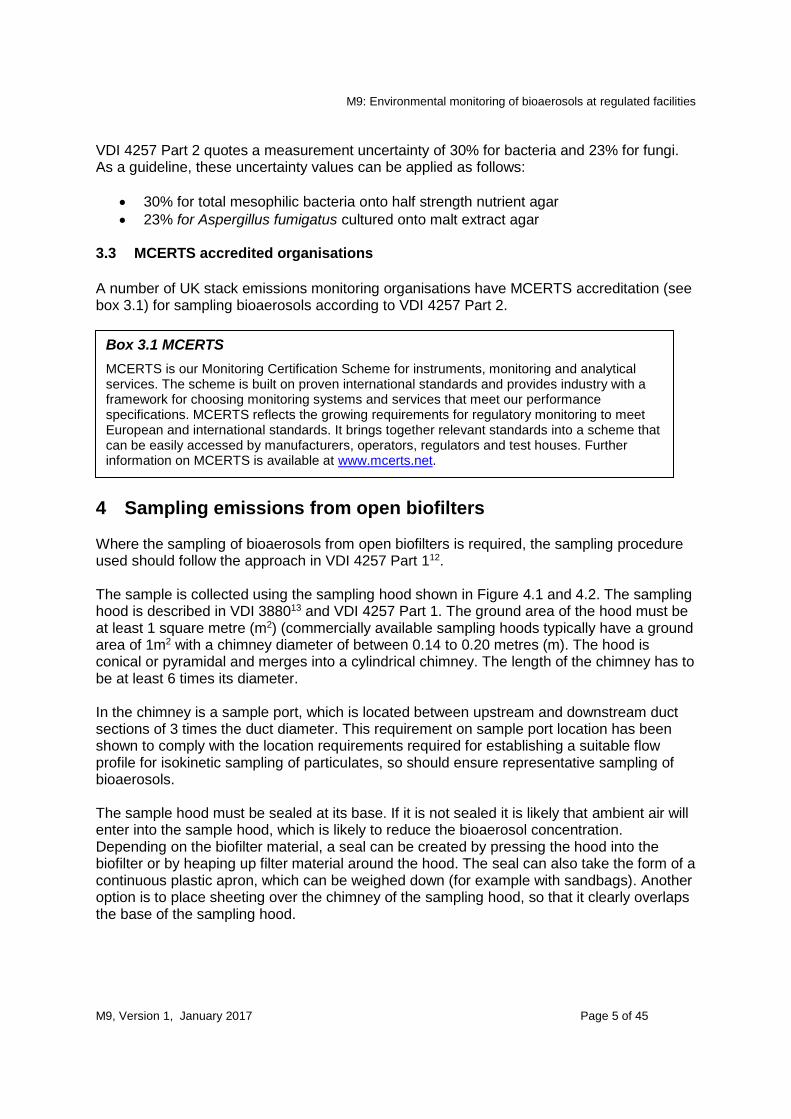
VDI 4257 Part 2 quotes a measurement uncertainty of 30% for bacteria and 23% for fungi. As a guideline, these uncertainty values can be applied as follows:
30% for total mesophilic bacteria onto half strength nutrient agar
23% for Aspergillus fumigatus cultured onto malt extract agar 3.3 MCERTS accredited organisations
A number of UK stack emissions monitoring organisations have MCERTS accreditation (see box 3.1) for sampling bioaerosols according to VDI 4257 Part 2.
4 Sampling emissions from open biofilters Where the sampling of bioaerosols from open biofilters is required, the sampling procedure used should follow the approach in VDI 4257 Part 112. The sample is collected using the sampling hood shown in Figure 4.1 and 4.2. The sampling hood is described in VDI 388013 and VDI 4257 Part 1. The ground area of the hood must be at least 1 square metre (m2) (commercially available sampling hoods typically have a ground area of 1m2 with a chimney diameter of between 0.14 to 0.20 metres (m). The hood is conical or pyramidal and merges into a cylindrical chimney. The length of the chimney has to be at least 6 times its diameter. In the chimney is a sample port, which is located between upstream and downstream duct sections of 3 times the duct diameter. This requirement on sample port location has been shown to comply with the location requirements required for establishing a suitable flow profile for isokinetic sampling of particulates, so should ensure representative sampling of bioaerosols. The sample hood must be sealed at its base. If it is not sealed it is likely that ambient air will enter into the sample hood, which is likely to reduce the bioaerosol concentration. Depending on the biofilter material, a seal can be created by pressing the hood into the biofilter or by heaping up filter material around the hood. The seal can also take the form of a continuous plastic apron, which can be weighed down (for example with sandbags). Another option is to place sheeting over the chimney of the sampling hood, so that it clearly overlaps the base of the sampling hood.
Box 3.1 MCERTS
MCERTS is our Monitoring Certification Scheme for instruments, monitoring and analytical services. The scheme is built on proven international standards and provides industry with a framework for choosing monitoring systems and services that meet our performance specifications. MCERTS reflects the growing requirements for regulatory monitoring to meet European and international standards. It brings together relevant standards into a scheme that can be easily accessed by manufacturers, operators, regulators and test houses. Further information on MCERTS is available at www.mcerts.net.

M9: Environmental monitoring of bioaerosols at regulated facilities
M9, Version 1, January 2017 Page 6 of 45
Since sampling hoods are also susceptible to the wind at the chimney outlet, a wind collar is required at the outlet to screen off the wind, thus keeping the flow conditions in the sample hood constant. Figure 4.1: Sample hood for measurement of flow velocities and for sampling biofilters (diagram based on VDI 4257 Part 1)
Biofilter
Biofilter air flow
Hood apron (optional)
Wind break collar
Sample port located with 3 x the duct
diameter upstream and 3 x the duct
diameter downstream
Length of duct > 6 x the
diameter
Diameter is usually
between 0.14 to 0.20m
Hood area is usually 1m2

M9: Environmental monitoring of bioaerosols at regulated facilities
M9, Version 1, January 2017 Page 7 of 45
Figure 4.2: Sample hood for measurement of flow velocities and for sampling biofilters (the hood can also be used to measure odour, as seen in this figure)
The sampling strategy is to split the biofilter surface area into a grid of partial areas, and to sample a sufficient number of areas within the grid to provide a representative sample. The number of partial areas depends on the size of the biofilter, and how evenly distributed (homogeneous) the flow velocity is. The flow velocity is determined by positioning the hood over each partial area. Velocity and temperature are measured at a single point in the centre of the chimney. A vane anemometer or a thermal anemometer can be used for the measurement of velocity (the velocity is typically less than 3 metres per second (m/s), so a Pitot tube, which is commonly used for determining velocity in stack emissions monitoring, would not be suitable). The flow through the biofilter is considered homogenous if the flow through the partial areas differs by a factor of <2. If the factor is >2, then the active area source is subdivided into 2 flow classes, which are then considered as separate homogeneously aerated area sources. Factors >4 indicate the biofilter is not functioning properly and will need to be restored. The number of partial areas is dependent on the size of the biofilter. For example, biofilter sizes up to 100m2 will be subdivided into 10 partial areas (see Annex 1) compared to biofilter sizes up to 40m2 that will subdivide into 4 partial areas. The sampling strategy described in VDI 4257 Part 1 can lead to a large number of samples being required to ensure that a biofilter is sampled representatively. VDI 4257 Part 1 states that a single sample to be taken from each partial area or up to 4 partial areas can be sampled sequentially to make a single combined cumulative sample (30 minutes is the maximum sample time permitted, so each partial area is sampled for 7 minutes and 30 seconds to give a cumulative sample of 30 minutes). Also, to reduce analysis costs, up to 4 samples can be combined to form a single sample (see Annex 1).

M9: Environmental monitoring of bioaerosols at regulated facilities
M9, Version 1, January 2017 Page 8 of 45
The sample is extracted using the isokinetic sampling / impinger absorber solution approach described in VDI 4257 Part 2.
5 Sampling ambient emissions 5.1 Introduction to sampling techniques and strategy
Ambient sampling of bioaerosol emissions from open facilities can be done using a number of different techniques7. The techniques specified in this technical note use impaction samplers (Andersen sampler) or filters (IOM personal sampler). European Technical Specification, CEN TS 16115-114, is a method for the determination of moulds, using filter sampling systems and culture based analyses. This method works on the same principles described in this technical note but it specifies different sampling equipment and uses a different filter configuration, made of layers of gelatine and polycarbonate. The equipment is larger and more difficult to transport in the field than the sampling equipment routinely used in the UK. Although, this equipment is not described in this technical note, it may still be used for sampling in the UK for regulatory monitoring (if this approach is used the culturing of total bacteria and Aspergillus fumigatus must be done in accordance with the selective media described in Section 6). European Technical Specification, CEN TS 16115-215provides broad guidelines on the sampling principles for carrying out bioaerosol assessments in ambient air, associated with biowaste facilities. The principle of this specification is to compare the concentrations in air unaffected by the activities of the facility (that is the background air sampled upwind of the plant) with the concentration of bioaerosols in air downwind of the plant. This comparison enables an assessment of the plant related contribution over a specified area to be made. The difference between the upwind and downwind concentration caused by bioaerosol emissions from the site is known as the process contribution. It uses sampling locations that form a fan like shape, which helps to ensure that variable wind directions are taken account of during the sampling period. CEN TS 16115-2 emphasises that the sample strategy must be determined based on measurement objectives. An important difference in approach between this technical note and CEN TS 16115-2, is that the measurement objective in this technical note specifies a sample strategy to determine bioaerosol concentrations at the nearest sensitive receptor (see Box 5.1). This technical guidance note follows the general principles given in CEN TS 16115-2 but specifies less sample locations, than used in the examples given in the technical specification, because it focuses on determining the bioaerosol concentration at the nearest sensitive receptor only. The sample strategy specified in this technical note has been agreed in consultation with UK industry and bioaerosol monitoring specialists.
Box 5.1: definition of nearest sensitive receptor for composting and anaerobic digestion for standard rules permits
‘Nearest sensitive receptor’ means the nearest place to the permitted activities where people are likely to be for prolonged periods. This term would therefore apply to dwellings (including any associated gardens) and too many types of workplaces. We would not normally regard a place where people are likely to be present for less than 6 hours at one time as being a sensitive receptor. The term does not apply to those controlling the permitted facility, their staff when they are at work or to visitors to the facility, as their health is covered by Health and Safety at Work legislation, but would apply to dwellings occupied by the family of those controlling the anaerobic digestion facility.

M9: Environmental monitoring of bioaerosols at regulated facilities
M9, Version 1, January 2017 Page 9 of 45
This guidance is applicable to most sites but cannot be applied to all sites, due to local site specific issues, such as topography, restricted access to private land, cropped fields, open water or location of structures and buildings. Under these circumstances deviations from the preferred approach can be made. Deviations should be described in a sampling strategy that is prepared by the monitoring organisation, and agreed by the operator of the facility and the competent authority. Any deviations should also be recorded, when the results are reported. 5.2 Sample location strategy
5.2.1 Application of different approaches The following sections, which are based on CEN TS 16115-2, describe approaches that must be considered when designing a sampling strategy. A number of different sample locations are required to assess the levels of bioaerosol emitted from an open facility. It is necessary to locate these at specified distances, which are dependent on the distance from the centre of the active operational area. For example, the active operational area for composting is the area where activities, such as waste shredding, waste screening and windrow turning is taking place. The active operational area should be assessed by the operator and monitoring consultant, during the development of the sample strategy. 5.2.2 Sample locations upwind of the site Sampling should be carried out upwind of the site. Upwind data should provide information on the concentration of specified bioaerosols that are present in the air blowing onto the operational area of the site. This should reflect either the background concentration at that time, or the effects of neighbouring operations, such as agricultural activities. Upwind data indicates the concentration of bioaerosols that would be present, irrespective of whether the facility was there or not. The sample location of the upwind concentration measurement should be measured at a distance of 50m from the centre of the active operational area. If a neighbouring operation, structure or installation prevents sampling at this location, then sampling should be carried out at a location, which is at a distance as far upwind as is possible between the active operational area and the neighbouring operation, structure or installation. Also, if a neighbouring operation has the potential to generate bioaerosols, then the upwind sample location should be located between the active operational area of the facility being assessed and the neighbouring operation, which may mean the same location is closer to the active operational than the preferred distance of 50m. If an upwind location is used that is not at the recommended distance from the active operational area, then an explanation for this should be included in the monitoring report. Whenever these samples are collected, a note should be made of any upwind activities that may affect the concentration of bioaerosols (for example, agricultural processes and landfill activities).

M9: Environmental monitoring of bioaerosols at regulated facilities
M9, Version 1, January 2017 Page 10 of 45
5.2.3 Sample locations downwind of the site Sampling should be carried out downwind of the site, using a fan like shape arrangement to detect the position of the plume. The orientation of the measurement area is determined by the prevailing mean wind direction. This approach is used to ensure that measurements are made in the emission plume, during the sampling campaign. If there are any buildings, installations or structures between the downwind location(s) and the centre of the active operational area, then sampling should be carried out upwind of that structure or installation, at a distance greater than twice its height.
5.2.4 Fan like shape sampling arrangement The sampling arrangement is designed to assess bioaerosol levels at the nearest sensitive receptor to the site. Sampling should be carried out at a minimum of 1 upwind and 3 downwind locations in a fan like arrangement simultaneously. The upwind location is located at 50m from the centre of the active operational area. The downwind sampling locations are selected, based on the mean direction of the wind, to ensure measurements are made in the emission plume, during the sampling campaign. The distance of the downwind locations from the centre of the active operational area should be the same as the distance of the nearest sensitive receptor from the source. This approach measures the potential bioaerosol exposure at the nearest sensitive receptor, assuming the wind was blowing in the direction of the receptor and the terrain is similar. Figure 5.1 shows this approach applied to a facility with a single point source. A central traverse is determined based on the mean wind direction. A sampling traverse line is run through these points at an angle of 30° (±3) to the centre traverse. Topography or vegetation may restrict the line of sight required to locate sample traverses. This may make it difficult to determine the angle for locating the sample points. The restriction should be noted in the sample strategy and final monitoring report.

M9: Environmental monitoring of bioaerosols at regulated facilities
M9, Version 1, January 2017 Page 11 of 45
Figure 5.1: Simplified fan like shape sampling arrangement for point sources (adapted from CEN TS 16115-2)
For area sources, the orientation of the fan like shape sampling arrangement is selected by determining the centre point of the sources in the site. The centre points are determined from an estimate of the mass emissions for each source, and then determining the weighted geometric centroids (a calculation is provided in CEN TS 16115-2). If it is not possible to determine the mass emissions of each source, then they can be estimated or it can be assumed that each source contributes equally. The sampling locations are then determined on each traverse line, in the same way as for a point source emission (see Figure 5.2).
Upwind sample location
Downwind sample locations
Mean wind direction
30°
30°
Site boundary
Centre of point source

M9: Environmental monitoring of bioaerosols at regulated facilities
M9, Version 1, January 2017 Page 12 of 45
Figure 5.2: Simplified fan like shape sampling arrangement for area sources (based on CEN TS 16115-2)
Figure 5.3 shows a schematic of how the downwind sample locations relate to the mean wind direction and the location of the nearest sample receptor. Figure 5.3: Example application of fan like shape sampling arrangements related to the location of the nearest sensitive receptor
Upwind sample location
Mean wind direction
30°
30°
Site boundary
Centre of area sources in grey
Area sources
Centre of area sources in black
Centre of site’s area sources
Downwind sample locations
Downwind - 175m to centre
of area sources
175m
Upwind – 50m to centre of area source
Sample locations
Mean wind direction on day of sampling
Nearest sensitive receptor
Site boundary

M9: Environmental monitoring of bioaerosols at regulated facilities
M9, Version 1, January 2017 Page 13 of 45
5.2.5 Modifications to fan like shape sampling arrangement In practice it is not always possible to comply with the fan like shape sampling arrangement. For example, it may need to be adapted if there are split or multiple sources or if there are confounding sources, whose contribution is not from the site being assessed. Under these circumstances an assessment should be made of whether sources are treated separately or as an area or a line source, and if confounding sources need to be taken account of. At sites that have a number of separate widely spread area sources, the sources that are located more than 250m away from the nearest sensitive receptor should be discounted from the sampling strategy because they not are likely to affect the sensitive receptor. At a large site with widely spread sources and multiple sensitive receptors at different locations, it may be necessary to carry out separate assessments for sensitive receptors. Another complication is that access to the exact required sample locations may not always be possible. Under these circumstances it may be acceptable to sample a few degrees off-axis from the required locations. If this is not possible, the fan shape arrangement will have to be adapted. The fan like shape arrangement will also need to be adapted if topography has a significant impact on meteorological conditions. For example, earth works or stands of trees would have to be taken into account because they may affect the flow of wind from the site, which may affect the position of some or even all of the sample locations. Health and safety must always be considered at the earliest point in the monitoring strategy and must be given the highest priority. Such considerations may lead to modification of the fan like shape sampling arrangement. A sample location that would meet the requirements of the fan like shape sampling arrangement must not be used, if it introduces an unacceptable safety risk. For example, a location that falls within the facilities’ operational boundary should not be used because of on-site hazards, such as site traffic. Some sites may be affected by several of the above issues. A summary of issues that have been encountered by organisations carrying out these assessments is provided in Box 5.2. Box 5.2: Summary of issues that make implementation of the fan like shape sampling arrangement difficult
Source:
other bioaerosol source(s) adjacent to site
site operational areas split into different locations
potential interference from passing vehicles Access:
sites with restricted access to sample locations (for example: private land without permission to access, land overgrown, woodland, road, railway, rivers and other water bodies)
site not visible from sampling location
sample location within operational site boundary Topographic impacts on meteorology:
site within a quarry
significant variable wind direction (due to site location / topography / site layout / structures)

M9: Environmental monitoring of bioaerosols at regulated facilities
M9, Version 1, January 2017 Page 14 of 45
Operators of sites that are unable to follow the fan like shape arrangements should contact the competent authority to agree a modified sampling strategy, which could involve an increased number of measurements to mitigate the fact that the standard sampling strategy could not be followed. For example, a single central traverse could be used but an increased number of samples, which are spread over a longer time period, would be needed to compensate for not using the fan like shape sampling arrangement. 5.2.6 Carrying out the measurements The bearing from true north of the sample locations from the centre of the active operational area should be measured (in degrees) and recorded. This bearing can be estimated from a scale map of the site. In order to determine the bioaerosol process contribution from the site, sampling at the upwind and downwind locations should be carried out concurrently, so that the results can be compared. A sample is considered to be concurrent if the sample times overlap by a minimum of 10% of each other.
Sampling should not be carried out during rain, sleet or snow (as this obstructs the air jets in the sampler and may damage the vacuum pump); or if the ambient temperature falls below 3°C (as this causes unacceptable levels of condensation to form in the sampler and tubing). When planning a sampling programme, consideration should be given to the likelihood that inclement weather may make sampling impractical on that day. 5.3 Measurement and assessment of meteorological conditions
5.3.1 Measurement of meteorological conditions
As the prevailing meteorological conditions, during sampling, have a significant influence on the measurement results, they shall be considered in the evaluation of the results. CEN TS 16115-2 specifies that the following meteorological parameters should be determined:
wind speed
wind direction
temperature
relative humidity
atmospheric conditions
An automatic weather station, with an integral data logger should be available on site, during monitoring periods. It can be located permanently or temporarily on site, in a location that meets standard guidance, away from any intervening structures or buildings, which could influence measurements. It should enable an operator to accurately record the wind speed and wind direction representative of the site. It should also record the air temperature and relative humidity. The wind speed and wind direction should be measured and recorded every minute, the air temperature and relative humidity should be measured and recorded, as a minimum, every 10 minutes.

M9: Environmental monitoring of bioaerosols at regulated facilities
M9, Version 1, January 2017 Page 15 of 45
Whenever sampling takes place, the prevailing weather conditions should be assessed and recorded. This should include an estimate of cloud cover (for example using oktas, which is a unit of measurement used to describe the amount of cloud cover at a specific location). Meteorological data (wind speed and direction, air temperature and relative humidity) recorded by the weather station's data logger should be downloaded from the data logger onto a computer at the end of the sampling day. A record should be kept of all data collected on the sampling day. 5.3.2 Assessment of meteorological conditions The average wind speed and average wind direction must be calculated for the duration of the sampling period for each sample. This cannot be estimated by calculating the arithmetic mean of the values during each sampling period. Both wind variables (speed and direction) should be converted into vectors, the average of these components are calculated, then the vector converted back into the individual components of wind speed and wind direction. A mathematical formulae that can be used to do this is detailed in Annex 2. If the weather station has been orientated using a compass, then the calculated wind directions must be converted from magnetic to true north bearings. The weather station will record the direction the wind has blown from. This should then be converted into the direction the wind blows to, by adding or subtracting 180° to the calculated true north average wind direction bearings.
The difference between the bearing of the samplers and the average bearing to which the wind blows during the sampling period should be calculated. The difference for the upwind samples should ideally be 180°. The difference for the downwind sample in the centre of the fan like shape should ideally be 0° (a difference of up to ±30° is acceptable). The wind flow direction should be from the source toward the samplers within the ±30° sector for over 80% of the sampling duration. Deviations from this should be noted in the monitoring report, and discussed in context with the results. CEN TS 161151-2 states that the preferred wind speed range for carrying out bioaerosol monitoring is between 2 to 4 m/s at a sampling height of 10m averaged over the sample duration. A sampling height of 10m is chosen because by convention wind speeds are reported at this height. It is recognised that sampling at this height may not be practical, so wind speed measurements at other heights are acceptable (a wind speed versus height calculation can be used to infer the change in wind speed from the measured height to a height of 10m - see Annex 2). It is recognised that wind speeds do vary over short periods of time, so wind speeds outside of the preferred range, although best avoided, are acceptable.

M9: Environmental monitoring of bioaerosols at regulated facilities
M9, Version 1, January 2017 Page 16 of 45
It is useful to measure wind speed, using a portable instrument, at the same height that the Anderson or IOM sampler(s) is located. It is advisable to do this at the upwind location and at the downwind location of the sample point on the central traverse of the fan like shape. This provides the sample team with information on changes in wind speed. It also provides information on the wind speed and direction at the exact location where the sample is being taken. These measurements may be made alongside other wind speed measurements, such as those made using a permanent weather station, or they may provide the only wind speed measurements for the duration of the sampling. The arithmetic mean of the air temperature and relative humidity should be calculated and recorded for the duration of each sampling period. This data provides information on potential survival rate (tenacity) of bioaerosols, which can have a major influence on the measurement results. It is known that warmer temperatures aid growth of bioaerosols, while a relative humidity of 80% or more means they remain viable longer. Similarly, it is necessary to record cloud cover because ultra violet light reduces the survival rate of bioaerosols. It is necessary to assess and record the weather conditions because this provides information about dispersion conditions, especially potentially unfavourable dispersion conditions, which can lead to an increased impact locally. 5.4 Number of samples The number of samples depends on the sampling technique used because bioaerosols collected on a filter can be suspended in a solution, which can then be used for generating results in the analytical laboratory for different bioaerosol components. It is not possible to do this with the impaction method because this sample technique relies on sampling directly onto the Petri dish that will be used for the laboratory analysis (a Petri dish is used to culture microorganisms. A Petri dish will provide a single result for either Aspergillus fumigatus or mesophilic bacteria, depending on the culture medium used). Table 5.1 compares the number of on-site samples required when carrying out a sample campaign using Andersen samplers and IOM Personal samplers. Table 5.1: number of samples required when carrying out sampling for Aspergillus fumigatus and mesophilic bacteria with Andersen and IOM Personal Samplers
Number of filter heads / impactors
Number of on-site samples
Number of plates in laboratory Note 3
Fan-like shape (4 locations)
Andersen 4 Note 1 & 2 24 24
IOM 12 12 72 Note 4
Note 1This is a minimum number of samples. Note 2This is based on using 1 impactor at each location. The time spent on site would be reduced if more
impactors were used. Note 3 This does not include blanks. Additional plates are used if serial dilution is required for IOM samples. Note 4 The filter from each sample is plated in triplicate.

M9: Environmental monitoring of bioaerosols at regulated facilities
M9, Version 1, January 2017 Page 17 of 45
5.5 Sample time
The sample time depends on the sampling technique and the sampling strategy. Impactors can only be used for a short period of time (typically between 1 to 20 minutes) because the plates can become overloaded. This is more likely to occur the closer the sample location is to the source of bioaerosols. Overloading does not affect filters, so longer sample times are possible but it is possible that the bioaerosols captured on the filter will become stressed, and begin to die off over time. A sample time of 60 minutes is recommended for the filter technique. Although, if close to the source, shorter sample times may be more appropriate, due to the potential build-up of dust on the filter, and potentially high concentrations of bioaerosols, which would make analysis more onerous, due to the need to use more dilution steps. Impactors can be used over a short sample time, which means the effect of variable wind direction during the sample period is reduced but the chances of missing the emission plume may be increased, which means more repeat sample may be necessary. 5.6 Sampling using impaction samplers
5.6.1 Sampling equipment The impaction sampler used must perform to the same standard as a single stage Andersen sampler16. With direct impaction, Petri dishes of the appropriate media are loaded directly into the sampler and a defined quantity of air is sampled. These dishes are then incubated in the laboratory. Table 5.2 summarises the various items of equipment required to carry out sampling using an impaction sampler.

M9: Environmental monitoring of bioaerosols at regulated facilities
M9, Version 1, January 2017 Page 18 of 45
Table 5.2 Equipment required when sampling using an impaction sampler
Item Recommended quantity / comments
On-site sampling
Weather station 1; capable of monitoring wind speed and direction, air temperature and relative humidity.
Digital watch/timer 1 per person or per pump (or pumps with integral timers).
Consumables Re-sealable bags and/or sterile container for transporting plates, tissues,
indelible pen, plastic sheeting for use in work station or disinfected base (for example, table), 70% alcohol (ethanol or IMS), sterile gloves.
Cool box For transportation of samples with temperature control at 5°C ± 3°C.
Temperature device 1 max / min temperature indicator per cool box.
Impactor Method
Single stage impaction sampler
1 per sample location.
Vacuum pump(s) 1 high volume pump per sampler or 2 or more lower volume pumps connected in parallel; preferably DC electricity operated.
Tubing Appropriate length and diameter to attach sampler to vacuum pump.
Dry gas flow meter Minimum of 1; sufficient quantity to calibrate all vacuum pumps on-site to 30 l/min.
Tripod With suitable attachment points.
For this sampling approach, 1 single stage viable impactor sampler can be used to collect culturable microorganisms at each sample location. It should be thoroughly cleaned using 70 per cent (v/v) aqueous solution of ethanol or a 70 per cent (v/v) aqueous solution of industrial methylated spirits (lMS) and dried every time prior to use. A rubber or neoprene stopper should be used to temporarily plug the cone entrance after disinfection, prior to use, to reduce the likelihood of microbial contamination. Each impaction sampler should be mounted onto a tripod, or other suitable structure, so that the top of the inlet cone is held between 1.5 and 1.8m above the ground. Each single stage impaction sampler fitted with a cone should be fitted with a hemi-cylindrical baffle extending in height at least 15 centimetres (cm) above the top of the inlet of the cone, to ensure stagnation point sampling (see Figure 5.4 and Photograph 5.1).

M9: Environmental monitoring of bioaerosols at regulated facilities
M9, Version 1, January 2017 Page 19 of 45
Figure 5.4: Diagram of a single stage impaction sampler and picture of samplers (Andersen) set up in the field
Photograph 5.1: Single stage impaction sampler (Andersen) set up in the field
The sampler should be connected to a vacuum pump using tubing of an appropriate length and internal diameter.
ImpactionSampler
Baffle

M9: Environmental monitoring of bioaerosols at regulated facilities
M9, Version 1, January 2017 Page 20 of 45
Prior to every sample run the pump must be connected to a loaded sampler and calibrated at ambient temperature using a dry gas flow meter (with the resultant plate discarded). Air should enter the cone at a constant flow rate of 28.3 l/min to within an accuracy of ±2% (0.57 l/min). A digital watch or clock should be synchronised with the internal clock in the weather station data logger, so sample start and stop times can be recorded. 5.6.2 Sampling procedure A single Petri dish (with the lid removed) should be loaded into each sampler immediately prior to use, in accordance with the manufacturer's instructions. Once loaded, the sampler should be kept upright, to prevent the Petri dish from dislodging. A single sample of Aspergillus fumigatus (1 Petri dish containing selective medium) should be collected at each of the specified locations using a single stage impaction sampler. The same procedure should be repeated for mesophilic bacteria using Petri dishes containing selective medium specific for the culturing of mesophilic bacteria. The start and stop times when the vacuum is applied and shut off should be recorded using a synchronised digital watch. The sampling times should be such that no more than 300 colonies grow on each Petri dish. It is recommended that sampling times reflect the likelihood of overloading of the plates; initially a guideline of 20 minutes is suggested. However, shorter sampling times should be used if it is likely that local concentrations of airborne microorganisms will be high and cause overloading of the plates (>399 colonies); for example, as low as 1 minute in highly contaminated environments17. Petri dishes should be kept at 5°C ± 3°C before and after sampling. This means that they should be stored and transported from and back to the laboratory, in a temperature controlled environment, such as a temperature controlled cool box. The temperature and the duration of transportation must be documented. Sample processing should, if possible, be conducted immediately, but no later than 24 hours after the end of the sampling period. Control Petri dishes (blanks) containing all media types should also be included in the sampling programme. At least 2 Petri dishes containing the appropriate media for the microorganisms being sampled should be kept in resealable bags in the work station during the entire working day. At least 1 Petri dish containing each of the sampling media should be placed in a sampler at the downwind location and exposed for the same time period as the respective samples, except the vacuum pump should not be switched on. All control dishes should be handled, incubated and enumerated in an identical manner to the samples collected with the pumps operational.

M9: Environmental monitoring of bioaerosols at regulated facilities
M9, Version 1, January 2017 Page 21 of 45
5.7 Sampling using filters
The IOM personal sampler is housed in a two part filter cassette. Either a 25mm polycarbonate, quartz or fibre glass filter should be used to collect viable microorganisms. A defined quantity of air is sucked through the filter, on or in which, separation of the suspended particles occurs. The filter is then ‘washed’ in the laboratory, and the resulting fluid is spread onto Petri dishes of the appropriate media and incubated in the laboratory. 5.7.1 Sampling equipment Table 5.3 summarises the various items of equipment required to carry out sampling using IOM filter heads. Table 5.3 Equipment required when sampling using IOM sampling head
Item Recommended quantity / comments
On-site sampling
Weather station 1 capable of monitoring wind speed and direction, air temperature and relative humidity.
Digital watch/timer 1 per person or per pump (or pumps with integral timers).
Consumables Resealable bags and/or sterile container for transporting filters, tissues,
indelible pen, plastic sheeting for use in work station or disinfected base (for example, table), 70% alcohol (ethanol or IMS), sterile gloves.
Cool box For transportation of samples with temperature control at 5°C ± 3°C.
Temperature device 1 max / min temperature indicator per cool box.
Filter Method
Sampling head IOM sampling head, one for each filter being run concurrently.
Vacuum pump(s) 1 per filter; a compensating pump capable of a flow rate of 3 l/ min.
Dry gas flow meter Minimum of 1; sufficient quantity to calibrate all vacuum pumps on-site to up to 3 l/min.
Filters Polycarbonate, quartz or fibre glass filter, sterile, diameter 25mm, pore size
0.8μm.
Tweezers Sterile, to handle the filters.
Filter holder Disposable or multi-use with the ability to be sterilised.
Tubing Inner diameter of 8 to 10mm.
Sterile filters should be inserted into the filter holder in a laboratory safety cabinet and their sterility retained during transport. Filter sterility must be guaranteed up to the moment of sampling. The sterile filter holders and sterile filters must be mounted on the sampling apparatus without any contamination (using sterile disposable gloves). Prior to placing the filter holders, the filters should be visually inspected for integrity and exact, airtight fitting of the seat and the presence of O rings. This check should be repeated after removal of the filter holder from the sampling apparatus. For the tubing connecting the filter and pump, the inner diameter of the pipe or hose should be 8 to 10mm. The connecting hose should not exceed 1.5m in length. The sampling head must be operated in a fixed vertical position at a height of 1.5m above ground with vertical orientation (Figure 5.5). The sampling heads must be fixed securely to the mounting bar, in

M9: Environmental monitoring of bioaerosols at regulated facilities
M9, Version 1, January 2017 Page 22 of 45
order to maintain correct orientation during sampling. A bent pipe or hose connection can be used to connect the sampling head to the sampling apparatus. Figure 5.5 IOM Sampling heads in the field (note the sampling heads are fixed to bar to maintain the correct orientation)
Air is sucked into the sampling apparatus by a vacuum pump with a flow rate of 2 l/min up to 10 l/min (accurate to within 0.1 l/min)18. A gas volume meter is used to determine the sampling air volume. Prior to sampling, calibration of the sampling apparatus should be performed by means of a certified reference volume meter (laboratory float flow meter/rotameter, bellow gas meter, or bubble meter) having a measurement accuracy of more than ±2 % expressed in operational cubic metres, referenced to ambient air conditions. The reference volume meter must be connected to the air inlet of the sampling apparatus. The air inlet orifice of the reference apparatus should be free from restrictions. After successful adjustment of the flow rate, the display accuracy of the sampling apparatus should be checked against the reference volume meter. The air volume sucked through the sampling apparatus shall be indicated with an accuracy of ±1 % compared with the reference volume meter. 5.7.2 Sampling procedure A minimum of 3 filters should be collected at each of the specified locations. At each sample location, the 3 filters should be collected in parallel using separate sampling pumps at the same sampling height. Triplicate samples at a single sample location are considered to have been collected in parallel if the onset and cessation of the sampling periods do not differ by more than 10%. The start and stop times when the vacuum is applied and shut off should be recorded using the synchronised digital watch.

M9: Environmental monitoring of bioaerosols at regulated facilities
M9, Version 1, January 2017 Page 23 of 45
Typically, the sample times should be at least 60 minutes, in order to collect a representative amount. Although, if a higher sample rate is used, the sample time may be reduced, provided a sufficient sample volume is obtained. Much longer sample times should be avoided, as this can cause microorganisms to dry out and lose viability. Following sampling, filters can either be transported to the laboratory in their filter cassettes or placed in a Petri dish. If filters are placed in a Petri dish, they should be placed with the loaded surface upwards. The cassettes and Petri dish should be stored in separate re-sealable bags. It is important to protect them from disturbing impacts (that is sunshine, humidity or desiccation, heat and dust). Alternatively, prior to transport, samples can be stored in a buffer solution to prevent microbial stress but this must be done in a way that avoids potential contamination. Samples should be kept at 5°C ± 3°C after sampling. This means that they should be stored and transported from and back to the laboratory, in a temperature controlled environment, such as a temperature controlled cool box. The temperature and the duration of transportation must be documented. Sample processing should, if possible, be conducted immediately, but no later than 24 hours after the end of the sampling period. A minimum of 2 field blanks should be retained from each site visit. A blank is a filter treated in an identical manner as the real sample, but without sucking air through the sampling apparatus. For this purpose, a sterile filter holder with filter is placed in the sampling head with the pump switched off, then removed, packed and analytically processed; prolonged exposure of the filter to the ambient air should be avoided. The resulting blank represents the bioaerosols entering the sample simply by handling the filter during sampling. 5.8 Strengths and weaknesses of Andersen sampler and IOM personal sampler Typically in measurement science a single method is selected as the standard reference method. For bioaerosol sampling, the European Technical Specification CEN TS 16115-1 is an established procedure that by convention could be classed as the closest to meeting the requirements of a standard reference method. However, other alternative methods may be used provided they give equivalent results. Both the Andersen sampler and the IOM personal sampler, when used following the procedures given in this technical note, are alternative methods that can be used for regulatory monitoring in the UK. A Defra study stated that the Andersen sampler was generally better suited for ambient bioaerosol measurements from composting facilities, than the IOM filter heads6. Although the DEFRA study showed that the Andersen sampler has less variability than the IOM filter heads, it also showed that it was less suitable at high bioaerosol concentrations, due to overloading of the Andersen sampler’s plates. Table 5.4 compares the strengths and weaknesses of the Andersen sampler and the IOM personal sampler heads. Due to their different strengths and weakness both approaches are acceptable. Therefore, it is left to the user to decide which approach to use.

M9: Environmental monitoring of bioaerosols at regulated facilities
M9, Version 1, January 2017 Page 24 of 45
Table 5.4 Strengths and weaknesses of Andersen sampler and IOM personal sampler
Characteristic Impaction (Andersen) Filter (IOM)
Scope of use Can be used for Aspergillus fumigatus and mesophilic bacteria but they must be sampled separately.
Can be used for Aspergillus fumigatus and mesophilic bacteria. They can be sampled together as part of the same sample.
Sample volume Higher volume sampling (28.3 l/min). Lower volume sampling (2 l/min but may be used up to 10 l/min).
Sample time Guideline of 20 minutes but may be reduced to as low as 1 minute if high concentrations are expected.
Guideline of 60 minutes but may be reduced, provided a sufficient sample volume is collected.
Limit of detection
Better LOD (around 4 CFU/m3 based on a typical sample time and volume). Able to enumerate viable bioaerosols within a lower concentration range (<1,000 CFU/m3 – that is, at or close to background).
Appropriate where high bioaerosol concentrations may be expected (>10,000 CFU/m3), such as close to source. At sampling rates of 2 l/min, the limit of detection may be higher than the background concentration in ambient air (for example, a LOD after a 60 minutes sampling campaign in triplicate, using a 5 millilitre (ml) buffer solution for the filter, was 138 CFU/m3). Sampling rates can be increased up to 10 l/min, in order to improve the LOD.
Upper limit Risk of overloading at high concentrations, so may not be appropriate for sampling where higher concentrations might be expected, such as close to source.
Less risk of overloading at higher concentrations.
Flexibility of analysis / number of onsite samples
Samples of Aspergillus fumigatus and mesophilic bacteria must be collected on separate plates, which will double the number of samples required.
One filter can be re-suspended, and then analysed multiple times for different bioaerosols.
Sampling efficiency
Sample efficiency improved by baffle attachment, which creates stable air conditions.
Sampling efficiency improved by attaching sample heads to a rigid mounting bar, which ensures stable orientation of the sample heads.
Portability Less portable. Highly portable.

M9: Environmental monitoring of bioaerosols at regulated facilities
M9, Version 1, January 2017 Page 25 of 45
6 Laboratory preparation, culture and enumeration of colonies 6.1 Laboratory equipment, culture media and solutions All laboratory procedures, media preparation and sterilisation should be carried out in accordance with EN ISO 721819. Each laboratory should be equipped with the standard equipment of a microbiological laboratory. See Table 6.1 for essential equipment. Laboratories carrying out this work must comply with biosafety level category 2, as Aspergillus fumigatus is classified a category 2 organism. Laboratories must ensure that analytical blanks and field blanks are reported with the results. Important: Any changes in the formulation to media described in this section are not acceptable. It is essential that sterility of equipment for on-site sampling is retained during transport from the laboratory to the field and is guaranteed up to the moment of sampling. The period of time between sample collection and analysis should be as short as possible but must be no later than 24 hours after the end of the sampling period. Table 6.1 Equipment required to carry out methods specified in this document
Item Recommended quantity / comments
Autoclave 1. Capable of operating at temperatures up to 121°C ± 3°C*.
Top-pan balance 1.
Incubators 2, at 37°C ± 2°C and 45°C ± 2°C with thermostats.
Refrigerator 1, at 5°C ± 3°C with thermostat.
Test tube/flask shakers
1 vortex and 1 shaker platform capable of rotation in a horizontal plane.
Consumables Media (Tables 7.2 and 7.3), Petri dishes (vented, sterile, diameter 90mm), distilled water, spreaders, 10ml test tubes, others as appropriate.
Microbiological safety cabinet
Containment Level 2.
Sterile impingers Purpose glass blown impingers containing 30ml saline solution for stack monitoring For transportation all orifices should be capped with sterile aluminium foil.
Sterile filter equipment IOM sampling head and filter holders, polycarbonate or quartz filters with a 25mm diameter and 0.8µm pore size. Filters inserted into sampling head in a safety cabinet.
Impaction samplers These should be thoroughly cleaned using 70% (v/v) aqueous solution of ethanol or 70% aqueous solution of industrial methylated spirit (IMS) and dried prior to use.
*When using commercial media it should be prepared at the temperature specified by the manufacturer.

M9: Environmental monitoring of bioaerosols at regulated facilities
M9, Version 1, January 2017 Page 26 of 45
6.1.1 Selective media
Half strength nutrient agar medium should be used to selectively culture total mesophilic bacteria. Malt extract agar medium should be used to culture Aspergillus fumigatus (Tables 6.2 and 6.3). All media should be stored at 4°C and equilibrated to atmospheric temperature immediately prior to use. Table 6.2: Half-strength nutrient agar medium to selectively culture total mesophilic bacteria
Ingredients per litre of distilled water
Nutrient agar 14 gram (g)
Agar 10g
Cycloheximide* (dissolved in a minimum volume of acetone < 2ml)
100 milligram
*A specialist health and safety assessment is required when using cycloheximide.
Table 6.3: Malt extract medium to culture Aspergillus fumigatus
Ingredients per litre of distilled water
Malt extract 20g
Agar 20g
Penicillin G (Na+ salt)* 20,000 units
Streptomycin sulphate* 40,000 units *A specialist health and safety assessment is required when using penicillin G and streptomycin sulphate. The antimicrobial agents should be added to the medium after autoclaving, immediately prior to dispensing, when the temperature of the liquid has fallen to approximately 47°C. The surface of the medium should be perpendicular to the side of the Petri dish, free from bubbles and imperfections. If the medium is wet on the surface, it should be either pre-incubated to evaporate off any excess water or dried in a cabinet. All Petri dishes should be labelled on the bottom of the plate with the date and a unique sample number using an indelible pen. For impaction samplers: Petri dishes must be filled with sufficient medium to ensure that the distance between the top of the agar surface and the base of the preceding stage is the same as that specified by the manufacturer. Standard glass Petri dishes supplied by the manufacturer should be filled with 27ml of medium; 90mm plastic Petri dishes should be filled with 40ml of medium. For filters and impingers: Petri dishes must be filled with sufficient medium to ensure a standardised approach to plating in the laboratory. It is recommended that generally 18ml to 20ml of agar in 90mm Petri dishes will be sufficient, to obtain at least 3mm thickness.

M9: Environmental monitoring of bioaerosols at regulated facilities
M9, Version 1, January 2017 Page 27 of 45
6.1.2 Physiological saline or phosphate buffered solution
For the suspension of filters, sampling liquid for impingers and for a dilution series, a sterilized physiological saline (0.9% NaCl with 0.01% Tween® 80) or phosphate buffered solution should be used. The following volumes should be used:
sampling with glass blown impingers – 30ml
re-suspension of filters – 5 or 10ml in wide-neck conical flask
diluent for dilution series – 9ml in 10ml or 0.9ml in 1ml test tubes
6.2 Culturing colonies All working steps must be carried out under conditions that prevent the samples from contamination. 6.2.1 Processing petri dishes from impaction sampling Once returned to the laboratory, ensure all dishes are adequately labelled. Inverted (lid to bottom) plates are placed in an appropriate microbiological incubator at the same time. At the end of the incubation period, colonies should be counted and recorded (Sections 6.3 and 6.4) 6.2.2 Processing liquid samples from filtration sampling In the aseptic atmosphere of a microbiological safety cabinet, the filter samples are transferred, using a sterile pair of tweezers, to a wide-neck flask (minimum diameter corresponding to the filter size) containing 5ml of sterilised physiological saline solution (this may not be required at this stage, if the filters have been transferred to the buffer solution in the field). The filters are intensively shaken in a horizontal position at 37°C ± 2°C for at least 15 minutes. During shaking of filters, the loaded surface of the filter must lay flat, face upwards and be able to move freely within the suspension. Further processing of the sample must take place within one hour of suspension. Immediately prior to dilution, the suspension should be shaken for 1 minute. Based on this original suspension, a serial dilution series may be set up, if required. 6.2.3 Processing liquid samples from impinger sampling Saline solution should be added to each impinger to a volume of 30ml and sterilized. For transportation to the field, tubing should be installed and all orifices covered using sterile caps (for example, aluminium foil).

M9: Environmental monitoring of bioaerosols at regulated facilities
M9, Version 1, January 2017 Page 28 of 45
The final volume of sample solution must be recorded, as this will be used to calculate CFU/m3 of air sampled. This can be determined in 2 ways:
when samples are returned to the laboratory for analysis, the sample liquid is passed through a filter, which is then re-suspended with a known volume of liquid, for example 10ml
before sampling, the empty weight (without tubing attached) of impingers is determined; as liquid losses can occur during sampling, primarily due to evaporation, samples returned to the laboratory for analysis are weighed to determine the mass of remaining sampling fluid – a density of 1 gram per millilitre of the final liquid volume is used to determine the mass of the final liquid volume
Once the samples have been weighed or re-suspended, shake the sample for 1 minute. A serial dilution series may then be set up using this suspension. 6.2.4 Preparing a serial dilution The number of dilution steps and the dilution intervals should be adapted to the expected bioaerosol concentration. This means that upwind samples are unlikely to need diluting but downwind samples close to the site may do. To prepare a dilution, a millilitre of the original suspension is thoroughly mixed and transferred to a 10ml test tube containing 9ml saline solution. In the same way, the following dilution steps are handled. The first dilution step is ready to use and referred to as 10–1. The 10–1 dilution is likewise shaken for 1 minute. After this, 1ml of the dilution is transferred to 9ml (dilution of 1:100) of sterile saline. This second step of dilution is further referred to as 10–2 (1:100). The resulting dilution is handled as described before, so that additional decimal steps of dilution are gained (1:1,000; 1:10,000). These steps of dilution are further addressed as 10–3, 10–4, and so on. The number of dilution steps must be appropriate to the concentrations of microorganisms to be quantified. The dilution must be carried out using sterile disposable pipette tips. Before plating out, the dilutions should be re-shaken for approximately 30 seconds. Starting with the highest dilution step, 0.1ml of each respective step is plated on at least 3 plates (parallels) of culture medium with a pipette and spread out by circular movements. Inoculation of at least 3 parallel plates for each dilution step is required for quality assurance. Allow the liquid to absorb into the plate for at least a few minutes before inverting and incubating. If low concentrations of bacteria or fungi are expected it is possible to plate 1ml of original suspension, but this must be plated out onto 4 plates using 250 µl per plate. The total number of colonies on all 4 plates is added together to determine the number of colonies per millilitre of the original suspension. Fresh agar plates are recommended, for example stored at 5°C for up to 14 days with protection against drying-out. Blank samples should be determined from the original suspension and all dilution steps, and incubated concurrently. Plates should be adequately labelled with their contents (noting for example blank, sample and dilution factor) and incubated inverted in an appropriate microbiological incubator.

M9: Environmental monitoring of bioaerosols at regulated facilities
M9, Version 1, January 2017 Page 29 of 45
6.3 Colony enumeration In the laboratory, quantitative determination of the concentrations of microorganisms is performed by counting visually recognisable colonies following cultivation. The same person should carry out the counting for a batch of samples from a measurement campaign. Their name should be recorded. The density of the colonies grown on the culture medium must always allow proper counting of the colonies. The density of the colonies results from the number of dilution steps. Therefore, in principal, several dilution steps may need to be plated out. The counting of colonies should be carried out at the end of the following incubation periods: Total mesophilic bacteria – the first counting (check) should take place after incubation of the sample for 2 days at 37°C; and then re-checked after 7 days. The maximum number of colonies counted within these 7 days is given for each step of dilution. The lower dilution stage is always of priority. The optimal range for evaluation and quantification is up to 150 colony forming units on a plate. If 399 or more colonies are counted on any single plate, this should be recorded as ‘too numerous to count’ (TNTC). When counting colonies on plates collected using impaction, only colonies that fall at the impaction sites of the sampler should be counted and recorded. Satellite colonies growing adjacent to larger colonies at the impaction site, and colonies growing around the perimeter of the medium should be ignored. If TNTC concentrations are recorded for all plates, then further sampling may be required using shortened sampling times.
Aspergillus fumigatus – the number of colonies of A. fumigatus growing on each malt extract
agar medium plate after incubation of the sample for 2 days at 45°C should be counted and recorded. A. fumigatus should be counted no later than 3 days for the final time, as their growth rate will rapidly colonise sample plates. Identification should be based upon gross colony colour and morphology, plus spore-bearing structures according to standard texts20. Low magnification, bright field light microscopy may be necessary to confirm identification. If spreading colonies of other fungi obscure less than half of a Petri dish, then colonies of A. fumigatus should be enumerated on the half that is not obscured, as long as this appears to be representative of the entire sample. This should be recorded, and the number of colonies adjusted as if the whole dish were enumerated. If spreading colonies obscure more than half of one Petri dish, this should be recorded as ‘No results, spreaders’. 6.3.1 Calculating concentration of microorganisms per unit of air sampled 6.3.1.1 Impaction sampler The concentration of culturable microorganisms should be calculated and reported as colony forming units per cubic metre of air (CFU/m3).

M9: Environmental monitoring of bioaerosols at regulated facilities
M9, Version 1, January 2017 Page 30 of 45
The concentration should be calculated as follows:
* Using a positive hole correction table21.
A blank sample, covering the analytical procedure, should be less than or equal to 2 CFUs/plate. A field blank sample, covering the whole sampling procedure, should be less than or equal to 5 CFUs/plate. No blank correction is made to the measurement results of the samples. 6.3.1.2 Filters After quantification of the colonies, the arithmetic mean value of colony counts for the 3 plated samples is to be determined. If a dilution step was required, this mean value is multiplied with the dilution factor of the respective dilution step (for example, at 10–2 this would be 1:100). From these results the concentration of colony forming units in the volume of the original solution is theoretically plated out. Since only an aliquot of the suspension has been plated out, it has to be multiplied with the additional factor, for example with 50 if 0.1ml of 5ml were plated out. From this value the concentration of colonies in the air (in CFU/m³) is calculated according to the equation below:
Colony forming units per cubic metre of air (CFU/m³)
=
mean of colonies on 3 parallel plates
x
dilution factor*
Volume of air sample (m3)
* Dilution factor of sample and additional dilution factor, if required, resulting from plating out an aliquot of the dilution.
A blank sample, covering the analytical procedure, should be less than or equal to 2 CFUs/plate. A field blank sample, covering the whole sampling procedure, should be less than or equal to 2 CFUs/plate. No blank correction is made to the measurement results of the samples.
Colony forming units per cubic metre of air (CFU/m³)
Corrected* number of colonies
= Sample duration(min)
x Flow rate (0.0283 m3/min)

M9: Environmental monitoring of bioaerosols at regulated facilities
M9, Version 1, January 2017 Page 31 of 45
6.3.1.3 Impingers When analysing bioaerosol concentrations collected using the impinger approach used for stack emissions monitoring (VDI 4257-2), the approaches outlined above are used. The concentration of bioaerosols in the stack gas (in CFU/m3) is calculated according to the equation below:
Colony forming units = mean of colonies on 3 parallel plates per cubic metre sample gas volume (m3)* of air (CFU/m³)
*The sample gas volume is expressed at standard conditions of 273 Kelvin, 101.3 kilopascal and as a dry gas
A field blank is satisfactory if the agar plate value is not greater than 3 CFU/plate count. 6.4 Data recording and reporting
Detailed, accurate records should be kept by the laboratory for auditing purposes. Prior to sampling at site, the following information on the preparation of the selective media must be recorded:
date and time of preparation
batch numbers of the media components
laboratory personnel
storage conditions of the prepared media
After sampling at site, the following details should be recorded:
site name, address and map reference (where appropriate)
sampling date
date and time samples were processed and Petri dishes were placed in the incubator(s)
date and time Petri dishes were removed from the incubator(s)
temperature of the incubator(s)
selective medium used
laboratory personnel involved in processing and enumerating the samples For each Petri dish the following details should be recorded:
unique sample number
number of colonies on the plate
for impaction sampler: corrected number of colonies (using the Positive Hole Correction Table, supplied by the impaction sampler manufacturer, as in the case of the Andersen sampler)
Laboratories must ensure that analytical blanks and field blanks are reported with the results.

M9: Environmental monitoring of bioaerosols at regulated facilities
M9, Version 1, January 2017 Page 32 of 45
7 Data reporting and interpretation 7.1 Approach to reporting
Detailed, accurate records should be kept by the monitoring organisation for reference and auditing purposes. These do not need to be submitted to us but a summary should be included in the final report. The data should be reported using standard report forms (see Annexes 3, 4, 5). The report may be completed by the operator or a third party appointed by the operator, such as the monitoring organisation. 7.2 Reporting applicable to all methods All reports should be submitted with the following information as a minimum:
monitoring organisation and personnel
details of the commissioning laboratory used for enumeration
site name and description, including permit number, process description, estimated
mass on site at time of sampling, feedstock and mitigation/abatement systems
reason for monitoring
date(s) of the monitoring visit(s)
sampling approach used
any deviations from the sampling approach and a justification for those deviations
any other relevant information that may influence the results
A map of the site should be submitted with the following parameters clearly labelled:
the boundary of the site, marked in red
the locations of all the emissions sources
the location of all sampling points with the unique sample reference numbers listed
adjacent to them (an additional schematic showing sample locations is required for
stack and biofilter sampling); photographs can also be included
the location(s) of all sensitive receptors within an agreed set back distance, plus any
additional sensitive receptors, as deemed appropriate
the location(s) of activities outside the operational area that may influence the results
7.3 Reporting emissions from stack sampling An MCERTS accredited organisation will produce a standard report that meets the requirements of the MCERTS Performance standard for Organisations that carry out manual stack emissions monitoring22. However, for bioaerosol monitoring, a separate bioaerosol report will be required that sets the results in context with the operator’s permit (see Section 7.2). Data should be reported on the form provided in Annex 3. As a minimum, stack emission monitoring samples are carried out in triplicate. Each result should be reported separately, as well as the median.
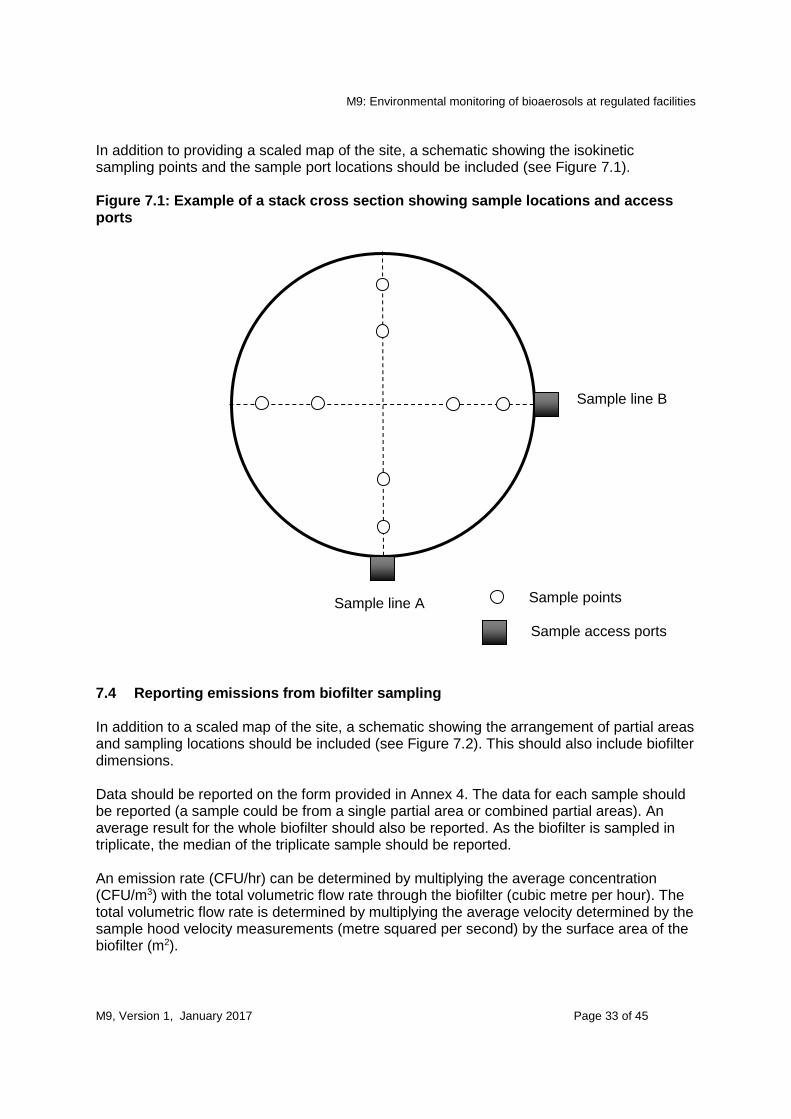
M9: Environmental monitoring of bioaerosols at regulated facilities
M9, Version 1, January 2017 Page 33 of 45
In addition to providing a scaled map of the site, a schematic showing the isokinetic sampling points and the sample port locations should be included (see Figure 7.1). Figure 7.1: Example of a stack cross section showing sample locations and access ports
7.4 Reporting emissions from biofilter sampling In addition to a scaled map of the site, a schematic showing the arrangement of partial areas and sampling locations should be included (see Figure 7.2). This should also include biofilter dimensions. Data should be reported on the form provided in Annex 4. The data for each sample should be reported (a sample could be from a single partial area or combined partial areas). An average result for the whole biofilter should also be reported. As the biofilter is sampled in triplicate, the median of the triplicate sample should be reported. An emission rate (CFU/hr) can be determined by multiplying the average concentration (CFU/m3) with the total volumetric flow rate through the biofilter (cubic metre per hour). The total volumetric flow rate is determined by multiplying the average velocity determined by the sample hood velocity measurements (metre squared per second) by the surface area of the biofilter (m2).
Sample line A
Sample line B
Sample points
Sample access ports

M9: Environmental monitoring of bioaerosols at regulated facilities
M9, Version 1, January 2017 Page 34 of 45
Figure 7.2: Example of a plan view of a biofilter showing partial areas and sample locations
7.5 Reporting emissions from ambient sampling The estimated concentration of bioaerosols and the meteorological conditions on the day of sampling should be reported to us on the forms provided in Annexes 5A and 5B. CEN TS 16115-2 provides an example approach for the assessment of results from ambient bioaerosol measurement campaigns. It states that the mean impact is characterized by averaging the ambient bioaerosol concentration data but because of the broad scatter inherent in the measurement of bioaerosol concentrations, the median value should be used. Use of the median reduces the effect of extreme values and any outliers present will have much less influence on the measurement result. Therefore, the median of replicate downwind samples should be used to assess the result for each sample location. However, the arithmetic mean should be used for the upwind locations, as only minor scatter is likely for background measurements. When using the simplified fan approach for routine compliance monitoring, the maximum median result of the 3 downwind sample locations is used to assess the impact of bioaerosols at the nearest sensitive receptor.
5m
8 m
A B
C D

M9: Environmental monitoring of bioaerosols at regulated facilities
M9, Version 1, January 2017 Page 35 of 45
7.6 Measurement uncertainty
Measurement uncertainty quantifies the dispersion around the true value, inherent in a measurement result. The uncertainty assigned to a result represents the range of values about the result in which the true value is expected to lie. Uncertainty should be quantified to show that the measurement is fit for purpose, by demonstrating that the uncertainty of the measurements is within certain criteria. The statement of uncertainty includes a value for the level of confidence. This quantifies the probability that the true value lies within the region defined by the confidence interval. The measurement uncertainty defines the size of the region in which the true value is expected to lie, and the confidence interval defines how likely this is. Measurement uncertainties result from uncertainties of sampling and analysis. The sampling and analysis organisations must have a procedure for determining their measurement uncertainty, which is based on the performance of the equipment they use (the spatial and temporal variability during sampling can be ignored from the determination of the uncertainty). A detailed example of how a measurement uncertainty is determined for stack emissions monitoring is provided in Environment Agency Technical Guidance Note M211.

M9: Environmental monitoring of bioaerosols at regulated facilities
M9, Version 1, January 2017 Page 36 of 45
Annex 1: Open biofilter sample strategy When sampling bioaerosol emissions from an open biofilter is it necessary to split the biofilter into a grid of equal partial areas. The number of partial areas depends on the size of the biofilter. Figure A1 is an example of how biofilters of different areas can be subdivided into partial areas. Each area is sampled to give a representative average bioaerosol concentration and emissions rate. Figure A1: Example schematic of the division of biofilters into partial areas showing the arrangement of sample locations
To reduce the sampling requirements, especially for large biofilters, it is possible to combine partial areas and samples. However, a maximum of 4 partial areas can be combined and a maximum of 4 samples can be combined. The following is an example based on the biofilters shown in Figure A1. Biofilter A has 10 partial areas. Assuming the flow is homogenous, this biofilter is classed as a single active area source. The following sample arrangement may be used:
9 impingers labelled 1a, 1b, 1c, 2a, 2b, 2c, 3a, 3b, 3c
partial area A is sampled for 7.5 minutes in triplicate using impingers 1a, 1b and 1c
the procedure is repeated using the same impingers at partial area B, C and D
impingers 1a, 1b and 1c are combined to give a single sample (Sample 1)
the procedure is repeated for partial areas E, F, G, H, using impingers 2a, 2b, 2c
5m
20m
A
5m
8m
B
A B
C D
E F
G H
I J
A B
C D

M9: Environmental monitoring of bioaerosols at regulated facilities
M9, Version 1, January 2017 Page 37 of 45
impingers 2a, 2b and 2c are combined to give a single sample (Sample 2)
the procedure is repeated for partial areas I and J, using impingers 3a, 3b, 3c
impingers 3a, 3b and 3c are combined to give a single sample (Sample 3) This gives 3 separate cumulative samples, which provide an average result for the biofilter. Biofilter B has 4 partial areas. The following sample arrangement may be used:
3 impingers labelled 1, 2 and 3
partial area A is sampled for 7.5 minutes in triplicate with impingers 1, 2, 3
this is repeated partial areas B, C and D using impingers 1, 2, 3 This gives 3 separate cumulative samples, which provide an average result for the biofilter.

M9: Environmental monitoring of bioaerosols at regulated facilities
M9, Version 1, January 2017 Page 38 of 45
Annex 2A: Calculation of average wind speed and direction The average wind speed and average wind direction during the sampling period can be calculated by resolving each weather data point (each logged value of direction and speed) into a northerly and easterly component, summing these, and then dividing by the number of data points. Firstly the northerly component is calculated according to the following equation:
Northerly component (N) = Σ (cos (θi) * u
i)
where θ
i is the wind direction (in degrees from true north), u
i is the wind speed (in m/s ) for
data point i, and n is the total number of data points. Next the easterly component is calculated according to the following equation:
Easterly component (E) = Σ (sin (θi) * u
i)
These 2 components must then be combined to give the average wind speed, according to the following equation: Average wind speed (m/s) = [√ (N2+E2)]
n The average wind direction is calculated according to the following equation: Average wind direction (°) = arctan (E/N) The average direction needs to be corrected thus:
If N < 0, add 180º If N > 0 and E < 0, add 360°
(Note: many computer systems use radians when performing trigonometric calculations. To convert from degrees to radians, multiply the angle by π/180).

M9: Environmental monitoring of bioaerosols at regulated facilities
M9, Version 1, January 2017 Page 39 of 45
Annex 2B: Calculation of wind speed versus height above ground Close to the surface wind speed decreases with decreasing height, as the friction drag of the ground becomes increasingly significant. The convention is to normalize wind speed to the velocity at 10m above ground. This can be estimated using a formula derived from the well-established logarithmic velocity profile:
𝑈2 = 𝑈1 +𝑈∗
𝑘𝑙𝑛 (
𝑧2𝑧1)
Where U is wind velocity, z is height above ground, subscripts denote heights 1 and 2, k is a constant of proportionality (the Von Karmen constant (~0.4)) and U* is the Friction Velocity (a term which accounts for the rate of loss of energy from the air to the ground). U* depends on surface roughness and wind speed, It can be estimated from the special case of the equation above where the lower velocity (U1) is zero. This occurs at a height above the surface of z0, the roughness length, so that
𝑈 =𝑈∗
𝑘𝑙𝑛 (
𝑧
𝑧0)
The value of z0 can be estimated from tables of measured values, or from the rule of thumb that zo ~ a tenth of the physical height of the dominant “roughness element” at the surface. Given the measured value of U and estimated zo a value for U* can be derived and used in turn to calculate wind speed at different heights Typical roughness lengths (from Bache and Johnstone 199223)
Ground cover z0(m)
Soils 0.001-0.01 Mown grass 0.01 Long grass/crops (~0.5m) 0.05 Farmland (many hedges) 0.08 Pasture land (many trees and hedges) 0.2 Orchards 0.5-1.0 Suburban housing 0.6 Forests, cities 1-5
Derivation: the rate of change of velocity decreases as height increases and the effect of friction on the air flow becomes less. 𝜕𝑈
𝜕𝑧=𝑈∗
𝑘.1
𝑧
Integrating this between two heights
𝑈2 − 𝑈1 = ∫𝑈∗
𝑘.1
𝑧=
𝑈∗
𝑘⌈𝑙𝑛𝑧2 − 𝑙𝑛𝑧1⌉
𝑧=𝑧2.𝑧=𝑧1
=𝑈∗
𝑘. 𝑙𝑛
𝑧2
𝑧1

M9: Environmental monitoring of bioaerosols at regulated facilities
M9, Version 1, January 2017 Page 40 of 45
Annex 3: Stack emissions monitoring report form
Stack emissions monitoring: estimated concentration of bioaerosols
Site: Site operator
Sampling date: Monitoring contractor:
Estimated mass of materials: Type of materials processed on site:
Emission point reference
Sample reference number
Emission threshold (CFU/m3)
Bioaerosol type
Sampling start/end times (hh:mm:ss)
Stack gas temp (oC)
Moisture (%)
Volumetric flow rate (m3/h)
Concentration of bioaerosols (CFU/m3)
Median of replicate samples (CFU/m3)

M9: Environmental monitoring of bioaerosols at regulated facilities
M9, Version 1, January 2017 Page 41 of 45
Annex 4: Biofilter emissions monitoring report form
Biofilter monitoring: estimated concentration of bioaerosols
Site Site operator
Sampling date: Monitoring contractor:
Estimated mass of materials: Type of materials processed on site:
Bioaerosol type: Biofilter medium type and age:
Emission threshold (CFU/m3): Biofilter total volumetric flow (m3/h):
Partial area(s) emission reference
Sample reference number
Sampling start/end times (hh:mm:ss)
Description of the visual integrity of the biofilter (for example, weed growth, channelling, dryness)
Exhaust gas temperature (oC)
Flow velocity (m/s)
Concentration of bioaerosols (CFU/m3)
Average result for each sample:
Median result of triplicate samples:

M9: Environmental monitoring of bioaerosols at regulated facilities
M9, Version 1, January 2017 Page 42 of 45
Annex 5A: Ambient emissions monitoring report form
Ambient sampling: estimated concentration of bioaerosols
Site: Site operator:
Sampling date: Monitoring contractor:
Estimated mass of materials: Type of materials processed on site:
Bioaerosol type: Site activity:
Activities affecting the concentration of bioaerosols:
Location Sample reference number
Distance from centre of active area (m)
Difference in bearing between location of samplers and mean direction wind blows to (°)
Sampling start/end times (hh:mm:ss)
Concentration of bioaerosols (CFU/m3)
Arithmetic mean of upwind samples (CFU/m3) (if required)
Median of downwind replicate field samples (CFU/m3)

M9: Environmental monitoring of bioaerosols at regulated facilities
M9, Version 1, January 2017 Page 43 of 45
Annex 5B: Meteorological report form for ambient emissions monitoring
Metrological conditions
Site: Site operator:
Sampling date: Monitoring contractor:
Location Sample reference number
Bearing of samplers from centre of operational area or turning / screening operation (° from true north)
Mean direction the wind blows to
during the sampling period (each individual sample) (° from true north)
Difference in bearing between location of samplers from centre of operational area and mean direction wind blows to
(°)
Mean wind speed during sampling (m/s)
Arithmetic mean of air temperature (°C)
Arithmetic mean of relative humidity (%)
Prevailing weather conditions (cloud cover in eighths)

M9: Environmental monitoring of bioaerosols at regulated facilities
M9, Version 1, January 2017 Page 44 of 45
Annex 6: References 1. Standardised Protocol for the Sampling and Enumeration of Airborne Micro-organisms at Composting Facilities (2009). Association for Organics Recycling. 2. Searl, A. (2008) Exposure-response relationships for bioaerosol emissions from waste treatment processes. Defra Project WR 0606. Institute for Occupational Medicine for, UK.
3. Exposures and Health Outcomes in Relation to Bioaerosol Emissions from Composting Facilities: A Systematic Review of Occupational and Community Studies. Pearson, Littlewood, Douglas, Robertson, Gant, Hansell. Journal of Toxicology and Environmental Health, Part B: Critical Reviews. Volume 18, Issue 1, 2015 4. Bioaerosol emissions from waste composting and the potential for workers’ exposure. Stagg, Bowry, Kelsey & Crook. Health and Safety Executive (2010)
5. Walser SM, Gerstner DG, Brenner B, Bünger J, Eikmann T, Janssen B, Kolb S, Kolk A, Nowak D, Raulf M, Sagunski H, Sedlmaier N, Suchenwirth R, Wiesmüller G, Wollin KM, Tesseraux I, Herr CE. Evaluation of exposure-response relationships for health effects of microbial bioaerosols - A systematic review. Int J Hyg Environ Health. 2015 Oct; 218(7):577-89. doi: 10.1016/j.ijheh.2015.07.004. Epub 2015 Jul 18. 6. Defra Project WR 1121 Bioaerosols and odour emissions from composting facilities (2013) Available from http://randd.defra.gov.uk 7. SC040021/SR3 Review of methods to measure bioaerosols at composting sites (available for download at https://publications.environment-agency.gov.uk/). 8. BS EN 15259:2007 Requirements for measurement sections and sites and for the measurement objective, plan and report. 9. Technical Guidance Note M1 (available from www.mcerts.net). 10. VDI 4257 Part 2, - 'Bioaerosols and Biological Agents - Emission Measurement - Sampling of Bioaerosols and Separation in Liquids' (2011) Available from http://www.vdi.eu/engineering/vdi-standards. 11. Technical Guidance Note M2 (available from www.mcerts.net). 12. VDI 4257 Part 1 - 'Bioaerosols and Biological Agents - Emission Measurement – Planning and performing emission measurements' (2013) - http://www.vdi.eu/engineering/vdi-standards. 13. VDI 3880 Olfactometry – Static sampling (2011) Available from http://www.vdi.eu/guidelines/vdi 14. CEN TS 16115-1 “Ambient air – Measurement of bioaerosols – Part 1 - Determination of moulds using filter sampling systems and culture-based analyses” 15. CEN TS 16115-2 “Ambient air – Measurement of bioaerosols – Part 2 – Planning and evaluation of plant related plume measurements”

M9: Environmental monitoring of bioaerosols at regulated facilities
M9, Version 1, January 2017 Page 45 of 45
16. Jones, W, Morring, K, Morey, P and Sorensen, W. (1985) Evaluation of the Andersen Viable Impactor for Single Stage Sampling. American Industrial Hygiene Association journal 46 (5) 294-298. 17. Swan JRM, Kelsey A, Crook B, Gilbert EJ (2003) ‘Occupational and environmental exposure to bioaerosols from composts and potential health effects – A critical review of published data’ HSE Research Report 130 ISBN0 7176 2707 1. 18. Yue Zhou and Yung-Sung Cheng (2010) Evaluation of IOM Personal Sampler at Different Flow Rates Journal of Occupational and Environmental Hygiene, 7: 88–93 ISSN: 1545-9624 print / 1545-9632 online. 19. British Standard BS EN ISO 7218:2007 Microbiology of food and animal feeding stuffs. General Requirements and guidance for microbiological examinations. ISBN 9780580554032 (British Standards Institution, 2007). 20. Kobayashi, GS (1980) Fungi. In Microbiology. Third Edition. Davis, BO, Dulbecco, R, Eisen, HN andGinsberg, HS, Eds. (Harper and Row, Philadelphia) pp.818-850. 21. Macher, Janet M (1989) 'Positive-Hole Correction of Multiple-Jet Impactors for Collecting Viable Microorganisms', American Industrial Hygiene Association Journal, 50: 11, 561 to 568. 22. MCERTS Performance standard for organisations that carry out manual stack emissions monitoring. 23. Microclimate and spray dispersion. By D H Bache and D R Johnstone. Ellis Horwood, 1992. LIT 10645