AIIM Guidance Note
6
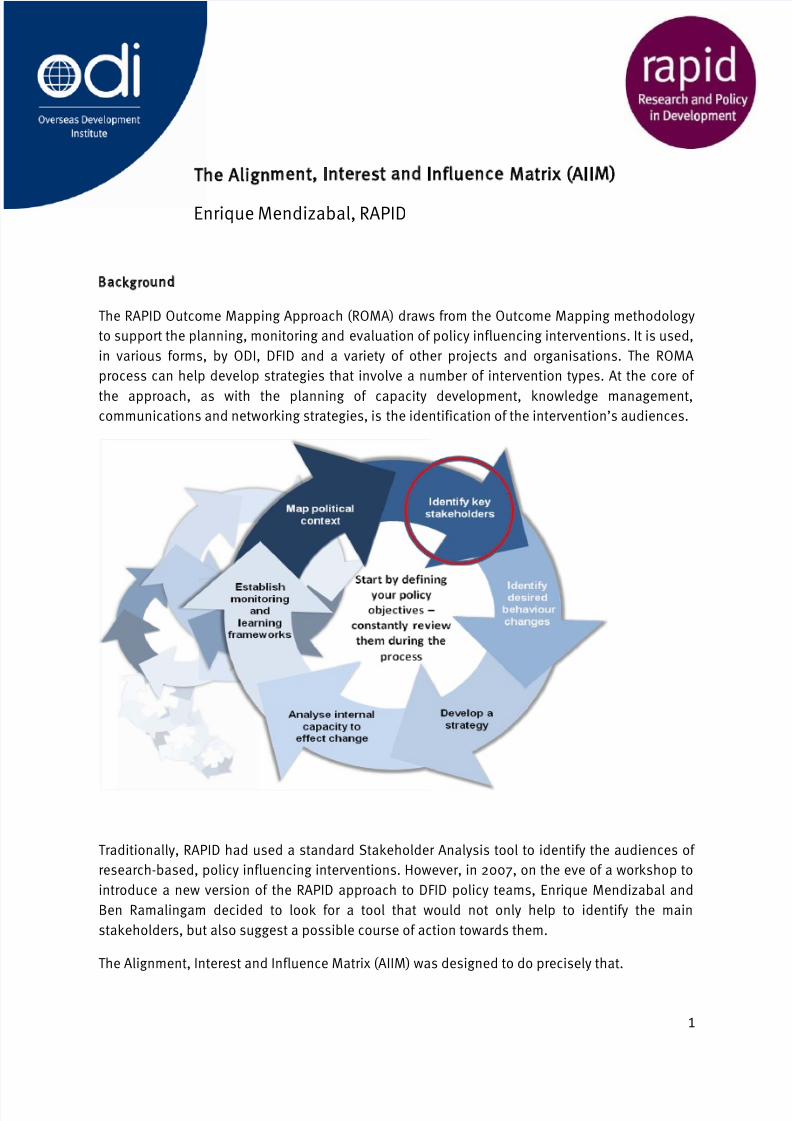
1 The Alignment, Interest and Influence Matrix (AIIM) Enrique Mendizabal, RAPID Background The RAPID Outcome Mapping Approach (ROMA) draws from the Outcome Mapping methodology to support the planning, monitoring and evaluation of policy influencing interventions. It is used, in various forms, by ODI, DFID and a variety of other projects and organisations. The ROMA process can help develop strategies that involve a number of intervention types. At the core of the approach, as with the planning of capacity development, knowledge management, communications and networking strategies, is the identification of the intervention’s audiences. Traditionally, RAPID had used a standard Stakeholder Analysis tool to identify the audiences of research-based, policy influencing interventions. However, in 2007, on the eve of a workshop to introduce a new version of the RAPID approach to DFID policy teams, Enrique Mendizabal and Ben Ramalingam decided to look for a tool that would not only help to identify the main stakeholders, but also suggest a possible course of action towards them. The Alignment, Interest and Influence Matrix (AIIM) was designed to do precisely that.
-
Upload
arnaldo-pellini -
Category
Documents
-
view
233 -
download
0
Transcript of AIIM Guidance Note
8/7/2019 AIIM Guidance Note
http://slidepdf.com/reader/full/aiim-guidance-note 1/6
1
The Alignment, Interest and Influence Matrix (AIIM)
Enrique Mendizabal, RAPID
Background
The RAPID Outcome Mapping Approach (ROMA) draws from the Outcome Mapping methodology
to support the planning, monitoring and evaluation of policy influencing interventions. It is used,
in various forms, by ODI, DFID and a variety of other projects and organisations. The ROMA
process can help develop strategies that involve a number of intervention types. At the core of
the approach, as with the planning of capacity development, knowledge management,communications and networking strategies, is the identification of the intervention’s audiences.
Traditionally, RAPID had used a standard Stakeholder Analysis tool to identify the audiences of
research-based, policy influencing interventions. However, in 2007, on the eve of a workshop to
introduce a new version of the RAPID approach to DFID policy teams, Enrique Mendizabal and
Ben Ramalingam decided to look for a tool that would not only help to identify the main
stakeholders, but also suggest a possible course of action towards them.
The Alignment, Interest and Influence Matrix (AIIM) was designed to do precisely that.
8/7/2019 AIIM Guidance Note
http://slidepdf.com/reader/full/aiim-guidance-note 2/6
2
Using the tool
The AIIM tool is often used in a workshop setting and involves a diverse group of participants –
each with insights into different actors or parts of the policy space. After defining the objectives
of the intervention and carrying out some background context analysis (or in-depth research
depending on the degree of complexity of the challenge), AIIM can help to clarify where some of the interventions’ main policy audiences and targets stand in relation to its objectives and
possible influencing approaches.
The first step of the process is to identify and list all the actors that may affect the policy
outcome –if you do not have enough time then you should focus your attention on the most
relevant or well known policy actors. These may be organisations, networks, groups,
departments or teams within these bodies or even individual members. The level of detail will
depend, in part, on how specific the policy objective is.
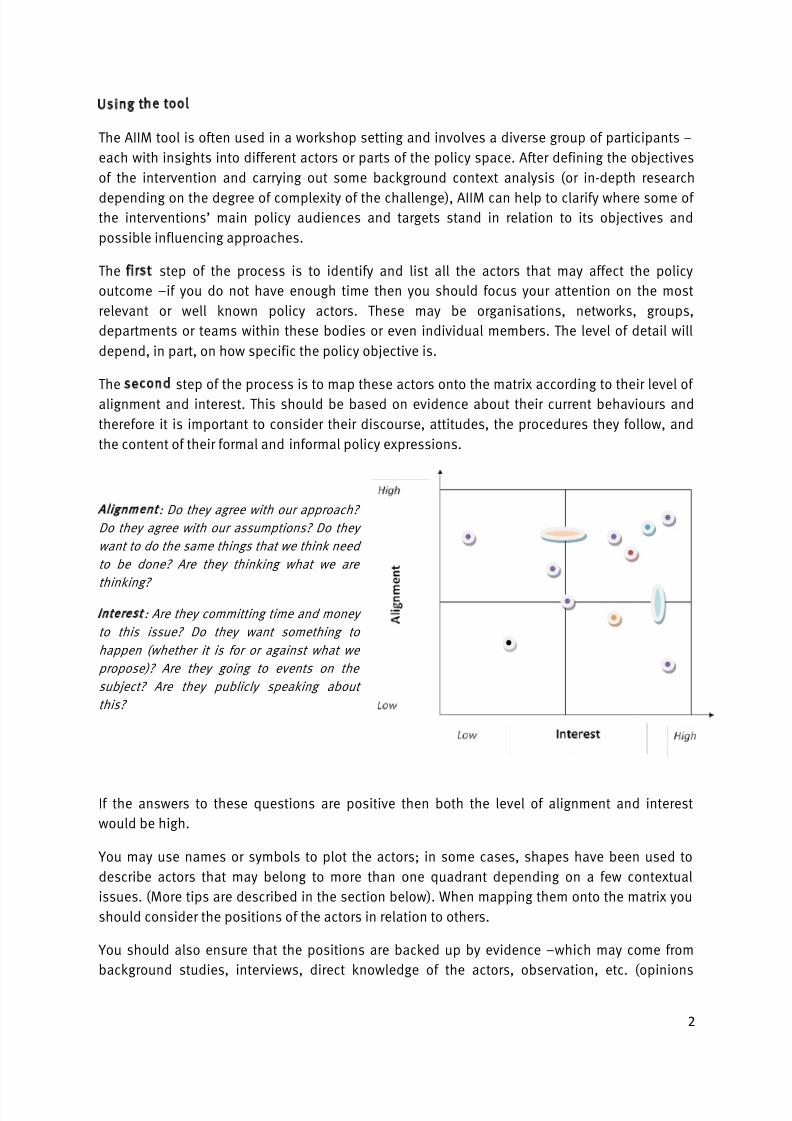
The second step of the process is to map these actors onto the matrix according to their level of
alignment and interest. This should be based on evidence about their current behaviours and
therefore it is important to consider their discourse, attitudes, the procedures they follow, and
the content of their formal and informal policy expressions.
Alignment: Do they agree with our approach?
Do they agree with our assumptions? Do they
want to do the same things that we think need
to be done? Are they thinking what we are
thinking?
Interest: Are they committing time and money
to this issue? Do they want something to
happen (whether it is for or against what we
propose)? Are they going to events on the
subject? Are they publicly speaking about
this?
If the answers to these questions are positive then both the level of alignment and interest
would be high.
You may use names or symbols to plot the actors; in some cases, shapes have been used to
describe actors that may belong to more than one quadrant depending on a few contextual
issues. (More tips are described in the section below). When mapping them onto the matrix you
should consider the positions of the actors in relation to others.
You should also ensure that the positions are backed up by evidence –which may come from
background studies, interviews, direct knowledge of the actors, observation, etc. (opinions
8/7/2019 AIIM Guidance Note
http://slidepdf.com/reader/full/aiim-guidance-note 3/6
3
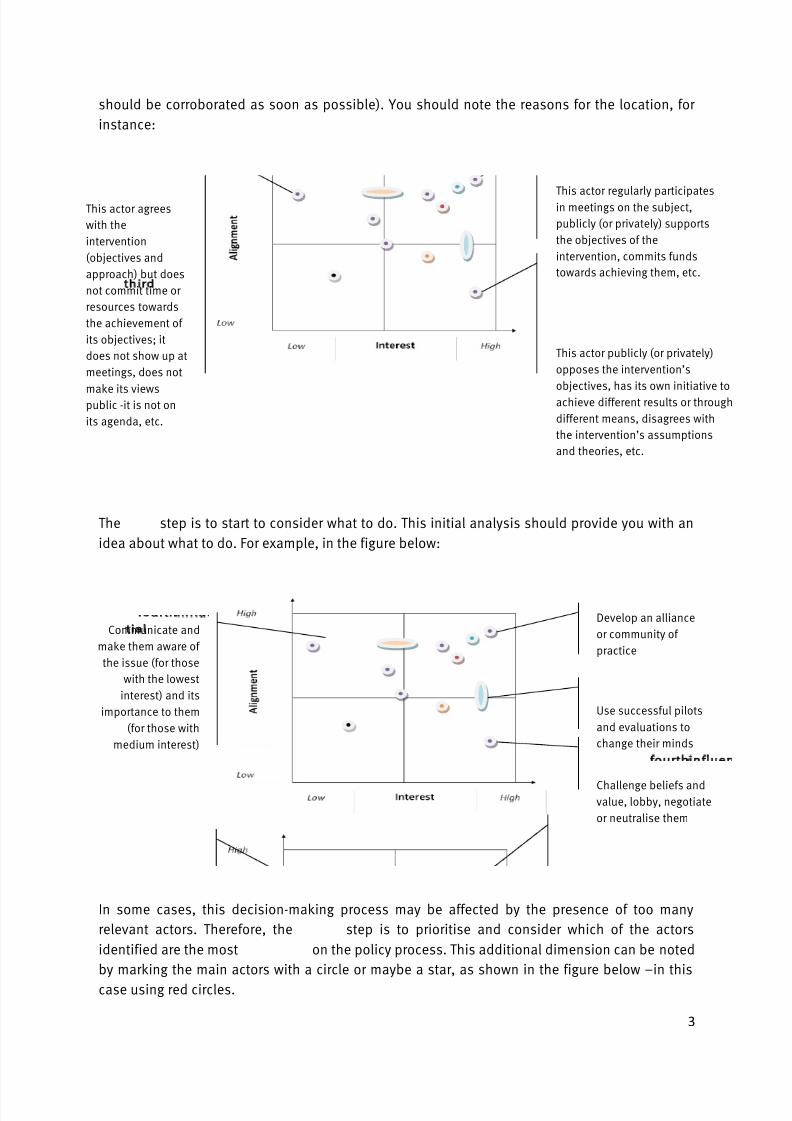
should be corroborated as soon as possible). You should note the reasons for the location, for
instance:
The third step is to start to consider what to do. This initial analysis should provide you with an
idea about what to do. For example, in the figure below:
In some cases, this decision-making process may be affected by the presence of too many
relevant actors. Therefore, the fourth step is to prioritise and consider which of the actors
identified are the most influential on the policy process. This additional dimension can be noted
by marking the main actors with a circle or maybe a star, as shown in the figure below –in this
case using red circles.
Develop an alliance
or community of
practice
Use successful pilots
and evaluations to
change their minds
Challenge beliefs andvalue, lobby, negotiate
or neutralise them
Communicate and
make them aware of
the issue (for those
with the lowest
interest) and its
importance to them
(for those with
medium interest)
This actor regularly participatesin meetings on the subject,
publicly (or privately) supports
the objectives of the
intervention, commits funds
towards achieving them, etc.
This actor publicly (or privately)
opposes the intervention’s
objectives, has its own initiative to
achieve different results or through
different means, disagrees with
the intervention’s assumptions
and theories, etc.
This actor agrees
with the
intervention
(objectives and
approach) but does
not commit time or
resources towards
the achievement of
its objectives; it
does not show up at
meetings, does not
make its viewspublic -it is not on
its agenda, etc.
8/7/2019 AIIM Guidance Note
http://slidepdf.com/reader/full/aiim-guidance-note 4/6
4
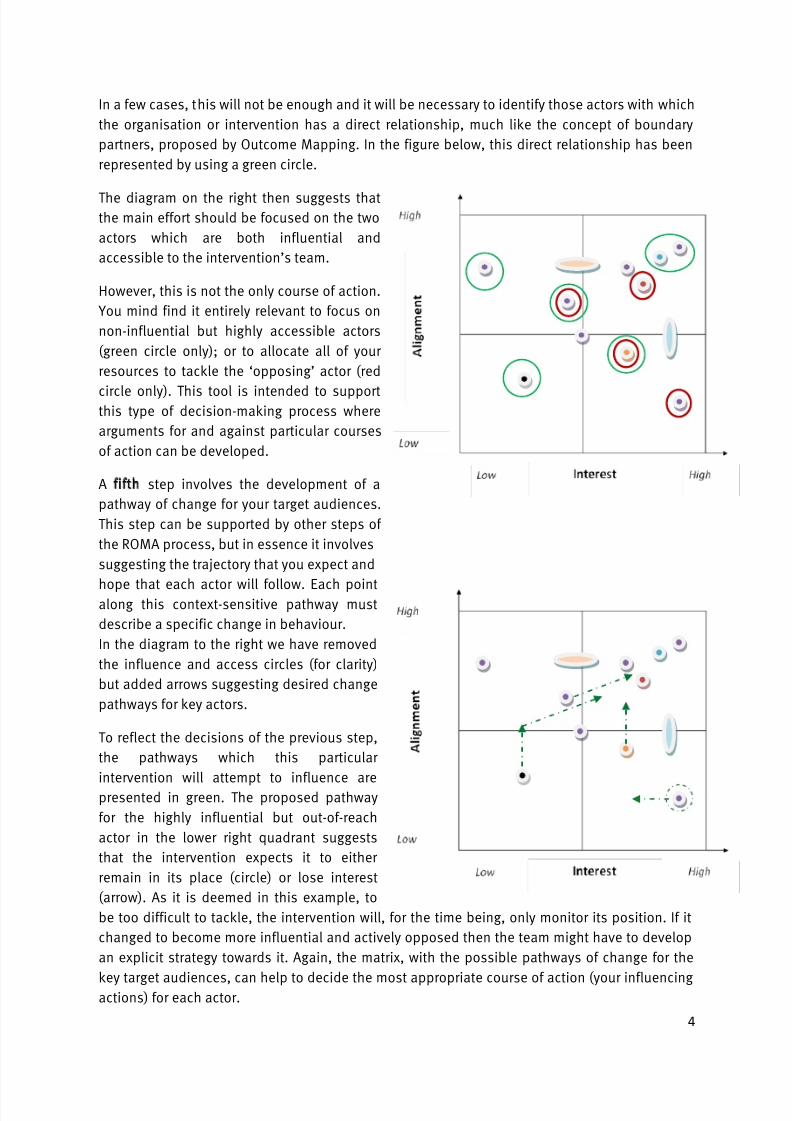
In a few cases, this will not be enough and it will be necessary to identify those actors with which
the organisation or intervention has a direct relationship, much like the concept of boundary
partners, proposed by Outcome Mapping. In the figure below, this direct relationship has been
represented by using a green circle.
The diagram on the right then suggests thatthe main effort should be focused on the two
actors which are both influential and
accessible to the intervention’s team.
However, this is not the only course of action.
You mind find it entirely relevant to focus on
non-influential but highly accessible actors
(green circle only); or to allocate all of your
resources to tackle the ‘opposing’ actor (red
circle only). This tool is intended to supportthis type of decision-making process where
arguments for and against particular courses
of action can be developed.
A fifth step involves the development of a
pathway of change for your target audiences.
This step can be supported by other steps of
the ROMA process, but in essence it involves
suggesting the trajectory that you expect and
hope that each actor will follow. Each pointalong this context-sensitive pathway must
describe a specific change in behaviour.
In the diagram to the right we have removed
the influence and access circles (for clarity)
but added arrows suggesting desired change
pathways for key actors.
To reflect the decisions of the previous step,
the pathways which this particular
intervention will attempt to influence are
presented in green. The proposed pathway
for the highly influential but out-of-reach
actor in the lower right quadrant suggests
that the intervention expects it to either
remain in its place (circle) or lose interest
(arrow). As it is deemed in this example, to
be too difficult to tackle, the intervention will, for the time being, only monitor its position. If it
changed to become more influential and actively opposed then the team might have to develop
an explicit strategy towards it. Again, the matrix, with the possible pathways of change for the
key target audiences, can help to decide the most appropriate course of action (your influencingactions) for each actor.
8/7/2019 AIIM Guidance Note
http://slidepdf.com/reader/full/aiim-guidance-note 5/6
5
Using AIIM for Monitoring and Adapting
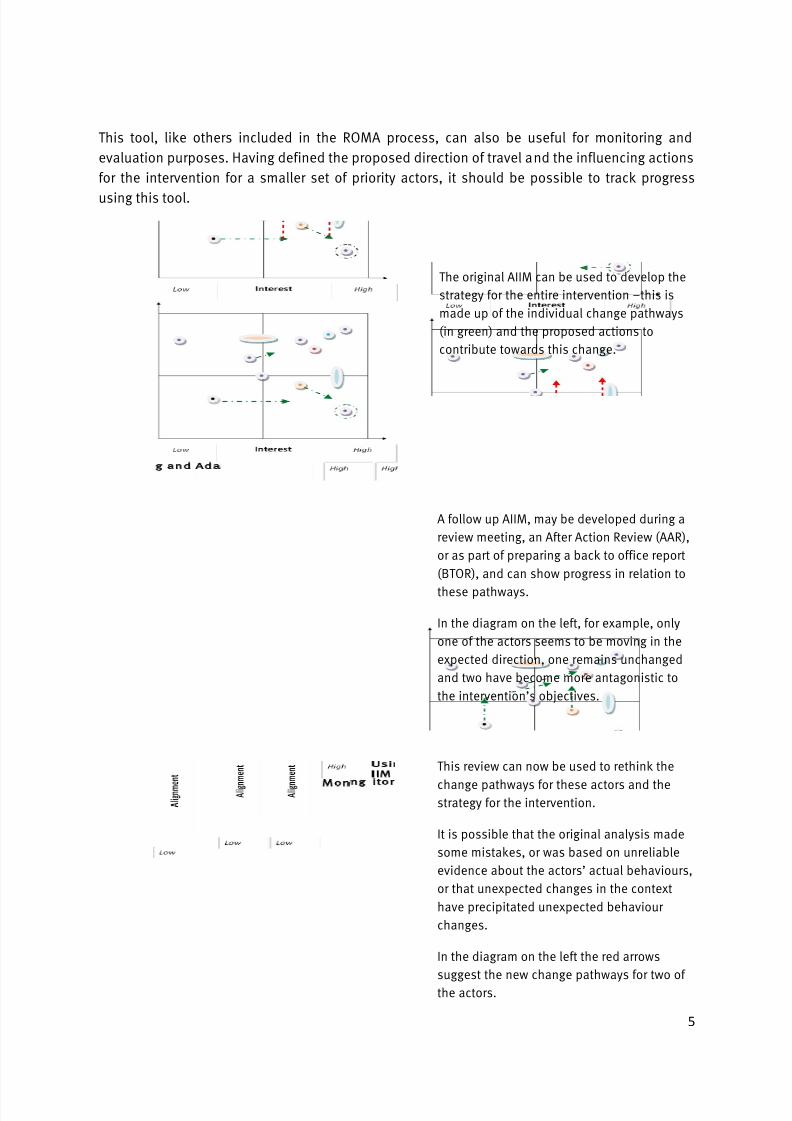
This tool, like others included in the ROMA process, can also be useful for monitoring and
evaluation purposes. Having defined the proposed direction of travel and the influencing actions
for the intervention for a smaller set of priority actors, it should be possible to track progress
using this tool.
The original AIIM can be used to develop the
strategy for the entire intervention –this is
made up of the individual change pathways
(in green) and the proposed actions to
contribute towards this change.
A follow up AIIM, may be developed during a
review meeting, an After Action Review (AAR),
or as part of preparing a back to office report
(BTOR), and can show progress in relation to
these pathways.
In the diagram on the left, for example, only
one of the actors seems to be moving in the
expected direction, one remains unchanged
and two have become more antagonistic to
the intervention’s objectives.
This review can now be used to rethink the
change pathways for these actors and thestrategy for the intervention.
It is possible that the original analysis made
some mistakes, or was based on unreliable
evidence about the actors’ actual behaviours,
or that unexpected changes in the context
have precipitated unexpected behaviour
changes.
In the diagram on the left the red arrows
suggest the new change pathways for two of
the actors.
8/7/2019 AIIM Guidance Note
http://slidepdf.com/reader/full/aiim-guidance-note 6/6
6
Some practical advice and tips
The tool has been designed to support decision-making, but it can also facilitate discussions and
communication with internal and external audiences. Since it was developed in 2007, users have
added innovations that we present here:
• Always attempt to state the policy objective or policy issue being addressed before listing and
plotting the actors –it will make the process more manageable and give a clear and tangible
reference against which the axes can be defined.
• Always make sure that the two main axes (alignment and interest) are clearly understood by all those
involved in the process.
• If when plotting a particular actor you find it difficult to find a position that all the participants can
agree with, try to break it down into smaller parts (maybe into the divisions of an organisation or even
individual policy-makers) and see where different teams or people can be plotted –it is possible that
a donor or government department does not always behave as a whole. If this does not work, it is
possible that the policy objective is still too broad and general.• If you do not have enough evidence about a particular actor’s current behaviour do not forget about
it, plot it outside of the matrix to remind yourself and others that you may need to find out about
them.
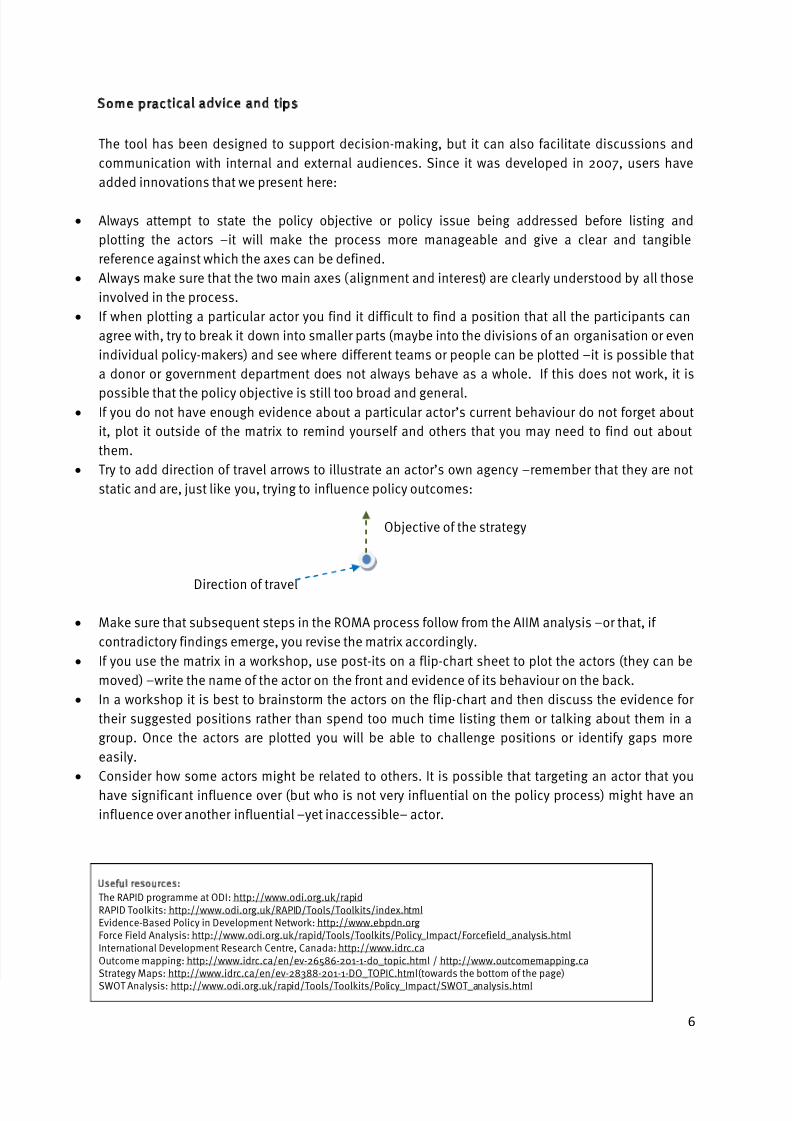
• Try to add direction of travel arrows to illustrate an actor’s own agency –remember that they are not
static and are, just like you, trying to influence policy outcomes:
Objective of the strategy
Direction of travel
• Make sure that subsequent steps in the ROMA process follow from the AIIM analysis –or that, if
contradictory findings emerge, you revise the matrix accordingly.
• If you use the matrix in a workshop, use post-its on a flip-chart sheet to plot the actors (they can be
moved) –write the name of the actor on the front and evidence of its behaviour on the back.
• In a workshop it is best to brainstorm the actors on the flip-chart and then discuss the evidence for
their suggested positions rather than spend too much time listing them or talking about them in a
group. Once the actors are plotted you will be able to challenge positions or identify gaps more
easily.
• Consider how some actors might be related to others. It is possible that targeting an actor that you
have significant influence over (but who is not very influential on the policy process) might have an
influence over another influential –yet inaccessible– actor.
Useful resources:The RAPID programme at ODI: http://www.odi.org.uk/rapidRAPID Toolkits: http://www.odi.org.uk/RAPID/Tools/Toolkits/index.htmlEvidence-Based Policy in Development Network: http://www.ebpdn.orgForce Field Analysis: http://www.odi.org.uk/rapid/Tools/Toolkits/Policy_Impact/Forcefield_analysis.htmlInternational Development Research Centre, Canada: http://www.idrc.caOutcome mapping: http://www.idrc.ca/en/ev-26586-201-1-do_topic.html / http://www.outcomemapping.caStrategy Maps: http://www.idrc.ca/en/ev-28388-201-1-DO_TOPIC.html(towards the bottom of the page)
SWOT Analysis: http://www.odi.org.uk/rapid/Tools/Toolkits/Policy_Impact/SWOT_analysis.html