
TECHNICAL ASSISTANCE SERVICE FOR IPPC INTEGRATED … · Technical Assistance For IPPC “Integrated...
192
Technical Assistance For IPPC “Integrated Pollution Prevention and Control” NIRAS IC Consortium ~ Regulatory Impact Assessment Report ~ June 2013 Page 1 TECHNICAL ASSISTANCE SERVICE FOR IPPC – INTEGRATED POLLUTION PREVENTION AND CONTROL IN TURKEY Project Identification No: EuropeAid/129470/D/SER/TR Contract No: TR0802.04-02/001 Draft Regulatory Impact Assessment (RIA) JUNE 2013 This project is co-financed by the European Union and the Republic of Turkey National Programme for Turkey 2008 – Instrument for Pre-Accession Assistance
Transcript of TECHNICAL ASSISTANCE SERVICE FOR IPPC INTEGRATED … · Technical Assistance For IPPC “Integrated...

Technical Assistance For IPPC “Integrated Pollution Prevention and Control”
NIRAS IC Consortium ~ Regulatory Impact Assessment Report ~ June 2013
Page 1
TECHNICAL ASSISTANCE SERVICE FOR
IPPC – INTEGRATED POLLUTION PREVENTION AND CONTROL
IN TURKEY
Project Identification No: EuropeAid/129470/D/SER/TR
Contract No: TR0802.04-02/001
Draft
Regulatory Impact Assessment (RIA)
JUNE 2013
This project is co-financed by the European Union and the Republic of Turkey
National Programme for Turkey 2008 –
Instrument for Pre-Accession Assistance
Technical Assistance For IPPC “Integrated Pollution Prevention and Control”
NIRAS IC Consortium ~ Regulatory Impact Assessment Report ~ June 2013
Page 2
Project Title : Technical Assistance for IPPC Integrated Pollution Prevention and Control Contract Number : TR0802.04-02/001 Project Value : € 950,000.00 Starting Date : 07 May 2012 End Date / Duration : 06 May 2014 / 24 Months
Contracting Authority : CFCU (Central Finance and Contracts Unit Undersecretariat of Treasury Prime Ministery) CFCU Contract Manager : Dilek Ceylan Çalışkan Address : Eskişehir Yolu 4. Km 2. Cad. (Halkbank Kampüsü) No: 63 C-Blok 06520 Söğütözü, Ankara / TURKEY Telephone : + 90 312 295 49 00 Fax : + 90 312 286 70 72 e-mail : [email protected]
Beneficiary : Republic of Turkey Ministry of Environment and
Urbanization Address : Vekaletler Caddesi No: 1, 4. Kat. 06650 Kızılay, Ankara Telephone : + 90 312 410 1000 Fax : + 90 312 419 2192
Consultant : NIRAS IC Sp. z o.o. Project Director : Bartosz Wojciechowski Address : ul. Waliców 11, 00-851, Warsaw, Poland Telephone : +48 22 583 96 96 Fax : +48 22 583 96 97 e-mail : [email protected] Project Team Leader : Iain Maclean Address (Project Office) : Bestekar Sokak 30/18, 06680 Kavaklıdere Ankara Telephone/Fax : +90 312 418 0834 e-mail : [email protected]
Date of Report : June 2013 Compiled By : Iain Maclean Dr. Peter Futo Carlos Cisneros Checked By : Bartosz Wojciechowski
Technical Assistance For IPPC “Integrated Pollution Prevention and Control”
NIRAS IC Consortium ~ Regulatory Impact Assessment Report ~ June 2013
Page 3
Table of Contents
Table of Contents 3 Detailed Table of Contents 4 Glossary of Terms 6 Executive Summary 8 The RIA Component of the IPPC TA Project 16 Problem Statement 17 Policy Context and The Options 24 The IPPC/IED Regulation and Its Transposition Into Turkish Law 33 Assessing The Costs of Enforcement 36 Assessing the Costs of Compliance 39 IPPC/IED in Five Selected Industrial Sectors of Turkey 46 Impact Assessment Survey Among Industrial Companies of Turkey 74 Econometric calculation of costs to industry 97 Econometric calculations on adaptation time-frames 116 Econometric calculation of social impacts of IPPC/IED 121 Conclusions 125 Recommendations 126 Annex 1: Best Practices of Assessing the Impacts of Pollution Reduction Policies 128 Annex 2: Implementation of IPPC and IED in Some Countries 152 Annex 3: Legal Evaluation of Draft Regulation on Integrated Environmental Permitting 157 Annex 4: IPPC Adaptation Costs in Spain: the Table in Turkish Language 185 Annex 5: RIA as a Policy Tool in Turkey 187
Technical Assistance For IPPC “Integrated Pollution Prevention and Control”
NIRAS IC Consortium ~ Regulatory Impact Assessment Report ~ June 2013
Page 4
Detailed Table of Contents
Table of Contents 3 Detailed Table of Contents 4 Glossary of Terms 6 Executive Summary 8
The Directive 8 Industrial pollution in Turkey 8 Policy context 9 Costs of enforcement 10 Costs of compliance 10 Impact assessment survey among industrial companies of Turkey 11 IPPC/IED in five selected industrial sectors of Turkey 14 Conclusions and recommendations 15
The RIA Component of the IPPC TA Project 16 Problem Statement 17
Industrial air pollution in Turkey 17 Industrial water use and pollution in Turkey 20
Policy Context and The Options 24 Environmental issues in Turkey-EU negotiations 24 The Role of Environment in Economic Policies 25 Integrated Permitting and Social Awareness to Environmental Pollution in Turkey 27 Clean Production Initiatives in Turkey 29 Alternative Ways to Introduce IPPC 31
The IPPC/IED Regulation and Its Transposition Into Turkish Law 33 The Industrial Emissions Directive 33 Transposition of IED Into Turkish Law 34 Commentary on The Draft Regulation 35
Assessing The Costs of Enforcement 36 Permitting And Inspection ondustrial Companies Today 36 Implications of IED in Terms of Additional Activities And Resources 37
Assessing the Costs of Compliance 39 Items Of Cost And Benefit For Companies 39 Company costs due to IPPC: a bottom-up estimation 39 Costs due to IPPC: comparison of bottom-up and top-down estimation 45
IPPC/IED in Five Selected Industrial Sectors of Turkey 46 The Energy Industry 46 The Cement Industry 54 The Chemical Industry 61 The Food And Beverages Industry 65 The Textile and Clothing Industry 70
Impact Assessment Survey Among Industrial Companies of Turkey 74 Aims and method of the survey 74 Compliance of Industry With Environmental Regulations 76 Environmental Costs and Revenues 78 Environmentally Motivated Social and Institutional Contacts of Companies 81 Awareness of the Industrial Emissions Directive 83 Potential Impacts of The Introduction of IED on The Company 84 Questions -for Regulatory Consultation 94
Econometric calculation of costs to industry 97 Baseline 97 Description of the methodology 98 Emissions to Air 102 Emissions to Water 108 Solid Waste Management 110 Conclusions and Recommendations on The Use of These Cost Estimates 114
Econometric calculations on adaptation time-frames 116 Baseline 116
Technical Assistance For IPPC “Integrated Pollution Prevention and Control”
NIRAS IC Consortium ~ Regulatory Impact Assessment Report ~ June 2013
Page 5
Emissions to Air 116 Emissions to Water 119 Solid Waste Management 119
Econometric calculation of social impacts of IPPC/IED 121 Baseline 121 Description of the methodology 121 Results of the benefits calculations 122 Cost benefit analysis 123 Conclusions and recommendations on the use of these benefit estimates 124
Conclusions 125 Recommendations 126
Policy recommendations 126 Recommendations to improve impact assessment activities 127
Annex 1: Best Practices of Assessing the Impacts of Pollution Reduction Policies 128 EU: Impact assessment of the EU Thematic Strategy on air pollution (2005) 128 Ireland: Environmental Impacts of Integrated Licensing (2006) 132 UK: An Impact Assessment of the IPPC (2007) 133 EU: Impact Assessment of the IED Directive (2007) 136 EU: Model calculation of impacts of introducing BAT in LCPs (2008) 141 Spain: The IPPC Impact Assessment Survey (2008) 142 Ireland: Investigation on pollution abatement costs (2010) 146 EU: Air pollution damages caused by industry (2011) 148 Turkey: RIA of NECD for air pollution emission control (2012) 150
Annex 2: Implementation of IPPC and IED in Some Countries 152 Implementation of IPPC in the Mediterranean Area 152 Bulgaria 153 Hungary 154 Poland 155 Romania 157
Annex 3: Legal Evaluation of Draft Regulation on Integrated Environmental Permitting 157 Annex 4: IPPC Adaptation Costs in Spain: the Table in Turkish Language 185 Annex 5: RIA as a Policy Tool in Turkey 187
The Development of RIA Activities in Turkey 187 Turkish Guideline on Regulatory Impact Assessment 189
Technical Assistance For IPPC “Integrated Pollution Prevention and Control”
NIRAS IC Consortium ~ Regulatory Impact Assessment Report ~ June 2013
Page 6
Glossary of Terms
AEL Associated Emission Level
APC Air Pollution Control
BAT Best Available Techniques
BOD Biochemical Oxygen Demand
BREF BAT (Best Available Techniques) Reference Document
CIP Census of Industrial Production
CLP/GHS Globally Harmonised System of Classification and Labelling of Chemicals
EEA European Environment Agency
EECB Energy Efficiency Coordination Board
ELV Emission Limit Values
EMAS Eco-Management and Audit Scheme
EMS Environmental Management System
EPA Environmental Protection Agency
EPDK Energy Market Regulatory Authority
EPER European Pollutant Emission Register
E-PRTR European Pollutant Release and Transfer Register
ESES DPL Environmental Sustainability and Energy Sector Development Policy Loan
ETS Emissions Trading System
EÜAŞ Electricity Generation Company
FGD Flue Gas Desulphurization
GEM General Equilibrium Model
GHG Greenhouse Gases
IED Industrial Emissions Directive
IPA Instrument for Pre-Accession
IPC Integrated Pollution Control
IPPC Integrated Pollution Prevention and Control
LCP Large Combustion Plants
LNB Low-NOx Burners
MoEF Ministry of Environment and Forestry
MoEU Ministry of Environment and Urbanization
MS Member State
MTFR Maximum Technically Feasible Reduction

Technical Assistance For IPPC “Integrated Pollution Prevention and Control”
NIRAS IC Consortium ~ Regulatory Impact Assessment Report ~ June 2013
Page 7
NCPC National Cleaner Production Center
NECD National Emissions Ceilings Directive
NGO Non-Governmental Organization
NMVOC Non-Methane Volatile Organic Compounds
OPEX Yearly Operating Expense
PPC Pollution Prevention and Control
PSFC Pulverised Solid Fuel Combustion
REACH Regulation on Registration, Evaluation, Authorisation and Restriction of
Chemicals
RIA Regulatory Impact Analysis
SA Staged-Air
SCR Selective Catalytic Reduction
SDS Safety Data Sheets
SME Small and Medium sized Enterprises
TA Technical Assistance
TCMB Turkish Cement Manufacturers' Association
TEIAS Turkish Electricity Transmission Company
TETAS Turkish Electricity Trade & Engagement Incorporation
TKİ Turkish Coal Enterprises
TOBB The Union of Chambers and Commodity Exchanges of Turkey
TTGV Technology Development Foundation of Turkey
TTK Turkish Hard Coal Enterprises
TUBITAK The Scientific and Technological Research Council of Turkey
VALY Value Of Life Year
VOC Volatile Organic Compounds
VSL Value Of Statistical Life
Technical Assistance For IPPC “Integrated Pollution Prevention and Control”
NIRAS IC Consortium ~ Regulatory Impact Assessment Report ~ June 2013
Page 8
Executive Summary
The Directive The aim of this RIA Report is to reveal the expected impacts of introducing the IPPC / IED Directive to Turkey. The Industrial Emissions Directive. Directive 2010/75/EU of the European Parliament and of the Council of 24 November on industrial emissions recasts the following directives: (a) the three directives on titanium dioxide (b) the Directive on Volatile Organic Compounds (c) the Waste Incineration Directive, (d) the Directive on Large Combustion Plants and (e) the IPPC Directive. As a result of this recasting, the IED repeals the above 7 directives: LCP with the effect from January 2016, and the other six directives with effect from 7 January 2014. Implementation. The IED requires upgrading of any existing integrated environmental permit system established under the IPPC Directive. The environmental conditions established in the resulting integrated environmental permits must be based on the so-called conclusions on Best Available Techniques (BATs) and the Associated Emission Levels (AELs), which are described in a series of BAT Reference Documents (BREFs). The public has the right to participate in the decision-making process, and to be informed of its consequences. Transposition. The MoEU, with the help of the Twinning Component of the IPPC Project, has prepared a „Draft Regulation on Integrated Environmental Permit” which in its final form will be the transposition of Chapters I and II of the IED into Turkish law. Further work is required in order to ensure full transposition.
Industrial pollution in Turkey In Turkey rapid economic growth is closely associated with industrial pollution, and with the high share of energy-intensive products in the Turkish export portfolio. IPPC / IED addresses all elements of the environmental performance of industrial companies. The challenges of industrial emissions into air and water should be highlighted here:
Industrial air pollution continues to be a serious problem for various areas of Turkey and a challenge for public policy. Among industrial sectors, most harm is caused by the emissions of SO2, followed by NOx. The electricity generating sector and in particular, fuel combustion is critically important because it is responsible for emitting almost two-thirds of SO2 and about one third of NOx. Other sectors, such as industrial production, residential heating and road transport emit the bulk of NMVOC, while NH3 emissions arises mainly from the agricultural sector. Over the decade 2000-2010, the increase of GHG emission of the energy sector is spectacular. In 2011 the energy sector took the greatest share in GHG emissions (71%), while industrial operations was in the second place with (13%).

Technical Assistance For IPPC “Integrated Pollution Prevention and Control”
NIRAS IC Consortium ~ Regulatory Impact Assessment Report ~ June 2013
Page 9
Industrial water pollution. Food, beverage and textile industries are responsible for more than two-thirds of industrial water pollution. Water consumption is by far highest in the sector of metal manufacturing, followed by the food and beverage industry, the textile industry and the chemical industry. The overwhelming majority, more than three-quarters, of untreated industrial wastewater in Turkey is generated by coastal industries and is discharged directly into the sea. On the other hand, about half of treated industrial wastewater flows into rivers. Overall, only about one-third of industrial wastewater is treated.
Policy context The introduction of IPPC / IED to Turkey is closely connected to a series of policy areas. Here only the most important linkages to other, non-environmental policy areas will be highlighted. Environmental issues in Turkey-EU negotiations. Chapter 27 of the EU Acquis Communautaire, on the environment, was opened in December 2009 and will involve a wide range of legal harmonization. Turkey’s legislative alignment in the field of environment protection has made better progress than its performance in implementation, which will require time and significant funding. Improving compliance, while maintaining cost competitiveness, will be a key challenge for Turkey in the years ahead. The industrial strategy of the Government of Turkey for 2011-2014 has highlighted the importance of integrating environmental considerations into industrial development. In particular, it has assigned a great importance to the harmonization and effective implementation of the “Integrated Pollution Prevention and Control Directive (IPPC). On a strategic level, trade openness implies the harmonisation of environmental regulations, because as long as different countries have different legal regulations on health, safety and environmental protection, these differences may act as technical barriers to trade and investment. SMEs are an important and preferred sector of the Turkish economy. SMEs are disproportionately affected by the administrative burden of environmental regulations. Most managers of SMEs do not have the necessary sensitivity to environmental issues for their business. Surveys have shown that SMEs are much less capable of benefiting from awareness-raising efforts than bigger companies. Innovation policy and clean production initiatives. During the last decade there were certain pilot programmes promoting cleaner technology in Turkey. Companies applying cleaner production principles make an important step towards satisfying the requirements of the IPPC and IED directives. Cleaner production serves the adaptation process for environmental regulations, including IPPC, but cleaner production itself is not a sufficient condition for compliance with these regulations. Social awareness. The Industrial Emissions Directive ensures that the public has a right to participate in the decision making process. The introduction of integrated permitting will bring substantial changes in the procedure of public consultation on environmental issues in Turkey. Social activism has gained impetus in recent years. Environmental awareness in Turkish society is increasing. It is to be expected that public participation in the process of implementing and enforcing Integrated Permitting will gradually increase.
Technical Assistance For IPPC “Integrated Pollution Prevention and Control”
NIRAS IC Consortium ~ Regulatory Impact Assessment Report ~ June 2013
Page 10
Costs of enforcement Permitting procedures in force. In 2010 a "By Law on the Permit and Licenses Required by the Environmental Law" was introduced for granting a single environmental permit instead of the various environment-based permits and licenses previously required for activities and facilities that caused environmental pollution. The central and provincial organizations of the Ministry of Environment and Urbanisation carried out more than 51.000 environmental inspections in 2011 within the scope of the By law on Environmental Inspection. Additional tasks associated with the introduction of integrated permitting will include a regular updating and extending the Inventory, a continuous collection of data about the industry, establishment and maintenance of offices, equipment and software, training and information activities including the preparation / translation of BAT guidelines, adaptation of the current electronic permit system to IED needs, issuing integrated environmental permits and interacting with the EU, e.g. reporting. The above activities for the central and province levels of public administration imply costs of up to 5 million TL in the first year of integrated permits being issued, and up to 2,5 million TL in the consecutive years. Additionally, the present inspection costs will increase by up to 20%.
Costs of compliance Items of cost for companies. The perceptions of typical companies are negative regarding impact of environmental regulations on investments, exports and competitiveness. Business managers / owners perceive environmental regulations as just another layer of bureaucracy which might be good for the environment, but not good for business. The most significant cost items are:
Investment in cleaner technology / pollution abatement equipment and their maintenance costs
Charges to be paid for maintaining a permit (e.g. in the UK this charge is: 4000 GBP(11500 TL) per year)
Cost of application for permit – depends on risk level
So called surrender costs (upon termination of activity): Cost of site investigation, clean-up (i.e. carrying out actual decommissioning, including disposal of wastes, plant and equipment) and writing “decommissioning report”
Application writing (this may amount to 1 year’s full-time work for a person)
Keeping records and collecting information
Consultant fees, depending on size of site and complexity Benefits. However, according to case study evidence, IPPC can be good for business. Application writing and the preceding assessment of the installation, the thorough review of the environmental impact may reveal areas previously overlooked.
Many companies are motivated by IPPC to optimize water use, materials use and energy use.
IPPC also makes companies look at waste generation in detail, and through utilizing opportunities for waste minimization to reduce operating costs, charges for waste or effluent disposal.
IPPC may encourage the introduction of new technologies which frequently bring indirect benefits in terms of production efficiency.
Technical Assistance For IPPC “Integrated Pollution Prevention and Control”
NIRAS IC Consortium ~ Regulatory Impact Assessment Report ~ June 2013
Page 11
Company costs due to IPPC: a bottom-up estimation. Bottom-up methods of RIA cost estimations rely on business surveys. This RIA did not have the resources to implement an extensive business survey in Turkey. Therefore the bottom-up approach of cost assessment has applied a model calculation. For each IPPC category of Annex I the adaptation costs were taken from an IPPC-related business survey made in Spain. These costs were multiplied by to the number of Turkish IPPC installations and summarized. The result of this calculation was that during the first decade of IPPC coming into force in Turkey, the cumulated costs attributable to IPPC will amount to between 20 and 40 billion EUR. Company costs due to IPPC: top-down estimation. The above sum is comparable with the results of macro-economical calculations, outlined in the econometric chapters of this RIA. According to these, the adaptation to IPPC / IED, including capital expenditures and operating costs over the period of 2012-2025 will amount to approximately 46 Billion EUR, approximately €630 per capita. This is in the range that has been observed in the approximation processes of other transition economies. The implementation of the IED amounts to approximately half of the total costs of adopting the Acquis in Turkey.
Impact assessment survey among industrial companies of Turkey Aims. The survey was intended to give a reasonable overview of:
the present level of preparedness of the biggest and environmentally most active affected companies
expected investment costs and costs of ongoing compliance, e.g. administrative costs
expected benefits, e.g. due to opening up new markets, due to reducing risks or due to reducing material costs by reducing waste.
company attitudes to compliance. Survey sample. The survey targeted a relatively small, partially representative sample of those industrial installations / plants in Turkey that will be most affected by the introduction of Integrated Environmental Permitting. Due to limits of resources, the IED Impact Assessment Survey covered only 57 installations in 5 sectors and 5 provinces. The sectors and provinces targeted by the survey were agreed with the MoEU. The majority of respondent companies were selected from five selected industry sectors of importance in Turkey: Cement, Chemical, Energy, Food and Textile. More than half of the responding companies were large companies (i.e. employing more than 250 persons), and the rest were SMEs. Field work, data collection, data entry and primary statistical analysis was implemented by TOBB. Environmental performance. Most responding companies possess registered Environmental Management Systems and some operate non-registered EMSs. Typical responding companies employ 1 to 3 persons for performing environmentally relevant tasks for 10% to 30% of their working time. A few respondents employ 1 to 3 staff which is occupied full time with environmental management, including administration. A group of companies has outsourced part of the workload to external environmental consultants.
Technical Assistance For IPPC “Integrated Pollution Prevention and Control”
NIRAS IC Consortium ~ Regulatory Impact Assessment Report ~ June 2013
Page 12
Compliance of industry with environmental regulations. The overwhelming majority of companies is well aware of the fact that environmental regulations are changing. Meeting emission requirements and managing administrative procedures of environmental regulations have caused substantial difficulties to a wide range of companies. Most respondents have asserted that environmental regulations significantly affect their business, raising costs but also delivering social benefits. Many companies operate with temporary environmental permits, either because the installation itself has only temporary operation permit, or because some environmental problem. A group of respondents has stressed their strong social commitment to environment friendly production, their participation in various bodies and councils devoted to environmental protection. Companies recognise that environment protection measures contribute to the development of the firm. Most companies pay environmental fees for certification and permits to authorities ranging from a few hundred Euro up to 5000 Euro, according to the price list established by MoEU. A few respondents have explicitly mentioned that the adaptation of the best available technologies represented a substantial cost item for them. According to the respondents, significant environmental costs are attributed to items such as waste disposal, operating water treatment plants, occasional closing down of old installations, measurement, analysis, administration and external consulting services. Benefits from environmentally relevant activities. About one-third of responding companies was able to transform environmentally justified activities into by-products, into energy savings or material savings, and subsequently to increase their income. In particular cases this means that the waste generated by the installation is incinerated and the resulting steam is used for heating nearby living quarters or to generate electricity. Social and institutional linkages. About half of the respondents had previously communicated with chambers about environmental issues. The responses show an active co-operation with regional and national chambers of industry, with sectoral associations and with TOBB. A surprisingly high proportion, about one quarter of the respondents has been brought to court for environmental reasons e.g. for non-compliance with environmental regulations. A significant group of companies established contacts with environment protection organisations / NGOs, in most cases for jointly implementing environment protection projects. Awareness of IPPC / IED. About two-thirds of the respondents were familiar with the Industrial Emissions Directive. Somewhat more than two-thirds of the respondents were familiar with the Turkish Legislation introducing integrated permitting. About two-fifths of the companies have already checked whether or not they are subject to the provisions of IPPC. About one-third of the respondents considered that their company already complied with the requirements of IED. Companies vary in their awareness of BREFs, e.g. about one-third of the respondents has reported that they have seen and studied their sectoral BREF documents, a few reported that they have taken into consideration the recommendations contained in the BREFs. Most respondents need more guidance both on Integrated Environmental Permitting and on technological requirements. Most respondents expect the necessary guidance from MoEP, the Chambers and from professional / industrial associations. The medium of communication should be training courses, consultation events, simplified booklets and web based interactive information sources.
Technical Assistance For IPPC “Integrated Pollution Prevention and Control”
NIRAS IC Consortium ~ Regulatory Impact Assessment Report ~ June 2013
Page 13
Expected impacts of IPPC / IED. Respondents are clearly aware of the impacts of IED both for the company and for society and identify the major benefits and costs of having a new European environmental regulation introduced in Turkey. Expectations regarding technological innovations and cleaner production are high, while respondents realistically expect certain types of environmental expenditures to grow. Most respondents have recognized that the training of employees in environmental matters is necessary. The expectations of companies regarding the competitiveness effects of IEP are balanced: most of them expect no such effect, and the number of optimists somewhat outweighs the number of pessimists. IED seems to have a small effect on the competitiveness of most companies. Several respondents have pointed out that other factors have a much greater effects on competitiveness. Pessimistic respondents have referred to increasing costs, while optimistic respondents reckon with an increasing demand for environment friendly products. Company opinions differ by sectors:
Cement and textile companies attribute significant changes to the introduction of IPPC / IED both in terms of environmental benefits and costs.
On the other hand, the representatives of Large Combustion Plants were much more skeptical as of the impacts of IPPC / IED. The reason may be that the LPC Directive has already been introduced - although not yet enforced - in Turkey, and therefore integrated permitting does not bring so much novelty for these installations.
Company opinions differ by size:
Big companies, compared to their smaller counterparts, are much more optimistic about the positive benefits of IPPC / IED. The hope of big companies that environment friendly technologies and products will open up new markets for them, is stronger than the expectations of average sized industrial companies.
SMEs. On the other hand, small and medium sized companies are much more skeptical about the benefits of IPPC / IED compared to their bigger counterparts. Moreover, smaller companies are more convinced than big ones that IPPC / IED will bring significant cost increases for them.
Regulatory bargaining. Company representatives are highly interested to participate in the rule-making process. Their recommendations stress the importance of awareness raising and training. Many have called for a gradual introduction of IPPC / IED: the schedule should be negotiated on a sector-by sector basis in the framework of public consultancy. Companies would prefer a long transition period, the median length of the recommended transition period would be between 5 and 10 years. Some have recommended a fair, proactive and efficient implementation of the regulation. As for incentives, companies would welcome a wide range of measures such as (a) subsidies with or without EU co-financing, (b) tax deductions / tax breaks, (c) loans with low interest rates, (d) marketing support to sell eco-friendly products and (e) market development of environment-friendly inputs such as raw materials and pollution abatement technologies.
Technical Assistance For IPPC “Integrated Pollution Prevention and Control”
NIRAS IC Consortium ~ Regulatory Impact Assessment Report ~ June 2013
Page 14
IPPC/IED in five selected industrial sectors of Turkey The energy industry and in particular, Large Combustion Plants can be regarded as the major target group for industrial air pollution prevention, both in terms of damage caused and expected compliance costs. Fuel combustion for electricity generating purposes is responsible for emitting almost two-thirds of SO2 and about one third of NOx. Turkey operates 37 lignite fueled LCPs which include both public and privately owned plants. 34 of these lignite fuelled LCPS have a capacity larger than 300 MW. Emission rates and specific emissions (per MWh) of pollutants depends on whether or not the particular plant has installed pollution abatement technologies for dust collection, Flue Gas Desulphurization (FGD) and NOx abatement. Retrofitting LCPs in Turkey to meet the requirements of IPPC/IED clearly will cost much more than the costs associated with upgrading any other sector. Cumulated pollution abatement costs for the Turkish electricity sector for the period 2010 to 2025 is estimated to be somewhat over €18 billion at year 2010 prices. Estimated annual expenditures amount to 0,1% - 0,2% of GDP. The cement industry. Cement is produced by 66 companies in Turkey, out of which 48 cement plants are so-called integrated units which produce clinker, and fall under IPPC. The remaining 14 plants are performing only the grinding of purchased clinker and do not fall under IPPC. In 2010 Turkey’s export of cement ranks first in the world and Turkish cement industry has reached an annual production of 62.7 million tons. The Turkish cement industry provides employment for more than 15 thousand employees. The main environmental impacts in the manufacture of cement fall within the following categories: (a) Dust (stack emissions and fugitive sources) (b) gaseous atmospheric emissions (NOx, SO2, CO2, VOC, others) (c) Other emissions (noise and vibrations, odour, process water, production waste, etc.) (d) resource consumption (energy, raw materials). In Turkey the legal emission limits for cement plants are much higher than those given in the “BAT Conclusions” document for cement. Compliance with the Cement-BREF Document (BAT) can be achieved by investing in various pollution abatement technologies. The approximate magnitude of adaptation costs for the Turkish cement industry sector is estimated to be 1,5 billion EUR, with an error margin of 30% plus or minus. The chemical industry employs more than 80.000 persons in approximately 4,000 companies. The companies are mainly concentrated in the following cities: Istanbul, Izmir, Kocaeli, Sakarya, Adana, Gaziantep and Ankara. The technologies applied by the Turkish chemical industry are very diverse, with sub-industries such as petrochemicals, textiles, fertilizer production, pharmaceutical companies, soap and detergent industry, paints and coatings industry soda production, chrome chemicals and chrome derivatives, boron chemicals and sodium sulphate production. IPPC is clearly very relevant for the big chemical companies, but the majority of existing chemical companies are small or medium size businesses. It is difficult to make general statements about the adaptation costs of the chemical industry, because of the wide variety of technologies used and also because the installations vary very strongly by size, from a few giant companies to many medium sized businesses. The approximate magnitude of adaptation costs to the Turkish chemical industry sector is estimated to be between 1 and 2 billion EUR.
Technical Assistance For IPPC “Integrated Pollution Prevention and Control”
NIRAS IC Consortium ~ Regulatory Impact Assessment Report ~ June 2013
Page 15
The food and beverages industry employs almost a quarter of million persons and includes more than 30.000 enterprises, most of them SMEs. IPPC / IED is relevant only for the biggest companies of the sector. The major environmental challenge to the food industry is to implement those investments which are necessary to reduce water pollution, to manage solid and liquid wastes and to reduce stack gas emissions. The BREF for the Food, Drink and Milk Industries describes over 370 “techniques to consider in the determination of BAT”, both “process-integrated” and “end-of-pipe” techniques. Many address the issues of minimising water consumption and contamination; energy consumption and the use of raw materials with the consequent minimization of waste production. In the professional literature there is no cost assessment of the costs for upgrading the food industry sector as a whole, partly because the technologies applied in the sector are very heterogeneous. However, at the level of individual installations there are excellent case studies of cost assessments covering the complete or partial retrofitting of food industry installations in order to meet the requirements of IPPC. The textile and clothing industry includes more than 50.000 companies, which employ more than half million persons. Only 26 firms of the textile industry employ more than 1000 persons. Low levels of environmental costs have contributed to a certain extent to the competitiveness of Turkish textile products in export markets, but importers of textile and clothing products in EU frequently demand certification proving that the products are produced harmless to environment. The main environmental concerns in the textile industry are (a) discharged water and the chemical load it carries (b) energy consumption, (c) air emissions, (d) solid wastes and (e) odours, which can be a significant nuisance in certain treatments. In the processing of textiles, the industry uses a number of dyes, chemicals, auxiliary chemicals and sizing materials. The result is contaminated wastewater, which can cause environmental problems unless properly treated before its disposal. Wastewater treatment is the crucial environmental activity of the sector. Most Turkish textile companies use the so called “lagoon process”, i.e. a natural biological process for wastewater decomposition. The BREF for textile industry, depending on the textile technology used, for wastewater treatment recommends (a) oxidation methods, e.g. ozonation (b) adsorption activated carbon or (c) combined biological-physical and chemical treatments. The representatives of the Turkish textile industry argue that Government intervention is needed to reduce the price of bio-degradable dyes. According to the opinion of the representatives of the Turkish textile industry, for older textile companies and for companies located in densely populated areas the IED should be introduced not earlier then 10 years from now.
Conclusions and recommendations Integrated licensing should become the most important driver of pollution avoidance in Turkey. Pollution abatement costs associated with the introduction of IPPC / IED are substantial, but will not reduce substantially the competitiveness of Turkish industry. Special attention must be paid to lignite fuelled LCPs which have the greatest impact on the environment. . Consequently, implementation of IPPC / IED will bring benefits already in the middle term.
Technical Assistance For IPPC “Integrated Pollution Prevention and Control”
NIRAS IC Consortium ~ Regulatory Impact Assessment Report ~ June 2013
Page 16
This RIA recommends a strategy of introducing IPPC/IED, whereby both environmental preferences and industrial competitiveness will be respected. Under this scenario the deadlines of transposition and the schedule of enforcing the requirements is determined by consecutive consultation and agreements between the Government, the EU and the representatives of the operators on a sector-by-sector basis. The authorities implement the international best practices for raising awareness raising and offering guidance, and offer administrative simplifications for facilitating the adaptation of SMEs and for operators with registered Environmental Management Systems. The “Polluter pays” principle is generally applied, but financial incentives are offered for the adaptation of SMEs on the one side and LCPs on the other side.
The RIA Component of the IPPC TA Project
The Inception Report of the IPPC TA Project has defined the tasks of RIA in the context of the introduction of Integrated Permitting (IPPC) in Turkey. 1 According to this document, Regulatory Impact Analysis (RIA) forms an important part of the Project. RIA should address the probable economical and social impacts of IED application, in particular,
Cover financial and social impacts by assessing different scenarios;
Contain information on installations covered by the Directive;
Determine the general level of compliance of installations with directive;
Assess costs to be borne by the operators and by the administration;
Assess benefits concerning increased process efficiency, decreased of use of resources, human health and the environment.
Moreover RIA should facilitate stakeholder consultation and the sharing of information. The timeline of the RIA component is as follows:
The fact finding work within the RIA Component started in February 2013 and ended in April 2013. This included consultation with the Beneficiary, desk research and structured interviews with stakeholders. A business survey about the expected impacts was designed and conducted among Turkish companies affected by integrated permitting.
Analysis and report writing work was carried out for May.
A workshop with stakeholders was held on 12th June 2013, where the main findings of the RIA were discussed.
RIA training courses for MoEU staff, in the context of Integrated Permitting, were held in October and November 2013.
Acknowledgements
The authors of this report would like to thank to TOBB for their help in implementing the field work, data entry and primary statistical analysis of the business survey.
Special thanks to Mr Cesar Soaenez, RTA of the Twinning Component of the IPPC Project, for the valuable information and guidance offered.
1 Inception Report. Technical Assistance service for IPPC – Integrated Pollution Prevention and
Control in Turkey. Project Identification No: EuropeAid/129470/D/SER/TR. Contract No: TR0802.04-02/001. 27 May 2012
Technical Assistance For IPPC “Integrated Pollution Prevention and Control”
NIRAS IC Consortium ~ Regulatory Impact Assessment Report ~ June 2013
Page 17
Problem Statement
Industrial air pollution in Turkey In Turkey rapid economic growth is closely associated with increasing demand for electric energy and transport services. One of the key factors of the competitiveness of Turkish industry is the availability of cheap energy and the high share of energy-intensive products in the Turkish export portfolio. The above patterns of economic development can be clearly seen in air pollution data. Air pollution continues to be a serious problem for various areas of Turkey and a challenge for public policy. Turkey does not report its pollution data to the European Pollutant Release and Transfer Register (E-PRTR), but TURKSTAT maintains emission inventories since 19972. Furthermore, reliable surveys and model based computational results are available for limited geographical areas. Major air pollutants and polluters. A recent study3 reported emissions of four types of gas namely SO2, NOx, NMVOC and NH3. The study found that among industrial sectors, most harm is caused by the emissions of SO2, followed by NOx. The study found that the electricity generating sector and in particular, fuel combustion is critically important because it is responsible for emitting almost two-thirds of SO2 and about one third of NOx. Other sectors, such as industrial production, residential heating and road transport were found to emit the bulk of NMVOC. Less harm4 is caused by NH3 emissions from the agricultural sector, arising mainly from livestock rearing and the application of fertilizers to land. Greenhouse gas emissions. Turkey maintains a national greenhouse gas emission inventory.5 Ministries and other Government agencies contribute to the collection of greenhouse gas emissions data. The inventory contains emissions registered by the following primary information sources on GHG:
Energy balance sheets (Ministry of Energy and Natural Resources)
Industrial production data (TÜIK)
Agricultural production and agricultural data (TÜIK)
Calculations and data on land use change (Ministry of Agriculture and Rural Affairs) (now Ministry of Food, Agriculture and Animal Husbandry)
Calculations and data on forest sinks and emissions (Ministry of Environment and Forestry) (now Ministry of Forestry and Water Affairs)
Waste data (TÜIK)
Calculations and data on transport-related emissions (Ministry of Transportation)
2 “Environmental Statistics Compendium of Turkey, II. ”Published by Turkstat - Turkish Statistical
Institute, May 2006. 3 “Improving Emissions Control - NECD Emissions Management Strategies, Possible Emission
Ceilings and RIA.” Version 1 – 02 August 2012. By Russell Frost, Peter Newman, Chris Dore. Report by the Project EuropeAid/128897/D/SER/TR. Implementing Authority / Beneficiary: Ministry of Environment and Urbanisation. Service Contract Number: TR0802.03-02/001. 4 in monetary terms
5 Source: Ulusal Seragazı Emisyon Envanteri Raporu 1990-2009.

Technical Assistance For IPPC “Integrated Pollution Prevention and Control”
NIRAS IC Consortium ~ Regulatory Impact Assessment Report ~ June 2013
Page 18
Calculations and data on HFCs (Hybrid fiber-coaxial), PFCs (Perfluorocarbon) and SF6 (Sulphur-hexafluoride) (Ministry of Environment and Forestry) (now Ministry of Environment and Urbanisation)
Table 1. Aggregated GHG emissions by sectors (million tonnes of CO2) 6
Sector 1990 2000 2005 2006 2007 2008 2009 2011
Energy sector 132,13 212,55 241,75 258,56 288,69 277,71 278,33 301,25
Industrial operations without the energy sector
15,44 24,37 28,78 30,7 29,26 29,83 31,69 56,21
Agriculture 29,78 27,37 25,84 26,5 26,31 25,04 25,70 28,83
Waste 9,68 32,72 33,52 33,88 35,71 33,92 33,93 36,13
Total 187,03 297,01 329,9 349,64 379,98 366,5 369,65 422,42
Change compared to 1990
100.00 158,8 176,39 186,95 203,16 195,96 197,64 225,89
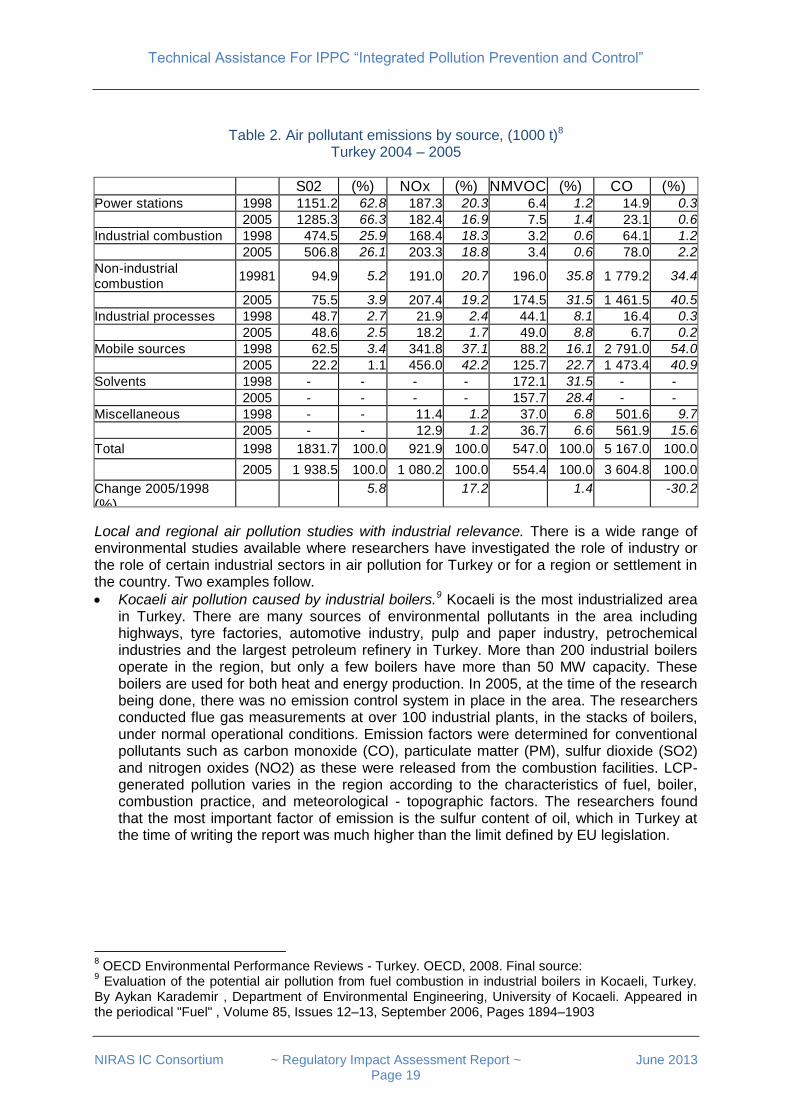
Over the decade 2000-2010, the increase of GHG emission of the energy sector is spectacular. In 2011 the energy sector took the greatest share in GHG emissions (71%), while industrial operations was in the second place with (13%). The following table contains more detail about the industrial causes of air pollution. For SO2, which is the most harmful substance for health and biodiversity, power stations were and still are the major polluters. In every category of pollutant, the emission of “Non-industrial combustion”7 is higher than that of “Industrial processes”. As it can be seen from the last line of the next table, over the period 1998-2005, the emission of every type of pollutant has increased, with the notable exception of CO. The reduction in CO is probably due to improved combustion efficiency.
6 Sources: (a) Ulusal Seragazı Emisyon Envanteri Raporu 1990-2009. (b)
http://www.tuik.gov.tr/PreHaberBultenleri.do?id=13482 7 Non-industrial energy production is applied in small-scale combustion installations with a thermal
capacity less than 50 MW, also known as small combustion plants (SCPs). Small combustion plants are used in the following activity sources: District heating, Commercial and institutional, Residential (including households), Agriculture / Forestry / Fishing, and Other (including military). Source: Small combustion installations: Techniques, emissions and measures for emission reduction. By Krystyna Kubica, Bostjan Paradiz, Panagiota Dilara. European Commission. Joint Research Centre, Institute for Environment and Sustainability. European Communities, 2007.
Technical Assistance For IPPC “Integrated Pollution Prevention and Control”
NIRAS IC Consortium ~ Regulatory Impact Assessment Report ~ June 2013
Page 19
Table 2. Air pollutant emissions by source, (1000 t)8 Turkey 2004 – 2005
S02 (%) NOx (%) NMVOC (%) CO (%) Power stations 1998 1151.2 62.8 187.3 20.3 6.4 1.2 14.9 0.3
2005 1285.3 66.3 182.4 16.9 7.5 1.4 23.1 0.6
Industrial combustion 1998 474.5 25.9 168.4 18.3 3.2 0.6 64.1 1.2
2005 506.8 26.1 203.3 18.8 3.4 0.6 78.0 2.2
Non-industrial combustion
19981 94.9 5.2 191.0 20.7 196.0 35.8 1 779.2 34.4
2005 75.5 3.9 207.4 19.2 174.5 31.5 1 461.5 40.5
Industrial processes 1998 48.7 2.7 21.9 2.4 44.1 8.1 16.4 0.3
2005 48.6 2.5 18.2 1.7 49.0 8.8 6.7 0.2
Mobile sources 1998 62.5 3.4 341.8 37.1 88.2 16.1 2 791.0 54.0
2005 22.2 1.1 456.0 42.2 125.7 22.7 1 473.4 40.9
Solvents 1998 - - - - 172.1 31.5 - -
2005 - - - - 157.7 28.4 - -
Miscellaneous 1998 - - 11.4 1.2 37.0 6.8 501.6 9.7
2005 - - 12.9 1.2 36.7 6.6 561.9 15.6
Total 1998 1831.7 100.0 921.9 100.0 547.0 100.0 5 167.0 100.0
2005 1 938.5 100.0 1 080.2 100.0 554.4 100.0 3 604.8 100.0
Change 2005/1998
(%) 5.8 17.2 1.4 -30.2
Local and regional air pollution studies with industrial relevance. There is a wide range of environmental studies available where researchers have investigated the role of industry or the role of certain industrial sectors in air pollution for Turkey or for a region or settlement in the country. Two examples follow.
Kocaeli air pollution caused by industrial boilers.9 Kocaeli is the most industrialized area in Turkey. There are many sources of environmental pollutants in the area including highways, tyre factories, automotive industry, pulp and paper industry, petrochemical industries and the largest petroleum refinery in Turkey. More than 200 industrial boilers operate in the region, but only a few boilers have more than 50 MW capacity. These boilers are used for both heat and energy production. In 2005, at the time of the research being done, there was no emission control system in place in the area. The researchers conducted flue gas measurements at over 100 industrial plants, in the stacks of boilers, under normal operational conditions. Emission factors were determined for conventional pollutants such as carbon monoxide (CO), particulate matter (PM), sulfur dioxide (SO2) and nitrogen oxides (NO2) as these were released from the combustion facilities. LCP-generated pollution varies in the region according to the characteristics of fuel, boiler, combustion practice, and meteorological - topographic factors. The researchers found that the most important factor of emission is the sulfur content of oil, which in Turkey at the time of writing the report was much higher than the limit defined by EU legislation.
8 OECD Environmental Performance Reviews - Turkey. OECD, 2008. Final source:
9 Evaluation of the potential air pollution from fuel combustion in industrial boilers in Kocaeli, Turkey.
By Aykan Karademir , Department of Environmental Engineering, University of Kocaeli. Appeared in the periodical "Fuel" , Volume 85, Issues 12–13, September 2006, Pages 1894–1903
Technical Assistance For IPPC “Integrated Pollution Prevention and Control”
NIRAS IC Consortium ~ Regulatory Impact Assessment Report ~ June 2013
Page 20
Istanbul area emission inventory. For the year 2007, an emission inventory was created for the greater Istanbul area (i.e. for a rectangle of size 92 km X 57 km).10 The data base covers CO, NOx, SOx, NH3, and chemically speciated PM10, PM2.5 and various NMVOC emissions. The inventory relies on secondary data: it was compiled by using various industrial, agricultural and municipal activities gathered from local official authorities and experts, measurements, published studies for the region or extracted from pre–existing databases. The results indicate that the road transport sector is the main contributor to the emissions in the area, whereas residential combustion (for SOx) and solvent use (for NMVOCs) are also important source categories. As confirmed and re-iterated by many other studies, industrial combustion is found to be the main source of SOx emissions.
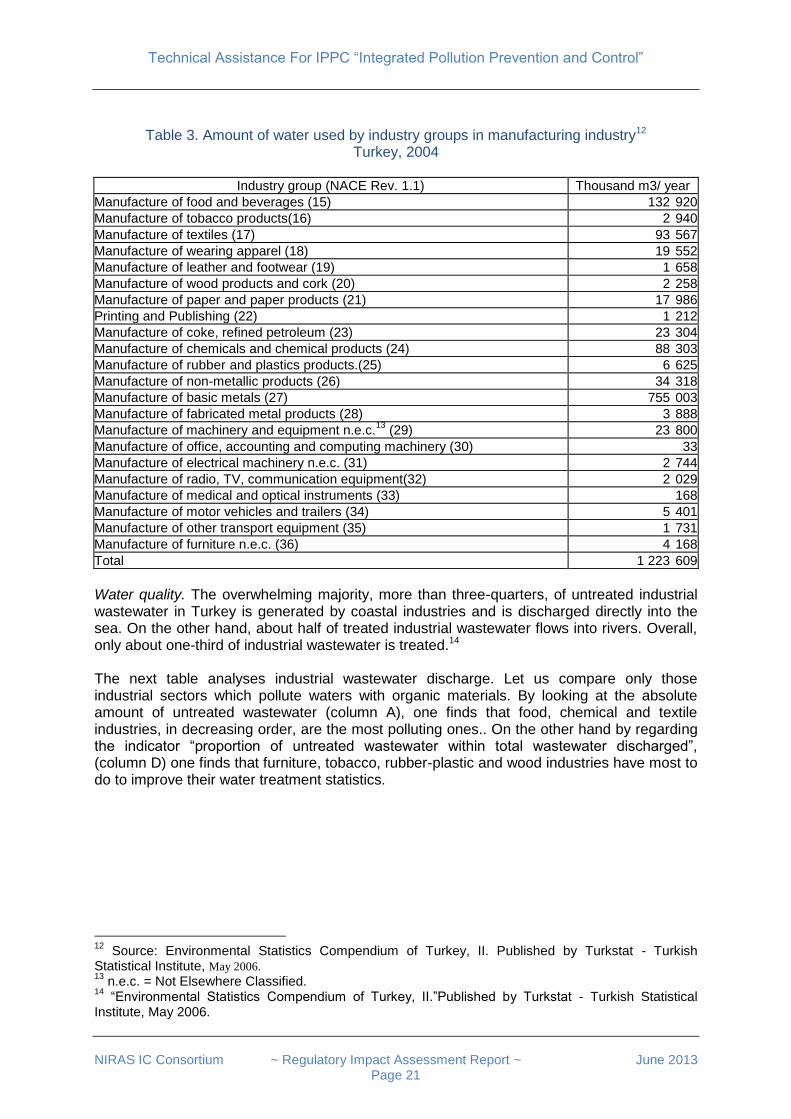
Industrial water use and pollution in Turkey Efficiency of industrial water usage. IPPC / IED has relevance not only to wastewater discharge, but it also defines specific provisions for the efficient use of water11. In Turkey industrial water use is about % 11 of total water use, with surface water being the main source of supply for industry. Water consumption is by far highest in the sector of metal manufacturing, followed by the food and beverage industry, the textile industry and the chemical industry.
10
Compilation of a GIS based high spatially and temporally resolved emission inventory for the greater Istanbul area. By Konstantinos Markakis, Ulas Im, Alper Unal, Dimitrios Melas, Orhan Yenigun, Selahattin Incecik. Atmospheric Pollution Research 3 (2012) 112‐ 125. 11
Annex III of IED states that BAT shall be determined on the basis of 12 criteria, whereby Criterion 9. is the consumption and nature of raw materials (including water) used in the process and energy efficiency.
Technical Assistance For IPPC “Integrated Pollution Prevention and Control”
NIRAS IC Consortium ~ Regulatory Impact Assessment Report ~ June 2013
Page 21
Table 3. Amount of water used by industry groups in manufacturing industry12 Turkey, 2004
Industry group (NACE Rev. 1.1) Thousand m3/ year
Manufacture of food and beverages (15) 132 920
Manufacture of tobacco products(16) 2 940
Manufacture of textiles (17) 93 567
Manufacture of wearing apparel (18) 19 552
Manufacture of leather and footwear (19) 1 658
Manufacture of wood products and cork (20) 2 258
Manufacture of paper and paper products (21) 17 986
Printing and Publishing (22) 1 212
Manufacture of coke, refined petroleum (23) 23 304
Manufacture of chemicals and chemical products (24) 88 303
Manufacture of rubber and plastics products.(25) 6 625
Manufacture of non-metallic products (26) 34 318
Manufacture of basic metals (27) 755 003
Manufacture of fabricated metal products (28) 3 888
Manufacture of machinery and equipment n.e.c.13
(29) 23 800
Manufacture of office, accounting and computing machinery (30) 33
Manufacture of electrical machinery n.e.c. (31) 2 744
Manufacture of radio, TV, communication equipment(32) 2 029
Manufacture of medical and optical instruments (33) 168
Manufacture of motor vehicles and trailers (34) 5 401
Manufacture of other transport equipment (35) 1 731
Manufacture of furniture n.e.c. (36) 4 168
Total 1 223 609
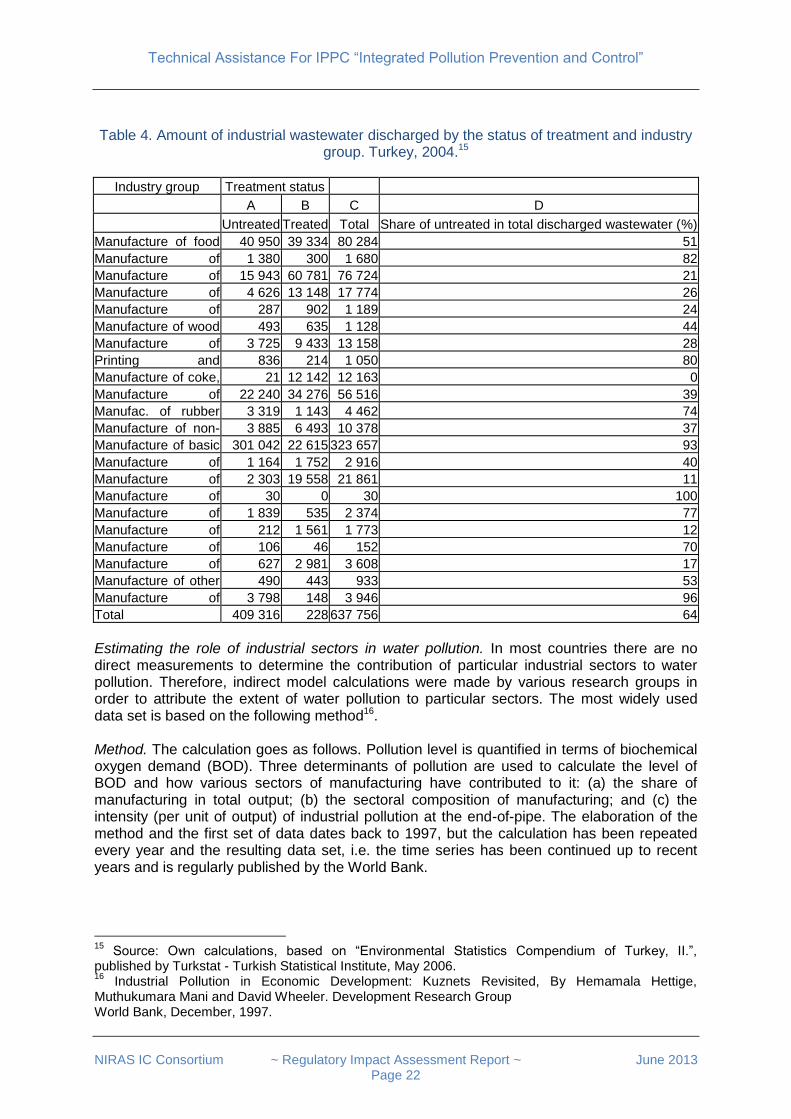
Water quality. The overwhelming majority, more than three-quarters, of untreated industrial wastewater in Turkey is generated by coastal industries and is discharged directly into the sea. On the other hand, about half of treated industrial wastewater flows into rivers. Overall, only about one-third of industrial wastewater is treated.14 The next table analyses industrial wastewater discharge. Let us compare only those industrial sectors which pollute waters with organic materials. By looking at the absolute amount of untreated wastewater (column A), one finds that food, chemical and textile industries, in decreasing order, are the most polluting ones.. On the other hand by regarding the indicator “proportion of untreated wastewater within total wastewater discharged”, (column D) one finds that furniture, tobacco, rubber-plastic and wood industries have most to do to improve their water treatment statistics.
12
Source: Environmental Statistics Compendium of Turkey, II. Published by Turkstat - Turkish Statistical Institute, May 2006. 13
n.e.c. = Not Elsewhere Classified. 14
“Environmental Statistics Compendium of Turkey, II.”Published by Turkstat - Turkish Statistical Institute, May 2006.
Technical Assistance For IPPC “Integrated Pollution Prevention and Control”
NIRAS IC Consortium ~ Regulatory Impact Assessment Report ~ June 2013
Page 22
Table 4. Amount of industrial wastewater discharged by the status of treatment and industry group. Turkey, 2004.15
Industry group (NACE Rev. 1.1)
Treatment status
A B C D
Untreated Treated Total Share of untreated in total discharged wastewater (%)
Manufacture of food and beverages (15)
40 950 39 334 80 284 51
Manufacture of tobacco products(16)
1 380 300 1 680 82
Manufacture of textiles (17)
15 943 60 781 76 724 21
Manufacture of wearing apparel (18)
4 626 13 148 17 774 26
Manufacture of leather and footwear (19)
287 902 1 189 24
Manufacture of wood products and cork (20)
493 635 1 128 44
Manufacture of paper and paper products (21)
3 725 9 433 13 158 28
Printing and Publishing (22)
836 214 1 050 80
Manufacture of coke, refined petroleum (23)
21 12 142 12 163 0
Manufacture of chemicals and chemical products (24)
22 240 34 276 56 516 39
Manufac. of rubber and plastics products.(25)
3 319 1 143 4 462 74
Manufacture of non-metallic products (26)
3 885 6 493 10 378 37
Manufacture of basic metals (27)
301 042 22 615 323 657 93
Manufacture of fabricated metal products (28)
1 164 1 752 2 916 40
Manufacture of machinery and equipment n.e.c. (29)
2 303 19 558 21 861 11
Manufacture of office,account. and compu. Mach(30)
30 0 30 100
Manufacture of electrical machinery n.e.c. (31)
1 839 535 2 374 77
Manufacture of radio, TV, communication equipm.(32)
212 1 561 1 773 12
Manufacture of medical and optical instruments (33)
106 46 152 70
Manufacture of motor vehicles and trailers (34)
627 2 981 3 608 17
Manufacture of other transport equipment (35)
490 443 933 53
Manufacture of furniture n.e.c. (36)
3 798 148 3 946 96
Total 409 316 228 440
637 756 64
Estimating the role of industrial sectors in water pollution. In most countries there are no direct measurements to determine the contribution of particular industrial sectors to water pollution. Therefore, indirect model calculations were made by various research groups in order to attribute the extent of water pollution to particular sectors. The most widely used data set is based on the following method16. Method. The calculation goes as follows. Pollution level is quantified in terms of biochemical oxygen demand (BOD). Three determinants of pollution are used to calculate the level of BOD and how various sectors of manufacturing have contributed to it: (a) the share of manufacturing in total output; (b) the sectoral composition of manufacturing; and (c) the intensity (per unit of output) of industrial pollution at the end-of-pipe. The elaboration of the method and the first set of data dates back to 1997, but the calculation has been repeated every year and the resulting data set, i.e. the time series has been continued up to recent years and is regularly published by the World Bank.
15
Source: Own calculations, based on “Environmental Statistics Compendium of Turkey, II.”, published by Turkstat - Turkish Statistical Institute, May 2006. 16
Industrial Pollution in Economic Development: Kuznets Revisited, By Hemamala Hettige, Muthukumara Mani and David Wheeler. Development Research Group World Bank, December, 1997.
Technical Assistance For IPPC “Integrated Pollution Prevention and Control”
NIRAS IC Consortium ~ Regulatory Impact Assessment Report ~ June 2013
Page 23
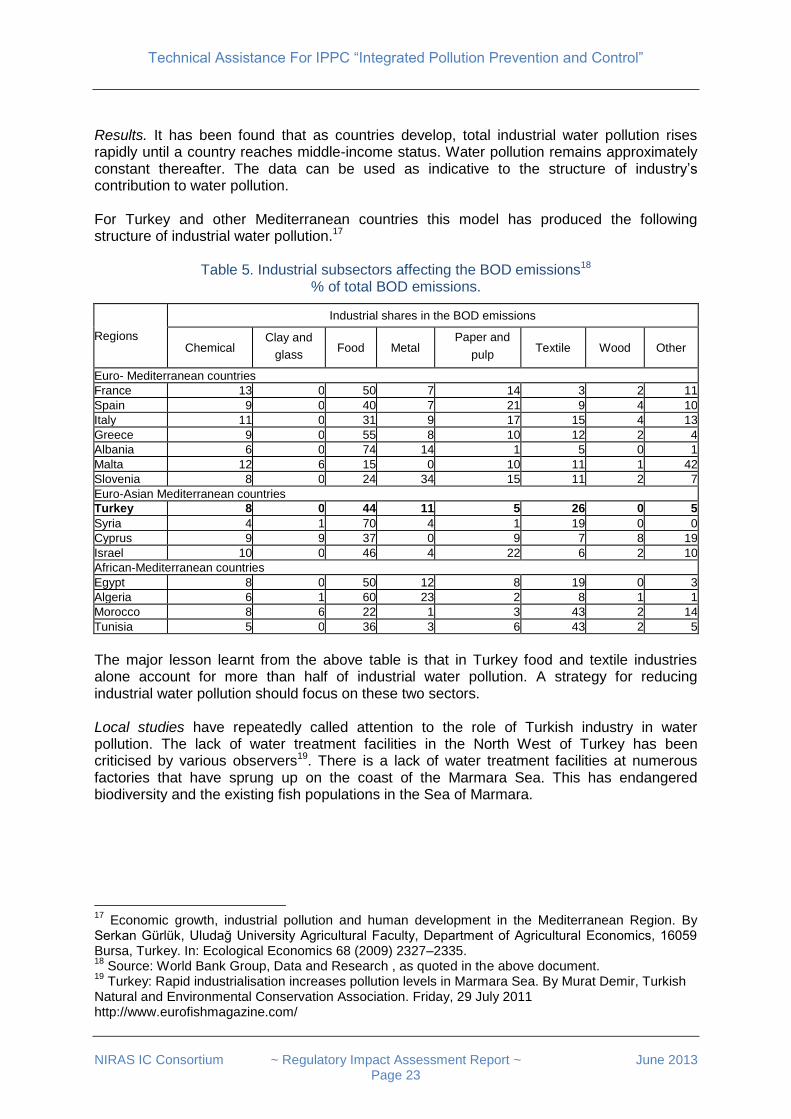
Results. It has been found that as countries develop, total industrial water pollution rises rapidly until a country reaches middle-income status. Water pollution remains approximately constant thereafter. The data can be used as indicative to the structure of industry’s contribution to water pollution. For Turkey and other Mediterranean countries this model has produced the following structure of industrial water pollution.17
Table 5. Industrial subsectors affecting the BOD emissions18 % of total BOD emissions.
Regions
Industrial shares in the BOD emissions
Chemical Clay and
glass Food Metal
Paper and
pulp Textile Wood Other
Euro- Mediterranean countries
France 13 0 50 7 14 3 2 11
Spain 9 0 40 7 21 9 4 10
Italy 11 0 31 9 17 15 4 13
Greece 9 0 55 8 10 12 2 4
Albania 6 0 74 14 1 5 0 1
Malta 12 6 15 0 10 11 1 42
Slovenia 8 0 24 34 15 11 2 7
Euro-Asian Mediterranean countries
Turkey 8 0 44 11 5 26 0 5
Syria 4 1 70 4 1 19 0 0
Cyprus 9 9 37 0 9 7 8 19
Israel 10 0 46 4 22 6 2 10
African-Mediterranean countries
Egypt 8 0 50 12 8 19 0 3
Algeria 6 1 60 23 2 8 1 1
Morocco 8 6 22 1 3 43 2 14
Tunisia 5 0 36 3 6 43 2 5
The major lesson learnt from the above table is that in Turkey food and textile industries alone account for more than half of industrial water pollution. A strategy for reducing industrial water pollution should focus on these two sectors. Local studies have repeatedly called attention to the role of Turkish industry in water pollution. The lack of water treatment facilities in the North West of Turkey has been criticised by various observers19. There is a lack of water treatment facilities at numerous factories that have sprung up on the coast of the Marmara Sea. This has endangered biodiversity and the existing fish populations in the Sea of Marmara.
17
Economic growth, industrial pollution and human development in the Mediterranean Region. By Serkan Gürlük, Uludağ University Agricultural Faculty, Department of Agricultural Economics, 16059 Bursa, Turkey. In: Ecological Economics 68 (2009) 2327–2335. 18
Source: World Bank Group, Data and Research , as quoted in the above document. 19
Turkey: Rapid industrialisation increases pollution levels in Marmara Sea. By Murat Demir, Turkish Natural and Environmental Conservation Association. Friday, 29 July 2011 http://www.eurofishmagazine.com/
Technical Assistance For IPPC “Integrated Pollution Prevention and Control”
NIRAS IC Consortium ~ Regulatory Impact Assessment Report ~ June 2013
Page 24
Water quality regulations in Turkey20. The following regulations are in force for governing water quality management. The framework law is the Law No. 2872 on the Environment which was first introduced in 1983 and then amended in 2006. It specifies the general principles for environmental protection and the prevention of pollution, defines the measures and prohibitions related to environmental protection, and imposes administrative penalties on polluters of water. This law adopts the principle of “polluter pays”. This was followed by the By-law on Water Pollution Control, which further specified how existing quality of water resources should be protected by considering water resources as an ecosystem and determining legal measures for the prevention and sanctioning of water pollution. Water quality regulations in the EU. International experience has shown that pollution prevention and control regulations implemented at the level of industrial installations are reliable tools to achieve the policy aims associated with water quality21. In the EU, the IPPC/Industrial Emissions Directive22 is one of the directives backing up the Water Framework Directive23 which establishes a legal framework to protect and restore clean waters across Europe and to ensure its long term sustainable use.
Policy Context and The Options
Environmental issues in Turkey-EU negotiations24
Chapter 27 of the EU Acquis Communautaire, on the environment, was opened in December 2009 and will involve a wide range of legal harmonization. Turkey’s legislative alignment in the field of environment protection has made better progress than its performance in implementation, which will require time and significant funding. Improving compliance, while maintaining cost competitiveness, will be a key challenge for Turkey in the years ahead. The following progress, relevant for IPPC / IED, has been reported:
Industrial pollution control. Some progress can be reported regarding industrial pollution control and risk management. The by-law on control of industrial pollution was amended and Turkey ratified the amendments related to the international agreement on remediation of oil pollution. A web-based permitting system has been created for industries, but the establishment of an integrated permit system is still at an early stage.
Air. In 1983 Turkey has ratified the Convention on Long-Range Transboundary Air Pollution, which elaborates fundamental principles for protecting man and his environment against air pollution. Turkey has completed the transposition of Directive 2001/80/EC on Large Combustion Plants.
20
“Turkey Water Report 2009”. Published by the General Directorate of State Hydraulic Works of the Republic of Turkey. 21
«Water Quality & EU Policy» . Katherine-Joanne Haralambous. National Technical University of Athens. Workshop on “Water Resources Management: Needs & Prospects” Amman, 22/04/2013 22
Together with the Nitrates Directive (91/676/EEC) and REACH (EC) No. 1907/2006 23
Directive 2000/60/EC. Other water related directives in force: the Urban Waste Water Treatment Directive (911/271/EEC), .the Bathing Water Directive (2006/7/EC), .the Nitrates Directive (91/676/EEC) and the .Drinking Water Directive (98/83/EC). 24
Sources: (a) Turkey 2012 Progress Report. Enlargement Strategy And Main Challenges 2012-2013. Accompanying the Document Communication from the Commission to the European Parliament and the Council. European Commission Brussels, 10.10.2012. (b) World Bank Group – Turkey Partnership: Country Program Snapshot April 2013.
Technical Assistance For IPPC “Integrated Pollution Prevention and Control”
NIRAS IC Consortium ~ Regulatory Impact Assessment Report ~ June 2013
Page 25
Water. The European Union (EU) is committed to the improvement of water quality for the Mediterranean countries. An important EU Policy for the Mediterranean Region is “Initiative Horizon 2020” which contains a comprehensive environmental strategy. This strategy facilitates the decrease industrial pollution in the Mediterranean Basin by supporting the improvement of the environmental performance of Mediterranean countries, by financing research projects relevant to the Mediterranean Sea. Turkey adopted a water law and legislation on river basin management and on groundwater and drinking water.
Waste. Turkey has adopted EU legislation on control of waste electrical and electronic equipment. Efforts have continued to bring landfill facilities up to EU standards and to improve the management of hazardous waste. The capacity for sorting and recycling has increased, but Turkey still needs to fulfill the requirements of the EU Waste Framework Directive in connection with the preparation and implementation of waste management plans.
The Role of Environment in Economic Policies Industrialization is Turkey’s major instrument for economic development. Since 1980 the country operates an export-led, open trade policy which has accelerated industrial development and urbanisation. In 1995 the EU and Turkey established a Customs Union which has been a major instrument of integration of the Turkish economy into the EU and global markets, offering powerful tools to reform the Turkish economy, but also raising environmental awareness.25 However, Industry in Turkey is energy intensive, with the iron and steel manufacturing and cement production sectors by far the largest energy users. The "Pollution haven hypothesis" argues that the industries that are highly pollution intensive i.e. dirty industries, have been migrating from developed economies to the developing world, because of relatively low wages and lax environmental regulations. Since the 1990s a wide range of studies26 investigated the hypothesis that lenient environmental governance has contributed to Turkey's spectacular growth of competitiveness. Some macro-economical studies27 have investigated long time series of GDP, trade volumes and the emission of greenhouse gases in Turkey and have concluded that during the last three decades of the 20th century the country was indeed a pollution haven. These studies have called for specialization in less polluting sectors on export side, and the design and monitoring of appropriate sanitary and environmental standards on import side. On a strategic level, trade openness implies the harmonisation of environmental regulations, because as long as different countries have different legal regulations on health, safety and environmental protection, these differences may act as technical barriers to trade and investment.
25
The EU-Turkey Customs Union: A Model for Future Euro-Med Integration. By Sübidey Togan. MEDPRO Technical Report No. 9. March 2012. 26
See e.g. (a) Pollution Haven Hypothesis and the Role of Dirty Industries in Turkey’s Exports. Elif Akbostanci , G.Ipek Tunç and Serap Türüt-Asik. No 403, ERC Working Papers from ERC - Economic Research Center, Middle East Technical University, 2004 27
See e.g. Turkey's Foreign Trade and Environmental Pollution: An Environmental Kuznets Curve Approach. By Cemal Atici and Fırat Kurt. Tarım Ekonomisi Dergisi 2007; 13(2) : 61 – 69.
Technical Assistance For IPPC “Integrated Pollution Prevention and Control”
NIRAS IC Consortium ~ Regulatory Impact Assessment Report ~ June 2013
Page 26
The Industrial strategy of the Government of Turkey for 2011-2014 has highlighted the importance of integrating environmental considerations into industrial development. In particular among the priorities of the major strategy document, the following objectives have been formulated:28
in industry, production will conform to health and environment regulations and importance will be placed on social responsibility standards. Because the Turkish Industry is becoming a part of the EU industrial zone, harmonization with the EU environmental legislation is of vital importance. Full harmonization with the EU legislation on environment will be achieved; but measures will be taken to minimize the cost of harmonization particularly for SMEs by effective transition-period strategies. Within the principles of sustainable development for Turkish Industry, implementation of environmental policies is an essential part of industrial strategy and it is of great importance that this process is directed with appropriate transition strategies. Within this framework, the Republic of Turkey-EU Integrated Environmental Approximation Strategy was prepared for the period between 2007 and 2023.
The Industrial strategy of the Government highlights that the harmonization and effective implementation of the “Integrated Pollution Prevention and Control Directive (IPPC) is of great importance with regards to competitiveness of the industrialists in foreign markets. Therefore, projects regarding harmonization of this Directive are being carried out.
Small and medium sized enterprises. Turkey's economy relies heavily on its SME sector to provide growth and jobs29. More than 99% of firms are SMEs, which contribute 78% of employment and 58% of the value added registered in the country. The Government operates a consequent SME development policy. Small businesses as a rule operate low capacity equipment and therefore fall below the capacity thresholds set in the IPPC Directive. However, many installations included in the IPPC inventory, prepared by the TA Component of the IPPC Project, are medium sized businesses that face challenges in environmental management, in the necessary know-how and in administrative capacity. This RIA study recommends that the integrated permitting procedure for small and medium sized firms is made as simple as possible and that additional guidance and support is provided for the SME sector. RIA. The Industrial Strategy highlights that Regulatory Impact Assessment will be done in order to determine the implementation processes for regulations which will come into force during the next period related to all environmental action plans. In this context, impact analyses of the topics which will be determined by stakeholders, starting from those directives identified by the EU as high cost, are planned to be conducted. At the end of these studies, implementation plans including detailed cost analysis for harmonization of the directives will be prepared. The implementation schedules of some directives may be changed according to the costs and the effects on the industry.
28 Turkish Industrial Strategy Document 2011-2014 (Towards EU Membership). Published in 2010 by the Ministry of Industry and Trade of the Republic of Turkey. 29
SBA Fact Sheet TURKEY, 2010/11. European Commission, Enterprise and Industry.
Technical Assistance For IPPC “Integrated Pollution Prevention and Control”
NIRAS IC Consortium ~ Regulatory Impact Assessment Report ~ June 2013
Page 27
Integrated Permitting and Social Awareness to Environmental Pollution in Turkey The introduction of integrated permitting will bring substantial changes in the procedure of public consultation on environmental issues in Turkey. The Industrial Emissions Directive ensures that the public has a right to participate in the decision making process, and to be informed of its consequences. In particular, the public will have access to permit applications in order to give opinions, to permits, to results of the monitoring of releases and to the European Pollutant Release and Transfer Register (E-PRTR)30. Members of the public will be able to view an application for an integrated permit before the permit is granted or refused, and applications for an integrated permit will have to describe any foreseeable significant effects of emissions from the installation to the environment. A famous case where IPPC would have made a difference. In the 1990s there was a well publicised, environmentally motivated social movement which was concerned with the granting of permits to operate a goldmine in Ovacik, in the district of Bergama, province Izmir.31 Local citizens and environmental groups demonstrated and brought the mining firm first to Turkish courts and later to the European Court of Human Rights. If IPPC or the equivalent for mining activities had been in force at that time, it would have certainly changed the administrative procedure and the courts could have reached a different decision.32 Challenges regarding the awareness of the population. As of today, it is hard to evaluate the level of environmental consciousness in various strata of Turkish society. However, it can be stated that while consumer awareness in Turkey is generally on the rise, when it comes to environmental issues, public awareness – although gradually increasing - still lags behind the level of environmental awareness of developed MSs of the EU. Challenges regarding the awareness of SMEs. Moreover, as one study33 prepared in 2005 found, SMEs are much less willing to participate in awareness-raising efforts than bigger companies: most managers of SMEs do not have the necessary sensitivity to understand the importance and implications of environmental issues for their business”; moreover “they do not see any problem with their operations unless a regulatory body warns them or suspends their operation due to violation of environmental codes”. The need for awareness. Article 56 of the Constitution of Turkey34 states that everyone has the right to live in a healthy, balanced environment and that it is the duty of the state and citizens to improve the natural environment, and to prevent environmental pollution. However, this Article cannot be implemented by relying solely on the efforts of the State: in order to make environmental polices work, an active civil society is needed. Gradual raising of awareness. While researchers from the early 2000's have registered a lack of interest in environmental issues in the vast majority of Turkish society, recent studies have shown a gradual improvement in this dimension of social consciousness.
30
A database of emission data reported by Member States, which is intended to provide environmental information on major industrial activities. E-PRTR has replaced the previous EU-wide pollutant inventory, the so-called European Pollutant Emission Register (EPER). 31 Opposition to gold mining at Bergama, Turkey. February 25, 2013. Environmental Justice Organisations, Liabilities and
Trade (EJOLT) factsheet, http://www.ejolt.org/wordpress/wp-content/uploads/2013/02/FS_003_Bergama.pdf. 32
The mine is operating. 33 Kaya, Eda: The Implementation Of The IPPC Directive To SMEs In Textile Industry In Turkey. 2005.
http://www.lumes.lu.se/database/alumni/04.05/theses/eda_kaya.pdf 34
Health Services and Conservation of the Environment
Technical Assistance For IPPC “Integrated Pollution Prevention and Control”
NIRAS IC Consortium ~ Regulatory Impact Assessment Report ~ June 2013
Page 28
Early educational efforts. From the 1980's onwards, courses of environmental studies have been offered for students at different levels of the educational system. Moreover in 1990, the Ministry of National Education, with the help of UNESCO, released handbooks on environmental education for teachers. The awareness-raising efforts also affected the higher education thus Turkish universities which established environmental engineering departments and research centres during the 1980s. 35 As a result, there are now more than 2000 environmental engineers in Turkey. Also there are various NGOs that have made serious efforts to raise social awareness regarding environmental values and aims.36
A study on farmers’ awareness. A study37 conducted in 2005 examined awareness in rural areas – brought a rather disappointing result in 2006. The researchers surveyed 159 rural dwellers living in 25 villages of Turkey about their attitudes to environment, with special respect to the use of agrochemicals. The study concluded that neither „governmental organizations, non-governmental organizations established at local, regional, national and international levels; nor the private sector and the public pay enough attention to environmental issues.” Studies on citizen’s awareness. In 2008 various research projects have studied the awareness of students38 and of the general population39 regarding environmental pollution. The aim of the latter study was to determine awareness, sensitivities and behaviours towards
environmental problems among 975 individuals in 25 cities. The study made clear that people in Turkey are aware of environmental pollution. Respondents were more concerned with global warming and air pollution, than with water and soil pollution. Significant differences in awareness could be seen in terms of gender: females are more aware than males. Moreover, educated persons were found to be more aware than less educated ones. In policies related to converting sensitivity for the environment into action, the Turkish government and institutions should take into account gender, education, income, age, the proximity of an industrial city and the availability of information sources for members of the public .
35 Özdemir, İbrahim: Development of Environmental Consciousness in Turkey [Richard Foltz
(ed.),Environmentalism in the Muslim World, Boston: MIT Press, 2003. Source:
http://www.scribd.com/doc/12718903/ 36
E.g. the TEMA Foundation (Turkish Foundation for Combating Soil Erosion, for Reforestation and the Protection of Natural Habitats). 37
„Rural Awareness of Environmental Issues: the Case of Turkey”. Polish J. of Environ. Stud. Vol. 16, No. 2 (2007). By H. Akca, M. Sayili and M. Yilmazcoban. 38
Responses of University Students Related to Environmental Problems: A Case Study of Ege University (Izmir-Turkey). By Bahriye Gülgün, Serpil Önder, Erden Akta, Funda Ünal Ankaya. In: Journal of Int. Environmental Application & Science, Vol. 3 (4). Pages 234-246 (2008). 39 Cankurt, Murat: Awareness to Environmental Pollution in Turkey. Source http://ageconsearch.umn.edu/bitstream/6807/2/sp08ca01.pdf
Technical Assistance For IPPC “Integrated Pollution Prevention and Control”
NIRAS IC Consortium ~ Regulatory Impact Assessment Report ~ June 2013
Page 29
Social activism has gained impetus in recent years and with it environmental issues have been increasingly covered by social research and the media. Books have appeared with scholarly analysis of the tension between environmental protection and economic development in Turkey and on the role of environmental movements in the democratization process of Turkey.40 Environmentalist organisations have launched awareness raising actions and disseminated know-how in order to raise attention to phenomena of global warning, industrial pollution and to speak up for the revision of transportation and energy policies.41 Turkish environmental organisations have repeatedly demonstrated against plans to build nuclear power plants in the country.42 A recently issued influential documentary film has shown the social effects of a landfill in a Turkish village.43
Conclusions. Environmental awareness in Turkish society is increasing. It is to be expected that public participation in the process of implementing and enforcing Integrated Permitting will gradually increase. The Government and NGOs – as well as chambers of commerce, industrial associations and institutions - should play a crucial part in preparing and managing this process by launching initiatives to raise awareness on environmental issues , by organizing conferences, seminars or meetings about environmental issues and by embracing specific local and sectoral environmental issues. More concrete steps are needed to be taken to raise the awareness of Turkish population and industry about integrated permitting, its requirements and the additional rights of the public to become involved in the administrative procedure of permitting. During the last few years training programmes, seminars, and workshops were implemented by the MoEU, by TÜSIAD44 and CP/RAC45 in order to raise awareness among companies: these efforts should be extended to awareness raising among the general population and citizens.
Clean Production Initiatives in Turkey Cleaner (sustainable) production decreases risks for humans and the environment by continuous application of an integrated and preventive environment strategy on products and processes. “Cleaner Production” requires the incorporation of environmental concerns as planning parameters for industrial, agricultural and urban, activities. In contrast “Pollution Control” and "End of pipe" approaches try to overcome the environmental problems after they arise.
40
Environmentalism in Turkey - Between Democracy and Development?. Edited by Micret Adaman. Bogazici University, Turkey. Murat Arsel, University of Chicago, Ashgate Publishing, Ltd., 2005, USA 41 „Academics, Activists Tackle Climate Change in Turkey”. The launching of a"Climate Change
Activist School" in Istanbul. Published on the website „Treehugger”, September 2, 2009. Source: http://www.treehugger.com/environmental-policy/academics-activists-tackle-climate-change-in-turkey.html 42 „Turkish activists call on government to give up nuclear power program”. People’s Daily Online,
2011 July 8. Source http://english.people.com.cn/90001/90777/90853/7403211.html 43
„Polluting Paradise”. Directed by Fatih Akin. The film was screened in the Special Screenings section at the 2012 Cannes Film Festival. Source http://www.hollywoodreporter.com/review/polluting-paradise-cannes-festival-review-326818 44
Turkish Industrialists and Businessmen's Association 45 Regional Activity Centre for Cleaner Production
Technical Assistance For IPPC “Integrated Pollution Prevention and Control”
NIRAS IC Consortium ~ Regulatory Impact Assessment Report ~ June 2013
Page 30
Companies applying cleaner production principles make an important step towards satisfying the requirements of the IPPC and IED directives. Cleaner production serves the adaptation process for the regulations related with Eco-labeling, Eco-design and Integrated Pollution Prevention and Control (IPPC). However, cleaner production itself is not a sufficient condition of compliance with these regulations. International organisations have recognized the importance of clean production. The number of the National Cleaner Production Centers (NCPC) has reached 42 since 1994 as a result of UNEP/UNIDO cleaner production program. Moreover, there are other cleaner production centres, which have been established by countries’ own initiatives and national sources. Such centres are often located in developed countries. In Turkey the "Cleaner Production" concept was first proposed as an Agenda by The Scientific and Technological Research Council of Turkey (TUBITAK) and Technology Development Foundation of Turkey (TTGV) in 1999. This Agenda recommended the establishment of a cleaner production centre. Such a centre has not been established on a national scale although an Eco-efficiency (Cleaner Production) Program has been implemented by UNIDO and TTGV since 2008. A recent study46 on the feasibility of cleaner production initiatives in Turkey has identified the following industrial sectors where the elaboration and adoption of cleaner technologies is feasible and desirable: (a) basic metal industry, (b) food products and beverages, (c) chemicals and chemical products, (d) other non-metallic mineral products and (e) textile products. The study recommends wide ranging policy reforms with supporting legislation and dissemination programmes. The study recommends tax exemptions and financial incentives for those companies which invest in cleaner technology R&D, installation and commercialization, into energy efficiency and renewable energy projects. Moreover, the creation of a national or regional risk/venture capital for cleaner production activities is necessary. A successful cleaner technology programme47. In 2008-2011 the Ministry of Environment and Forestry of Turkey was the beneficiary of a cleaner technology project implemented by UNDP, UNEP, UNIDO and FAO48. The project included (a) the organization of trainings in order to create a pool of national experts of eco-efficiency (b) demonstration projects of cleaner technology in 6 companies, (c) dissemination of the results of the pilot projects (d) establishment of an Information Centre (e) preparation of guidance documents for the implementations of eco-efficiency (cleaner production).
46
Project of determination of the framework conditions and research-development needs for the dissemination of cleaner (sustainable) production applications in Turkey. Final report. T.R. Ministry of Environment and Forestry, Technology Development Foundation of Turkey. Ankara – 2010. 47
Adaptation to climate change in industry: demonstration projects for water saving through eco-efficiency approach . By E. Alkaya, M. Bögürcü, F. Ulutaş, G.N. Demirer . Technology Development Foundation of Turkey (TTGV), Middle East Technical University. Presented on the 15th European Round Table on Sustainable Consumption and Production (ERSCP) , May 03, 2012, Bregenz/Austria 48 United Nations Development Programme (UNDP) , .United Nations Environment Programme (UNEP) , United Nations Industrial Development Organization (UNIDO) , Food and Agriculture Organization of the United Nations (FAO)

Technical Assistance For IPPC “Integrated Pollution Prevention and Control”
NIRAS IC Consortium ~ Regulatory Impact Assessment Report ~ June 2013
Page 31
Alternative Ways to Introduce IPPC This study identifies various policy options regarding the introduction of the IPPC/IEP Directive. The options differ from each other mainly by (a) the duration of the transition period, and (b) by the level of facilitation and incentives given to operators of IPPC installations. Having in mind the accession negotiations of Turkey to the EU and the overall environmental policy strategy of Turkey, the option of “not introducing IPPC / IED” is unrealistic, will not be analysed here. Option 1 is called “Maximum Environmental Benefits from IPPC/IED”. This option is characterized by quick transposition, by defining deadlines as uniformly across sectors as possible, by consequent strict enforcement of the regulation, by allowing only a minimum number of exceptions from requirements, and no incentives offered for improving environmental performance of polluting companies. The “polluter pays” principle is applied without any exception for all groups of companies. Option 2: is defined as “Feasibility Oriented Introduction of IPPC/IED“. Under this scenario:
The deadlines of transposition and the schedule of enforcing the requirements is determined by consecutive agreements among the Government, the EU and the representatives of the operators. Deadlines may be different across sectors, but may not be determined on a case by case basis.
Administrative simplifications. Authorities implement the international best practices for raising awareness raising and offering guidance, but offer administrative simplifications for facilitating the adaptation of operators only in exceptional cases. For example, a simplified integrated permitting procedure is established, whereby a single administrative procedure is needed to satisfy the requirements of several environmental regulations but offered only for small and medium sized firms with a registered Environmental Management System and with a good record of environmental compliance.
Financial incentives. The “Polluter pays” principle is still generally applied, but exceptions are made (a) in case of SMEs, in line with Turkey’s policies on small and medium enterprises and (b) in case of large combustion plants, by taking into consideration the public interests associated with electricity generation. For companies under (a) and (b) the schedule of enforcement offers more time for adaptation and certain financial incentives are offered from public funds49. Option 2 is a compromise representing a middle range between Option 1 and Option 3.
Option 3 is defined as “Facilitated Introduction of IPPC/IED”. Under this scenario the Government makes serious efforts to reduce the burdens to companies in adapting their installations to the requirements of integrated permitting and IPPC / IED.
Co-ordinating with other Government bodies. An inter-ministerial body is set up. The respective environmental policies are closely co-ordinated with other policy areas, by taking into consideration (a) competitiveness, growth and development aspects and strategies of Industrial Policy and Trade Policy (b) EU Integration Policy and (c) Small Business Development policy.
Deadlines. The requirements of IPPC / IED are introduced gradually, whereby simplifications and exceptions offered for various groups of operators are negotiated separately, e.g. on a sectoral basis. For big installations and for installations that are sensitive from the point of view of competitiveness, deadlines may be determined on a case by case basis.
49
For a selection of these public funds and support schemes see at the end of this sub-chapter.

Technical Assistance For IPPC “Integrated Pollution Prevention and Control”
NIRAS IC Consortium ~ Regulatory Impact Assessment Report ~ June 2013
Page 32
Administrative simplifications. Authorities offer administrative simplifications for facilitating the adaptation of operators for a wide group of operators. A simplified integrated permitting procedure is established, whereby a single administrative procedure is needed to satisfy the requirements of several environmental regulations, and this permitting system is offered for all small and medium sized firms, without any other conditions. SMEs will be disproportionately affected by IEP especially due to high perceived costs of bureaucracy and reporting. Therefore a "streamlined" reporting would be justified for thus group of firms, whereby industry only has to report once to the Ministry to cover their obligations under IPPC, waste, air water etc. i.e. that reporting is required in a single format that meets all the requirements.
Financial incentives. Better environmental compliance of industrial operators is motivated by various state subsidies offered for R and D and for technical support measures, preferential credit lines, co-financed by EU Structural Funds. A wide range of support projects are launched with the help of the EU and of other international organisations. The target group of these incentives includes SMEs and large installations owned by the public, but is not restricted to these groups of firms.
Financial incentives: some more detail. International experience shows that the retrofitting of some industries to reduce pollution is frequently supported by public money50. In Turkey there is a wide range of already existing and operating possible financial instruments which could be used to facilitate compliance with IPPC / IED under Option 2 and Option 3.51
For companies, innovation in the field of industrial pollution may be supported through the 7th Framework Programme of the EU.
For competent authorities technical capacity building is facilitated by the IPA Instrument for Pre-Accession. One of the major aims of EU assistance through IPA is the adoption of EU law on transport, agriculture, food safety, environment, climate change, energy.52
Moreover it is possible to obtain loans from EBRD for projects reducing industrial pollution.53
The European Investment Bank offers also loans for projects in the context of energy and environment. 54
The World Bank has strongly supported Turkey’s EU accession process over the past decade. It is currently supporting Turkey in harmonizing energy and environmental regulations with EU standards. In particular, the World Bank has offered a series of loans called “Environmental Sustainability and Energy Sector Development Policy Loan” (ESES DPL) for enhancing private sector clean technology investments and integrating climate change considerations in key sector policies and programs.55
The Government of Turkey operates a Credit Guarantee Fund which may offer incentives for companies investing in pollution abatement equipment.
50
See e.g. the case study of Poland in Annex 2. 51 Source: The Integrated Pollution Prevention and Control Directive. By Gürdoğar SARIGÜL on
behalf of DG Environment. European Commission Delegation to Turkey, Sector Manager for Environment and Sustainable Development. Istanbul, 21 October 2009. 52
“Turkey - financial assistance”. EU website: http://ec.europa.eu/enlargement/instruments/funding-
by-country/turkey/index_en.htm 53
http://www.ebrd.com/pages/country/turkey.shtml 54
http://www.eib.europa.eu/projects/regions/enlargement/turkey/index.htm. 55
World Bank Group – Turkey Partnership: Country Program Snapshot April 2013.
Technical Assistance For IPPC “Integrated Pollution Prevention and Control”
NIRAS IC Consortium ~ Regulatory Impact Assessment Report ~ June 2013
Page 33
The IPPC/IED Regulation and Its Transposition Into Turkish Law
The Industrial Emissions Directive IED. Directive 2010/75/EU of the European Parliament and of the Council of 24 November on industrial emissions recasts the following directives:
The three directives on titanium dioxide56
The Directive on Volatile Organic Compounds57
The Waste Incineration Directive,58
The Directive on Large Combustion Plants59
The IPPC Directive60 As a result of this recasting, the IED repeals the above 7 directives: LCP with the effect from January 2016, and the other six directives with effect from 7 January 2014. The IED requires upgrading of any existing integrated environmental permit system established under the IPPC Directive. The environmental conditions established in the resulting integrated environmental permits must be based on the so-called conclusions on Best Available Techniques (BATs) and the Associated Emission Levels (AELs), which are described in a series of BAT Reference Documents (BREFs). Format of the IED. IED is set out in seven chapters as summarised in the next Table. Chapters I and II provide the main replacement for the IPPC Directive 2008/1/EC. Activities covered by Chapters III, IV and VI, such as large combustion plants, waste incineration and co-incineration plants and plants producing titanium dioxide, are activities that can be found within Annex I and are thus required to obtain a permit in order to operate.61
56
(a) Council Directive 78/176/EEC of 20 February 1978 on waste from the titanium dioxide industry (b) Council Directive 82/883/EEC of 3 December 1982 on procedures for the surveillance and monitoring of environments concerned by waste from the titanium dioxide industry (c) Council Directive 92/112/EEC of 15 December 1992 on procedures for harmonising the programmes for the reduction and eventual elimination of pollution caused by waste from the titanium dioxide industry, 57
Council Directive 1999/13/EC of 11 March 1999 on the limitation of emissions of volatile organic compounds due to the use of organic solvents in certain activities and installations, 58
Directive 2000/76/EC of the European Parliament and of the Council of 4 December 2000 on the incineration of waste, 59
Directive 2001/80/EC of the European Parliament and of the Council of 23 October 2001 on the limitation of emissions of certain pollutants into the air from large combustion plants 60
Directive 2008/1/EC of the European Parliament and of the Council of 15 January 2008 concerning integrated pollution prevention and control. 61
Article 4 of IED.
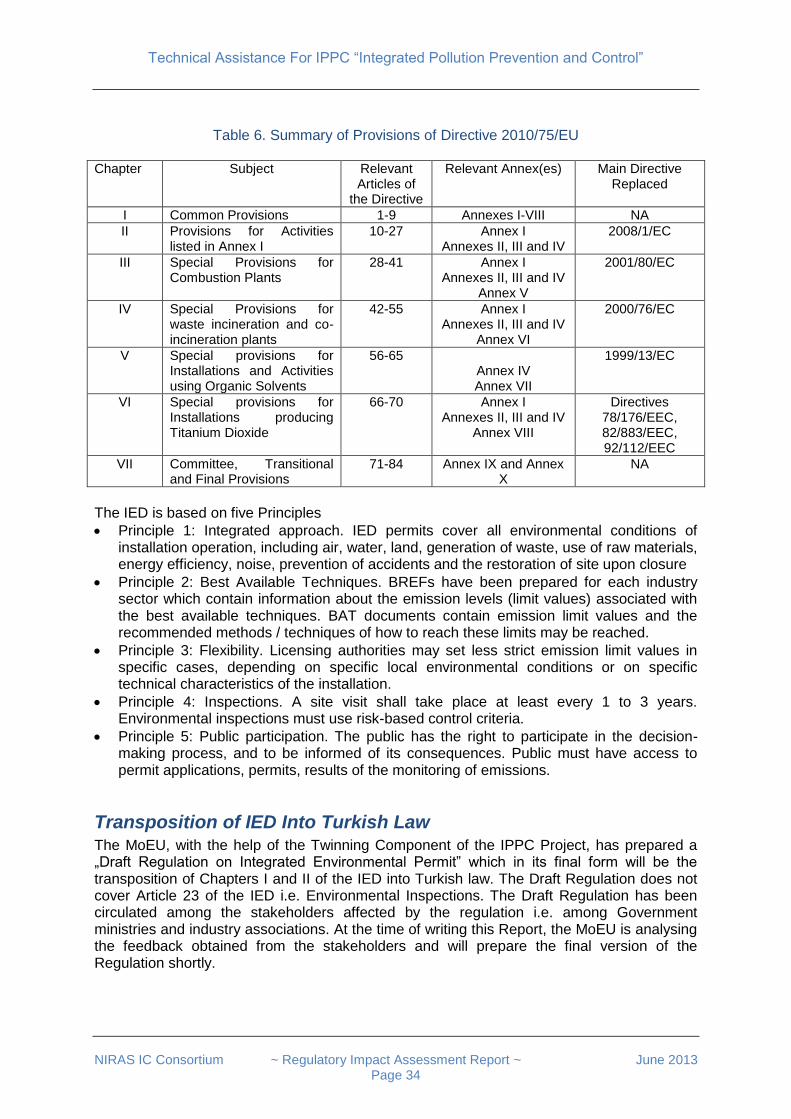
Technical Assistance For IPPC “Integrated Pollution Prevention and Control”
NIRAS IC Consortium ~ Regulatory Impact Assessment Report ~ June 2013
Page 34
Table 6. Summary of Provisions of Directive 2010/75/EU
Chapter Subject Relevant Articles of
the Directive
Relevant Annex(es) Main Directive Replaced
I Common Provisions 1-9 Annexes I-VIII NA
II Provisions for Activities listed in Annex I
10-27 Annex I Annexes II, III and IV
2008/1/EC
III Special Provisions for Combustion Plants
28-41 Annex I Annexes II, III and IV
Annex V
2001/80/EC
IV Special Provisions for waste incineration and co-incineration plants
42-55 Annex I Annexes II, III and IV
Annex VI
2000/76/EC
V Special provisions for Installations and Activities using Organic Solvents
56-65 Annex IV Annex VII
1999/13/EC
VI Special provisions for Installations producing Titanium Dioxide
66-70 Annex I Annexes II, III and IV
Annex VIII
Directives 78/176/EEC, 82/883/EEC, 92/112/EEC
VII Committee, Transitional and Final Provisions
71-84 Annex IX and Annex X
NA
The IED is based on five Principles
Principle 1: Integrated approach. IED permits cover all environmental conditions of installation operation, including air, water, land, generation of waste, use of raw materials, energy efficiency, noise, prevention of accidents and the restoration of site upon closure
Principle 2: Best Available Techniques. BREFs have been prepared for each industry sector which contain information about the emission levels (limit values) associated with the best available techniques. BAT documents contain emission limit values and the recommended methods / techniques of how to reach these limits may be reached.
Principle 3: Flexibility. Licensing authorities may set less strict emission limit values in specific cases, depending on specific local environmental conditions or on specific technical characteristics of the installation.
Principle 4: Inspections. A site visit shall take place at least every 1 to 3 years. Environmental inspections must use risk-based control criteria.
Principle 5: Public participation. The public has the right to participate in the decision-making process, and to be informed of its consequences. Public must have access to permit applications, permits, results of the monitoring of emissions.
Transposition of IED Into Turkish Law The MoEU, with the help of the Twinning Component of the IPPC Project, has prepared a „Draft Regulation on Integrated Environmental Permit” which in its final form will be the transposition of Chapters I and II of the IED into Turkish law. The Draft Regulation does not cover Article 23 of the IED i.e. Environmental Inspections. The Draft Regulation has been circulated among the stakeholders affected by the regulation i.e. among Government ministries and industry associations. At the time of writing this Report, the MoEU is analysing the feedback obtained from the stakeholders and will prepare the final version of the Regulation shortly.
Technical Assistance For IPPC “Integrated Pollution Prevention and Control”
NIRAS IC Consortium ~ Regulatory Impact Assessment Report ~ June 2013
Page 35
The “Draft Regulation on Integrated Environmental Permit” is a twenty six page document with the following content. The document consists of the following Sections:
Purpose, Scope, Basis, Definitions
General Principles on Integrated Environmental Permits
Legal Procedure for the Integrated Environmental Permit
Inspections and sanctions The document includes the following Annexes:
Categories of activities under the scope of this By-law
List of polluting substances
Criteria for determining Best Available Techniques
Public participation in decision-making
Criteria to define a change as substantial The Draft Regulation has been prepared in order to transpose Chapters I and II of the IED62 with the exception of Article 23 that sets requirements for environmental inspections. It does not attempt to transpose Chapters III and IV of IED63 and avoids reference to combustion plant and to waste incineration and co-incineration plants. Chapter VI of IED64 is not significant at this time, as no titanium dioxide installation exists in Turkey, while Chapter V of IED65 is planned to be transposed in separate legislation.
Commentary on The Draft Regulation66 Overall there is a high degree of concordance between the draft Regulation and Chapters I & II of the Directive 2010/75/EU although some discrepancies have been identified. The main discrepancies are as follows: 1. There is no definition for the terms “groundwater”, “poultry”, “fuel”, “combustion plant”,
“stack”, “operating hours”, “waste”, “hazardous waste” or “organic solvent”. While some of these terms may be argued to relate to combustion plant and to Chapter III, the operation of combustion plants, even large combustion plants, is frequently associated with a wide range of Annex I activities. The definitions of groundwater, poultry, waste and hazardous waste are significant to implementation of Chapters I & II of the Directive and the definition of organic solvent is relevant to activity 6.7 of Annex I.
2. Article 5(1) of Directive 2010/75/EU states: “Without prejudice to other requirements laid down in national or Union law, the competent authority shall grant a permit if the installation complies with the requirements of this Directive”. This requirement is only partially transposed in the draft Regulation. This requirement is significant particularly in relation to installations such as landfill sites or incinerators that frequently are unpopular with the public
3. There is no specific transposition for an operator to report to the competent authority following an accident or an incident, although Article 34 of the draft Regulation does require reporting of any infringement of permit conditions.
62
Common Provisions / Provisions for Activities listed in Annex I 63
Special Provisions for Combustion Plants / Special Provisions for waste incineration and co-incineration plants 64
Special provisions for Installations producing Titanium Dioxide 65
Special provisions for Installations and Activities using Organic Solvents 66
A full legal analysis of the draft Regulation is found in the Annex.
Technical Assistance For IPPC “Integrated Pollution Prevention and Control”
NIRAS IC Consortium ~ Regulatory Impact Assessment Report ~ June 2013
Page 36
4. There is no direct reference to Principle(c) in Article 11 of the IED although there are three articles in the draft Regulation that contain a requirement “to achieve a high degree of protection of the environment as a whole”
From a practical point difficulties may be experienced in relation to permitting combustion plants that are operated in association with activities found within Annex I. Further difficulties may be experienced in relation to the co-incineration of waste which can be encountered, for example, in installations that produce cement. In cases such as this, the competent authority should develop a policy to clarify how such associated activities will be permitted. The main conclusion is that the draft Regulation provides a sound basis upon which to commence integrated permitting in Turkey but it should be recognised that the draft Regulation falls short of full transposition of Directive 2010/75/EU. Further work is required in order to ensure full transposition.
Assessing The Costs of Enforcement
Permitting And Inspection ondustrial Companies Today Permitting procedures in force.67 In 2006, Turkish environmental authorities started to elaborate a single environmental permit using an integrative approach to replace the five different environment-based permits and eighteen different licenses that were given by the central organization of the Ministry and its provincial directorates. The aim was to simplify the bureaucratic procedures. In 2010 a "By Law on the Permit and Licenses Required by the Environmental Law"68 was introduced for granting a single environmental permit instead of the various environment-based permits and licenses previously required for activities and facilities that caused environmental pollution. Since 2010 the single Environmental Permit / Environmental Permit and License is granted in an electronic environment. Current status of integrated environmental inspections in Turkey69. The competent authorities for environmental inspections are the Provincial Directorates of MoEU. The central level of MoEU does inspections only in specific cases, e.g. if the installation is particularly complex because of its characteristics. Provincial Directorates as a rule select 20 installations per year for integrated inspections (i.e. for air, water, etc. pollution). Additionally, integrated inspections are launched if complaints have been received about an installation. Further inspections are carried out that do not cover all the environmental factors that are contained in a permit, and may focus on a single media (e.g. air, water, etc). Global reports on inspections are published yearly.70 Information about a specific inspection can be requested by the public. The central and provincial organizations of the Ministry of Environment and Urbanisation carried out more than 51.000 environmental inspections in 2011 within the scope of the By law on Environmental Inspection. As of 2011, the categories of inspections were as follows.
67
Based on “Environmental Inspection Report of Turkiye in 2011”. 68
Official Gazette no. 27214 of 29 April 2009 69
Based on (a) Environmental Inspection Report of Turkiye in 2011. MoEU, 2012 and (b) on information obtained from the IPPC Twinning Project. 70
Environmental Inspection Report of Turkiye in 2011. MoEU, 2012.
Technical Assistance For IPPC “Integrated Pollution Prevention and Control”
NIRAS IC Consortium ~ Regulatory Impact Assessment Report ~ June 2013
Page 37
Which administrative procedure. Inspections are carried out mainly under the following administrative procedures: (a) Environmental Impact Assessment (b) Provisional Activity Certificate (c) and Certificate of Environmental Permit.
Planned / unplanned. There are (a) routine (planned) inspections and (b) non-routine (unplanned) inspections. Routine inspections are made within the framework of annual or multi-year programs and operators can be previously informed or not informed. In case of non-routine inspections operators are not informed previously.
What is the initiative. Inspections may be carried out (a) As part of the permit renewal procedure, (b) As part of the procedure for getting a new permit, (c) Following accidents and events (such as fire), (d) If any regulatory non-compliance is detected, (e) If deemed necessary by the MoEU or by the Provincial Directorates (f) If notifications or complaints are received.
Which media (air, water, etc.) are covered.
Combined inspections have been implemented since 2004 by the MoEU. Combined inspections are defined as follows: "Combined inspections check the compliance of the facilities or activities with the Environmental Law and with all by laws under the Environmental Law about air, water, soil, waste, chemicals, sea and noise.". The name “combined” is used instead of “integrated”; the latter name will be used only after IPPC based administrative procedures have been introduced.
Media based inspections check the compliance of the facilities and activities with the Environmental law and with one of the by laws made under the Environmental Law concerning air, water; soil, waste, chemicals, sea and noise."
Implications of IED in Terms of Additional Activities And Resources71 A recent study prepared by the Twinning Component of the IPPC Project has estimated the additional resource needs of the public administration associated with the introduction of integrated permitting. Assumptions of the study. The assessment was based on the estimated number of IPPC72 installations in Turkey, on the number of recent staff73 with permitting and inspection responsibilities and on the budgets of these activities under the recent permitting and inspection system. Another assumption of the study was that the tentative calendar of implementation would be as follows:
Publication of the transposed IED - 2014,
Entry into force for new installations - 3 years after publication (2017),
Entry into force for all existing installations - 13 years after the publication.
71
Estimates of the resources needed by the MoEU to implement an integrated environmental permitting and inspection system. Strategy proposals for the implementation of integrated environmental permitting and inspection in the coming years. Project TR-2008-IB-EN-03, Activities no: 2.1.3, 3.1. ,Prepared by: Lara Altable , Rocío Jiménez, Íñigo de Vicente-Mingarro, Daniel Martín-Montalvo, Marcin Wisniewski, Michał Jabłoński, Joan Ramon Cabello, Jaime Fernández-Orcajo, Luis Suárez, César Seoánez. 72
Based on the available results of IPPC TA Project in January 2013, the study assumed that the number of IPPC installations was 6206. With the arrival of new capacity data, in May 2013 this number was reduced to 4955. 73
The relevant staff at central MoEU level: 25 persons. MoEU staff in provinces for EIA, permits and inspections: in 2010 was 1.181. Out of this, staff with inspection responsibilities in the provinces: 313 persons.
Technical Assistance For IPPC “Integrated Pollution Prevention and Control”
NIRAS IC Consortium ~ Regulatory Impact Assessment Report ~ June 2013
Page 38
In addition, the study assumed that the majority of permits would be granted in each province by province level authorities and the rest - mostly those for bigger installations - by central environmental authorities. Since IEPs are much more complex than the permits and licenses currently being issued, an increase of administrative burdens for public authorities was forecasted, implying additional resources in terms of the number of staff and also in terms of knowledge. Various scenarios were studied, such as the division of work between central level and province level authorities. Implications of introducing integrated permitting. The study made an inventory of tasks associated with the introduction of integrated permitting, including the following activities.
Updating and extending the Inventory by using other databases, e.g. the EIA and inspection databases operated by MoEU, and the databases of the Ministry of Customs and Trade and that of TÜIK (Turkish Statistical Institute).
Obtaining IPPC related information from the industry.
Establishment and maintenance of offices, equipment and software.
Training activities.
Adaptation of the current electronic permit system to IED needs
Capacity building for IPPC related communication
Informing and training the industry, creating and maintaining a website.
Preparation / translation of BAT guidelines
Establishment of Technical Working Groups for the preparation of national guides
Issuing integrated environmental permits
Interacting with the EU, e.g. reporting Forecasted permitting costs. The report summarized that the above activities will imply the following associated costs for the central and province levels of public administration:
between 4 to 5 million TL in the first year of integrated permits being issued, and
between 2 and 2,5 million TL in the consecutive years. Implications for inspection activities. Environmental inspection implies operational costs (sampling, monitoring, vehicles, etc). In order to adapt to the IED and coordinate inspections developed in different provinces, periodic inspection plans must be created, including:
Criteria for scheduling of inspections based on the environmental risk of the installation.
An IED-conform typology of inspections to be developed, activities to be identified for each of the inspection types (e.g. partial inspection of waste, inspection of air emissions or inspection of documents).
Criteria and written procedures for the conduct of inspections.
Human and material resources available to this program.
Inspector training programs.
Introducing exchange program experiences into the practice. Forecast increase of inspection costs. According to international experiences74, the additional workload and operational cost due to the implementation of an IED-compliant system will range between 15% to 20%.
74
The consultants were relying mostly on Spanish and Polish experience.
Technical Assistance For IPPC “Integrated Pollution Prevention and Control”
NIRAS IC Consortium ~ Regulatory Impact Assessment Report ~ June 2013
Page 39
Assessing the Costs of Compliance
Items Of Cost And Benefit For Companies
Costs. The perceptions of typical companies are negative regarding impact of environmental regulations on investments, exports and competitiveness. Business managers / owners perceive environmental regulations as just another layer of bureaucracy which might be good for the environment, but it is not good for business. Indeed, in the UK the overall costs of all environmental regulations are estimated to be £4 billion per year. 75 The most significant cost items are
Investment in cleaner technology / pollution abatement equipment and their maintenance costs
Charges to be paid for the Environmental Agency (UK: 4000 GBP per year)
Cost of application for permit – depends on risk level
So called surrender costs (upon termination of activity): Cost of site investigation, clean-up (i.e. carrying out actual decommissioning, including disposal of wastes, plant and equipment) and writing “decommissioning report”
Application writing (this may amount to 1 year’s full-time work for a person)
Keeping records and collecting information
Consultant fees, depending on size of site and complexity Benefits. However, according to case study evidence, IPPC can be good for business. Application writing and the preceding assessment of the installation, the thorough review of the environmental impact may reveal areas previously overlooked.
Many companies are motivated by IPPC to optimize water, materials use and energy use.
IPPC also makes companies look at waste generation in detail, and through utilizing opportunities for waste minimization to reduce operating costs, charges for waste or effluent disposal.
IPPC may encourage the introduction of new technologies which frequently bring indirect benefits in terms of production efficiency.
Company costs due to IPPC: a bottom-up estimation Bottom-up methods of RIA cost estimations rely on business surveys. The following calculation is an attempt to estimate the costs of adaptation to IPPC for companies with a bottom-up method.
75
See: “IPPC: cost or benefit?” By Janet Murfin. Power point presentation for the IChemeE Seminar, Hull, March 2005.
Technical Assistance For IPPC “Integrated Pollution Prevention and Control”
NIRAS IC Consortium ~ Regulatory Impact Assessment Report ~ June 2013
Page 40
Method. The basis of the estimation is the Spanish IPPC impact assessment survey of 2009, which collected the responses of 433 installations, 7,6% of the total number of IPPC installations of Spain at that time. 76 The cost parameter collected by the interviewers was the cumulative expenditures attributed to IPPC over the years, 2000 to 2007. Moreover, in this survey the cumulation is to be interpreted across (a) environmental operating costs and (b) once-off costs of pollution abatement investments. Thus the estimate includes the costs of diagnoses, studies, investments made in order to obtain IPPC permit, additional staff costs for processing IPPC the permit application and for fulfilling the requirements stated in the IPPC permit. The algorithm of cost assessment for Turkey consists of multiplying the per-installation adaptation costs calculated in Spain by the number of installations in Turkey, and repeating this for each of thirty two IPPC categories. The number of IPPC installations in Turkey was taken from the inventory of IPPC installations, which has been compiled by the Technical Assistance Component of the IPPC Project in 2012-2013.77 This estimation method relies on a set of assumptions:
The original Spanish cost data are reliable
In Turkey the adaptation costs for an average IPPC installation are comparable to those in Spain
In Turkey the proportion of large installations within „IPPC Annex I categories” is comparable with those in Spain
The above assumptions hold in the majority of the thirty two „IPPC Annex I categories”. However, there are some „IPPC Annex I categories” for which this is not true. The following table demonstrates the most important deficiencies and caveats of the above set of assumptions.
76
"Estudio de las implicaciones económicas de la innovación tecnológica consecuencia de la aplicación de la ley 16/2002". By Inerco. The survey and its results are detailed in Annex 1. of this study. 77
“IPPC Inventory Report” Project Title: Technical Assistance for IPPC Integrated Pollution Prevention and Control. Date: February 2013.
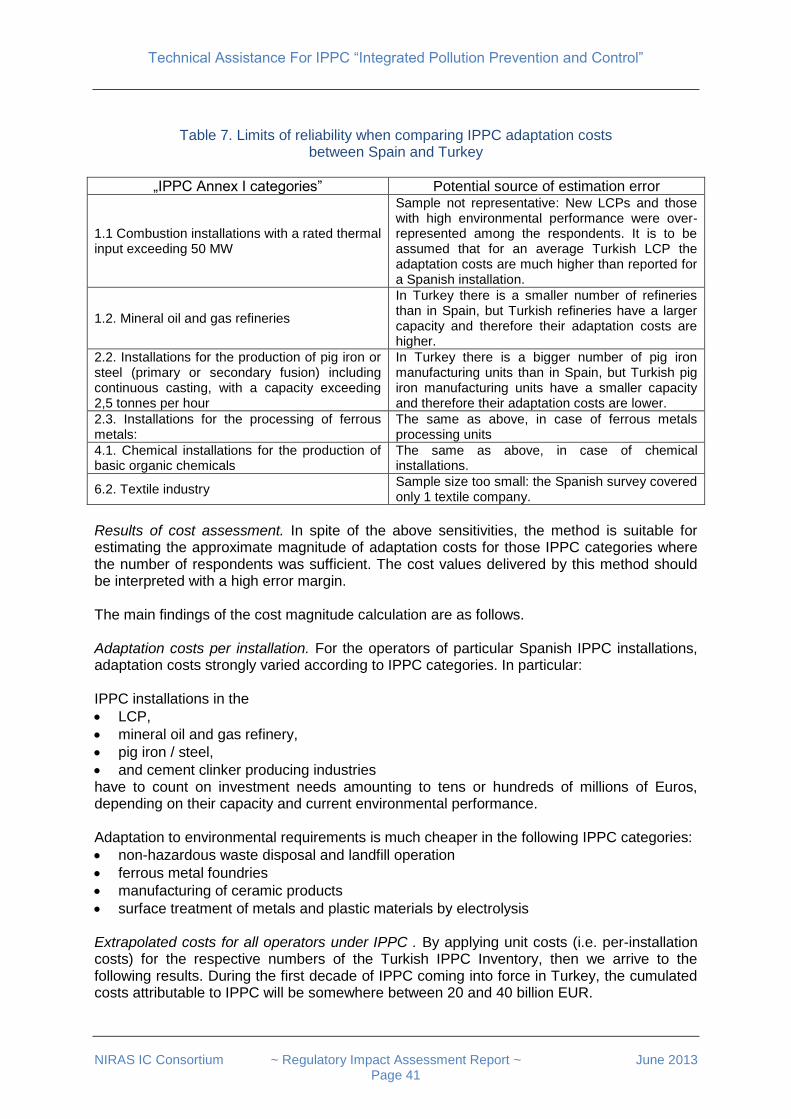
Technical Assistance For IPPC “Integrated Pollution Prevention and Control”
NIRAS IC Consortium ~ Regulatory Impact Assessment Report ~ June 2013
Page 41
Table 7. Limits of reliability when comparing IPPC adaptation costs between Spain and Turkey
„IPPC Annex I categories” Potential source of estimation error
1.1 Combustion installations with a rated thermal input exceeding 50 MW
Sample not representative: New LCPs and those with high environmental performance were over-represented among the respondents. It is to be assumed that for an average Turkish LCP the adaptation costs are much higher than reported for a Spanish installation.
1.2. Mineral oil and gas refineries
In Turkey there is a smaller number of refineries than in Spain, but Turkish refineries have a larger capacity and therefore their adaptation costs are higher.
2.2. Installations for the production of pig iron or steel (primary or secondary fusion) including continuous casting, with a capacity exceeding 2,5 tonnes per hour
In Turkey there is a bigger number of pig iron manufacturing units than in Spain, but Turkish pig iron manufacturing units have a smaller capacity and therefore their adaptation costs are lower.
2.3. Installations for the processing of ferrous metals:
The same as above, in case of ferrous metals processing units
4.1. Chemical installations for the production of basic organic chemicals
The same as above, in case of chemical installations.
6.2. Textile industry Sample size too small: the Spanish survey covered only 1 textile company.
Results of cost assessment. In spite of the above sensitivities, the method is suitable for estimating the approximate magnitude of adaptation costs for those IPPC categories where the number of respondents was sufficient. The cost values delivered by this method should be interpreted with a high error margin. The main findings of the cost magnitude calculation are as follows. Adaptation costs per installation. For the operators of particular Spanish IPPC installations, adaptation costs strongly varied according to IPPC categories. In particular: IPPC installations in the
LCP,
mineral oil and gas refinery,
pig iron / steel,
and cement clinker producing industries have to count on investment needs amounting to tens or hundreds of millions of Euros, depending on their capacity and current environmental performance. Adaptation to environmental requirements is much cheaper in the following IPPC categories:
non-hazardous waste disposal and landfill operation
ferrous metal foundries
manufacturing of ceramic products
surface treatment of metals and plastic materials by electrolysis Extrapolated costs for all operators under IPPC . By applying unit costs (i.e. per-installation costs) for the respective numbers of the Turkish IPPC Inventory, then we arrive to the following results. During the first decade of IPPC coming into force in Turkey, the cumulated costs attributable to IPPC will be somewhere between 20 and 40 billion EUR.
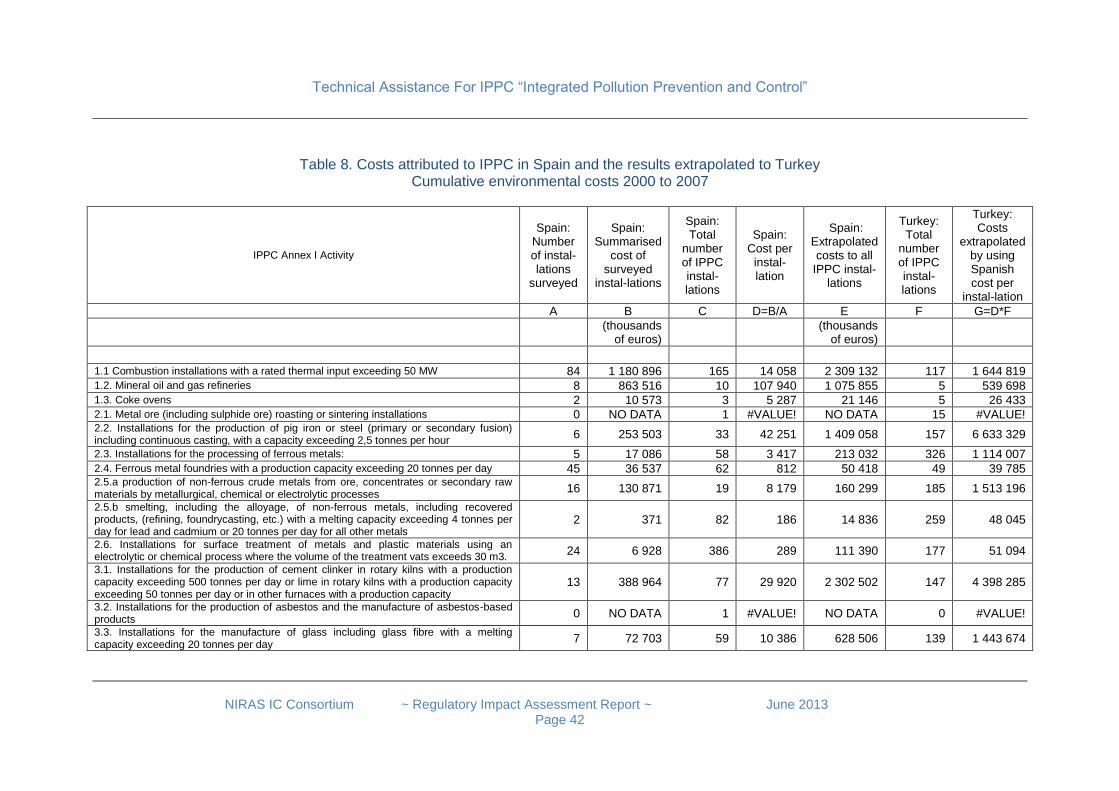
Technical Assistance For IPPC “Integrated Pollution Prevention and Control”
NIRAS IC Consortium ~ Regulatory Impact Assessment Report ~ June 2013
Page 42
Table 8. Costs attributed to IPPC in Spain and the results extrapolated to Turkey Cumulative environmental costs 2000 to 2007
IPPC Annex I Activity
Spain: Number of instal-lations
surveyed
Spain: Summarised
cost of surveyed
instal-lations
Spain: Total
number of IPPC instal-lations
Spain: Cost per
instal-lation
Spain: Extrapolated costs to all
IPPC instal-lations
Turkey: Total
number of IPPC instal-lations
Turkey: Costs
extrapolated by using Spanish cost per
instal-lation A B C D=B/A E F G=D*F
(thousands
of euros)
(thousands of euros)
1.1 Combustion installations with a rated thermal input exceeding 50 MW 84 1 180 896 165 14 058 2 309 132 117 1 644 819 1.2. Mineral oil and gas refineries 8 863 516 10 107 940 1 075 855 5 539 698 1.3. Coke ovens 2 10 573 3 5 287 21 146 5 26 433 2.1. Metal ore (including sulphide ore) roasting or sintering installations 0 NO DATA 1 #VALUE! NO DATA 15 #VALUE! 2.2. Installations for the production of pig iron or steel (primary or secondary fusion) including continuous casting, with a capacity exceeding 2,5 tonnes per hour
6 253 503 33 42 251 1 409 058 157 6 633 329
2.3. Installations for the processing of ferrous metals: 5 17 086 58 3 417 213 032 326 1 114 007 2.4. Ferrous metal foundries with a production capacity exceeding 20 tonnes per day 45 36 537 62 812 50 418 49 39 785 2.5.a production of non-ferrous crude metals from ore, concentrates or secondary raw materials by metallurgical, chemical or electrolytic processes
16 130 871 19 8 179 160 299 185 1 513 196
2.5.b smelting, including the alloyage, of non-ferrous metals, including recovered products, (refining, foundrycasting, etc.) with a melting capacity exceeding 4 tonnes per day for lead and cadmium or 20 tonnes per day for all other metals
2 371 82 186 14 836 259 48 045
2.6. Installations for surface treatment of metals and plastic materials using an electrolytic or chemical process where the volume of the treatment vats exceeds 30 m3.
24 6 928 386 289 111 390 177 51 094
3.1. Installations for the production of cement clinker in rotary kilns with a production capacity exceeding 500 tonnes per day or lime in rotary kilns with a production capacity exceeding 50 tonnes per day or in other furnaces with a production capacity
13 388 964 77 29 920 2 302 502 147 4 398 285
3.2. Installations for the production of asbestos and the manufacture of asbestos-based products
0 NO DATA 1 #VALUE! NO DATA 0 #VALUE!
3.3. Installations for the manufacture of glass including glass fibre with a melting capacity exceeding 20 tonnes per day
7 72 703 59 10 386 628 506 139 1 443 674
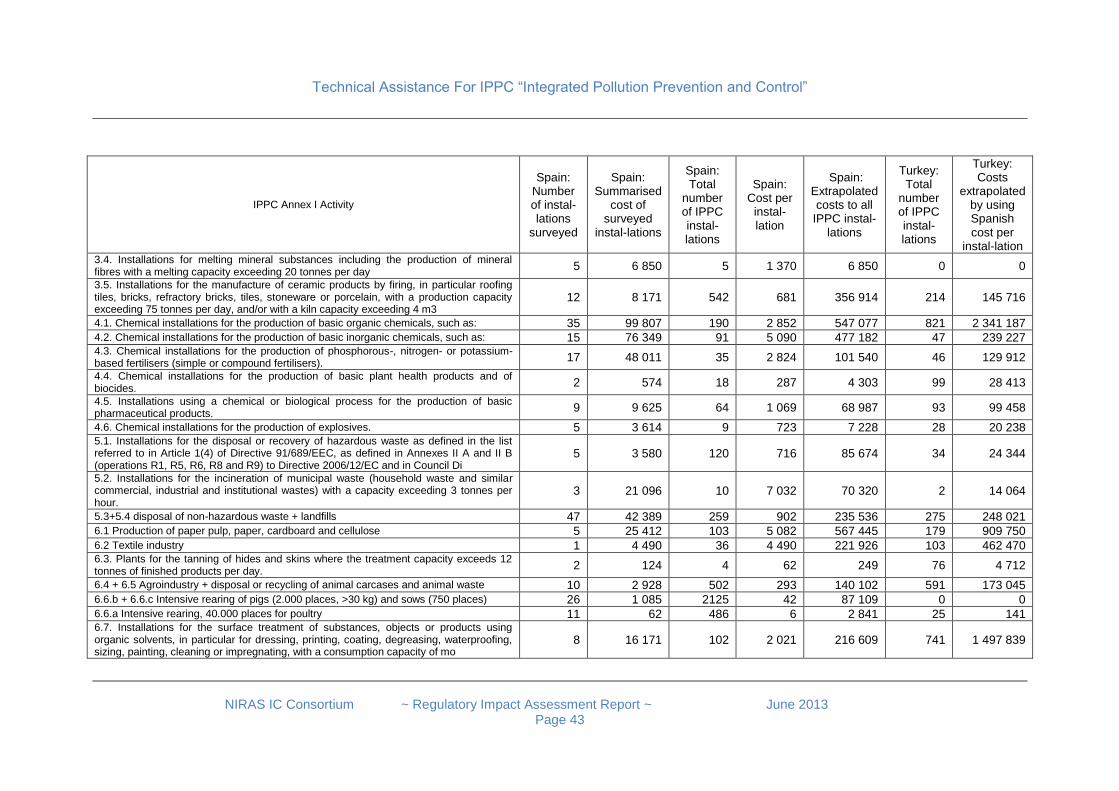
Technical Assistance For IPPC “Integrated Pollution Prevention and Control”
NIRAS IC Consortium ~ Regulatory Impact Assessment Report ~ June 2013
Page 43
IPPC Annex I Activity
Spain: Number of instal-lations
surveyed
Spain: Summarised
cost of surveyed
instal-lations
Spain: Total
number of IPPC instal-lations
Spain: Cost per
instal-lation
Spain: Extrapolated costs to all
IPPC instal-lations
Turkey: Total
number of IPPC instal-lations
Turkey: Costs
extrapolated by using Spanish cost per
instal-lation 3.4. Installations for melting mineral substances including the production of mineral fibres with a melting capacity exceeding 20 tonnes per day
5 6 850 5 1 370 6 850 0 0
3.5. Installations for the manufacture of ceramic products by firing, in particular roofing tiles, bricks, refractory bricks, tiles, stoneware or porcelain, with a production capacity exceeding 75 tonnes per day, and/or with a kiln capacity exceeding 4 m3
12 8 171 542 681 356 914 214 145 716
4.1. Chemical installations for the production of basic organic chemicals, such as: 35 99 807 190 2 852 547 077 821 2 341 187 4.2. Chemical installations for the production of basic inorganic chemicals, such as: 15 76 349 91 5 090 477 182 47 239 227 4.3. Chemical installations for the production of phosphorous-, nitrogen- or potassium-based fertilisers (simple or compound fertilisers).
17 48 011 35 2 824 101 540 46 129 912
4.4. Chemical installations for the production of basic plant health products and of biocides.
2 574 18 287 4 303 99 28 413
4.5. Installations using a chemical or biological process for the production of basic pharmaceutical products.
9 9 625 64 1 069 68 987 93 99 458
4.6. Chemical installations for the production of explosives. 5 3 614 9 723 7 228 28 20 238 5.1. Installations for the disposal or recovery of hazardous waste as defined in the list referred to in Article 1(4) of Directive 91/689/EEC, as defined in Annexes II A and II B (operations R1, R5, R6, R8 and R9) to Directive 2006/12/EC and in Council Di
5 3 580 120 716 85 674 34 24 344
5.2. Installations for the incineration of municipal waste (household waste and similar commercial, industrial and institutional wastes) with a capacity exceeding 3 tonnes per hour.
3 21 096 10 7 032 70 320 2 14 064
5.3+5.4 disposal of non-hazardous waste + landfills 47 42 389 259 902 235 536 275 248 021 6.1 Production of paper pulp, paper, cardboard and cellulose 5 25 412 103 5 082 567 445 179 909 750 6.2 Textile industry 1 4 490 36 4 490 221 926 103 462 470 6.3. Plants for the tanning of hides and skins where the treatment capacity exceeds 12 tonnes of finished products per day.
2 124 4 62 249 76 4 712
6.4 + 6.5 Agroindustry + disposal or recycling of animal carcases and animal waste 10 2 928 502 293 140 102 591 173 045 6.6.b + 6.6.c Intensive rearing of pigs (2.000 places, >30 kg) and sows (750 places) 26 1 085 2125 42 87 109 0 0 6.6.a Intensive rearing, 40.000 places for poultry 11 62 486 6 2 841 25 141 6.7. Installations for the surface treatment of substances, objects or products using organic solvents, in particular for dressing, printing, coating, degreasing, waterproofing, sizing, painting, cleaning or impregnating, with a consumption capacity of mo
8 16 171 102 2 021 216 609 741 1 497 839

Technical Assistance For IPPC “Integrated Pollution Prevention and Control”
NIRAS IC Consortium ~ Regulatory Impact Assessment Report ~ June 2013
Page 44
IPPC Annex I Activity
Spain: Number of instal-lations
surveyed
Spain: Summarised
cost of surveyed
instal-lations
Spain: Total
number of IPPC instal-lations
Spain: Cost per
instal-lation
Spain: Extrapolated costs to all
IPPC instal-lations
Turkey: Total
number of IPPC instal-lations
Turkey: Costs
extrapolated by using Spanish cost per
instal-lation 6.8. Installations for the production of carbon (hard-burnt coal) or electrographite by means of incineration or graphitisation.
3 4 585 3 1 528 4 585 0 0
TOTAL 433 3 336 873 5660 7 706 11 498 651 4955 38 185 233
Technical Assistance For IPPC “Integrated Pollution Prevention and Control”
NIRAS IC Consortium ~ Regulatory Impact Assessment Report ~ June 2013
Page 45
Costs due to IPPC: comparison of bottom-up and top-down estimation The macro-economical chapters of this RIA contain model calculations about adaptation costs. The results are comparable with those of the bottom-up approach. The total costs of adaptation to IPPC / IED, include capital expenditures and operating costs over the period of 2012-2025. This amount is estimated to be approximately 46 Billion EUR, approximately €630 per capita. This is in the range that has been observed in the approximation processes of other transition economies. The implementation of the IED amounts to approximately half of the total costs of adopting the Acquis in Turkey. Some details of the econometric results on IPPC / IED adaptation are as follows:
Air pollution. The top-down calculations on satisfying air emission requirements of IPPC / IED were based on the costs of removing a set of the most relevant polluting substances. The results of these econometric calculation of costs to industry have confirmed that the total costs of adapting the economy of Turkey to these requirements between 2013 and 2025 will be approximately 25 billion EUR, out of which the energy sector will incur 18 billion EUR, and the cement sector approximately 1,5 billion EUR. Three-quarters of the total cost is devoted to capital expenditures, and one-quarter to operating expenditures.
Emissions to Water. Modelling results indicate that the cost of treating effluents in the period 2013-2025 will be approximately 1,5 billion EUR. Four-fifths of this amount is devoted to capital expenditures, and one-fifth to operating expenditures.
Solid Waste Management. The model calculation applied benchmarks observed in other transition economies to extrapolated data of population and number of landfills to be permitted. The total cost, in the period 2013-2027 is forecasted as approximately 20 billion EUR. Approximately one-third of this amount is devoted to capital expenditures, and two-thirds to operating expenditures.
Benefits. The introduction of IPPC/IED will have a considerable positive impact due to avoiding certain damages to health, the ecosystem, to the society and to the environment protection sector of the economy. By far the most benefits will arise due to reduced air pollution, followed by improved waste management and reduced water pollution.

Technical Assistance For IPPC “Integrated Pollution Prevention and Control”
NIRAS IC Consortium ~ Regulatory Impact Assessment Report ~ June 2013
Page 46
IPPC/IED in Five Selected Industrial Sectors of Turkey
The Energy Industry The energy industry and in particular, Large Combustion Plants can be regarded as the major target group for industrial air pollution prevention, both in terms of damage caused and expected compliance costs. Fuel combustion for electricity generating purposes is responsible for emitting almost two-thirds of SO2 and about one third of NOx.78 Since many LCPs are publicly owned, it can be argued that the public are the ultimate polluters in this case as users of electricity. The public however does face increased electricity prices in the future in order for LCPs to comply with the IED. The structure of the affected stakeholder groups is as follows. Key players of the electricity market. Companies. In 2010 the state-owned generation company EUAS (Electricity Generation Co.Inc.) owned c.a. 54 percent of the
total installed capacity. The rest of electricity generation capacity was owned by a wide range of private companies. Besides EUAS (electricity generation) the other main players in the electricity market are TETAS (Türkiye Elektrik Ticaret ve Taahhüt A.Ş., electricity wholesale), TEIAS (Turkish Electricity Transmission Company, transmission). Electricity distribution is under an ongoing privatisation process: there are 21 distribution regions under Turkish privatization portfolio, out of which by 2010 in 8 regions the respective Distribution Companies were privatised. 79
Associations. The major professional associations of the electricity industry are the Turkish Electricity Producers Union and the Turkish Electricity Industry Association.
Authorities. The Energy Market Regulatory Authority (EPDK) is responsible for licensing new energy projects, including renewables. This authority is subordinated to the Ministry of Energy and Natural Resources of the Republic of Turkey.
78
For more details see Appendix 1: the RIA of NECD in Turkey. 79
Turkish Energy Industry Report 2010. Republic of Turkey Prime Ministry , Investment Support and Promotion Agency of Turkey. With the co-operation of Deloitte.
Technical Assistance For IPPC “Integrated Pollution Prevention and Control”
NIRAS IC Consortium ~ Regulatory Impact Assessment Report ~ June 2013
Page 47
LCPs in Turkey. The overview of the LCP sector in Turkey has been described in detail in the BAT Guide80 for coal and lignite fired LCPs which has been prepared on behalf of the Ministry of Environment and Urbanism of Turkey. The BAT Guide is based on the 2010 Annual Report of EÜAŞ, which is the institution responsible for the operation of the publicly owned power plants and electricity production.81 Lignite fueled plants. Turkey operates 37 lignite fueled LCPs, this includes both public and privately owned plants. 34 of these lignite fuelled LCPS have a capacity larger than 300 MW, with 32 installations using the pulverised solid fuel combustion (PSFC) technology.
80
BAT Guide for coal and lignite large combustion plants. Document prepared in June 2012 by the IPPC Twinning Project for Turkey on behalf of the MoEU of Turkey. (Eşleştirme Projesi TR 08 IB EN 03IPPC – Entegre Kirlilik Önleme ve KontrolT.C. Çevre ve Şehircilik Bakanlığı) Project TR-2008-IB-EN-03, Mission no: 2.1.4.a.3 81
At the writing of this Report a more recent Report of EÜAS is also available in Turkish language: “Elektrik Üretim Sektör Raporu 2012.”
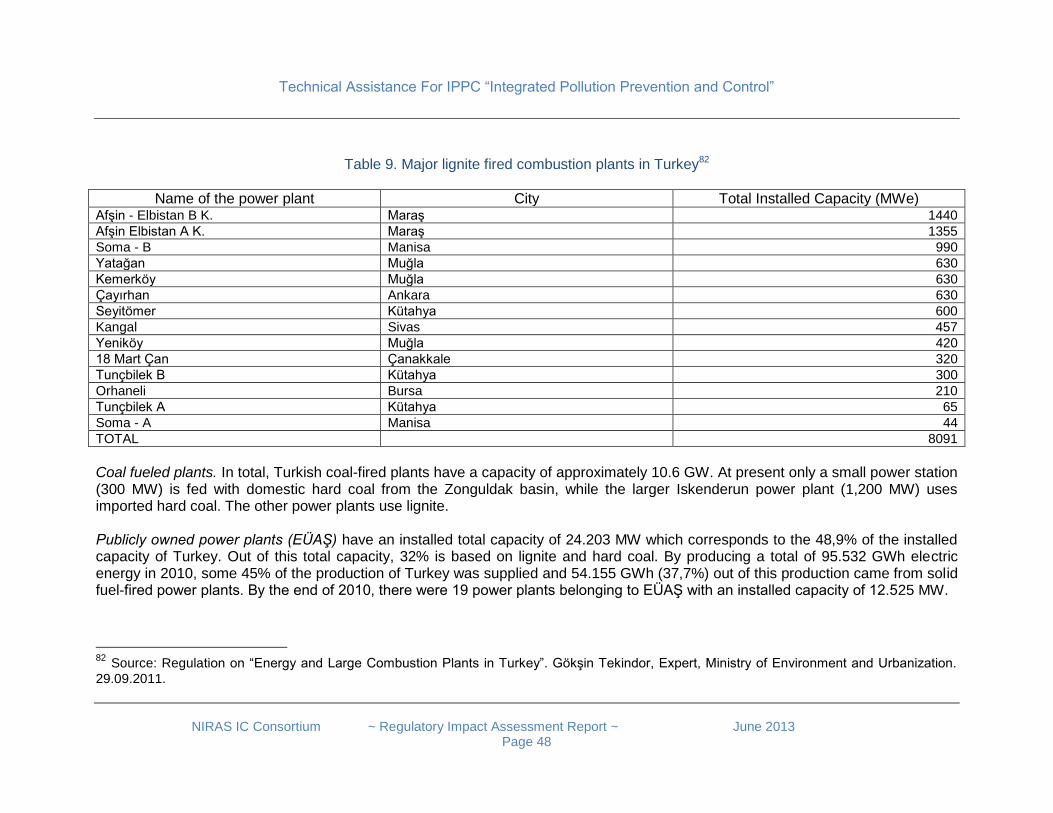
Technical Assistance For IPPC “Integrated Pollution Prevention and Control”
NIRAS IC Consortium ~ Regulatory Impact Assessment Report ~ June 2013
Page 48
Table 9. Major lignite fired combustion plants in Turkey82
Name of the power plant City Total Installed Capacity (MWe) Afşin - Elbistan B K. Maraş 1440
Afşin Elbistan A K. Maraş 1355
Soma - B Manisa 990
Yatağan Muğla 630
Kemerköy Muğla 630
Çayırhan Ankara 630
Seyitömer Kütahya 600
Kangal Sivas 457
Yeniköy Muğla 420
18 Mart Çan Çanakkale 320
Tunçbilek B Kütahya 300
Orhaneli Bursa 210
Tunçbilek A Kütahya 65
Soma - A Manisa 44
TOTAL 8091
Coal fueled plants. In total, Turkish coal-fired plants have a capacity of approximately 10.6 GW. At present only a small power station (300 MW) is fed with domestic hard coal from the Zonguldak basin, while the larger Iskenderun power plant (1,200 MW) uses imported hard coal. The other power plants use lignite. Publicly owned power plants (EÜAŞ) have an installed total capacity of 24.203 MW which corresponds to the 48,9% of the installed capacity of Turkey. Out of this total capacity, 32% is based on lignite and hard coal. By producing a total of 95.532 GWh electric energy in 2010, some 45% of the production of Turkey was supplied and 54.155 GWh (37,7%) out of this production came from solid fuel-fired power plants. By the end of 2010, there were 19 power plants belonging to EÜAŞ with an installed capacity of 12.525 MW.
82 Source: Regulation on “Energy and Large Combustion Plants in Turkey”. Gökşin Tekindor, Expert, Ministry of Environment and Urbanization.
29.09.2011.
Technical Assistance For IPPC “Integrated Pollution Prevention and Control”
NIRAS IC Consortium ~ Regulatory Impact Assessment Report ~ June 2013
Page 49
Sources of coal and lignite. Solid-fueled power plants in Turkey feed partially on national lignite and hard coal resources, and partly on imported hard coal.
Locally mined solid fuels.. The Turkish coal sector produces both hard coal (2.8 million tonnes in 2010) and lignite (69.0 million tonnes), mainly used for power generation. TKİ (Turkish Coal Enterprises) is a state economic enterprise which serves as a supplier to a total of 12 power plants which are in the ownership of EÜAŞ and its subsidiaries. . Lignite is mined mostly by the state-owned Turkish Coal Works (TKI) in various parts of the country, which controls mining in Afsin-Elbistan located in Southeast Anatolia, where most lignite coal is produced. Hard coal is mainly mined by the Turkish Hard Coal Enterprises (TTK) in Zonguldak in the western Black Sea region.
Imported solid fuels. Turkey imported 26.9 million tonnes of hard coal for thermal power plants, steel production, industry and domestic heating purposes. Half of coal consumption in Turkey is imported; TKI also has the monopoly over coal imports. 83
Environmental challenges of LCPs. The main environmental impacts generated by large combustion plants are emissions to air, water consumption, discharge of wastewater and waste management.
Air. Regarding emissions to air, these are derived from the combustion process and are different depending on the fuel used. If coal used as fuel, the main pollutants are fine particles, sulfur dioxide, nitrogen oxides and carbon dioxide.
Water is used in large quantities by LCPs, mainly in the cooling process, so the polluting effect of the discharge is the potential increase in temperature of the receiving medium. A large amount of wastewater, carrying large amounts of suspended matter, is generated by water leaking from coal stockpiles.
Waste. Coal power plants generate substantial amounts of waste, mainly slag and ash.
83
Turkish Energy Industry Report 2010. Republic of Turkey Prime Ministry , Investment Support and Promotion Agency of Turkey. With the co-operation of Deloitte.
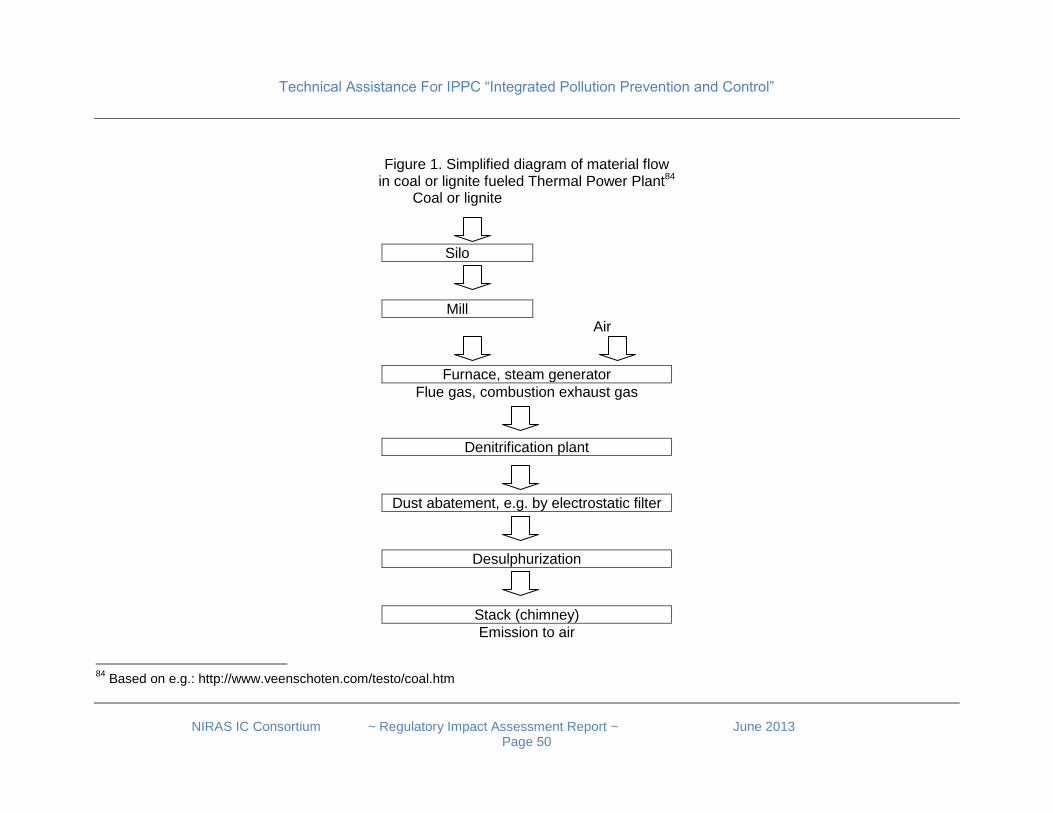
Technical Assistance For IPPC “Integrated Pollution Prevention and Control”
NIRAS IC Consortium ~ Regulatory Impact Assessment Report ~ June 2013
Page 50
Figure 1. Simplified diagram of material flow in coal or lignite fueled Thermal Power Plant84
Coal or lignite
Silo
Mill
Air
Furnace, steam generator
Flue gas, combustion exhaust gas
Denitrification plant
Dust abatement, e.g. by electrostatic filter
Desulphurization
Stack (chimney)
Emission to air
84
Based on e.g.: http://www.veenschoten.com/testo/coal.htm
Technical Assistance For IPPC “Integrated Pollution Prevention and Control”
NIRAS IC Consortium ~ Regulatory Impact Assessment Report ~ June 2013
Page 51
A relatively recent study85 has estimated the major gaseous emissions86 generated by 17 lignite fueled plants of Turkey. These are installed near the regions where the lignite is mined. The study found that emission rates and specific emissions (per MWh) of pollutants depends on whether or not the particular plant has electrostatic precipitators and flue -gas desulphurisation systems. Environment protection legislation for LCPs. The emission limit values that the power plants are obliged to fulfill in Turkey are indicated in the By-law on Large Combustion Plants87. In 2010 the Turkish Regulation88 on “Large Combustion Plants” took effect as a transposition of LCP Directive (2001/80/EC). The regulation sets limits on emissions for PM, SO2, CO and NOx arising from combustion plants. New plants must comply with the ceilings laid down in the Regulation as soon as they come into operation, whereas a 9 - year transition period has been set for the existing plants. As of 08.06.2019, ceilings laid down in the regulation will become effective. Specific air pollution regulation. There are also some provisions in relation to power plants in the By-law on Industrial Based Air Pollution Control89., including the principles and procedures concerning the monitoring, validation and reporting of greenhouse gas emissions from the relevant installations. The list of GHG emitting installations is published in Annex 1 of the By-law on Monitoring of the Greenhouse Gas Emissions90. Energy efficiency. In 2005 the Government accepted an Energy Efficiency Strategy Paper.91 In 2007-2008 an Energy Efficiency Law together with its secondary legislation was put into force and an inter-ministerial EE Coordination Board (EECB) was created which oversees and monitors the energy consumption of industrial installations, public facilities and residential buildings as well.
85
Emissions estimation for lignite-fired power plants in Turkey. by: Nurten Vardar, Zehra Yumurtaci. Energy Policy (08 October 2009). 86
E.g. sulfur dioxides, nitrogen oxides, carbon dioxide, and carbon monoxide, some various organic emissions (e.g. benzene, toluene and xylenes) and some trace metals (e.g. arsenic, cobalt, chromium, manganese and nickel) 87
Official Gazette numbered 27605 and dated 08/06/2010 88
Official Gazette: 08 June 2010, no 27605. 89
Official Gazette numbered 27277 and dated 03/07/2009 90
Official Gazette numbered 28274 and dated 25/04/2012 91 Energy efficiency policies and programs in Turkey. Erdal Çalikoğlu, Deputy General Director of General Directorate of Electrical Power
Resources, Survey and Development Administration.
Technical Assistance For IPPC “Integrated Pollution Prevention and Control”
NIRAS IC Consortium ~ Regulatory Impact Assessment Report ~ June 2013
Page 52
Pollution abatement technologies for LCPs in any country. A comprehensive description of the Best Available Technologies is given in the BREF for Large Combustion Plants92. In this report only the major and most costly technologies will be briefly mentioned. In case of thermal combustion plants, the major technologies of controlling emissions are as follows:93
Dust. The major technologies of dust collection are (a) Gravitational, Inertial & Centrifugal Dust Collectors (e.g. by rotational settling of dust) (b) Scrubbing Dust Collectors (e.g. by spraying water on dust) (c) Filter Type Dust Separator (e.g. by bag filter) (d) Electrostatic Precipitator (e.g. by collecting dust on electrodes)
Sulphur. The major technologies of Flue Gas Desulphurization (FGD) are (a) Wet type desulphurization (e.g. with limestone as adsorbent) (b) Dry type desulphurization (with activated carbon as adsorbent)
NOx. The major technologies of Flue Gas Denitrification, NOx Abatement are (a) Flue gas recirculation (b) Installing Low NOx burners (c) Installing staged burners (d) Selective catalytic reduction (e.g. by using ammonia as the reducing agent) (e) Selective non-catalytic reduction (e.g. by using urea to decompose NOx into molecular nitrogen, carbon dioxide and water).
Pollution abatement strategies recommended for Turkish LCPs. The RIA of NECD for Turkey94 has recommended a wide range of pollution reduction measures and energy efficiency measures for LCPs through the application of Best Available Techniques. This included the following technological and investment decisions:
For natural gas fired power plants:
o the installation of low-NOx, pre-mix burners.
For hard-coal fired power plants:
o Fluid gas desulphurization techniques (FGD) to remove 90% of SO2 combustion emissions
o Low-NOx burners and staged-air supply;
For exclusively fuel-oil fired power plants95:
o the use of fuel oil having a sulphur content of less than 1.0%.
92
Integrated Pollution Prevention and Control. Reference Document on Best Available Techniques for Large Combustion Plants. July 2006. 93
Source: Air Pollution Control Technology in Thermal Power Plants. Overseas Environmental Cooperation Center, Japan. With Ministry of Environment, Japan. March 2005. 94
For more detail see Appendix 1. 95
Selective Catalytic Reduction (SCR) for of NOx emissions abatement was not recommended because its costs exceeded its likely benefits.
Technical Assistance For IPPC “Integrated Pollution Prevention and Control”
NIRAS IC Consortium ~ Regulatory Impact Assessment Report ~ June 2013
Page 53
Cost assessment. Cumulated pollution abatement costs for the Turkish electricity sector for the period 2010 to 2025 is estimated to be somewhat over €18 billion at year 2010 prices. Estimated annual expenditures amount to 0,1% - 0,2% of GDP.96 Cost considerations. Retrofitting LCPs in Turkey to meet the requirements of IPPC/IED will cost clearly much more than the costs associated with upgrading any other sector. These costs depend strongly on the applied fuel, on the existing technological level of the installation and on many other factors. International experience shows that the costs range from zero to hundreds of millions of Euros per installation. Turkey needs to implement a case-by-case, plant-by-plant assessment of the investment needs. International experiences on costs can be obtained for particular technologies and from case studies of particular plants.
The BREF for LCPs 97 includes cost estimations for a wide variety of the recommended technologies, calculated at the level of individual companies. These cost items can be used as benchmarks and applied for installations of similar capacity and technology.
Two Polish LCPs have been extended by a Gas-Steam Unit costing respectively 142 million EUR and 88 million EUR98. The investment reduced SO2 emission by more than 80%, and NOx, CO2 and dust emission (each of them) by half.
A case study in Hungary on upgrading LCPs. 99 Budapest Power Plant is the biggest power generating company in Budapest, and at the same time the biggest cogeneration company in Hungary. It owned by EDF (France) and operates 3 plants. The impacts of enforcement of IPPC in Hungary were not substantial for the company. The start of enforcement of IPPC in Hungary for old companies (2007) coincided with the privatisation of the company which triggered a large re-structuring. The improvement of environmental performance was no more than a positive side-effect of this re-structuring. Originally Budapest Power Plant had 6 installations in Budapest100 generating electric energy. As part of the re-structuring of these 6 plants, 3 plants had to be closed or have the activity restricted to district heat generation101. The investments of 2007 have brought benefits in terms of efficiency, safety and improved company image. However, those decisions were based on efficiency considerations and the closures cannot be attributed to the high cost of renewing the environmental permits.
96
For more details see Appendix 1: the RIA of NECD in Turkey. 97
.”Integrated Pollution Prevention and Control Reference Document on Best Available Techniques for Large Combustion Plants”. European Commission, July 2006 98
For more detail se Appendix 2. 99
Interview with Mr. Balázs Major , Environmental Manager , Budapest Power Plant (Budapesti Erömü ZRt.). Date of conversation: 5. April 2013 100
Ujpest, Kispest, Kelenföld, Angyalföld, Köbánya, Révész utca 101
The last 3 installations in the list.
Technical Assistance For IPPC “Integrated Pollution Prevention and Control”
NIRAS IC Consortium ~ Regulatory Impact Assessment Report ~ June 2013
Page 54
BAT considerations. The remaining 3 plants102 have been upgraded in 2007 according to efficiency considerations, in the framework of an investment project, i.e. not due to environmental reasons. The resulting contemporary technologies satisfy BAT requirements of the sector and since then no additional investment was needed. As of now, the biggest environmental challenge lies in keeping NOx emissions under limits, as these limits have been reduced recently due to the imminent introduction of IED to Hungary.
Administrative considerations. Originally the applications for environmental permits were prepared by external consultants, based on data provided by Budapest Power Plant experts. However in recent years, the environmental manager of the company prepares the whole application.
The above considerations applied for compliance with IPPC. However, at the time of writing this report, Hungary is preparing for the introduction of IED. For Budapest Power Plant,103the environmental authorities have specified in deep technical detail all investment measures that the company must take in order to meet the new requirements. The deadline for compliance is 1 January 2016 and the authority issued schedule of further emission reduction which is binding for the affected LCPs .104
The Cement Industry Cement production is a sub-sector of the of the building materials industry sector. Turkey is a major producer of basic construction materials such as cement, building steel, timber, bricks, PVC, polyethylene, glass, ceramic tiles and sanitary ware. Turkey is especially strong and competitive in producing construction steel, cement, ceramic and glass products. 105 Cement is produced by 66 companies in Turkey, out of which 62 are members of the Turkish Cement Manufacturers’ Association. 48 cement plants are so-called integrated units which produce clinker, and fall under IPPC. The remaining 14 plants are performing only the grinding of purchased clinker and do not fall under IPPC.106
102
The first 3 installations in the list. 103
There were altogether 16 plants involved in Hungary, which included the three installations of Budapest Power Plant. 104
For more detail of this IED-motivated LCP retrofitting programme see Annex 2. 105 Building Materials Industry in Turkey. Published by the Ministry of Economy. Ankara 2012. 106
Information obtained from the Turkish Cement Manufacturers’ Association.
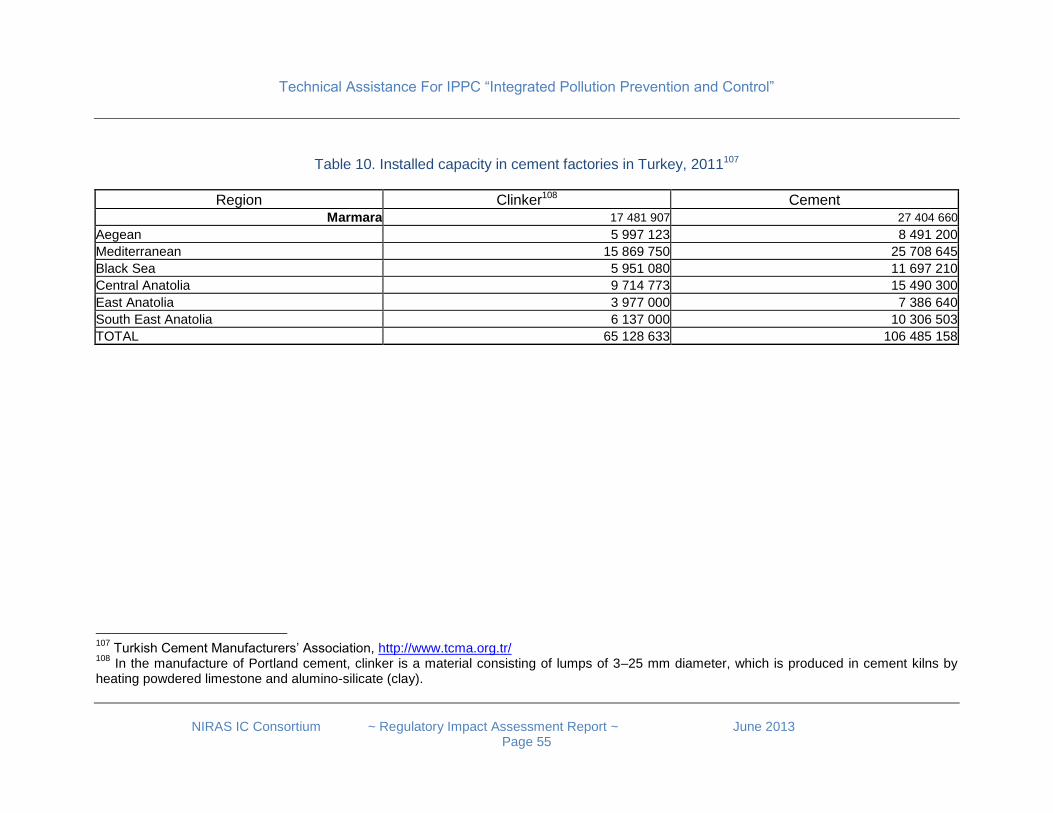
Technical Assistance For IPPC “Integrated Pollution Prevention and Control”
NIRAS IC Consortium ~ Regulatory Impact Assessment Report ~ June 2013
Page 55
Table 10. Installed capacity in cement factories in Turkey, 2011107
Region Clinker108 Cement Marmara 17 481 907 27 404 660
Aegean 5 997 123 8 491 200
Mediterranean 15 869 750 25 708 645
Black Sea 5 951 080 11 697 210
Central Anatolia 9 714 773 15 490 300
East Anatolia 3 977 000 7 386 640
South East Anatolia 6 137 000 10 306 503
TOTAL 65 128 633 106 485 158
107
Turkish Cement Manufacturers’ Association, http://www.tcma.org.tr/ 108
In the manufacture of Portland cement, clinker is a material consisting of lumps of 3–25 mm diameter, which is produced in cement kilns by heating powdered limestone and alumino-silicate (clay).
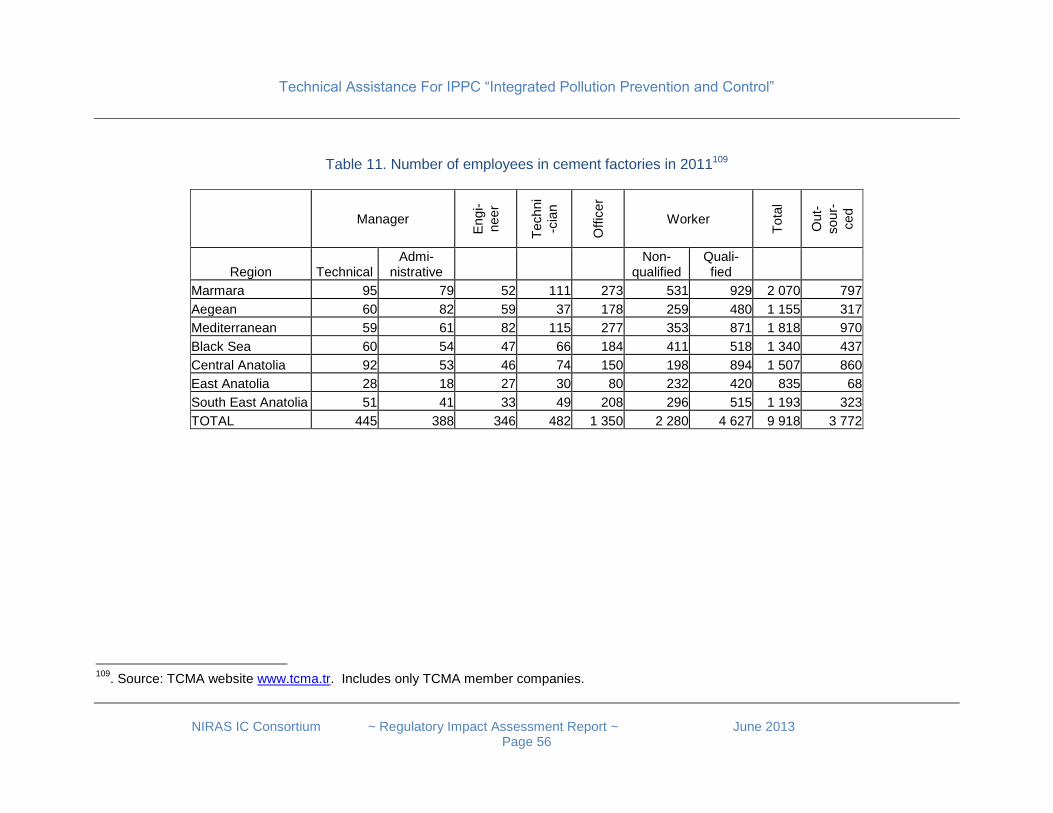
Technical Assistance For IPPC “Integrated Pollution Prevention and Control”
NIRAS IC Consortium ~ Regulatory Impact Assessment Report ~ June 2013
Page 56
Table 11. Number of employees in cement factories in 2011109
Manager
Eng
i-
neer
Techni
-cia
n
Offic
er
Worker
Tota
l
Out-
sour-
ced
Region Technical Admi-
nistrative Non-
qualified Quali- fied
Marmara 95 79 52 111 273 531 929 2 070 797
Aegean 60 82 59 37 178 259 480 1 155 317
Mediterranean 59 61 82 115 277 353 871 1 818 970
Black Sea 60 54 47 66 184 411 518 1 340 437
Central Anatolia 92 53 46 74 150 198 894 1 507 860
East Anatolia 28 18 27 30 80 232 420 835 68
South East Anatolia 51 41 33 49 208 296 515 1 193 323
TOTAL 445 388 346 482 1 350 2 280 4 627 9 918 3 772
109
. Source: TCMA website www.tcma.tr. Includes only TCMA member companies.
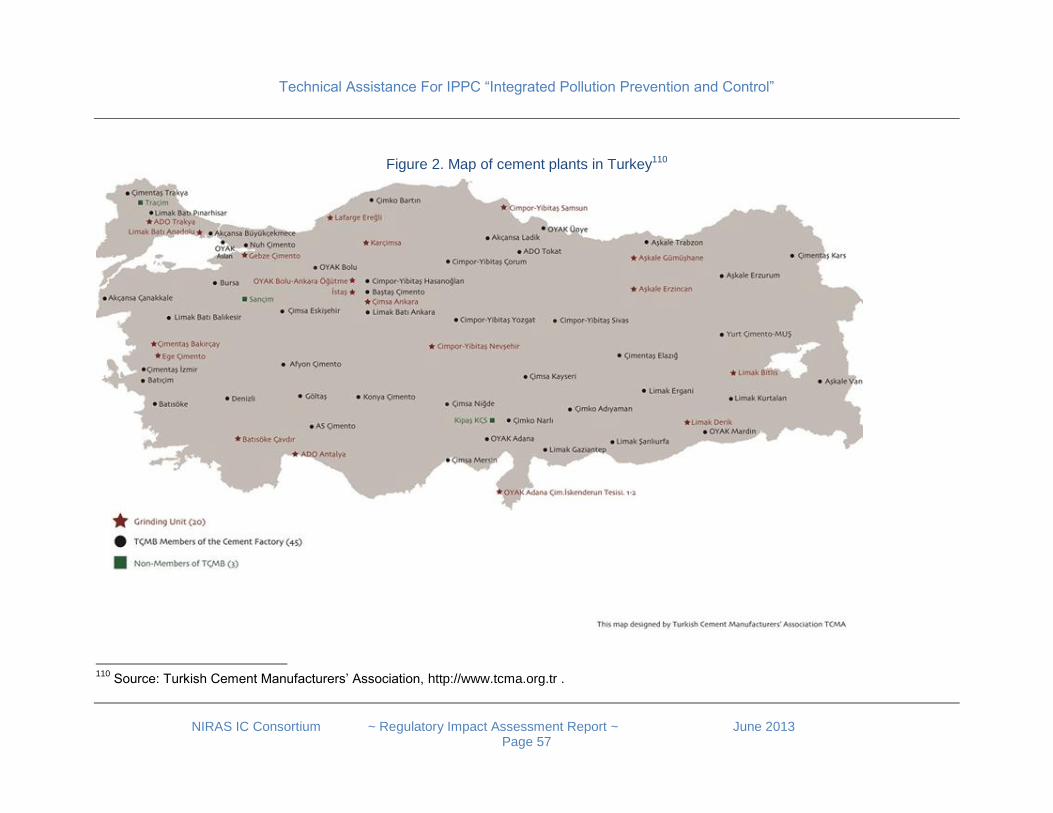
Technical Assistance For IPPC “Integrated Pollution Prevention and Control”
NIRAS IC Consortium ~ Regulatory Impact Assessment Report ~ June 2013
Page 57
Figure 2. Map of cement plants in Turkey110
110
Source: Turkish Cement Manufacturers’ Association, http://www.tcma.org.tr .

Technical Assistance For IPPC “Integrated Pollution Prevention and Control”
NIRAS IC Consortium ~ Regulatory Impact Assessment Report ~ June 2013
Page 58
Cement export. In 2010 Turkey’s export of cement ranked first in the world and Turkish cement industry reached an annual production of 62.7 million tons. The Turkish cement industry provides employment for more than 15 thousand employees. In 2011 the value of cement export was 914 Million USD. The major markets for Turkish cement exports were Iraq (25%), Syria (14%), Russia (6%), Israel (5%) and Brazil (4%). Stakeholders. The major professional organisation is the Turkish Cement Manufacturers’ Association111. A full list of member plants is to be found on the website of TCMA.112 Technology. A typical process of cement manufacture consists of three stages: (a) grinding a mixture of limestone and clay or shale to make a fine "rawmix" (b) heating the rawmix up to 1450 °C in a cement kiln (energy use accounts for up to 40% of production costs) (c) grinding the resulting clinker in a Cement mill to make cement.
Figure 3. Simplified flow chart of cement production113
Limestone Clay
Blending Dust
Kiln Exhaust gases, dust
Clinker store
Cement mill Dust
Cement
111 See www.tcma.org.tr . 112
A full list of member plants of TCMA with availabilities is to be found on the following website: http://www.tcma.org.tr/ENG/index.php?page=icerikgoster&cntID=99 113
Based on: http://www.understanding-cement.com/manufacturing.html
Technical Assistance For IPPC “Integrated Pollution Prevention and Control”
NIRAS IC Consortium ~ Regulatory Impact Assessment Report ~ June 2013
Page 59
Environmental challenges. The main environmental impacts in the manufacture of cement are related to the following categories114:
�Dust (stack emissions and fugitive sources)
�Gaseous atmospheric emissions (NOx, SO2, CO2, VOC, others)
�Other emissions (noise and vibrations, odour, process water, production waste, etc.)
�Resource consumption (energy, raw materials). In Turkey the legal emission limits for cement plants are much higher than given in the “BAT Conclusions” document for cement, both (a) for NO2
115 and (b) for dust pollution. The draft Turkish IPPC Bylaw refers to the concept of “BAT Conclusions”, and compliance with the emission limits given in these documents is mandatory. Since the EU regulation is much more stringent than current requirements in Turkey, cement companies will have to invest in new environmental technologies in order to comply. Company readiness. The information about the present level of readiness at Turkish cement plants to satisfy the EU requirements does not exist. To full assess the state of readiness a targeted survey covering all plants would be necessary. Environmentally directed investment and management is performed on an ongoing basis by the industry, and all Turkish cement companies possess environmental permits according to the present regulations. Compliance with the Cement-BREF Document (BAT) can be achieved by investing into various pollution abatement technologies.116
114
Based on several sources, e.g. (a) http://en.wikipedia.org/wiki/Cement_kiln and (b) “Best Available Techniques” for the Cement Industry. A contribution from the European Cement Industry to the exchange of information and preparation of the IPPC BAT. Reference Document for the cement industry. December 1999. (c) Air Quality In The Marmara Region. Cement plants - implementation of BAT - Practical Example. By Konrad Mair, Dipl.-Ing. Government of Upper Bavaria, Munich. Power Point slides to Workshop “Industry Emissions and Air Pollution in the Marmara Region”, Bursa, 12 April 2012 115
NO2 limits are different for waste-fueled and for non-waste fueled kilns. 116
Source: various interviews and the following publication: “Air Quality In The Marmara Region. Cement plants - implementation of BAT - Practical Example.” By Konrad Mair, Dipl.-Ing. Government of Upper Bavaria, Munich. Power Point slides to Workshop “Industry Emissions and Air Pollution in the Marmara Region”, Bursa, 12 April 2012
Technical Assistance For IPPC “Integrated Pollution Prevention and Control”
NIRAS IC Consortium ~ Regulatory Impact Assessment Report ~ June 2013
Page 60
Reduction of NOx emission. This can be made (a) either by investing into new, low-NOx-burners in the cement kilns117, or (b) by installing DeNOx technology (end-of-pipe technology, with or without catalysts). Most cement plants in Turkey lack these technologies. Investment costs of various types of De-NOx technologies are between 600.000 EUR to 4 million EUR per plant (depending on plant capacity and on the particular technology selected), while the operating costs of the same unit is between 0,5 to 1 EUR per ton of clinker. 118
Reduction of dust emission. This can be made either (a) by upgrading the existing electrostatic precipitator equipment or (b) by installing dust baghouses (i.e. using cylindrical bags as a filter medium as Air Pollution Control Equipment, APC). Unexpected dust pollution from Turkish cement companies is frequently caused by sudden breakdowns of the electricity service, because practically all cement companies remove dust from exhaust gases with the help of so called electrostatic precipitators. The installation of reserve backup electricity generators would eliminate this potential pollution source.
Improving energy efficiency and flexibility in fuel procurement. A cement plant may work with up to 100 % with waste incineration. In Turkey waste is used as fuel in case of 50% of cement plants, and in such plants on average 3% of the heat is produced by waste (up to 10 % in individual cases).
Developing administrative know-how. In case of a new permitting procedure of training existing staff, hiring trained personnel or outsourcing application writing tasks to external environmental consultants.
The once-off investment cost and the annual operating cost associated with the above efforts is an open question and should be the subject of a separate study.
Negotiations about emission limits, technology change and the associated transition period between the Government and TCMB are ongoing. TCMB has commented on the draft Turkish bylaw transposing IPPC in Turkey. According to the understanding of the industry, the sector needs a minimum transition period of 7 to 10 years.
117
See the following publication: NOx Control Technologies for the Cement Industry. EPA Contract No. 68-D98-026. By Rebecca Battye, Stephanie Walsh, Judy Lee-Greco EC/R Incorporated, North Caroline 2000. Capital Costs for Low-NOx burners were estimated in 2000 to be between 0,5 to 1 million USD, depending on the technology, while annual operating costs were between 120.000 USD and 200.000 USD. See Tables 6-5 and 6-6. 118
See Annexes 4.2.4.1. and 4.2.5 of the IPPC BREF document for cement production.

Technical Assistance For IPPC “Integrated Pollution Prevention and Control”
NIRAS IC Consortium ~ Regulatory Impact Assessment Report ~ June 2013
Page 61
Costs of emission abatement and integrated permitting for the cement industry. Cement plants apply the same basic technology with slight variations. This makes sectoral level cost assessment more reliable than for other sectors. The Spanish IPPC survey119 offers a reliable reference point as to the cost items. In 2008 representatives of 13 Spanish cement or lime production installations120 were interviewed about their costs due to IPPC as aggregated over the years 2000 to 2007. The average value of the above indicator across the 13 companies was 30 million EUR. Therefore, the approximate magnitude of adaptation costs to the Turkish cement industry sector is estimated to be 1,5 billion EUR, with an error margin of 30% plus or minus.
The Chemical Industry Overview of the sector. The Turkish chemical industry has been active for several decades, providing many basic and intermediate inputs to various industries. The industry employs more than 81,500 people in approximately 4,000 companies. The companies are mainly concentrated in the following cities: Istanbul, Izmir, Kocaeli, Sakarya, Adana, Gaziantep and Ankara. The industry comprises 11 publicly quoted companies, with a total market capitalization of around USD 3.2 billion (August 2010). The largest company is Petkim Petrokimya Holding A.S. (“Petkim”) with a market capitalization of USD 1,438 million (August 2010). IPPC is clearly very relevant for the big chemical companies. However the majority of existing chemical companies are small or medium size business121,.
Table 12. Statistical Overview of the Chemical Industry in Turkey122
Number of companies (95% SME) 13,118 companies
Production capacity per year 180 million tonnes
Turnover (2010) 123 billion USD
Added value (2007) 50 billion USD
Employment 765.000 persons
Chemical sector added-value/NGDP 6%
Total export (2010) 13 billion USD
Total import (2010) 65 billion USD
Chemicals export as percentage of manufacturing industry export 27%
Chemicals import as percentage of manufacturing industry imports 47%
119
More details about the Spanish survey in Annex 1. 120
IPPC Annex I term: “3.1. Installations for the production of cement clinker in rotary kilns with a production capacity exceeding 500 tonnes per day or lime in rotary kilns with a production capacity exceeding 50 tonnes per day or in other furnaces with a production capacity” 121
Turkish Chemicals Industry Report, Prepared by Deloitte. Published by the Investment Support and Promotion Agency of Turkey. Republic of Turkey Prime Ministry, August 2010 122 Source: Turkish Chemical Industry. By Mr. Timur Erk, President of TCMA. The Union of Chambers and Commodity Exchanges of Turkey. Chemical Industry Sector Assembly of Turkey.
Technical Assistance For IPPC “Integrated Pollution Prevention and Control”
NIRAS IC Consortium ~ Regulatory Impact Assessment Report ~ June 2013
Page 62
Sub-industries of the chemical sector: 123
Petrochemicals. (a) TÜPRAŞ (Turkish Petroleum Refineries Corporation) is an upstream producer which operates as the only integrated Refinery in Turkey with its 4 refineries in Izmit, Izmir, Kırıkkale and Batman. The company is Turkey’s largest petroleum company with a crude processing capacity of 28.1 million tons per annum. It also owns a petrochemical production facility with an annual capacity of 50,000 tons. (b) PETKİM Petrokimya Holding A.Ş. is the only integrated petrochemical complex in Turkey, operates in Petkim-Aliağa complex in Izmir, producing a wide range of petrochemicals, including all common plastics. The total production of these petrochemicals meets about 30% of domestic demand.
Textiles. Polymer production related to textiles and the production of textile chemicals have also developed simultaneously.
Fertilizer production is concentrated in seven major companies: Tugsaş, Igsaş, Bagfas, Toros Gübre, Ege Gübre, Akdeniz Gübre and Gübre Fabrikalari, which are all private enterprises.
Pharmaceutical companies in Turkey manufacture a wide range of pharmaceutical products, mostly generic formulas.
In the soap and detergent industry there are many companies, about 15 of them being the major ones; among these there are multinational groups with worldwide reputations.
The paints and coatings industry has became one of the most dynamic sectors of the Turkish chemical industry: it produces about 800 000 tons/year of paints and coatings and is comprised of about 600 manufacturers, more than 20 of which are large-scale companies.
The largest soda factory in the Middle East is Eti Soda A.Ş. with a total capacity of 750.000 tons/year.
Among chrome chemicals and chrome derivatives, some of the most important are produced in Turkey.
Most boron minerals and boron chemicals are produced and exported by Eti Maden İşletmeleri Genel Müdürlüğü.
In sodium sulphate production, Turkey ranks among the top producers in the world. Environmental regulations on chemicals124. The Government aims to align local regulations to EU directives, especially in chemical substances area, with a fast adoption process being projected. During the years 2008 and 2009, the MoEF prepared and issued regulations regarding the chemicals produced and imported to Turkey. These regulations are as follows: (a) Chemical Inventory and Control Regulation (C.I.C.R. ) (b) Regulation on Authoring and Distribution of Safety Data Sheets for Hazardous Substances and Preparations (c) Regulation on Classification, Packaging and Labelling of Hazardous Substances and Preparations (d) Regulation on Restrictions for the Manufacture, Marketing and Use of Certain Dangerous Substances & Preparations.
123
Chemicals Industry. Published by the Republic of Turkey, Ministry of Economy, 2012. 124
Source: “Chemical Regulations in Turkiye; Today and Tomorrow” By Melih Babayigit, CRAD Regulatory Services.
Technical Assistance For IPPC “Integrated Pollution Prevention and Control”
NIRAS IC Consortium ~ Regulatory Impact Assessment Report ~ June 2013
Page 63
In preparatory stage. Additionally, preparatory work and progress has been made in introducing: (a) SEVESO II Directive125 (b) CLP/GHS Regulation126 (c) REACH127 Regulation (d) Cosmetics Directive128 (e) Detergents Regulation129. Responsible Care. Pollution prevention is one of the main aims of the “Responsible Care” initiative. This Initiative is a global, voluntary initiative developed autonomously by the chemical industry for the chemical industry. It stands for the chemical industry's desire to improve health, safety, and environmental performance. The Initiative runs in 52 countries including Turkey. In Turkey the Initiative is run by the Turkish Chemical Manufacturers Association which coordinates the Responsible Care initiative among its 65 member companies in Turkey since 1993.130 Costs of emission abatement and integrated permitting for the chemical industry. It is very difficult to make general statements about the adaptation costs of the chemical industry, because of the wide variety of technologies used and also because the installations vary very strongly by size, from a few giant companies to many medium sized businesses. Due to this wide variety, the adaptation cost of an “average chemical firm” is meaningless. However, the Spanish IPPC survey131 offers some reference points to these cost items. In 2008 representatives of 83 companies of the chemical industry132 were interviewed about their costs due to IPPC as aggregated over the years 2000 to 2007. The average value of the above indicator across these 83 companies was 2,8 million EUR. The approximate magnitude of adaptation costs to the Turkish chemical industry sector is estimated to be 2,8 billion EUR, with an error margin of 30% plus or minus.
125
Council Directive 96/82/EC of 9.12.1996 on the control of major-accident hazards involving dangerous substances. 126
CLP/GHS regulation on Classification, labelling and packaging of substances and mixtures. Published in the Official Journal 31 December 2008 127
Regulation (EC) No 1907/2006 of the European Parliament and of the Council of 18 December 2006 concerning the Registration, Evaluation, Authorisation and Restriction of Chemicals (REACH). 128
Council Directive of 27 July 1976 on the approximation of the laws of the Member States relating to cosmetic products (76/768/EEC) 129
Regulation (EC) No 648/2004 of the European Parliament and of the Council of 31 March 2004 on detergents. 130
Turkish Chemical Industry's Responsible Care© Initiative. 16 Years of Implementation in Turkey, 1993-2009. Dr. Caner Zanbak, Environmental Advisor, Turkish Chemical Manufacturers Association, Sabancı Headquarters, Istanbul, Turkey, 9 June 2009. 131
More details about the Spanish survey in Annex 1. 132
IPPC Annex I terms: 4.1., 4.2, 4.3, 4.4, 4.5, 4.6.

Technical Assistance For IPPC “Integrated Pollution Prevention and Control”
NIRAS IC Consortium ~ Regulatory Impact Assessment Report ~ June 2013
Page 64
A case study for a chemical company in Hungary 133. TVK is the biggest chemical company in Hungary, a subsidiary of MOL PLC, the Hungarian oil company. At the time of introduction of IPPC to Hungary134, TVK had 9 factories producing basic chemicals (ethylene, polypropylene, high and low density polyethylene). TVK operates an ISO 14000 environmental management system. The impacts of new regulation were substantial:
Closure of an installation. One of the 9 factories of TVK (a Low Density Polyethylene LDP manufacturing plant) had to be closed, and that decision is attributed to the high cost of renewing its environmental permit.
Increase of administrative costs. The remaining 8 installations need separate IPPC permits. Applications for environmental permits were prepared by external consultants, based on data provided by TVK experts. TVK also paid a fee to the authority for the administrative procedure of permitting.
Complying with environmental requirements of IPPC was not costly for the remaining 8 factories, because these were previously equipped with contemporary technologies satisfying BAT requirements of the sector and therefore no additional investment was needed. TVK has an energy saving programme which brings significant results, but the savings cannot be attributed to IPPC.
133
Interview with Mr. Zoltan Böcsödi, Environmental Manager, Tisza Chemical Group Public Limited Company. (TVK = Tiszai Vegyi Kombinát),Tiszaújváros, Hungary. Date of conversation: 4. April 2013. 134
Hungary introduced integrated environmental permitting in 2001 by issuing a Government decree. The decree is enforced since 30 October 2003 for new installations and since 30 October 2007 for all installations.
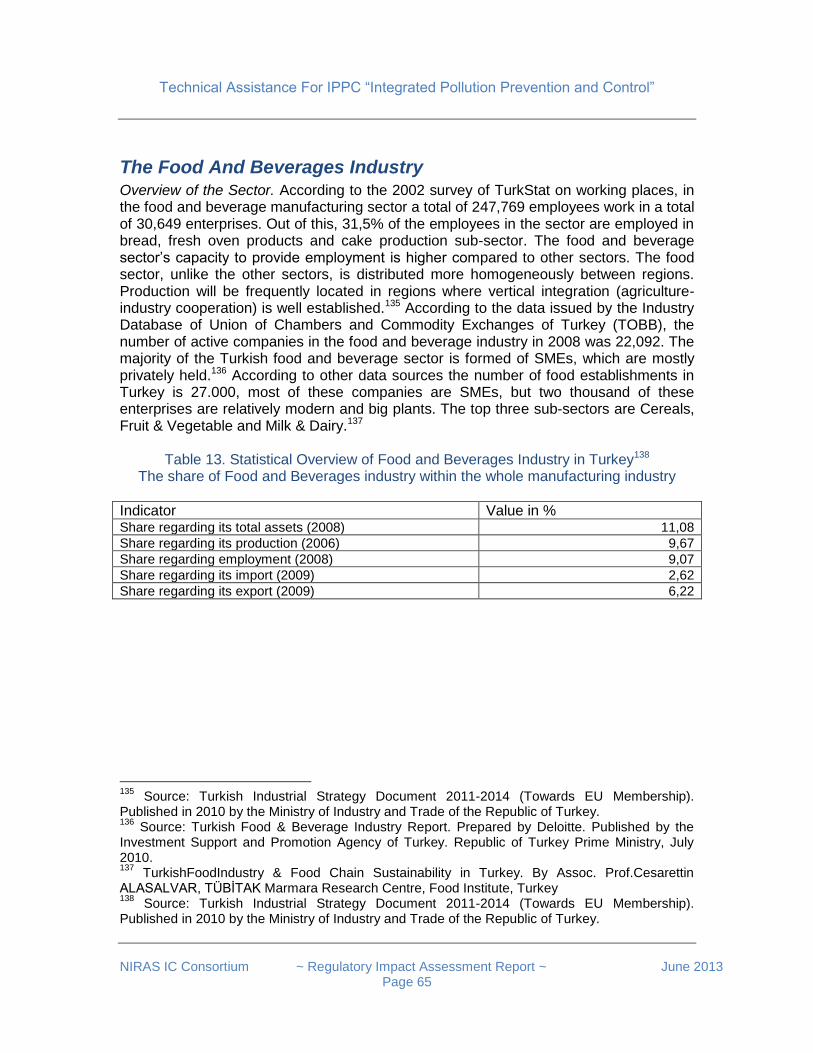
Technical Assistance For IPPC “Integrated Pollution Prevention and Control”
NIRAS IC Consortium ~ Regulatory Impact Assessment Report ~ June 2013
Page 65
The Food And Beverages Industry Overview of the Sector. According to the 2002 survey of TurkStat on working places, in the food and beverage manufacturing sector a total of 247,769 employees work in a total of 30,649 enterprises. Out of this, 31,5% of the employees in the sector are employed in bread, fresh oven products and cake production sub-sector. The food and beverage sector’s capacity to provide employment is higher compared to other sectors. The food sector, unlike the other sectors, is distributed more homogeneously between regions. Production will be frequently located in regions where vertical integration (agriculture-industry cooperation) is well established.135 According to the data issued by the Industry Database of Union of Chambers and Commodity Exchanges of Turkey (TOBB), the number of active companies in the food and beverage industry in 2008 was 22,092. The majority of the Turkish food and beverage sector is formed of SMEs, which are mostly privately held.136 According to other data sources the number of food establishments in Turkey is 27.000, most of these companies are SMEs, but two thousand of these enterprises are relatively modern and big plants. The top three sub-sectors are Cereals, Fruit & Vegetable and Milk & Dairy.137
Table 13. Statistical Overview of Food and Beverages Industry in Turkey138 The share of Food and Beverages industry within the whole manufacturing industry
Indicator Value in % Share regarding its total assets (2008) 11,08
Share regarding its production (2006) 9,67
Share regarding employment (2008) 9,07
Share regarding its import (2009) 2,62
Share regarding its export (2009) 6,22
135
Source: Turkish Industrial Strategy Document 2011-2014 (Towards EU Membership). Published in 2010 by the Ministry of Industry and Trade of the Republic of Turkey. 136
Source: Turkish Food & Beverage Industry Report. Prepared by Deloitte. Published by the Investment Support and Promotion Agency of Turkey. Republic of Turkey Prime Ministry, July 2010. 137
TurkishFoodIndustry & Food Chain Sustainability in Turkey. By Assoc. Prof.Cesarettin ALASALVAR, TÜBİTAK Marmara Research Centre, Food Institute, Turkey 138
Source: Turkish Industrial Strategy Document 2011-2014 (Towards EU Membership). Published in 2010 by the Ministry of Industry and Trade of the Republic of Turkey.
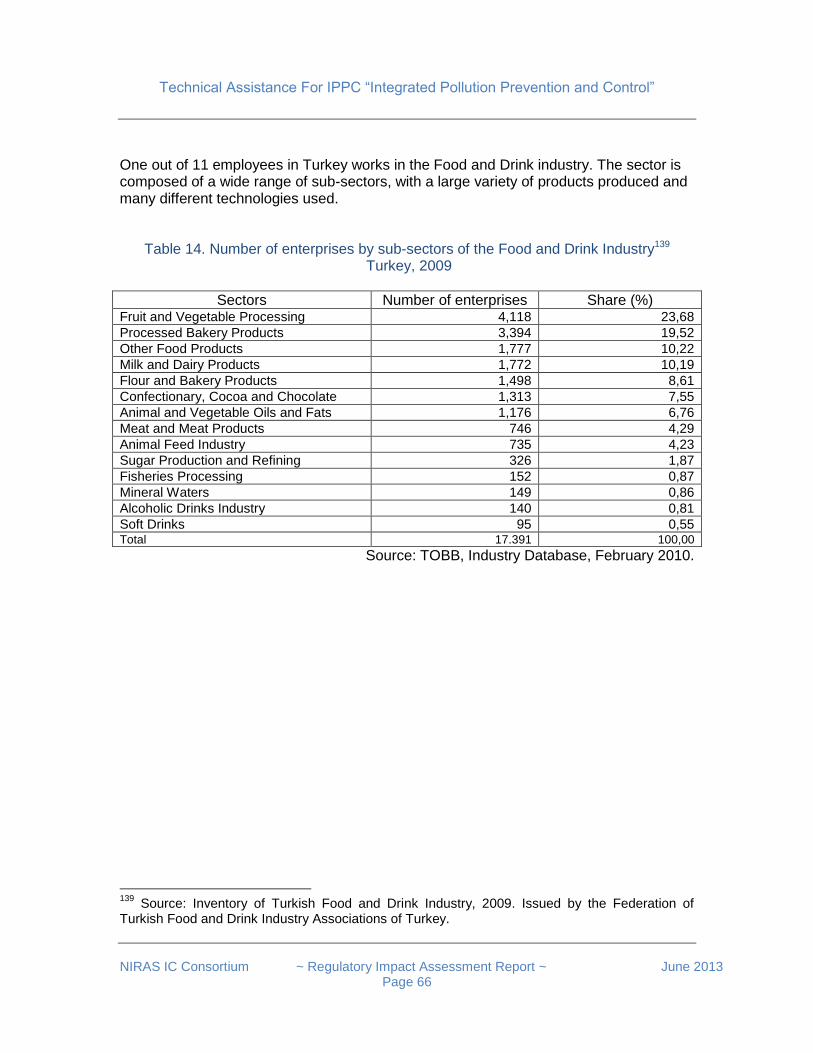
Technical Assistance For IPPC “Integrated Pollution Prevention and Control”
NIRAS IC Consortium ~ Regulatory Impact Assessment Report ~ June 2013
Page 66
One out of 11 employees in Turkey works in the Food and Drink industry. The sector is composed of a wide range of sub-sectors, with a large variety of products produced and many different technologies used.
Table 14. Number of enterprises by sub-sectors of the Food and Drink Industry139
Turkey, 2009
Sectors Number of enterprises Share (%) Fruit and Vegetable Processing 4,118 23,68
Processed Bakery Products 3,394 19,52
Other Food Products 1,777 10,22
Milk and Dairy Products 1,772 10,19
Flour and Bakery Products 1,498 8,61
Confectionary, Cocoa and Chocolate 1,313 7,55
Animal and Vegetable Oils and Fats 1,176 6,76
Meat and Meat Products 746 4,29
Animal Feed Industry 735 4,23
Sugar Production and Refining 326 1,87
Fisheries Processing 152 0,87
Mineral Waters 149 0,86
Alcoholic Drinks Industry 140 0,81
Soft Drinks 95 0,55 Total 17.391 100,00
Source: TOBB, Industry Database, February 2010.
139
Source: Inventory of Turkish Food and Drink Industry, 2009. Issued by the Federation of Turkish Food and Drink Industry Associations of Turkey.
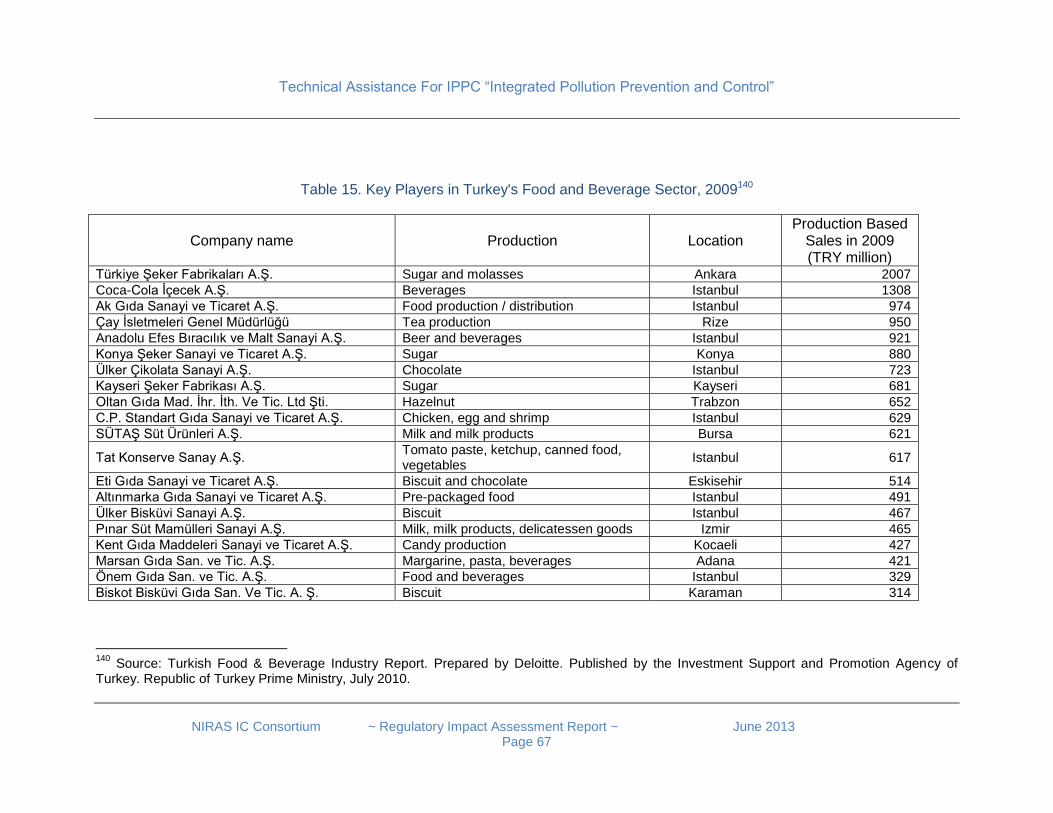
Technical Assistance For IPPC “Integrated Pollution Prevention and Control”
NIRAS IC Consortium ~ Regulatory Impact Assessment Report ~ June 2013
Page 67
Table 15. Key Players in Turkey's Food and Beverage Sector, 2009140
Company name Production Location Production Based
Sales in 2009 (TRY million)
Türkiye Şeker Fabrikaları A.Ş. Sugar and molasses Ankara 2007
Coca-Cola İçecek A.Ş. Beverages Istanbul 1308
Ak Gıda Sanayi ve Ticaret A.Ş. Food production / distribution Istanbul 974
Çay İsletmeleri Genel Müdürlüğü Tea production Rize 950
Anadolu Efes Bıracılık ve Malt Sanayi A.Ş. Beer and beverages Istanbul 921
Konya Şeker Sanayi ve Ticaret A.Ş. Sugar Konya 880
Ülker Çikolata Sanayi A.Ş. Chocolate Istanbul 723
Kayseri Şeker Fabrikası A.Ş. Sugar Kayseri 681
Oltan Gıda Mad. İhr. İth. Ve Tic. Ltd Şti. Hazelnut Trabzon 652
C.P. Standart Gıda Sanayi ve Ticaret A.Ş. Chicken, egg and shrimp Istanbul 629
SÜTAŞ Süt Ürünleri A.Ş. Milk and milk products Bursa 621
Tat Konserve Sanay A.Ş. Tomato paste, ketchup, canned food, vegetables
Istanbul 617
Eti Gıda Sanayi ve Ticaret A.Ş. Biscuit and chocolate Eskisehir 514
Altınmarka Gıda Sanayi ve Ticaret A.Ş. Pre-packaged food Istanbul 491
Ülker Bisküvi Sanayi A.Ş. Biscuit Istanbul 467
Pınar Süt Mamülleri Sanayi A.Ş. Milk, milk products, delicatessen goods Izmir 465
Kent Gıda Maddeleri Sanayi ve Ticaret A.Ş. Candy production Kocaeli 427
Marsan Gıda San. ve Tic. A.Ş. Margarine, pasta, beverages Adana 421
Önem Gıda San. ve Tic. A.Ş. Food and beverages Istanbul 329
Biskot Bisküvi Gıda San. Ve Tic. A. Ş. Biscuit Karaman 314
140
Source: Turkish Food & Beverage Industry Report. Prepared by Deloitte. Published by the Investment Support and Promotion Agency of Turkey. Republic of Turkey Prime Ministry, July 2010.
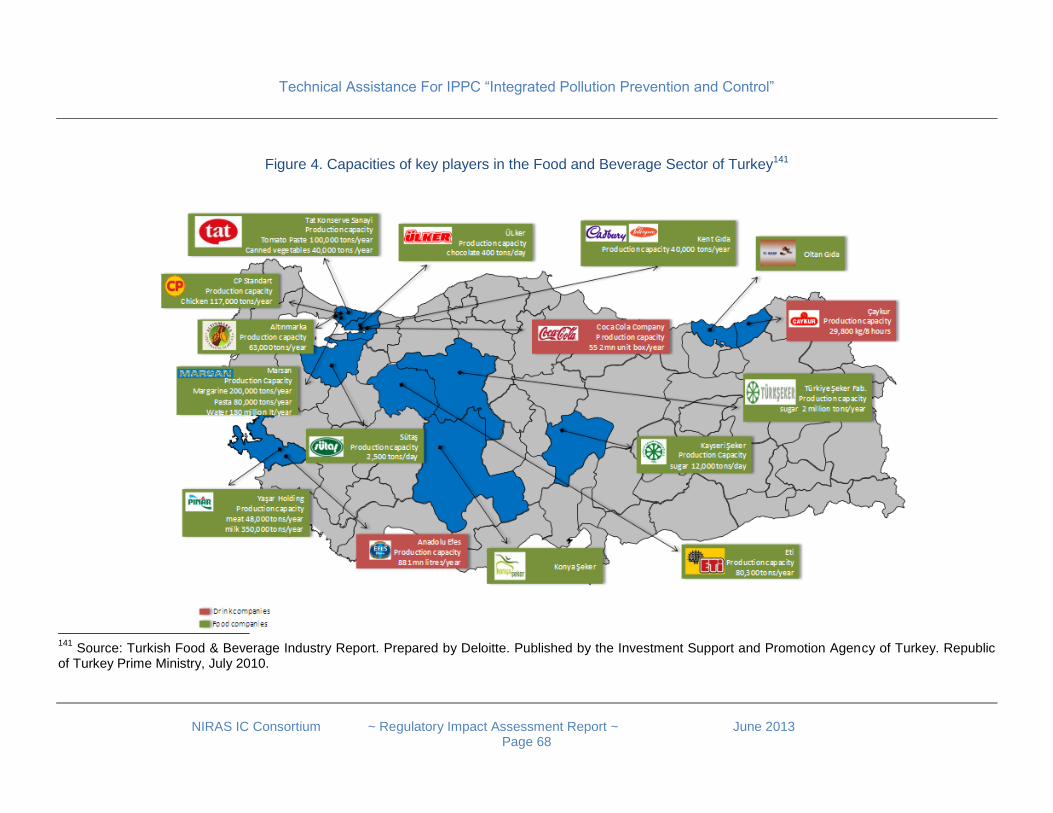
Technical Assistance For IPPC “Integrated Pollution Prevention and Control”
NIRAS IC Consortium ~ Regulatory Impact Assessment Report ~ June 2013
Page 68
Figure 4. Capacities of key players in the Food and Beverage Sector of Turkey141
141
Source: Turkish Food & Beverage Industry Report. Prepared by Deloitte. Published by the Investment Support and Promotion Agency of Turkey. Republic of Turkey Prime Ministry, July 2010.
Technical Assistance For IPPC “Integrated Pollution Prevention and Control”
NIRAS IC Consortium ~ Regulatory Impact Assessment Report ~ June 2013
Page 69
Environment and Energy in the Sector. The major environmental challenge to the food industry is to implement those investments which are necessary (a) to manage solid and liquid wastes and (b) to reduce stack gas emissions. The wastes of the sector are basically used in feeding animals or they are discharged to the places determined by local authorities. The sector is well aware of the fact that in EU legislation, the environmental issues of the food industry are regulated by the Integrated Pollution Prevention and Control Directive (2008/1/EC), and by the Waste Framework Directive (2008/98/EC), but for the time being, of the environmental directives relevant for the sector, only the Packaging and Packaging Waste Directive (94/62/EC) is in force in Turkey. 142 Environment friendly technologies. The BREF for the Food, Drink and Milk Industries143 describes over 370 “techniques to consider in the determination of BAT”, both “process-integrated” and “end-of-pipe” techniques. Many address the issues of minimising water consumption and contamination; energy consumption and minimising the use of raw materials with the consequent minimization of waste production. Specific techniques are described e.g. on food storage, on refrigeration techniques with minimal energy consumption and food degradation. Best Available Techniques are described in two “tiers”: Tier 1 contains horizontal techniques, such as Equipment and installation cleaning, Waste water treatment, Accidental releases, etc. while Tier 2 contains “Additional BAT” techniques for specific sub-sectors such as the fruit and vegetable sector, etc. Costs. In the professional literature there is no cost assessment about the costs of upgrading the food industry sector as a whole in a particular country, partly because the technologies applied in the sector are very heterogeneous. However, at the level of individual installations there are excellent case studies of cost assessments covering the complete or partial retrofitting of food industry installations in order to meet the requirements of IPPC.144
Each chapter of the BREF for the Food, Drink and Milk Industries145 includes sub-chapters under the title “Economics”. These sub-chapters include a wide variety of cost estimations for the recommended technologies, calculated on the level of individual companies and extrapolated for installations of similar capacity and technology.
142
Source: Turkish Industrial Strategy Document 2011-2014 (Towards EU Membership). Published in 2010 by the Ministry of Industry and Trade of the Republic of Turkey. 143
Integrated Pollution Prevention and Control. Reference Document on Best Available Techniques in the Food, Drink and Milk Industries. August 2006. Size: 682 pages. 144
E.g. “The Application of Membrane Separation Processes as Environmental Friendly Methods in the Beet Sugar Production”. Zita Šereš, Julianna Gyura, Mirjana Djurić, Gyula Vatai, Matild Eszterle. In: Environmental Technologies. Edited by E. Burcu Ozkaraova Gung. Published on the website http://cdn.intechopen.com. 145
Integrated Pollution Prevention and Control. Reference Document on Best Available Techniques in the Food, Drink and Milk Industries. August 2006. Size: 682 pages.
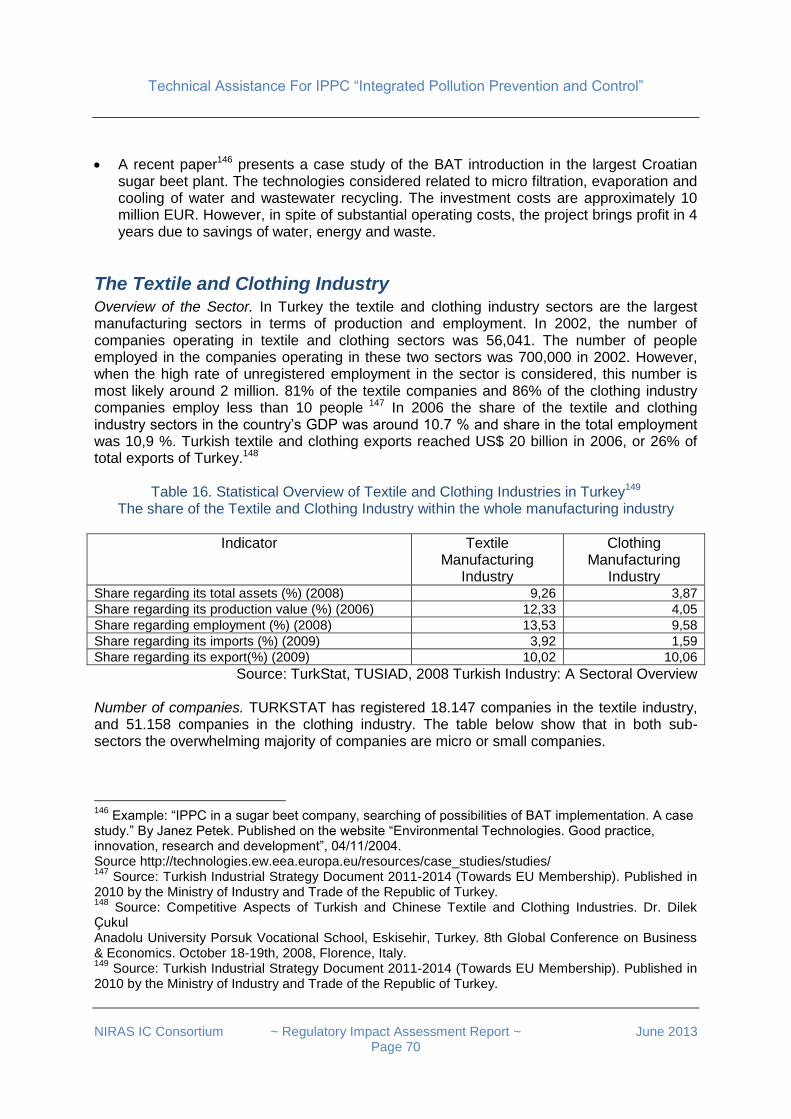
Technical Assistance For IPPC “Integrated Pollution Prevention and Control”
NIRAS IC Consortium ~ Regulatory Impact Assessment Report ~ June 2013
Page 70
A recent paper146 presents a case study of the BAT introduction in the largest Croatian sugar beet plant. The technologies considered related to micro filtration, evaporation and cooling of water and wastewater recycling. The investment costs are approximately 10 million EUR. However, in spite of substantial operating costs, the project brings profit in 4 years due to savings of water, energy and waste.
The Textile and Clothing Industry Overview of the Sector. In Turkey the textile and clothing industry sectors are the largest manufacturing sectors in terms of production and employment. In 2002, the number of companies operating in textile and clothing sectors was 56,041. The number of people employed in the companies operating in these two sectors was 700,000 in 2002. However, when the high rate of unregistered employment in the sector is considered, this number is most likely around 2 million. 81% of the textile companies and 86% of the clothing industry companies employ less than 10 people 147 In 2006 the share of the textile and clothing industry sectors in the country’s GDP was around 10.7 % and share in the total employment was 10,9 %. Turkish textile and clothing exports reached US$ 20 billion in 2006, or 26% of total exports of Turkey.148
Table 16. Statistical Overview of Textile and Clothing Industries in Turkey149 The share of the Textile and Clothing Industry within the whole manufacturing industry
Indicator Textile Manufacturing
Industry
Clothing Manufacturing
Industry Share regarding its total assets (%) (2008) 9,26 3,87
Share regarding its production value (%) (2006) 12,33 4,05
Share regarding employment (%) (2008) 13,53 9,58
Share regarding its imports (%) (2009) 3,92 1,59
Share regarding its export(%) (2009) 10,02 10,06
Source: TurkStat, TUSIAD, 2008 Turkish Industry: A Sectoral Overview Number of companies. TURKSTAT has registered 18.147 companies in the textile industry, and 51.158 companies in the clothing industry. The table below show that in both sub-sectors the overwhelming majority of companies are micro or small companies.
146
Example: “IPPC in a sugar beet company, searching of possibilities of BAT implementation. A case study.” By Janez Petek. Published on the website “Environmental Technologies. Good practice, innovation, research and development”, 04/11/2004. Source http://technologies.ew.eea.europa.eu/resources/case_studies/studies/ 147
Source: Turkish Industrial Strategy Document 2011-2014 (Towards EU Membership). Published in 2010 by the Ministry of Industry and Trade of the Republic of Turkey. 148
Source: Competitive Aspects of Turkish and Chinese Textile and Clothing Industries. Dr. Dilek Çukul Anadolu University Porsuk Vocational School, Eskisehir, Turkey. 8th Global Conference on Business & Economics. October 18-19th, 2008, Florence, Italy. 149
Source: Turkish Industrial Strategy Document 2011-2014 (Towards EU Membership). Published in 2010 by the Ministry of Industry and Trade of the Republic of Turkey.
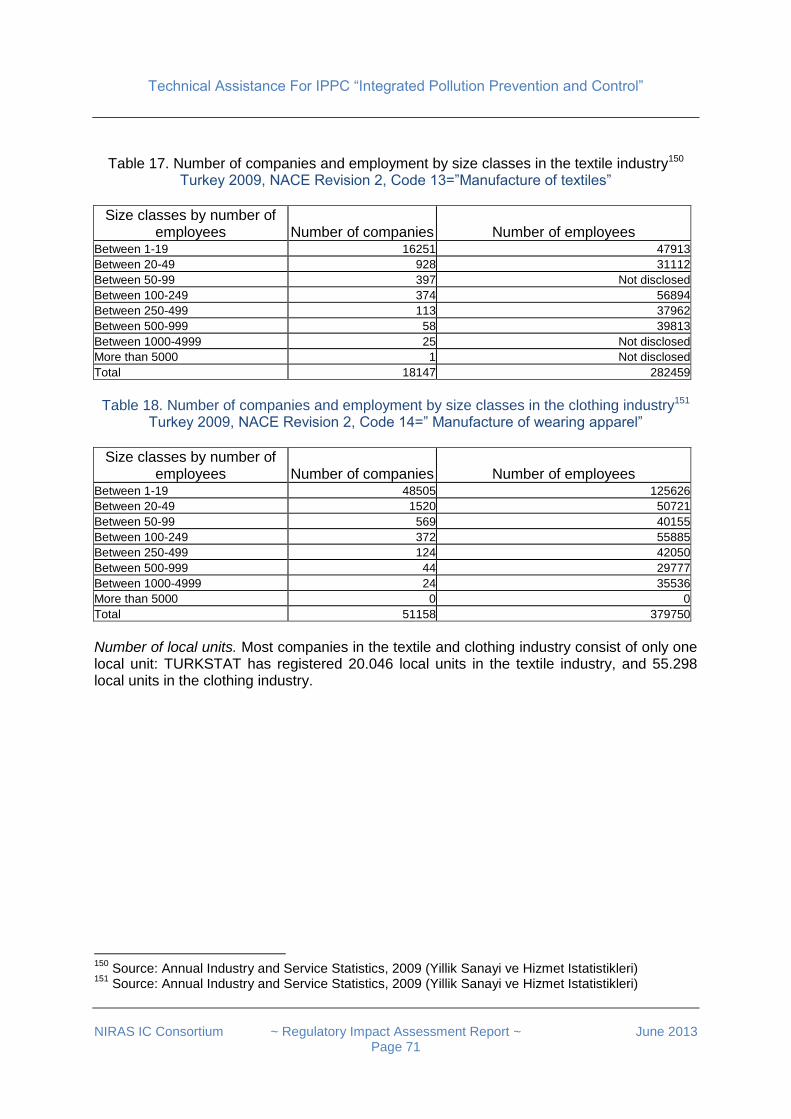
Technical Assistance For IPPC “Integrated Pollution Prevention and Control”
NIRAS IC Consortium ~ Regulatory Impact Assessment Report ~ June 2013
Page 71
Table 17. Number of companies and employment by size classes in the textile industry150 Turkey 2009, NACE Revision 2, Code 13=”Manufacture of textiles”
Size classes by number of employees Number of companies Number of employees
Between 1-19 16251 47913
Between 20-49 928 31112
Between 50-99 397 Not disclosed
Between 100-249 374 56894
Between 250-499 113 37962
Between 500-999 58 39813
Between 1000-4999 25 Not disclosed
More than 5000 1 Not disclosed
Total 18147 282459
Table 18. Number of companies and employment by size classes in the clothing industry151
Turkey 2009, NACE Revision 2, Code 14=” Manufacture of wearing apparel”
Size classes by number of employees Number of companies Number of employees
Between 1-19 48505 125626
Between 20-49 1520 50721
Between 50-99 569 40155
Between 100-249 372 55885
Between 250-499 124 42050
Between 500-999 44 29777
Between 1000-4999 24 35536
More than 5000 0 0
Total 51158 379750
Number of local units. Most companies in the textile and clothing industry consist of only one local unit: TURKSTAT has registered 20.046 local units in the textile industry, and 55.298 local units in the clothing industry.
150
Source: Annual Industry and Service Statistics, 2009 (Yillik Sanayi ve Hizmet Istatistikleri) 151
Source: Annual Industry and Service Statistics, 2009 (Yillik Sanayi ve Hizmet Istatistikleri)
Technical Assistance For IPPC “Integrated Pollution Prevention and Control”
NIRAS IC Consortium ~ Regulatory Impact Assessment Report ~ June 2013
Page 72
Textile production technology and the environment.152 In any country, the main environmental concerns in the textile industry are (a) discharged water and the chemical load it carries (b) energy consumption, (c) air emissions, (d) solid wastes and (e) odours, which can be a significant nuisance in certain treatments. In the processing of textiles, the industry uses a number of dyes, chemicals, auxiliary chemicals and sizing materials. The result is contaminated waste water, which can cause environmental problems unless properly treated before its disposal. Conventional treatment systems are not very effective in removing pollutants such as dissolved solids, colour and trace metals. Therefore, in all textile industry plants, wastewater treatment is the crucial environmental activity of the company. In case of the textile industry the two most problematic wastewater quality indicators are (a) colour, (b) sulphates, because the cost of treatment for these two indicators. In most cases untreated or partially treated textile dyes are the main environmental issue. Turkish textile industry and the environment. According to the Industrial Strategy Document153, the IPPC Directive is the most important framework regulation regarding the environment. Textile and clothing export is made to EU within the framework of REACH regulation. In this industry sector, textile finishing is has the highest potential to harm the environment. Low levels of environmental costs have contributed to the competitiveness of Turkish textile products in export markets, but importers of textile and clothing products in EU demand certification proving that the products are produced harmless to environment. According to the Industrial Strategy Document, most enterprises operating in textile and clothing sector in Turkey have begun to pay increasing attention to the issues listed in the relevant BAT document. According to the Industrial Strategy Document, state aid is used to encourage investments enabling the textile and clothing sector to move to a more environment-friendly production structure. Wastewater treatment in Turkish textile companies. Most Turkish textile companies use the so called “lagoon process”154, which is a natural biological decomposition process for wastewater. Decomposition is implemented in so-called “Stabilization ponds”, which in practice are artificial lakes. This technology needs a relatively large land surface but its operational cost and risks are negligible.155 The resulting treated wastewater must conform to legal requirements, in terms of so-called “wastewater quality indicators”, such as (a) colour, (b) content of sulphates, (c) Total organic carbon (TOC), (d) Biochemical Oxygen Demand (BOD), (e) Chemical oxygen demand (COD), (f) Free Chlorine and others.
152
Source: various publications, including (a) Integrated Pollution Prevention and Control (IPPC) Reference Document on Best Available Techniques for the Textiles Industry. European Commission, July 2003 (b) “Advance Methods for Treatment of Textile Effluents” by the Indian Ministry of Environment and Forests, Delhi 2007. 153
Source: Turkish Industrial Strategy Document 2011-2014 (Towards EU Membership). Published in 2010 by the Ministry of Industry and Trade of the Republic of Turkey. 154
For more details see: «Wastewater Technology Fact Sheet - Facultative Lagoons» . By United States Environmental Protection Agency. 155
For a full range of technologies for treating textile wastes see the following documents: (a) Integrated Pollution Prevention and Control (IPPC), Reference Document on Best Available Techniques for the Textiles Industry. July 2003 (See Page 438 for Unit cost of wastewater treatment) and (b) «Cotton Textile Processing: Waste Generation and Effluent Treatment.» By B. Ramesh Babu, A.K. Parande, S. Raghu, and T. Prem Kumar. The Journal of Cotton Science 11:141–153 (2007).
Technical Assistance For IPPC “Integrated Pollution Prevention and Control”
NIRAS IC Consortium ~ Regulatory Impact Assessment Report ~ June 2013
Page 73
Challenges in wastewater treatment. In Turkey a high proportion of waste sludge containing textile dyes ends up in municipal waste landfills where some of this harmful material subsequently is washed into natural waters, instead of being transported to hazardous waste depositories, where, according to the law, such materials should be treated.
The BREF for textile industry, depending on the textile technology used, for wastewater treatment recommends (a) oxidation methods, e.g. ozonation (b) adsorption activated carbon or (c) combined biological-physical and chemical treatments. 156
Ozonation: a major cost item. Ozonation of textile waste water prior to discharge to the stabilization pond (i.e. the “lagoon”) reduces color significantly by facilitating the oxidation of organics and inorganics. However, as representatives of the Turkish textile industry argue, ozonation technology would be extremely costly for the companies. For example, for a big textile plant the once-off investment cost of an ozonation plant is 1 to 1,2 million USD, with a yearly operating costs of 0,3 million USD.157 Turkish textile industry in these years is fighting continuous increase of input prices (e.g. petrol based acrylic and polyester fibres, cellulose, electricity, etc.) and stagnating output prices.
Promotion of bio-degradable dyes. Therefore, as representatives of the Turkish textile industry argue, Government intervention is needed to reduce the price of bio-degradable dyes, in order to motivate textile plants to use dyes with enhanced bio-degradability.158 Unfortunately most dyes used are not bio-degradable. For identifying bio-degradable dyes the European Standard for Biodegradability (EN 13432)159 can be used which is widely used by laboratories issuing bio-degradability certifications. If the Government took appropriate measures to develop the market of bio-degradable dyes, the use of these substances would be much cheaper for companies than ozonation. Moreover, it would demonstrate the priority of a cleaner technology as opposed to an end-of-pipe solution.
156
See pages x and xi of the above quoted document. 157
Source: interview with textile industry experts. 158 Examples for (a) dyes with high biodegradability and (b) methods of bio-degradation of dyes are
given in the professional literature. Example: “Textile Organic Dyes – Characteristics, Polluting Effects and Separation/Elimination Procedures from Industrial Effluents – A Critical Overview “ By Zaharia Carmen and Suteu Daniela. Article appeared in: “Organic Pollutants Ten Years After the Stockholm Convention – Environmental and Analytical Update”. Edited by Tomasz Puzyn and Aleksandra Mostrag-Szlichtyng, 2012. 159
In Turkey registered on 05.03.2003 as a Turkish Standard under TS No: TS EN 13432.
Technical Assistance For IPPC “Integrated Pollution Prevention and Control”
NIRAS IC Consortium ~ Regulatory Impact Assessment Report ~ June 2013
Page 74
A pilot project in Turkey to save water and energy160. In 2007 IPPC principles and the BAT for textile industry161 were used to implement measures for saving water and energy in a large textile plant in Turkey. In the pilot project water and energy use was optimised and detailed water and energy mass balance analysis were conducted. The adaptation of the suggested BAT options to the textile mill provided 28% reduction in water consumption and 25% reduction in energy consumption. The BAT options included the installation of flow meters in processes, the reuse of water at various stages of the technological processes (e.g. washing, dyeing, finishing) and other innovative solutions Pilot projects for ozonation in Turkey. Ozonation of wastewater of textile mills is not new in Turkey. A pilot project introduced this BAT in a textile mill in Bursa162 and also in a denim163 manufacturing plant in Kayseri164. The projects have shown the feasibility and cost efficiency of this environmental technology. Transition period. According to the opinion of the representatives of the Turkish textile industry, for older textile companies and for companies located in densely populated areas the IED should be introduced not earlier then 10 years from now. Textile companies located in cities have to cope with higher operation costs. According to this recommendation, the transition period can be shorter for new companies and for rural textile companies.
Impact Assessment Survey Among Industrial Companies of Turkey
Aims and method of the survey The survey targeted a relatively small, partially representative sample of those industrial installations / plants in Turkey that will be most affected by the introduction of Integrated Environmental Permitting. The survey targeted five selected industry sectors of importance in Turkey. The responses were intended to give a reasonable overview of:
the present level of preparedness of the biggest and environmentally most active affected companies
expected investment costs and costs of ongoing compliance, e.g. administrative costs
expected benefits, e.g. due to opening up new markets, due to reducing risks or due to reducing material costs by reducing waste.
company attitudes to compliance.
160
“Adoption of EU’s IPPC Directive: Optimization of Water and Energy Consumption in a Textile Mill”. By A. Merve Kocabas, Hande Yukseler, Filiz B. Dilek, Ulku Yetis. Department of Environmental Engineering, Middle East Technical University. 161
The BREF document has been quoted above. 162
“Investigation of COD and colour removal in textile industry by using advanced oxidation and chemical treatment.” By Birgül A., Solmaz S.K.A., Ekoloji (2007) No. 62, pages 72-80 163
Denim is the material of the blue jeans. 164 “Ozonation of a denim producing textile industry wastewater – process optimization”. M.A. thesis by Eyüp Kaan Morali in environmental engineering. Middle East Technical University. Supervisor: Prof. Dr. Ülkü Yeti September 2010, 83 pages. This pilot project of ozonation was supported by TÜBITAK.
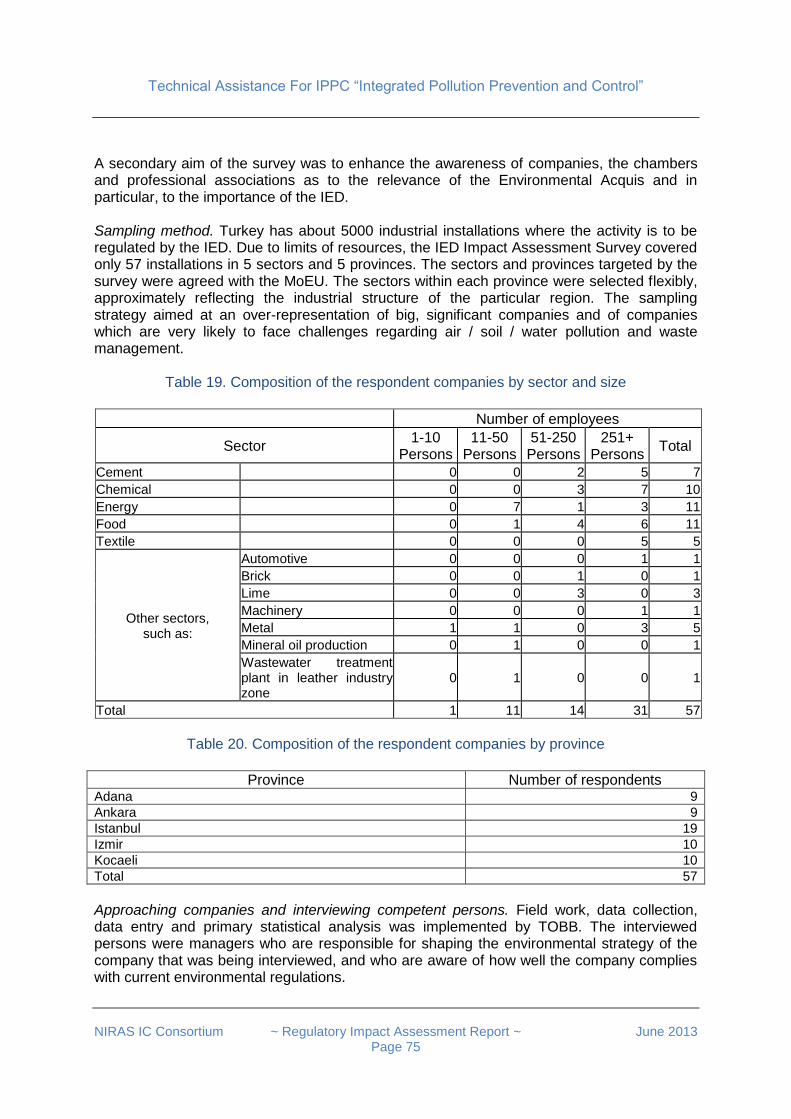
Technical Assistance For IPPC “Integrated Pollution Prevention and Control”
NIRAS IC Consortium ~ Regulatory Impact Assessment Report ~ June 2013
Page 75
A secondary aim of the survey was to enhance the awareness of companies, the chambers and professional associations as to the relevance of the Environmental Acquis and in particular, to the importance of the IED. Sampling method. Turkey has about 5000 industrial installations where the activity is to be regulated by the IED. Due to limits of resources, the IED Impact Assessment Survey covered only 57 installations in 5 sectors and 5 provinces. The sectors and provinces targeted by the survey were agreed with the MoEU. The sectors within each province were selected flexibly, approximately reflecting the industrial structure of the particular region. The sampling strategy aimed at an over-representation of big, significant companies and of companies which are very likely to face challenges regarding air / soil / water pollution and waste management.
Table 19. Composition of the respondent companies by sector and size
Number of employees
Sector 1-10
Persons 11-50
Persons 51-250 Persons
251+ Persons
Total
Cement 0 0 2 5 7
Chemical 0 0 3 7 10
Energy 0 7 1 3 11
Food 0 1 4 6 11
Textile 0 0 0 5 5
Other sectors, such as:
Automotive 0 0 0 1 1
Brick 0 0 1 0 1
Lime 0 0 3 0 3
Machinery 0 0 0 1 1
Metal 1 1 0 3 5
Mineral oil production 0 1 0 0 1
Wastewater treatment plant in leather industry zone
0 1 0 0 1
Total 1 11 14 31 57
Table 20. Composition of the respondent companies by province
Province Number of respondents
Adana 9
Ankara 9
Istanbul 19
Izmir 10
Kocaeli 10
Total 57
Approaching companies and interviewing competent persons. Field work, data collection, data entry and primary statistical analysis was implemented by TOBB. The interviewed persons were managers who are responsible for shaping the environmental strategy of the company that was being interviewed, and who are aware of how well the company complies with current environmental regulations.
Technical Assistance For IPPC “Integrated Pollution Prevention and Control”
NIRAS IC Consortium ~ Regulatory Impact Assessment Report ~ June 2013
Page 76
The small sample size was counterbalanced by the length of the Questionnaire and with the abundance of qualitative (open) questions. The aim of this approach was to implement a structured interview with the respondents and thereby to achieve a depth and richness of information with a relatively small sample. Open questions were answered in one, two or maximum three sentences. These sentences were entered into an Excel file and submitted to the IPPC TA project. The duration of the conversation was about 60 to 70 minutes.
Compliance of Industry With Environmental Regulations
Q1. What kind of environmental permit is your company operating with? A high percentage of responding companies operates with temporary environmental permits. Frequencies:
Permanent: 21 respondents.
Temporary: 27 respondents. Typical reasons why companies operate with temporary permits is either that the installation itself has only temporary operation permit, or that some unsolved environmental problems (e.g. wastewater management) has to be solved before the authorities are willing to issue a permanent environmental permit. Q2. Are you aware of some regulatory changes having taken place?
Frequencies: Yes: 55 respondents. No: 3 respondents. The overwhelming majority of companies is well aware of the fact that environmental regulations are changing. Q3. Which change of environmental regulation (or which change of its enforcement, e.g. permitting procedure) has significantly affected your company? While responding to this open question, companies reported substantial difficulties to meet the requirements of
Water pollution regulation regarding color parameter.
Directive on Waste Incineration165.
Liability insurance provisions of waste management regulation.
SEVESO Directive.
Regulation on landfill storage of sewage sludge.
Large combustion plants regulation. Additionally, the following procedural difficulties were mentioned:
The period of validity of environmental permits was shortened.
It takes too long to get environmental permits.
165
Directive 2000/76/EC of the European Parliament and of the Council of 4 December 2000 on the incineration of waste.
Technical Assistance For IPPC “Integrated Pollution Prevention and Control”
NIRAS IC Consortium ~ Regulatory Impact Assessment Report ~ June 2013
Page 77
It is too cumbersome to obtain an environmental permit for temporarily operating an installation.
The requirements regarding the frequency of emission measurement are too stringent.
Difficulties of submitting application electronically.
Notification of authorities about emissions is too bureaucratic. Q4. How do changes in environmental regulation / enforcement affect your company? Please highlight and explain the most significant impacts. Most respondents have asserted that environmental regulations significantly affect their business, raising costs but also delivering social benefits. Environmental impacts were mentioned only infrequently. Impacts in terms of environmental investments and management. Respondents mentioned various cost items and extra workload resulting from changes of environmental regulations.
Some companies had to invest in new waste management equipment, water purification equipment, coal storage infrastructure, chimney upgrading, dust filtering and storage. Some of these investments were financed by foreign funded credits.
Some companies have changed their input materials in order to reduce emissions, but in some cases it was difficult to purchase raw material complying with the emission limit values.
Operating costs were raised by the fact that some companies had to improve emissions measurements and monitoring, e.g. by establishing a Continuous Emission Measurement System in chimneys.
Other companies were complying with bureaucratic workload of environmental regulations by hiring consultants for writing of applications.
Most of the employees should be given the necessary training to address environmental issues.
Social impacts. A group of respondents has stressed their strong social commitment to environment friendly production, their participation in various bodies and councils devoted to environmental protection. Respondents have recognised that environment protection measures contribute to the development of the firm. Pollution prevention measures taken by some companies have contributed to spread “positive thinking” within the staff and increased the prestige of the firm.
Technical Assistance For IPPC “Integrated Pollution Prevention and Control”
NIRAS IC Consortium ~ Regulatory Impact Assessment Report ~ June 2013
Page 78
Environmental Costs and Revenues Q5. Please give estimation about your yearly environmental investments (capital expenditure)
Respondents have interpreted the term “capital expenditure for environmental purposes” differently. The values given for capital expenditures ranged from tens of thousands of Euros to 6 million Euros, depending on the size, sector, environmental performance of the company and on the actual environmental challenges faced by the installations. It is not possible to quantitatively analyse the responses, but they can give a good insight into the tasks ahead. The 57 respondents have mentioned various items of environmentally justified investment items, including:
exchange of a well pump,
purchase and maintenance of an emission monitoring device,
recovery of waste disposal equipment,
noise and vibration reduction,
reconstruction of ventilating fans,
renewal of steam traps (valves),
changing filter equipment, e.g. conversion of electric filters to bag filters,
investments in wastewater management,
waste minimization
reducing water consumption,
establishment of flue gas measurement system. Q6. Please give an estimation about your yearly operating expenditure (OPEX) on Environmental Protection? (OPEX includes labour costs of environmental administration /application, leasing payments, maintenance and labour costs for equipment and the treatment and disposal of waste. ) Respondents have interpreted the term “yearly operating expenditure (OPEX) on Environmental Protection” differently. The values given ranged from tens of thousands Euros to 10 million Euros. It is not possible to quantitatively analyse the responses, but they can give a good insight into the tasks ahead. The 57 respondents have mentioned various items of environmentally justified operating expenditure items, including in-house and outsourced environmental services such as
the compilation of applications for environmental permits
the maintenance and operation of cogeneration systems, catalytic converters, scrubbers, waste water discharge equipment, etc.
waste transportation, for disposing of hazardous wastes, for performing an analysis of waste
and environmental certificates. Some costs mentioned here related to additional electricity consumption due to more efficient dust filters.

Technical Assistance For IPPC “Integrated Pollution Prevention and Control”
NIRAS IC Consortium ~ Regulatory Impact Assessment Report ~ June 2013
Page 79
Q7. How many persons work for how long in order to prepare a typical application for an environmental permit? (Please express in man-months) Please comment on the workload. Typical responding companies employ 1 to 3 persons for performing environmentally relevant tasks in 10% to 30% of their working time. A few respondents employ 1 to 3 staff which is occupied full time with environmental management, including administration. One company is an exception and reported that 15 persons spend 5 months of the year with environmentally justified tasks. One company has established an environmental management unit with three employees. If the company employs one (or seldom two) specialized environmental officer, this person co-operates closely with the plant manager and with an operating engineer. A group of respondents has mentioned that the workload is shared with external environmental consultants. Environmentally justified workload is higher in the months preceding environmental reviews or the submitting of applications for environmental permits. The following human resource-intensive environmental services were highlighted:
many respondents have highlighted that to obtain permits and licences involves many (6 to 12) man months.
online application process takes a lot of time due to lack of appropriate technical and IT infrastructure.
collection of the required data takes a long time.
to update environmentally relevant old documentation if regulation changes or ownership of the company changes
to perform environmental studies, to participate in training
to continuously monitor the environmental performance of the firm. Q8. Does the environmental authority charge some fee for the environmental permit? Frequencies: Yes: 51 respondents. No: 7 respondents. Companies responding with “yes” pay environmental fees for certification and permits to authorities ranging from a few hundred Euro up to 5000 Euro, according to the price list established by MoEU. A wide range of companies have stressed that the fees are fair, while a few respondents found them excessive. The certificates, temporary or permanent permits, licenses, document handling fees, monitoring and analysis fees mentioned by the respondents cover environmentally relevant activities of companies such as
waste handling, hazardous waste recovery
emissions of gases, wastewater
generation of noise. Q9 Please estimate the yearly administrative costs as of now, related to satisfy pollution control regulation and please comment the above estimation.
Technical Assistance For IPPC “Integrated Pollution Prevention and Control”
NIRAS IC Consortium ~ Regulatory Impact Assessment Report ~ June 2013
Page 80
Respondents have interpreted the term “yearly administrative costs as of now, related to satisfy pollution control regulation” differently. The values given ranged from tens of thousands Euros to 1,2 million Euros. Environmental costs depend on the amount of emissions and waste generated and are typically higher in the early phases of an investment. It is not possible to quantitatively analyse the responses, but the comments can give a good insight into how companies interpret environmental polices. A few respondents have explicitly mentioned that the adaptation of the best available technologies represented a substantial cost item for them. According to the respondents, significant environmental costs are attributed to
disposal costs (waste, sludge, etc.)
operating a water treatment plant, e.g. cooling the discharged water
occasionally closing down old installations or parts thereof and establishing new ones (e.g. setting up a new paint shop)
operating costs of in-house staff responsible for company level environmental activities
measurement, analysis, e.g. operating real-time remote monitoring stations for wastewater discharges, obtaining measurement devices
administrative expenses
financing external consulting services Q10. Does your company receive environmental revenues of the following types: Receipts (incomes) from by-products resulting from Environmental Protection activities?
Table 21.
Sub-Question Yes,
relevant
Yes, but not
relevant No
Do not know
Number of respondents Incomes from selling by-products of environmentally justified technology changes
18 5 32 0
Energy or material savings due to more efficient processes and other productivity gains resulting from Environmental Protection activities
16 3 36 2
Reduced environmental charges and environmental taxes
0 1 50 4
Subsidies received due to environment friendly actions / projects
8 0 45 3
Increased sales due to environmentally improved product quality, enhanced public image, consumer trust in green products.
8 1 41 6
Transactions of tradeable emission permits 2 0 52 1
Opening up new markets for the companies 5 2 43 4
About one-third of responding companies was able to transform environmentally justified activities into by-products, into energy savings or material savings, and subsequently to increase their incomes. In particular cases this means that the waste generated by the installation is incinerated and the resulting steam is used for heating nearby living quarters or to generate electricity. One respondent explains that the surplus heat generated by this technology is used for electricity generation, but complains that due to lack of subsidies the company faces fierce competition from electricity generating companies.
Technical Assistance For IPPC “Integrated Pollution Prevention and Control”
NIRAS IC Consortium ~ Regulatory Impact Assessment Report ~ June 2013
Page 81
A significant group of respondents has recognized the positive role of subsidies received for environmental projects. Q11. How many people are employed, at your firm, to perform environmental control, maintaining / operating environmental equipment, waste disposal, measurement and permit administration? The size of staff with environmental responsibilities depends on the size, sector and environmental challenges of the company. While the median value is 4, the frequencies are as follows:
One person: 7 respondents,
2 to 3 persons: 13 respondents,
4 to 5 persons: 10 respondents,
6 and more persons: 28 respondents. Q12. Does your company have an Environmental Management System? Most responding companies possess a registered Environmental Management System. The frequencies are as follows:
Yes, a registered one: 35 respondents
Yes, a non-registered one 6 respondents
No: 18 respondents
Do not know: 0 respondents
Environmentally Motivated Social and Institutional Contacts of Companies Q13. With regard to pollution control, have you ever had connections with legal courts, had lawsuits? A surprisingly high proportion, about one quarter of the respondents has been brought to court for environmental reasons. Frequencies:
Yes: 14 respondents
No: 41 respondents
Don’t know: 3 respondents In most cases the reason was non-compliance in waste management and water emissions. In specific cases the reasons, for which these companies had to go to court were as follows:
Legal action because the color parameter of discharged water was not satisfactory (textile company)
Waste management plan was not submitted, penalties for unauthorized, indiscriminate storage of waste or waste fire.
Causing harm by emitting dust.
The noise emitted by the installation conflicted with municipal plans for developing a nearby housing estate; the municipality applied sanction but the company filed a lawsuit against the punishment.
Administrative penalty due to odor complaints (food company).
Technical Assistance For IPPC “Integrated Pollution Prevention and Control”
NIRAS IC Consortium ~ Regulatory Impact Assessment Report ~ June 2013
Page 82
Q14. With regard to pollution control, have you ever had connections with environment protection organisations? A significant group of companies established contacts with environment protection organisations. Frequencies:
Yes: 10 respondents
No: 47 respondents
Do not know: 1 respondent. In all mentioned cases the co-operation with environment protection organisations was motivated by corporate social responsibility considerations. The responding companies and the co-operating NGOs have jointly implemented environmental projects, such as
cleaning up a shoreline,
or planting trees. Q15. With regard to pollution control, have you ever had connections with chambers? About half of the respondents had previously communicated with chambers about environmental issues. Frequencies:
Yes: 27 respondents
No 29 respondents
Do not know: 2 respondents The responses show an active co-operation with regional and national chambers of industry, with sectoral associations and with TOBB. The services offered by chambers and associations include
Disseminating information on legislation and standards via personal meetings and via emails.
Disseminating environmental and other standards
Organising trainings about compliance with legislation
Offering help in emission measurement
Sharing best practices,
Elaborating and representing industry opinion on draft legislation
Participating in public support campaigns
Issuing awards for emission reduction Q16. With regard to pollution control, have you ever had connections with the media (newspapers, radio, TV)? Only about one-fifth of the respondents communicated with the media on pollution issues. Frequencies:
Yes: 12 respondents
No 46 respondents
Do not know: 1 respondents The respondents have reported various occasions when the media has praised these companies for various environment friendly actions, such as
Technical Assistance For IPPC “Integrated Pollution Prevention and Control”
NIRAS IC Consortium ~ Regulatory Impact Assessment Report ~ June 2013
Page 83
Establishing a sludge drying plant
Launching a waste management project
Contributing to heating of 10.000 housing units via environment friendly heat generation
Planting trees
Obtaining an environment award from the regional chamber of industry Q17. Are there any products, produced / exported in your company for which your client wants a proof that the production technology is environment friendly? Environmental concerns do not appear to be barriers of trade. No respondent has reported such a conflict.
Awareness of the Industrial Emissions Directive Q18. Are you aware of the IED? About two-third of the respondents was familiar with the Industrial Emissions Directive. Frequencies.
Yes: 35 respondents
No: 21 respondents Q19. Are you aware of Turkish Legislation introducing Integrated Environmental Permitting? Somewhat more than two-third of the respondents was familiar with the Turkish Legislation introducing integrated permitting. Frequencies.
Yes: 39 respondents
No: 18 respondents The respondents have obtained their knowledge about this regulation from the following sources:
Official newspaper
Website of the ministry of environment and urbanization
Professional / sectoral association
Environmental consultants
Regional chambers
From professional reference publications (e.g. Lebib Yalkın publications)
From a seminar organized jointly by the ministry of environment and TOBB.
By being involved in a factory pilot application of IPPC. Q20. What guidance, e.g. BREFs are you aware of to assist your company in the implementation of Integrated Environmental Permitting? Companies vary by their awareness of BREFs:
Technical Assistance For IPPC “Integrated Pollution Prevention and Control”
NIRAS IC Consortium ~ Regulatory Impact Assessment Report ~ June 2013
Page 84
About one-third of the respondents (e.g. in the textile, LCP, and cement industries) has reported that they have seen and studied their sectoral BREF documents, a few them reported that they have taken into consideration the recommendations contained in the BREFs.
About one-third of the respondents reported that they are aware of the existence and importance of BREF documents, but have not encountered them.
The rest of the respondents have not heard about these documents or did not respond to this question.
Q21 and Q22. Do you think more guidance/training in administrative requirements of IEP and in the associated technological requirements should be provided for industry? Who should provide this guidance and how? Most respondents need more guidance both on Integrated Environmental Permitting and on technological requirements. Frequencies:
Yes: 55 respondents
No: 2 respondent. Most respondents expect the necessary guidance from MoEP. A wide group has also mentioned the chambers and associations as well. Some respondents have mentioned the possible role of universities, other accredited educational institutions, TUBITAK and other R&D centres, EU experts and NGOs. The medium of communication should be training courses, consultation events, simplified booklets and web based interactive information sources.
Potential Impacts of The Introduction of IED on The Company Q23. Do your company’s activities fall under the category of industry typically associated with higher pollution rates? If yes, why, if not, why not? About half of the respondents identify their industries as high polluters. Frequencies:
Yes: 28 respondents
No: 19 respondents
Do not know: 0 respondent. Polluter companies are well aware of the fact, why the activities of their company are covered by IPPC.
Some respondents classify their activities according to industry sector and plant capacity. Typical examples are LCPs with capacities of 50 MW or more, other respondents mention their use of solvents in high quantity.
Other respondents mention here the type of pollution (e.g. wastewater, odor, etc.) which makes them subject to IPPC.
A third group of respondents considers their company subject to IPPC due to high consumption of energy, water or fuel.
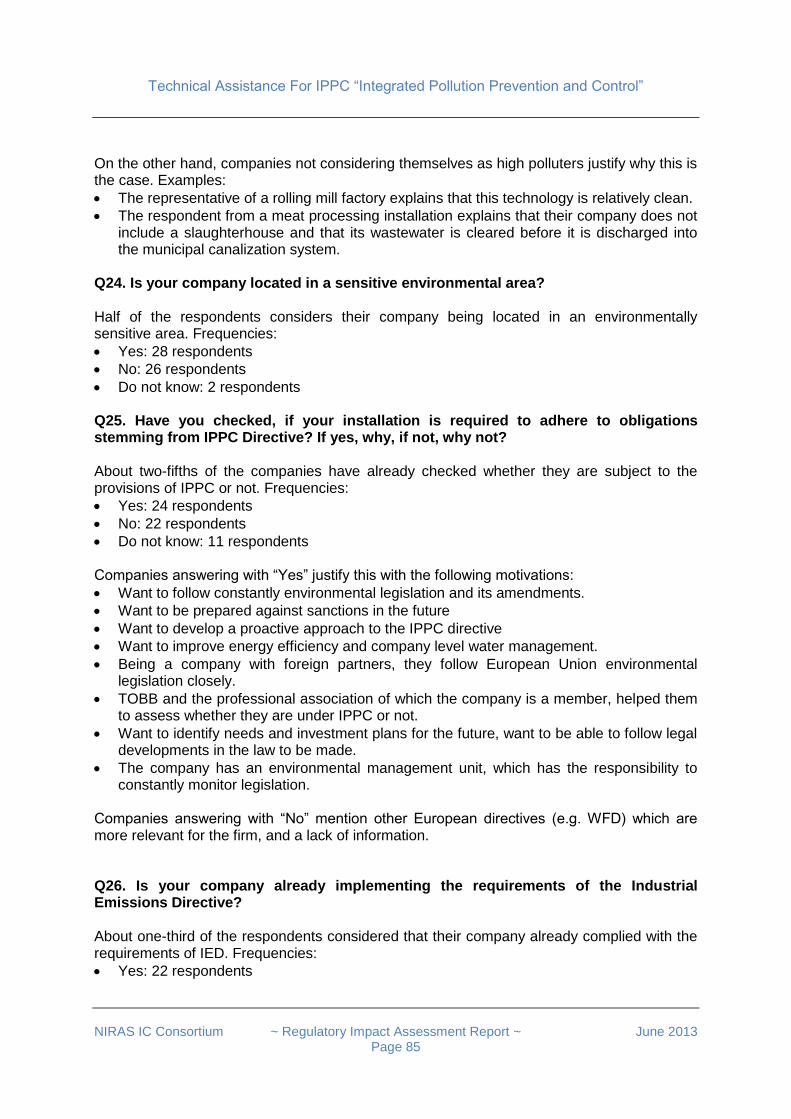
Technical Assistance For IPPC “Integrated Pollution Prevention and Control”
NIRAS IC Consortium ~ Regulatory Impact Assessment Report ~ June 2013
Page 85
On the other hand, companies not considering themselves as high polluters justify why this is the case. Examples:
The representative of a rolling mill factory explains that this technology is relatively clean.
The respondent from a meat processing installation explains that their company does not include a slaughterhouse and that its wastewater is cleared before it is discharged into the municipal canalization system.
Q24. Is your company located in a sensitive environmental area? Half of the respondents considers their company being located in an environmentally sensitive area. Frequencies:
Yes: 28 respondents
No: 26 respondents
Do not know: 2 respondents Q25. Have you checked, if your installation is required to adhere to obligations stemming from IPPC Directive? If yes, why, if not, why not? About two-fifths of the companies have already checked whether they are subject to the provisions of IPPC or not. Frequencies:
Yes: 24 respondents
No: 22 respondents
Do not know: 11 respondents Companies answering with “Yes” justify this with the following motivations:
Want to follow constantly environmental legislation and its amendments.
Want to be prepared against sanctions in the future
Want to develop a proactive approach to the IPPC directive
Want to improve energy efficiency and company level water management.
Being a company with foreign partners, they follow European Union environmental legislation closely.
TOBB and the professional association of which the company is a member, helped them to assess whether they are under IPPC or not.
Want to identify needs and investment plans for the future, want to be able to follow legal developments in the law to be made.
The company has an environmental management unit, which has the responsibility to constantly monitor legislation.
Companies answering with “No” mention other European directives (e.g. WFD) which are more relevant for the firm, and a lack of information. Q26. Is your company already implementing the requirements of the Industrial Emissions Directive? About one-third of the respondents considered that their company already complied with the requirements of IED. Frequencies:
Yes: 22 respondents

Technical Assistance For IPPC “Integrated Pollution Prevention and Control”
NIRAS IC Consortium ~ Regulatory Impact Assessment Report ~ June 2013
Page 86
No: 25 respondents
Do not know: 10 respondents Here the following motivations, are mentioned:
The desire of increasing the performance productivity: 10 respondents
The desire of increasing the prestige of the company : 17 respondents
Further motivations: o Want to comply with regulations, to satisfy environmental requirements. o Environment protection has a high priority for the company. o To support the protection of the environment as a whole
Q27. Do you think that the technology used in your company has to be changed in order to satisfy more stringent pollution control requirements? If yes, how?
Table 22.
Option Number of respondents
Yes, to a large extent, by applying so-called “Clean Technologies” (e.g. input substitution, pollution prevention, product modification, production of a useful by-product, etc.)
5
Only to some extent, by applying so-called “End of pipe techniques” (e.g. filters, clean-up actions, etc.)
17
There is no need to change the technology just for environmental reasons 13
Don’t know 20
Companies vary according to the strategic depth of their environmental investment plans:
Only one tenth of the respondents considered that serious investments are needed in order to integrate environment protection into their technological processes.
One third considers that some “end of pipe” technologies are sufficient, such as the establishment of a wastewater treatment plan or the setting up of a dust emission reduction unit or of an odor Removal Unit.
One third thinks that the activities of their company are satisfactory from the point of view of environment protection.
Q28. Under the IED, you have to show whether or not there’s been any pollution to land during the permit period. If there has, you are liable to clean it all up to your previous, “baseline level”. Does this affect your company? If yes, how? If not, why not? Only one third of the respondents think that land recovery obligations are relevant for their firm. Frequencies:
Yes: 18 respondents
No: 13 respondents
Do not know: 25 respondents
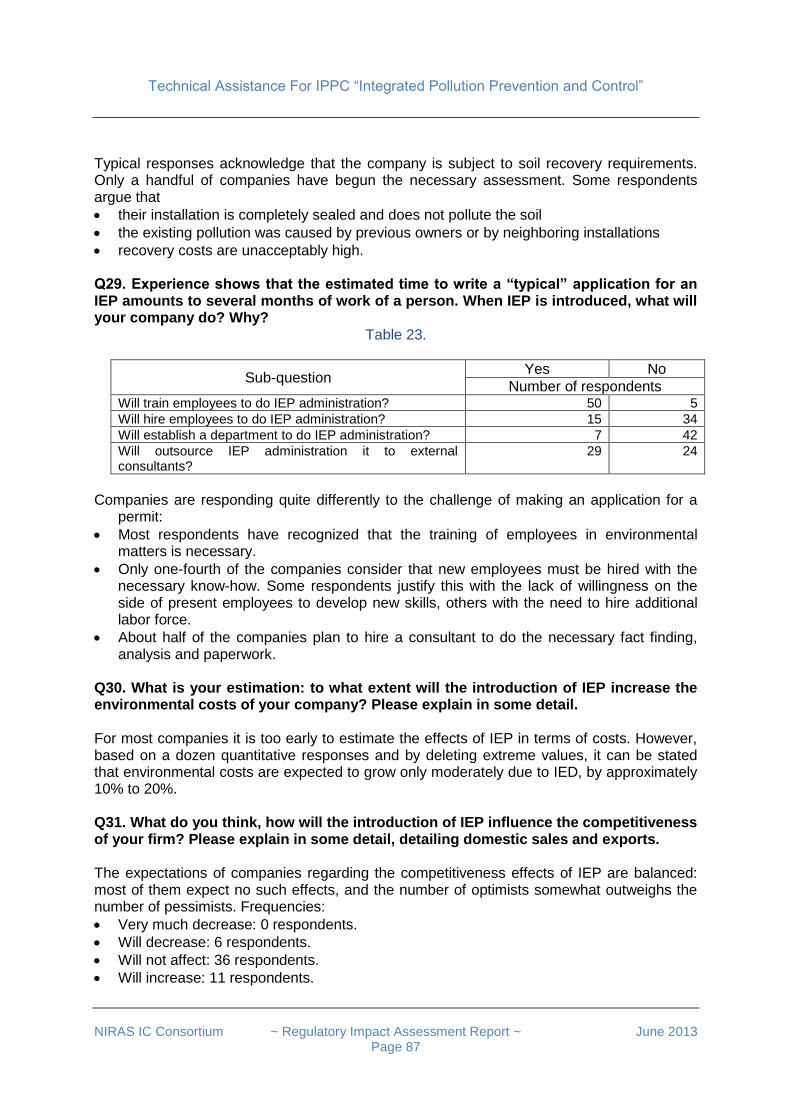
Technical Assistance For IPPC “Integrated Pollution Prevention and Control”
NIRAS IC Consortium ~ Regulatory Impact Assessment Report ~ June 2013
Page 87
Typical responses acknowledge that the company is subject to soil recovery requirements. Only a handful of companies have begun the necessary assessment. Some respondents argue that
their installation is completely sealed and does not pollute the soil
the existing pollution was caused by previous owners or by neighboring installations
recovery costs are unacceptably high. Q29. Experience shows that the estimated time to write a “typical” application for an IEP amounts to several months of work of a person. When IEP is introduced, what will your company do? Why?
Table 23.
Sub-question Yes No
Number of respondents Will train employees to do IEP administration? 50 5
Will hire employees to do IEP administration? 15 34
Will establish a department to do IEP administration? 7 42
Will outsource IEP administration it to external consultants?
29 24
Companies are responding quite differently to the challenge of making an application for a
permit:
Most respondents have recognized that the training of employees in environmental matters is necessary.
Only one-fourth of the companies consider that new employees must be hired with the necessary know-how. Some respondents justify this with the lack of willingness on the side of present employees to develop new skills, others with the need to hire additional labor force.
About half of the companies plan to hire a consultant to do the necessary fact finding, analysis and paperwork.
Q30. What is your estimation: to what extent will the introduction of IEP increase the environmental costs of your company? Please explain in some detail. For most companies it is too early to estimate the effects of IEP in terms of costs. However, based on a dozen quantitative responses and by deleting extreme values, it can be stated that environmental costs are expected to grow only moderately due to IED, by approximately 10% to 20%. Q31. What do you think, how will the introduction of IEP influence the competitiveness of your firm? Please explain in some detail, detailing domestic sales and exports. The expectations of companies regarding the competitiveness effects of IEP are balanced: most of them expect no such effects, and the number of optimists somewhat outweighs the number of pessimists. Frequencies:
Very much decrease: 0 respondents.
Will decrease: 6 respondents.
Will not affect: 36 respondents.
Will increase: 11 respondents.
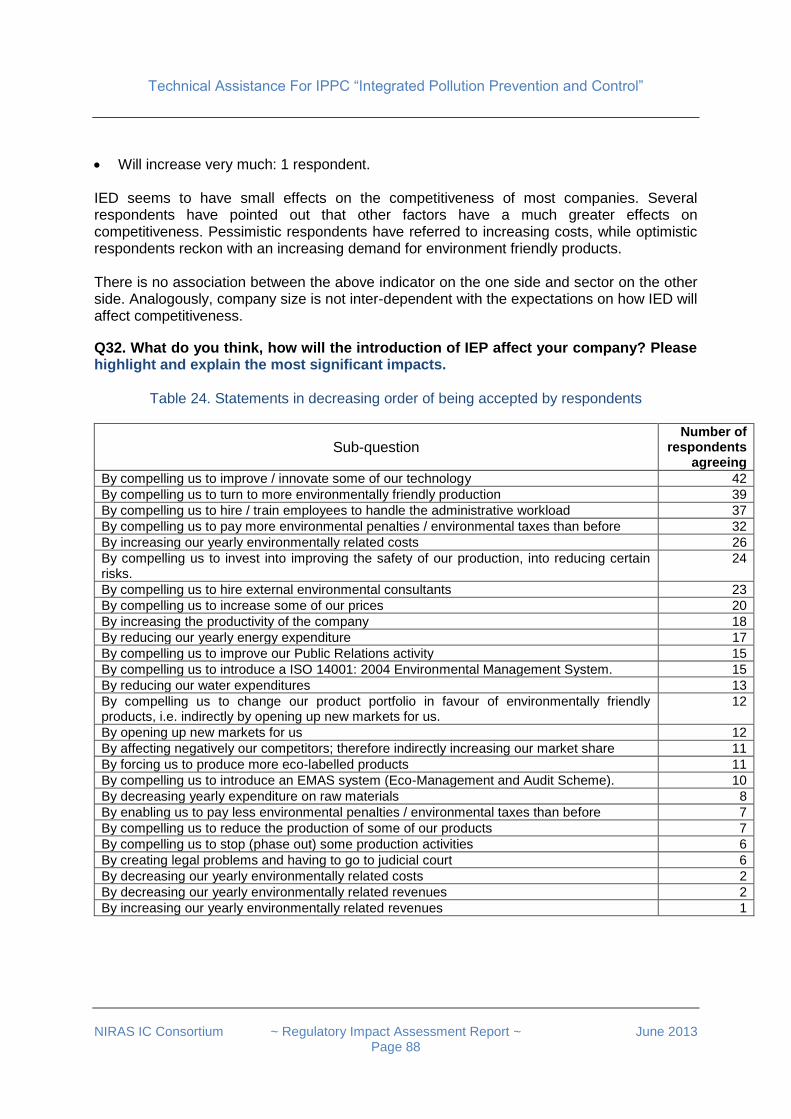
Technical Assistance For IPPC “Integrated Pollution Prevention and Control”
NIRAS IC Consortium ~ Regulatory Impact Assessment Report ~ June 2013
Page 88
Will increase very much: 1 respondent. IED seems to have small effects on the competitiveness of most companies. Several respondents have pointed out that other factors have a much greater effects on competitiveness. Pessimistic respondents have referred to increasing costs, while optimistic respondents reckon with an increasing demand for environment friendly products. There is no association between the above indicator on the one side and sector on the other side. Analogously, company size is not inter-dependent with the expectations on how IED will affect competitiveness.
Q32. What do you think, how will the introduction of IEP affect your company? Please highlight and explain the most significant impacts.
Table 24. Statements in decreasing order of being accepted by respondents
Sub-question Number of
respondents agreeing
By compelling us to improve / innovate some of our technology 42
By compelling us to turn to more environmentally friendly production 39
By compelling us to hire / train employees to handle the administrative workload 37
By compelling us to pay more environmental penalties / environmental taxes than before 32
By increasing our yearly environmentally related costs 26
By compelling us to invest into improving the safety of our production, into reducing certain risks.
24
By compelling us to hire external environmental consultants 23
By compelling us to increase some of our prices 20
By increasing the productivity of the company 18
By reducing our yearly energy expenditure 17
By compelling us to improve our Public Relations activity 15
By compelling us to introduce a ISO 14001: 2004 Environmental Management System. 15
By reducing our water expenditures 13
By compelling us to change our product portfolio in favour of environmentally friendly products, i.e. indirectly by opening up new markets for us.
12
By opening up new markets for us 12
By affecting negatively our competitors; therefore indirectly increasing our market share 11
By forcing us to produce more eco-labelled products 11
By compelling us to introduce an EMAS system (Eco-Management and Audit Scheme). 10
By decreasing yearly expenditure on raw materials 8
By enabling us to pay less environmental penalties / environmental taxes than before 7
By compelling us to reduce the production of some of our products 7
By compelling us to stop (phase out) some production activities 6
By creating legal problems and having to go to judicial court 6
By decreasing our yearly environmentally related costs 2
By decreasing our yearly environmentally related revenues 2
By increasing our yearly environmentally related revenues 1

Technical Assistance For IPPC “Integrated Pollution Prevention and Control”
NIRAS IC Consortium ~ Regulatory Impact Assessment Report ~ June 2013
Page 89
By looking at the first few lines of the above table, one can see a very balanced picture of company expectations. Respondents are clearly aware of the impacts of IED both for the company and for the society, and identify the major benefits and costs of having a new European environmental regulation introduced in Turkey. Expectations regarding technological innovations and cleaner production are high, while respondents realistically expect to grow certain types of environmental expenditures. Impact expectations by sectors and by company size classes. The next table compares the expectations of companies by sectors. The reliability of these statements is clearly limited by the small sample size, however, some general tendencies are visible in the next two tables. Expectations of various sectors as to the impact of IPPC / IED.
Cement. There is a wide range of statements where the agreement rates of cement companies are significantly different from the all-industrial sample averages. In particular, compared to the overall industrial average, cement companies are much stronger convinced that IPPC / IED will bring significant environmental benefits and significant environmental costs.
Chemical. The expectation of chemical companies coincide with those of the industrial average.
Energy. The representatives of Large Combustion Plants were much more skeptical as of the impacts of IPPC / IED. The reason may be that the LPC Directive has already been introduced - although not yet enforced - in Turkey, and therefore integrated permitting does not bring so much novelty for these installations.
Food. These companies are thinking very similarly to the overall industrial average. This class of industry does not believe at all that their production technology, product portfolio or market share will change due to environmental considerations.
Textile. These companies, similarly to cement companies, attribute significant changes to the introduction of IPPC / IED.
Expectations of various size classes as to the impact of IPPC / IED. Company expectations vary also according to their size, as it can be seen from the table which differentiates between the responding companies according to the number of employees.
Big companies, compared to their smaller counterparts, are much more optimistic about the positive benefits of IPPC / IED. The hope of big companies that environment friendly technologies and products will open up new markets for them, is stronger than the respective expectations of the average industrial companies.
SMEs. On the other hand, small and medium sized companies are much more skeptical about the benefits of IPPC / IED compared to their bigger counterparts. Moreover, smaller companies are more convinced than big ones that IPPC / IED will bring significant cost increases for them.
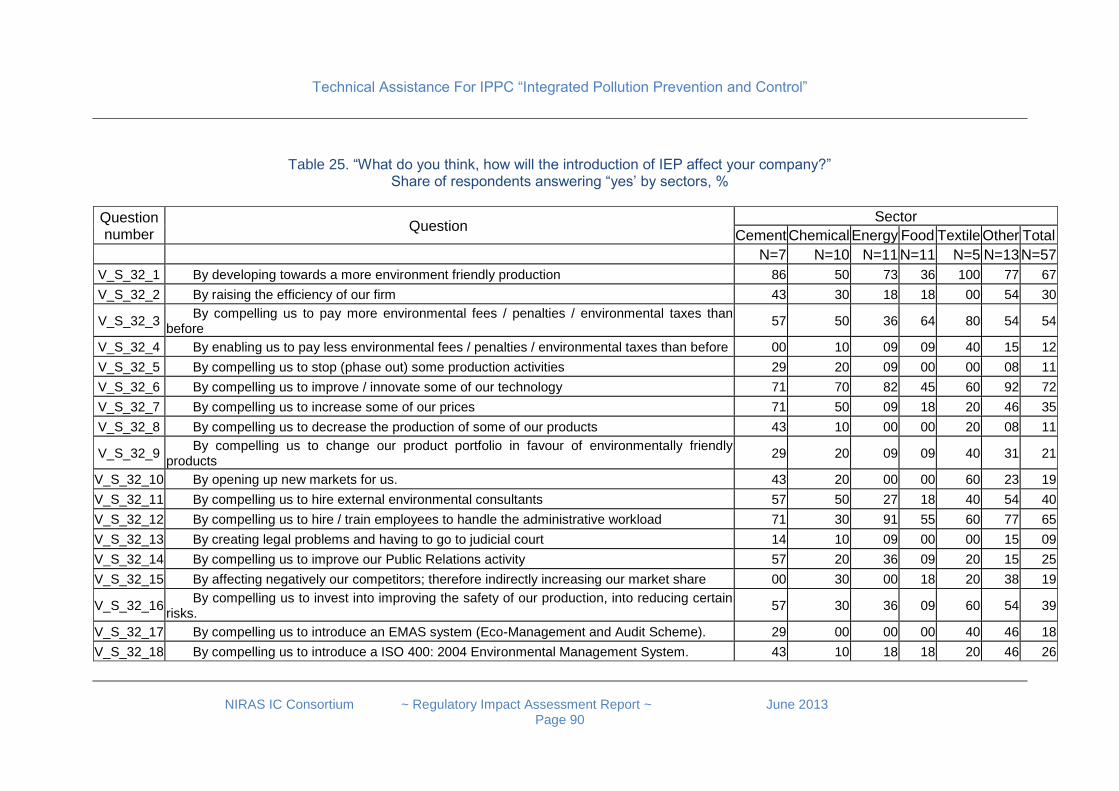
Technical Assistance For IPPC “Integrated Pollution Prevention and Control”
NIRAS IC Consortium ~ Regulatory Impact Assessment Report ~ June 2013
Page 90
Table 25. “What do you think, how will the introduction of IEP affect your company?” Share of respondents answering “yes’ by sectors, %
Question number
Question Sector
Cement Chemical Energy Food Textile Other Total
N=7 N=10 N=11 N=11 N=5 N=13 N=57
V_S_32_1 By developing towards a more environment friendly production 86 50 73 36 100 77 67
V_S_32_2 By raising the efficiency of our firm 43 30 18 18 00 54 30
V_S_32_3 By compelling us to pay more environmental fees / penalties / environmental taxes than
before 57 50 36 64 80 54 54
V_S_32_4 By enabling us to pay less environmental fees / penalties / environmental taxes than before 00 10 09 09 40 15 12
V_S_32_5 By compelling us to stop (phase out) some production activities 29 20 09 00 00 08 11
V_S_32_6 By compelling us to improve / innovate some of our technology 71 70 82 45 60 92 72
V_S_32_7 By compelling us to increase some of our prices 71 50 09 18 20 46 35
V_S_32_8 By compelling us to decrease the production of some of our products 43 10 00 00 20 08 11
V_S_32_9 By compelling us to change our product portfolio in favour of environmentally friendly
products 29 20 09 09 40 31 21
V_S_32_10 By opening up new markets for us. 43 20 00 00 60 23 19
V_S_32_11 By compelling us to hire external environmental consultants 57 50 27 18 40 54 40
V_S_32_12 By compelling us to hire / train employees to handle the administrative workload 71 30 91 55 60 77 65
V_S_32_13 By creating legal problems and having to go to judicial court 14 10 09 00 00 15 09
V_S_32_14 By compelling us to improve our Public Relations activity 57 20 36 09 20 15 25
V_S_32_15 By affecting negatively our competitors; therefore indirectly increasing our market share 00 30 00 18 20 38 19
V_S_32_16 By compelling us to invest into improving the safety of our production, into reducing certain
risks. 57 30 36 09 60 54 39
V_S_32_17 By compelling us to introduce an EMAS system (Eco-Management and Audit Scheme). 29 00 00 00 40 46 18
V_S_32_18 By compelling us to introduce a ISO 400: 2004 Environmental Management System. 43 10 18 18 20 46 26
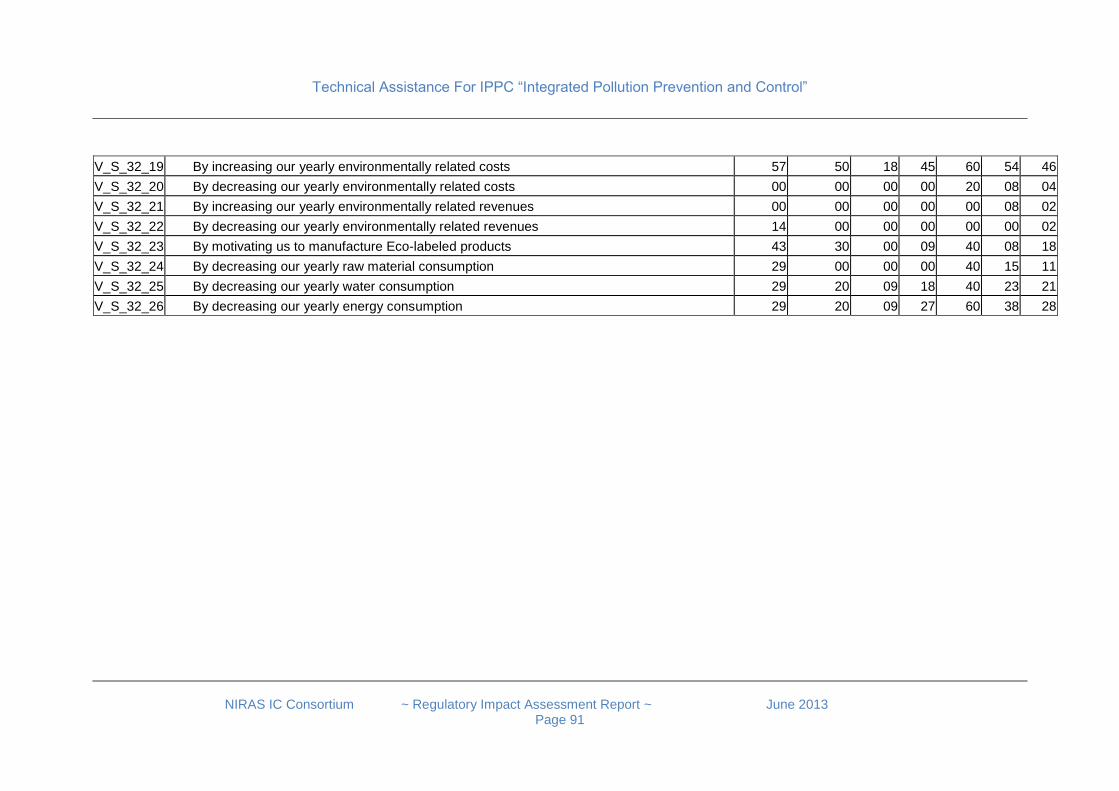
Technical Assistance For IPPC “Integrated Pollution Prevention and Control”
NIRAS IC Consortium ~ Regulatory Impact Assessment Report ~ June 2013
Page 91
V_S_32_19 By increasing our yearly environmentally related costs 57 50 18 45 60 54 46
V_S_32_20 By decreasing our yearly environmentally related costs 00 00 00 00 20 08 04
V_S_32_21 By increasing our yearly environmentally related revenues 00 00 00 00 00 08 02
V_S_32_22 By decreasing our yearly environmentally related revenues 14 00 00 00 00 00 02
V_S_32_23 By motivating us to manufacture Eco-labeled products 43 30 00 09 40 08 18
V_S_32_24 By decreasing our yearly raw material consumption 29 00 00 00 40 15 11
V_S_32_25 By decreasing our yearly water consumption 29 20 09 18 40 23 21
V_S_32_26 By decreasing our yearly energy consumption 29 20 09 27 60 38 28
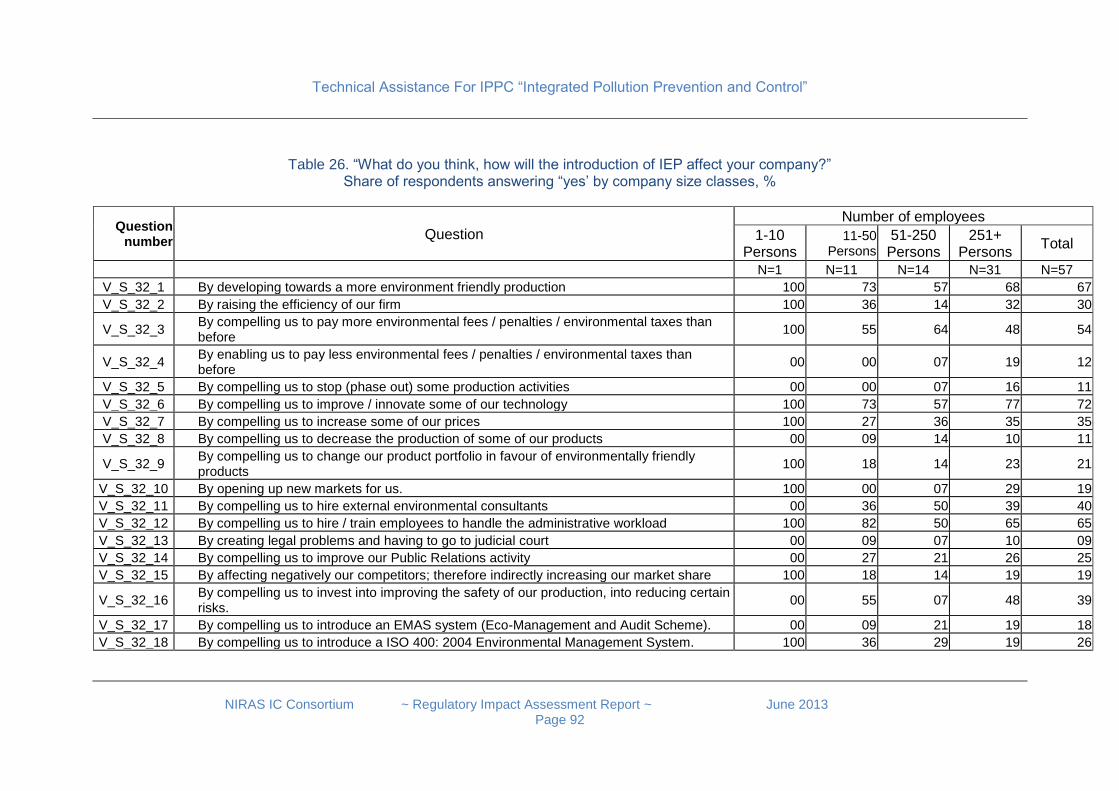
Technical Assistance For IPPC “Integrated Pollution Prevention and Control”
NIRAS IC Consortium ~ Regulatory Impact Assessment Report ~ June 2013
Page 92
Table 26. “What do you think, how will the introduction of IEP affect your company?” Share of respondents answering “yes’ by company size classes, %
Question number
Question
Number of employees
1-10 Persons
11-50 Persons
51-250 Persons
251+ Persons
Total
N=1 N=11 N=14 N=31 N=57
V_S_32_1 By developing towards a more environment friendly production 100 73 57 68 67
V_S_32_2 By raising the efficiency of our firm 100 36 14 32 30
V_S_32_3 By compelling us to pay more environmental fees / penalties / environmental taxes than before
100 55 64 48 54
V_S_32_4 By enabling us to pay less environmental fees / penalties / environmental taxes than before
00 00 07 19 12
V_S_32_5 By compelling us to stop (phase out) some production activities 00 00 07 16 11
V_S_32_6 By compelling us to improve / innovate some of our technology 100 73 57 77 72
V_S_32_7 By compelling us to increase some of our prices 100 27 36 35 35
V_S_32_8 By compelling us to decrease the production of some of our products 00 09 14 10 11
V_S_32_9 By compelling us to change our product portfolio in favour of environmentally friendly products
100 18 14 23 21
V_S_32_10 By opening up new markets for us. 100 00 07 29 19
V_S_32_11 By compelling us to hire external environmental consultants 00 36 50 39 40
V_S_32_12 By compelling us to hire / train employees to handle the administrative workload 100 82 50 65 65
V_S_32_13 By creating legal problems and having to go to judicial court 00 09 07 10 09
V_S_32_14 By compelling us to improve our Public Relations activity 00 27 21 26 25
V_S_32_15 By affecting negatively our competitors; therefore indirectly increasing our market share 100 18 14 19 19
V_S_32_16 By compelling us to invest into improving the safety of our production, into reducing certain risks.
00 55 07 48 39
V_S_32_17 By compelling us to introduce an EMAS system (Eco-Management and Audit Scheme). 00 09 21 19 18
V_S_32_18 By compelling us to introduce a ISO 400: 2004 Environmental Management System. 100 36 29 19 26
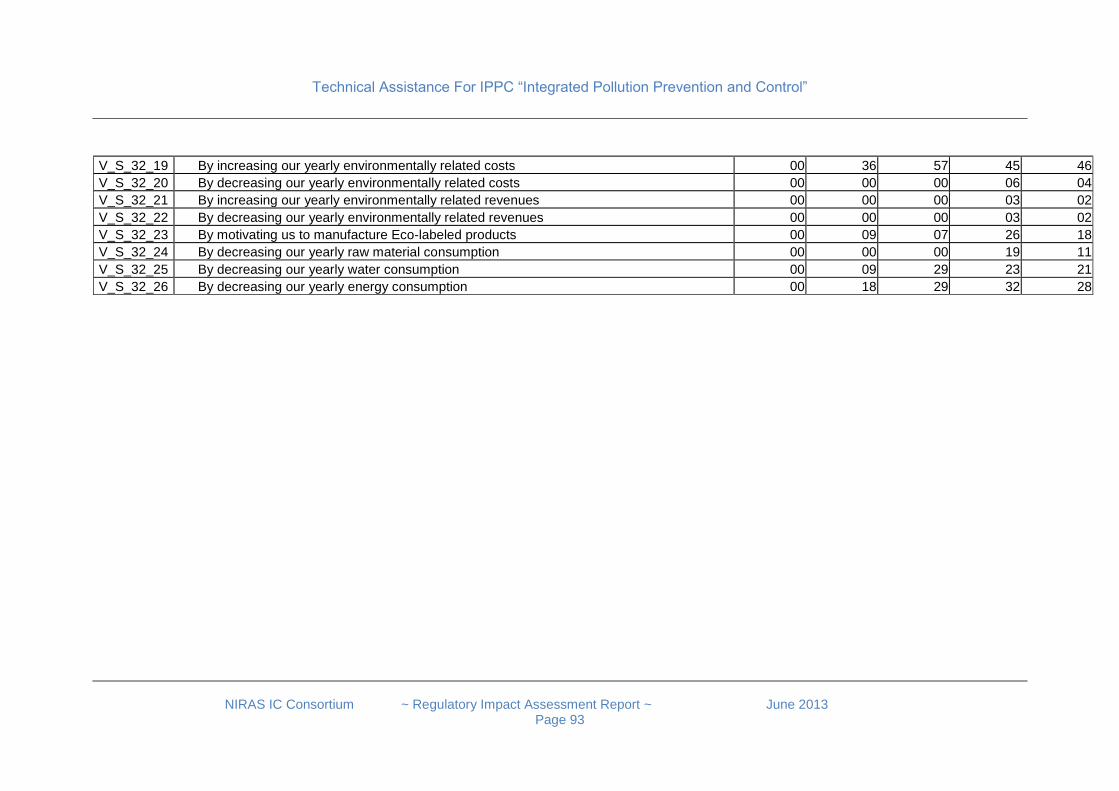
Technical Assistance For IPPC “Integrated Pollution Prevention and Control”
NIRAS IC Consortium ~ Regulatory Impact Assessment Report ~ June 2013
Page 93
V_S_32_19 By increasing our yearly environmentally related costs 00 36 57 45 46
V_S_32_20 By decreasing our yearly environmentally related costs 00 00 00 06 04
V_S_32_21 By increasing our yearly environmentally related revenues 00 00 00 03 02
V_S_32_22 By decreasing our yearly environmentally related revenues 00 00 00 03 02
V_S_32_23 By motivating us to manufacture Eco-labeled products 00 09 07 26 18
V_S_32_24 By decreasing our yearly raw material consumption 00 00 00 19 11
V_S_32_25 By decreasing our yearly water consumption 00 09 29 23 21
V_S_32_26 By decreasing our yearly energy consumption 00 18 29 32 28

Technical Assistance For IPPC “Integrated Pollution Prevention and Control”
NIRAS IC Consortium ~ Regulatory Impact Assessment Report ~ June 2013
Page 94
Questions -for Regulatory Consultation Q33. Do you have any recommendation for the Government as to the introduction of the Industrial Emissions Directive? Company representatives are highly interested to participate in the rule-making process. Frequencies:
Yes: 33 respondents
No: 23 respondents. The recommendations can be summarized according to the following issue groups.
Awareness raising, training. Many respondents have stressed the need for awareness raising, training and consultancy. Sectoral experts should introduce the stakeholders into the provisions of IED, BAT and BREF. All relevant documents should be translated into Turkish. Universities, vocational schools should be involved in the necessary training programmes. More pilot projects of best available techniques should be launched and the resulting “best practices” disseminated.
Transition time, gradual introduction. Another recurring topic was the need for a long transition period and the gradual transition to the Directive. The Ministry should not impose a uniform transition period for all industry, but rather the transition time should be determined on the basis of company size, technological situation and capacity.
IT and the practical implementation of the regulation. The Information Technology infrastructure of the MoEU should be developed in order to satisfy the needs of an increasing information flow between the Ministry and the companies.
Links to state support and to fiscal policy. The issue of environmental costs and incentives was raised by a wide group of respondents. Companies can meet higher environmental standards without compromising production, but need incentives. Incentives for older plants should have priority.
Links to competition policy. Competition policy issues were raised by a wide group of respondents. They stressed that IPPC / IED should be applied equally to all industry sectors. Fair implementation of the Regulation will not lead to unfair competition practices. Specific and targeted measures must be taken in order to prevent unfair competition. One respondent recommended that companies failing to obtain Integrated environmental permit should be excluded from state support for investments in technology and labor, and also from tax incentives.
Links to investment policy. Changes in regulations and implementation makes planning difficult for investors. Therefore regulatory policy should be based on a long term plan which should be well communicated to the stakeholders well in advance.
Table 27.
Q34. When, after how many years should Integrated Environmental Permitting be introduced?
Q35. How long should be the time given to companies for preparation?
Number of respondents
1 year 4 4
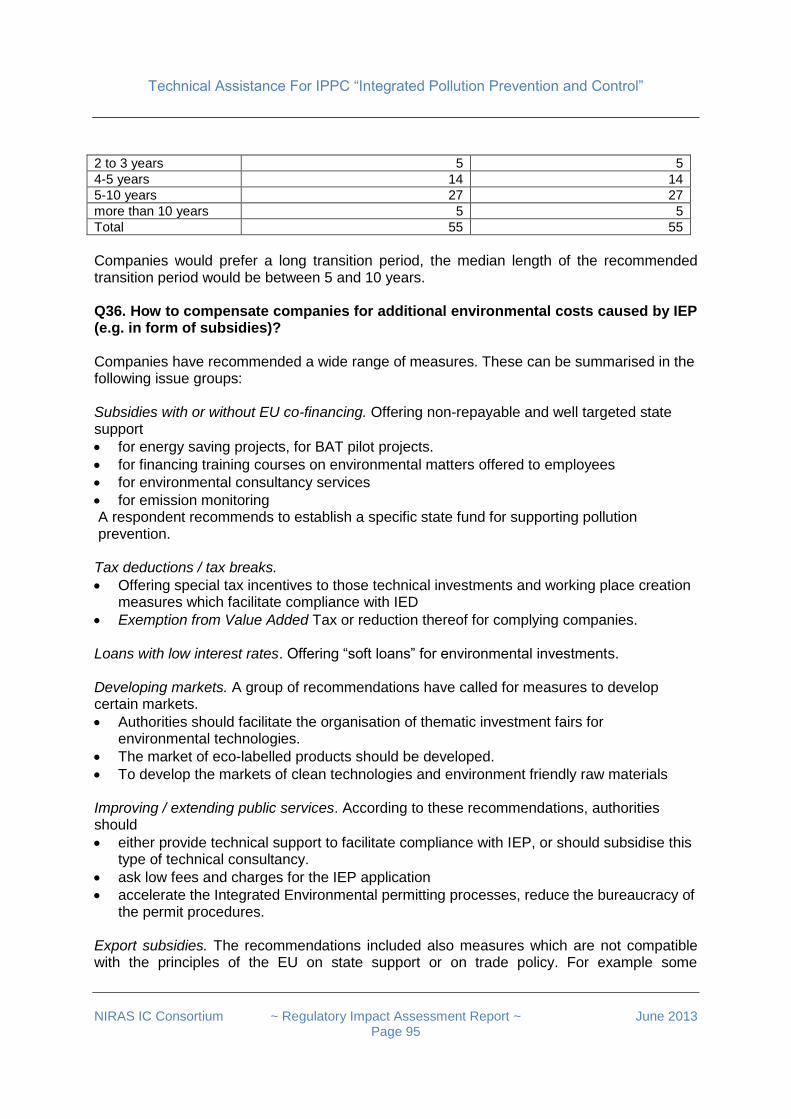
Technical Assistance For IPPC “Integrated Pollution Prevention and Control”
NIRAS IC Consortium ~ Regulatory Impact Assessment Report ~ June 2013
Page 95
2 to 3 years 5 5
4-5 years 14 14
5-10 years 27 27
more than 10 years 5 5
Total 55 55
Companies would prefer a long transition period, the median length of the recommended transition period would be between 5 and 10 years. Q36. How to compensate companies for additional environmental costs caused by IEP (e.g. in form of subsidies)? Companies have recommended a wide range of measures. These can be summarised in the following issue groups: Subsidies with or without EU co-financing. Offering non-repayable and well targeted state support
for energy saving projects, for BAT pilot projects.
for financing training courses on environmental matters offered to employees
for environmental consultancy services
for emission monitoring A respondent recommends to establish a specific state fund for supporting pollution prevention. Tax deductions / tax breaks.
Offering special tax incentives to those technical investments and working place creation measures which facilitate compliance with IED
Exemption from Value Added Tax or reduction thereof for complying companies. Loans with low interest rates. Offering “soft loans” for environmental investments. Developing markets. A group of recommendations have called for measures to develop certain markets.
Authorities should facilitate the organisation of thematic investment fairs for environmental technologies.
The market of eco-labelled products should be developed.
To develop the markets of clean technologies and environment friendly raw materials Improving / extending public services. According to these recommendations, authorities should
either provide technical support to facilitate compliance with IEP, or should subsidise this type of technical consultancy.
ask low fees and charges for the IEP application
accelerate the Integrated Environmental permitting processes, reduce the bureaucracy of the permit procedures.
Export subsidies. The recommendations included also measures which are not compatible with the principles of the EU on state support or on trade policy. For example some
Technical Assistance For IPPC “Integrated Pollution Prevention and Control”
NIRAS IC Consortium ~ Regulatory Impact Assessment Report ~ June 2013
Page 96
respondents would welcome incentives facilitating the export of products manufactured with environment-friendly technologies. Q37. What element / requirement of the Directive should be introduced gradually? As to the scheduling of the introduction of IPPC / IED, respondents have formulated various recommendations.
Graduality in requirements. BREFs and in particular the reduction of emission limit values should be introduced in consecutive stages, gradually. The schedule should be negotiated on a sector-by sector basis.
Which element of the environment should take precedence. Some respondents have expressed their opinion that introducing IPPC / IEP for wastewater, for ground water, for soil and for solid waste management is urgent. However, reducing emissions to air should be gradual.
Which activity of the public sector should be scheduled first. The information campaign for awareness raising for the preparation of Investments is urgent. Preparing guidelines take precedence. The establishment of incentive programs is urgent.
Public consultancy. All stages of the introduction should be accompanied by public consultation and by detailed studies, whereby efficiency-related factors should be taken into consideration. One respondent has added that gradual introduction is important, but without compromising the expected positive effects of IPPC / IED on human health.
Q38. What groups of companies should be preferred when giving compensation (e.g. in form of subsidies) or giving longer transition period? Respondents have differentiated among companies according to the following aspects.
By sector. Certain respondents thought that power plants, heavy industry and cement companies should be prioritized.
By age. Many respondents have expressed the opinion that old companies should be given more time and more facilitation, whereas for new companies the regulation should be applied immediately.
By impact on global warming. One respondent thinks that special attention and facilitation should be devoted to the environmental performance of all industries affecting .global warming.
By competitiveness. For many Turkish companies cheap energy is the key to competitiveness in European and other markets. One respondent would like keep low energy prices and improved environmental performance as a dual priority.
By level of pollution. Others recommended that the adaptation of companies with the highest pollution load should be facilitated with a priority.
By environmental performance. Companies with clean technologies, with energy / water saving processes and with eco-labelled products should be supported.
By ownership. Publicly owned companies, municipal holdings and industrial zones (OSB) should be given special attention.
Technical Assistance For IPPC “Integrated Pollution Prevention and Control”
NIRAS IC Consortium ~ Regulatory Impact Assessment Report ~ June 2013
Page 97
Econometric calculation of costs to industry166
Baseline In this Chapter, a Cost Analysis of the impacts on the Industrial Sector in terms of investment costs and recurring Operation & Maintenance costs has been performed using macro-economic econometric modelling techniques. The objective is to estimate -from a National Perspective- the cost to Industry of Implementing the IPPC/IED Directive, and-more specifically- to contribute to the Regulatory Impact Analysis the following:
The Costs of implementing the Heavy Investment Directives contained in the IED;
Establish a time frame for implementation within the affordability constraints of Turkish Industry and the Turkish Public who will have to absorb the costs.
There are two broad methods employed to estimate Regulatory Impact;
The bottom to top approach. This consists in an extrapolation of costs based on collected
data through surveys and general cost references. The partial database thus established
is then extrapolated to the whole of the Industrial sector concerned;
The top to bottom approach, or macro-econometric analysis. In this case impacts are
estimated on the basis of pollutants to be removed or populations to be served by new or
improved standards and Unit Costs derived from domestic and international references.
The bottom to top approach is generally employed when extensive data is available and the directive being evaluated impacts on a specific sector with a limited number of industries. Its strength lies in being an industry sourced estimate with partial hard data derived from the operators. Its weakness lies in that the extrapolation exercise may cause a large magnitude of error if the core data is insufficient, not representative or has been derived from a reference base that differs widely from the idiosyncratic conditions prevailing in the beneficiary region/country. The top to bottom, macro-econometric approach is employed when the directives evaluated are complex, have a wide reaching impact and, especially, affect the population significantly and must be timed so as not to exceed affordability thresholds.
In the case of IED, with a very complex impact on the population through interactive emissions to Air, water and through solid waste accumulation, which have a direct and harmful impact on health and for which abatement costs will primarily be cost recovered through the public via tariff increases (for waste, water, electricity) and increases in the costs of affected products, (cement, petrol, chemical products), the macro-econometric approach is essential.
166
This Chapter provided by Mr Carlos Cisneros, STE Economics, May, 2013
Technical Assistance For IPPC “Integrated Pollution Prevention and Control”
NIRAS IC Consortium ~ Regulatory Impact Assessment Report ~ June 2013
Page 98
In this RIA, in fact, both approaches have been employed, the macro for the heavy investment directives and the micro with a complementary survey, to gather more specific qualitative information and to complement the gaps and better define the macro national level approach. The Model Tools developed for the macro-econometric exercise have been applied to each area of Emissions individually. Thus there are three major models:
1. Emissions to Air (including those arising from Large Combustion Plants, the Cement
Industry, VOCs)
2. Emissions to Water of the Industrial sector;
3. Solid Waste (mainly the Landfill Directive)
The results of the modelling tools are presented in a multi-annual cost stream that permits linking such a cost stream to the affordability thresholds. This, in turn, ensures that the implementation of IED does not:
Establish a non Feasible Time-frame that implies that Operating costs are greater than
maximum affordability, i.e. that maximum cost recovery is insufficient to cover Operating
Expenses.
That significant cross-subsidization from other Environmental Sectors is required, which
would compromise heavily a necessarily harmonic implementation, given the interactive
nature of Environment.
These factors must be taken into account in order to elaborate a feasible, credible national policy.
Description of the methodology
Scope and methodology
The implementation of the complex IED, implies a range of additional costs and benefits for the economy of Turkey. Both the costs and benefits of such implementation are evaluated in this RIA. The evaluation of Costs has been performed in two stages: 1) A preliminary analysis based on the existing budgets of various institutions, especially
those for the Heavy Directives, which have been made available. The Turkstat databases have been extensively used to establish the present situation and to adapt international references where applicable to Turkish conditions. This initial estimate provided a baseline figure that enabled the project team to establish the framework for the more elaborate Emissions cost analysis performed. This “baseline scenario” derived from existing information also enabled the project team to perform an overall macroeconomic analysis so as to establish the timeframes required for full transposition of the directives contained in the Acquis from the investment point of view, relating subsequently those investment needs to Operating Costs and Turkey´s financial and economic capacities.
Technical Assistance For IPPC “Integrated Pollution Prevention and Control”
NIRAS IC Consortium ~ Regulatory Impact Assessment Report ~ June 2013
Page 99
2) A national evaluation of the abatement costs of the emissions in the three areas indicated.
The starting point of these analyses was 1) above and the procedure, basically, involves:
Evaluating in depth the existing sector cost figures to ascertain the methodology of the cost estimates already performed ;
Preparation of a matrix of Unit Costs that was derived from the baseline scenario and, by default, in those cases where specific to Turkey unit costs could not be obtained, “project best estimates” based on conditions in Turkey and the experience of the key and senior experts in the various transition economies in which they have performed this type of analyses.
This information was collected and input, together with a vast array of necessary assumptions and sector specific parameters which are summarized elsewhere in this report, into a simplified but integral calculation Model.
The evaluation of Benefits was performed subsequent to the Cost Analyses, in accordance with common logic and with the ToR. This evaluation was done on the basis of the existing methodology developed by the EU Commission for the Cost-Benefit Analyses of Large Infrastructure Projects. This methodology can be readily applied to the Benefits calculation as it is mostly population driven. This has the following advantages:
The Analytical tool is fully consistent with that used for the evaluation of all projects to be presented to the EU and to the IFIs.
The same Economic Benefits Model Tool can be applied to any Sector, thus facilitating the task of establishing priorities on the basis of the benefits to society with a fully coherent evaluation methodology.
Timeframe
Transition Periods Full compliance with all aspects of the environmental acquis cannot be expected until the investments required under the heavy investment directives are completed. For this, as evidenced by experience in other transition countries, a period of about 20 years is required. In the RIA exercise a general time-frame is indicated, as this is a very limited exercise regarding time resources. Subsequently, when fine-tuning for the Sector and Directive-specific implementation plans, more accurate transition periods will need to be calculated with more detailed inputs being obtained on account of progress in the collection of data and improvements in the databases and further definition of policy.
Definition of Costs
General Concepts The costs of implementing the IED are wide-ranging and will result, basically, from:
1. the increased administrative burden;
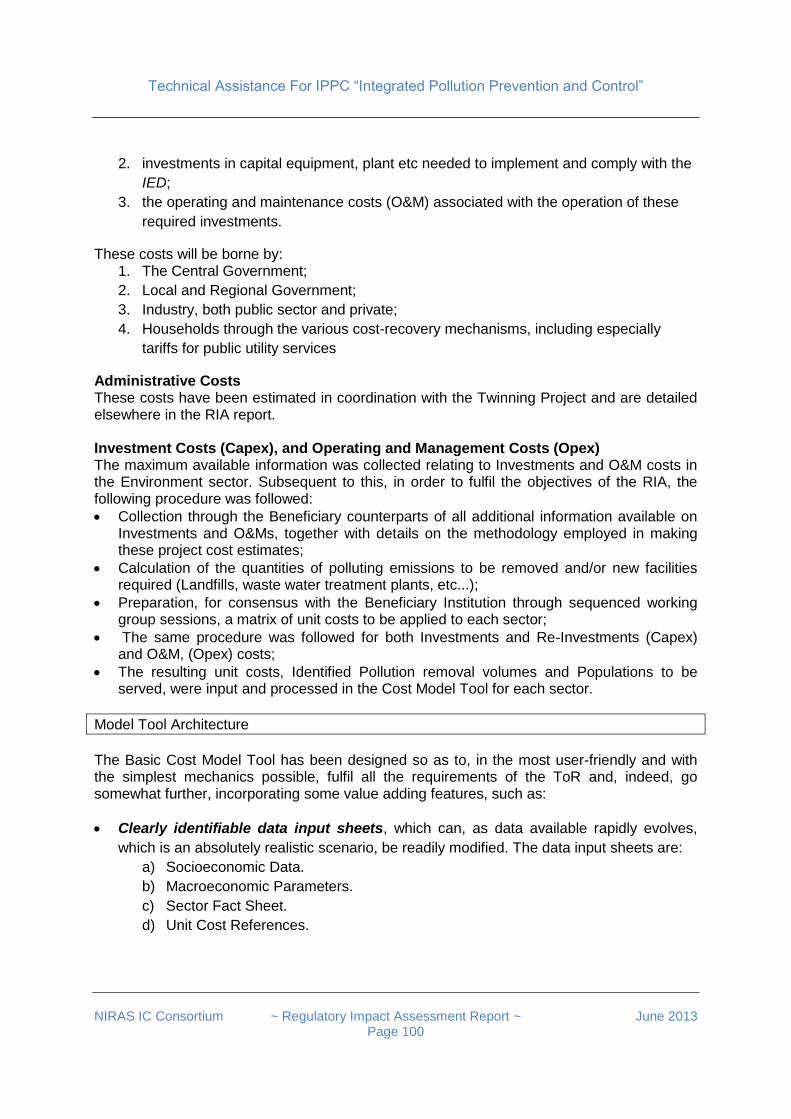
Technical Assistance For IPPC “Integrated Pollution Prevention and Control”
NIRAS IC Consortium ~ Regulatory Impact Assessment Report ~ June 2013
Page 100
2. investments in capital equipment, plant etc needed to implement and comply with the
IED;
3. the operating and maintenance costs (O&M) associated with the operation of these
required investments.
These costs will be borne by: 1. The Central Government;
2. Local and Regional Government;
3. Industry, both public sector and private;
4. Households through the various cost-recovery mechanisms, including especially
tariffs for public utility services
Administrative Costs These costs have been estimated in coordination with the Twinning Project and are detailed elsewhere in the RIA report. Investment Costs (Capex), and Operating and Management Costs (Opex) The maximum available information was collected relating to Investments and O&M costs in the Environment sector. Subsequent to this, in order to fulfil the objectives of the RIA, the following procedure was followed:
Collection through the Beneficiary counterparts of all additional information available on Investments and O&Ms, together with details on the methodology employed in making these project cost estimates;
Calculation of the quantities of polluting emissions to be removed and/or new facilities required (Landfills, waste water treatment plants, etc...);
Preparation, for consensus with the Beneficiary Institution through sequenced working group sessions, a matrix of unit costs to be applied to each sector;
The same procedure was followed for both Investments and Re-Investments (Capex) and O&M, (Opex) costs;
The resulting unit costs, Identified Pollution removal volumes and Populations to be served, were input and processed in the Cost Model Tool for each sector.
Model Tool Architecture
The Basic Cost Model Tool has been designed so as to, in the most user-friendly and with the simplest mechanics possible, fulfil all the requirements of the ToR and, indeed, go somewhat further, incorporating some value adding features, such as:
Clearly identifiable data input sheets, which can, as data available rapidly evolves,
which is an absolutely realistic scenario, be readily modified. The data input sheets are:
a) Socioeconomic Data.
b) Macroeconomic Parameters.
c) Sector Fact Sheet.
d) Unit Cost References.
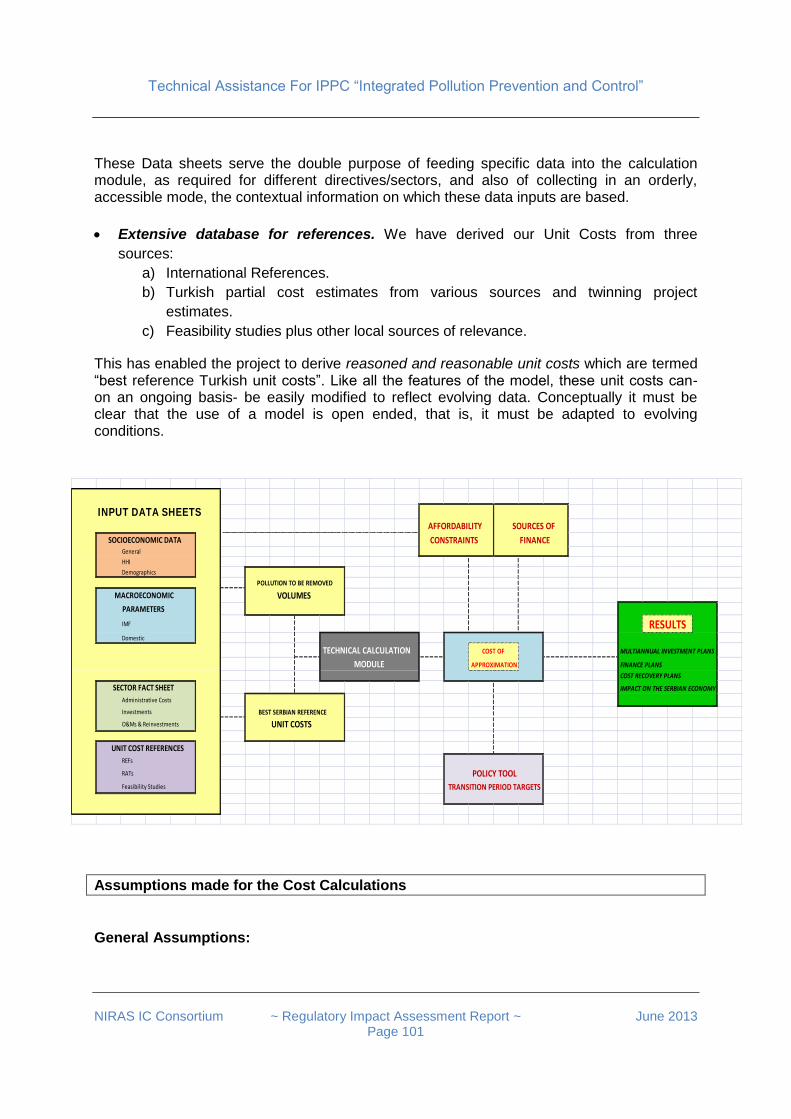
Technical Assistance For IPPC “Integrated Pollution Prevention and Control”
NIRAS IC Consortium ~ Regulatory Impact Assessment Report ~ June 2013
Page 101
These Data sheets serve the double purpose of feeding specific data into the calculation module, as required for different directives/sectors, and also of collecting in an orderly, accessible mode, the contextual information on which these data inputs are based.
Extensive database for references. We have derived our Unit Costs from three
sources:
a) International References.
b) Turkish partial cost estimates from various sources and twinning project
estimates.
c) Feasibility studies plus other local sources of relevance.
This has enabled the project to derive reasoned and reasonable unit costs which are termed “best reference Turkish unit costs”. Like all the features of the model, these unit costs can- on an ongoing basis- be easily modified to reflect evolving data. Conceptually it must be clear that the use of a model is open ended, that is, it must be adapted to evolving conditions.
INPUT DATA SHEETS AFFORDABILITY SOURCES OF
SOCIOECONOMIC DATA CONSTRAINTS FINANCEGeneral
HHI
Demographics
POLLUTION TO BE REMOVED
MACROECONOMIC VOLUMES
PARAMETERS
IMF RESULTSDomestic
TECHNICAL CALCULATION COST OF MULTIANNUAL INVESTMENT PLANS
MODULE APPROXIMATION FINANCE PLANS
COST RECOVERY PLANS
SECTOR FACT SHEET IMPACT ON THE SERBIAN ECONOMY
PARAMETERSAdministrative Costs
Investments BEST SERBIAN REFERENCE
O&Ms & Reinvestments UNIT COSTS
UNIT COST REFERENCES
PARAMETERSREFs
RATs POLICY TOOLFeasibility Studies TRANSITION PERIOD TARGETS
Assumptions made for the Cost Calculations
General Assumptions:
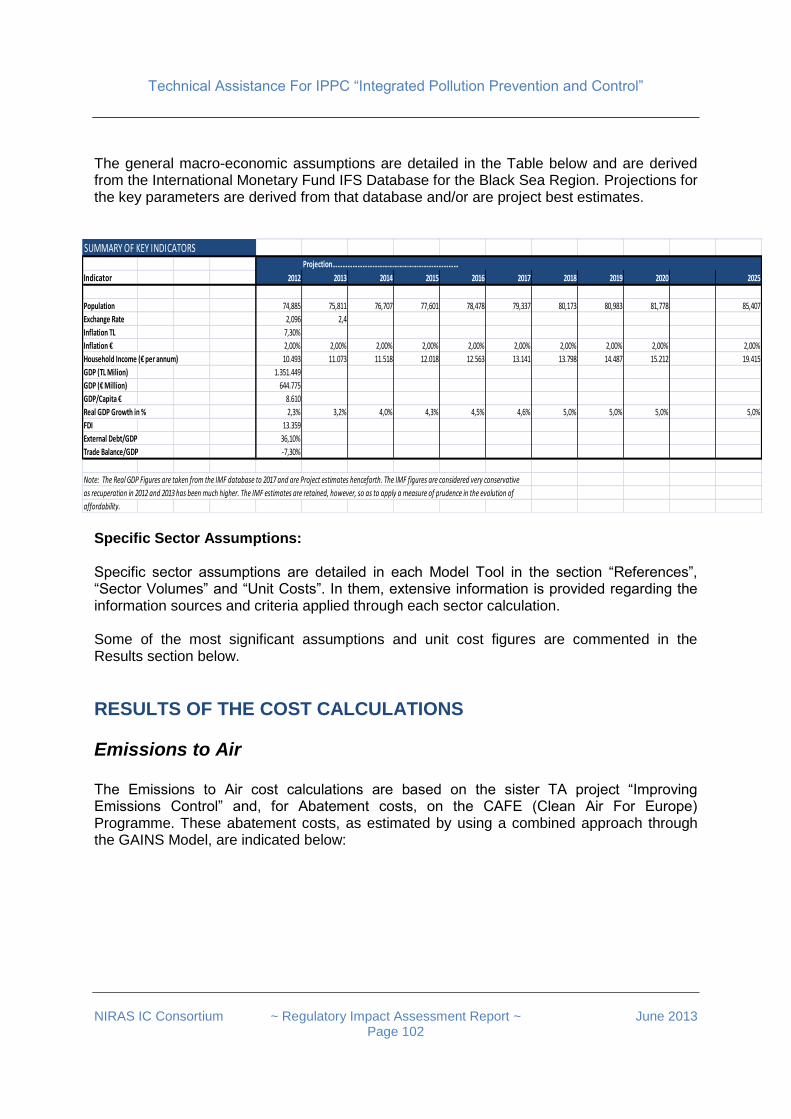
Technical Assistance For IPPC “Integrated Pollution Prevention and Control”
NIRAS IC Consortium ~ Regulatory Impact Assessment Report ~ June 2013
Page 102
The general macro-economic assumptions are detailed in the Table below and are derived from the International Monetary Fund IFS Database for the Black Sea Region. Projections for the key parameters are derived from that database and/or are project best estimates.
SUMMARY OF KEY INDICATORS
Projection…………………………………………………………………
Indicator 2012 2013 2014 2015 2016 2017 2018 2019 2020 2025
Population 74,885 75,811 76,707 77,601 78,478 79,337 80,173 80,983 81,778 85,407
Exchange Rate 2,096 2,4
Inflation TL 7,30%
Inflation € 2,00% 2,00% 2,00% 2,00% 2,00% 2,00% 2,00% 2,00% 2,00% 2,00%
Household Income (€ per annum) 10.493 11.073 11.518 12.018 12.563 13.141 13.798 14.487 15.212 19.415
GDP (TL Milion) 1.351.449
GDP (€ Million) 644.775
GDP/Capita € 8.610
Real GDP Growth in % 2,3% 3,2% 4,0% 4,3% 4,5% 4,6% 5,0% 5,0% 5,0% 5,0%
FDI 13.359
External Debt/GDP 36,10%
Trade Balance/GDP -7,30%
Note: The Real GDP Figures are taken from the IMF database to 2017 and are Project estimates henceforth. The IMF figures are considered very conservative
as recuperation in 2012 and 2013 has been much higher. The IMF estimates are retained, however, so as to apply a measure of prudence in the evolution of
affordability. Specific Sector Assumptions: Specific sector assumptions are detailed in each Model Tool in the section “References”, “Sector Volumes” and “Unit Costs”. In them, extensive information is provided regarding the information sources and criteria applied through each sector calculation. Some of the most significant assumptions and unit cost figures are commented in the Results section below.
RESULTS OF THE COST CALCULATIONS
Emissions to Air The Emissions to Air cost calculations are based on the sister TA project “Improving Emissions Control” and, for Abatement costs, on the CAFE (Clean Air For Europe) Programme. These abatement costs, as estimated by using a combined approach through the GAINS Model, are indicated below:
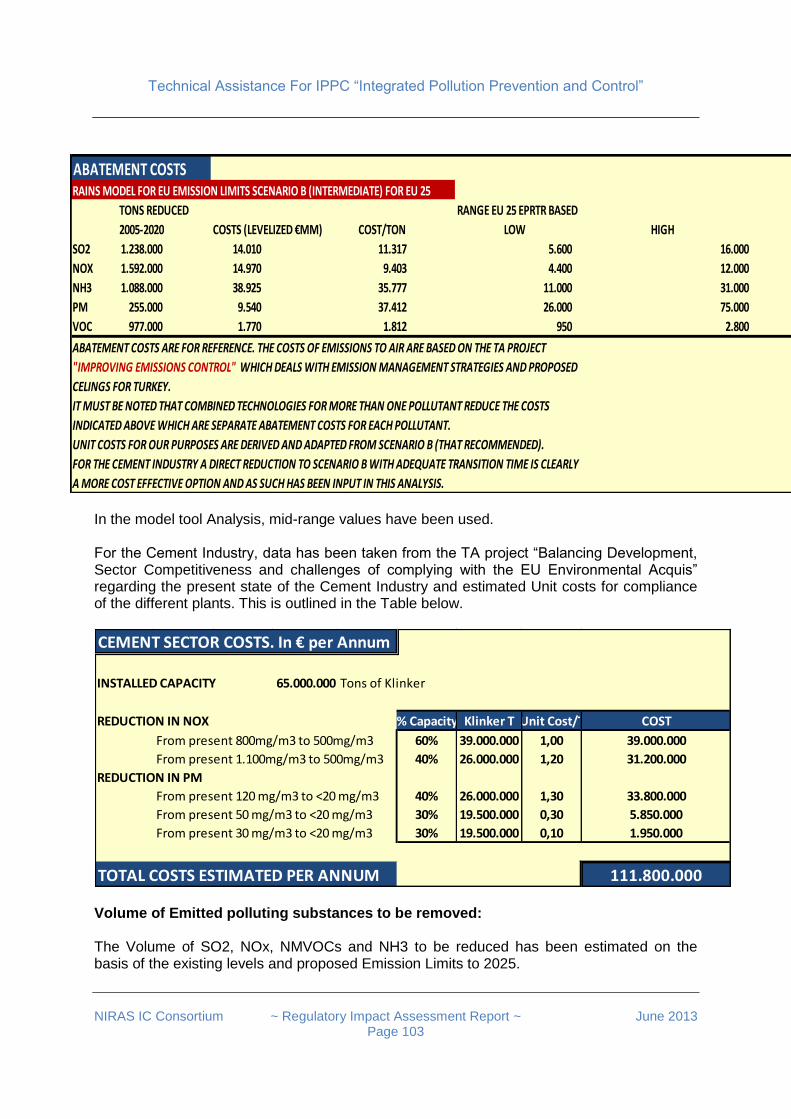
Technical Assistance For IPPC “Integrated Pollution Prevention and Control”
NIRAS IC Consortium ~ Regulatory Impact Assessment Report ~ June 2013
Page 103
ABATEMENT COSTS RAINS MODEL FOR EU EMISSION LIMITS SCENARIO B (INTERMEDIATE) FOR EU 25
TONS REDUCED RANGE EU 25 EPRTR BASED
2005-2020 COSTS (LEVELIZED €MM) COST/TON LOW HIGH
SO2 1.238.000 14.010 11.317 5.600 16.000
NOX 1.592.000 14.970 9.403 4.400 12.000
NH3 1.088.000 38.925 35.777 11.000 31.000
PM 255.000 9.540 37.412 26.000 75.000
VOC 977.000 1.770 1.812 950 2.800
ABATEMENT COSTS ARE FOR REFERENCE. THE COSTS OF EMISSIONS TO AIR ARE BASED ON THE TA PROJECT
"IMPROVING EMISSIONS CONTROL" WHICH DEALS WITH EMISSION MANAGEMENT STRATEGIES AND PROPOSED
CELINGS FOR TURKEY.
IT MUST BE NOTED THAT COMBINED TECHNOLOGIES FOR MORE THAN ONE POLLUTANT REDUCE THE COSTS
INDICATED ABOVE WHICH ARE SEPARATE ABATEMENT COSTS FOR EACH POLLUTANT.
UNIT COSTS FOR OUR PURPOSES ARE DERIVED AND ADAPTED FROM SCENARIO B (THAT RECOMMENDED).
FOR THE CEMENT INDUSTRY A DIRECT REDUCTION TO SCENARIO B WITH ADEQUATE TRANSITION TIME IS CLEARLY
A MORE COST EFFECTIVE OPTION AND AS SUCH HAS BEEN INPUT IN THIS ANALYSIS. In the model tool Analysis, mid-range values have been used. For the Cement Industry, data has been taken from the TA project “Balancing Development, Sector Competitiveness and challenges of complying with the EU Environmental Acquis” regarding the present state of the Cement Industry and estimated Unit costs for compliance of the different plants. This is outlined in the Table below.
CEMENT SECTOR COSTS. In € per Annum
INSTALLED CAPACITY 65.000.000 Tons of Klinker
REDUCTION IN NOX % Capacity Klinker T Unit Cost/T COST
From present 800mg/m3 to 500mg/m3 60% 39.000.000 1,00 39.000.000
From present 1.100mg/m3 to 500mg/m3 40% 26.000.000 1,20 31.200.000
REDUCTION IN PM
From present 120 mg/m3 to <20 mg/m3 40% 26.000.000 1,30 33.800.000
From present 50 mg/m3 to <20 mg/m3 30% 19.500.000 0,30 5.850.000
From present 30 mg/m3 to <20 mg/m3 30% 19.500.000 0,10 1.950.000
TOTAL COSTS ESTIMATED PER ANNUM 111.800.000 Volume of Emitted polluting substances to be removed: The Volume of SO2, NOx, NMVOCs and NH3 to be reduced has been estimated on the basis of the existing levels and proposed Emission Limits to 2025.
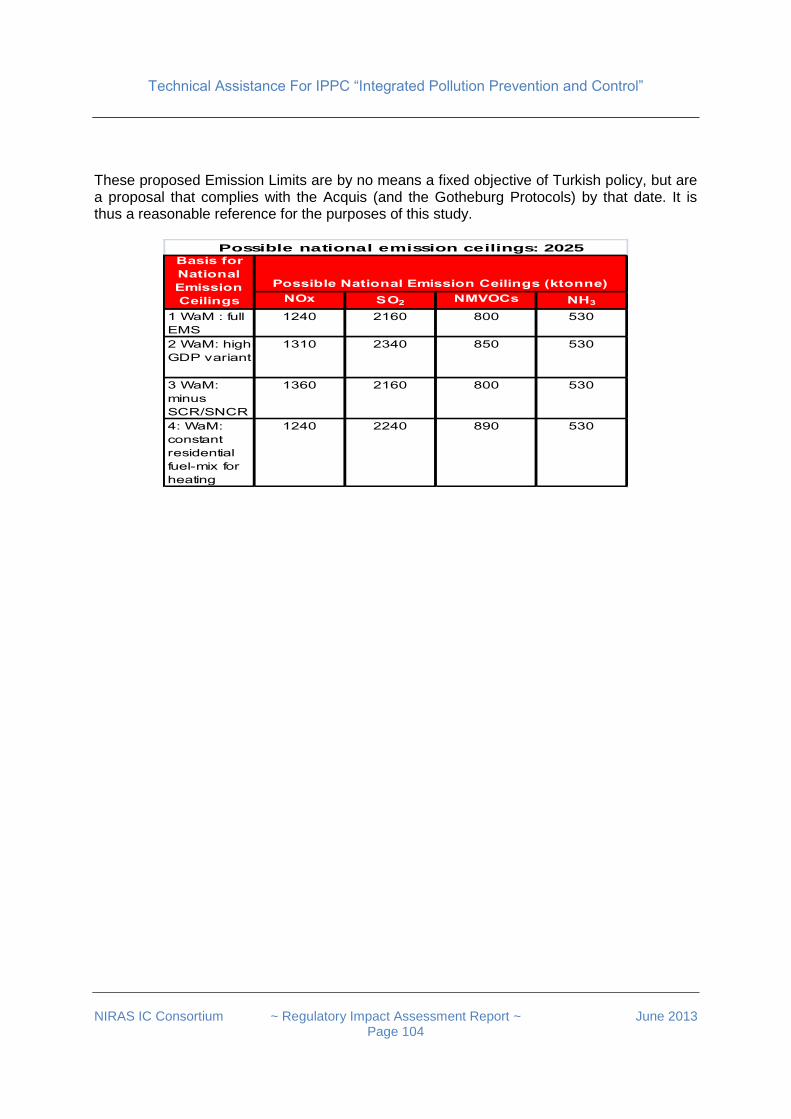
Technical Assistance For IPPC “Integrated Pollution Prevention and Control”
NIRAS IC Consortium ~ Regulatory Impact Assessment Report ~ June 2013
Page 104
These proposed Emission Limits are by no means a fixed objective of Turkish policy, but are a proposal that complies with the Acquis (and the Gotheburg Protocols) by that date. It is thus a reasonable reference for the purposes of this study.
Possible national emission ceilings: 2025
NOx SO2 NMVOCs NH3
1 WaM : full
EMS
1240 2160 800 530
2 WaM: high
GDP variant
1310 2340 850 530
3 WaM:
minus
SCR/SNCR
1360 2160 800 530
4: WaM:
constant
residential
fuel-mix for
heating
1240 2240 890 530
Basis for
National
Emission
Ceilings
Possible National Emission Ceilings (ktonne)
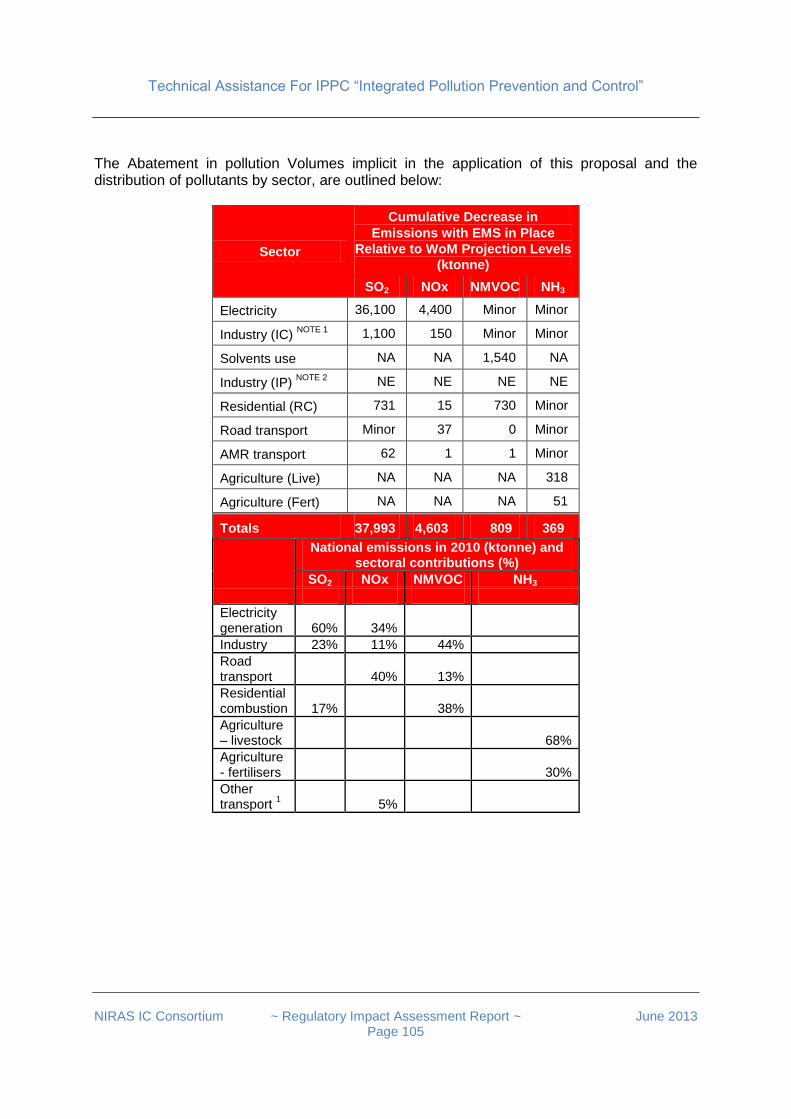
Technical Assistance For IPPC “Integrated Pollution Prevention and Control”
NIRAS IC Consortium ~ Regulatory Impact Assessment Report ~ June 2013
Page 105
The Abatement in pollution Volumes implicit in the application of this proposal and the distribution of pollutants by sector, are outlined below:
Sector
Cumulative Decrease in
Emissions with EMS in Place
Relative to WoM Projection Levels
(ktonne)
SO2 NOx NMVOC NH3
Electricity 36,100 4,400 Minor Minor
Industry (IC) NOTE 1
1,100 150 Minor Minor
Solvents use NA NA 1,540 NA
Industry (IP) NOTE 2
NE NE NE NE
Residential (RC) 731 15 730 Minor
Road transport Minor 37 0 Minor
AMR transport 62 1 1 Minor
Agriculture (Live) NA NA NA 318
Agriculture (Fert) NA NA NA 51
Totals 37,993 4,603 809 369
National emissions in 2010 (ktonne) and sectoral contributions (%)
SO2 NOx NMVOC NH3
Electricity generation 60% 34%
Industry 23% 11% 44%
Road transport 40% 13%
Residential combustion 17% 38%
Agriculture – livestock 68%
Agriculture - fertilisers 30%
Other transport
1 5%
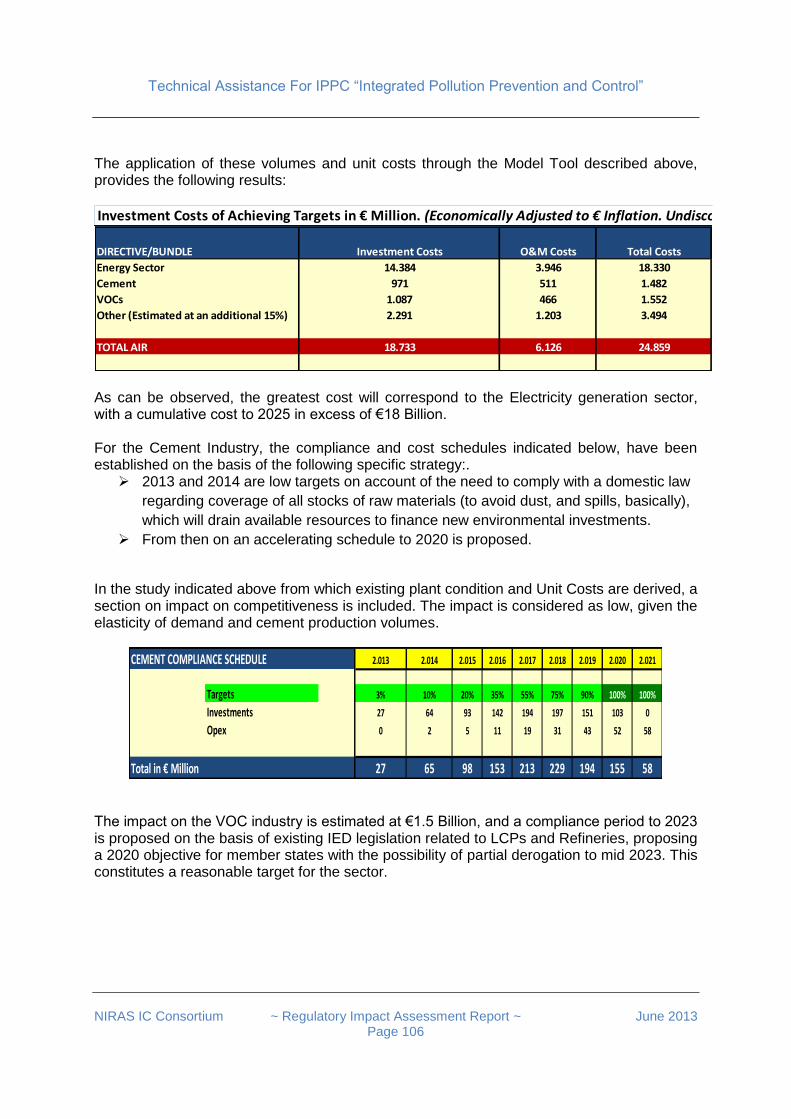
Technical Assistance For IPPC “Integrated Pollution Prevention and Control”
NIRAS IC Consortium ~ Regulatory Impact Assessment Report ~ June 2013
Page 106
The application of these volumes and unit costs through the Model Tool described above, provides the following results:
Investment Costs of Achieving Targets in € Million. (Economically Adjusted to € Inflation. Undiscounted)
DIRECTIVE/BUNDLE Investment Costs O&M Costs Total Costs
Energy Sector 14.384 3.946 18.330
Cement 971 511 1.482
VOCs 1.087 466 1.552
Other (Estimated at an additional 15%) 2.291 1.203 3.494
TOTAL AIR 18.733 6.126 24.859
As can be observed, the greatest cost will correspond to the Electricity generation sector, with a cumulative cost to 2025 in excess of €18 Billion. For the Cement Industry, the compliance and cost schedules indicated below, have been established on the basis of the following specific strategy:.
2013 and 2014 are low targets on account of the need to comply with a domestic law
regarding coverage of all stocks of raw materials (to avoid dust, and spills, basically),
which will drain available resources to finance new environmental investments.
From then on an accelerating schedule to 2020 is proposed.
In the study indicated above from which existing plant condition and Unit Costs are derived, a section on impact on competitiveness is included. The impact is considered as low, given the elasticity of demand and cement production volumes.
CEMENT COMPLIANCE SCHEDULE 2.013 2.014 2.015 2.016 2.017 2.018 2.019 2.020 2.021
Targets 3% 10% 20% 35% 55% 75% 90% 100% 100%
Investments 27 64 93 142 194 197 151 103 0
Opex 0 2 5 11 19 31 43 52 58
Total in € Million 27 65 98 153 213 229 194 155 58 The impact on the VOC industry is estimated at €1.5 Billion, and a compliance period to 2023 is proposed on the basis of existing IED legislation related to LCPs and Refineries, proposing a 2020 objective for member states with the possibility of partial derogation to mid 2023. This constitutes a reasonable target for the sector.
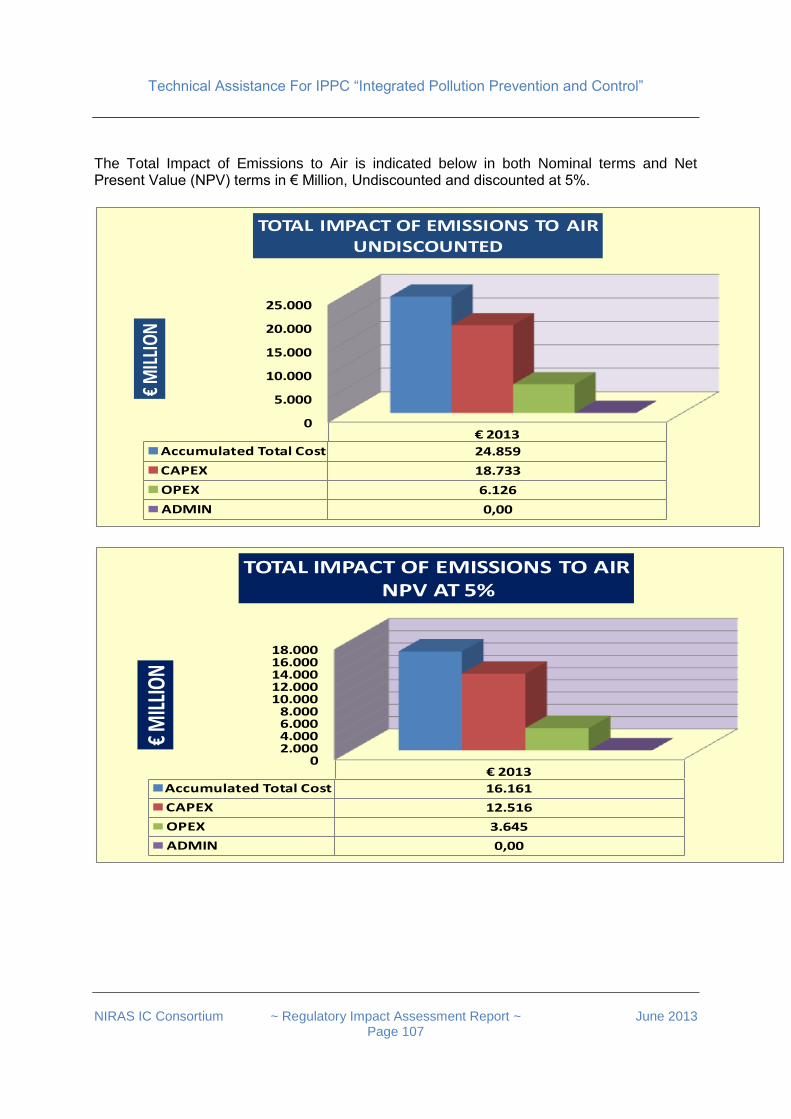
Technical Assistance For IPPC “Integrated Pollution Prevention and Control”
NIRAS IC Consortium ~ Regulatory Impact Assessment Report ~ June 2013
Page 107
The Total Impact of Emissions to Air is indicated below in both Nominal terms and Net Present Value (NPV) terms in € Million, Undiscounted and discounted at 5%.
0
5.000
10.000
15.000
20.000
25.000
€ 2013
Accumulated Total Cost 24.859
CAPEX 18.733
OPEX 6.126
ADMIN 0,00
€M
ILLI
ON
TOTAL IMPACT OF EMISSIONS TO AIR UNDISCOUNTED
02.0004.0006.0008.000
10.00012.00014.00016.00018.000
€ 2013
Accumulated Total Cost 16.161
CAPEX 12.516
OPEX 3.645
ADMIN 0,00
€M
ILLI
ON
TOTAL IMPACT OF EMISSIONS TO AIRNPV AT 5%
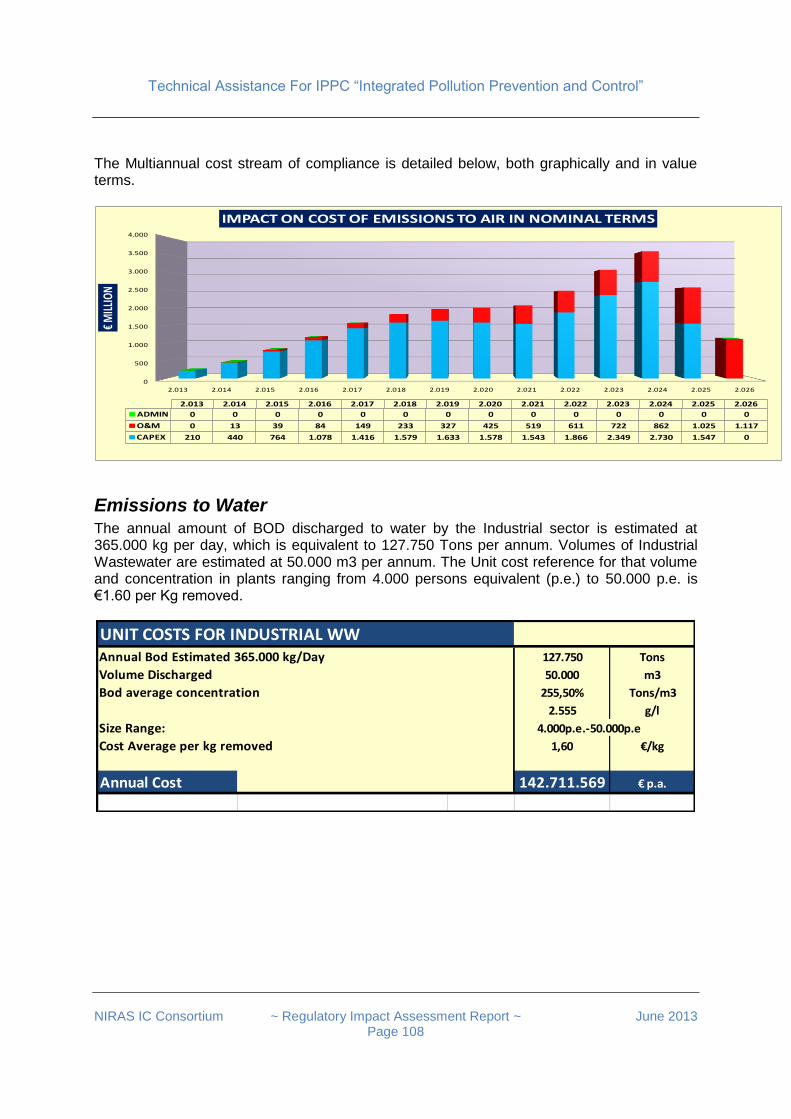
Technical Assistance For IPPC “Integrated Pollution Prevention and Control”
NIRAS IC Consortium ~ Regulatory Impact Assessment Report ~ June 2013
Page 108
The Multiannual cost stream of compliance is detailed below, both graphically and in value terms.
0
500
1.000
1.500
2.000
2.500
3.000
3.500
4.000
2.013 2.014 2.015 2.016 2.017 2.018 2.019 2.020 2.021 2.022 2.023 2.024 2.025 2.026
€M
ILLI
ON
2.013 2.014 2.015 2.016 2.017 2.018 2.019 2.020 2.021 2.022 2.023 2.024 2.025 2.026
ADMIN 0 0 0 0 0 0 0 0 0 0 0 0 0 0
O&M 0 13 39 84 149 233 327 425 519 611 722 862 1.025 1.117
CAPEX 210 440 764 1.078 1.416 1.579 1.633 1.578 1.543 1.866 2.349 2.730 1.547 0
IMPACT ON COST OF EMISSIONS TO AIR IN NOMINAL TERMS
Emissions to Water The annual amount of BOD discharged to water by the Industrial sector is estimated at 365.000 kg per day, which is equivalent to 127.750 Tons per annum. Volumes of Industrial Wastewater are estimated at 50.000 m3 per annum. The Unit cost reference for that volume and concentration in plants ranging from 4.000 persons equivalent (p.e.) to 50.000 p.e. is €1.60 per Kg removed.
UNIT COSTS FOR INDUSTRIAL WWAnnual Bod Estimated 365.000 kg/Day 127.750 Tons
Volume Discharged 50.000 m3
Bod average concentration 255,50% Tons/m3
2.555 g/l
Size Range: 4.000p.e.-50.000p.e
Cost Average per kg removed 1,60 €/kg
Annual Cost 142.711.569 € p.a.
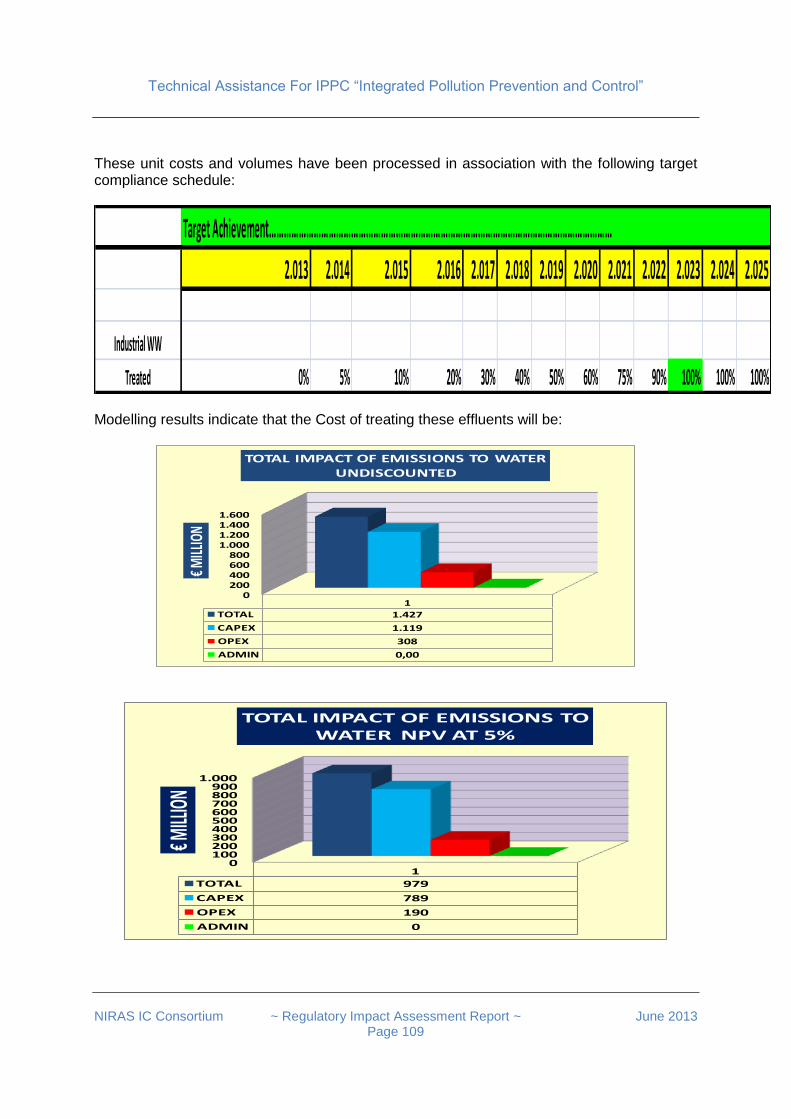
Technical Assistance For IPPC “Integrated Pollution Prevention and Control”
NIRAS IC Consortium ~ Regulatory Impact Assessment Report ~ June 2013
Page 109
These unit costs and volumes have been processed in association with the following target compliance schedule:
Target Achievement…………………………………………………………………………………………………………………………
2.013 2.014 2.015 2.016 2.017 2.018 2.019 2.020 2.021 2.022 2.023 2.024 2.025
Industrial WW
Treated 0% 5% 10% 20% 30% 40% 50% 60% 75% 90% 100% 100% 100%
Modelling results indicate that the Cost of treating these effluents will be:
0200400600800
1.0001.2001.4001.600
1
TOTAL 1.427
CAPEX 1.119
OPEX 308
ADMIN 0,00
€MILL
ION
TOTAL IMPACT OF EMISSIONS TO WATER UNDISCOUNTED
0100200300400500600700800900
1.000
1
TOTAL 979
CAPEX 789
OPEX 190
ADMIN 0
€MILL
ION
TOTAL IMPACT OF EMISSIONS TO WATER NPV AT 5%
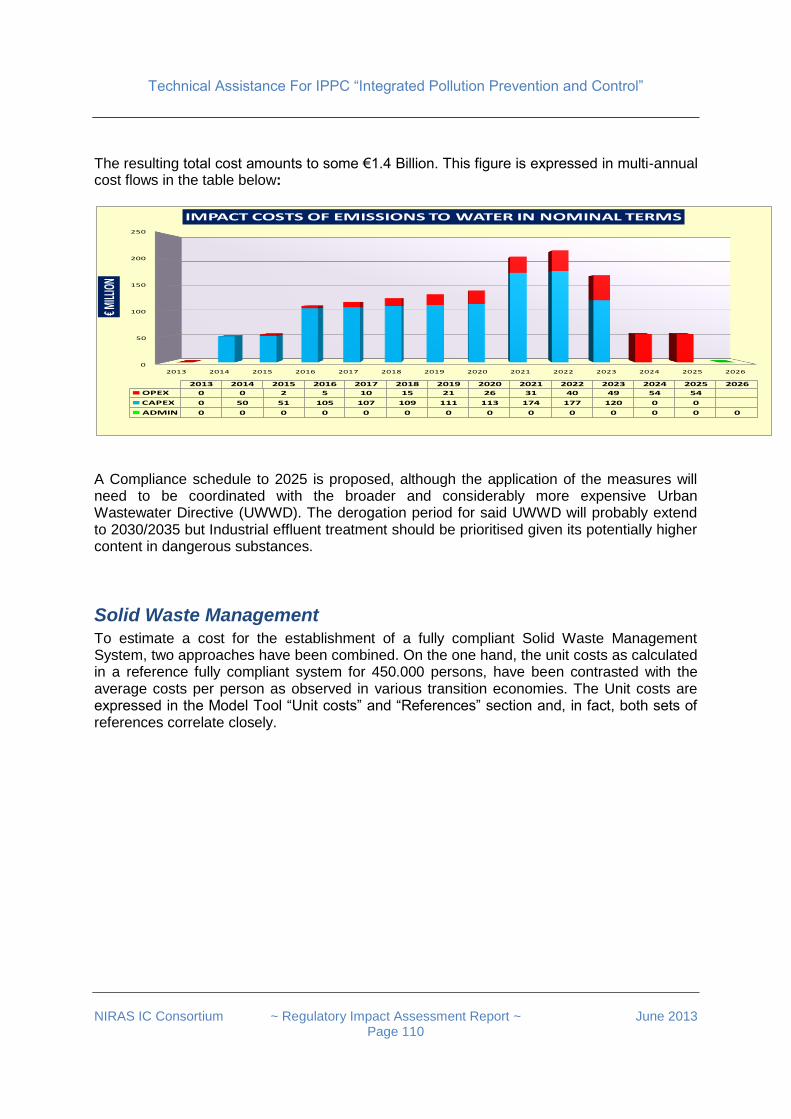
Technical Assistance For IPPC “Integrated Pollution Prevention and Control”
NIRAS IC Consortium ~ Regulatory Impact Assessment Report ~ June 2013
Page 110
The resulting total cost amounts to some €1.4 Billion. This figure is expressed in multi-annual cost flows in the table below:
0
50
100
150
200
250
2013 2014 2015 2016 2017 2018 2019 2020 2021 2022 2023 2024 2025 2026
€MILL
ION
2013 2014 2015 2016 2017 2018 2019 2020 2021 2022 2023 2024 2025 2026
OPEX 0 0 2 5 10 15 21 26 31 40 49 54 54
CAPEX 0 50 51 105 107 109 111 113 174 177 120 0 0
ADMIN 0 0 0 0 0 0 0 0 0 0 0 0 0 0
IMPACT COSTS OF EMISSIONS TO WATER IN NOMINAL TERMS
A Compliance schedule to 2025 is proposed, although the application of the measures will need to be coordinated with the broader and considerably more expensive Urban Wastewater Directive (UWWD). The derogation period for said UWWD will probably extend to 2030/2035 but Industrial effluent treatment should be prioritised given its potentially higher content in dangerous substances.
Solid Waste Management To estimate a cost for the establishment of a fully compliant Solid Waste Management System, two approaches have been combined. On the one hand, the unit costs as calculated in a reference fully compliant system for 450.000 persons, have been contrasted with the average costs per person as observed in various transition economies. The Unit costs are expressed in the Model Tool “Unit costs” and “References” section and, in fact, both sets of references correlate closely.
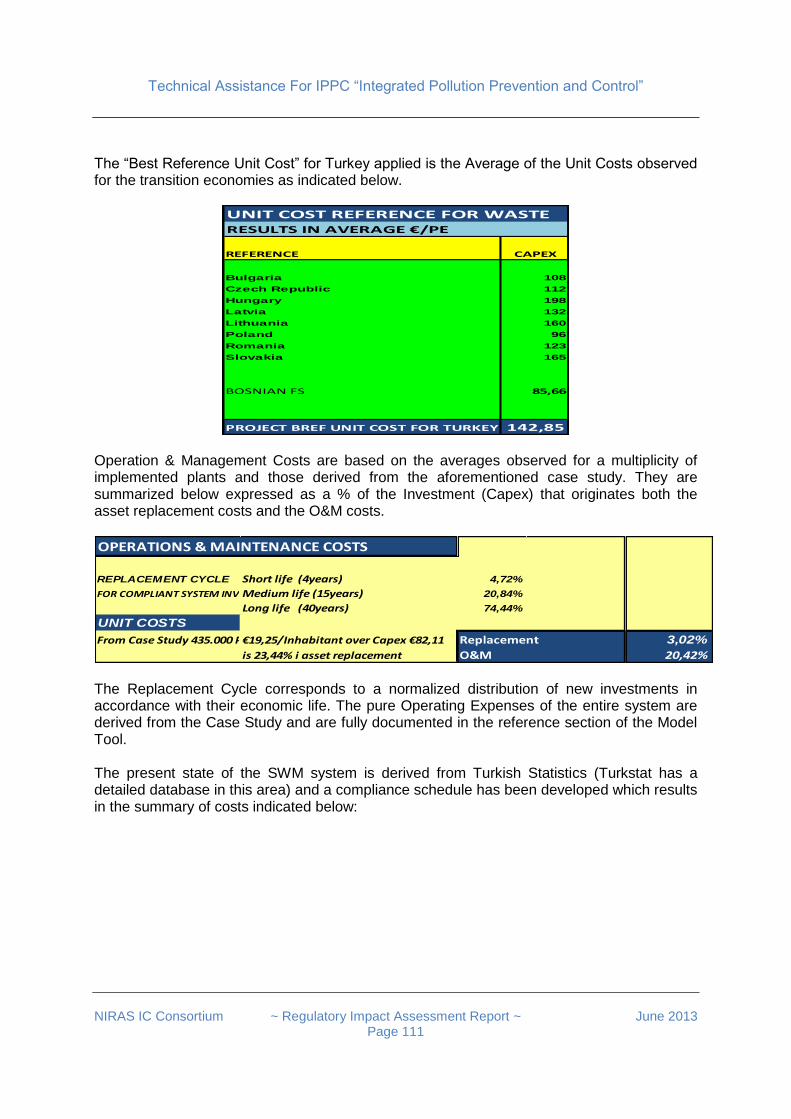
Technical Assistance For IPPC “Integrated Pollution Prevention and Control”
NIRAS IC Consortium ~ Regulatory Impact Assessment Report ~ June 2013
Page 111
The “Best Reference Unit Cost” for Turkey applied is the Average of the Unit Costs observed for the transition economies as indicated below.
UNIT COST REFERENCE FOR WASTERESULTS IN AVERAGE €/PE
REFERENCE CAPEX
Bulgaria 108
Czech Republic 112
Hungary 198
Latvia 132
Lithuania 160
Poland 96
Romania 123
Slovakia 165
BOSNIAN FS 85,66
PROJECT BREF UNIT COST FOR TURKEY 142,85 Operation & Management Costs are based on the averages observed for a multiplicity of implemented plants and those derived from the aforementioned case study. They are summarized below expressed as a % of the Investment (Capex) that originates both the asset replacement costs and the O&M costs.
OPERATIONS & MAINTENANCE COSTS
REPLACEMENT CYCLE Short life (4years) 4,72%
FOR COMPLIANT SYSTEM INVESTMENTSMedium life (15years) 20,84%
Long life (40years) 74,44%
UNIT COSTS
From Case Study 435.000 Pop Unit€19,25/Inhabitant over Capex €82,11 Replacement 3,02%
is 23,44% i asset replacement O&M 20,42% The Replacement Cycle corresponds to a normalized distribution of new investments in accordance with their economic life. The pure Operating Expenses of the entire system are derived from the Case Study and are fully documented in the reference section of the Model Tool. The present state of the SWM system is derived from Turkish Statistics (Turkstat has a detailed database in this area) and a compliance schedule has been developed which results in the summary of costs indicated below:

Technical Assistance For IPPC “Integrated Pollution Prevention and Control”
NIRAS IC Consortium ~ Regulatory Impact Assessment Report ~ June 2013
Page 112
COMPLIANCE TARGET 2.013 2.014 2.015 2.016 2.017 2.018 2.019 2.020 2.021 2.022 2.023 2.024 2.025
INHABITANTS SERVED 38.623.702 41.589.637 44.555.572 47.945.212 51.334.852 55.571.902 58.961.542 62.351.182 65.740.822 69.130.462 72.520.102 75.062.332 77.206.280
AS % POPULATION 52,00% 55,50% 59,00% 63,00% 67,00% 72,00% 76,00% 80,00% 84,00% 88,00% 92,00% 95,00% 97,53%
SUMMARY OF COSTS OF COMPLIANCE TO 2025. (€ MILLION)
2.013 2.014 2.015 2.016 2.017 2.018 2.019 2.020 2.021 2.022 2.023 2.024 2.025
INVESTMENTS (CAPEX) 312 432 441 514 524 668 545 556 567 579 590 452 388
OPERATING EXPENSES (OPEX) 0 75 178 297 436 584 778 947 1.127 1.319 1.523 1.740 1.923
ADMINISTRATIVE COSTS (ADMIN) 0 0 0 0 0 0 0 0 0 0 0 0 0
TOTAL COSTS 312 507 619 811 960 1.252 1.323 1.503 1.695 1.898 2.113 2.191 2.312 The total cost, in both Nominal and NPV terms, is expressed below:
0
5.000
10.000
15.000
20.000
€2013
Accumulated Total Cost 19.592
CAPEX 6.569
OPEX 13.023
ADMIN 0
€M
ILLI
ON
TOTAL IMPACT ON WASTE SECTOR UNDISCOUNTED
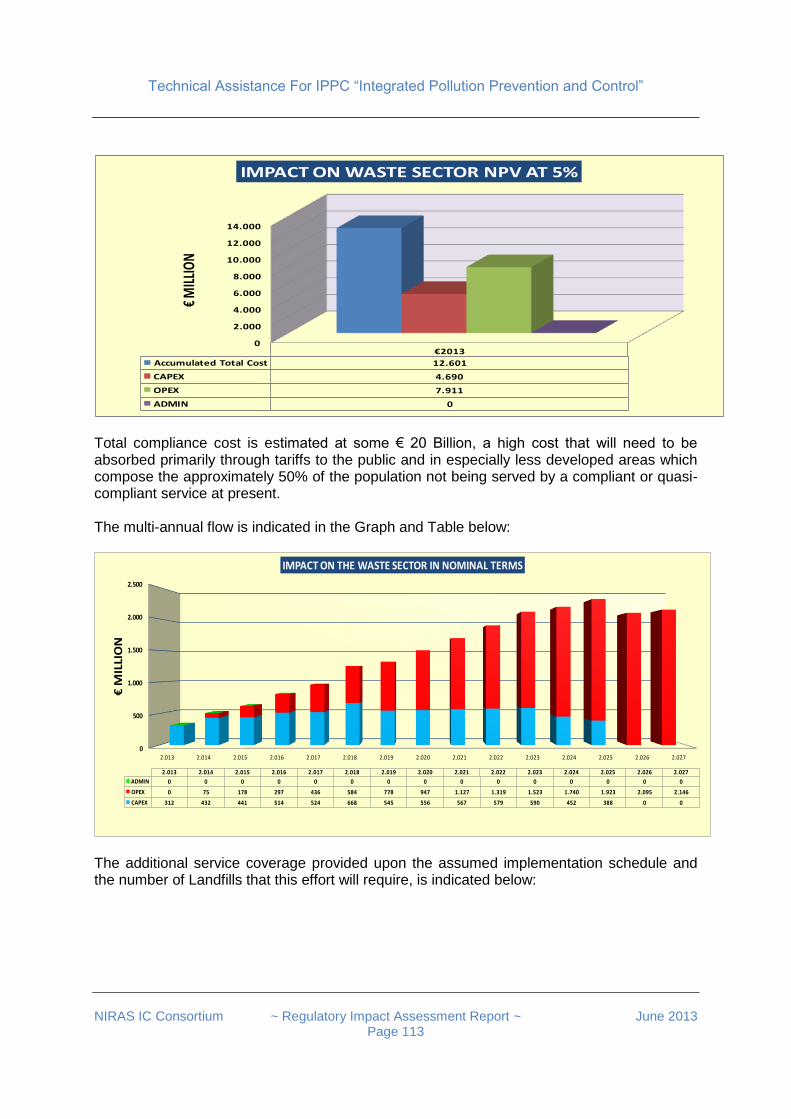
Technical Assistance For IPPC “Integrated Pollution Prevention and Control”
NIRAS IC Consortium ~ Regulatory Impact Assessment Report ~ June 2013
Page 113
0
2.000
4.000
6.000
8.000
10.000
12.000
14.000
€2013
Accumulated Total Cost 12.601
CAPEX 4.690
OPEX 7.911
ADMIN 0
€M
ILLI
ON
IMPACT ON WASTE SECTOR NPV AT 5%
Total compliance cost is estimated at some € 20 Billion, a high cost that will need to be absorbed primarily through tariffs to the public and in especially less developed areas which compose the approximately 50% of the population not being served by a compliant or quasi-compliant service at present. The multi-annual flow is indicated in the Graph and Table below:
0
500
1.000
1.500
2.000
2.500
2.013 2.014 2.015 2.016 2.017 2.018 2.019 2.020 2.021 2.022 2.023 2.024 2.025 2.026 2.027
€M
ILLI
ON
2.013 2.014 2.015 2.016 2.017 2.018 2.019 2.020 2.021 2.022 2.023 2.024 2.025 2.026 2.027
ADMIN 0 0 0 0 0 0 0 0 0 0 0 0 0 0 0
OPEX 0 75 178 297 436 584 778 947 1.127 1.319 1.523 1.740 1.923 2.095 2.146
CAPEX 312 432 441 514 524 668 545 556 567 579 590 452 388 0 0
IMPACT ON THE WASTE SECTOR IN NOMINAL TERMS
The additional service coverage provided upon the assumed implementation schedule and the number of Landfills that this effort will require, is indicated below:
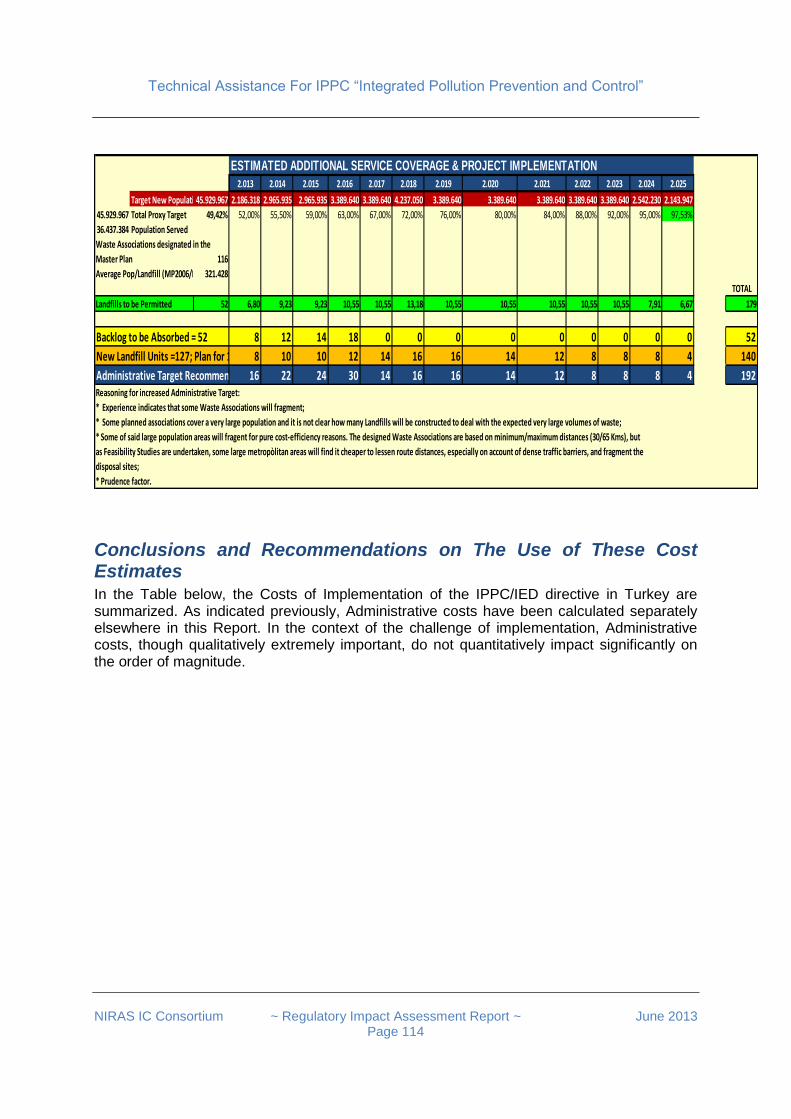
Technical Assistance For IPPC “Integrated Pollution Prevention and Control”
NIRAS IC Consortium ~ Regulatory Impact Assessment Report ~ June 2013
Page 114
ESTIMATED ADDITIONAL SERVICE COVERAGE & PROJECT IMPLEMENTATION
2.013 2.014 2.015 2.016 2.017 2.018 2.019 2.020 2.021 2.022 2.023 2.024 2.025
Target New Population45.929.967 2.186.318 2.965.935 2.965.935 3.389.640 3.389.640 4.237.050 3.389.640 3.389.640 3.389.640 3.389.640 3.389.640 2.542.230 2.143.947
45.929.967 Total Proxy Target 49,42% 52,00% 55,50% 59,00% 63,00% 67,00% 72,00% 76,00% 80,00% 84,00% 88,00% 92,00% 95,00% 97,53%
36.437.384 Population Served
Waste Associations designated in the
Master Plan 116
Average Pop/Landfill (MP2006/Pop2011)321.428
TOTAL
Landfills to be Permitted 52 6,80 9,23 9,23 10,55 10,55 13,18 10,55 10,55 10,55 10,55 10,55 7,91 6,67 179
Backlog to be Absorbed = 52 8 12 14 18 0 0 0 0 0 0 0 0 0 52
New Landfill Units =127; Plan for 140 8 10 10 12 14 16 16 14 12 8 8 8 4 140
Administrative Target Recommended 16 22 24 30 14 16 16 14 12 8 8 8 4 192Reasoning for increased Administrative Target:
* Experience indicates that some Waste Associations will fragment;
* Some planned associations cover a very large population and it is not clear how many Landfills will be constructed to deal with the expected very large volumes of waste;
* Some of said large population areas will fragent for pure cost-efficiency reasons. The designed Waste Associations are based on minimum/maximum distances (30/65 Kms), but
as Feasibility Studies are undertaken, some large metropòlitan areas will find it cheaper to lessen route distances, especially on account of dense traffic barriers, and fragment the
disposal sites;
* Prudence factor.
Conclusions and Recommendations on The Use of These Cost Estimates In the Table below, the Costs of Implementation of the IPPC/IED directive in Turkey are summarized. As indicated previously, Administrative costs have been calculated separately elsewhere in this Report. In the context of the challenge of implementation, Administrative costs, though qualitatively extremely important, do not quantitatively impact significantly on the order of magnitude.
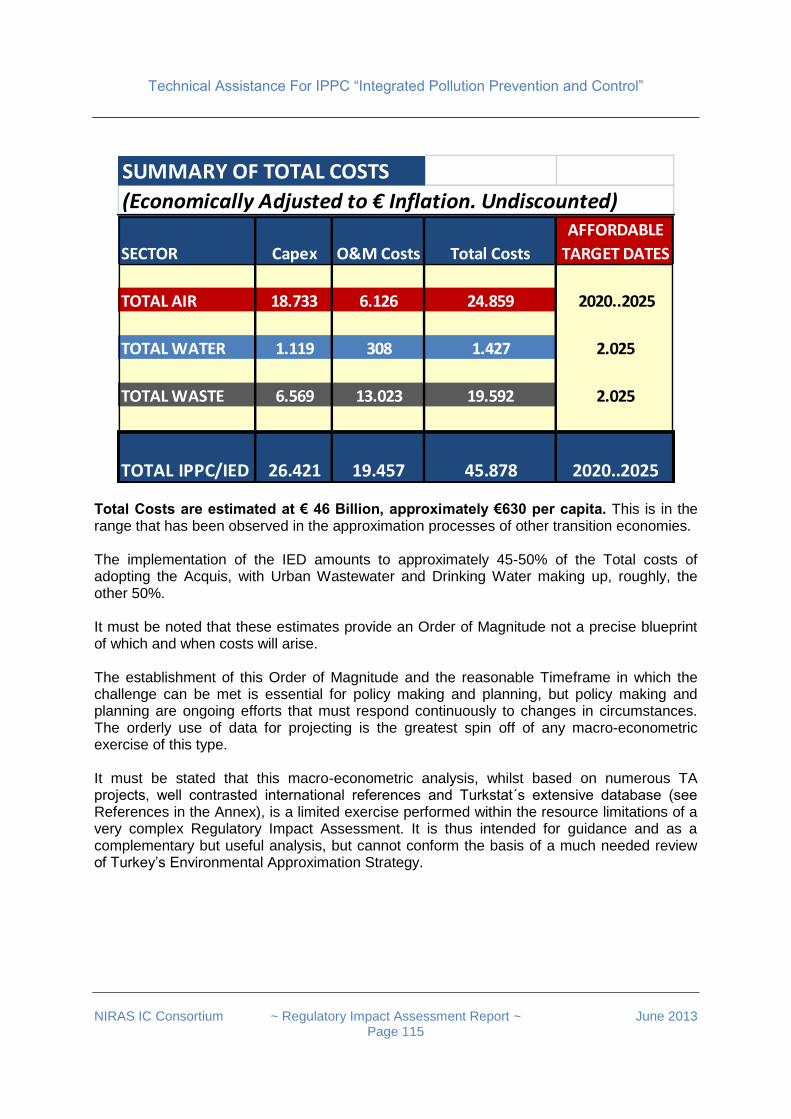
Technical Assistance For IPPC “Integrated Pollution Prevention and Control”
NIRAS IC Consortium ~ Regulatory Impact Assessment Report ~ June 2013
Page 115
SUMMARY OF TOTAL COSTS
(Economically Adjusted to € Inflation. Undiscounted)AFFORDABLE
SECTOR Capex O&M Costs Total Costs TARGET DATES
TOTAL AIR 18.733 6.126 24.859 2020..2025
TOTAL WATER 1.119 308 1.427 2.025
TOTAL WASTE 6.569 13.023 19.592 2.025
TOTAL IPPC/IED 26.421 19.457 45.878 2020..2025
Total Costs are estimated at € 46 Billion, approximately €630 per capita. This is in the range that has been observed in the approximation processes of other transition economies. The implementation of the IED amounts to approximately 45-50% of the Total costs of adopting the Acquis, with Urban Wastewater and Drinking Water making up, roughly, the other 50%. It must be noted that these estimates provide an Order of Magnitude not a precise blueprint of which and when costs will arise. The establishment of this Order of Magnitude and the reasonable Timeframe in which the challenge can be met is essential for policy making and planning, but policy making and planning are ongoing efforts that must respond continuously to changes in circumstances. The orderly use of data for projecting is the greatest spin off of any macro-econometric exercise of this type. It must be stated that this macro-econometric analysis, whilst based on numerous TA projects, well contrasted international references and Turkstat´s extensive database (see References in the Annex), is a limited exercise performed within the resource limitations of a very complex Regulatory Impact Assessment. It is thus intended for guidance and as a complementary but useful analysis, but cannot conform the basis of a much needed review of Turkey’s Environmental Approximation Strategy.
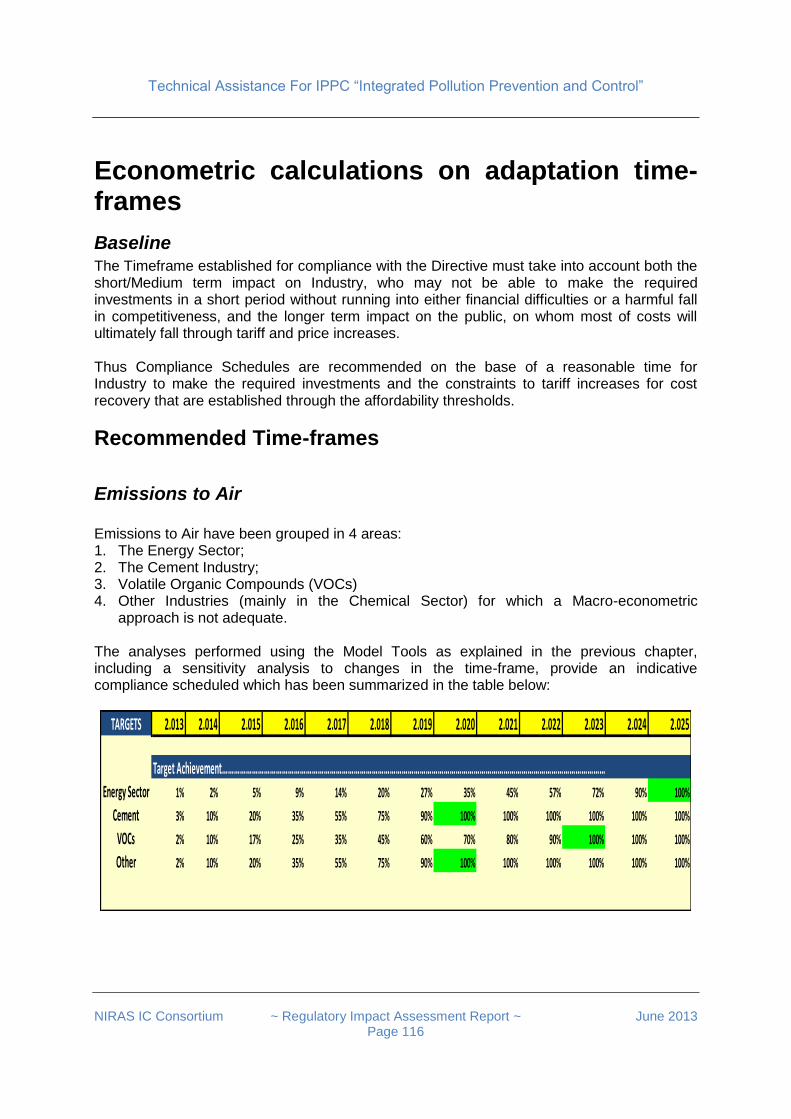
Technical Assistance For IPPC “Integrated Pollution Prevention and Control”
NIRAS IC Consortium ~ Regulatory Impact Assessment Report ~ June 2013
Page 116
Econometric calculations on adaptation time-frames
Baseline The Timeframe established for compliance with the Directive must take into account both the short/Medium term impact on Industry, who may not be able to make the required investments in a short period without running into either financial difficulties or a harmful fall in competitiveness, and the longer term impact on the public, on whom most of costs will ultimately fall through tariff and price increases. Thus Compliance Schedules are recommended on the base of a reasonable time for Industry to make the required investments and the constraints to tariff increases for cost recovery that are established through the affordability thresholds.
Recommended Time-frames
Emissions to Air Emissions to Air have been grouped in 4 areas: 1. The Energy Sector; 2. The Cement Industry; 3. Volatile Organic Compounds (VOCs) 4. Other Industries (mainly in the Chemical Sector) for which a Macro-econometric
approach is not adequate. The analyses performed using the Model Tools as explained in the previous chapter, including a sensitivity analysis to changes in the time-frame, provide an indicative compliance scheduled which has been summarized in the table below:
TARGETS 2.013 2.014 2.015 2.016 2.017 2.018 2.019 2.020 2.021 2.022 2.023 2.024 2.025
Target Achievement…………………………………………………………………………………………………………………………………………………………………………
Energy Sector 1% 2% 5% 9% 14% 20% 27% 35% 45% 57% 72% 90% 100%
Cement 3% 10% 20% 35% 55% 75% 90% 100% 100% 100% 100% 100% 100%
VOCs 2% 10% 17% 25% 35% 45% 60% 70% 80% 90% 100% 100% 100%
Other 2% 10% 20% 35% 55% 75% 90% 100% 100% 100% 100% 100% 100%
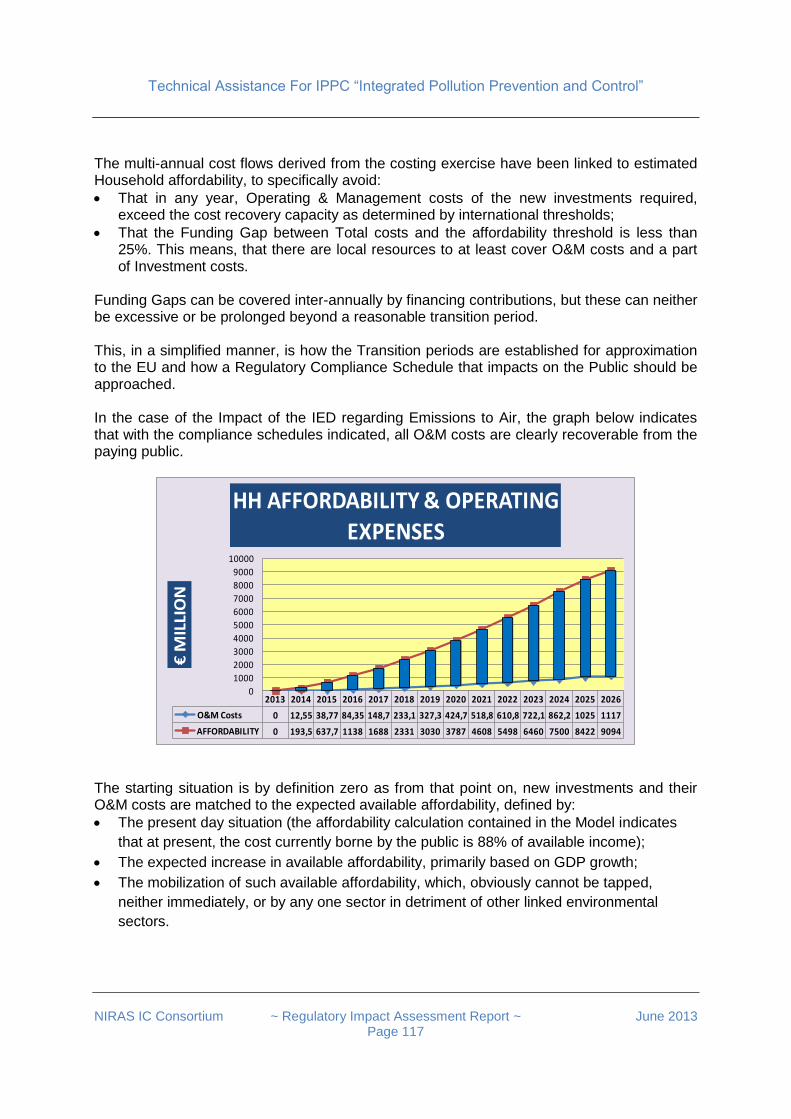
Technical Assistance For IPPC “Integrated Pollution Prevention and Control”
NIRAS IC Consortium ~ Regulatory Impact Assessment Report ~ June 2013
Page 117
The multi-annual cost flows derived from the costing exercise have been linked to estimated Household affordability, to specifically avoid:
That in any year, Operating & Management costs of the new investments required, exceed the cost recovery capacity as determined by international thresholds;
That the Funding Gap between Total costs and the affordability threshold is less than 25%. This means, that there are local resources to at least cover O&M costs and a part of Investment costs.
Funding Gaps can be covered inter-annually by financing contributions, but these can neither be excessive or be prolonged beyond a reasonable transition period. This, in a simplified manner, is how the Transition periods are established for approximation to the EU and how a Regulatory Compliance Schedule that impacts on the Public should be approached. In the case of the Impact of the IED regarding Emissions to Air, the graph below indicates that with the compliance schedules indicated, all O&M costs are clearly recoverable from the paying public.
2013 2014 2015 2016 2017 2018 2019 2020 2021 2022 2023 2024 2025 2026
O&M Costs 0 12,55 38,77 84,35 148,7 233,1 327,3 424,7 518,8 610,8 722,1 862,2 1025 1117
AFFORDABILITY 0 193,5 637,7 1138 1688 2331 3030 3787 4608 5498 6460 7500 8422 9094
0
1000
2000
3000
4000
5000
6000
7000
8000
9000
10000
€M
ILLI
ON
HH AFFORDABILITY & OPERATING EXPENSES
The starting situation is by definition zero as from that point on, new investments and their O&M costs are matched to the expected available affordability, defined by:
The present day situation (the affordability calculation contained in the Model indicates
that at present, the cost currently borne by the public is 88% of available income);
The expected increase in available affordability, primarily based on GDP growth;
The mobilization of such available affordability, which, obviously cannot be tapped,
neither immediately, or by any one sector in detriment of other linked environmental
sectors.
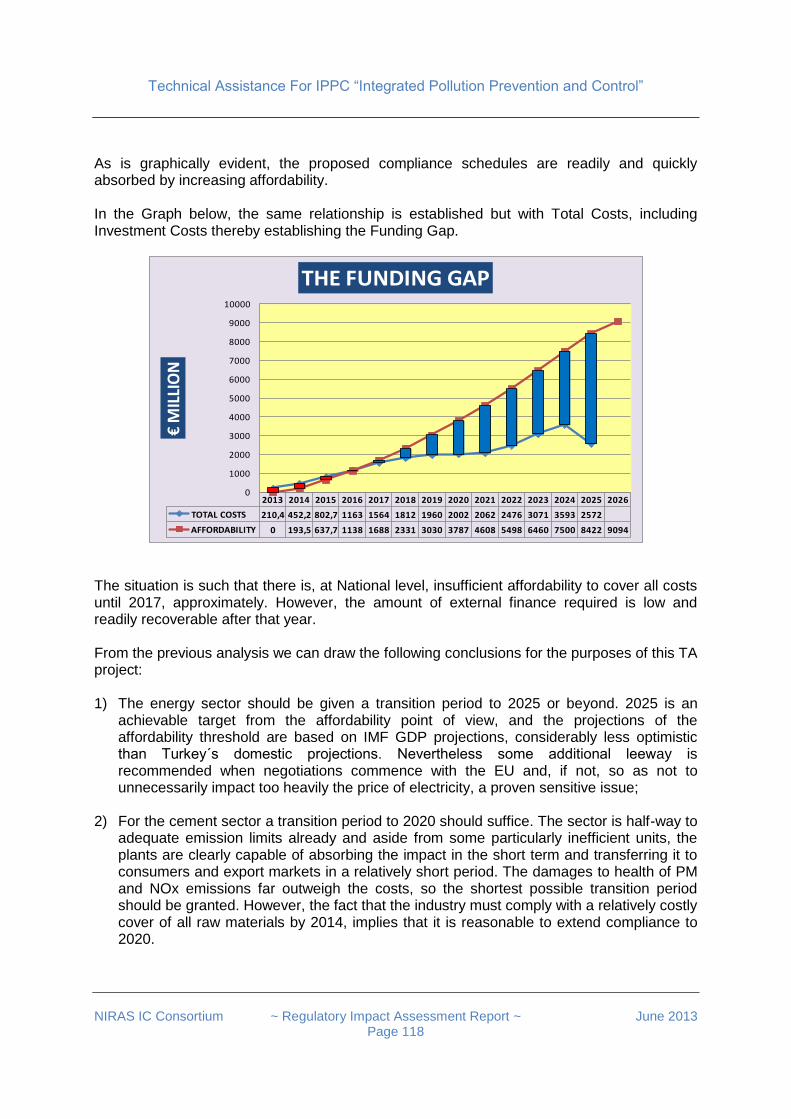
Technical Assistance For IPPC “Integrated Pollution Prevention and Control”
NIRAS IC Consortium ~ Regulatory Impact Assessment Report ~ June 2013
Page 118
As is graphically evident, the proposed compliance schedules are readily and quickly absorbed by increasing affordability. In the Graph below, the same relationship is established but with Total Costs, including Investment Costs thereby establishing the Funding Gap.
2013 2014 2015 2016 2017 2018 2019 2020 2021 2022 2023 2024 2025 2026
TOTAL COSTS 210,4 452,2 802,7 1163 1564 1812 1960 2002 2062 2476 3071 3593 2572
AFFORDABILITY 0 193,5 637,7 1138 1688 2331 3030 3787 4608 5498 6460 7500 8422 9094
0
1000
2000
3000
4000
5000
6000
7000
8000
9000
10000
€M
ILLI
ON
THE FUNDING GAP
The situation is such that there is, at National level, insufficient affordability to cover all costs until 2017, approximately. However, the amount of external finance required is low and readily recoverable after that year. From the previous analysis we can draw the following conclusions for the purposes of this TA project: 1) The energy sector should be given a transition period to 2025 or beyond. 2025 is an
achievable target from the affordability point of view, and the projections of the affordability threshold are based on IMF GDP projections, considerably less optimistic than Turkey´s domestic projections. Nevertheless some additional leeway is recommended when negotiations commence with the EU and, if not, so as not to unnecessarily impact too heavily the price of electricity, a proven sensitive issue;
2) For the cement sector a transition period to 2020 should suffice. The sector is half-way to adequate emission limits already and aside from some particularly inefficient units, the plants are clearly capable of absorbing the impact in the short term and transferring it to consumers and export markets in a relatively short period. The damages to health of PM and NOx emissions far outweigh the costs, so the shortest possible transition period should be granted. However, the fact that the industry must comply with a relatively costly cover of all raw materials by 2014, implies that it is reasonable to extend compliance to 2020.
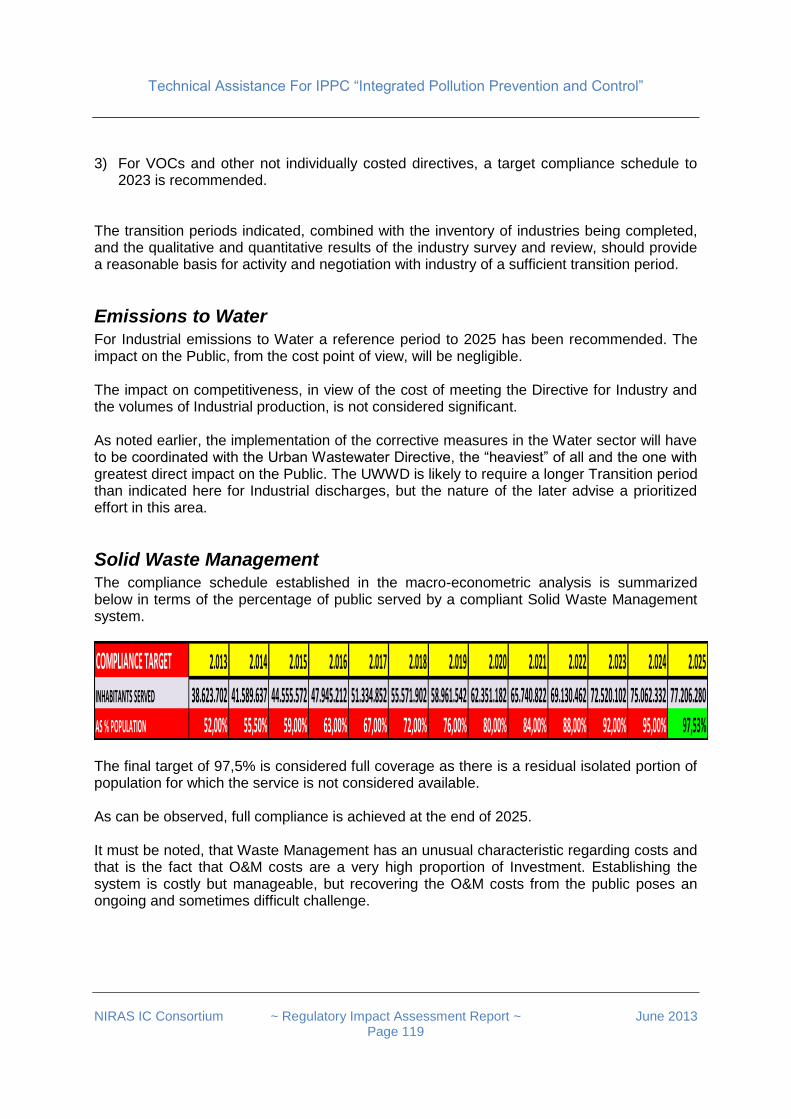
Technical Assistance For IPPC “Integrated Pollution Prevention and Control”
NIRAS IC Consortium ~ Regulatory Impact Assessment Report ~ June 2013
Page 119
3) For VOCs and other not individually costed directives, a target compliance schedule to 2023 is recommended.
The transition periods indicated, combined with the inventory of industries being completed, and the qualitative and quantitative results of the industry survey and review, should provide a reasonable basis for activity and negotiation with industry of a sufficient transition period.
Emissions to Water For Industrial emissions to Water a reference period to 2025 has been recommended. The impact on the Public, from the cost point of view, will be negligible. The impact on competitiveness, in view of the cost of meeting the Directive for Industry and the volumes of Industrial production, is not considered significant. As noted earlier, the implementation of the corrective measures in the Water sector will have to be coordinated with the Urban Wastewater Directive, the “heaviest” of all and the one with greatest direct impact on the Public. The UWWD is likely to require a longer Transition period than indicated here for Industrial discharges, but the nature of the later advise a prioritized effort in this area.
Solid Waste Management The compliance schedule established in the macro-econometric analysis is summarized below in terms of the percentage of public served by a compliant Solid Waste Management system.
COMPLIANCE TARGET 2.013 2.014 2.015 2.016 2.017 2.018 2.019 2.020 2.021 2.022 2.023 2.024 2.025
INHABITANTS SERVED 38.623.702 41.589.637 44.555.572 47.945.212 51.334.852 55.571.902 58.961.542 62.351.182 65.740.822 69.130.462 72.520.102 75.062.332 77.206.280
AS % POPULATION 52,00% 55,50% 59,00% 63,00% 67,00% 72,00% 76,00% 80,00% 84,00% 88,00% 92,00% 95,00% 97,53%
The final target of 97,5% is considered full coverage as there is a residual isolated portion of population for which the service is not considered available. As can be observed, full compliance is achieved at the end of 2025. It must be noted, that Waste Management has an unusual characteristic regarding costs and that is the fact that O&M costs are a very high proportion of Investment. Establishing the system is costly but manageable, but recovering the O&M costs from the public poses an ongoing and sometimes difficult challenge.
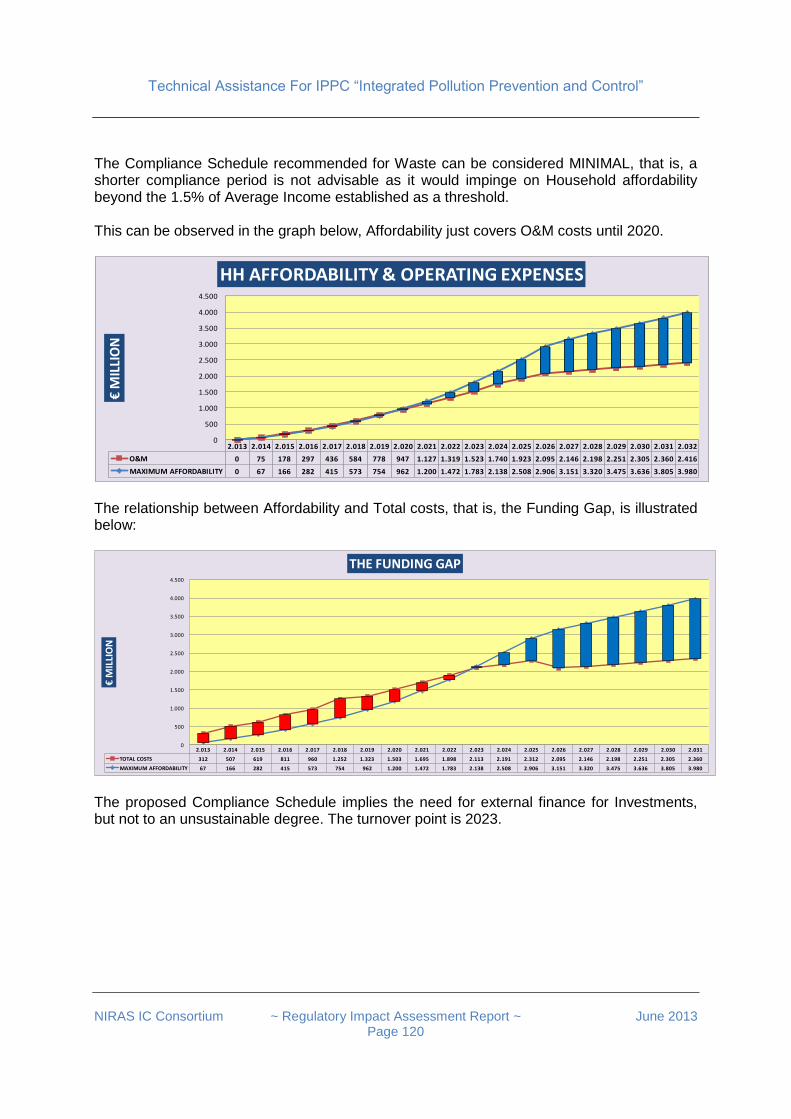
Technical Assistance For IPPC “Integrated Pollution Prevention and Control”
NIRAS IC Consortium ~ Regulatory Impact Assessment Report ~ June 2013
Page 120
The Compliance Schedule recommended for Waste can be considered MINIMAL, that is, a shorter compliance period is not advisable as it would impinge on Household affordability beyond the 1.5% of Average Income established as a threshold. This can be observed in the graph below, Affordability just covers O&M costs until 2020.
2.013 2.014 2.015 2.016 2.017 2.018 2.019 2.020 2.021 2.022 2.023 2.024 2.025 2.026 2.027 2.028 2.029 2.030 2.031 2.032
O&M 0 75 178 297 436 584 778 947 1.127 1.319 1.523 1.740 1.923 2.095 2.146 2.198 2.251 2.305 2.360 2.416
MAXIMUM AFFORDABILITY 0 67 166 282 415 573 754 962 1.200 1.472 1.783 2.138 2.508 2.906 3.151 3.320 3.475 3.636 3.805 3.980
0
500
1.000
1.500
2.000
2.500
3.000
3.500
4.000
4.500
€M
ILLI
ON
HH AFFORDABILITY & OPERATING EXPENSES
The relationship between Affordability and Total costs, that is, the Funding Gap, is illustrated below:
2.013 2.014 2.015 2.016 2.017 2.018 2.019 2.020 2.021 2.022 2.023 2.024 2.025 2.026 2.027 2.028 2.029 2.030 2.031
TOTAL COSTS 312 507 619 811 960 1.252 1.323 1.503 1.695 1.898 2.113 2.191 2.312 2.095 2.146 2.198 2.251 2.305 2.360
MAXIMUM AFFORDABILITY 67 166 282 415 573 754 962 1.200 1.472 1.783 2.138 2.508 2.906 3.151 3.320 3.475 3.636 3.805 3.980
0
500
1.000
1.500
2.000
2.500
3.000
3.500
4.000
4.500
€M
ILLI
ON
THE FUNDING GAP
The proposed Compliance Schedule implies the need for external finance for Investments, but not to an unsustainable degree. The turnover point is 2023.
Technical Assistance For IPPC “Integrated Pollution Prevention and Control”
NIRAS IC Consortium ~ Regulatory Impact Assessment Report ~ June 2013
Page 121
Econometric calculation of social impacts of IPPC/IED
Baseline As indicated in the previous chapters, the implementation of the IED has far-reaching and high impacts on the Population of Turkey:
There will be very significant costs through increases in Tariffs and the price of some consumer goods;
There will be a considerable impact on the general health of Turkish citizens. The latter is of great importance, as it is precisely the damage caused to health and the general environment what the IED is designed to avoid. The main categories of benefits, or damage avoided, include:
Health Benefits. They stem from the direct savings of treating the cost of illnesses aggravated by pollution and of the avoidance of early mortality.
Resource Benefits. They are the benefits directly accruing from commercial enterprises dependant directly from the environment, i.e. forestry, agriculture, fisheries.
Resource Cost Savings. They are the savings to the operators and to the consumers of Implementing a directive, for example, provision of water supply will imply the savings of drilling a well, the avoided cost of consuming bottled water. Connection to sewerage will imply the saving of building a septic tank, etc.
Benefits to the Ecosystem. The benefits to the general environment that are not commercially quantifiable but for which society expresses a “Willingness to Pay” (WTP concept) that can be monetised.
Social Benefits. Those stemming from the conservation of natural and cultural heritage, recreational opportunities, social cohesion…
Wider Economic Benefits. Increased employment through environmental investment, eco-efficiency gains, increased attraction to investment, tourism and eco-tourism…
Description of the methodology
Monetising the Benefits Benefits are monetised using three basic methods of monetary quantification:
Unit pollution damage costs are applied to estimated reductions in reference pollutants.
Unit of damage per unit of pollutant multiplied by units of emission avoided. Unit receptor damage costs applied to the estimated reduction in damage to receptors of the pollutant.
This benefit is calculated on the basis of the value of the damage on the basis of repair costs (i.e. damage to buildings) or on the basis of the Willingness to Pay concept (see below) (i.e. value of clean water to households).
Dose- response function. Relates changes in pollution to effects on the receptors.
Technical Assistance For IPPC “Integrated Pollution Prevention and Control”
NIRAS IC Consortium ~ Regulatory Impact Assessment Report ~ June 2013
Page 122
I.e. Dose (level of concentration of a given pollutant) multiplied by number of receptors (population) multiplied by the probability of illness/mortality and multiplied by the unit costs of treatment (hospital days, lost activity, premature mortality, etc..)
The conceptual understanding of these functions requires the explanation of some basic tenets:
The Willingness to Pay Concept. (WTP) When the application of a directive leads to a service, such as supply of clean drinking water or treatment of wastewater, the value can be directly linked to the Willingness To Pay, ultimately expressed as a tariff charged for the supply of said service.
Benefits Transfer Valuation. The calculation of benefits is mostly based on WTP values, dose-response functions and unit cost values derived from the experience in the US and the EU 15 states.
This is logical, as the data has been collected and scientifically tested in those, more advanced, economies. To transform those values to monetary values applicable to a candidate country, we shall have to weigh the values proportionally to the per capita Purchase Price Parity.
Value of Life and Health. In the context of this report and of environmental benefit assessment, the “value of life and health” is used as a means to convey the WTP of the population to avoid risks.
Much controversy arose in the 1990s when this technique was introduced, but the basic concept is ancient and natural. We all subscribe insurance policies which have a set cost and a benefit value. This does not mean our life is worth the monetary value determined in the document. It simply implies that we are willing to pay to obtain certain monetary benefits that will compensate - in a limited monetary sense - our absence as wage earners to our dependants.
The same concept is here applicable. To society, a life has different values, some of them are monetary, and these should be estimated in the context of environmental economics, because not doing so leads to a disregard of the economic value of life and health and induces economic agents to produce with technologies that do not reflect, even in this limited economic field, the true costs.
A simplified model tool to monetize the Benefits, using an internationally accepted methodology, has been applied to estimate the benefits accruing from each emission sector which directly provides the benefits per population unit, so that comparison between different actions/policies is meaningful and may serves as an input for project prioritization. There is a body of specific damages avoided monetary parameters (removal of 1 ton of SO2, removal of chromium from water, etc.) which has been adapted to Turkish conditions for the calculation of benefits exercise.
Results of the benefits calculations In the Model Tool “Benefits Tables” the development of the estimates of the positive impacts on Society are developed for the three sectors considered:
Industrial Wastewater, “WATER”;

Technical Assistance For IPPC “Integrated Pollution Prevention and Control”
NIRAS IC Consortium ~ Regulatory Impact Assessment Report ~ June 2013
Page 123
Solid Waste Management “WASTE”; and
Emissions to Air “AIR & INDUSTRIAL POLLUTION”.
Those Tables contain in the “comments” attached to the unit costs, and the specific references included in the text, the information pertaining to the sources of the impact values. The Benefit Transfer Equation has been calculated on the basis of the 2012 GDP in Turkey and in the reference countries, which are the EU 27 as established, mainly, found in the Ecotec study of 2000/2001 and the US references applied. The relationship of Turkey to these references is weighed 80/20 in favour of the EU 27 data because of its relative homogeneity with the EU countries. The results of applying said equation is that Benefits are transferred to Turkey in a proportion of 52%. The technique consists in defining volumes and applying that proportion of the external benefits documented in the reference countries. Below are summarized the results of this analysis:
SUMMARY OF MONETISED BENEFITS
RANGE OF BENEFITS IN
€MILLION PER ANNUM
LOW MEDIUM HIGH
Drinking Water 0 0 0
WATER Surface Water 8 24 48
River Ecosystems 6 18 35
WasteWater Treatment 85 166 246
Methane Capture 25 31 39
Energy from Methane 6 21 47
WASTE Carbon Dioxide Capture 0 0 1
Leachate & Disamenity from Landfills 29 87 174
Recycling & Composting 367 2.744 6.451
Reduction in Mortality 946 1.375 1.803
AIR & INDUSTRIAL Reduction in Morbidity 2.724 8.172 13.621
POLLUTION Agriculture 0 0 0
Construction & Materials 0 0 0
TOTAL ANNUAL MONETISED BENEFITS: 4.196 12.638 22.467
Cost benefit analysis In order to provide a useful indicator of the Cost to Social Benefits relationship, the Cost Stream in each Sector has been discounted at 5% over the period 2013-2015 and compared to the benefit stream, performing the same calculation (NPV, 5%, 2013-2025).
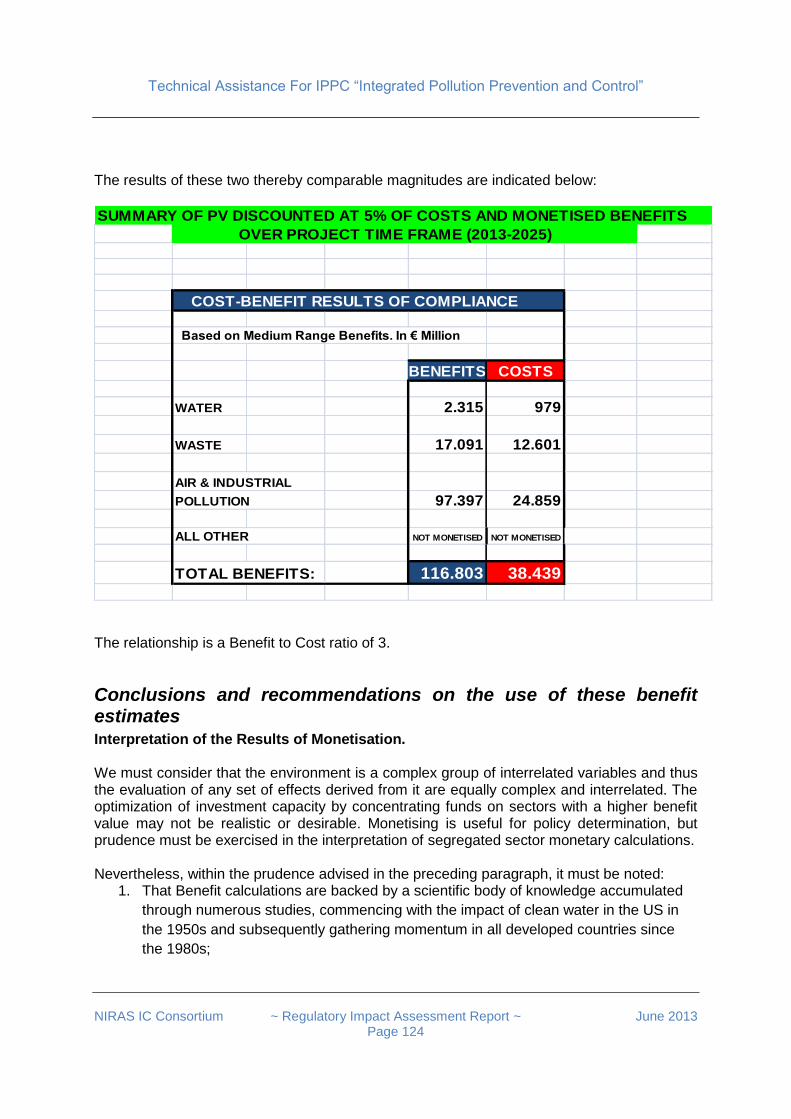
Technical Assistance For IPPC “Integrated Pollution Prevention and Control”
NIRAS IC Consortium ~ Regulatory Impact Assessment Report ~ June 2013
Page 124
The results of these two thereby comparable magnitudes are indicated below:
SUMMARY OF PV DISCOUNTED AT 5% OF COSTS AND MONETISED BENEFITS
OVER PROJECT TIME FRAME (2013-2025)
COST-BENEFIT RESULTS OF COMPLIANCE
Based on Medium Range Benefits. In € Million
BENEFITS COSTS
WATER 2.315 979
WASTE 17.091 12.601
AIR & INDUSTRIAL
POLLUTION 97.397 24.859
ALL OTHER NOT MONETISED NOT MONETISED
TOTAL BENEFITS: 116.803 38.439
The relationship is a Benefit to Cost ratio of 3.
Conclusions and recommendations on the use of these benefit estimates Interpretation of the Results of Monetisation. We must consider that the environment is a complex group of interrelated variables and thus the evaluation of any set of effects derived from it are equally complex and interrelated. The optimization of investment capacity by concentrating funds on sectors with a higher benefit value may not be realistic or desirable. Monetising is useful for policy determination, but prudence must be exercised in the interpretation of segregated sector monetary calculations. Nevertheless, within the prudence advised in the preceding paragraph, it must be noted:
1. That Benefit calculations are backed by a scientific body of knowledge accumulated
through numerous studies, commencing with the impact of clean water in the US in
the 1950s and subsequently gathering momentum in all developed countries since
the 1980s;
Technical Assistance For IPPC “Integrated Pollution Prevention and Control”
NIRAS IC Consortium ~ Regulatory Impact Assessment Report ~ June 2013
Page 125
2. The level of accuracy of said calculations can be considered as high, at least, as the
estimate of Costs;
3. The analysis made for this TA project is, again, simplified and limited due to resource
limitations, but indicates a reasonably reliable order of magnitude.
In view of these results, the following becomes evident: 1. That Government Policy must take into account not only the costs to industry, but also
the External Benefits to Society, which are, basically, the damage avoided through reduced pollution;
2. That compliance schedules should be compressed in those subsectors that do most environmentally costly damage, mainly emissions to air, particularly of NMVOCs;
3. That in view of the Benefit to Cost Ratio, the implementation of the environmental acquis in Turkey, should be a priority for the Turkish Administration, whether Turkey decides to join the EU or not.
Conclusions The role of IPPC / IED in pollution avoidance. Integrated licensing should become the most important driver of pollution avoidance. During the decade following the introduction of integrated licensing, there is a potential of reducing industrial pollution load by one third. The benefits to society greatly surpass the costs to companies. IPPC / IED and competitiveness. Pollution abatement costs associated with the introduction of IPPC / IED are substantial, but do not reduce substantially the competitiveness of Turkish industry. Costs resulting from environmental legislation are generally a small cost item, compared with other factors influencing competitiveness, such as labour costs. Some results of surveys implemented in the EU167 and applied for Turkey confirm that in a particular year only a small minority of companies invest into pollution abatement equipment, e.g. one in twenty. Among exporting companies and energy intensive companies the likelihood of investing in pollution abatement equipment is higher. There is a wide range of companies where environmental requirements will drive innovation and efficiency. Environmental investments integrated into the technological process have a much deeper positive impact on productivity and plant performance, than end-of pipe solutions.
167
See Appendix 1.

Technical Assistance For IPPC “Integrated Pollution Prevention and Control”
NIRAS IC Consortium ~ Regulatory Impact Assessment Report ~ June 2013
Page 126
The major source of damages and the major cost item. The introduction of IPPC / IED will improve the environmental performance of industry with regard to all elements of the environment. However, the issue of air pollution should be dealt with separately. Model calculations made in the EU and extrapolated for Turkey168 confirm that air pollution causes the loss of hundreds of thousands of life-years in Turkey and huge material losses in equipment, crops and biodiversity. Two thirds of damages caused by air pollution can be attributed to LCPs. A small percentage of facilities, a well identifiable group of large polluters, cause most of the damages. Fuel combustion for electricity generating purposes is responsible for emitting almost two-third of SO2 and about one third of NOx. However, joining the EU Thematic Strategy on air pollution may halve this amount within two decades. Certain model calculations made in the EU169 reinforce the finding of other studies that compliance with IPPC reduces NOx pollution by at least 60% and SO2 pollution by at least 80%. Cumulated pollution abatement costs for the Turkish electricity sector for the period 2010 to 2025 is estimated to be somewhat over €18 billion at year 2010 prices. Estimated annual expenditures amount to 0,1% - 0,2% of GDP.
Recommendations
Policy recommendations This RIA has outlined three Options for introducing the IPPC / IED Directive in Turkey. Option 1 maximises environmental benefits arising from IPPC/IED with a uniform schedule of introduction of the requirements, while Option 3 is characterized by proactive facilitation efforts and extensive financial commitments from the Government. We recommend the implementation of Option 2, which is a compromise between the two approaches in order to achieve the environmental benefits without endangering competitiveness of the Turkish industry. Option 2: is defined as “Feasibility Oriented Introduction of IPPC/IED“. Under this scenario:
The deadlines of transposition and the schedule of enforcing the requirements is determined by consecutive agreements among the Government, the EU and the representatives of the operators. Deadlines may be different across sectors, but may not be determined on a case by case basis.
Administrative simplifications. Authorities implement the international best practices for raising awareness raising and offering guidance, but offer administrative simplifications for facilitating the adaptation of operators only in exceptional cases. For example, a simplified integrated permitting procedure is established, whereby a single administrative procedure is needed to satisfy the requirements of several environmental regulations but offered only for small and medium sized firms with a registered Environmental Management System and with a good record of environmental compliance.
168
See Appendix 1. 169
See Appendix 1.
Technical Assistance For IPPC “Integrated Pollution Prevention and Control”
NIRAS IC Consortium ~ Regulatory Impact Assessment Report ~ June 2013
Page 127
Financial incentives. The “Polluter pays” principle is generally applied, but exceptions are made (a) in case of SMEs, in line with Turkey’s policies on small and medium enterprises and (b) in case of large combustion plants, by taking into consideration the public interests associated with electricity generation. For companies under (a) and (b) the schedule of enforcement offers more time for adaptation and certain financial incentives are offered from national and European funds, including credits, credit guarantees and to a certain extent, in case of research, development and other justifiable projects, the involvement of non-returnable subsidies.
The Government and NGOs – as well as chambers of commerce, industrial associations and institutions - should play a crucial part in preparing and managing the adaptation process. The major task ahead is to launching initiatives to raise awareness on environmental issues , by organizing conferences, seminars or meetings about environmental issues and by embracing specific local and sectoral environmental issues. More concrete steps are needed to be taken to raise the awareness of Turkish population and industry about integrated permitting, its requirements and the additional rights of the public to become involved in the administrative procedure of permitting.
Recommendations to improve impact assessment activities Turkey should support research on country level air pollution modeling and apply its findings in policy making. Turkey should contribute to EU wide impact assessment efforts by strengthening co-operation with the European Environment Agency and by supplying statistical data. Turkey should develop its installation-level pollution inventory according to European standards. The data base should be available for the public, and its use by researchers should be encouraged and motivated. In issues of how of technology interacts with the environment, impact assessment findings made in one country can be readily transferred to others. Turkey should participate on international forums where impact assessment methods and findings are exchanged. Turkey should introduce the surveying of environmental costs into its industrial statistics. Researchers should be encouraged to analyse the resulting data base. Turkey should seek to minimise the cost to industry for reporting of environmental data by harmonizing the reporting required by the integrated permitting system with all other environmental reporting requirements.
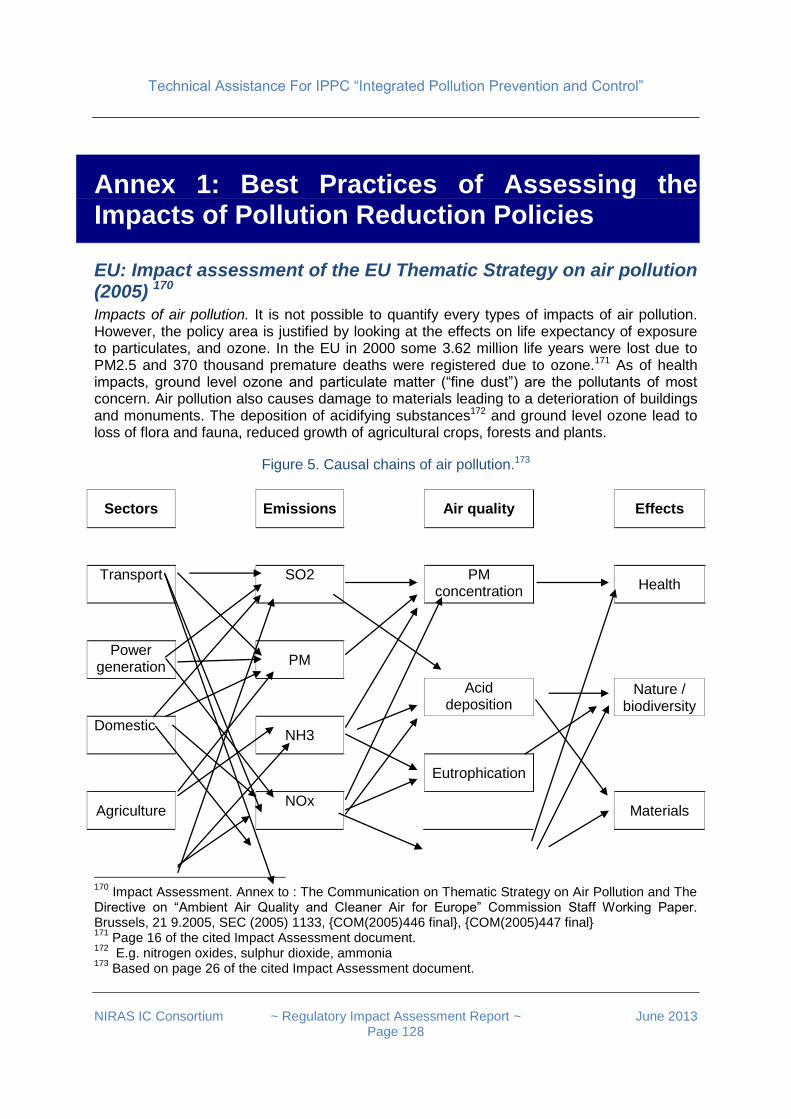
Technical Assistance For IPPC “Integrated Pollution Prevention and Control”
NIRAS IC Consortium ~ Regulatory Impact Assessment Report ~ June 2013
Page 128
Annex 1: Best Practices of Assessing the Impacts of Pollution Reduction Policies
EU: Impact assessment of the EU Thematic Strategy on air pollution (2005) 170 Impacts of air pollution. It is not possible to quantify every types of impacts of air pollution. However, the policy area is justified by looking at the effects on life expectancy of exposure to particulates, and ozone. In the EU in 2000 some 3.62 million life years were lost due to PM2.5 and 370 thousand premature deaths were registered due to ozone.171 As of health impacts, ground level ozone and particulate matter (“fine dust”) are the pollutants of most concern. Air pollution also causes damage to materials leading to a deterioration of buildings and monuments. The deposition of acidifying substances172 and ground level ozone lead to loss of flora and fauna, reduced growth of agricultural crops, forests and plants.
Figure 5. Causal chains of air pollution.173
Sectors Emissions Air quality Effects
Transport SO2 PM concentration
Health
Power generation
PM
Acid
deposition Nature /
biodiversity
Domestic NH3
Eutrophication
Agriculture NOx
Materials
170
Impact Assessment. Annex to : The Communication on Thematic Strategy on Air Pollution and The Directive on “Ambient Air Quality and Cleaner Air for Europe” Commission Staff Working Paper. Brussels, 21 9.2005, SEC (2005) 1133, {COM(2005)446 final}, {COM(2005)447 final} 171
Page 16 of the cited Impact Assessment document. 172
E.g. nitrogen oxides, sulphur dioxide, ammonia 173
Based on page 26 of the cited Impact Assessment document.
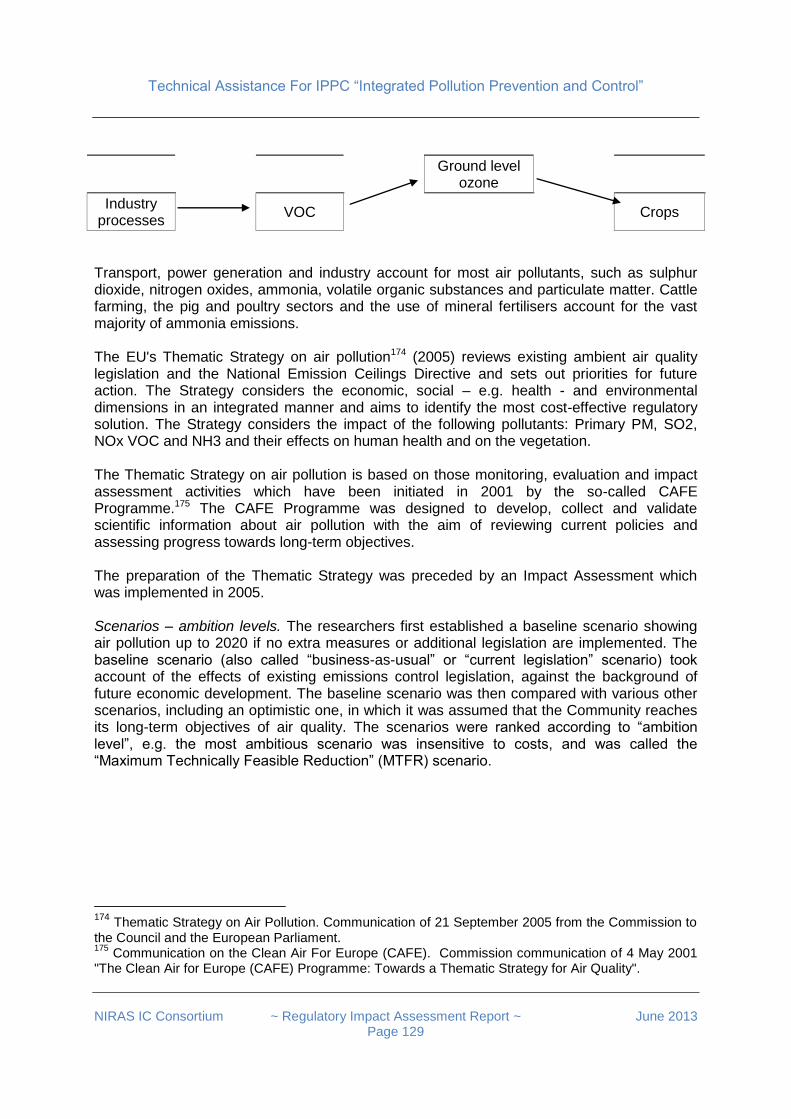
Technical Assistance For IPPC “Integrated Pollution Prevention and Control”
NIRAS IC Consortium ~ Regulatory Impact Assessment Report ~ June 2013
Page 129
Ground level
ozone
Industry processes
VOC Crops
Transport, power generation and industry account for most air pollutants, such as sulphur dioxide, nitrogen oxides, ammonia, volatile organic substances and particulate matter. Cattle farming, the pig and poultry sectors and the use of mineral fertilisers account for the vast majority of ammonia emissions. The EU's Thematic Strategy on air pollution174 (2005) reviews existing ambient air quality legislation and the National Emission Ceilings Directive and sets out priorities for future action. The Strategy considers the economic, social – e.g. health - and environmental dimensions in an integrated manner and aims to identify the most cost-effective regulatory solution. The Strategy considers the impact of the following pollutants: Primary PM, SO2, NOx VOC and NH3 and their effects on human health and on the vegetation.
The Thematic Strategy on air pollution is based on those monitoring, evaluation and impact assessment activities which have been initiated in 2001 by the so-called CAFE Programme.175 The CAFE Programme was designed to develop, collect and validate scientific information about air pollution with the aim of reviewing current policies and assessing progress towards long-term objectives. The preparation of the Thematic Strategy was preceded by an Impact Assessment which was implemented in 2005. Scenarios – ambition levels. The researchers first established a baseline scenario showing air pollution up to 2020 if no extra measures or additional legislation are implemented. The baseline scenario (also called “business-as-usual” or “current legislation” scenario) took account of the effects of existing emissions control legislation, against the background of future economic development. The baseline scenario was then compared with various other scenarios, including an optimistic one, in which it was assumed that the Community reaches its long-term objectives of air quality. The scenarios were ranked according to “ambition level”, e.g. the most ambitious scenario was insensitive to costs, and was called the “Maximum Technically Feasible Reduction” (MTFR) scenario.
174 Thematic Strategy on Air Pollution. Communication of 21 September 2005 from the Commission to the Council and the European Parliament. 175
Communication on the Clean Air For Europe (CAFE). Commission communication of 4 May 2001 "The Clean Air for Europe (CAFE) Programme: Towards a Thematic Strategy for Air Quality".
Technical Assistance For IPPC “Integrated Pollution Prevention and Control”
NIRAS IC Consortium ~ Regulatory Impact Assessment Report ~ June 2013
Page 130
Conceptualisation and calculation of impacts. For every investigated scenario the impacts were measured in terms of various indicators such as (a) the reduction of 5 pollutants in natural units (b) the resulting demographical and environmental changes176. The impact assessment of the different options was based on an analysis implemented with the help of the so-called RAINS model177. The health benefits of pollution reduction were calculated by making certain assumptions about the monetary value of statistical life. Finally, (c) some of the health and environmental changes were converted into money terms and expressed as monetized benefits. The benefits were compared with the costs (e.g. abatement costs). The major monetised benefits of policy options came from less premature deaths and a smaller loss of life expectancy. Benefits from reduced morbidity contributed significantly to the calculated overall benefits as well. Conceptualisation and calculation of macro-economic effects. For each of the options (i.e. for each previously defined ambition levels), the impacts on competitiveness and employment were also assessed by using a General Equilibrium Model178 of EU economy, the so called GEM-E3 Model179. Changes of competitiveness and employment were converted into either costs or into benefits. Decision criterion. The optimal scenario of the Thematic Strategy was defined at the level of ambition, ath which the total monetised benefits minus the total monetised costs (i.e. the net benefits) were maximized. The above balance was calculated only for the costs and benefits of reducing PM2.5 concentration, i.e. by not taking into consideration those impacts that were linked with acidification, eutrophication and ground-level ozone targets. These latter impacts of air pollution were not to be measured and monetized with an acceptable level of reliability. Identification of the recommended Thematic Strategy. All scenarios delivered benefits far in excess of costs. However, upon increasing the ambition levels, at around the mid range of ambition level the additional costs relative to benefits start to increase steeply. The so-called Maximum Technically Feasible Scenario turned out to be desirable, but not feasible. Thus the optimal ambition level of the Thematic Strategy was defined at 7.1 billion EUR pollution abatement costs per year.
176
This was expressed in terms of “EU-wide cumulative years of life years lost”, acidification, eutrophication and ozone reduction. 177 RAINS: Regional Acidification Information Simulation Integrated Assessment Model. The RAINS
model was developed under the CAFE Program and run by the International Institute for Applied Systems Analysis (IIASA). 178
General equilibrium models are standard tools of empirical economic analysis, searching for
equilibrium of demand and supply under various conditions. They are widely used to analyze the aggregate welfare and distributional impacts of policies (e.g. of different tax, subsidy, quota, limit and permission instruments) whose effects may be transmitted through multiple markets. 179 The GEM-E3 is an applied general equilibrium model that covers the interactions between the Economy, the Energy system and the Environment, designed for evaluating climate and energy policies, as well as fiscal issues. The GEM-E3 model was developed with the support of the 5th Research Framework Programme and has been used for several DGs of the EC, as well as for national authorities.
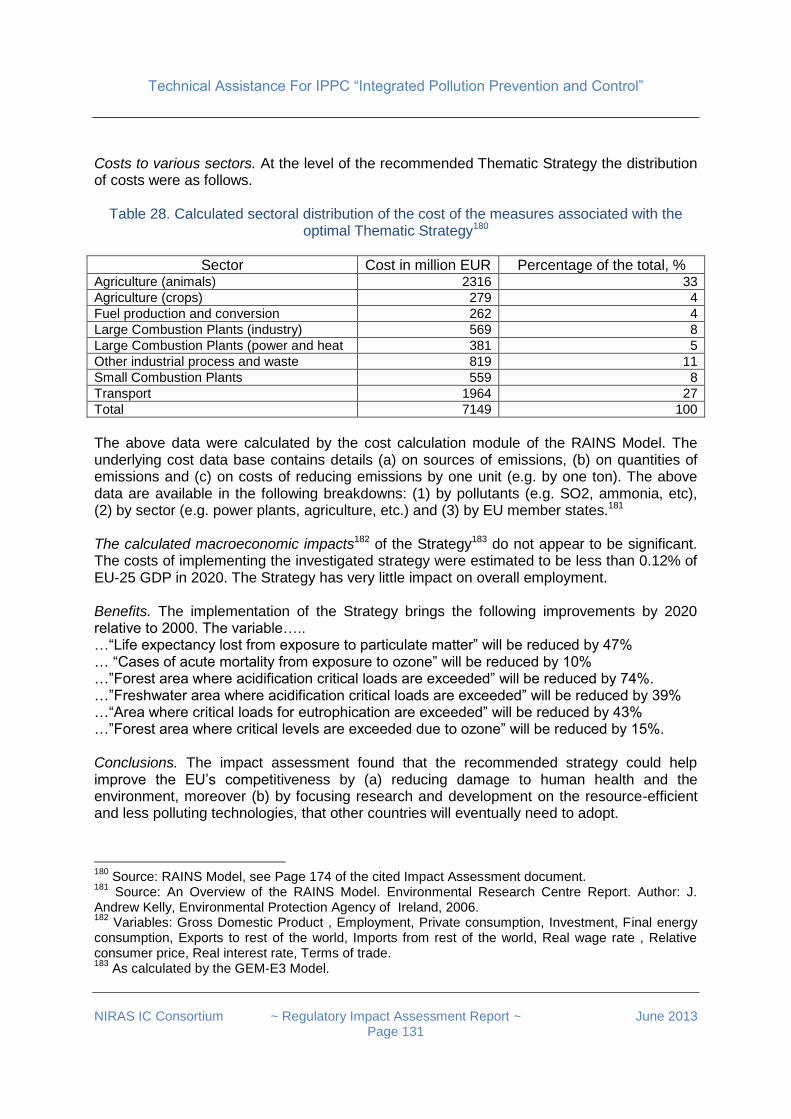
Technical Assistance For IPPC “Integrated Pollution Prevention and Control”
NIRAS IC Consortium ~ Regulatory Impact Assessment Report ~ June 2013
Page 131
Costs to various sectors. At the level of the recommended Thematic Strategy the distribution of costs were as follows.
Table 28. Calculated sectoral distribution of the cost of the measures associated with the optimal Thematic Strategy180
Sector Cost in million EUR Percentage of the total, % Agriculture (animals) 2316 33
Agriculture (crops) 279 4
Fuel production and conversion 262 4
Large Combustion Plants (industry) 569 8
Large Combustion Plants (power and heat 381 5
Other industrial process and waste 819 11
Small Combustion Plants 559 8
Transport 1964 27
Total 7149 100
The above data were calculated by the cost calculation module of the RAINS Model. The underlying cost data base contains details (a) on sources of emissions, (b) on quantities of emissions and (c) on costs of reducing emissions by one unit (e.g. by one ton). The above data are available in the following breakdowns: (1) by pollutants (e.g. SO2, ammonia, etc), (2) by sector (e.g. power plants, agriculture, etc.) and (3) by EU member states.181 The calculated macroeconomic impacts182 of the Strategy183 do not appear to be significant. The costs of implementing the investigated strategy were estimated to be less than 0.12% of EU-25 GDP in 2020. The Strategy has very little impact on overall employment. Benefits. The implementation of the Strategy brings the following improvements by 2020 relative to 2000. The variable….. …“Life expectancy lost from exposure to particulate matter” will be reduced by 47% … “Cases of acute mortality from exposure to ozone” will be reduced by 10% …”Forest area where acidification critical loads are exceeded” will be reduced by 74%. …”Freshwater area where acidification critical loads are exceeded” will be reduced by 39% …“Area where critical loads for eutrophication are exceeded” will be reduced by 43% …”Forest area where critical levels are exceeded due to ozone” will be reduced by 15%. Conclusions. The impact assessment found that the recommended strategy could help improve the EU’s competitiveness by (a) reducing damage to human health and the environment, moreover (b) by focusing research and development on the resource-efficient and less polluting technologies, that other countries will eventually need to adopt.
180
Source: RAINS Model, see Page 174 of the cited Impact Assessment document. 181
Source: An Overview of the RAINS Model. Environmental Research Centre Report. Author: J. Andrew Kelly, Environmental Protection Agency of Ireland, 2006. 182
Variables: Gross Domestic Product , Employment, Private consumption, Investment, Final energy consumption, Exports to rest of the world, Imports from rest of the world, Real wage rate , Relative consumer price, Real interest rate, Terms of trade. 183
As calculated by the GEM-E3 Model.
Technical Assistance For IPPC “Integrated Pollution Prevention and Control”
NIRAS IC Consortium ~ Regulatory Impact Assessment Report ~ June 2013
Page 132
Lessons learnt from this impact assessment for Turkey.
Substantive. Air pollution causes the loss of hundreds of thousands of life-years in Turkey, but joining the EU Thematic Strategy on air pollution may halve this amount within two decades. This is a very conservative extrapolation of the damages and impacts calculated in the impact assessment.
Methodological. Turkey should support research on country level air pollution modeling184 and apply its findings in policy making. Turkey should contribute to EU wide impact assessment efforts by strengthening co-operation with the European Environment Agency and by supplying statistical data.
Ireland: Environmental Impacts of Integrated Licensing (2006)185
In Ireland, Integrated Pollution Control (IPC) licences have been issued since 1994, following the 1992 EPA Act. This Act consolidated the patchwork of environmental regulation and enforcement that previously existed, typical of EU Member States at that time. A primary aim of this study was to develop environmental performance indicators to interpret reported emissions data. Licensed installations report a diverse range of air and water emissions to the EPA annually, including 28 parameters, 16 pertaining to water emissions and 12 pertaining to air emissions. The study focused on four diverse IPPC-regulated sectors:
Food & Drink manufacturing (n = 32 installations observed),
Power Generation (n = 9 installations observed).;
Pharmaceutical manufacturing (n = 27 installations observed).; and
Non-pharmaceutical chemical manufacturing (n = 27 installations observed). Extent of pollution reduction. Between 2001 and 2007, pollution loadings were reduced by 21% for the Food & Drink sector, 24% for the Pharma sector, 39% for the Power Generation sector, and 83% for the Non-Pharma Chemical sector. There were large reductions in sulphur oxide (SOx) and nitrogen oxide (NOx) pollution from all four sectors, largely reflecting a shift in fuel use from heavy fuel oil to light fuel oil and natural gas, and the installation of abatement technologies on large boilers.
The role of integrated licensing in pollution reduction. Purely economic, (i.e. not environmentally motivated) considerations have also played a role in the spreading of cleaner technologies. However, the questionnaire responses indicated that integrated licensing was the most important driver of pollution avoidance, and was responsible for 50% of air pollution avoidance and 30% of water pollution avoidance. Case study observations have reinforced the hypothesis that the observed pollution reduction in these sectors can be attributed to integrated licensing to a large extent. Benefits to the society. Pollution reduction data has allowed the calculation of the impact of integrated licensing on the social cost of pharmaceutical manufacture. These benefits have significantly surpassed the IPPC related compliance costs to companies.
184
Details about regional level air pollution modelling: see the chapter of this study on air pollution. 185
Emissions from IPPC Industry: Quantifying Pollution Trends & Regulatory Effectiveness Final Report for the ERTDI-funded project: 2006-FS-NE-38-M4. ERC Report 16 - David Styles and Michael B. Jones.
Technical Assistance For IPPC “Integrated Pollution Prevention and Control”
NIRAS IC Consortium ~ Regulatory Impact Assessment Report ~ June 2013
Page 133
Annual compliance costs to companies. Based on company responses, IPPC compliance costs could be identified in the Pharma sector: These costs amounted to 1.6 million EUR per responding installation. Breakdown by activities: most (63%) of compliance expenditure was on operation and maintenance of systems necessary for compliance, whilst 27% was on monitoring and reporting. Breakdown by elements of the environment: of total compliance expenditure, 20% was attributed to the control of air pollution, 30% to the control of water pollution, and 50% to the management of waste. Benefits to the companies. Questionnaire responses indicated that environmental licence requirements drive innovation, and encourage the companies to identify production efficiencies. In terms of competitiveness, respondents suggested that licensing had a positive or neutral effect on competitiveness at the national and EU levels, but a negative effect on global (non-EU) competitiveness. Lessons learnt from this impact assessment for Turkey.
Substantive. Integrated licensing may become the most important driver of pollution avoidance. During the decade following the introduction of integrated licensing, there is a potential of reducing industrial pollution load by one third. The benefits to the society greatly surpass the costs to companies. There is a wide range of company cases where environmental requirements have driven innovation and efficiency.
Methodological. Turkey should develop its installation-level pollution inventory according to European standards. The data base should be available for the public, and its use by researchers should be encouraged and motivated.
UK: An Impact Assessment of the IPPC (2007) 186 In the UK certain elements of an integrated permit system were already introduced in 1990187. However, in 2000 pollution control became more coherent, when the Integrated Pollution Prevention and Control Directive (96/61/EC) was implemented in the United Kingdom through the Pollution Prevention and Control (England and Wales) Regulations 2000 (“the PPC Regulations”) and through very similar regulations for Scotland and Northern Ireland. Prior to the introduction of IPPC (i.e. before 2000), a wide range of operators were regulated already under integrated permitting system, while for other operators IPPC was introduced only in 2000. The study effectively compared the above two groups of operators.
186
Mid-term review of the UK’s implementation of the Pollution Prevention and Control Regulations. April 2007. Department for Environment, Food and Rural Affairs. Source: www.defra.gov.uk. 187
With the implementation of the Environmental Protection Act (1990). Source: Integrated Pollution Control and the Evolving Style and Structure of Environmental Regulation in the UK. By Andrew Jordan, The Centre For Social and Economic Research on the Global Environment (CSERGE), University of East Anglia and University College London.

Technical Assistance For IPPC “Integrated Pollution Prevention and Control”
NIRAS IC Consortium ~ Regulatory Impact Assessment Report ~ June 2013
Page 134
Research design. This mid term review was practically equivalent with an ex post RIA. The researchers attempted to compare observed costs and benefits with hypothetical costs and benefits of the counterfactual scenario, i.e. by addressing the question of “what would have happened with the costs and benefits if the regulation had not been issued”. In other words, the study attempted to determine the additional costs and associated benefits of IPPC over and above those which would have existed, if the previous regime continued, in spite of the fact that not introducing IPPC would not have been permissible under European law. Method of revealing company costs and opinions. The survey sample included those sites in the UK that have been included into the IPPC the regime up until September 2005. The findings are based on a survey of more than 250 installations by assessing
Capital and operating costs for operators (application costs and fees, capital costs, costs of management time, monitoring and reporting, as well as the costs of administering the regulations by regulators.
Benefits, including improvements in environmental quality and resource efficiency.
Other impacts, e.g. impacts on regulatory burdens, on small businesses and on environmental industries.
Method of calculating environmental benefits. Environmental benefits were not calculated by using company responses. Instead, data obtained from the official Pollution Inventory were used, which is a detailed (installation-level, site by site) data base in the UK. Pollutant trends were identified before and after the introduction of the IPPC regime. The original intention of the study was to produce the monetisation of both costs and benefits, and to compare these over time. The costs have been projected, but the benefits did not prove possible to be expressed in monetary terms with any reliability. The results of the study were as follows. Costs for operators (including capital costs, management time, monitoring, reporting) were as follows.
The average application cost (including application fees) was estimated to be around £50,000 per operator, but varied significantly between operators. Regarding the regulatory burdens, the survey of operators revealed that most of those who responded felt that the IPPC system was more burdensome than the predecessor regulations under which they operated.
The median one-off compliance cost associated with the improvements required by the permit was £32,000 per operator, but varied significantly between operators.
Cumulative overall costs to UK operators over the period 2001 to 2005 of IPPC who had been issued a permit by 2005 are estimated to be £770 million, whereby the great majority of this expenditure was incurred by a small number of sites. Effects of cost on competition and competitiveness. The majority of survey respondents felt that IPPC application costs in the UK were unnecessarily high, which has reduced their competitiveness with rivals in the UK, Europe and more widely. In particular, small and medium-sized companies felt at a relative disadvantage compared with larger sites.
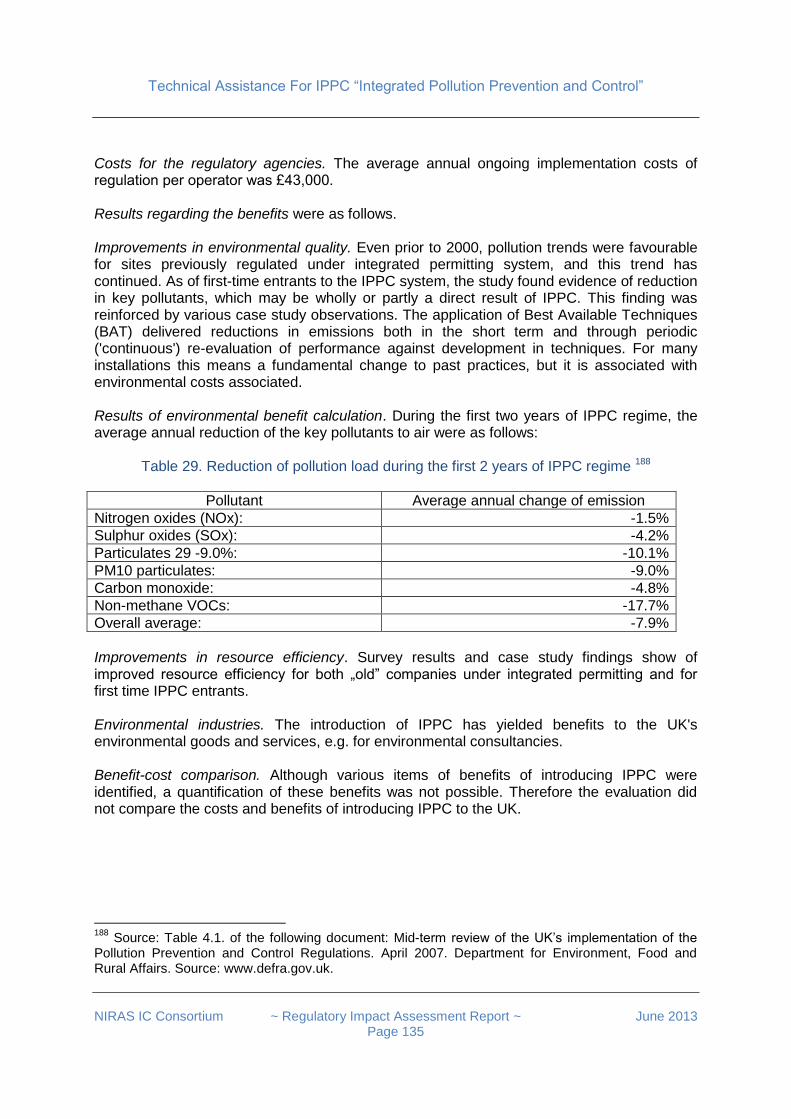
Technical Assistance For IPPC “Integrated Pollution Prevention and Control”
NIRAS IC Consortium ~ Regulatory Impact Assessment Report ~ June 2013
Page 135
Costs for the regulatory agencies. The average annual ongoing implementation costs of regulation per operator was £43,000. Results regarding the benefits were as follows. Improvements in environmental quality. Even prior to 2000, pollution trends were favourable for sites previously regulated under integrated permitting system, and this trend has continued. As of first-time entrants to the IPPC system, the study found evidence of reduction in key pollutants, which may be wholly or partly a direct result of IPPC. This finding was reinforced by various case study observations. The application of Best Available Techniques (BAT) delivered reductions in emissions both in the short term and through periodic ('continuous') re-evaluation of performance against development in techniques. For many installations this means a fundamental change to past practices, but it is associated with environmental costs associated. Results of environmental benefit calculation. During the first two years of IPPC regime, the average annual reduction of the key pollutants to air were as follows:
Table 29. Reduction of pollution load during the first 2 years of IPPC regime 188
Pollutant Average annual change of emission
Nitrogen oxides (NOx): -1.5%
Sulphur oxides (SOx): -4.2%
Particulates 29 -9.0%: -10.1%
PM10 particulates: -9.0%
Carbon monoxide: -4.8%
Non-methane VOCs: -17.7%
Overall average: -7.9%
Improvements in resource efficiency. Survey results and case study findings show of improved resource efficiency for both „old” companies under integrated permitting and for first time IPPC entrants. Environmental industries. The introduction of IPPC has yielded benefits to the UK's environmental goods and services, e.g. for environmental consultancies. Benefit-cost comparison. Although various items of benefits of introducing IPPC were identified, a quantification of these benefits was not possible. Therefore the evaluation did not compare the costs and benefits of introducing IPPC to the UK.
188
Source: Table 4.1. of the following document: Mid-term review of the UK’s implementation of the Pollution Prevention and Control Regulations. April 2007. Department for Environment, Food and Rural Affairs. Source: www.defra.gov.uk.
Technical Assistance For IPPC “Integrated Pollution Prevention and Control”
NIRAS IC Consortium ~ Regulatory Impact Assessment Report ~ June 2013
Page 136
Lessons learnt from this impact assessment for Turkey.
Substantive. Environmental benefits of IPPC appear already in the first 2 years of enforcement by an annual reduction of pollution load by 7%. The median values of (a) application costs and (b) one-off investment costs are in the same magnitude, amounting to a few tens of thousands of Euros. Companies, especially small and medium-sized companies felt that compliance costs could and should be reduced by better regulation. IPPC drives resource efficiency, environmental industries and services..
Methodological. The major data sources of IPPC impact assessment studies are (a) pollution inventories and (b) business surveys. Contrary to the policy impact assessment methodology embraced by the EEA, in the UK impact assessment environmental benefits were expressed only in terms of reduced pollution, but the causal chain was not further investigated, e.g. health and mortality impacts were not quantified, costs and benefits were not directly compared.
EU: Impact Assessment of the IED Directive (2007) 189 In 2007 the EU has implemented an Impact Assessment of the IED Directive which was at that year only at the stage of a proposal.
Scope of the Impact Assessment. The Impact Assessment covered all EU MSs and has investigated a wide range of alternatives on how the improve efficiency of the then existing legislation in force. At the time of the Impact Assessment the then current EU legal framework on industrial emissions comprised the IPPC Directive and several “sectoral Directives”190, most of which later were merged with IPPC and resulted in IED. The aim of the Impact Assessment was to achieve the environmental and health objectives of existing legislation in the most cost-effective way, i.e. by reducing the associated administrative burdens, by minimizing the distortions of competition within the EU, without hampering the competitive position of European industry. Impact Assessment procedure. An Impact Assessment Board was established to facilitate the process. The impact assessment was based on an extensive, 3 year long consultation of stakeholders, on the collection of data, information and interviews.
189 See the following source: Impact Assessment. Accompanying document to the Proposal for a Directive of the European Parliament and of the Council on industrial emissions (integrated pollution prevention and control) (recast). Brussels, 21.12.2007. 190 Namely: the Large Combustion Plants (LCP), Waste Incineration (WI), Solvents Emissions (SE) and Titanium Dioxide (TiO2) Directives.
Technical Assistance For IPPC “Integrated Pollution Prevention and Control”
NIRAS IC Consortium ~ Regulatory Impact Assessment Report ~ June 2013
Page 137
Damages caused by industrial pollution. The Impact Assessment has found that the largest European industrial installations accounted for a considerable share191 of total emissions of key atmospheric pollutants and had a big role in polluting water and soil, generating waste and using energy. For example, the pollutants covered by the Thematic Strategy on Air Pollution192 caused a total annual damage cost between €53-164 billion in 2004 in to human health impacts and crops in the 25 MSs of the EU. This was only a subset of the damages caused by industrial pollution. The above estimation was based
on the emission levels reported in the European Pollutant Emission Register (EPER)
on results of computerised model calculations193 on assumptions about the value of statistical life (VSL), which was then applied to the
impact of air pollution in terms of (a) number of deaths and (2) to changes in life expectancy.
Regulatory challenges. Industrial emissions have generally been reduced over the 10 to 20 years preceding the Impact Assessment194, but failed to achieve the aims set by NEC Directive and the Thematic Strategies. The Impact Assessment has identified significant problems with then existing regulations. In particular,
the BAT were not sufficiently implemented,
the role (legal status) of BREFs were unclear,
some provisions of the existing regulations were enforced only partially,
some measures have put unnecessary administrative burden on companies and distorted competition.
Competitiveness issues. The Impact Assessment offered a literature review about how environmental regulations affect company level competitiveness. While some studies highlight the concern that the private costs imposed by stringent environmental policy impair competitiveness and productivity, a number of other studies show that environmental regulation motivates innovation in a number of ways. Costs resulting from environmental legislation are generally a small factor influencing competitiveness, compared with other competitive factors, such as labour costs.
191
83% for sulphur dioxide (SO2), 34% for oxides of nitrogen (NOx), 43% for dust and 55% for volatile organic compounds (VOC) 192
NH3, NOx, particulate matter, SO2 and VOCs 193
The RAINS model was applied. 194
For instance by about 35% for NOx and 55% for SO2 between 1990 and 2000,
Technical Assistance For IPPC “Integrated Pollution Prevention and Control”
NIRAS IC Consortium ~ Regulatory Impact Assessment Report ~ June 2013
Page 138
Survey results on how IPPC affects competitiveness195. Primary measures, i.e. the introduction of clean technologies and process-integrated environmental investments integrated into the technological process tend to have a generally positive impact on productivity and plant performance. On the other hand, secondary measures, i.e. end-of pipe solutions had a mixed impact on plant performance: some had a positive impact, others were neutral and others had a negative effect on competitiveness. Companies demonstrating strong BAT/environmental performance, are not economically disadvantaged, i.e. they were not doing any worse than any other plants with fewer BATs in place and still having higher emissions. High environmental performance was considered only very infrequently as a competitive disadvantage. IPPC administrative costs were found to be insignificant. Competitive distortions result from between-country differences regarding levels of stringencies and regulatory quality. Environmentally high performing plants urged to increase the stringency of environmental regulations in other, more leniently regulated countries. Administrative burdens and the simplification of legislation. The implementation of the IPPC Directive involves several information obligations, with significant variations in practices and costs across the Member States.
Administrative costs to operators cover the costs to of getting an integrated permit for a particular installation, i.e. understanding the legal requirements, preparing applications, responding to requests for information from regulators. The EU Impact Assessment cites various surveys estimating the average administrative costs to industry of getting a permit. This cost item varies between ied nnn 10.000 EUR, depending on the study, on country and on sector. Additionally, the cited Impact Assessment has investigated 15 installations from the point of view of the information cost of application of the IPPC Directive and compared it with the costs of other environmental legislation. The cost estimation was based on the Standard Cost Model which was elaborated by the EU in order to measure administrative costs of complying with regulations. The cost of IPPC-related information obligations were estimated to be only a small fraction of the administrative burden of the total of environmental legislation.
Administrative cost to authorities. Estimations are made for the costs to administrations of producing application materials (forms, guidances, etc.), consulting the public, determining the application, etc. The average cost to authorities per installation is estimated to be 10.000 Euro per new permits and 7000 Euro for a review of an existing permit. This cost depends on how the particular MS has introduced the Directive, because MSs have certain freedom as to how they are institutionalising IPPC. The cost also depends on sectors, e.g. for the energy sector it is somewhat more expensive than for the metal sector.
The above costs were multiplied by the number of IPPC installations in the EU which were separately estimated in the above mentioned document. The estimation in 2007 arrived to 46,000 existing installations and 6,000 new installations.
195
E.g. based on the following report: “Assessment of different approaches to implementation of the IPPC Directive and their impacts on competitiveness”. Final report to the European Commission. By IFO Institute in collaboration with Carl Bro Group, December 2006

Technical Assistance For IPPC “Integrated Pollution Prevention and Control”
NIRAS IC Consortium ~ Regulatory Impact Assessment Report ~ June 2013
Page 139
Recommendations of the Impact Assessment. The Impact Assessment offered a wide range of recommendations. As of emissions, it proposed the strengthening of existing minimum requirements in certain sectors196. It also proposed the reduction of unnecessary administrative costs of IPPC permitting and reporting. The number of IPPC Installations in the EU in 2008. An EU review of the IPPC Directive implemented in 2008 has evaluated the permitting procedure across MSs of the EU. 197 This survey of 2008 has counted altogether 43.264 IPPC installations in 27 EU member states. More than 60% of these installations were found in the 5 most industrialized countries of the EU. The installations were categorized according to industrial sectors.
196
LCP, certain cement kilns co-incinerating waste, titanium dioxide 197 European Commission Directorate General. Environment Monitoring of Permitting Progress for Existing IPPC Installations . Framework Contract ENV.C.4./FRAI2007/OO11 . Final Report March 2009 ENTEC UK Limited in Partnership with the Institute for European Environmental Policy (IEEP). March 2009.
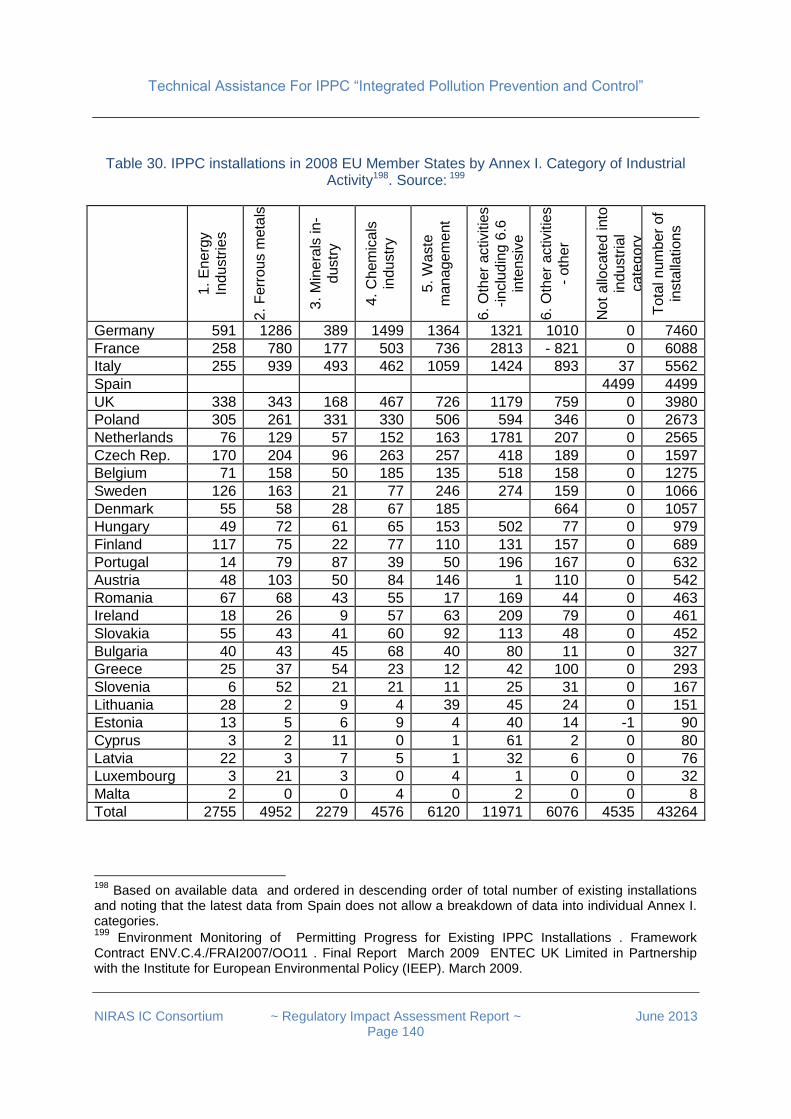
Technical Assistance For IPPC “Integrated Pollution Prevention and Control”
NIRAS IC Consortium ~ Regulatory Impact Assessment Report ~ June 2013
Page 140
Table 30. IPPC installations in 2008 EU Member States by Annex I. Category of Industrial Activity198. Source: 199
1
. E
nerg
y
Indu
str
ies
2.
Ferr
ous m
eta
ls
3. M
ine
rals
in-
dustr
y
4.
Ch
em
ica
ls
indu
str
y
5. W
aste
ma
na
ge
me
nt
6. O
ther
activitie
s
-in
clu
din
g 6
.6
inte
nsiv
e
agricu
ltu
re
6. O
ther
activitie
s
- oth
er
No
t a
llocate
d into
indu
str
ial
ca
teg
ory
Tota
l n
um
ber
of
insta
llation
s
Germany 591 1286 389 1499 1364 1321 1010 0 7460
France 258 780 177 503 736 2813 - 821 0 6088
Italy 255 939 493 462 1059 1424 893 37 5562
Spain 4499 4499
UK 338 343 168 467 726 1179 759 0 3980
Poland 305 261 331 330 506 594 346 0 2673
Netherlands 76 129 57 152 163 1781 207 0 2565
Czech Rep. 170 204 96 263 257 418 189 0 1597
Belgium 71 158 50 185 135 518 158 0 1275
Sweden 126 163 21 77 246 274 159 0 1066
Denmark 55 58 28 67 185 664 0 1057
Hungary 49 72 61 65 153 502 77 0 979
Finland 117 75 22 77 110 131 157 0 689
Portugal 14 79 87 39 50 196 167 0 632
Austria 48 103 50 84 146 1 110 0 542
Romania 67 68 43 55 17 169 44 0 463
Ireland 18 26 9 57 63 209 79 0 461
Slovakia 55 43 41 60 92 113 48 0 452
Bulgaria 40 43 45 68 40 80 11 0 327
Greece 25 37 54 23 12 42 100 0 293
Slovenia 6 52 21 21 11 25 31 0 167
Lithuania 28 2 9 4 39 45 24 0 151
Estonia 13 5 6 9 4 40 14 -1 90
Cyprus 3 2 11 0 1 61 2 0 80
Latvia 22 3 7 5 1 32 6 0 76
Luxembourg 3 21 3 0 4 1 0 0 32
Malta 2 0 0 4 0 2 0 0 8
Total 2755 4952 2279 4576 6120 11971 6076 4535 43264
198
Based on available data and ordered in descending order of total number of existing installations and noting that the latest data from Spain does not allow a breakdown of data into individual Annex I. categories. 199 Environment Monitoring of Permitting Progress for Existing IPPC Installations . Framework Contract ENV.C.4./FRAI2007/OO11 . Final Report March 2009 ENTEC UK Limited in Partnership with the Institute for European Environmental Policy (IEEP). March 2009.
Technical Assistance For IPPC “Integrated Pollution Prevention and Control”
NIRAS IC Consortium ~ Regulatory Impact Assessment Report ~ June 2013
Page 141
Lessons learnt from this impact assessment for Turkey.
Substantive. Costs resulting from environmental legislation are generally a small cost item, compared with other factors influencing competitive, such as labour costs. Environmental investments integrated into the technological process have a much deeper positive impact on productivity and plant performance, than end-of pipe solutions.
Methodological. In issues of how of technology interacts with the environment, impact assessment findings made in one country can be readily transferred to others. Turkey should participate on international forums where impact assessment methods and findings are exchanged.
EU: Model calculation of impacts of introducing BAT in LCPs (2008)200 A study published by the EEA has investigated a hypothetical scenario of BAT compliance in major European LCPs. Its research question is the following: to what extent air emissions (NOx and SO2) of electricity generating LCPs in 25 MSs of the EU would have been reduced, if in 2004 the best available techniques (BAT) had been fully introduced and the associated emission levels (AELs) had been fully achieved. The researchers have identified 450 LCP facilities in these countries, based on the publicly available 2004 data of the European Pollutant Emission Register (EPER). Further, by relying on commercially available information sources, for each of these installations they identified the following parameters: (a) the type of fuel used, (b) capacity, (c) installed abatement techniques. The quantity of fuel combusted in each of these facilities was estimated based on CO2 emissions (as it was reported for the EPER database). For a limited number of LCPs where emission data was not reported in EPER, the emissions for 2004 were estimated. The observed emissions were subsequently compared with calculated hypothetical emissions, on the assumption that these plants were complying with the emission limits of the LCP Directive and have applied the BAT as described in the LCP BREF. The results of the study clearly indicate that in the EU-25 emissions of the air pollutants NOX and SO2 from large combustion plants could be significantly reduced if the emission levels associated with the best available techniques described in the large combustion plants BREF were to be achieved. In particular, the emissions of NOx from LCPs would have been 60% to 90% lower, depending on the applied processes and techniques201. Similarly, for SO2, introducing best available techniques in all facilities would have decreased emissions from the large combustion plants by more than 80 % to 95%. Most of the hypothetical emission decrease would have come from coal and lignite-fired LCPs, if these installations had implemented the techniques recommended in LCP BREF.
200
Air pollution from electricity-generating large combustion plants. An assessment of the theoretical emission reduction of SO2 and NOx through implementation of BAT as set in the BREFs. European Environmental Agency Technical report No 4/2008 201
The range of applied emission-reducing processes and techniques is described in detail in Chapter 3 of the LCP BREF document: “Integrated Pollution Prevention and Control. Reference Document on Best Available Techniques for Large Combustion Plants. European Commission, July 2006.
Technical Assistance For IPPC “Integrated Pollution Prevention and Control”
NIRAS IC Consortium ~ Regulatory Impact Assessment Report ~ June 2013
Page 142
Lessons learnt from this impact assessment for Turkey.
Substantive. This model calculation reinforces the finding of other studies that compliance with IPPC reduces NOx pollution by at least 60% and SO2 pollution by at least 80%.
Methodological. This is an excellent example of impact assessment done by comparing a counterfactual scenario with an observed scenario. It should be used in teaching how to demonstrate causality in environmental research.
Spain: The IPPC Impact Assessment Survey (2008)202 In Spain the IPPC Law has been introduced in 2002. Within the public administration a division of work was established according to which the Ministry of Environment Protection coordinates, and the regions as competent agencies execute the regulations. Altogether 5.700 IPPC installations were identified covering all sectors mentioned in the Directive. Survey. In Spain a survey was made in 2008 about the impacts of having introduced IPPC into environmental legislation. The survey covered responses of 433 companies with IPPC installations. General results. The overall finding was that IPPC and the integrated permitting system has implied important changes in productive processes, reduced administrative loads, improved the control of atmospheric emissions, water discharges and waste management, reduced environmental impacts and health impacts of industrial processes and at the same time it improved competitiveness. The survey found that in general, companies considered that the efforts and measures taken have been positive for competitiveness and for corporate image. About 28% of the surveyed installations have applied exclusively BAT technologies for pollution abatement, and an additional 45% have applied some combination of BAT and other technologies. Costs. The survey also investigated the company level costs of adapting to IPPC. The researchers have collected responses about various cost items such as environmental operating costs and once-off costs of pollution abatement investments. The cost items included costs of diagnoses, studies, investments done in order to obtain IPPC permit, additional staff costs for processing IPPC the permit application and for fulfilling the requirements stated in the IPPC permit. The central cost indicator of the research was an aggregation of the above costs over the period of 2000 to 2007. Results of cost calculations. During the 2000-2007 period, the average adaptation cost / installation was as follows:203
202
Source: (a) Implementation of IPPC in Spain & Poland. Presentation of Cesar Soanez at the Training Course of the IPPC Twinning Project TR/2008/IB/EN/03. (b) Estudio de las implicaciones económicas de la innovación tecnológica consecuencia de la aplicación de la ley 16/2002". By Inerco, consultant firm. (c) Impacto e implicaciones de la actual normativa IPPC. By Begoña Nava de Olano (Área de Medio Ambiente Industrial Ministerio de Medio Ambiente, y Medio Rural y Marino). 23 november 2010. 203
The exact costs are in the next table.

Technical Assistance For IPPC “Integrated Pollution Prevention and Control”
NIRAS IC Consortium ~ Regulatory Impact Assessment Report ~ June 2013
Page 143
Agro-industry + animal waste treatment: 0.28 million €
Paper & pulp: 5 million €
Organic chemicals: 2.8 million €
Cement: 30 million €
LCP: 13 million €
Iron & steel: 42 million €
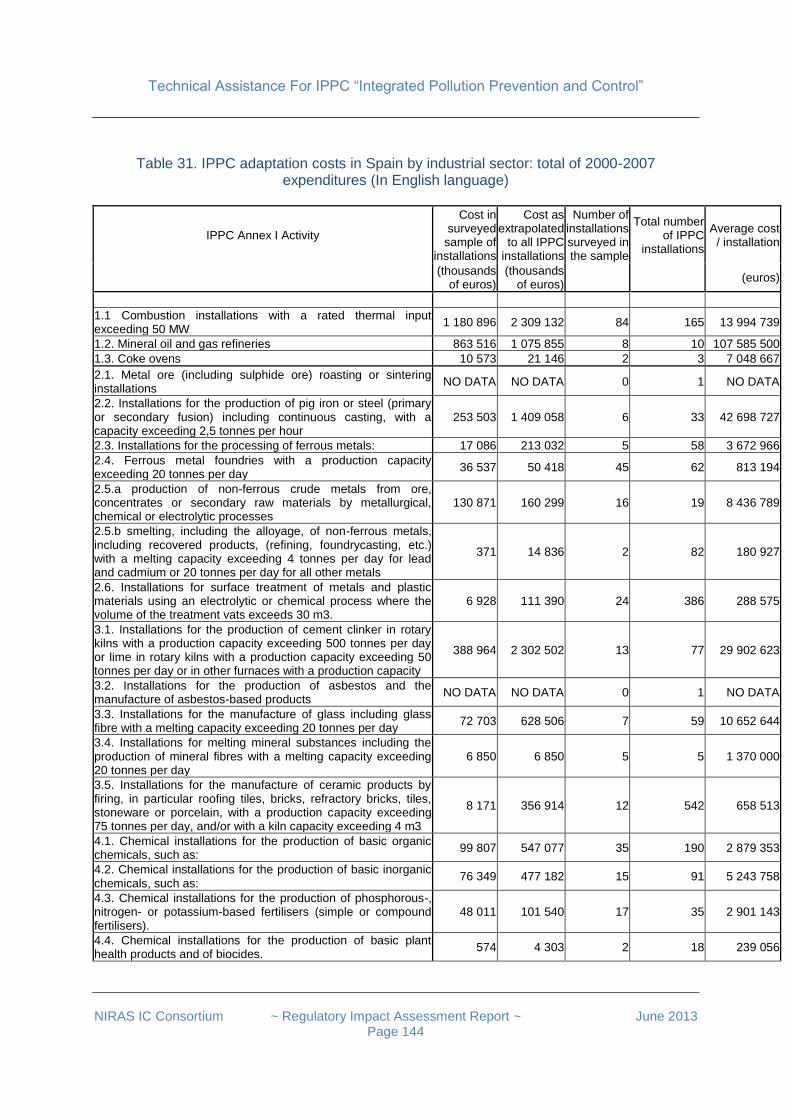
Technical Assistance For IPPC “Integrated Pollution Prevention and Control”
NIRAS IC Consortium ~ Regulatory Impact Assessment Report ~ June 2013
Page 144
Table 31. IPPC adaptation costs in Spain by industrial sector: total of 2000-2007 expenditures (In English language)
IPPC Annex I Activity
Cost in surveyed
sample of installations
Cost as extrapolated
to all IPPC installations
Number of installations surveyed in the sample
Total number of IPPC
installations
Average cost / installation
(thousands
of euros) (thousands
of euros) (euros)
1.1 Combustion installations with a rated thermal input exceeding 50 MW
1 180 896 2 309 132 84 165 13 994 739
1.2. Mineral oil and gas refineries 863 516 1 075 855 8 10 107 585 500
1.3. Coke ovens 10 573 21 146 2 3 7 048 667
2.1. Metal ore (including sulphide ore) roasting or sintering installations
NO DATA NO DATA 0 1 NO DATA
2.2. Installations for the production of pig iron or steel (primary or secondary fusion) including continuous casting, with a capacity exceeding 2,5 tonnes per hour
253 503 1 409 058 6 33 42 698 727
2.3. Installations for the processing of ferrous metals: 17 086 213 032 5 58 3 672 966
2.4. Ferrous metal foundries with a production capacity exceeding 20 tonnes per day
36 537 50 418 45 62 813 194
2.5.a production of non-ferrous crude metals from ore, concentrates or secondary raw materials by metallurgical, chemical or electrolytic processes
130 871 160 299 16 19 8 436 789
2.5.b smelting, including the alloyage, of non-ferrous metals, including recovered products, (refining, foundrycasting, etc.) with a melting capacity exceeding 4 tonnes per day for lead and cadmium or 20 tonnes per day for all other metals
371 14 836 2 82 180 927
2.6. Installations for surface treatment of metals and plastic materials using an electrolytic or chemical process where the volume of the treatment vats exceeds 30 m3.
6 928 111 390 24 386 288 575
3.1. Installations for the production of cement clinker in rotary kilns with a production capacity exceeding 500 tonnes per day or lime in rotary kilns with a production capacity exceeding 50 tonnes per day or in other furnaces with a production capacity
388 964 2 302 502 13 77 29 902 623
3.2. Installations for the production of asbestos and the manufacture of asbestos-based products
NO DATA NO DATA 0 1 NO DATA
3.3. Installations for the manufacture of glass including glass fibre with a melting capacity exceeding 20 tonnes per day
72 703 628 506 7 59 10 652 644
3.4. Installations for melting mineral substances including the production of mineral fibres with a melting capacity exceeding 20 tonnes per day
6 850 6 850 5 5 1 370 000
3.5. Installations for the manufacture of ceramic products by firing, in particular roofing tiles, bricks, refractory bricks, tiles, stoneware or porcelain, with a production capacity exceeding 75 tonnes per day, and/or with a kiln capacity exceeding 4 m3
8 171 356 914 12 542 658 513
4.1. Chemical installations for the production of basic organic chemicals, such as:
99 807 547 077 35 190 2 879 353
4.2. Chemical installations for the production of basic inorganic chemicals, such as:
76 349 477 182 15 91 5 243 758
4.3. Chemical installations for the production of phosphorous-, nitrogen- or potassium-based fertilisers (simple or compound fertilisers).
48 011 101 540 17 35 2 901 143
4.4. Chemical installations for the production of basic plant health products and of biocides.
574 4 303 2 18 239 056
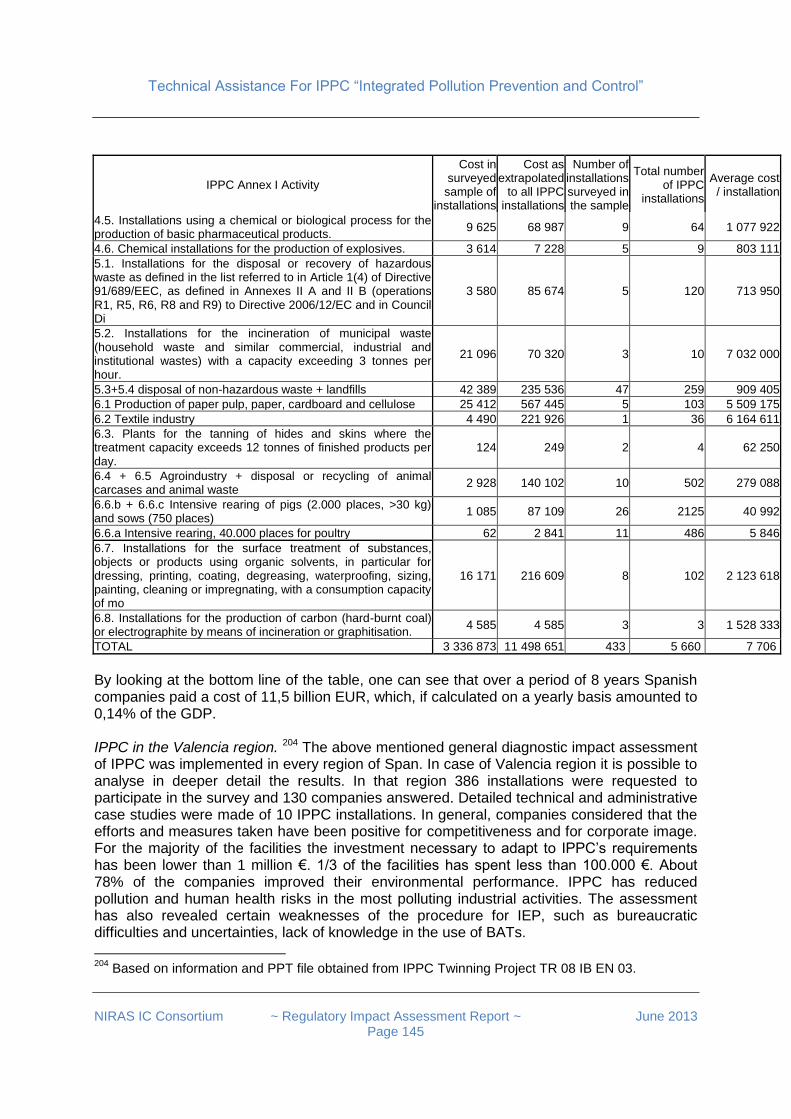
Technical Assistance For IPPC “Integrated Pollution Prevention and Control”
NIRAS IC Consortium ~ Regulatory Impact Assessment Report ~ June 2013
Page 145
IPPC Annex I Activity
Cost in surveyed
sample of installations
Cost as extrapolated
to all IPPC installations
Number of installations surveyed in the sample
Total number of IPPC
installations
Average cost / installation
4.5. Installations using a chemical or biological process for the production of basic pharmaceutical products.
9 625 68 987 9 64 1 077 922
4.6. Chemical installations for the production of explosives. 3 614 7 228 5 9 803 111
5.1. Installations for the disposal or recovery of hazardous waste as defined in the list referred to in Article 1(4) of Directive 91/689/EEC, as defined in Annexes II A and II B (operations R1, R5, R6, R8 and R9) to Directive 2006/12/EC and in Council Di
3 580 85 674 5 120 713 950
5.2. Installations for the incineration of municipal waste (household waste and similar commercial, industrial and institutional wastes) with a capacity exceeding 3 tonnes per hour.
21 096 70 320 3 10 7 032 000
5.3+5.4 disposal of non-hazardous waste + landfills 42 389 235 536 47 259 909 405
6.1 Production of paper pulp, paper, cardboard and cellulose 25 412 567 445 5 103 5 509 175
6.2 Textile industry 4 490 221 926 1 36 6 164 611
6.3. Plants for the tanning of hides and skins where the treatment capacity exceeds 12 tonnes of finished products per day.
124 249 2 4 62 250
6.4 + 6.5 Agroindustry + disposal or recycling of animal carcases and animal waste
2 928 140 102 10 502 279 088
6.6.b + 6.6.c Intensive rearing of pigs (2.000 places, >30 kg) and sows (750 places)
1 085 87 109 26 2125 40 992
6.6.a Intensive rearing, 40.000 places for poultry 62 2 841 11 486 5 846
6.7. Installations for the surface treatment of substances, objects or products using organic solvents, in particular for dressing, printing, coating, degreasing, waterproofing, sizing, painting, cleaning or impregnating, with a consumption capacity of mo
16 171 216 609 8 102 2 123 618
6.8. Installations for the production of carbon (hard-burnt coal) or electrographite by means of incineration or graphitisation.
4 585 4 585 3 3 1 528 333
TOTAL 3 336 873 11 498 651 433 5 660 7 706
By looking at the bottom line of the table, one can see that over a period of 8 years Spanish companies paid a cost of 11,5 billion EUR, which, if calculated on a yearly basis amounted to 0,14% of the GDP. IPPC in the Valencia region. 204 The above mentioned general diagnostic impact assessment of IPPC was implemented in every region of Span. In case of Valencia region it is possible to analyse in deeper detail the results. In that region 386 installations were requested to participate in the survey and 130 companies answered. Detailed technical and administrative case studies were made of 10 IPPC installations. In general, companies considered that the efforts and measures taken have been positive for competitiveness and for corporate image. For the majority of the facilities the investment necessary to adapt to IPPC’s requirements has been lower than 1 million €. 1/3 of the facilities has spent less than 100.000 €. About 78% of the companies improved their environmental performance. IPPC has reduced pollution and human health risks in the most polluting industrial activities. The assessment has also revealed certain weaknesses of the procedure for IEP, such as bureaucratic difficulties and uncertainties, lack of knowledge in the use of BATs.
204
Based on information and PPT file obtained from IPPC Twinning Project TR 08 IB EN 03.
Technical Assistance For IPPC “Integrated Pollution Prevention and Control”
NIRAS IC Consortium ~ Regulatory Impact Assessment Report ~ June 2013
Page 146
Lessons learnt from this impact assessment for Turkey.
Substantive. In Spain the yearly adaptation costs to IPPC amounted to 0,14 % of the GDP.
Methodological. It is feasible to implement a survey over IPPC installations in a country, which is representative for a wide range of IPPC categories.
Ireland: Investigation on pollution abatement costs (2010)205 A research project in Ireland has investigated which types of companies are ready to increase their environmental expenditures in order to decrease pollution. The following costs that companies have to incur were estimated: (a) operating expenses (e.g. monitoring, external consultant’s fees and costs associated by using less polluting input materials) and (b) capital investment into pollution control equipment. Regulatory changes. In Ireland certain forms of integrated permit systems were in force already since 1994, and IPPC was introduced in 2003. The regulatory pressure on increasing the environmental expenditures of companies were further increased in 2005 when the European Union’s Emissions Trading System (ETS) for CO2 permits came into force. The IPCC of course has wider scope than the EU ETS which solely targets carbon dioxide emissions. Data. The data set covers the responses of 1.491 companies in the mining, manufacturing and utilities sectors for the years 2006 and 2007 as collected by the Census of Industrial Production (CIP) of the Republic of Ireland. Methodology. The researchers have created a regression model where the main explanatory and control variables of environmental expenditures are company turnover, exports, purchases, fuel, additions to capital assets, sales of capital assets, indirect taxes, employment, earnings, other labour costs, company size, company age, exporting status, ownership, energy intensity, the share of water and refuse charges within the turnover, foreign ownership, industry sector and region. Since the statistical data set did not directly record whether a company is under the IPPC regulation or not, therefore the researchers have used (a) a published incomplete list of IPPC companies and (b) a list of companies to which IPPC most likely applied. The latter list was generated on the basis of NACE sectors and company size as measured by employment and turnover. An analogous procedure of estimation was applied to determine whether a particular company in the data base was under ETS.
205
"Corporate Expenditure on Environmental Protection." By Stefanie A. Haller and Liam Murphy. ESRI Working Paper No. 347. June 2010. In Cooperation with the Economic and Social Research Institute (ESRI), Dublin, Ireland.
Technical Assistance For IPPC “Integrated Pollution Prevention and Control”
NIRAS IC Consortium ~ Regulatory Impact Assessment Report ~ June 2013
Page 147
The results of descriptive statistics were as follows.
Annual expenses. Only 22.47% of companies reported positive environmental expenditure in 2007. Overall mean expenditure on the environment was €23,490 (by taking into consideration the non-spending companies as well) in 2007, and among companies that report spending positive values it was €104,480 There was some variation across industries, with companies in the chemicals, non-metallic minerals and food, beverages and tobacco sectors reporting the largest values. The indicators "environmental expenditure per industry turnover" is tiny at an average of 0.02%, whereby the chemicals sector reported the largest share. The shares in the machinery and equipment, office and data machinery, electrical instruments and transport goods sectors are about half of those in the remaining sectors.
Once-off costs. Regarding capital investment in equipment for pollution control, the share of companies that invested in equipment for pollution control was small at 4.5% of those investigated. The mean capital expenditure for the whole sample was €22,670 and €522,900 for those that reported positive investments. The chemicals sector is prominent as well as the food, beverages and tobacco and the machinery and equipment reporting somewhat larger than average values. The indicator of " investment in equipment for pollution control per total capital investment" is highest in the wood and transport goods sectors.
Regression results. Companies for which environmental concerns are most costly in terms of production and image do most to address them. In particular:
Annual expenses. As for annual environmental expenditures, larger, exporting companies and companies subject to IPPC are most likely make such expenditures. Once the decision to commit resources has been taken, larger companies, companies that are foreign-owned, and companies that a low report a low level of water and refuse charges in turnover have higher absolute levels of environmental expenditure.
Once-off costs. Regarding investment in equipment for pollution control, energy intensive and exporting companies are more likely to make such investments. Once the decision to invest has been taken, larger companies and companies that report high water and refuse charges invest more in equipment for pollution control.
Lessons learnt from this impact assessment for Turkey.
Substantive. In a particular year only a small minority of companies invest into pollution abatement equipment, e.g. one in twenty. Among exporting companies and energy intensive companies the likelihood of investing in pollution abatement equipment is higher. For those companies which invest into pollution abatement equipment, the average value of this investment is approximately half a million EUR.
Methodological. Turkey should introduce the surveying of environmental costs into its industrial statistics206. Researchers should be encouraged to analyse the resulting data base.
206
The respective EU methodology is available in the following publication: “Environmental expenditure statistics: Industry data collection handbook”. European Communities, 2005.
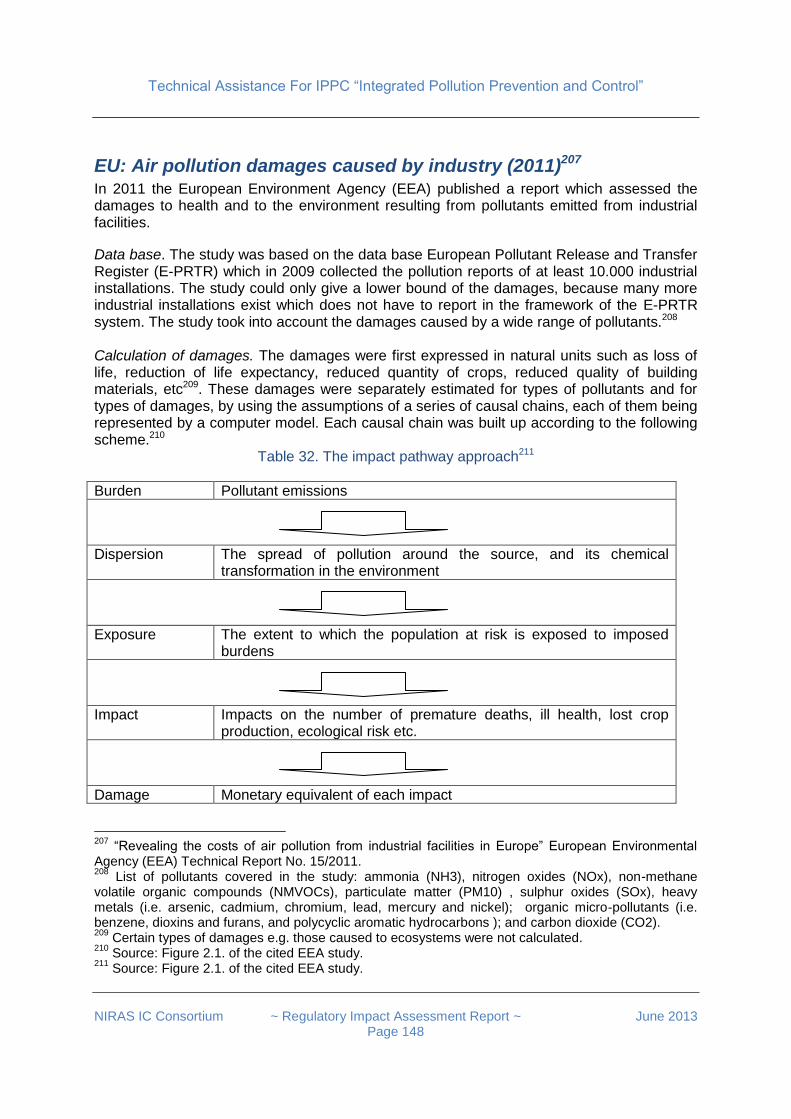
Technical Assistance For IPPC “Integrated Pollution Prevention and Control”
NIRAS IC Consortium ~ Regulatory Impact Assessment Report ~ June 2013
Page 148
EU: Air pollution damages caused by industry (2011)207 In 2011 the European Environment Agency (EEA) published a report which assessed the damages to health and to the environment resulting from pollutants emitted from industrial facilities.
Data base. The study was based on the data base European Pollutant Release and Transfer Register (E-PRTR) which in 2009 collected the pollution reports of at least 10.000 industrial installations. The study could only give a lower bound of the damages, because many more industrial installations exist which does not have to report in the framework of the E-PRTR system. The study took into account the damages caused by a wide range of pollutants.208 Calculation of damages. The damages were first expressed in natural units such as loss of life, reduction of life expectancy, reduced quantity of crops, reduced quality of building materials, etc209. These damages were separately estimated for types of pollutants and for types of damages, by using the assumptions of a series of causal chains, each of them being represented by a computer model. Each causal chain was built up according to the following scheme.210
Table 32. The impact pathway approach211
Burden Pollutant emissions
Dispersion The spread of pollution around the source, and its chemical transformation in the environment
Exposure The extent to which the population at risk is exposed to imposed burdens
Impact Impacts on the number of premature deaths, ill health, lost crop production, ecological risk etc.
Damage Monetary equivalent of each impact
207
“Revealing the costs of air pollution from industrial facilities in Europe” European Environmental Agency (EEA) Technical Report No. 15/2011. 208
List of pollutants covered in the study: ammonia (NH3), nitrogen oxides (NOx), non-methane volatile organic compounds (NMVOCs), particulate matter (PM10) , sulphur oxides (SOx), heavy metals (i.e. arsenic, cadmium, chromium, lead, mercury and nickel); organic micro-pollutants (i.e. benzene, dioxins and furans, and polycyclic aromatic hydrocarbons ); and carbon dioxide (CO2). 209
Certain types of damages e.g. those caused to ecosystems were not calculated. 210
Source: Figure 2.1. of the cited EEA study. 211
Source: Figure 2.1. of the cited EEA study.
Technical Assistance For IPPC “Integrated Pollution Prevention and Control”
NIRAS IC Consortium ~ Regulatory Impact Assessment Report ~ June 2013
Page 149
For each pollutant the researchers quantified the pollutant emission, described its geographical dispersion and the extent to which the population was exposed, applied a concentration-response function and finally evaluated the economic impact. If the pollutant reaches the human body through more complex routes (e.g. directly through air and indirectly through water, animals and food), the model was more complex. Converting natural units into monetary terms. All types of damages were expressed in monetary terms. For example, according to one valuation method used in the study, the so-called “value of statistical life” was assumed to be 2,08 million EUR.212 Findings. The cost of damage caused by emissions from the E-PRTR industrial facilities in 2009 was estimated as amounting to at least EUR 102–169 billion. A small number of industrial facilities cause the majority of the damage costs to health and the environment. Fifty per cent of the total damage cost occurred as a result of emissions from just 191 out of the approximately 10 000 facilities that reported at least some data for releases to air in 2009. Three quarters of the total damage costs are caused by the emissions of 622 facilities, which comprise 6 % of the total number. By sectors of the economy: LCPs cause two-thirds of the reported damages. However, the sectoral distribution of damages is biased, because pollution is underreported in those sectors which operate with many small installations. The estimated costs are as follows
Emissions from the power generating sector contribute the largest share of the damage cost, estimated at EUR 66–112 billion EUR. The remaining damage costs are distributed between:
Combustion within various manufacturing processes: 10 to 20 billion EUR
Other, non-combustion industrial production processes: 23 to 25 billion EUR,
Agriculture: 2 to 5 billion EUR,
Waste management: 3 to 4 billion EUR. By countries: the East-West slope. In absolute terms pollution and pollution-caused damages are highest in the more developed Western MSs of the EU, but if the damages are expressed as a percentage of GDP, this indicator is the higher in Central and Easten European MSs of the EU. Lessons learnt from this impact assessment for Turkey.
Substantive. Two thirds of damages caused by air pollution can be attributed to LCPs. A small percentage of facilities, a well identifiable group of large polluters, cause most of the damages.
Methodological. Researchers creating a weighted sum of harms caused to persons, crops, nature and infrastructure use money as a common denominator.
212
Source: table A1.3 of the cited EEA study.
Technical Assistance For IPPC “Integrated Pollution Prevention and Control”
NIRAS IC Consortium ~ Regulatory Impact Assessment Report ~ June 2013
Page 150
Turkey: RIA of NECD213 for air pollution emission control (2012)214 The study presented in this chapter was the outcome of an EU co-financed project on behalf of MoEU. NECD sets upper limits for EU MSs for the total emissions in 2010 of the four pollutants responsible for acidification, eutrophication and ground-level ozone pollution215, but leaves it largely to the Member States to decide which measures – on top of Community legislation for specific source categories - to take in order to comply. Methodology. This project has compared the costs and benefits of various emission control strategies that were defined for Turkey. The calculation of emissions, of pollution abatement costs, of health related and other benefits of implementing these strategies was extended up to 2025. Health, mortality and other benefits were converted into money terms by using standard techniques. The study also includes a RIA of introducing NECD in Turkey with a complete cost-benefit analysis implemented for the previously defined strategies. The level of detail of the assessment was defined at the level of those 4 pollutants for which NECD has set emission limits. The pollution behavior of the Turkish economy is analysed at the level of 6 sectors: (a) Electricity generation, (b) Industry, (c) Road transport, (d) Residential combustion, (e) Agriculture (livestock), (f) Agriculture (fertilisers). The investigated strategies and the respective scenarios. The range of scenarios defined in the Report included the “Business as usual” strategy, while other strategies were defined which included other direct measures for improving air quality and other indirect policy measures. The researchers have identified, detailed and recommended a particular strategy, the so-called EMS (Emission Management Strategy) and have calculated its costs and benefits as well.
In particular, for the electricity generating sector, in the framework of the EMS (Emission Management Strategy) the researchers recommended a wide range of pollution reduction measures such as:
To increase the use of zero-emission sources (hydro, wind, geothermal, nuclear and solar)
To introduce emissions control at fuel-fired electricity generation stations through the application of Best Available Techniques216
To implement a wide range of energy efficiency measures217
To switch from high-sulphur fuels to low-sulphur fuels.
213
NECD = Directive 2001/81/EC of the European Parliament and the Council on National Emission Ceilings for certain pollutants. 214
“Improving Emissions Control - NECD Emissions Management Strategies, Possible Emission Ceilings and RIA.” Version 1 – 02 August 2012. By Russell Frost, Peter Newman, Chris Dore. Report by the Project EuropeAid/128897/D/SER/TR. Implementing Authority / Beneficiary: Ministry of Environment and Urbanisation. Service Contract Number: TR0802.03-02/001. 215
Sulphur dioxide, nitrogen oxides, volatile organic compounds and ammonia. 216
For more detail see the Chapter about the Energy Industry. 217
Such as (a) improvements in the efficiency of the electricity transmission grid, (b) better insulation of homes, institutional and commercial buildings, etc.
Technical Assistance For IPPC “Integrated Pollution Prevention and Control”
NIRAS IC Consortium ~ Regulatory Impact Assessment Report ~ June 2013
Page 151
The algorithm of the cost-benefit analysis218. The economic appraisal for the electricity generating sector compared the “Business as usual” scenario and the scenario under the recommended EMS strategy. A stream of costs or benefits was defined as a time series of money values between 2010 and 2025. The calculation included the identification and discounting of 3 X 3 = 9 streams of costs and 3 X 3 = 9 streams of benefits.
Calculations were made separately for 3 combustion technologies: (a) existing lignite-fired, (b) new lignite-fired and (c) new coal-fired stations.
Within the above 3 combustion technology categories, calculations were made separately for 3 emissions control technologies: (a) FGD for SO2 abatement, (b) Low-NOx burners (LNB) and staged-air (SA) to limit NOx emissions, (c) and selective catalytic reduction (SCR) for NOx emissions abatement.
Capital and operating costs were merged into one cost item (a) per year (b) per combustion technology (c) per emissions control technology. By calculating the net present values of the above 9 time series, the merits of each of the 9 development measures could be assessed. The underlying data base was based on a series of assumptions about (a) the number of existing power plants by combustion technology and (b) about their technological levels. Results: damages caused by air pollution. Under the “Business as usual Scenario” now and up to 2025 most harm is caused by the emissions of SO2 (predominantly) and NOx. The study found that the electricity generating sector and in particular, fuel combustion is critically important because it is responsible for emitting almost two-third of SO2 and about one third of NOx. Other sectors, such as Industrial production, Residential Heating and Road transport are emitting the bulk of NMVOC. Less harm219 is caused by NH3 emissions from the agricultural sector (livestock rearing and fertiliser application to land). Results of the Cost-Benefit calculation. The cumulative costs to 2025 (at 2010 price levels) of emissions control to meet the identified possible ceilings are estimated as lying in a range from €15 billion to over €20 billion with the full EMS in place. In implementing its EMS for SO2 and NOx emissions, the electricity generating sector will incur significant capital and operating costs up to 2025. The sum of discounted costs is estimated at a little over €18 billion at year 2010 prices. However, the cumulative benefits220 are much higher (€134 billion) outweigh the costs to a very significant extent. The measures of the EMS Strategy are affordable at the national level: estimated annual expenditure peaks at a little over 0.2% of GDP in the period 2020-2024. Prices paid by households and industrial consumers of electricity might increase by about 3% and 4.5% respectively. Lessons learnt from this impact assessment for Turkey.
Substantive. Fuel combustion for electricity generating purposes is responsible for emitting almost two-third of SO2 and about one third of NOx. Cumulated pollution abatement costs for the Turkish electricity sector for the period 2010 to 2025 is estimated to be somewhat over €18 billion at year 2010 prices. Estimated annual expenditures amount to 0,1% - 0,2% of GDP.
218
See Annex 2 of the cited Report. 219
In monetary terms. 220
Including the monetised value of reduced health and mortality damages.

Technical Assistance For IPPC “Integrated Pollution Prevention and Control”
NIRAS IC Consortium ~ Regulatory Impact Assessment Report ~ June 2013
Page 152
Methodological. An analogous Impact Assessment should be prepared for water pollution.
Annex 2: Implementation of IPPC and IED in Some Countries
Implementation of IPPC in the Mediterranean Area A recent study221 has evaluated the implementation of the IPPC Directive in seven European Mediterranean regions222. Implementation was compared according to the he following aspects: (a) laws that implemented the Directive, (b) the administrative procedure of issuing permits, (c) control/ inspection system in facilities applying for permits, (d) content of the permits and (c) requirements to meet in order to get a permit. Legislation, level of public administration. IPPC has been introduced in all of these countries by national laws. However, in Italy and in Spain regional laws have also promulgated the Directive and Competent Authorities are working on national, regional and provincial level as well. Public participation. Countries vary according to the modalities adopted to assure the access to information and public participation in the permitting procedure. Italian Competent Authorities record the permit application document in specific offices and call the attention of the public via advertisements in newspapers and other media. The other investigated countries apply one or more of the following methods: (a) Publication of permit and other documents in the Official Gazette of Government and/or in City/Government bulletins (b) Publication of emissions of specific pollutants of IPPC installations in the Pollutant Release and Transfer Register (c) Personal notification communicated to neighboring population of installations (d) Publication of teh permit procedure in the Table of Statements of the Prefecture (e) Publication on a specific IPPC portal or website (f) Training/seminars/workshops for operators about their dissemination and consultation duties and the organisation of public debates and round tables. Institutionalisation. The following types of institutions are involved in the permitting procedure: (a) National institution (b) Regional institution (c) Local institution (d) Specialised public institution (e.g. river basin authority) (e) Other technical public departments (e.g. Fire Departments) (f) Public health and safety authority (g) NGOs.
221
The Implementation of IPPC Directive in the Mediterranean Area. By Tiberio Daddi, Maria Rosa De Giacomo, Marco Frey, Francesco Testa and Fabio Iraldo. Scuola Superiore di Studi Universitari e di Perfezionamento S. Anna, Pisa, Italy. In: “Environmental Management in Practice", book edited by Elzbieta Broniewicz, ISBN 978-953-307-358-3, Published: July 5, 2011. 222 Andalusia, Valencia (Spain), Piedmont, Sicily, Tuscany (Italy), Slovenia, West Macedonia (Greece)
Technical Assistance For IPPC “Integrated Pollution Prevention and Control”
NIRAS IC Consortium ~ Regulatory Impact Assessment Report ~ June 2013
Page 153
Duration. The researchers have compared the regions according to the duration of time necessary for the first issuing of integrated environmental permit. in all investigated regions authorities issue the permit within 5 to 10 months after receiving the application. Administrative simplifications. The authorities have granted certain administrative simplifications in the permitting procedure for particular categories of enterprises. In particular, in Spain authorities allow the use of simplified permit application documents for (a) farming installations (b) for installations with registered EMAS systems. Moreover, in Spain installations with registered EMAS systems or with certified ISO 14001 enjoy certain simplifications in the inspection / control procedures. As of Italian authorities, for enterprises with registered EMAS or certified ISO 14001 they issue permits (a) with longer validity and (b) with reduced fees. One of the suggestions of the study was to standardize favourable conditions granted to EMAS-registered companies at the EU level. Non-compliance. The researchers have identified the most frequent reasons of non-compliance: (a) installation failing to comply with the requirements contained in the permit (b) irregular data transmission to authorities (c) incorrect measurements due to wrong positioning, operation, calibration or maintenance of measuring instruments. Requirements / ELVs. The research has demonstrated that environmental requirements strongly vary across regions. For example, the requirements of how operators should protect the soil and groundwater from contamination are differently enforced in each country. Moreover, Emission Limit Values related to industrial water emissions differ strongly between the investigated regions.
Bulgaria223 The negotiations between Bulgaria and the EU on Chapter 22 “Environment” started in 2001 and were closed in November 2004. The negotiations process covered all environmental directives, including the transposition and implementation of the IPPC, LCP and VOC directives and the implementation and enforcement of the Seveso directive in Bulgaria. IPPC. Bulgaria has initially requested to introduce IPPC by the end of 2011. For IPPC negotiations and agreements were made on an installation by installation approach. Various transitional periods were negotiated for 41 out of 242 installations, such as (a) 2008 – 5 installations (b) 2009 – 1 installation (c) until 2011 – 35 installations. The IPPC directive was transposed in 2002/2003 by modifying a law and issuing a decree.224 Seven methodologies were issued by the Minister of Environment and Water. Between 2003 and 2007 altogether 153 integrated permits were issued.
223
Transposition and implementation of the IPPC, LCP, SEVESO II, VOC Directives – experience and lessons learnt. By Kalin Iliev, Nikolay Savov. Ministry of Environment and Water, Bulgaria. 2
nd ECENA
Plenary Meeting September 17-18, 2007, Brussels, Belgium 224
Environmental Protection Act (SG 91/2002) – Chapter VІІ, Section ІІ – “Integrated Permits and by the Ordinance on the terms and procedure for issuance of integrated permits (SG 26/2003)
Technical Assistance For IPPC “Integrated Pollution Prevention and Control”
NIRAS IC Consortium ~ Regulatory Impact Assessment Report ~ June 2013
Page 154
For LCP Bulgaria has also requested that the transition periods should be determined on a plant-by-plant basis for four of its existing 36 thermal power plants. The “Varna” and “Bobov dol” TPPs obtained deadlines until 2014, while the “Rousse – east” and “Lukoil Neftochim” TPPs obtained deadlines until 2011. LCP was introduced in Bulgaria in 2003 225 . As of 2007, 31 LCPs have obtained integrated permits, 2 have decreased their capacity below 50 MWs and 3 have been decommissioned.
Hungary Transposition. Hungary has introduced integrated environmental permitting in 2001 by issuing a Government decree226. The decree is enforced since 30 October 2003 for new installations and since 30 October 2007 for all installations. The public has access to information and may participate in the permitting procedure due to the fact that any person or organisation may make comments before the permit decision is made, furthermore, the permit issued is available them for review. The public is informed about the procedure through the local notaries. In 2003 the Department of Integrated Pollution Prevention and Environment Control of the Ministry for Environment and Water has launched a wide ranging awareness raising campaign227 with the help of an IPPC PHARE Twinning Project. Implementing IED. In 2012 the Ministry for Rural Development (which since 2010 is responsible for implementing environment protection policy) has launched a so-called Transitional National Plan228 for reducing the pollution of LCPs. This Plan is equivalent with the implementation of IED in Hungary in case of LCPs. The Plan determines emission levels for SO2, NOx and dust, identifies altogether 16 combustion installations operated by 9 plants, specifies for these installations in detail all those measures that operators must take in order to meet these requirements, sets a deadline of 1 January 2016 for meeting the above requirements and defines a schedule of emission reduction up to 2020.
225
Regulation No 10 of 6 October 2003 on ELVs (concentrations in waste gases) of sulphur dioxide, nitrogen oxides and total dust discharged into the air from large combustion plants 226
Government Decree 193/2001 (X. 19.) 227
IPPC in Hungary - a new approach to environment protection. By Department of Integrated Pollution Prevention and Environment Control of the Ministry for Environment and Water. December 2003. 228
“Magyarország átmeneti nemzeti terve a nagy tüzelöberendezesek légszennyezöanyag kibocsatásának csökkentésére az ipari kibocsátásokrol szolo 2010/751 EU europai parlamenti és tanácsi iranyelv 32. cikke alapján”. Vidékfejlesztesi Miniszterium, 2012.
Technical Assistance For IPPC “Integrated Pollution Prevention and Control”
NIRAS IC Consortium ~ Regulatory Impact Assessment Report ~ June 2013
Page 155
Poland229 Transposition. In Poland IPPC was introduced in 2001 by amending existing environmental laws230. This was followed by issuing executive orders about its implementation.231 The regulations allowed one integrated permit for all IPPC installations located at one site. IPPC permits are granted for a limited time: maximum for 10 years. A regular review of the integrated permits occurs at least every 5 years. Deadlines. New installation must have IPPC permit before starting operating, existing installations according to a schedule, as originally planned not later than 31.10.2007.232 Problematic sectors and installations obtained extra transition periods according to the following schedule:
2004: cement and lime, pig farms
2005: pulp and paper, textile, poultry farms
2006: energy, glass, ceramic, food, chemicals, waste (excluding landfills)
2007: landfills, metallurgy, coke ovens
2010: Large Combustion Plants between 50 and 300 MW, Specific municipal waste landfills (those receiving 10-20 t / day).
Deadline extension. Poland negotiated a 3 years transitional period and thus extended the deadline for full compliance with BAT till 31.12.2010 for three groups of installations: (a) municipal heat sources with a rated thermal input between 50 and 300 MW (b) municipal waste landfills receiving 10-20 tones per day (c) 65 large installations that were implementing compliance programs. Institutionalisation of IPPC implementation. . A division of work was established according to which the Ministry of Environment Protection coordinates, and the regions and provinces as competent agencies execute the regulations The Competent Authority is the Ministry of Environment, while the permit granting Authorities are located at the Voivodeship level ( 16 regional administrations, 1116 installations in 2009) for installation that can have a significant impact on environment, and the Starost level (380 county administrations, 854 installations in 2009) for other installations of IPPC Annex 1. An IPPC Inventory was set up and regularly updated: by 2013 altogether 3.270 IPPC installations were identified in all sectors covered by the Directive. A National BAT Center was established within the structure of Ministry of Environment. Technical Working Groups were established for different IPPC sectors. Public participation in IPPC permitting was institutionalized.
229
Sources: (a) Implementation of IPPC in Spain & Poland. Presentation of Cesar Soanez at the Training Course of the IPPC Twinning Project TR/2008/IB/EN/03. (b) IPPC implementation in Poland – special focus on public participation in process of issuing IPPC permits. PPT presentation of Artur Dąbrowski, presented at TAIEX Event “INFRA 32645”, Ankara, Turkey, 5-6 November 2009. 230
Act on the Amendment of the Environmental Protection Law, the Waste Act and Certain Acts. The provisions transposing IPPC requirements entered into force on 1.January 2002. 231
(a) Regulation of 26.07.2002 of the Ministry of Environment on the types of installations that cause considerable pollution of particular elements of nature and environment as a whole (transposition of Annex1) (b) Regulation of 04.11.2002 of the Ministry of Environment on the registration fees (c) Regulation of 08.04.2003 of the Ministry of Environment on the types of installations for which the operators may apply for compliance programs. 232
Schedule for individual sectors are determined in detail in Regulation of MoE of 26.09.2003)

Technical Assistance For IPPC “Integrated Pollution Prevention and Control”
NIRAS IC Consortium ~ Regulatory Impact Assessment Report ~ June 2013
Page 156
Information dissemination activities. An IPPC website was created. Guidelines and manuals were created and published. A number of relevant BREFs were translated into Polish and displayed on a website.. Training courses were held for staff of public administration and conferences and seminars for industry experts. PHARE and bilateral projects were launched for facilitating implementation. In Poland the costs of adaptation for companies233 depended on the particular sector and on the initial environmental performance of the installations. Approximately 60% of the installations were able to fulfill IPPC requirements with their existing pollution abatement infrastructure, a further 20% of the installations needed high investment expenditures and approximately 20% of the installations did not respond to the survey questionnaire. The Government granted fiscal benefits for environmental investments. Financing environment friendly energy generation234. The Strategic program "Advanced technologies of energy generation" supportes projects aimed at high energy efficiency, low emission technologies, resource efficiency and the development of Renewable Energy technologies. The programmes are implemented by "National Centre for Research and Development". The planned co-financing in 2010-2015 is 73 million EUR. Examples for subsidized projects:
A research study prepared on behalf of ”Laziska” Powerstation demonstrated that with the proper selection of coal and technology a desulphurisation rate (SOx) up to 93,0÷94,1 % can be achieved.
Another study demonstrated that NOx and PM emissions of LCPs fueled with pulverised bitumenous coal can be reduced deeply below the respective ELVs.
An investment project aiming at efficient power generation financed the extension of the Lublin-Wrotków Power Plant with a Gas-Steam Unit.
Another investment project aiming at efficient power generation financed the extension of Rzeszów Power Plant with a Gas-Steam Unit. The investment reduced SO2 emission by more than 80%, and NOx, CO2 and dust emission (each one of them) by half.
Financing is available from European funds:
Following Poland's accession to the EU the Structural Funds financed projects in the framework of the " Operational Programme Infrastructure and Environment" for enterprises. In particular, in this OP Priority Axis IX is "Environment-friendly energy infrastructure and energy efficiency" and the main objective of the Priority Axis is to decrease the impact of the energy sector on the environment.
Cohesion funds financed environment and transport projects of less developed regions
Bilateral aid programmes with environmentally relevant priorities are operating. (Norwegian Financial Mechanisms, USAID)
233
Source: Implementation of IPPC in Spain & Poland. Presentation of Cesar Soanez at the Training Course of the IPPC Twinning Project TR/2008/IB/EN/03. 234
“Available funds for the LCP directive implementation”. By Gerard Lipinski, Coordinator of Strategic Program “”Advanced technologies for energy generation”. The National Centre for Research and Development (Poland). Presented on the “Technical Workshop on the retrofitting of combustion plants in the Energy Community contracting parties”. Vienna, 31 October 2012.
Technical Assistance For IPPC “Integrated Pollution Prevention and Control”
NIRAS IC Consortium ~ Regulatory Impact Assessment Report ~ June 2013
Page 157
Moreover, for analogous purposes preferential credits are available from:
European Bank for Reconstruction and Development;
Targeted funds in State owned banks;
Commercial banks.
Romania235 Europeanisation of industrial pollution regulation. In Romania by 2007 all EU environmental directives -on control of industrial pollution were transposed into national legislation, including IPPC, LCP, Seveso II, Waste Landfill, VOC Directives. The deadlines regarding compliance or the closure of the installation for the involved companies are attached to national legislation and they are regularly checked through environmental inspections. Specific inspection guides were developed for the majority of EU directives, with the help of twinning programmes. Reports for each directive on the control of Industrial pollution are regularly sent to European Commission. IPPC. In particular, Romania has transposed IPPC directive (96/61/CE) by issuing a new law and a decree in 2005-2006236. The authorities registered each of the 660 IPPC installation237 and follow the environmental performance of those 161 IPPC installations which have received transition periods. IPPC permits are issued at regional level. By 2007 out of the 499 installations without transition period 447 have obtained IPPC permits.
Annex 3: Legal Evaluation of Draft Regulation on Integrated Environmental Permitting
238
The EU Twinning Project “Decreasing Industrial Pollution IPPC & Industrial Emissions Directives” has prepared a Draft Regulation on Integrated Environmental Permit. The Draft Regulation has been prepared to transpose Chapters I and II of the Industrial Emissions Directive (2010/75/EU) with the exception of Article 23 of the IED which addresses Environmental Inspections. This Evaluation has the aim of examining the concordance between the Draft Regulation and the IED.
235
Romanian experience on the transposition and implementation of the IPPC, LCP, Seveso II, Waste Landfill, VOC Directives – experience and lessons learnt. Ms. Madalina Gherasim (General Commissariat Bucharest), Mr. Costa Stanisav (Regional Commissariat Cluj-Cluj County Commissariat) Ministry of Environment and Sustainable Development, National Environmental Guard. . 2
nd ECENA Plenary Meeting September 17-18, 2007, Brussels, Belgium
236 Emergency Governmental Ordinance no. 152/2005 and Law no. 84/2006
237 2007 numbers
238 This annex was prepared by Iain Maclean 25th April 2013

Technical Assistance For IPPC “Integrated Pollution Prevention and Control”
NIRAS IC Consortium ~ Regulatory Impact Assessment Report ~ June 2013
Page 158
It is noted that the version of the Draft Regulation that was examined is the latest version available and not necessarily the final draft. It is further noted that the translation may be responsible for some of the gaps identified. Comments
It is noted that the Draft Regulation does not attempt to address the topics of large combustion plants and incineration/co-incineration which are the subject of Chapters III and IV of the IED and thus all reference to combustion plants and incineration/co-incineration have been removed from the Draft Regulation. It is noted that technical difficulties in permitting may be experienced for example in the food sector where in the case of larger installations there is usually an associated large combustion plant. Even in the case of smaller installations almost inevitably there is an associated combustion plant. It is further noted that technical difficulties in permitting may be experienced for example in the cement sector where the use of co-incineration is frequently encountered.
Table 33. Comparison of the Industrial Emissions Directive and of the Draft Regulation on Integrated Environmental Permit
Article Industrial Emissions Directive
Text from Industrial Emissions Directive 2010/75/EU
Reference to Draft Regulation on Integrated Environmental Permit
1 Subject matter
Comment on Text of Draft Regulation
This Directive lays down rules on integrated prevention and control of pollution arising from industrial activities. It also lays down rules designed to prevent or, where that is not practicable, to reduce emissions into air, water and land and to prevent the generation of waste, in order to achieve a high level of protection of the environment taken as a whole.
NA (Not Applicable)
2 Scope
2(1) This Directive shall apply to the industrial activities giving rise to pollution referred to in Chapters II to VI.
NA
2(2) This Directive shall not apply to research activities, development activities or the testing of new products and processes.
Article 1(3) excludes research and development activities from permitting
3 Definitions
3(1) ‘substance’ means any chemical element and its compounds, with the exception of the following substances: (a) radioactive substances as defined in Article 1 of Council Directive 96/29/Euratom of 13 May 1996
Article 3(1)(n) contains the definition of “substance”. This definition excludes the radioactive substances defined in Article 2 of the Radiation Safety Decree published in the Official
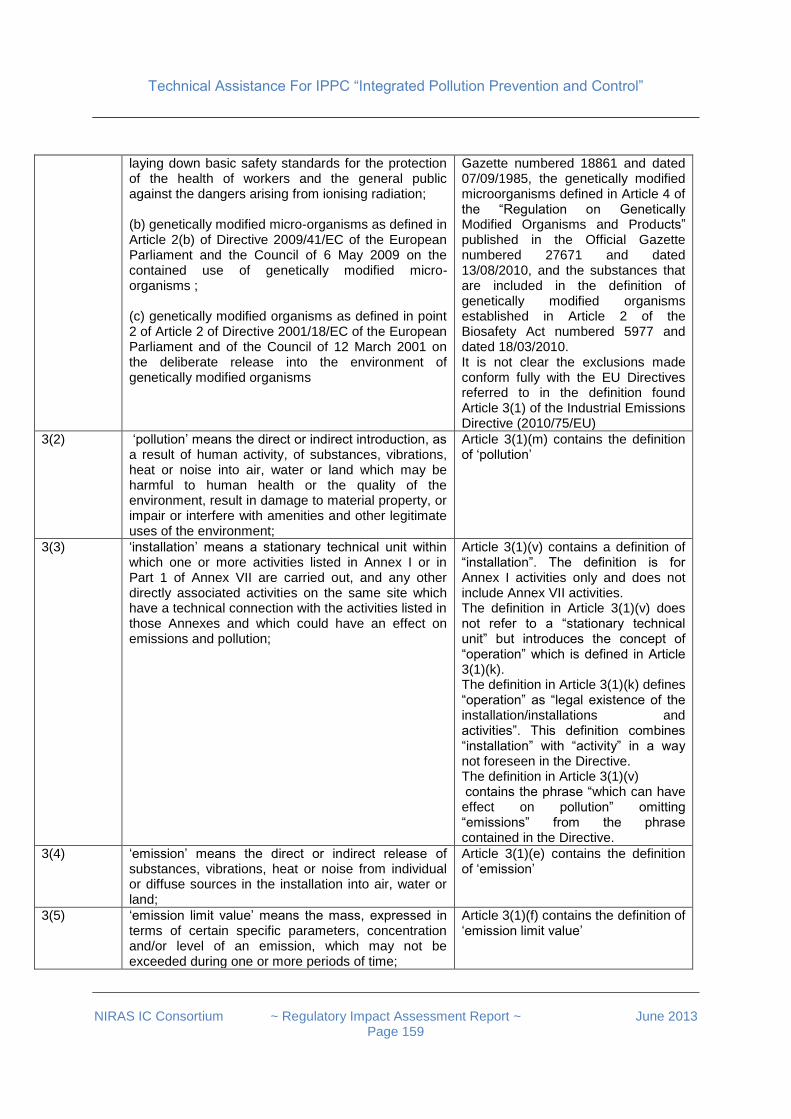
Technical Assistance For IPPC “Integrated Pollution Prevention and Control”
NIRAS IC Consortium ~ Regulatory Impact Assessment Report ~ June 2013
Page 159
laying down basic safety standards for the protection of the health of workers and the general public against the dangers arising from ionising radiation; (b) genetically modified micro-organisms as defined in Article 2(b) of Directive 2009/41/EC of the European Parliament and the Council of 6 May 2009 on the contained use of genetically modified micro-organisms ; (c) genetically modified organisms as defined in point 2 of Article 2 of Directive 2001/18/EC of the European Parliament and of the Council of 12 March 2001 on the deliberate release into the environment of genetically modified organisms
Gazette numbered 18861 and dated 07/09/1985, the genetically modified microorganisms defined in Article 4 of the “Regulation on Genetically Modified Organisms and Products” published in the Official Gazette numbered 27671 and dated 13/08/2010, and the substances that are included in the definition of genetically modified organisms established in Article 2 of the Biosafety Act numbered 5977 and dated 18/03/2010. It is not clear the exclusions made conform fully with the EU Directives referred to in the definition found Article 3(1) of the Industrial Emissions Directive (2010/75/EU)
3(2) ‘pollution’ means the direct or indirect introduction, as a result of human activity, of substances, vibrations, heat or noise into air, water or land which may be harmful to human health or the quality of the environment, result in damage to material property, or impair or interfere with amenities and other legitimate uses of the environment;
Article 3(1)(m) contains the definition of ‘pollution’
3(3) ‘installation’ means a stationary technical unit within which one or more activities listed in Annex I or in Part 1 of Annex VII are carried out, and any other directly associated activities on the same site which have a technical connection with the activities listed in those Annexes and which could have an effect on emissions and pollution;
Article 3(1)(v) contains a definition of “installation”. The definition is for Annex I activities only and does not include Annex VII activities. The definition in Article 3(1)(v) does not refer to a “stationary technical unit” but introduces the concept of “operation” which is defined in Article 3(1)(k). The definition in Article 3(1)(k) defines “operation” as “legal existence of the installation/installations and activities”. This definition combines “installation” with “activity” in a way not foreseen in the Directive. The definition in Article 3(1)(v) contains the phrase “which can have effect on pollution” omitting “emissions” from the phrase contained in the Directive.
3(4) ‘emission’ means the direct or indirect release of substances, vibrations, heat or noise from individual or diffuse sources in the installation into air, water or land;
Article 3(1)(e) contains the definition of ‘emission’
3(5) ‘emission limit value’ means the mass, expressed in terms of certain specific parameters, concentration and/or level of an emission, which may not be exceeded during one or more periods of time;
Article 3(1)(f) contains the definition of ‘emission limit value’
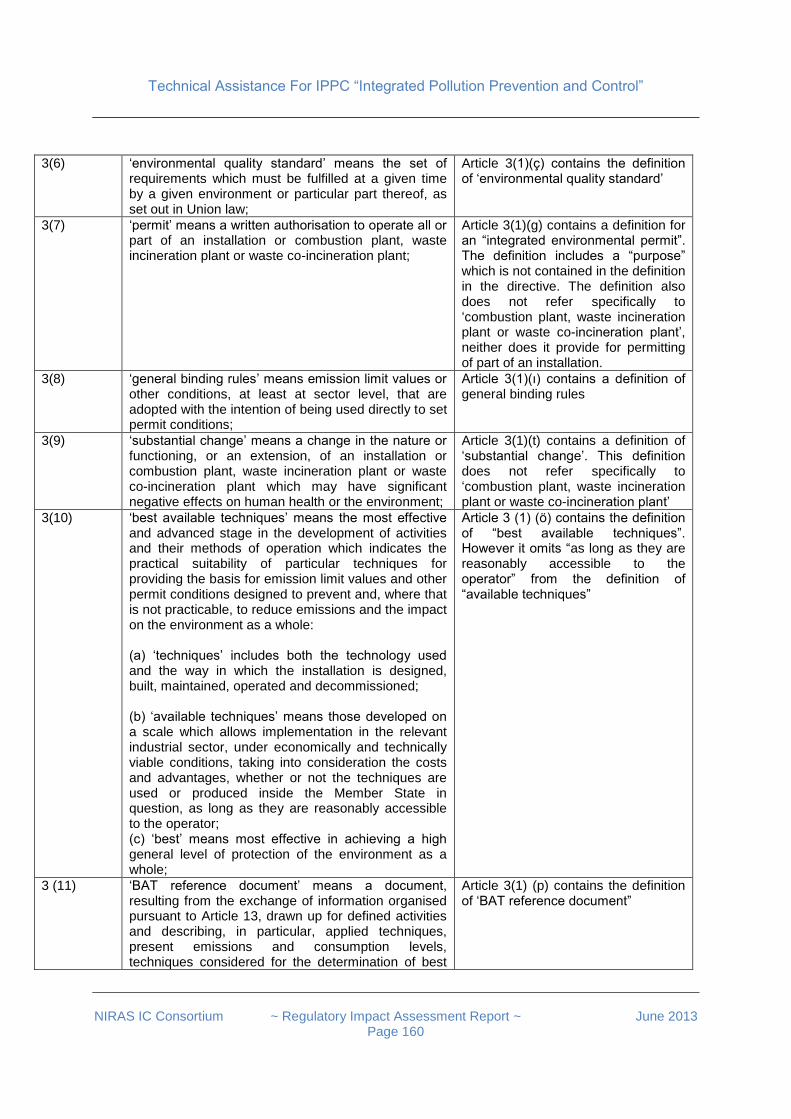
Technical Assistance For IPPC “Integrated Pollution Prevention and Control”
NIRAS IC Consortium ~ Regulatory Impact Assessment Report ~ June 2013
Page 160
3(6) ‘environmental quality standard’ means the set of requirements which must be fulfilled at a given time by a given environment or particular part thereof, as set out in Union law;
Article 3(1)(ç) contains the definition of ‘environmental quality standard’
3(7) ‘permit’ means a written authorisation to operate all or part of an installation or combustion plant, waste incineration plant or waste co-incineration plant;
Article 3(1)(g) contains a definition for an “integrated environmental permit”. The definition includes a “purpose” which is not contained in the definition in the directive. The definition also does not refer specifically to ‘combustion plant, waste incineration plant or waste co-incineration plant’, neither does it provide for permitting of part of an installation.
3(8) ‘general binding rules’ means emission limit values or other conditions, at least at sector level, that are adopted with the intention of being used directly to set permit conditions;
Article 3(1)(ı) contains a definition of general binding rules
3(9) ‘substantial change’ means a change in the nature or functioning, or an extension, of an installation or combustion plant, waste incineration plant or waste co-incineration plant which may have significant negative effects on human health or the environment;
Article 3(1)(t) contains a definition of ‘substantial change’. This definition does not refer specifically to ‘combustion plant, waste incineration plant or waste co-incineration plant’
3(10) ‘best available techniques’ means the most effective and advanced stage in the development of activities and their methods of operation which indicates the practical suitability of particular techniques for providing the basis for emission limit values and other permit conditions designed to prevent and, where that is not practicable, to reduce emissions and the impact on the environment as a whole: (a) ‘techniques’ includes both the technology used and the way in which the installation is designed, built, maintained, operated and decommissioned; (b) ‘available techniques’ means those developed on a scale which allows implementation in the relevant industrial sector, under economically and technically viable conditions, taking into consideration the costs and advantages, whether or not the techniques are used or produced inside the Member State in question, as long as they are reasonably accessible to the operator; (c) ‘best’ means most effective in achieving a high general level of protection of the environment as a whole;
Article 3 (1) (ö) contains the definition of “best available techniques”. However it omits “as long as they are reasonably accessible to the operator” from the definition of “available techniques”
3 (11) ‘BAT reference document’ means a document, resulting from the exchange of information organised pursuant to Article 13, drawn up for defined activities and describing, in particular, applied techniques, present emissions and consumption levels, techniques considered for the determination of best
Article 3(1) (p) contains the definition of ‘BAT reference document”
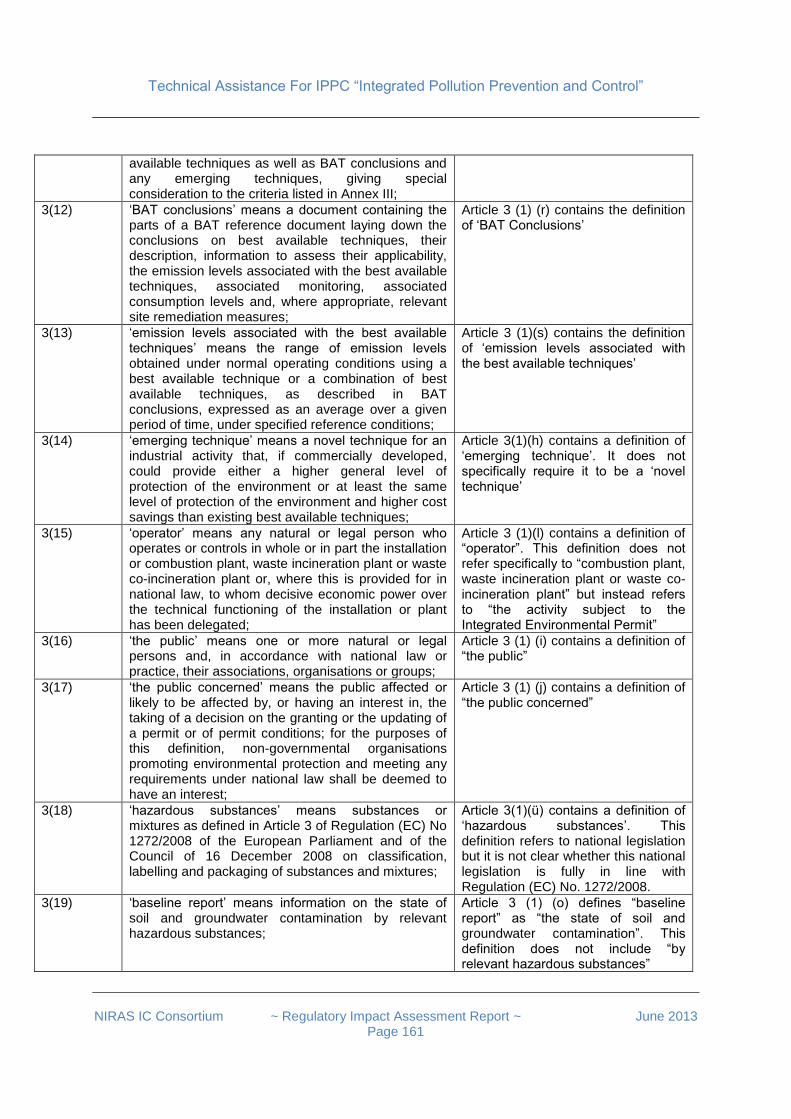
Technical Assistance For IPPC “Integrated Pollution Prevention and Control”
NIRAS IC Consortium ~ Regulatory Impact Assessment Report ~ June 2013
Page 161
available techniques as well as BAT conclusions and any emerging techniques, giving special consideration to the criteria listed in Annex III;
3(12) ‘BAT conclusions’ means a document containing the parts of a BAT reference document laying down the conclusions on best available techniques, their description, information to assess their applicability, the emission levels associated with the best available techniques, associated monitoring, associated consumption levels and, where appropriate, relevant site remediation measures;
Article 3 (1) (r) contains the definition of ‘BAT Conclusions’
3(13) ‘emission levels associated with the best available techniques’ means the range of emission levels obtained under normal operating conditions using a best available technique or a combination of best available techniques, as described in BAT conclusions, expressed as an average over a given period of time, under specified reference conditions;
Article 3 (1)(s) contains the definition of ‘emission levels associated with the best available techniques’
3(14) ‘emerging technique’ means a novel technique for an industrial activity that, if commercially developed, could provide either a higher general level of protection of the environment or at least the same level of protection of the environment and higher cost savings than existing best available techniques;
Article 3(1)(h) contains a definition of ‘emerging technique’. It does not specifically require it to be a ‘novel technique’
3(15) ‘operator’ means any natural or legal person who operates or controls in whole or in part the installation or combustion plant, waste incineration plant or waste co-incineration plant or, where this is provided for in national law, to whom decisive economic power over the technical functioning of the installation or plant has been delegated;
Article 3 (1)(l) contains a definition of “operator”. This definition does not refer specifically to “combustion plant, waste incineration plant or waste co-incineration plant” but instead refers to “the activity subject to the Integrated Environmental Permit”
3(16) ‘the public’ means one or more natural or legal persons and, in accordance with national law or practice, their associations, organisations or groups;
Article 3 (1) (i) contains a definition of “the public”
3(17) ‘the public concerned’ means the public affected or likely to be affected by, or having an interest in, the taking of a decision on the granting or the updating of a permit or of permit conditions; for the purposes of this definition, non-governmental organisations promoting environmental protection and meeting any requirements under national law shall be deemed to have an interest;
Article 3 (1) (j) contains a definition of “the public concerned”
3(18) ‘hazardous substances’ means substances or mixtures as defined in Article 3 of Regulation (EC) No 1272/2008 of the European Parliament and of the Council of 16 December 2008 on classification, labelling and packaging of substances and mixtures;
Article 3(1)(ü) contains a definition of ‘hazardous substances’. This definition refers to national legislation but it is not clear whether this national legislation is fully in line with Regulation (EC) No. 1272/2008.
3(19) ‘baseline report’ means information on the state of soil and groundwater contamination by relevant hazardous substances;
Article 3 (1) (o) defines “baseline report” as “the state of soil and groundwater contamination”. This definition does not include “by relevant hazardous substances”
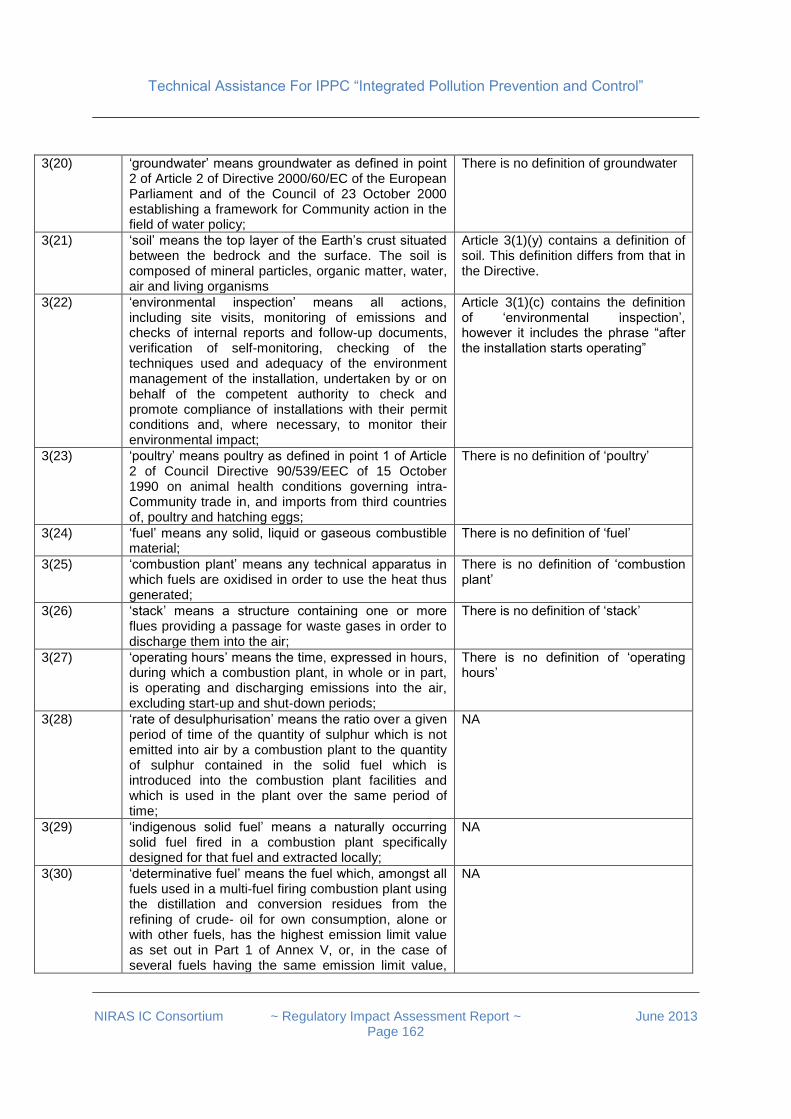
Technical Assistance For IPPC “Integrated Pollution Prevention and Control”
NIRAS IC Consortium ~ Regulatory Impact Assessment Report ~ June 2013
Page 162
3(20) ‘groundwater’ means groundwater as defined in point 2 of Article 2 of Directive 2000/60/EC of the European Parliament and of the Council of 23 October 2000 establishing a framework for Community action in the field of water policy;
There is no definition of groundwater
3(21) ‘soil’ means the top layer of the Earth’s crust situated between the bedrock and the surface. The soil is composed of mineral particles, organic matter, water, air and living organisms
Article 3(1)(y) contains a definition of soil. This definition differs from that in the Directive.
3(22) ‘environmental inspection’ means all actions, including site visits, monitoring of emissions and checks of internal reports and follow-up documents, verification of self-monitoring, checking of the techniques used and adequacy of the environment management of the installation, undertaken by or on behalf of the competent authority to check and promote compliance of installations with their permit conditions and, where necessary, to monitor their environmental impact;
Article 3(1)(c) contains the definition of ‘environmental inspection’, however it includes the phrase “after the installation starts operating”
3(23) ‘poultry’ means poultry as defined in point 1 of Article 2 of Council Directive 90/539/EEC of 15 October 1990 on animal health conditions governing intra-Community trade in, and imports from third countries of, poultry and hatching eggs;
There is no definition of ‘poultry’
3(24) ‘fuel’ means any solid, liquid or gaseous combustible material;
There is no definition of ‘fuel’
3(25) ‘combustion plant’ means any technical apparatus in which fuels are oxidised in order to use the heat thus generated;
There is no definition of ‘combustion plant’
3(26) ‘stack’ means a structure containing one or more flues providing a passage for waste gases in order to discharge them into the air;
There is no definition of ‘stack’
3(27) ‘operating hours’ means the time, expressed in hours, during which a combustion plant, in whole or in part, is operating and discharging emissions into the air, excluding start-up and shut-down periods;
There is no definition of ‘operating hours’
3(28) ‘rate of desulphurisation’ means the ratio over a given period of time of the quantity of sulphur which is not emitted into air by a combustion plant to the quantity of sulphur contained in the solid fuel which is introduced into the combustion plant facilities and which is used in the plant over the same period of time;
NA
3(29) ‘indigenous solid fuel’ means a naturally occurring solid fuel fired in a combustion plant specifically designed for that fuel and extracted locally;
NA
3(30) ‘determinative fuel’ means the fuel which, amongst all fuels used in a multi-fuel firing combustion plant using the distillation and conversion residues from the refining of crude- oil for own consumption, alone or with other fuels, has the highest emission limit value as set out in Part 1 of Annex V, or, in the case of several fuels having the same emission limit value,
NA
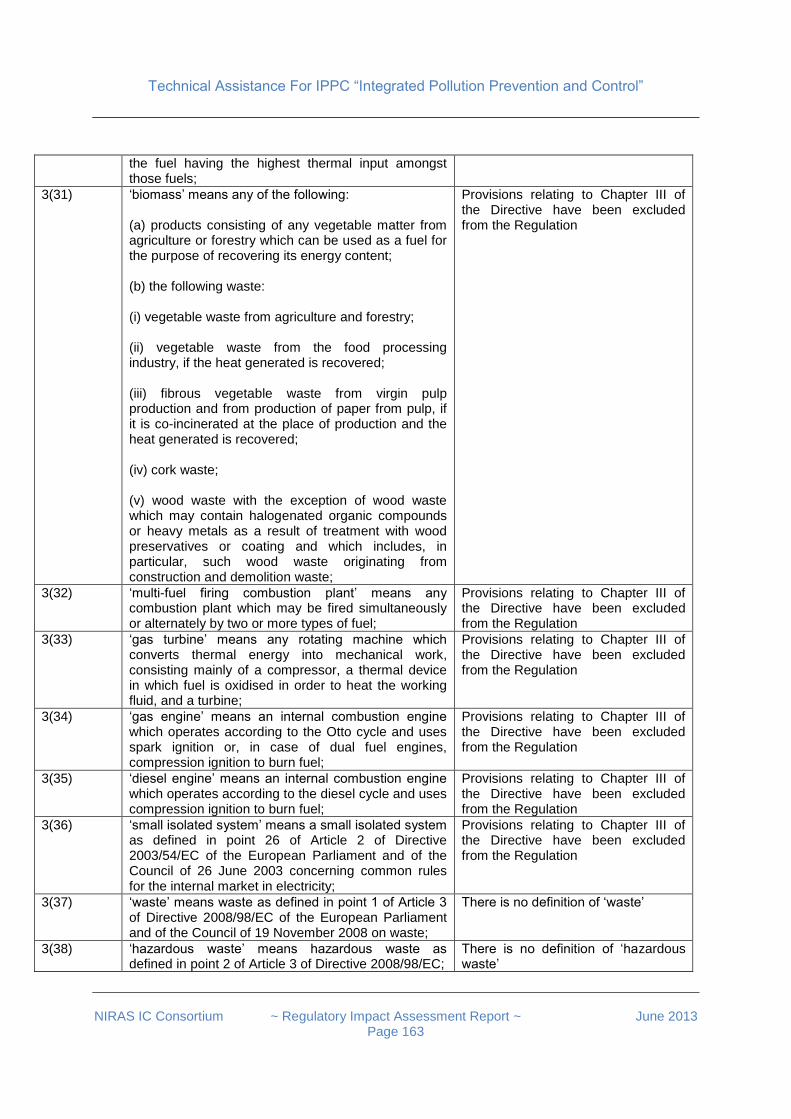
Technical Assistance For IPPC “Integrated Pollution Prevention and Control”
NIRAS IC Consortium ~ Regulatory Impact Assessment Report ~ June 2013
Page 163
the fuel having the highest thermal input amongst those fuels;
3(31) ‘biomass’ means any of the following: (a) products consisting of any vegetable matter from agriculture or forestry which can be used as a fuel for the purpose of recovering its energy content; (b) the following waste: (i) vegetable waste from agriculture and forestry; (ii) vegetable waste from the food processing industry, if the heat generated is recovered; (iii) fibrous vegetable waste from virgin pulp production and from production of paper from pulp, if it is co-incinerated at the place of production and the heat generated is recovered; (iv) cork waste; (v) wood waste with the exception of wood waste which may contain halogenated organic compounds or heavy metals as a result of treatment with wood preservatives or coating and which includes, in particular, such wood waste originating from construction and demolition waste;
Provisions relating to Chapter III of the Directive have been excluded from the Regulation
3(32) ‘multi-fuel firing combustion plant’ means any combustion plant which may be fired simultaneously or alternately by two or more types of fuel;
Provisions relating to Chapter III of the Directive have been excluded from the Regulation
3(33) ‘gas turbine’ means any rotating machine which converts thermal energy into mechanical work, consisting mainly of a compressor, a thermal device in which fuel is oxidised in order to heat the working fluid, and a turbine;
Provisions relating to Chapter III of the Directive have been excluded from the Regulation
3(34) ‘gas engine’ means an internal combustion engine which operates according to the Otto cycle and uses spark ignition or, in case of dual fuel engines, compression ignition to burn fuel;
Provisions relating to Chapter III of the Directive have been excluded from the Regulation
3(35) ‘diesel engine’ means an internal combustion engine which operates according to the diesel cycle and uses compression ignition to burn fuel;
Provisions relating to Chapter III of the Directive have been excluded from the Regulation
3(36) ‘small isolated system’ means a small isolated system as defined in point 26 of Article 2 of Directive 2003/54/EC of the European Parliament and of the Council of 26 June 2003 concerning common rules for the internal market in electricity;
Provisions relating to Chapter III of the Directive have been excluded from the Regulation
3(37) ‘waste’ means waste as defined in point 1 of Article 3 of Directive 2008/98/EC of the European Parliament and of the Council of 19 November 2008 on waste;
There is no definition of ‘waste’
3(38) ‘hazardous waste’ means hazardous waste as defined in point 2 of Article 3 of Directive 2008/98/EC;
There is no definition of ‘hazardous waste’
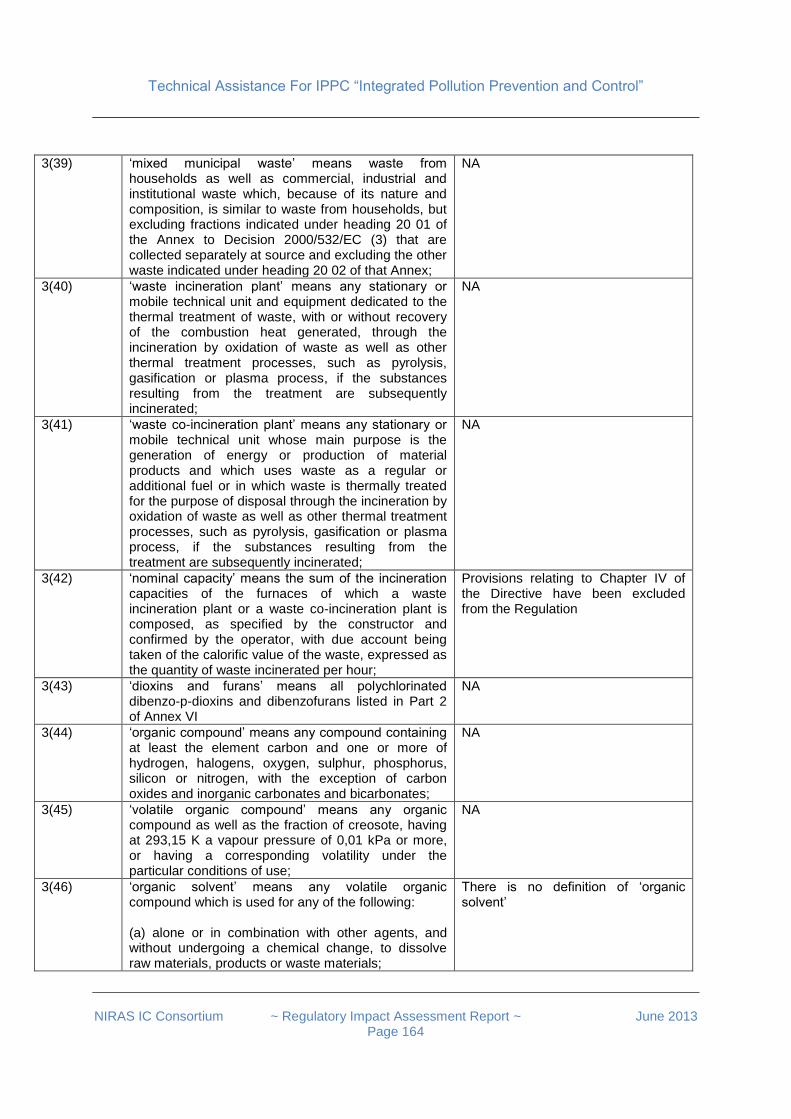
Technical Assistance For IPPC “Integrated Pollution Prevention and Control”
NIRAS IC Consortium ~ Regulatory Impact Assessment Report ~ June 2013
Page 164
3(39) ‘mixed municipal waste’ means waste from households as well as commercial, industrial and institutional waste which, because of its nature and composition, is similar to waste from households, but excluding fractions indicated under heading 20 01 of the Annex to Decision 2000/532/EC (3) that are collected separately at source and excluding the other waste indicated under heading 20 02 of that Annex;
NA
3(40) ‘waste incineration plant’ means any stationary or mobile technical unit and equipment dedicated to the thermal treatment of waste, with or without recovery of the combustion heat generated, through the incineration by oxidation of waste as well as other thermal treatment processes, such as pyrolysis, gasification or plasma process, if the substances resulting from the treatment are subsequently incinerated;
NA
3(41) ‘waste co-incineration plant’ means any stationary or mobile technical unit whose main purpose is the generation of energy or production of material products and which uses waste as a regular or additional fuel or in which waste is thermally treated for the purpose of disposal through the incineration by oxidation of waste as well as other thermal treatment processes, such as pyrolysis, gasification or plasma process, if the substances resulting from the treatment are subsequently incinerated;
NA
3(42) ‘nominal capacity’ means the sum of the incineration capacities of the furnaces of which a waste incineration plant or a waste co-incineration plant is composed, as specified by the constructor and confirmed by the operator, with due account being taken of the calorific value of the waste, expressed as the quantity of waste incinerated per hour;
Provisions relating to Chapter IV of the Directive have been excluded from the Regulation
3(43) ‘dioxins and furans’ means all polychlorinated dibenzo-p-dioxins and dibenzofurans listed in Part 2 of Annex VI
NA
3(44) ‘organic compound’ means any compound containing at least the element carbon and one or more of hydrogen, halogens, oxygen, sulphur, phosphorus, silicon or nitrogen, with the exception of carbon oxides and inorganic carbonates and bicarbonates;
NA
3(45) ‘volatile organic compound’ means any organic compound as well as the fraction of creosote, having at 293,15 K a vapour pressure of 0,01 kPa or more, or having a corresponding volatility under the particular conditions of use;
NA
3(46) ‘organic solvent’ means any volatile organic compound which is used for any of the following: (a) alone or in combination with other agents, and without undergoing a chemical change, to dissolve raw materials, products or waste materials;
There is no definition of ‘organic solvent’
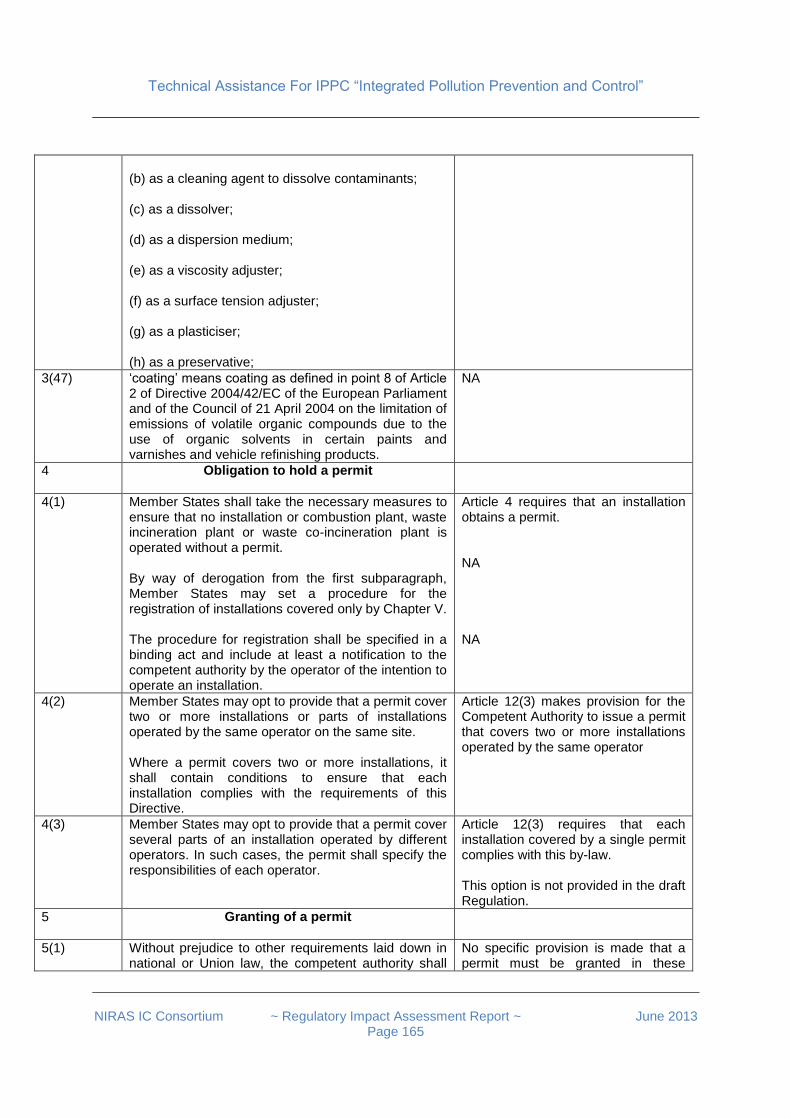
Technical Assistance For IPPC “Integrated Pollution Prevention and Control”
NIRAS IC Consortium ~ Regulatory Impact Assessment Report ~ June 2013
Page 165
(b) as a cleaning agent to dissolve contaminants; (c) as a dissolver; (d) as a dispersion medium; (e) as a viscosity adjuster; (f) as a surface tension adjuster; (g) as a plasticiser; (h) as a preservative;
3(47) ‘coating’ means coating as defined in point 8 of Article 2 of Directive 2004/42/EC of the European Parliament and of the Council of 21 April 2004 on the limitation of emissions of volatile organic compounds due to the use of organic solvents in certain paints and varnishes and vehicle refinishing products.
NA
4 Obligation to hold a permit
4(1) Member States shall take the necessary measures to ensure that no installation or combustion plant, waste incineration plant or waste co-incineration plant is operated without a permit. By way of derogation from the first subparagraph, Member States may set a procedure for the registration of installations covered only by Chapter V. The procedure for registration shall be specified in a binding act and include at least a notification to the competent authority by the operator of the intention to operate an installation.
Article 4 requires that an installation obtains a permit. NA NA
4(2) Member States may opt to provide that a permit cover two or more installations or parts of installations operated by the same operator on the same site. Where a permit covers two or more installations, it shall contain conditions to ensure that each installation complies with the requirements of this Directive.
Article 12(3) makes provision for the Competent Authority to issue a permit that covers two or more installations operated by the same operator
4(3) Member States may opt to provide that a permit cover several parts of an installation operated by different operators. In such cases, the permit shall specify the responsibilities of each operator.
Article 12(3) requires that each installation covered by a single permit complies with this by-law. This option is not provided in the draft Regulation.
5 Granting of a permit
5(1) Without prejudice to other requirements laid down in national or Union law, the competent authority shall
No specific provision is made that a permit must be granted in these

Technical Assistance For IPPC “Integrated Pollution Prevention and Control”
NIRAS IC Consortium ~ Regulatory Impact Assessment Report ~ June 2013
Page 166
grant a permit if the installation complies with the requirements of this Directive.
circumstances although Article 4(3) states that “Integrated Environmental Permit shall be granted by the Ministry”. Article 4(3) is not specific as to the circumstances in which the Ministry is obliged to grant a permit. In addition Article 20(2) requires the Competent Authority either to issue or to refuse a permit within 240 working days of the receipt of application. There is no specific provision that a permit must be granted if the installation complies with the requirements of the Directive.
5(2) Member States shall take the measures necessary to ensure that the conditions of, and the procedures for the granting of, the permit are fully coordinated where more than one competent authority or more than one operator is involved or more than one permit is granted, in order to guarantee an effective integrated approach by all authorities competent for this procedure.
Article 4(3) provides for a single competent authority whether at national or provincial level. No provision is made for the circumstance in which more than one operator is involved.
5(3) In the case of a new installation or a substantial change where Article 4 of Directive 85/337/EEC applies, any relevant information obtained or conclusion arrived at pursuant to Articles 5, 6, 7 and 9 of that Directive shall be examined and used for the purposes of granting the permit.
Article 3(1)(d) defines an environmental impact assessment report to be prepared on the basis of the national by-law on environmental impact assessment. Article 4(2) requires submission of an EIA Report.
6 General binding rules
Without prejudice to the obligation to hold a permit, Member States may include requirements for certain categories of installations, combustion plants, waste incineration plants or waste co-incineration plants in general binding rules. Where general binding rules are adopted, the permit may simply include a reference to such rules.
Article 6(1) provides that the Competent Authority may impose general rules for certain categories of activity. Article 6(2) requires that an application for a permit must comply with any relevant general binding rules.
7 Incidents and accidents
Without prejudice to Directive 2004/35/EC of the European Parliament and of the Council of 21 April 2004 on environmental liability with regard to the prevention and remedying of environmental damage (1), in the event of any incident or accident significantly affecting the environment, Member States shall take the necessary measures to ensure that:
There is no provision for such reporting.
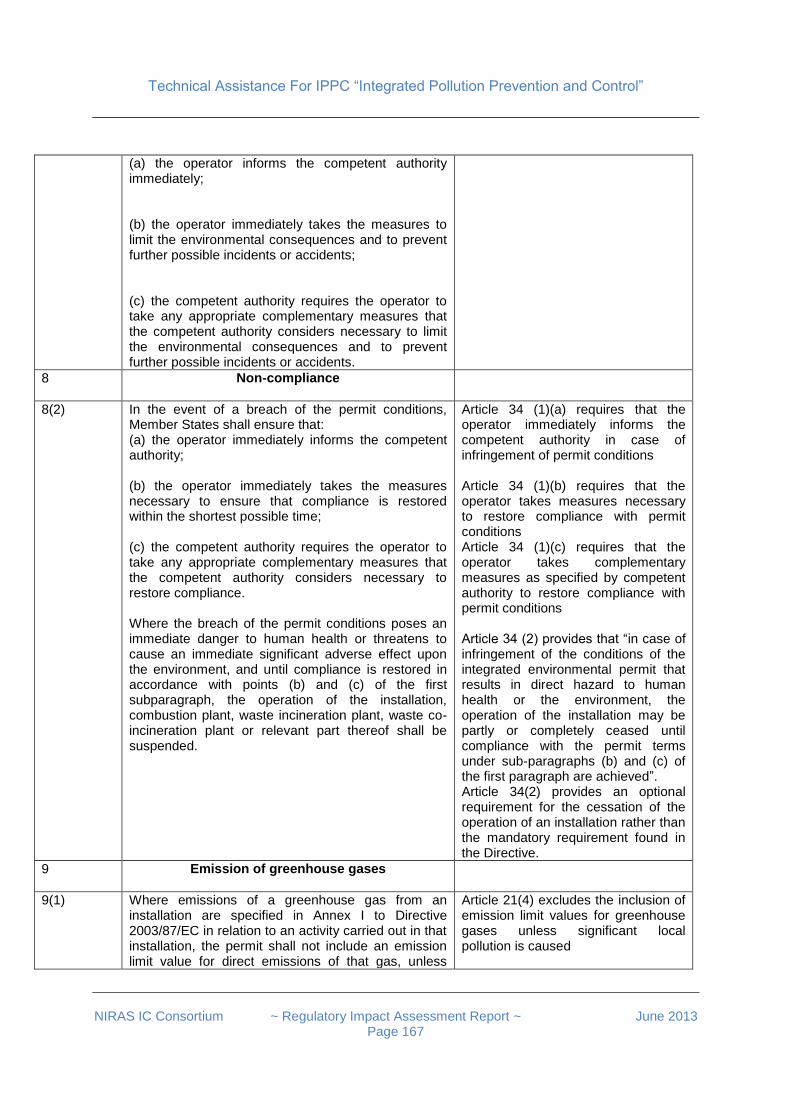
Technical Assistance For IPPC “Integrated Pollution Prevention and Control”
NIRAS IC Consortium ~ Regulatory Impact Assessment Report ~ June 2013
Page 167
(a) the operator informs the competent authority immediately; (b) the operator immediately takes the measures to limit the environmental consequences and to prevent further possible incidents or accidents; (c) the competent authority requires the operator to take any appropriate complementary measures that the competent authority considers necessary to limit the environmental consequences and to prevent further possible incidents or accidents.
8 Non-compliance
8(2) In the event of a breach of the permit conditions, Member States shall ensure that: (a) the operator immediately informs the competent authority; (b) the operator immediately takes the measures necessary to ensure that compliance is restored within the shortest possible time; (c) the competent authority requires the operator to take any appropriate complementary measures that the competent authority considers necessary to restore compliance. Where the breach of the permit conditions poses an immediate danger to human health or threatens to cause an immediate significant adverse effect upon the environment, and until compliance is restored in accordance with points (b) and (c) of the first subparagraph, the operation of the installation, combustion plant, waste incineration plant, waste co-incineration plant or relevant part thereof shall be suspended.
Article 34 (1)(a) requires that the operator immediately informs the competent authority in case of infringement of permit conditions Article 34 (1)(b) requires that the operator takes measures necessary to restore compliance with permit conditions Article 34 (1)(c) requires that the operator takes complementary measures as specified by competent authority to restore compliance with permit conditions Article 34 (2) provides that “in case of infringement of the conditions of the integrated environmental permit that results in direct hazard to human health or the environment, the operation of the installation may be partly or completely ceased until compliance with the permit terms under sub-paragraphs (b) and (c) of the first paragraph are achieved”. Article 34(2) provides an optional requirement for the cessation of the operation of an installation rather than the mandatory requirement found in the Directive.
9 Emission of greenhouse gases
9(1) Where emissions of a greenhouse gas from an installation are specified in Annex I to Directive 2003/87/EC in relation to an activity carried out in that installation, the permit shall not include an emission limit value for direct emissions of that gas, unless
Article 21(4) excludes the inclusion of emission limit values for greenhouse gases unless significant local pollution is caused
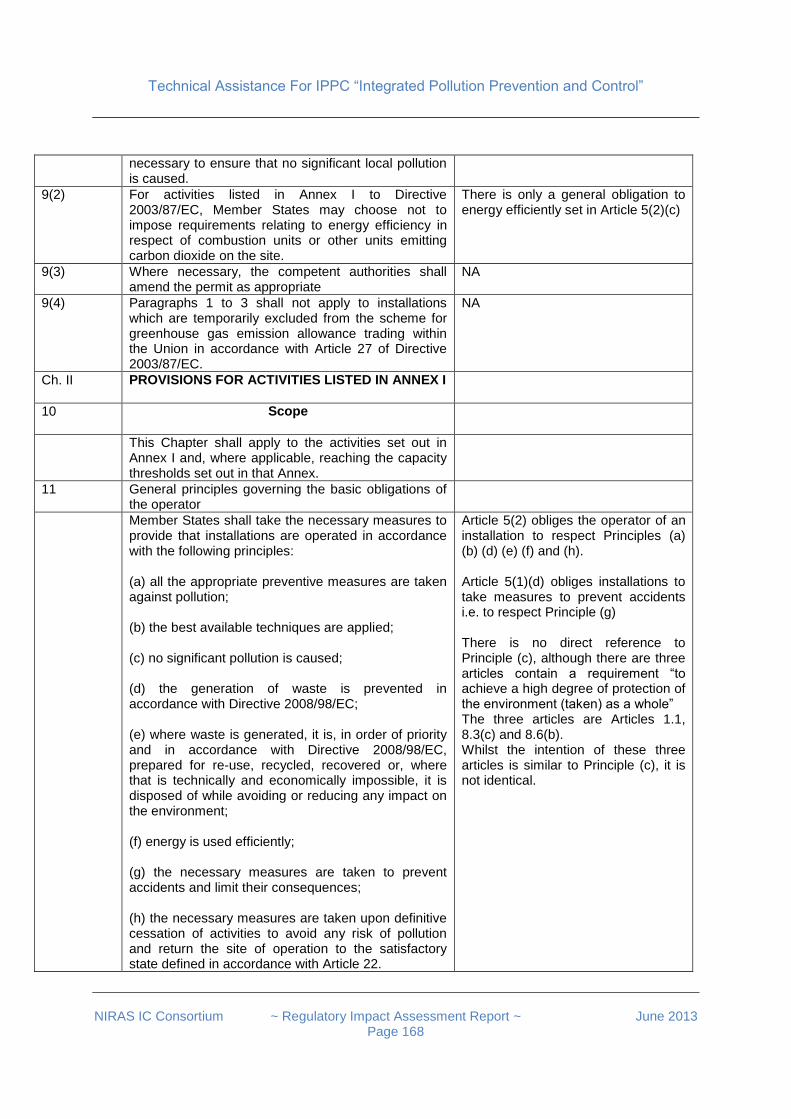
Technical Assistance For IPPC “Integrated Pollution Prevention and Control”
NIRAS IC Consortium ~ Regulatory Impact Assessment Report ~ June 2013
Page 168
necessary to ensure that no significant local pollution is caused.
9(2) For activities listed in Annex I to Directive 2003/87/EC, Member States may choose not to impose requirements relating to energy efficiency in respect of combustion units or other units emitting carbon dioxide on the site.
There is only a general obligation to energy efficiently set in Article 5(2)(c)
9(3) Where necessary, the competent authorities shall amend the permit as appropriate
NA
9(4) Paragraphs 1 to 3 shall not apply to installations which are temporarily excluded from the scheme for greenhouse gas emission allowance trading within the Union in accordance with Article 27 of Directive 2003/87/EC.
NA
Ch. II PROVISIONS FOR ACTIVITIES LISTED IN ANNEX I
10 Scope
This Chapter shall apply to the activities set out in Annex I and, where applicable, reaching the capacity thresholds set out in that Annex.
11 General principles governing the basic obligations of the operator
Member States shall take the necessary measures to provide that installations are operated in accordance with the following principles: (a) all the appropriate preventive measures are taken against pollution; (b) the best available techniques are applied; (c) no significant pollution is caused; (d) the generation of waste is prevented in accordance with Directive 2008/98/EC; (e) where waste is generated, it is, in order of priority and in accordance with Directive 2008/98/EC, prepared for re-use, recycled, recovered or, where that is technically and economically impossible, it is disposed of while avoiding or reducing any impact on the environment; (f) energy is used efficiently; (g) the necessary measures are taken to prevent accidents and limit their consequences; (h) the necessary measures are taken upon definitive cessation of activities to avoid any risk of pollution and return the site of operation to the satisfactory state defined in accordance with Article 22.
Article 5(2) obliges the operator of an installation to respect Principles (a) (b) (d) (e) (f) and (h). Article 5(1)(d) obliges installations to take measures to prevent accidents i.e. to respect Principle (g) There is no direct reference to Principle (c), although there are three articles contain a requirement “to achieve a high degree of protection of the environment (taken) as a whole” The three articles are Articles 1.1, 8.3(c) and 8.6(b). Whilst the intention of these three articles is similar to Principle (c), it is not identical.
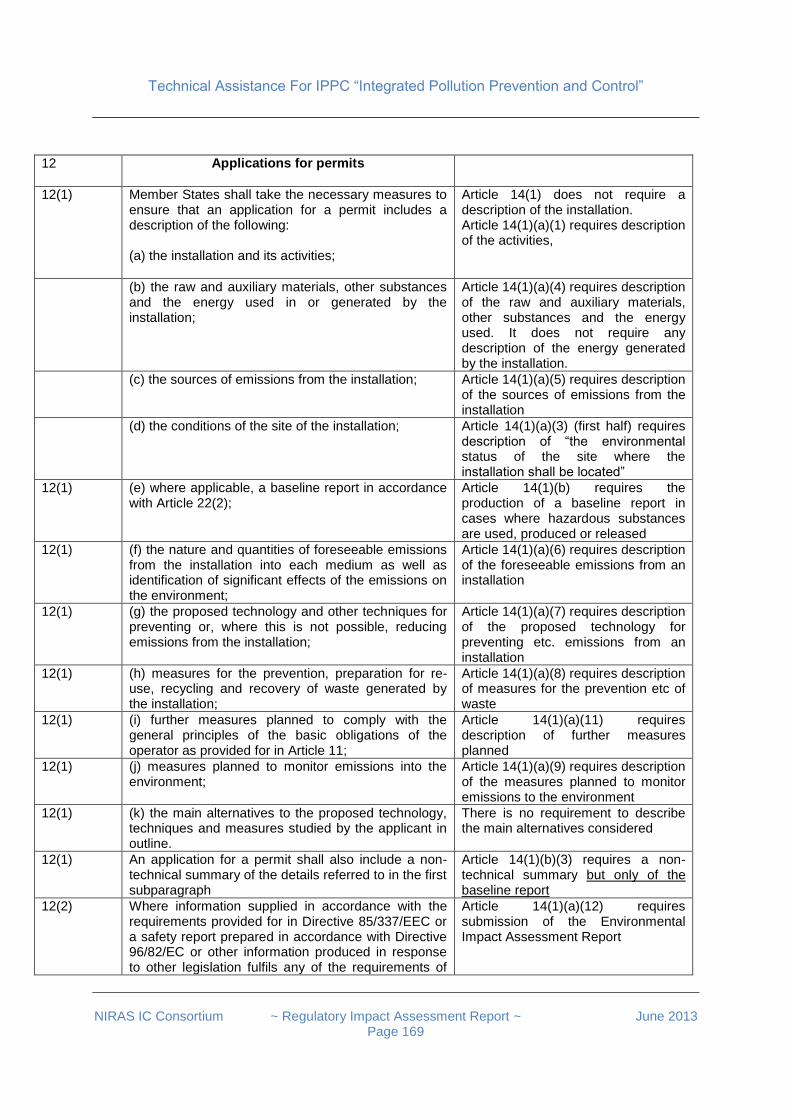
Technical Assistance For IPPC “Integrated Pollution Prevention and Control”
NIRAS IC Consortium ~ Regulatory Impact Assessment Report ~ June 2013
Page 169
12 Applications for permits
12(1) Member States shall take the necessary measures to ensure that an application for a permit includes a description of the following: (a) the installation and its activities;
Article 14(1) does not require a description of the installation. Article 14(1)(a)(1) requires description of the activities,
(b) the raw and auxiliary materials, other substances and the energy used in or generated by the installation;
Article 14(1)(a)(4) requires description of the raw and auxiliary materials, other substances and the energy used. It does not require any description of the energy generated by the installation.
(c) the sources of emissions from the installation;
Article 14(1)(a)(5) requires description of the sources of emissions from the installation
(d) the conditions of the site of the installation;
Article 14(1)(a)(3) (first half) requires description of “the environmental status of the site where the installation shall be located”
12(1) (e) where applicable, a baseline report in accordance with Article 22(2);
Article 14(1)(b) requires the production of a baseline report in cases where hazardous substances are used, produced or released
12(1) (f) the nature and quantities of foreseeable emissions from the installation into each medium as well as identification of significant effects of the emissions on the environment;
Article 14(1)(a)(6) requires description of the foreseeable emissions from an installation
12(1) (g) the proposed technology and other techniques for preventing or, where this is not possible, reducing emissions from the installation;
Article 14(1)(a)(7) requires description of the proposed technology for preventing etc. emissions from an installation
12(1) (h) measures for the prevention, preparation for re-use, recycling and recovery of waste generated by the installation;
Article 14(1)(a)(8) requires description of measures for the prevention etc of waste
12(1) (i) further measures planned to comply with the general principles of the basic obligations of the operator as provided for in Article 11;
Article 14(1)(a)(11) requires description of further measures planned
12(1) (j) measures planned to monitor emissions into the environment;
Article 14(1)(a)(9) requires description of the measures planned to monitor emissions to the environment
12(1) (k) the main alternatives to the proposed technology, techniques and measures studied by the applicant in outline.
There is no requirement to describe the main alternatives considered
12(1) An application for a permit shall also include a non-technical summary of the details referred to in the first subparagraph
Article 14(1)(b)(3) requires a non-technical summary but only of the baseline report
12(2) Where information supplied in accordance with the requirements provided for in Directive 85/337/EEC or a safety report prepared in accordance with Directive 96/82/EC or other information produced in response to other legislation fulfils any of the requirements of
Article 14(1)(a)(12) requires submission of the Environmental Impact Assessment Report
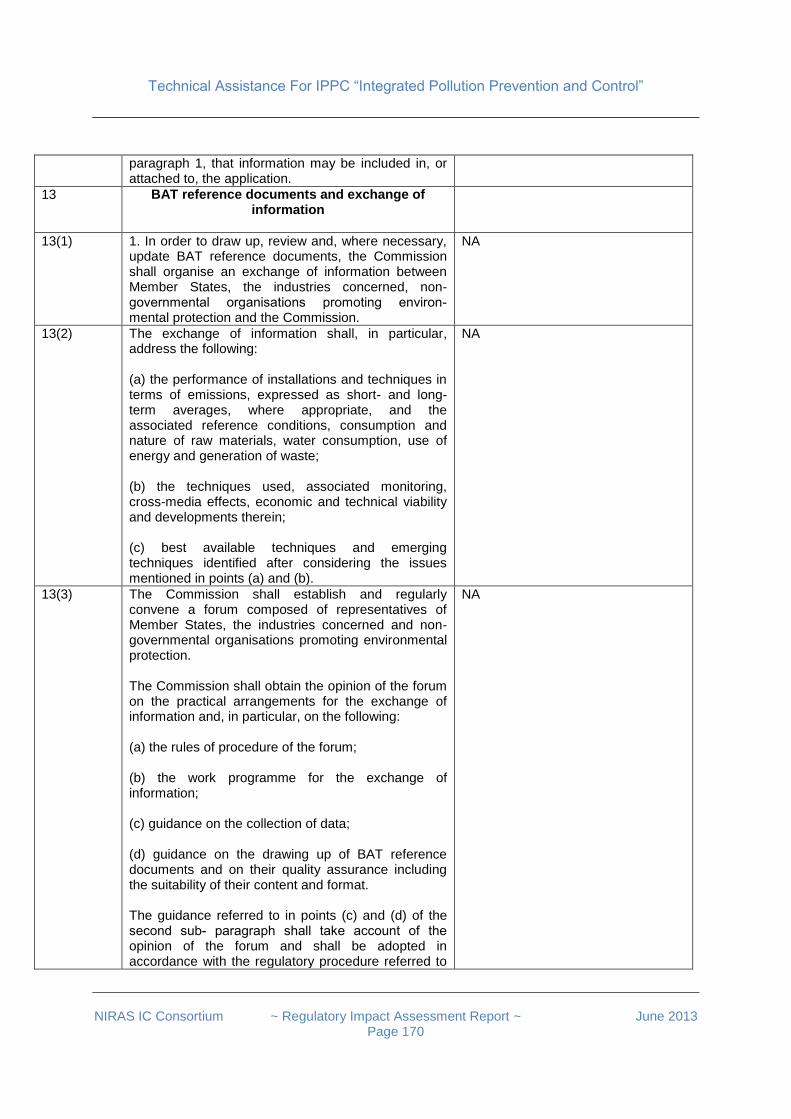
Technical Assistance For IPPC “Integrated Pollution Prevention and Control”
NIRAS IC Consortium ~ Regulatory Impact Assessment Report ~ June 2013
Page 170
paragraph 1, that information may be included in, or attached to, the application.
13 BAT reference documents and exchange of information
13(1) 1. In order to draw up, review and, where necessary, update BAT reference documents, the Commission shall organise an exchange of information between Member States, the industries concerned, non-governmental organisations promoting environ mental protection and the Commission.
NA
13(2) The exchange of information shall, in particular, address the following: (a) the performance of installations and techniques in terms of emissions, expressed as short- and long-term averages, where appropriate, and the associated reference conditions, consumption and nature of raw materials, water consumption, use of energy and generation of waste; (b) the techniques used, associated monitoring, cross-media effects, economic and technical viability and developments therein; (c) best available techniques and emerging techniques identified after considering the issues mentioned in points (a) and (b).
NA
13(3) The Commission shall establish and regularly convene a forum composed of representatives of Member States, the industries concerned and non-governmental organisations promoting environmental protection. The Commission shall obtain the opinion of the forum on the practical arrangements for the exchange of information and, in particular, on the following: (a) the rules of procedure of the forum; (b) the work programme for the exchange of information; (c) guidance on the collection of data; (d) guidance on the drawing up of BAT reference documents and on their quality assurance including the suitability of their content and format. The guidance referred to in points (c) and (d) of the second sub paragraph shall take account of the opinion of the forum and shall be adopted in accordance with the regulatory procedure referred to
NA

Technical Assistance For IPPC “Integrated Pollution Prevention and Control”
NIRAS IC Consortium ~ Regulatory Impact Assessment Report ~ June 2013
Page 171
in Article 75(2).
13(4) The Commission shall obtain and make publicly available the opinion of the forum on the proposed content of the BAT reference documents and shall take into account this opinion for the procedures laid down in paragraph 5.
NA
13(5) Decisions on the BAT conclusions shall be adopted in accordance with the regulatory procedure referred to in Article 75(2).
NA
13(6) After the adoption of a decision in accordance with paragraph 5, the Commission shall without delay make the BAT reference document publicly available and ensure that BAT conclusions are made available in all the official languages of the Union.
NA
13(7) Pending the adoption of a relevant decision in accordance with paragraph 5, the conclusions on best available techniques from BAT reference documents adopted by the Commission prior to the date referred to in Article 83 shall apply as BAT conclusions for the purposes of this Chapter except for Article 15(3) and (4).
NA
14 Permit conditions
14(1) Member States shall ensure that the permit includes all measures necessary for compliance with the requirements of Articles 11 and 18. Those measures shall include at least the following: (a) emission limit values for polluting substances listed in Annex II, and for other polluting substances, which are likely to be emitted from the installation concerned in significant quantities, having regard to their nature and their potential to transfer pollution from one medium to another;
Article 21(1)(a) requires the inclusion of emission limit values
14(1) (b) appropriate requirements ensuring protection of the soil and groundwater and measures concerning the monitoring and management of waste generated by the installation;
Article 21(1)(b) requires the protection of soil and groundwater Article 21(1)(c) requires the monitoring and management of waste
14(1) (c) suitable emission monitoring requirements specifying: (i) measurement methodology, frequency and evaluation procedure; and (ii) where Article 15(3)(b) is applied, that results of emission monitoring are available for the same periods of time and reference conditions as for the emission levels associated with the best available techniques;
Article 21(1)(d) requires the inclusion of suitable emission monitoring requirements as per (c)(i). No provision has been made for the situation as per (c)(ii)
14(1) (d) an obligation to supply the competent authority regularly, and at least annually, with:
Article 21(6)(1) requires at least annual submission of results of emission monitoring as per (d)(i)
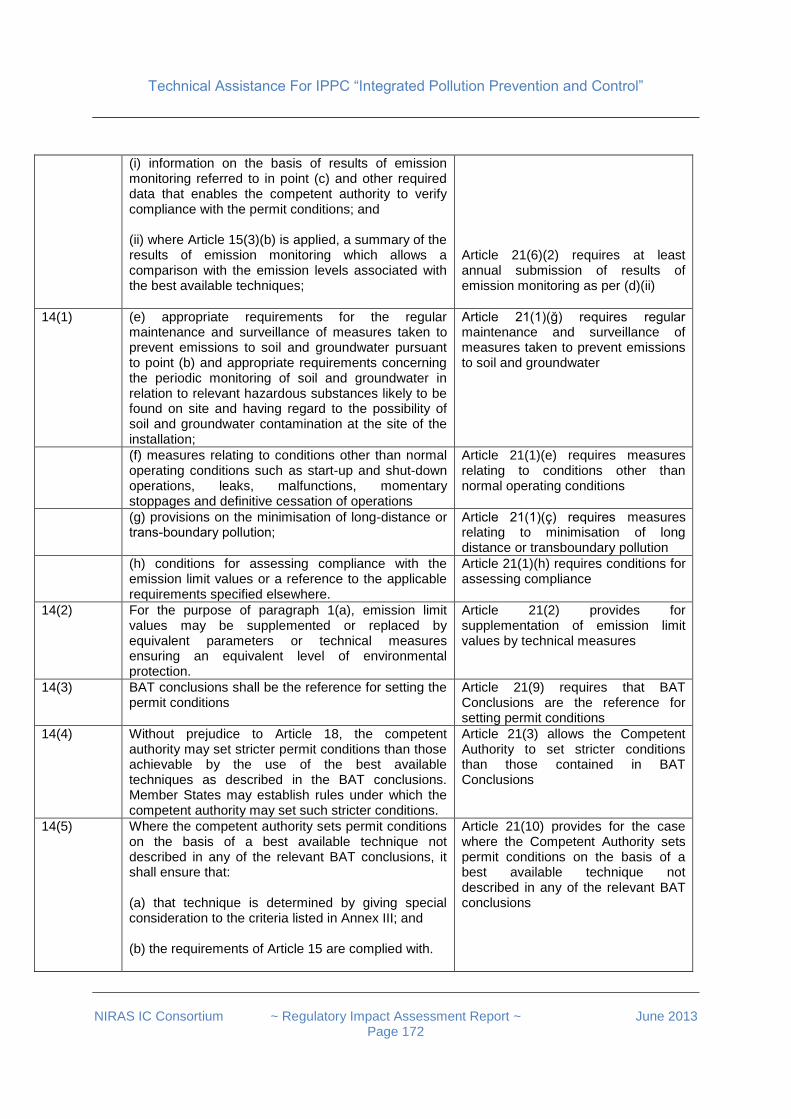
Technical Assistance For IPPC “Integrated Pollution Prevention and Control”
NIRAS IC Consortium ~ Regulatory Impact Assessment Report ~ June 2013
Page 172
(i) information on the basis of results of emission monitoring referred to in point (c) and other required data that enables the competent authority to verify compliance with the permit conditions; and (ii) where Article 15(3)(b) is applied, a summary of the results of emission monitoring which allows a comparison with the emission levels associated with the best available techniques;
Article 21(6)(2) requires at least annual submission of results of emission monitoring as per (d)(ii)
14(1) (e) appropriate requirements for the regular maintenance and surveillance of measures taken to prevent emissions to soil and groundwater pursuant to point (b) and appropriate requirements concerning the periodic monitoring of soil and groundwater in relation to relevant hazardous substances likely to be found on site and having regard to the possibility of soil and groundwater contamination at the site of the installation;
Article 21(1)(ğ) requires regular maintenance and surveillance of measures taken to prevent emissions to soil and groundwater
(f) measures relating to conditions other than normal operating conditions such as start-up and shut-down operations, leaks, malfunctions, momentary stoppages and definitive cessation of operations
Article 21(1)(e) requires measures relating to conditions other than normal operating conditions
(g) provisions on the minimisation of long-distance or transboundary pollution;
Article 21(1)(ç) requires measures relating to minimisation of long distance or transboundary pollution
(h) conditions for assessing compliance with the emission limit values or a reference to the applicable requirements specified elsewhere.
Article 21(1)(h) requires conditions for assessing compliance
14(2) For the purpose of paragraph 1(a), emission limit values may be supplemented or replaced by equivalent parameters or technical measures ensuring an equivalent level of environmental protection.
Article 21(2) provides for supplementation of emission limit values by technical measures
14(3) BAT conclusions shall be the reference for setting the permit conditions
Article 21(9) requires that BAT Conclusions are the reference for setting permit conditions
14(4) Without prejudice to Article 18, the competent authority may set stricter permit conditions than those achievable by the use of the best available techniques as described in the BAT conclusions. Member States may establish rules under which the competent authority may set such stricter conditions.
Article 21(3) allows the Competent Authority to set stricter conditions than those contained in BAT Conclusions
14(5) Where the competent authority sets permit conditions on the basis of a best available technique not described in any of the relevant BAT conclusions, it shall ensure that: (a) that technique is determined by giving special consideration to the criteria listed in Annex III; and (b) the requirements of Article 15 are complied with.
Article 21(10) provides for the case where the Competent Authority sets permit conditions on the basis of a best available technique not described in any of the relevant BAT conclusions
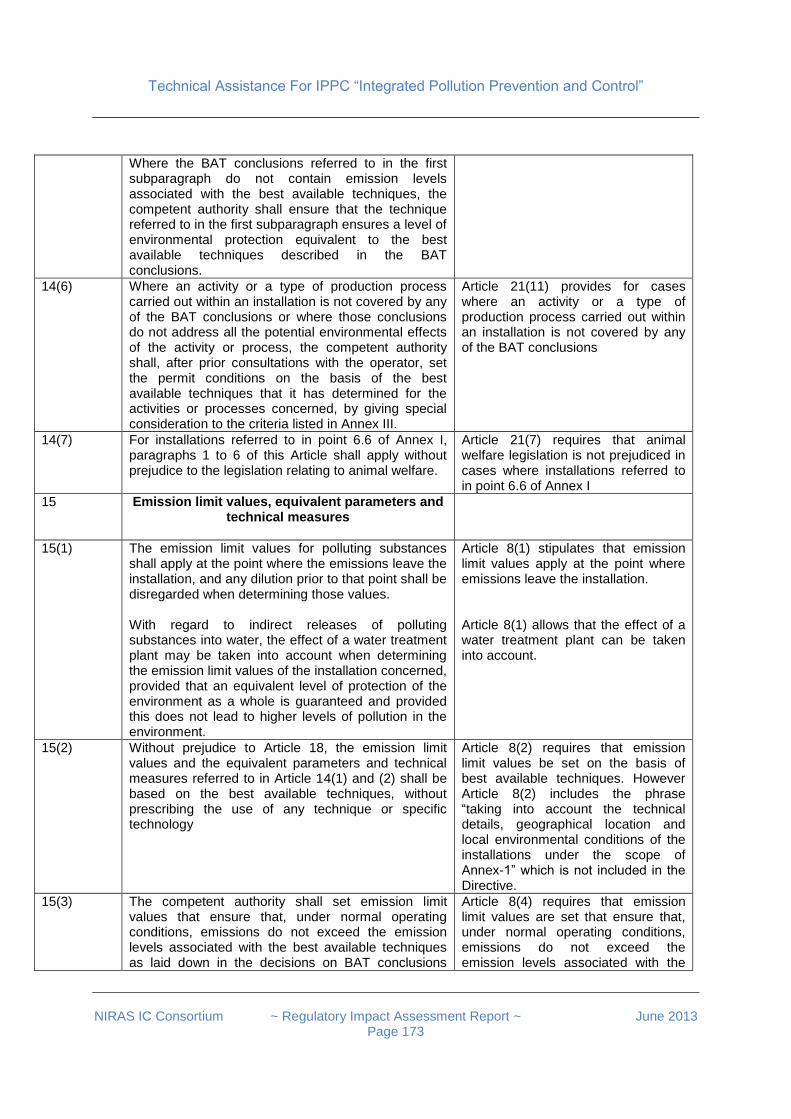
Technical Assistance For IPPC “Integrated Pollution Prevention and Control”
NIRAS IC Consortium ~ Regulatory Impact Assessment Report ~ June 2013
Page 173
Where the BAT conclusions referred to in the first subparagraph do not contain emission levels associated with the best available techniques, the competent authority shall ensure that the technique referred to in the first subparagraph ensures a level of environmental protection equivalent to the best available techniques described in the BAT conclusions.
14(6) Where an activity or a type of production process carried out within an installation is not covered by any of the BAT conclusions or where those conclusions do not address all the potential environmental effects of the activity or process, the competent authority shall, after prior consultations with the operator, set the permit conditions on the basis of the best available techniques that it has determined for the activities or processes concerned, by giving special consideration to the criteria listed in Annex III.
Article 21(11) provides for cases where an activity or a type of production process carried out within an installation is not covered by any of the BAT conclusions
14(7) For installations referred to in point 6.6 of Annex I, paragraphs 1 to 6 of this Article shall apply without prejudice to the legislation relating to animal welfare.
Article 21(7) requires that animal welfare legislation is not prejudiced in cases where installations referred to in point 6.6 of Annex I
15 Emission limit values, equivalent parameters and technical measures
15(1) The emission limit values for polluting substances shall apply at the point where the emissions leave the installation, and any dilution prior to that point shall be disregarded when determining those values. With regard to indirect releases of polluting substances into water, the effect of a water treatment plant may be taken into account when determining the emission limit values of the installation concerned, provided that an equivalent level of protection of the environment as a whole is guaranteed and provided this does not lead to higher levels of pollution in the environment.
Article 8(1) stipulates that emission limit values apply at the point where emissions leave the installation. Article 8(1) allows that the effect of a water treatment plant can be taken into account.
15(2) Without prejudice to Article 18, the emission limit values and the equivalent parameters and technical measures referred to in Article 14(1) and (2) shall be based on the best available techniques, without prescribing the use of any technique or specific technology
Article 8(2) requires that emission limit values be set on the basis of best available techniques. However Article 8(2) includes the phrase “taking into account the technical details, geographical location and local environmental conditions of the installations under the scope of Annex-1” which is not included in the Directive.
15(3) The competent authority shall set emission limit values that ensure that, under normal operating conditions, emissions do not exceed the emission levels associated with the best available techniques as laid down in the decisions on BAT conclusions
Article 8(4) requires that emission limit values are set that ensure that, under normal operating conditions, emissions do not exceed the emission levels associated with the

Technical Assistance For IPPC “Integrated Pollution Prevention and Control”
NIRAS IC Consortium ~ Regulatory Impact Assessment Report ~ June 2013
Page 174
referred to in Article 13(5) through either of the following: (a) setting emission limit values that do not exceed the emission levels associated with the best available techniques. Those emission limit values shall be expressed for the same or shorter periods of time and under the same reference conditions as those emission levels associated with the best available techniques; or (b) setting different emission limit values than those referred to under point (a) in terms of values, periods of time and reference conditions. Where point (b) is applied, the competent authority shall, at least annually, assess the results of emission monitoring in order to ensure that emissions under normal operating conditions have not exceeded the emission levels associated with the best available techniques.
best available techniques
15(4) By way of derogation from paragraph 3, and without prejudice to Article 18, the competent authority may, in specific cases, set less strict emission limit values. Such a derogation may apply only where an assessment shows that the achievement of emission levels associated with the best available techniques as described in BAT conclusions would lead to disproportionately higher costs compared to the environmental benefits due to: (a) the geographical location or the local environmental conditions of the installation concerned; or (b) the technical characteristics of the installation concerned. The competent authority shall document in an annex to the permit conditions the reasons for the application of the first subparagraph including the result of the assessment and the justification for the conditions imposed. The emission limit values set in accordance with the first subparagraph shall, however, not exceed the emission limit values set out in the Annexes to this Directive, where applicable. The competent authority shall in any case ensure that no significant pollution is caused and that a high level of protection of the environment as a whole is achieved.
Article 8(5) allows the Competent Authority to set less strict emission limit values. Article 8(6) requires that the Competent Authority specifies reasons for any derogation Article 22(e) requires in cases where derogation has been allowed, the reasons must be notified to any authority that issued a report under Article 17.
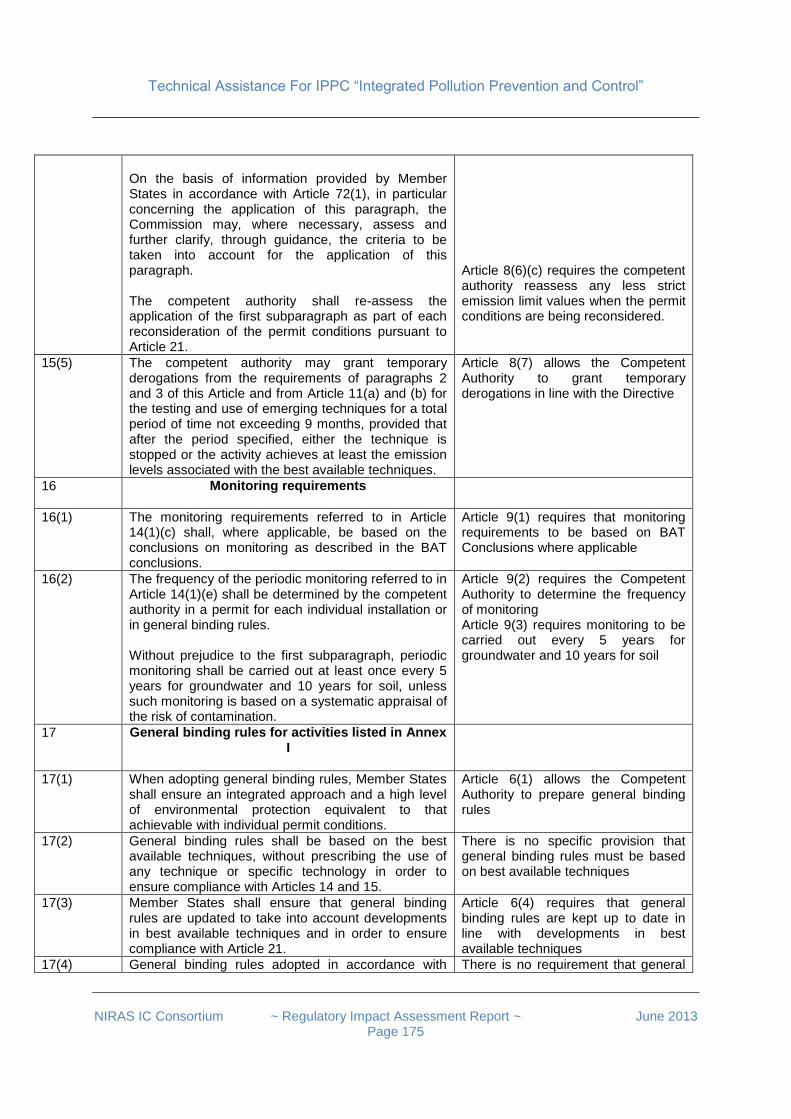
Technical Assistance For IPPC “Integrated Pollution Prevention and Control”
NIRAS IC Consortium ~ Regulatory Impact Assessment Report ~ June 2013
Page 175
On the basis of information provided by Member States in accordance with Article 72(1), in particular concerning the application of this paragraph, the Commission may, where necessary, assess and further clarify, through guidance, the criteria to be taken into account for the application of this paragraph. The competent authority shall re-assess the application of the first subparagraph as part of each reconsideration of the permit conditions pursuant to Article 21.
Article 8(6)(c) requires the competent authority reassess any less strict emission limit values when the permit conditions are being reconsidered.
15(5) The competent authority may grant temporary derogations from the requirements of paragraphs 2 and 3 of this Article and from Article 11(a) and (b) for the testing and use of emerging techniques for a total period of time not exceeding 9 months, provided that after the period specified, either the technique is stopped or the activity achieves at least the emission levels associated with the best available techniques.
Article 8(7) allows the Competent Authority to grant temporary derogations in line with the Directive
16 Monitoring requirements
16(1) The monitoring requirements referred to in Article 14(1)(c) shall, where applicable, be based on the conclusions on monitoring as described in the BAT conclusions.
Article 9(1) requires that monitoring requirements to be based on BAT Conclusions where applicable
16(2) The frequency of the periodic monitoring referred to in Article 14(1)(e) shall be determined by the competent authority in a permit for each individual installation or in general binding rules. Without prejudice to the first subparagraph, periodic monitoring shall be carried out at least once every 5 years for groundwater and 10 years for soil, unless such monitoring is based on a systematic appraisal of the risk of contamination.
Article 9(2) requires the Competent Authority to determine the frequency of monitoring Article 9(3) requires monitoring to be carried out every 5 years for groundwater and 10 years for soil
17 General binding rules for activities listed in Annex I
17(1) When adopting general binding rules, Member States shall ensure an integrated approach and a high level of environmental protection equivalent to that achievable with individual permit conditions.
Article 6(1) allows the Competent Authority to prepare general binding rules
17(2) General binding rules shall be based on the best available techniques, without prescribing the use of any technique or specific technology in order to ensure compliance with Articles 14 and 15.
There is no specific provision that general binding rules must be based on best available techniques
17(3) Member States shall ensure that general binding rules are updated to take into account developments in best available techniques and in order to ensure compliance with Article 21.
Article 6(4) requires that general binding rules are kept up to date in line with developments in best available techniques
17(4) General binding rules adopted in accordance with There is no requirement that general
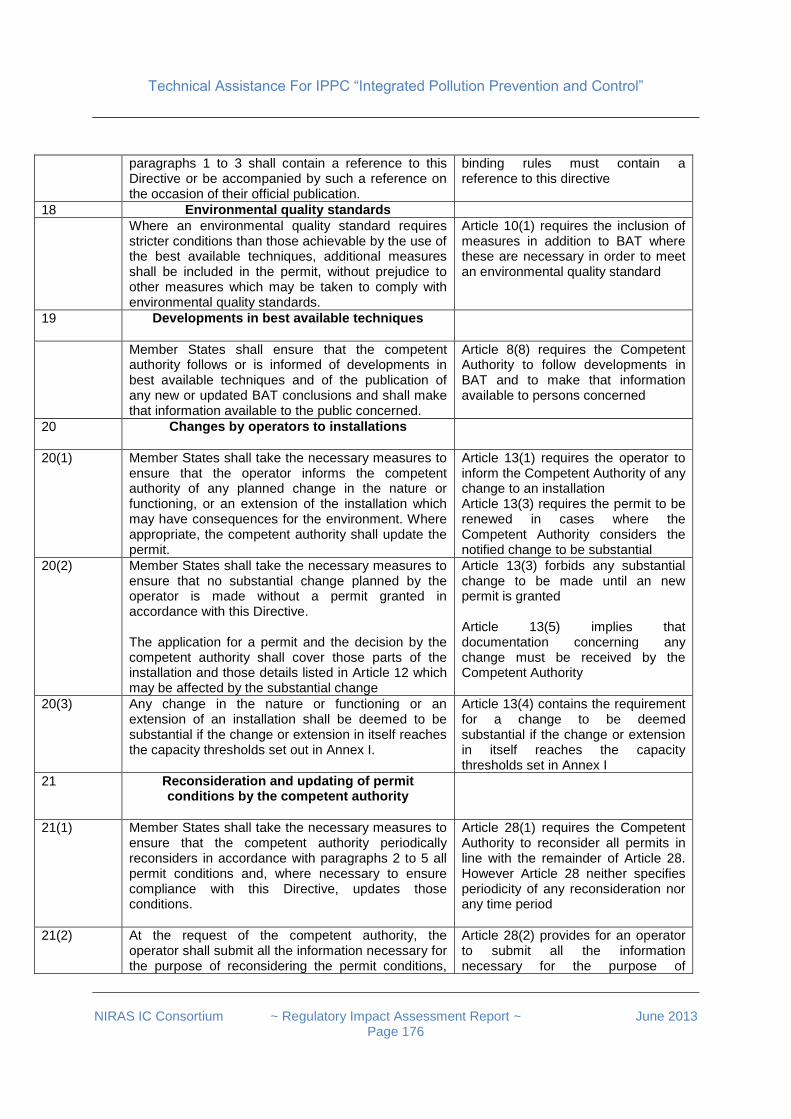
Technical Assistance For IPPC “Integrated Pollution Prevention and Control”
NIRAS IC Consortium ~ Regulatory Impact Assessment Report ~ June 2013
Page 176
paragraphs 1 to 3 shall contain a reference to this Directive or be accompanied by such a reference on the occasion of their official publication.
binding rules must contain a reference to this directive
18 Environmental quality standards
Where an environmental quality standard requires stricter conditions than those achievable by the use of the best available techniques, additional measures shall be included in the permit, without prejudice to other measures which may be taken to comply with environmental quality standards.
Article 10(1) requires the inclusion of measures in addition to BAT where these are necessary in order to meet an environmental quality standard
19 Developments in best available techniques
Member States shall ensure that the competent authority follows or is informed of developments in best available techniques and of the publication of any new or updated BAT conclusions and shall make that information available to the public concerned.
Article 8(8) requires the Competent Authority to follow developments in BAT and to make that information available to persons concerned
20 Changes by operators to installations
20(1) Member States shall take the necessary measures to ensure that the operator informs the competent authority of any planned change in the nature or functioning, or an extension of the installation which may have consequences for the environment. Where appropriate, the competent authority shall update the permit.
Article 13(1) requires the operator to inform the Competent Authority of any change to an installation Article 13(3) requires the permit to be renewed in cases where the Competent Authority considers the notified change to be substantial
20(2) Member States shall take the necessary measures to ensure that no substantial change planned by the operator is made without a permit granted in accordance with this Directive. The application for a permit and the decision by the competent authority shall cover those parts of the installation and those details listed in Article 12 which may be affected by the substantial change
Article 13(3) forbids any substantial change to be made until an new permit is granted Article 13(5) implies that documentation concerning any change must be received by the Competent Authority
20(3) Any change in the nature or functioning or an extension of an installation shall be deemed to be substantial if the change or extension in itself reaches the capacity thresholds set out in Annex I.
Article 13(4) contains the requirement for a change to be deemed substantial if the change or extension in itself reaches the capacity thresholds set in Annex I
21 Reconsideration and updating of permit conditions by the competent authority
21(1) Member States shall take the necessary measures to ensure that the competent authority periodically reconsiders in accordance with paragraphs 2 to 5 all permit conditions and, where necessary to ensure compliance with this Directive, updates those conditions.
Article 28(1) requires the Competent Authority to reconsider all permits in line with the remainder of Article 28. However Article 28 neither specifies periodicity of any reconsideration nor any time period
21(2) At the request of the competent authority, the operator shall submit all the information necessary for the purpose of reconsidering the permit conditions,
Article 28(2) provides for an operator to submit all the information necessary for the purpose of
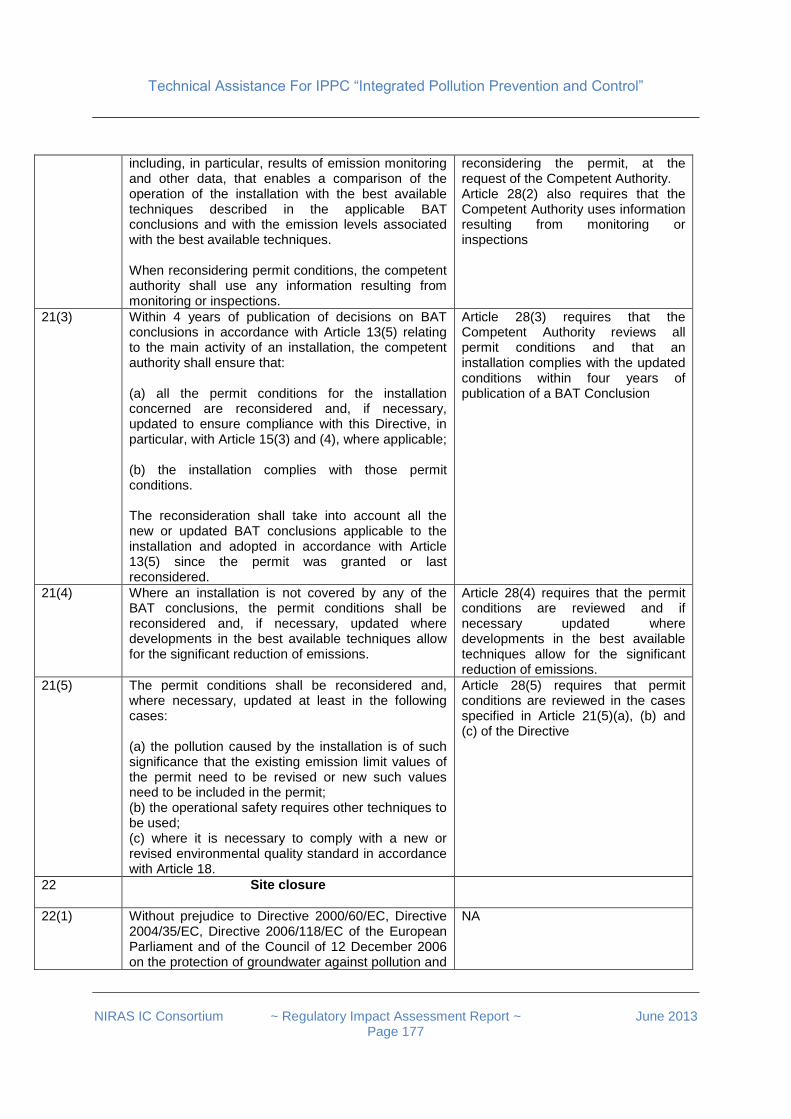
Technical Assistance For IPPC “Integrated Pollution Prevention and Control”
NIRAS IC Consortium ~ Regulatory Impact Assessment Report ~ June 2013
Page 177
including, in particular, results of emission monitoring and other data, that enables a comparison of the operation of the installation with the best available techniques described in the applicable BAT conclusions and with the emission levels associated with the best available techniques. When reconsidering permit conditions, the competent authority shall use any information resulting from monitoring or inspections.
reconsidering the permit, at the request of the Competent Authority. Article 28(2) also requires that the Competent Authority uses information resulting from monitoring or inspections
21(3) Within 4 years of publication of decisions on BAT conclusions in accordance with Article 13(5) relating to the main activity of an installation, the competent authority shall ensure that: (a) all the permit conditions for the installation concerned are reconsidered and, if necessary, updated to ensure compliance with this Directive, in particular, with Article 15(3) and (4), where applicable; (b) the installation complies with those permit conditions. The reconsideration shall take into account all the new or updated BAT conclusions applicable to the installation and adopted in accordance with Article 13(5) since the permit was granted or last reconsidered.
Article 28(3) requires that the Competent Authority reviews all permit conditions and that an installation complies with the updated conditions within four years of publication of a BAT Conclusion
21(4) Where an installation is not covered by any of the BAT conclusions, the permit conditions shall be reconsidered and, if necessary, updated where developments in the best available techniques allow for the significant reduction of emissions.
Article 28(4) requires that the permit conditions are reviewed and if necessary updated where developments in the best available techniques allow for the significant reduction of emissions.
21(5) The permit conditions shall be reconsidered and, where necessary, updated at least in the following cases: (a) the pollution caused by the installation is of such significance that the existing emission limit values of the permit need to be revised or new such values need to be included in the permit; (b) the operational safety requires other techniques to be used; (c) where it is necessary to comply with a new or revised environmental quality standard in accordance with Article 18.
Article 28(5) requires that permit conditions are reviewed in the cases specified in Article 21(5)(a), (b) and (c) of the Directive
22 Site closure
22(1) Without prejudice to Directive 2000/60/EC, Directive 2004/35/EC, Directive 2006/118/EC of the European Parliament and of the Council of 12 December 2006 on the protection of groundwater against pollution and
NA
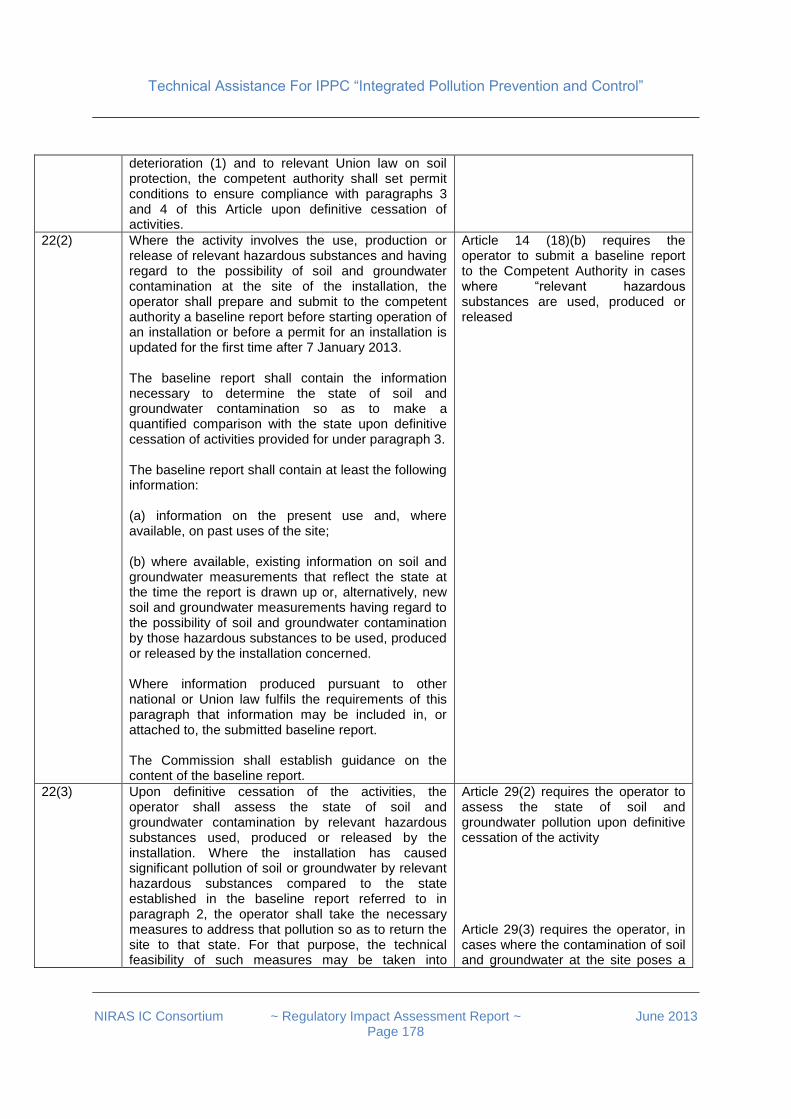
Technical Assistance For IPPC “Integrated Pollution Prevention and Control”
NIRAS IC Consortium ~ Regulatory Impact Assessment Report ~ June 2013
Page 178
deterioration (1) and to relevant Union law on soil protection, the competent authority shall set permit conditions to ensure compliance with paragraphs 3 and 4 of this Article upon definitive cessation of activities.
22(2) Where the activity involves the use, production or release of relevant hazardous substances and having regard to the possibility of soil and groundwater contamination at the site of the installation, the operator shall prepare and submit to the competent authority a baseline report before starting operation of an installation or before a permit for an installation is updated for the first time after 7 January 2013. The baseline report shall contain the information necessary to determine the state of soil and groundwater contamination so as to make a quantified comparison with the state upon definitive cessation of activities provided for under paragraph 3. The baseline report shall contain at least the following information: (a) information on the present use and, where available, on past uses of the site; (b) where available, existing information on soil and groundwater measurements that reflect the state at the time the report is drawn up or, alternatively, new soil and groundwater measurements having regard to the possibility of soil and groundwater contamination by those hazardous substances to be used, produced or released by the installation concerned. Where information produced pursuant to other national or Union law fulfils the requirements of this paragraph that information may be included in, or attached to, the submitted baseline report. The Commission shall establish guidance on the content of the baseline report.
Article 14 (18)(b) requires the operator to submit a baseline report to the Competent Authority in cases where “relevant hazardous substances are used, produced or released
22(3) Upon definitive cessation of the activities, the operator shall assess the state of soil and groundwater contamination by relevant hazardous substances used, produced or released by the installation. Where the installation has caused significant pollution of soil or groundwater by relevant hazardous substances compared to the state established in the baseline report referred to in paragraph 2, the operator shall take the necessary measures to address that pollution so as to return the site to that state. For that purpose, the technical feasibility of such measures may be taken into
Article 29(2) requires the operator to assess the state of soil and groundwater pollution upon definitive cessation of the activity Article 29(3) requires the operator, in cases where the contamination of soil and groundwater at the site poses a

Technical Assistance For IPPC “Integrated Pollution Prevention and Control”
NIRAS IC Consortium ~ Regulatory Impact Assessment Report ~ June 2013
Page 179
account. Without prejudice to the first subparagraph, upon definitive cessation of the activities, and where the contamination of soil and groundwater at the site poses a significant risk to human health or the environment as a result of the permitted activities carried out by the operator before the permit for the installation is updated for the first time after 7 January 2013 and taking into account the conditions of the site of the installation established in accordance with Article 12(1)(d), the operator shall take the necessary actions aimed at the removal, control, containment or reduction of relevant hazardous substances, so that the site, taking into account its current or approved future use, ceases to pose such a risk.
significant risk to human health or the environment, to take the necessary actions aimed at the removal, control, containment or reduction of relevant hazardous substances, so that the site, taking into account its current or approved future use, ceases to pose such a risk
22(4) Where the operator is not required to prepare a baseline report referred to in paragraph 2, the operator shall, upon definitive cessation of the activities, take the necessary actions aimed at the removal, control, containment or reduction of relevant hazardous substances, so that the site, taking into account its current or approved future use, ceases to pose any significant risk to human health or the environment due to the contamination of soil and groundwater as a result of the permitted activities and taking into account the conditions of the site of the installation established in accordance with Article 12(1)(d).
Article 29(4) requires the operator, in cases where a baseline report has not been required, to take the necessary actions aimed at the removal, control, containment or reduction of relevant hazardous substances, so that the site, taking into account its current or approved future use, ceases to pose any significant risk to human health or the environment due to the contamination of soil and groundwater as a result of the permitted activities and taking into account the conditions of the site of the installation
23 Environmental inspections
Article 23 is not the subject of this legislation
23(1) Member States shall set up a system of environmental inspections of installations addressing the examination of the full range of relevant environmental effects from the installations concerned. Member States shall ensure that operators afford the competent authorities all necessary assistance to enable those authorities to carry out any site visits, to take samples and to gather any information necessary for the performance of their duties for the purposes of this Directive.
NA
23(2) Member States shall ensure that all installations are covered by an environmental inspection plan at national, regional or local level and shall ensure that this plan is regularly reviewed and, where appropriate, updated.
23(3) Each environmental inspection plan shall include the following:
NA
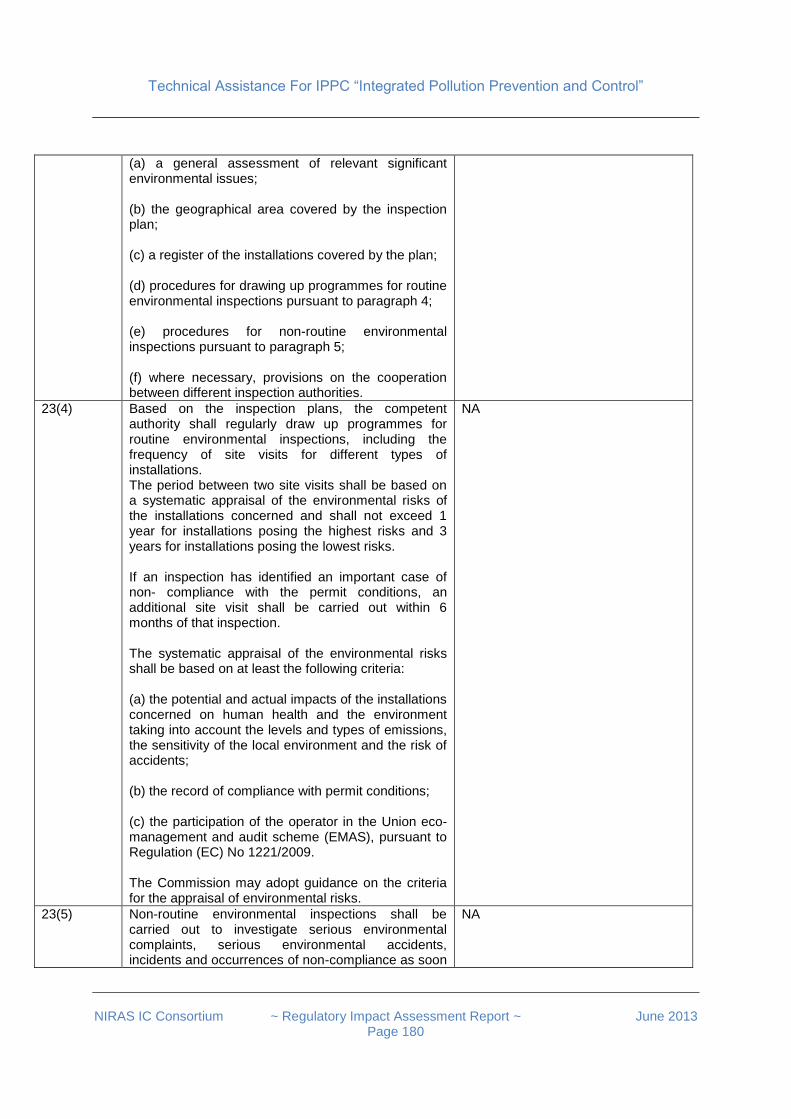
Technical Assistance For IPPC “Integrated Pollution Prevention and Control”
NIRAS IC Consortium ~ Regulatory Impact Assessment Report ~ June 2013
Page 180
(a) a general assessment of relevant significant environmental issues; (b) the geographical area covered by the inspection plan; (c) a register of the installations covered by the plan; (d) procedures for drawing up programmes for routine environmental inspections pursuant to paragraph 4; (e) procedures for non-routine environmental inspections pursuant to paragraph 5; (f) where necessary, provisions on the cooperation between different inspection authorities.
23(4) Based on the inspection plans, the competent authority shall regularly draw up programmes for routine environmental inspections, including the frequency of site visits for different types of installations. The period between two site visits shall be based on a systematic appraisal of the environmental risks of the installations concerned and shall not exceed 1 year for installations posing the highest risks and 3 years for installations posing the lowest risks. If an inspection has identified an important case of non- compliance with the permit conditions, an additional site visit shall be carried out within 6 months of that inspection. The systematic appraisal of the environmental risks shall be based on at least the following criteria: (a) the potential and actual impacts of the installations concerned on human health and the environment taking into account the levels and types of emissions, the sensitivity of the local environment and the risk of accidents; (b) the record of compliance with permit conditions; (c) the participation of the operator in the Union eco- management and audit scheme (EMAS), pursuant to Regulation (EC) No 1221/2009. The Commission may adopt guidance on the criteria for the appraisal of environmental risks.
NA
23(5) Non-routine environmental inspections shall be carried out to investigate serious environmental complaints, serious environmental accidents, incidents and occurrences of non-compliance as soon
NA
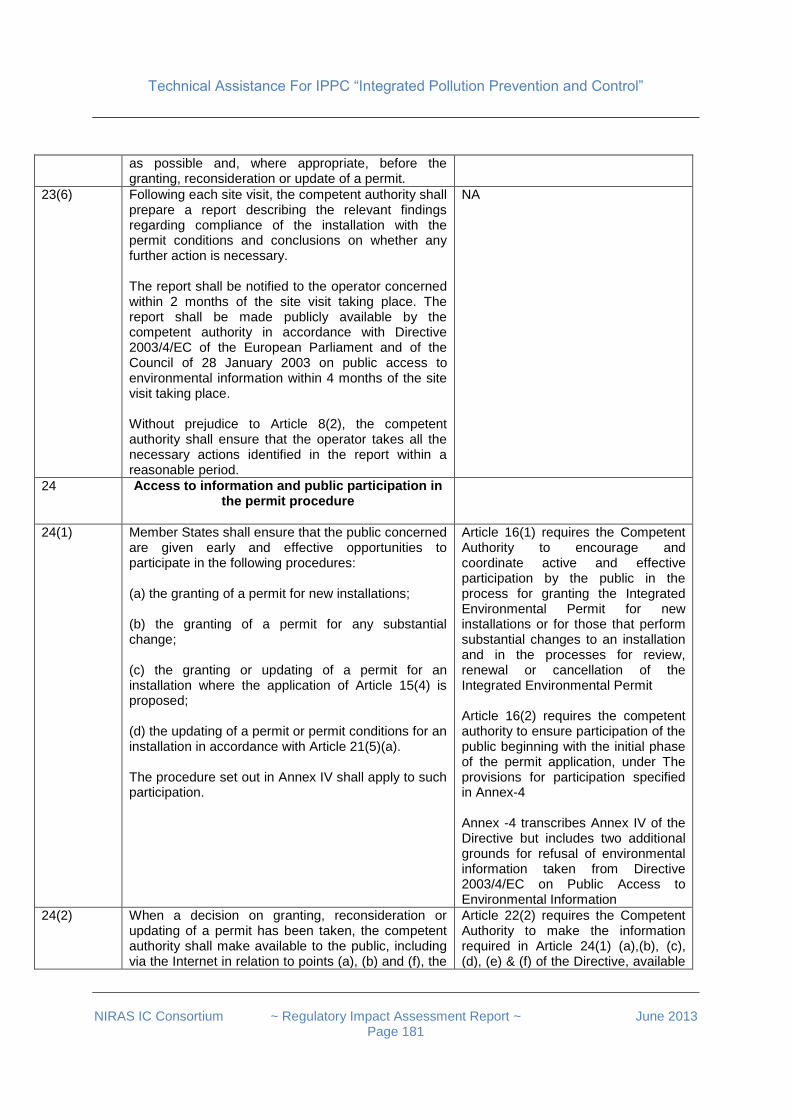
Technical Assistance For IPPC “Integrated Pollution Prevention and Control”
NIRAS IC Consortium ~ Regulatory Impact Assessment Report ~ June 2013
Page 181
as possible and, where appropriate, before the granting, reconsideration or update of a permit.
23(6) Following each site visit, the competent authority shall prepare a report describing the relevant findings regarding compliance of the installation with the permit conditions and conclusions on whether any further action is necessary. The report shall be notified to the operator concerned within 2 months of the site visit taking place. The report shall be made publicly available by the competent authority in accordance with Directive 2003/4/EC of the European Parliament and of the Council of 28 January 2003 on public access to environmental information within 4 months of the site visit taking place. Without prejudice to Article 8(2), the competent authority shall ensure that the operator takes all the necessary actions identified in the report within a reasonable period.
NA
24 Access to information and public participation in the permit procedure
24(1) Member States shall ensure that the public concerned are given early and effective opportunities to participate in the following procedures: (a) the granting of a permit for new installations; (b) the granting of a permit for any substantial change; (c) the granting or updating of a permit for an installation where the application of Article 15(4) is proposed; (d) the updating of a permit or permit conditions for an installation in accordance with Article 21(5)(a). The procedure set out in Annex IV shall apply to such participation.
Article 16(1) requires the Competent Authority to encourage and coordinate active and effective participation by the public in the process for granting the Integrated Environmental Permit for new installations or for those that perform substantial changes to an installation and in the processes for review, renewal or cancellation of the Integrated Environmental Permit Article 16(2) requires the competent authority to ensure participation of the public beginning with the initial phase of the permit application, under The provisions for participation specified in Annex-4 Annex -4 transcribes Annex IV of the Directive but includes two additional grounds for refusal of environmental information taken from Directive 2003/4/EC on Public Access to Environmental Information
24(2) When a decision on granting, reconsideration or updating of a permit has been taken, the competent authority shall make available to the public, including via the Internet in relation to points (a), (b) and (f), the
Article 22(2) requires the Competent Authority to make the information required in Article 24(1) (a),(b), (c), (d), (e) & (f) of the Directive, available
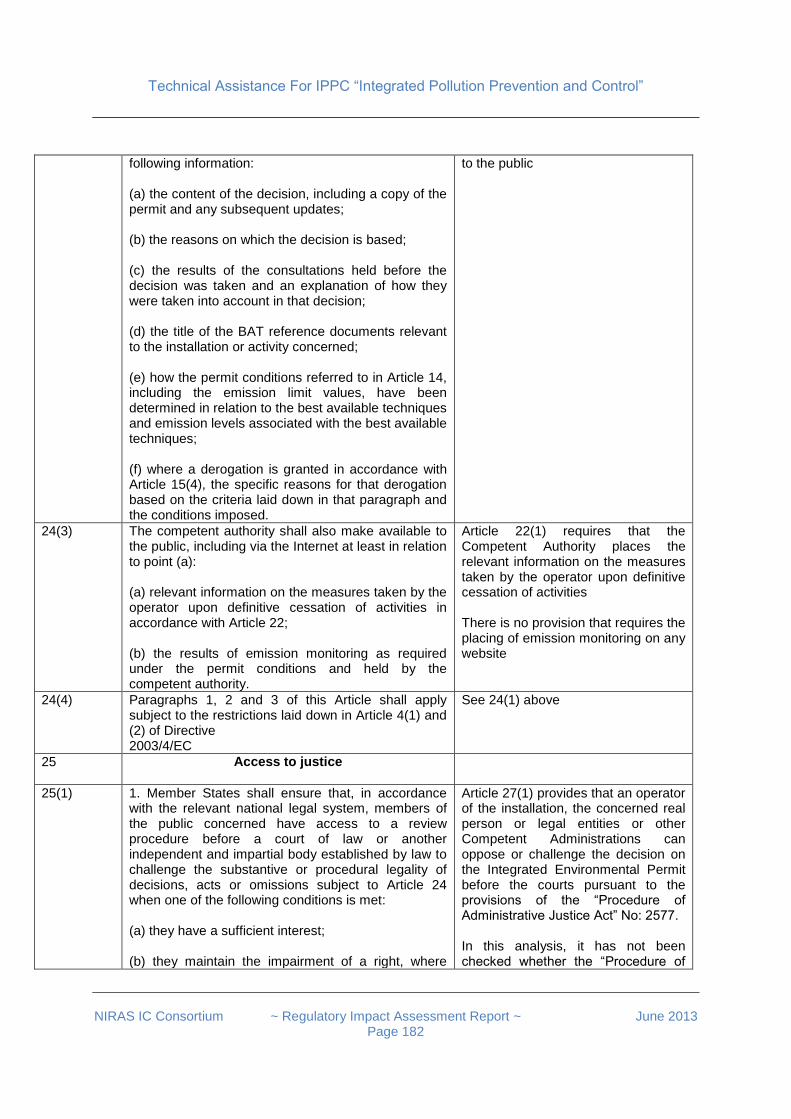
Technical Assistance For IPPC “Integrated Pollution Prevention and Control”
NIRAS IC Consortium ~ Regulatory Impact Assessment Report ~ June 2013
Page 182
following information: (a) the content of the decision, including a copy of the permit and any subsequent updates; (b) the reasons on which the decision is based; (c) the results of the consultations held before the decision was taken and an explanation of how they were taken into account in that decision; (d) the title of the BAT reference documents relevant to the installation or activity concerned; (e) how the permit conditions referred to in Article 14, including the emission limit values, have been determined in relation to the best available techniques and emission levels associated with the best available techniques; (f) where a derogation is granted in accordance with Article 15(4), the specific reasons for that derogation based on the criteria laid down in that paragraph and the conditions imposed.
to the public
24(3) The competent authority shall also make available to the public, including via the Internet at least in relation to point (a): (a) relevant information on the measures taken by the operator upon definitive cessation of activities in accordance with Article 22; (b) the results of emission monitoring as required under the permit conditions and held by the competent authority.
Article 22(1) requires that the Competent Authority places the relevant information on the measures taken by the operator upon definitive cessation of activities There is no provision that requires the placing of emission monitoring on any website
24(4) Paragraphs 1, 2 and 3 of this Article shall apply subject to the restrictions laid down in Article 4(1) and (2) of Directive 2003/4/EC
See 24(1) above
25 Access to justice
25(1) 1. Member States shall ensure that, in accordance with the relevant national legal system, members of the public concerned have access to a review procedure before a court of law or another independent and impartial body established by law to challenge the substantive or procedural legality of decisions, acts or omissions subject to Article 24 when one of the following conditions is met: (a) they have a sufficient interest; (b) they maintain the impairment of a right, where
Article 27(1) provides that an operator of the installation, the concerned real person or legal entities or other Competent Administrations can oppose or challenge the decision on the Integrated Environmental Permit before the courts pursuant to the provisions of the “Procedure of Administrative Justice Act” No: 2577. In this analysis, it has not been checked whether the “Procedure of
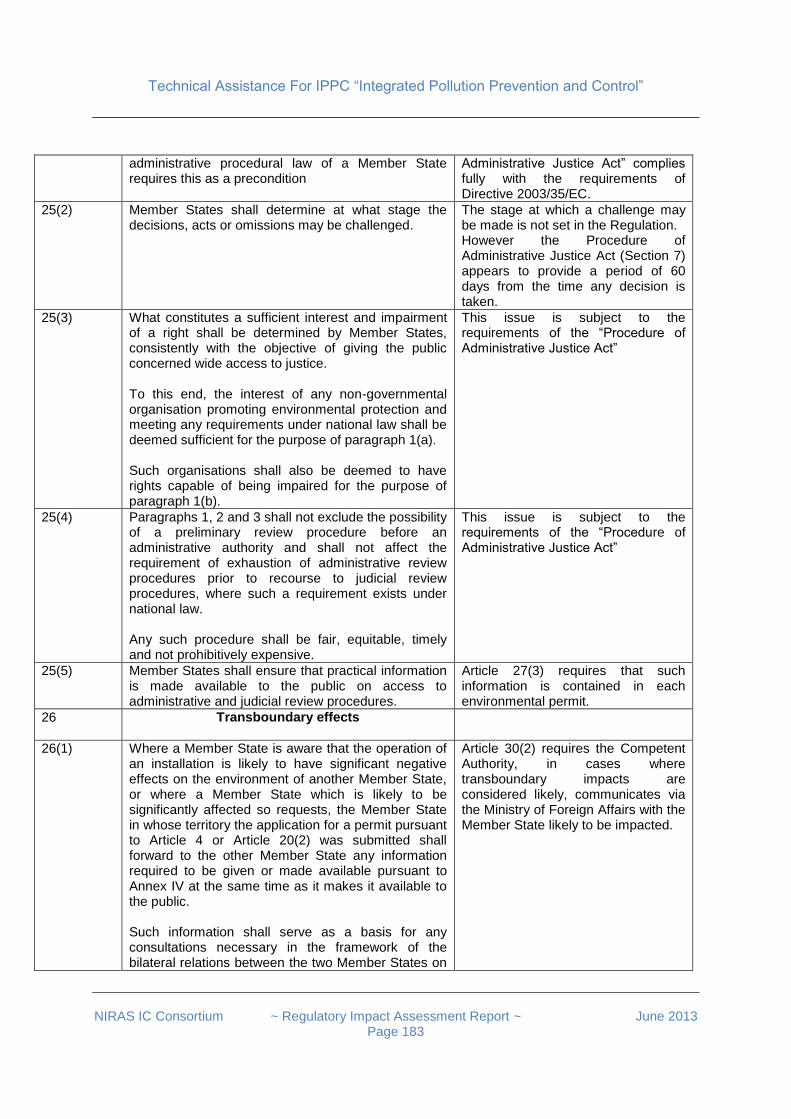
Technical Assistance For IPPC “Integrated Pollution Prevention and Control”
NIRAS IC Consortium ~ Regulatory Impact Assessment Report ~ June 2013
Page 183
administrative procedural law of a Member State requires this as a precondition
Administrative Justice Act” complies fully with the requirements of Directive 2003/35/EC.
25(2) Member States shall determine at what stage the decisions, acts or omissions may be challenged.
The stage at which a challenge may be made is not set in the Regulation. However the Procedure of Administrative Justice Act (Section 7) appears to provide a period of 60 days from the time any decision is taken.
25(3) What constitutes a sufficient interest and impairment of a right shall be determined by Member States, consistently with the objective of giving the public concerned wide access to justice. To this end, the interest of any non-governmental organisation promoting environmental protection and meeting any requirements under national law shall be deemed sufficient for the purpose of paragraph 1(a). Such organisations shall also be deemed to have rights capable of being impaired for the purpose of paragraph 1(b).
This issue is subject to the requirements of the “Procedure of Administrative Justice Act”
25(4) Paragraphs 1, 2 and 3 shall not exclude the possibility of a preliminary review procedure before an administrative authority and shall not affect the requirement of exhaustion of administrative review procedures prior to recourse to judicial review procedures, where such a requirement exists under national law. Any such procedure shall be fair, equitable, timely and not prohibitively expensive.
This issue is subject to the requirements of the “Procedure of Administrative Justice Act”
25(5) Member States shall ensure that practical information is made available to the public on access to administrative and judicial review procedures.
Article 27(3) requires that such information is contained in each environmental permit.
26 Transboundary effects
26(1) Where a Member State is aware that the operation of an installation is likely to have significant negative effects on the environment of another Member State, or where a Member State which is likely to be significantly affected so requests, the Member State in whose territory the application for a permit pursuant to Article 4 or Article 20(2) was submitted shall forward to the other Member State any information required to be given or made available pursuant to Annex IV at the same time as it makes it available to the public. Such information shall serve as a basis for any consultations necessary in the framework of the bilateral relations between the two Member States on
Article 30(2) requires the Competent Authority, in cases where transboundary impacts are considered likely, communicates via the Ministry of Foreign Affairs with the Member State likely to be impacted.

Technical Assistance For IPPC “Integrated Pollution Prevention and Control”
NIRAS IC Consortium ~ Regulatory Impact Assessment Report ~ June 2013
Page 184
a reciprocal and equivalent basis.
26(2) Within the framework of their bilateral relations, Member States shall ensure that in the cases referred to in paragraph 1, the applications are also made available for an appropriate period of time to the public of the Member State likely to be affected so that it will have the right to comment on them before the competent authority reaches its decision.
Article 30(3) provides for the Ministry of Foreign Affairs to negotiate an appropriate period for consultation with the affected Member State
26(3) The results of any consultations pursuant to paragraphs 1 and 2 shall be taken into consideration when the competent authority reaches a decision on the application.
Article 30(7) requires the Competent Authority to take any result of consultation into account in reaching a decision
26(4) The competent authority shall inform any Member State which has been consulted pursuant to paragraph 1 of the decision reached on the application and shall forward to it the information referred to in Article 24(2). That Member State shall take the measures necessary to ensure that that information is made available in an appropriate manner to the public concerned in its own territory.
Article 30(7) requires the Ministry of Foreign Affairs to notify the affected Member State of the decision
27 Emerging techniques
27(1) Member States shall, where appropriate, encourage the development and application of emerging techniques, in particular for those emerging techniques identified in BAT reference documents.
Article 8(9) provides for the Competent Authority to encourage the application of emerging techniques
27(2) The Commission shall establish guidance to assist Member States in encouraging the development and application of emerging techniques as referred to in paragraph 1.
NA
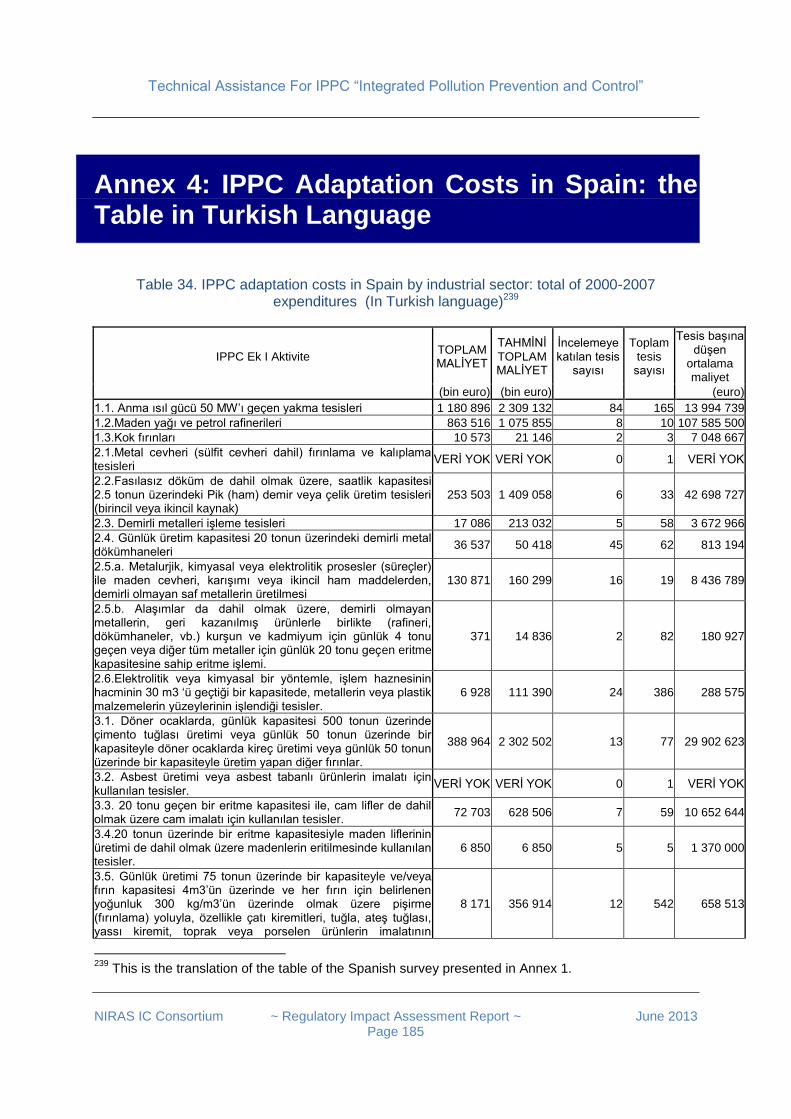
Technical Assistance For IPPC “Integrated Pollution Prevention and Control”
NIRAS IC Consortium ~ Regulatory Impact Assessment Report ~ June 2013
Page 185
Annex 4: IPPC Adaptation Costs in Spain: the Table in Turkish Language
Table 34. IPPC adaptation costs in Spain by industrial sector: total of 2000-2007
expenditures (In Turkish language)239
IPPC Ek I Aktivite TOPLAM MALİYET
TAHMİNİ TOPLAM MALİYET
İncelemeye katılan tesis
sayısı
Toplam tesis sayısı
Tesis başına düşen
ortalama maliyet
(bin euro) (bin euro) (euro)
1.1. Anma ısıl gücü 50 MW’ı geçen yakma tesisleri 1 180 896 2 309 132 84 165 13 994 739
1.2.Maden yağı ve petrol rafinerileri 863 516 1 075 855 8 10 107 585 500
1.3.Kok fırınları 10 573 21 146 2 3 7 048 667
2.1.Metal cevheri (sülfit cevheri dahil) fırınlama ve kalıplama tesisleri
VERİ YOK VERİ YOK 0 1 VERİ YOK
2.2.Fasılasız döküm de dahil olmak üzere, saatlik kapasitesi 2.5 tonun üzerindeki Pik (ham) demir veya çelik üretim tesisleri (birincil veya ikincil kaynak)
253 503 1 409 058 6 33 42 698 727
2.3. Demirli metalleri işleme tesisleri 17 086 213 032 5 58 3 672 966
2.4. Günlük üretim kapasitesi 20 tonun üzerindeki demirli metal dökümhaneleri
36 537 50 418 45 62 813 194
2.5.a. Metalurjik, kimyasal veya elektrolitik prosesler (süreçler) ile maden cevheri, karışımı veya ikincil ham maddelerden, demirli olmayan saf metallerin üretilmesi
130 871 160 299 16 19 8 436 789
2.5.b. Alaşımlar da dahil olmak üzere, demirli olmayan metallerin, geri kazanılmış ürünlerle birlikte (rafineri, dökümhaneler, vb.) kurşun ve kadmiyum için günlük 4 tonu geçen veya diğer tüm metaller için günlük 20 tonu geçen eritme kapasitesine sahip eritme işlemi.
371 14 836 2 82 180 927
2.6.Elektrolitik veya kimyasal bir yöntemle, işlem haznesinin hacminin 30 m3 ‘ü geçtiği bir kapasitede, metallerin veya plastik malzemelerin yüzeylerinin işlendiği tesisler.
6 928 111 390 24 386 288 575
3.1. Döner ocaklarda, günlük kapasitesi 500 tonun üzerinde çimento tuğlası üretimi veya günlük 50 tonun üzerinde bir kapasiteyle döner ocaklarda kireç üretimi veya günlük 50 tonun üzerinde bir kapasiteyle üretim yapan diğer fırınlar.
388 964 2 302 502 13 77 29 902 623
3.2. Asbest üretimi veya asbest tabanlı ürünlerin imalatı için kullanılan tesisler.
VERİ YOK VERİ YOK 0 1 VERİ YOK
3.3. 20 tonu geçen bir eritme kapasitesi ile, cam lifler de dahil olmak üzere cam imalatı için kullanılan tesisler.
72 703 628 506 7 59 10 652 644
3.4.20 tonun üzerinde bir eritme kapasitesiyle maden liflerinin üretimi de dahil olmak üzere madenlerin eritilmesinde kullanılan tesisler.
6 850 6 850 5 5 1 370 000
3.5. Günlük üretimi 75 tonun üzerinde bir kapasiteyle ve/veya fırın kapasitesi 4m3’ün üzerinde ve her fırın için belirlenen yoğunluk 300 kg/m3’ün üzerinde olmak üzere pişirme (fırınlama) yoluyla, özellikle çatı kiremitleri, tuğla, ateş tuğlası, yassı kiremit, toprak veya porselen ürünlerin imalatının
8 171 356 914 12 542 658 513
239
This is the translation of the table of the Spanish survey presented in Annex 1.
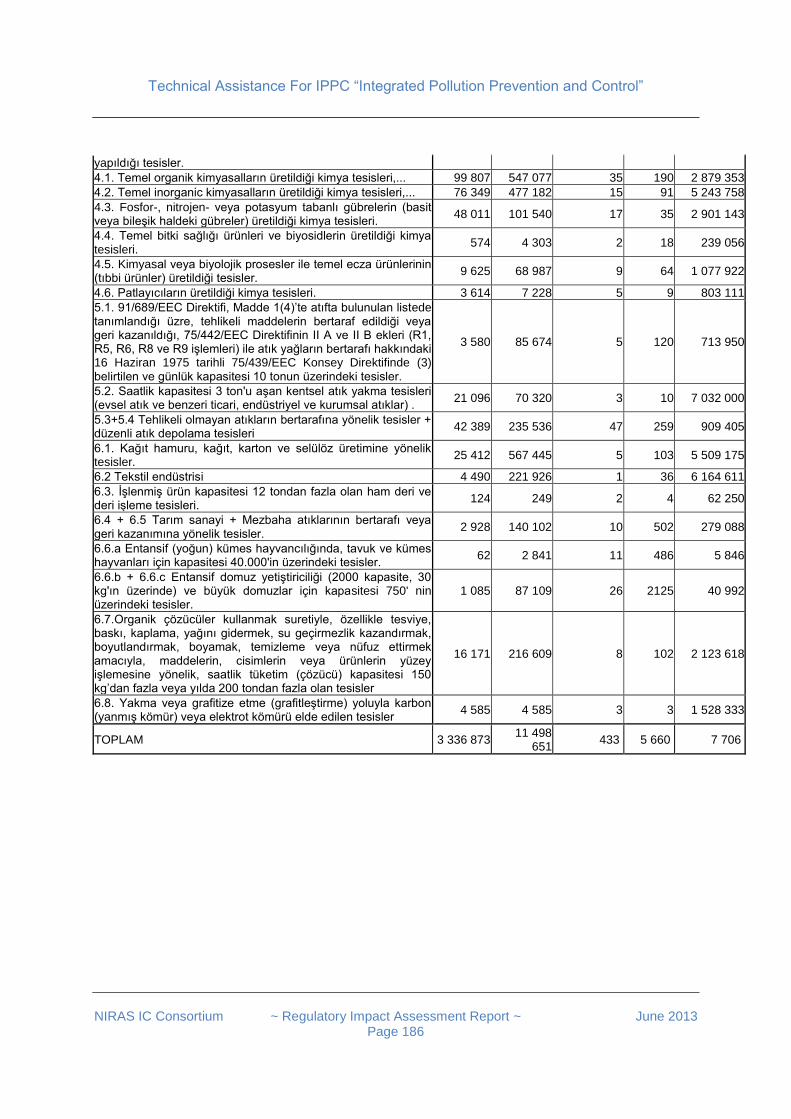
Technical Assistance For IPPC “Integrated Pollution Prevention and Control”
NIRAS IC Consortium ~ Regulatory Impact Assessment Report ~ June 2013
Page 186
yapıldığı tesisler.
4.1. Temel organik kimyasalların üretildiği kimya tesisleri,... 99 807 547 077 35 190 2 879 353
4.2. Temel inorganic kimyasalların üretildiği kimya tesisleri,... 76 349 477 182 15 91 5 243 758
4.3. Fosfor-, nitrojen- veya potasyum tabanlı gübrelerin (basit veya bileşik haldeki gübreler) üretildiği kimya tesisleri.
48 011 101 540 17 35 2 901 143
4.4. Temel bitki sağlığı ürünleri ve biyosidlerin üretildiği kimya tesisleri.
574 4 303 2 18 239 056
4.5. Kimyasal veya biyolojik prosesler ile temel ecza ürünlerinin (tıbbi ürünler) üretildiği tesisler.
9 625 68 987 9 64 1 077 922
4.6. Patlayıcıların üretildiği kimya tesisleri. 3 614 7 228 5 9 803 111
5.1. 91/689/EEC Direktifi, Madde 1(4)’te atıfta bulunulan listede tanımlandığı üzre, tehlikeli maddelerin bertaraf edildiği veya geri kazanıldığı, 75/442/EEC Direktifinin II A ve II B ekleri (R1, R5, R6, R8 ve R9 işlemleri) ile atık yağların bertarafı hakkındaki 16 Haziran 1975 tarihli 75/439/EEC Konsey Direktifinde (3) belirtilen ve günlük kapasitesi 10 tonun üzerindeki tesisler.
3 580 85 674 5 120 713 950
5.2. Saatlik kapasitesi 3 ton'u aşan kentsel atık yakma tesisleri (evsel atık ve benzeri ticari, endüstriyel ve kurumsal atıklar) .
21 096 70 320 3 10 7 032 000
5.3+5.4 Tehlikeli olmayan atıkların bertarafına yönelik tesisler + düzenli atık depolama tesisleri
42 389 235 536 47 259 909 405
6.1. Kağıt hamuru, kağıt, karton ve selülöz üretimine yönelik tesisler.
25 412 567 445 5 103 5 509 175
6.2 Tekstil endüstrisi 4 490 221 926 1 36 6 164 611
6.3. İşlenmiş ürün kapasitesi 12 tondan fazla olan ham deri ve deri işleme tesisleri.
124 249 2 4 62 250
6.4 + 6.5 Tarım sanayi + Mezbaha atıklarının bertarafı veya geri kazanımına yönelik tesisler.
2 928 140 102 10 502 279 088
6.6.a Entansif (yoğun) kümes hayvancılığında, tavuk ve kümes hayvanları için kapasitesi 40.000'in üzerindeki tesisler.
62 2 841 11 486 5 846
6.6.b + 6.6.c Entansif domuz yetiştiriciliği (2000 kapasite, 30 kg'ın üzerinde) ve büyük domuzlar için kapasitesi 750' nin üzerindeki tesisler.
1 085 87 109 26 2125 40 992
6.7.Organik çözücüler kullanmak suretiyle, özellikle tesviye, baskı, kaplama, yağını gidermek, su geçirmezlik kazandırmak, boyutlandırmak, boyamak, temizleme veya nüfuz ettirmek amacıyla, maddelerin, cisimlerin veya ürünlerin yüzey işlemesine yönelik, saatlik tüketim (çözücü) kapasitesi 150 kg’dan fazla veya yılda 200 tondan fazla olan tesisler
16 171 216 609 8 102 2 123 618
6.8. Yakma veya grafitize etme (grafitleştirme) yoluyla karbon (yanmış kömür) veya elektrot kömürü elde edilen tesisler
4 585 4 585 3 3 1 528 333
TOPLAM 3 336 873 11 498
651 433 5 660 7 706
Technical Assistance For IPPC “Integrated Pollution Prevention and Control”
NIRAS IC Consortium ~ Regulatory Impact Assessment Report ~ June 2013
Page 187
Annex 5: RIA as a Policy Tool in Turkey
The Development of RIA Activities in Turkey Compared to other countries of the region, Turkey has institutionalised an elaborate system of RIA, and has relied on the OECD and on the EU in elaborating the concepts, methods and institutional arrangement of RIA in the country.240 In 2005 a Better Regulation Group was formed in February 2005 involving a number of experts at the Prime Minister’s Office. 241 In 2006 a By-Law on “Principles and Procedures of Drafting Legislation” was issued as a Council of Ministers’ Decree on February 17, 2006, replacing the previous 1992 Principles. This By-Law defines procedures and processes in drafting legislations i.e. laws, decree-laws, by-laws and regulations. This by-law also includes provisions on RIA application. An appendix is attached to the By-Law clarifying the criteria when performing RIA. Draft laws and decree-laws whose effect is estimated to exceed 10 million TRY ($8m) are subject to RIA. The Prime Ministry has the power to request implementation of RIA regardless of estimated impact or type of legislation. Draft legislation related to national security and budget is excluded from RIA policy. RIA is to be carried out by the ministry or public agency proposing the draft law. The provisions related to RIA came into effect one year onward, February 17, 2007. Further the By-Law defines the contents of RIA reports. Accordingly, RIA should include:
Justification of drafting the legislation.
Benefit-cost analysis, cost-effectiveness analysis, impacts on the budget.
Assessment of necessity for creating a new agency or institution development.
Analysis of impact on economy, business, social life, environment and administrative procedures / bureaucracy.
Participation and consultation.
Feasibility of the proposed legislation.
240
See e.g. the seminar Regional Capacity Building Seminar on Regulatory Impact Assessment. Istanbul, Turkey, 20 November 2007 241
Source: “Setting up the RIA System in Turkey”. Power Point presentation of the Better Regulation Group. İstanbul, OECD November 20, 2007
Technical Assistance For IPPC “Integrated Pollution Prevention and Control”
NIRAS IC Consortium ~ Regulatory Impact Assessment Report ~ June 2013
Page 188
In 2007 the need for preparing Regulatory Impact Assessment (RIA) studies has been included in the Prime Ministry circular242, published on April 3, 2007. The circular has called for the development of administrative capacities in line ministries in order to determine the economic, social and environmental effects of the new regulations. The Circular has described actors, roles, responsibilities and processes and has reaffirmed the role of Better Regulation Group in implementing RIA efforts in Turkey243.
Since 2006 a long series of projects have been implemented in order to facilitate RIA study preparation and RIA training in Turkey, financed partly by the EU and partly by the Turkish Government. The beneficiaries of these programmes were the Prime Minister’s Office244 and various Line Ministries. The 2012 EU Progress Report for Turkey245 has pointed out, in that year “no progress was made with developing regulatory impact assessments with a view to increasing the quality of legislation.” However this general statement is not true in case of the Ministry of Environment and Urbanization: this line ministry is home of a continuous RIA activity.
The Ministry of Environment and Urbanization and its legal predecessor, the Ministry of Environment and Forestry246. Since 2007 the staff of MOEF and of MOEU has participated in the following projects that were either fully devoted to RIA or had a RIA component:
“Introducing Regulatory Impact Assessment into the Turkish Legal Framework”. General RIA trainings and the laboratory of ministry participated in the pilot study on good laboratory practices.
RIA project on “LCP” with a pilot RIA study, implemented by with TEPAV Foundation, MoEF delegated approximately 5 staff247
"Capacity Building in the Field of Environment" project, training for 20 staff of the Ministry, preparation of 3 different RIA studies in the field of environment protection including “WEEE”, “Seveso-II” and “Waste Incineration”248
RIA component with RIA study and training of the following different T.A. projects "Improving Emissions Control" and "VOC" and "REACH".
242
Circular No 2007/6 of The Prime Ministry on Regulation Impact Assessment (Official Gazette 04.03.2007/26482). 243
The interviewed officials could not tell, what is the present status of RIA in the Prime Minister’s Office. In 2011 Mr. Mustafa Doğan was the Deputy General Director of the DG Laws and Decrees, Better Regulation and Impact Assessment Group at the Prime Ministry of Turkey. See “Effective Regulatory Institutions for a State Based on the Rule-of-Law” Workshop in 2011 held for high-level officials of the Government of Iraq, Hosted by the Government of Turkey. Organised by the MENA-OECD Governance Programme. Workshop venue: Prime Minister’s Office. 244
Example: “Introducing Regulatory Impact Assessment into the Turkish Legal Framework”, fully-funded by the European Commission. Pilot project on public laboratories. Started in September 2006 and finalized in February 2007. Source: “Standard Summary Project Fiche, Project number: TR 06 03 06, Project Title: Introducing Regulatory Impact Analysis into the Turkish Legal Framework.” 245
Turkey, 2012 Progress Report. European Commission, Brussels, 10.10.2012, SWD(2012) 336 final. Commission Staff Working Document. Accompanying the document Communication From the Commission to the European Parliament and the Council “Enlargement Strategy and Main Challenges 2012-2013” 246
The above information was obtained from Ms Fulda Yetgin, MOEU. 247
See http://www.tepav.org.tr/eu_ing/Trainings 248
See http://duzenleyici.etkianalizi.info/5.
Technical Assistance For IPPC “Integrated Pollution Prevention and Control”
NIRAS IC Consortium ~ Regulatory Impact Assessment Report ~ June 2013
Page 189
Turkish Guideline on Regulatory Impact Assessment The above-mentioned Circular of the Prime Minister of 2007 on RIA249 contains a 10 page Guideline on Regulatory Impact Assessment. The following structure is a strongly condensed description of the Guideline, with special respect to the “Regulatory Impact Analysis Report Format”250 as it is described in the Circular. RIA Reports should be written in simple and understandable language, and normally should not exceed 30 pages. Additionally, all information annexes of the report and supporting documentation should be provided. A RIA Report consists of the following Chapters: Brief Summary Contents:
A brief description of the problem to be solved
Main objectives of the planned measure
Summary of options
Achieved results. Chapter 1. Administrative Procedure of the RIA Project. Contents:
The procedure followed in the RIA process and timeline
Consulted institutions, organizations, and other partners.
Comments received on-the overall structure of RIA report Chapter 2. Problem Definition This Chapter consists of the answers given to the following questions:
What is the problem that needs to be resolved?
What are the main causes of the problem?
Who are the affected groups, and the rate and intensity are affected by the way in which affected?
How will the planned measures improve the current situation?
Are there any problems with the existing government policies and regulations related to the field?
In order to solve the problem, intervention at what level is necessary: at the central level and/or at the local level?
Chapter 3. Objectives This Chapter consists of the answers given to the following questions:
What are the general policy objectives?
249
Genelge 2007/6, Düzenleyici Etki Analizi Çalışmaları. The circular was signed by Prime Minister RecepTayyip Erdoğan. 250
Düzenleyici Etki Analizi Raporu Formati.
Technical Assistance For IPPC “Integrated Pollution Prevention and Control”
NIRAS IC Consortium ~ Regulatory Impact Assessment Report ~ June 2013
Page 190
What are the specific policy objectives?
Are the specific policy objectives compatible with the general strategy of the government? Chapter 4. Alternative solutions / Options This Chapter consists of the answers given to the following questions:
What are the possible options for solving the problem identified? (Regulatory and non-regulatory options included)
Which of the above options can be excluded without further investigation? (E.g. due to inefficiency or due to incompatibility with other policies and strategies, etc.)
Chapter 5. Analysis of Impacts This most important Chapter consists of the answers given to the following questions:
Which social groups, economic sectors or regions will be affected by this arrangement?
What are the positive / negative, direct / indirect effects?
What are uncertainities included in the data and parameters?
How do these uncertainities affect the estimated impacts?
What effects will change over time and how? The Guideline also specifies the types of impacts to be assessed and also the main stakeholders for whom these impacts should be possibly identified by the RIA. Types of impacts to be identified: This Chapter aims to the determination of the costs and benefits arising from the proposed solution, and should determine the most appropriate and cost-saving option. It will not be possible to monetize all effects, but if possible, estimations, upper and lower bounds should be given. If possible, impacts / benefits / costs should be measured on an annual basis. Increasing or decreasing risks for any stakeholders (e.g. companies or citizens) should be considered.
Main stakeholders for which the impacts should be assessed / considered:
Impacts on the State, on policies, on the administration: the respective policies should be considered in terms of enforcement / compliance, obstacles, including the risks and uncertainties. Impacts on the state budget.
Impact on the economy as a whole, and on businesses should be assessed in terms of rising / decreasing input prices, production, transportation and marketing in the exchange, supply sources, risks. Effect on competition: companies obtaining or losing strong or dominant position as an effect of the regulation.
Effect on society, on citizen as consumers and /or employees: on job security, unemployment, growth, health, safety and consumer rights, injury and disease, etc.
Effects on the environment251: Air, water and soil pollution, land use change, biodiversity loss and the potential impact on climate change.
Chapter 6. Comparison of the options This Chapter consists of the answers given to the following questions:
For each of the options: what is the balance of negative and positive effects?
251
In this methodology y the environment is not a stakeholder in the narrow sense. However, environment protection can be regarded as an activity benefiting the widest group of stakeholders: present and future generations.

Technical Assistance For IPPC “Integrated Pollution Prevention and Control”
NIRAS IC Consortium ~ Regulatory Impact Assessment Report ~ June 2013
Page 191
Evaluation What are the consequences?
For each of the options: what conflicts and synergies are involved?
If possible evaluate every option according to previously defined evaluation criteria.
What should be the preferred option? Chapter 7. Implementation, Monitoring and Evaluation This Chapter consists of the answers given to the following questions:
What are the basic conditions of achieving the objectives identified?
Is it possible / is it necessary to control and evaluate the implementation of the regulation in a broad and comprehensive program?
Which administrative unit will be responsible for the implementation of the Regulation?
How will the affected stakeholders receive information about the regulation?
What are the penalties applicable to infringements of the rules?
Is there a specified time period after which the regulation will be reviewed? Is such a review planned?
In other countries. RIA reports in the European Union generally follow the outline as given in a methodological recommendation document issued by the EU Commission252. This structure is freely combined with the structure as recommended by the OECD253. In the US economic analyses of environment protection measures follow the recommendations as given in a document issued by the US Environment Protection Agency254.
The structure of the present RIA report follows the general structure as foreseen by the Turkish RIA Guideline of 2007.
252
See (a) “Impact Assessment Guidelines” European Commission, 15 January 2009. and (b) “Annexes to Impact Assessment Guidelines. European Commission , 15 January 2009. 253
See e.g. (a) „Introductory Handbook for Undertaking Regulatory Impact Analysis (RIA)”, OECD, Version 1.0 October 2008 (b) „The Evolution of Regulatory Policy in OECD Countries”, by Nick Malyshev OECD, 2005. (c) „Determinants of Quality in Regulatory Impact Analysis”. OECD Regulatory
Division Public Governance and Territorial Development Department, 2006. 254
“Guidelines for Preparing Economic Analyses”. U.S. Environmental Protection Agency, National Center for Environmental Economics, Office of Policy, December 17, 2010.
Technical Assistance For IPPC “Integrated Pollution Prevention and Control”
NIRAS IC Consortium ~ Regulatory Impact Assessment Report ~ June 2013
Page 192
This document has been produced with the financial assistance of the European Union. The content of this publication is the sole responsibility of the Niras IC Sp z o.o.
and can in no way be taken to reflect the views of the European Union.


