
Technical Application Papers No.10 Photovoltaic Plants
116
Technical Application Papers No.10 Photovoltaic plants
description
technical applications - pv systems
Transcript of Technical Application Papers No.10 Photovoltaic Plants
Technical Application Papers No.10Photovoltaic plants

1
Index
Technical Application Papers
Introduction ............................................... 4
PART I
1 Generalities on photovoltaic (PV) plants ............................................ 5
1.1 Operating principle ................................... 5
1.2 Energy from the Sun ................................. 5
1.3 Main components of a photovoltaic plant ...8 1.3.1 Photovoltaic generator ................................... 8 1.3.2 Inverter..........................................................11
1.4 Typologies of photovoltaic panels ......... 12 1.4.1 Crystal silicon panels ....................................12 1.4.2 Thin film panels ............................................13
1.5 Typologies of photovoltaic plants........... 15 1.5.1 Stand-alone plants .......................................15 1.5.2 Grid-connected plants ..................................16
1.6 Intermittence of generation and storage of the produced power ............................... 17
2 Energy production ..................... 18
2.1 Circuit equivalent to the cell ................... 18
2.2 Voltage-current characteristic of the module .......................................... 18
2.3 Grid connection scheme ........................ 19
2.4 Nominal peak power .............................. 20
2.5 Expected energy production per year .... 20
2.6 Inclination and orientation of the panels ........................................... 22
2.7 Voltages and currents in a PV plant ....... 24
2.8 Variation in the produced energy ........... 24 2.8.1 Irradiance ......................................................24
2.8.2 Temperatures of the modules .......................25 2.8.3 Shading ........................................................25
3 Installation methods and configurations ................................ 26
3.1 Architectural integration ................................. 26
3.2 Solar field layout ............................................ 27
3.2.1 Single-inverter plant ...............................................27
3.2.2 Plant with one inverter for each string ....................27
3.2.3 Multi-inverter plant .................................................27
3.3 Inverter selection and interfacing ................... 28
3.4 Choice of cables ............................................ 32
3.4.1 Types of cables .......................................................32
3.4.2 Cross sectional area and current carrying capacity..... 32
PART II – Italian context
4 Connection to the grid and measure of the energy ........... 33
4.1 General ........................................................... 33
4.2 In parallel with the LV network ....................... 34
4.3 In parallel with the MV network ..................... 36
4.4 Measurement of the energy produced and ex-changed with the grid .................................... 38
5 Earthing and protection against indirect contact ...... 39
5.1 Earthing .......................................................... 39
5.2 Plants with transformer .................................. 39 5.2.1 Exposed conductive parts on the load side of the
transformer .............................................................39
5.2.1.1 Plant with IT system ..................................39
5.2.1.2 Plant with TN system .................................39 5.2.2 Exposed conductive parts on the supply side of
the transformer .......................................................40
5.3 Plants without transformer ............................. 41
Photovoltaic plants
Follows
2
Index
Technical Application Papers
Photovoltaic plants
6 Protection against over-cur-rents and overvoltages ............ 42
6.1 Protection against over-currents on DC side ....42
6.1.1 Cable protection .....................................................42
6.1.2 Protection of the strings against reverse current ...43
6.1.3 Behaviour of the inverter ........................................43
6.1.4 Choice of the protective devices ............................43
6.2 Protection against overcurrents on AC side ..44
6.3 Choice of the switching and disconnecting devices ...44
6.4 Protection against overvoltages ..................... 45
6.4.1 Direct lightning .......................................................45
6.4.1.1 Building without LPS .................................45
6.4.1.2 Building with LPS ......................................45
6.4.1.3 PV plant on the ground ..............................46
6.4.2 Indirect lightning .....................................................46
6.4.2.1 Protection on DC side ...............................47
6.4.2.2 Protection on AC side ...............................48
7 Feed-in Tariff ................................... 49
7.1 Feed-in Tariff system and incentive tariffs ...... 49
7.2 Valorization of the power produced by the installation ...................................................... 50
7.2.1 Net Metering ...........................................................50
7.2.2 Sale of the energy produced ..................................51
7.3 incentive tariffs after 2010 .............................. 51
8 Economic analysis of the investment ......................................... 53
8.1 Theoretical notes ............................................ 53
8.1.1 Net Present Value (NPV) .........................................53
8.1.2 Economic indicators ...............................................53
8.1.2.1 Internal Rate of Return (IIR) .......................53
8.1.2.2 Discounted Payback .................................53
8.1.2.3 Simple Payback .........................................53
8.2 Economic considerations on PV installations ....... 54
8.3 Examples of investment analysis ................... 54
8.3.1 Self-financed 3kWp photovoltaic plant ..................54
8.3.2 Financed 3kWp photovoltaic plant .........................56
8.3.3 Self-financed 60kWp photovoltaic plant ................57
8.3.4 Financed 60kWp photovoltaic plant .......................58
PART III
9 ABB solutions for photo-voltaic applications .................. 59
9.1 Molded-case and air circuit-breakers ............... 59 9.1.1 Tmax T molded-case circuit-breakers for alternating
current applications...............................................59 9.1.2 New range of molded-case circuit-breakers SACE
Tmax XT ................................................................60 9.1.3 Molded-case circuit-breakers for applications up to
1150 V AC .............................................................61 9.1.4 Molded-case switch-disconnectors type Tmax T
and SACE Tmax XT ...............................................64 9.1.5 Air circuit-breakers for alternating current
applications ...........................................................65
9.1.6 Air circuit-breakers for applications up to 1150V AC ..66
9.1.7 Air switch-disconnectors ......................................67
9.1.8 Air switch-disconnectors for applications up
to 1150V AC ..........................................................68 9.1.9 Tmax T molded-case circuit-breakers for direct
current applications...............................................69 9.1.10 SACE Tmax XT molded-case circuit-breakers for
direct current applications ....................................70 9.1.11 Molded-case circuit-breakers for applications up to
1000V DC ..............................................................70 9.1.12 Molded-case switch-disconnectors for direct current
applications ...........................................................71 9.1.13 Tmax PV air circuit-breakers for direct current
applications ...........................................................72 9.1.14 Air switch-disconnectors for applications up
to1000V DC ...........................................................76
9.2 Residual current releases Type B ................. 77
9.2.1 Residual current releases RC223 and RC Type B .....77
9.2.2 Residual current devices for AC ............................78
3
9.3 Contactors .................................................... 78
9.4 Switch-disconnectors .................................. 79
9.5 Miniature circuit-breakers ............................. 81
9.6 Surge protective devices .............................. 82
9.7 Fuse disconnectors ...................................... 83
9.8 Cylindrical fuses ........................................... 84
9.9 Insulation monitoring devices ...................... 84
9.10 Metering devices for AC ............................... 85
9.11 Switchboards ............................................... 86
9.12 Wall-mounted consumer units ..................... 87
9.13 Junction boxes ............................................. 87
9.14 Inverters ....................................................... 88
9.15 Terminal blocks ............................................. 90
9.16 Motors .......................................................... 90
9.17 Frequency converters ................................... 91
9.18 Programmable Logic Controllers.................. 91
9.19 Sub-switchboards ........................................ 91
Annex A – New panel technologies
A.1 Emerging technologies .................................... 93
A.2 Concentrated photovoltaics ............................. 94
A.3 Photovoltaics with cylindrical panels ................ 94
Annex B – Other renewable energy sources
B.1 Introduction .................................................... 95
B.2 Wind power .................................................... 95
B.3 Biomass energy source .................................. 95
B.4 Geothermal power .......................................... 96
B.5 Tidal power and wave motion ......................... 96
B.6 Mini-hydroelectric power ................................ 97
B.7 Solar thermal power ....................................... 97
B.8 Solar thermodynamic power ........................... 99
B.9 Hybrid systems ............................................ 101
B.10 Energy situation in Italy ................................. 101
B.10.1 Non renewable energies ............................. 102
B.10.2 Renewable energies .................................. 102
Annex C – Dimensioning examples of photovoltaic plants
C.1 Introduction ................................................... 103
C.2 3kWp PV plant ............................................... 103
C.3 60kWp PV plant ............................................. 106

4
Technical Application Papers
Photovoltaic plants
Introduction
Introd
uction
In the present global energy and environmental context, the aim of reducing the emissions of greenhouse gases and polluting substances (also further to the Kyoto proto-col), also by exploiting alternative and renewable energy sources which are put side by side to and reduce the use of fossil fuels, doomed to run out due to the great consumption of them in several countries, has become of primary importance. The Sun is certainly a renewable energy source with great potential and it is possible to turn to it in the full respect of the environment. It is sufficient to think that instant by instant the surface of the terrestrial hemisphere exposed to the Sun gets a power exceeding 50 thousand TW; therefore the quantity of solar energy which reaches the terrestrial soil is enormous, about 10 thousand times the energy used all over the world. Among the different systems using renewable energy sources, photovoltaics is promising due to the intrinsic qualities of the system itself: it has very reduced service costs (the fuel is free of charge) and limited maintenance requirements, it is reliable, noiseless and quite easy to install. Moreover, photovoltaics, in some stand-alone applications, is definitely convenient in comparison with other energy sources, especially in those places which are difficult and uneconomic to reach with traditional electric lines. In the Italian scenario, photovoltaics is strongly increasing thanks to the Feed-in Tariff policy, that is a mechanism to finance the PV sector, providing the remuneration, through incentives granted by the EUA (Electrical Utilities Administrator), of the electric power produced by plants connected to the grid.
This Technical Paper is aimed at analyzing the problems and the basic concepts faced when realizing a photo-voltaic plant; starting from a general description regard-ing the modalities of exploiting solar energy through PV plants, a short description is given of the methods of
connection to the grid, of protection against overcurrents, overvoltages and indirect contact, so as to guide to the proper selection of the operating and protection devices for the different components of plants. This Technical Paper is divided into three parts: the first part, which is more general and includes the first three chapters, describes the operating principle of PV plants, their typology, the main components, the installation methods and the different configurations. Besides, it offers an analysis of the production of energy in a plant and illustrates how it varies as a function of determined quantities. The second part (including the chapters from four to eight) deals with the methods of connection to the grid, with the protection systems, with the description of the Feed-in Tariff system and with a simple economical analysis of the investment necessary to erect a PV plant, making particular reference to the Italian context and to the Standards, to the resolutions and the decrees in force at the moment of the drawing up of this Technical Paper. Finally, in the third part (which includes Chapter 9) the solutions offered by ABB for photovoltaic applications are described. In this second edition of the Technical Application Paper, new products have been introduced in the Chapter about ABB offer for photovoltaic applications and the Chapter about the Feed-in Tariff has been updated.
To complete this Technical Paper, there are three an-nexes offering:•adescriptionofthenewtechnologiesfortherealization
of solar panels and for solar concentration as a method to increase the solar radiation on panels;
•adescriptionoftheotherrenewableenergysourcesand an analysis of the Italian situation as regards en-ergy; an example for the dimensioning of a 3kWp PV plant for detached house and of a 60kWp plant for an artisan manufacturing industry.
5Photovoltaic plants
1 Generalities on photovoltaic (PV) plants
1 Generalities o
n pho
tovo
ltaic (PV
) plants
PART I
1.1 Operating principle
A photovoltaic (PV) plant transforms directly and instan-taneously solar energy into electrical energy without us-ing any fuels. As a matter of fact, the photovoltaic (PV) technology exploits the photoelectric effect, through which some semiconductors suitably “doped” generate electricity when exposed to solar radiation.
The main advantages of photovoltaic (PV) plants can be summarized as follows: •distribuitedgenerationwhereneeded;•noemissionofpollutingmaterials;•savingoffossilfuels;• reliabilityoftheplantssincetheydonothavemoving
parts (useful life usually over 20 years);• reducedoperatingandmaintenancecosts;•systemmodularity (to increase theplantpower it is
sufficient to raise the number of panels) according to the real requirements of users.
However, the initial cost for the development of a PV plant is quite high due to a market which has not reached its full maturity from a technical and economical point of view. Moreover the generation of power is erratic due to the variability of the solar energy source.
The annual electrical power output of a PV plant depends on different factors. Among them:•solarradiationincidentontheinstallationsite;• inclinationandorientationofthepanels;•presenceornotofshading;• technical performances of the plant components
(mainly modules and inverters).
The main applications of PV plants are: 1. installations (with storage systems) for users iso-
lated from the grid; 2. installations for users connected to the LV grid; 3. solar PV power plants, usually connected to the
MV grid. Feed-in Tariff incentives are granted only for the applications of type 2 and 3, in plants with rated power not lower than 1 kW.
A PV plant is essentially constituted by a generator (PV panels), by a supporting frame to mount the panels on the ground, on a building or on any building structure, by a system for power control and conditioning, by a pos-sible energy storage system, by electrical switchboards and switchgear assemblies housing the switching and protection equipment and by the connection cables.
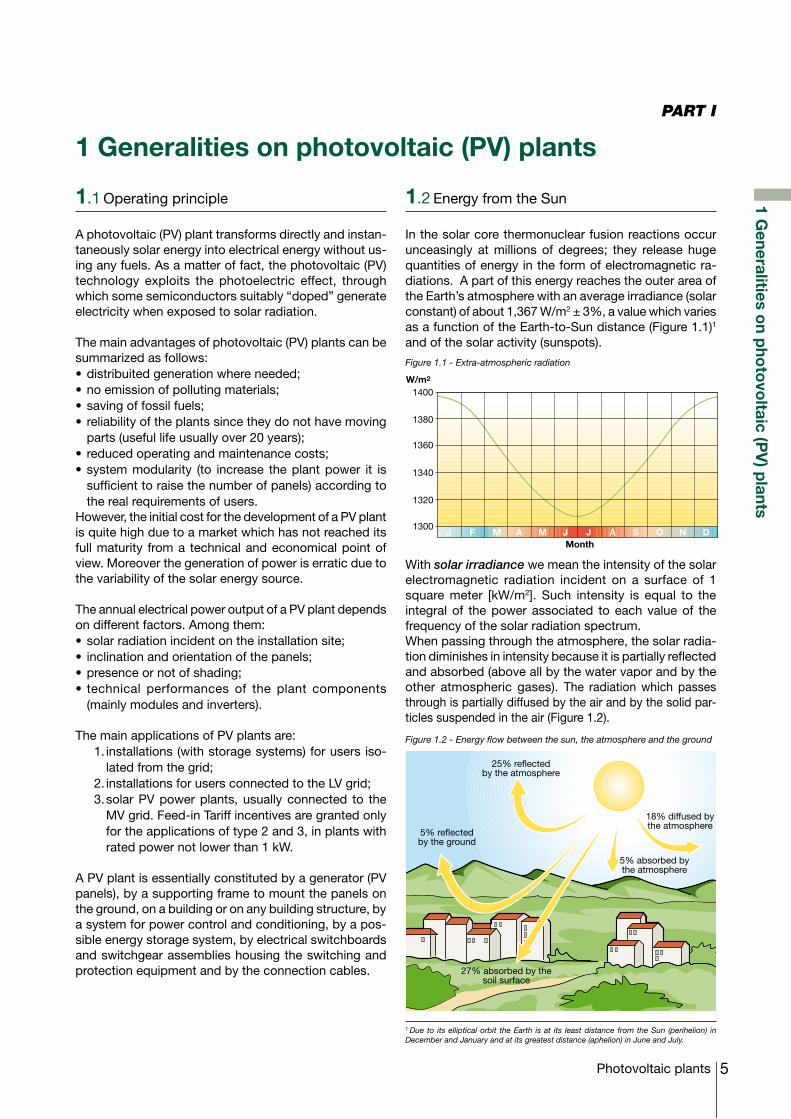
1.2 Energy from the Sun
In the solar core thermonuclear fusion reactions occur unceasingly at millions of degrees; they release huge quantities of energy in the form of electromagnetic ra-diations. A part of this energy reaches the outer area of the Earth’s atmosphere with an average irradiance (solar constant) of about 1,367 W/m2 ± 3%, a value which varies as a function of the Earth-to-Sun distance (Figure 1.1)1 and of the solar activity (sunspots).
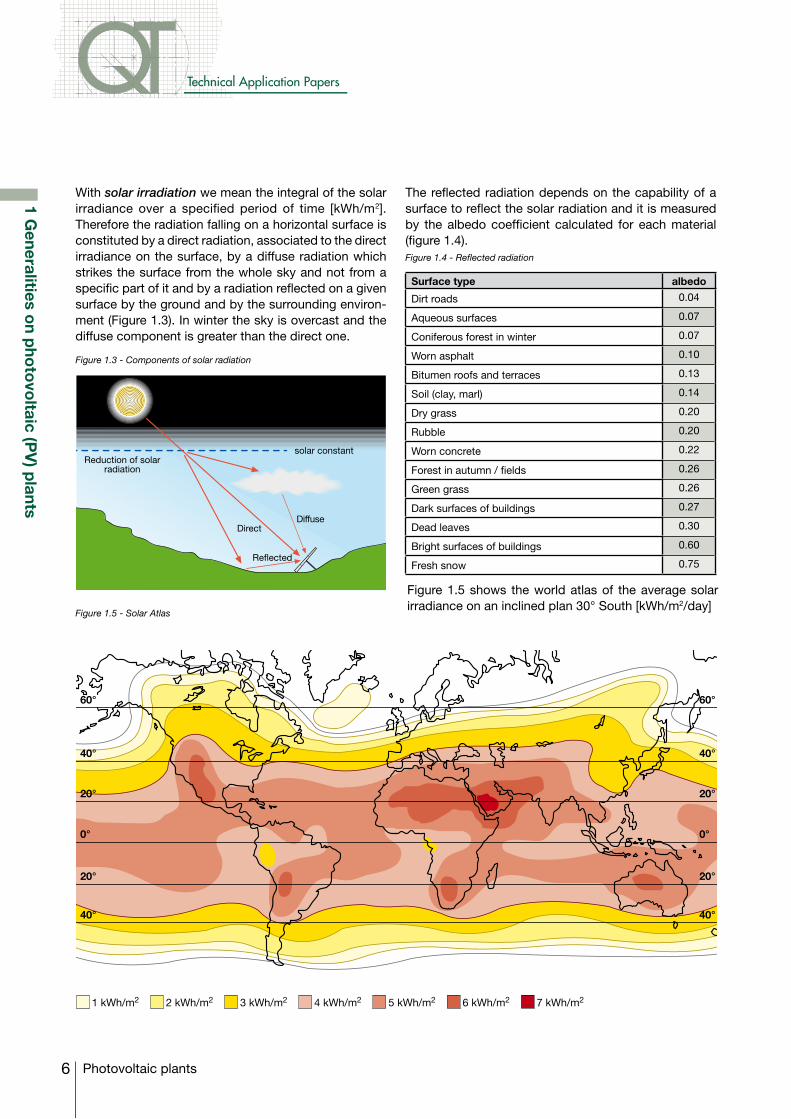
Figure 1.2 - Energy flow between the sun, the atmosphere and the ground
Figure 1.1 - Extra-atmospheric radiation
1 Due to its elliptical orbit the Earth is at its least distance from the Sun (perihelion) in December and January and at its greatest distance (aphelion) in June and July.
With solar irradiance we mean the intensity of the solar electromagnetic radiation incident on a surface of 1 square meter [kW/m2]. Such intensity is equal to the integral of the power associated to each value of the frequency of the solar radiation spectrum. When passing through the atmosphere, the solar radia-tion diminishes in intensity because it is partially reflected and absorbed (above all by the water vapor and by the other atmospheric gases). The radiation which passes through is partially diffused by the air and by the solid par-ticles suspended in the air (Figure 1.2).
25% reflectedby the atmosphere
5% reflectedby the ground
5% absorbed bythe atmosphere
18% diffused bythe atmosphere
27% absorbed by thesoil surface
W/m2
J F M AMonth
J J A S O N DM
1400
1380
1360
1340
1320
1300
6
Technical Application Papers
Photovoltaic plants
1 Generalities o
n pho
tovo
ltaic (PV
) plants
With solar irradiation we mean the integral of the solar irradiance over a specified period of time [kWh/m2]. Therefore the radiation falling on a horizontal surface is constituted by a direct radiation, associated to the direct irradiance on the surface, by a diffuse radiation which strikes the surface from the whole sky and not from a specific part of it and by a radiation reflected on a given surface by the ground and by the surrounding environ-ment (Figure 1.3). In winter the sky is overcast and the diffuse component is greater than the direct one.
Figure 1.3 - Components of solar radiation
Figure 1.4 - Reflected radiation
Figure 1.5 - Solar Atlas
Figure 1.5 shows the world atlas of the average solar irradiance on an inclined plan 30° South [kWh/m2/day]
The reflected radiation depends on the capability of a surface to reflect the solar radiation and it is measured by the albedo coefficient calculated for each material (figure 1.4).
Surface type albedo
Dirt roads 0.04
Aqueous surfaces 0.07
Coniferous forest in winter 0.07
Worn asphalt 0.10
Bitumen roofs and terraces 0.13
Soil (clay, marl) 0.14
Dry grass 0.20
Rubble 0.20
Worn concrete 0.22
Forest in autumn / fields 0.26
Green grass 0.26
Dark surfaces of buildings 0.27
Dead leaves 0.30
Bright surfaces of buildings 0.60
Fresh snow 0.75
1 kWh/m2 2 kWh/m2 3 kWh/m2 4 kWh/m2 5 kWh/m2 6 kWh/m2 7 kWh/m2
solar constantReduction of solar
radiation
Direct
Reflected
Diffuse
7Photovoltaic plants
1 Generalities o
n pho
tovo
ltaic (PV
) plants
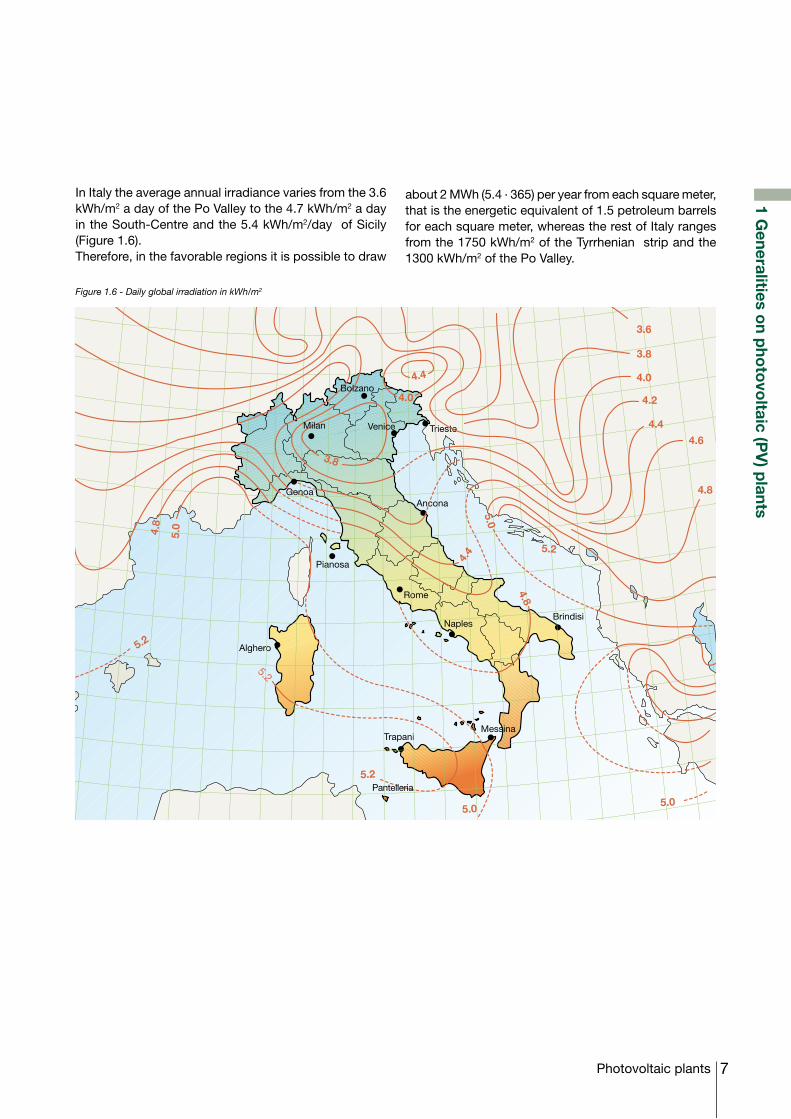
Figure 1.6 - Daily global irradiation in kWh/m2
In Italy the average annual irradiance varies from the 3.6 kWh/m2 a day of the Po Valley to the 4.7 kWh/m2 a day in the South-Centre and the 5.4 kWh/m2/day of Sicily (Figure 1.6). Therefore, in the favorable regions it is possible to draw
about 2 MWh (5.4 . 365) per year from each square meter, that is the energetic equivalent of 1.5 petroleum barrels for each square meter, whereas the rest of Italy ranges from the 1750 kWh/m2 of the Tyrrhenian strip and the 1300 kWh/m2 of the Po Valley.
Rome
NaplesBrindisi
Alghero
Trapani
Ancona
Pianosa
Trieste
3.8
4.0
3.8
4.0
4.4
4.2
5.04.8
4.4
4.8
5.2
5.2
5.0 5.0
5.2
4.6
4.4
4.8
5.0
5.2
3.6
Milan
Genoa
Bolzano
Venice
Pantelleria
Messina
8
Technical Application Papers
Photovoltaic plants
1 Generalities o
n pho
tovo
ltaic (PV
) plants
1.3 Main components of a photovoltaic plants
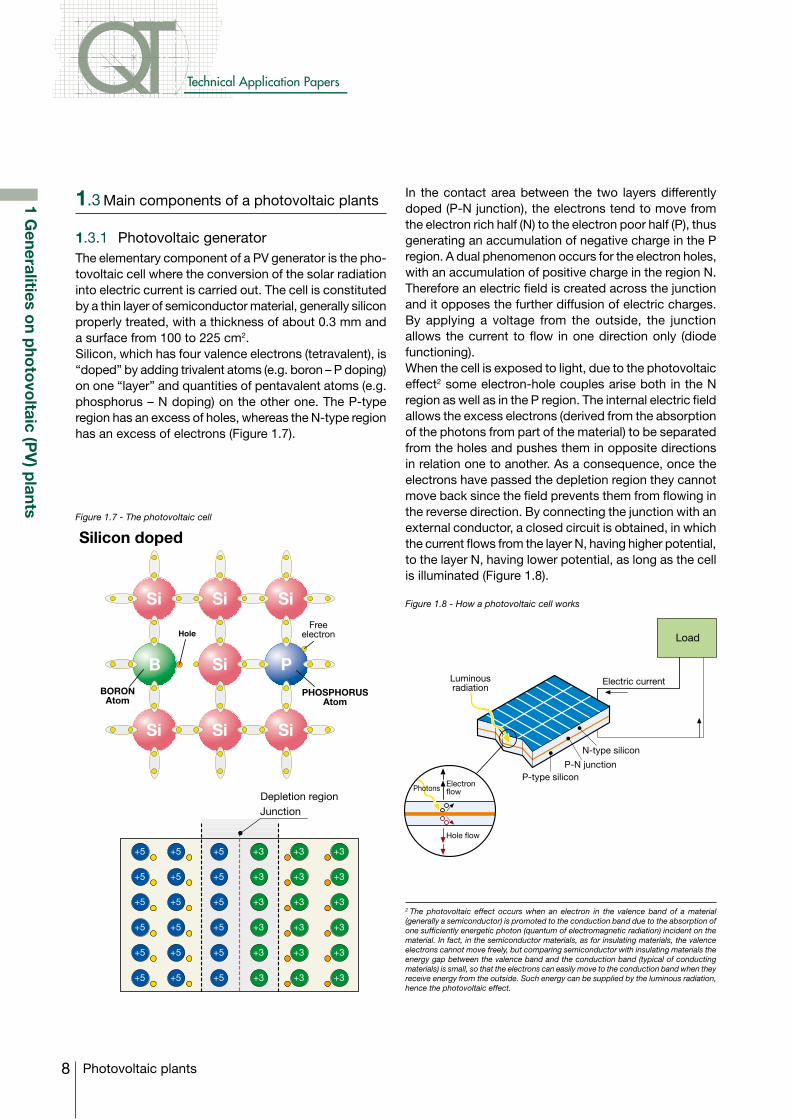
1.3.1 Photovoltaic generatorThe elementary component of a PV generator is the pho-tovoltaic cell where the conversion of the solar radiation into electric current is carried out. The cell is constituted by a thin layer of semiconductor material, generally silicon properly treated, with a thickness of about 0.3 mm and a surface from 100 to 225 cm2. Silicon, which has four valence electrons (tetravalent), is “doped” by adding trivalent atoms (e.g. boron – P doping) on one “layer” and quantities of pentavalent atoms (e.g. phosphorus – N doping) on the other one. The P-type region has an excess of holes, whereas the N-type region has an excess of electrons (Figure 1.7).
Figure 1.7 - The photovoltaic cell
Figure 1.8 - How a photovoltaic cell works
In the contact area between the two layers differently doped (P-N junction), the electrons tend to move from the electron rich half (N) to the electron poor half (P), thus generating an accumulation of negative charge in the P region. A dual phenomenon occurs for the electron holes, with an accumulation of positive charge in the region N. Therefore an electric field is created across the junction and it opposes the further diffusion of electric charges. By applying a voltage from the outside, the junction allows the current to flow in one direction only (diode functioning). When the cell is exposed to light, due to the photovoltaic effect2 some electron-hole couples arise both in the N region as well as in the P region. The internal electric field allows the excess electrons (derived from the absorption of the photons from part of the material) to be separated from the holes and pushes them in opposite directions in relation one to another. As a consequence, once the electrons have passed the depletion region they cannot move back since the field prevents them from flowing in the reverse direction. By connecting the junction with an external conductor, a closed circuit is obtained, in which the current flows from the layer N, having higher potential, to the layer N, having lower potential, as long as the cell is illuminated (Figure 1.8).
2 The photovoltaic effect occurs when an electron in the valence band of a material (generally a semiconductor) is promoted to the conduction band due to the absorption of one sufficiently energetic photon (quantum of electromagnetic radiation) incident on the material. In fact, in the semiconductor materials, as for insulating materials, the valence electrons cannot move freely, but comparing semiconductor with insulating materials the energy gap between the valence band and the conduction band (typical of conducting materials) is small, so that the electrons can easily move to the conduction band when they receive energy from the outside. Such energy can be supplied by the luminous radiation, hence the photovoltaic effect.
Silicon doped
Hole
Si Si Si
B Si P
Si Si Si
+5 +5 +5 +3 +3 +3
+5 +5 +5 +3 +3 +3
+5 +5 +5 +3 +3 +3
+5 +5 +5 +3 +3 +3
+5 +5 +5 +3 +3 +3
+5 +5 +5 +3 +3 +3
Depletion regionJunction
PHOSPHORUSAtom
Freeelectron
BORONAtom
Luminousradiation
P-type silicon
N-type silicon
P-N junction
Hole flow
ElectronflowPhotons
Electric current
Load
9Photovoltaic plants
Cell Module
Panelseveral modules assembledinto a single structure
Arrayassembly of panelsconnected in series
Photovoltaic generatorassembly of arrays connectedin parallel to obtain the required power
1 Generalities o
n pho
tovo
ltaic (PV
) plants
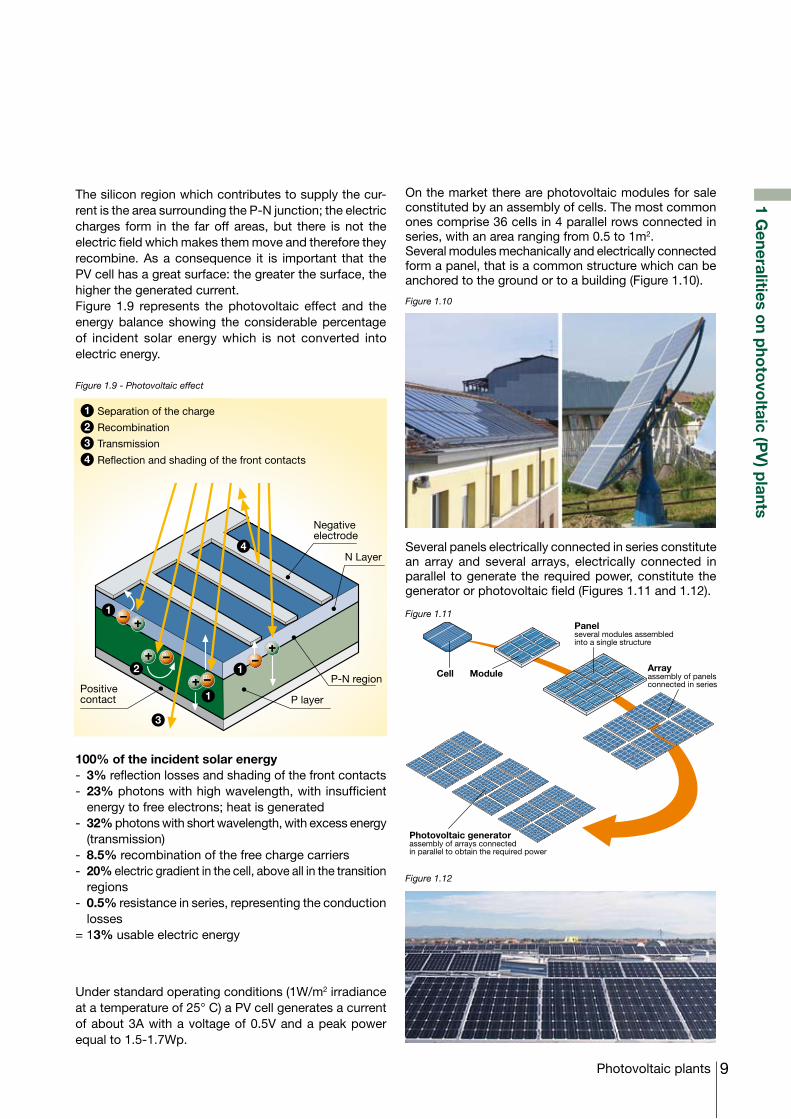
Figure 1.9 - Photovoltaic effect
Figure 1.11
Figure 1.12
Figure 1.10
The silicon region which contributes to supply the cur-rent is the area surrounding the P-N junction; the electric charges form in the far off areas, but there is not the electric field which makes them move and therefore they recombine. As a consequence it is important that the PV cell has a great surface: the greater the surface, the higher the generated current. Figure 1.9 represents the photovoltaic effect and the energy balance showing the considerable percentage of incident solar energy which is not converted into electric energy.
100% of the incident solar energy- 3% reflection losses and shading of the front contacts- 23% photons with high wavelength, with insufficient
energy to free electrons; heat is generated- 32% photons with short wavelength, with excess energy
(transmission) - 8.5% recombination of the free charge carriers- 20% electric gradient in the cell, above all in the transition
regions- 0.5% resistance in series, representing the conduction
losses= 13% usable electric energy
Under standard operating conditions (1W/m2 irradiance at a temperature of 25° C) a PV cell generates a current of about 3A with a voltage of 0.5V and a peak power equal to 1.5-1.7Wp.
Several panels electrically connected in series constitute an array and several arrays, electrically connected in parallel to generate the required power, constitute the generator or photovoltaic field (Figures 1.11 and 1.12).
On the market there are photovoltaic modules for sale constituted by an assembly of cells. The most common ones comprise 36 cells in 4 parallel rows connected in series, with an area ranging from 0.5 to 1m2. Several modules mechanically and electrically connected form a panel, that is a common structure which can be anchored to the ground or to a building (Figure 1.10).
Positivecontact P layer
P-N region
N Layer
Negativeelectrode
1
1
1
2
3
4
1 Separation of the charge
2 Recombination
3 Transmission
4 Reflection and shading of the front contacts
10
Technical Application Papers
Photovoltaic plants
1 Generalities o
n pho
tovo
ltaic (PV
) plants
The PV cells in the modules are not exactly alike due to the unavoidable manufacturing deviations; as a conse-quence, two blocks of cells connected in parallel between them can have not the same voltage. As a consequence, a flowing current is created from the block of cells at higher voltage towards the block at lower voltage. There-fore a part of the power generated by the module is lost within the module itself (mismatch losses).The inequality of the cells can be determined also by a different solar irradiance, for example when a part of cells are shaded or when they are deteriorated. These cells behave as a diode, blocking the current generated by the other cells. The diode is subject to the voltage of the other cells and it may cause the perforation of the junction with local overheating and damages to the module. Therefore the modules are equipped with by-pass diodes to limit such phenomenon by short-circuiting the shaded or damaged part of the module. The phenomenon of mis-match arises also between the arrays of the photovoltaic field, due to inequality of modules, different irradiance of the arrays, shadings and faults in an array. To avoid reverse current flowing among the arrays it is possible to insert diodes. The cells forming the module are encapsulated in an assembly system which:•electricallyinsulatesthecellstowardstheoutside;•protectsthecellsagainsttheatmosphericagentsand
against the mechanical stresses;• resistsultravioletrays,atlowtemperatures,sudden
changes of temperature and abrasion;•getsridofheateasilytopreventthetemperaturerise
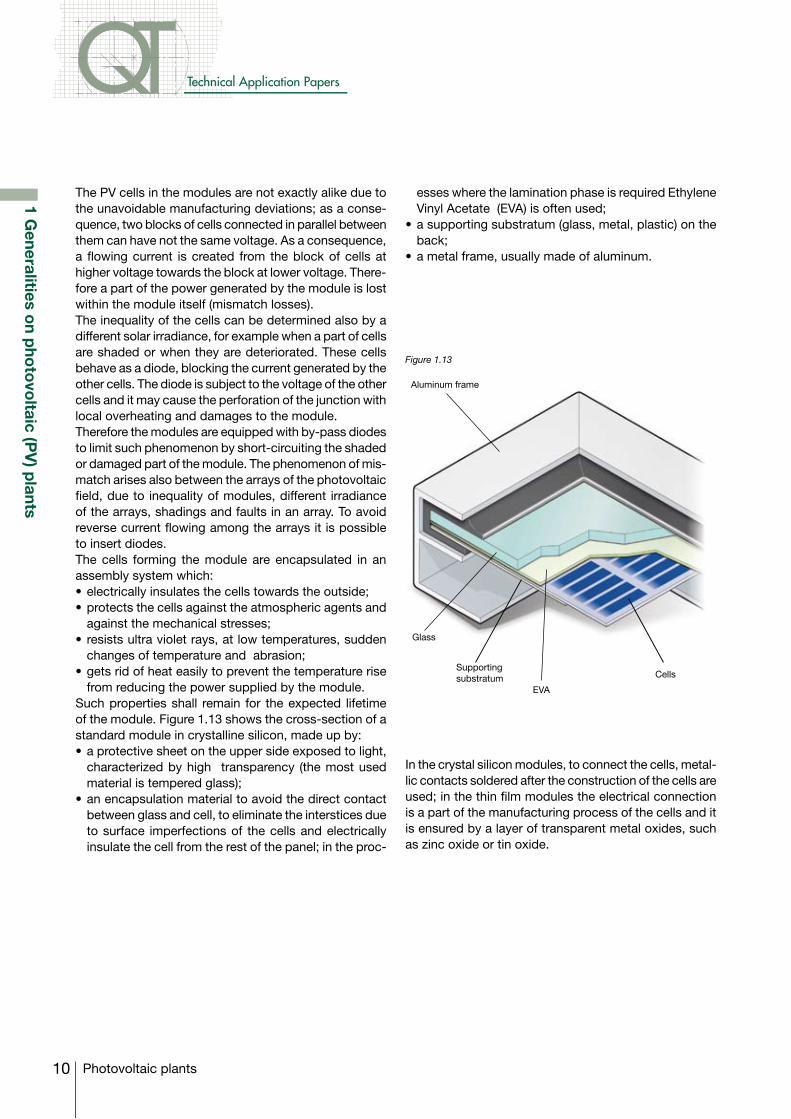
from reducing the power supplied by the module.Such properties shall remain for the expected lifetime of the module. Figure 1.13 shows the cross-section of a standard module in crystalline silicon, made up by:•aprotectivesheetontheuppersideexposedtolight,
characterized by high transparency (the most used material is tempered glass);
•anencapsulationmaterialtoavoidthedirectcontactbetween glass and cell, to eliminate the interstices due to surface imperfections of the cells and electrically insulate the cell from the rest of the panel; in the proc-
esses where the lamination phase is required Ethylene Vinyl Acetate (EVA) is often used;
•asupportingsubstratum(glass,metal,plastic)ontheback;
•ametalframe,usuallymadeofaluminum.
In the crystal silicon modules, to connect the cells, metal-lic contacts soldered after the construction of the cells are used; in the thin film modules the electrical connection is a part of the manufacturing process of the cells and it is ensured by a layer of transparent metal oxides, such as zinc oxide or tin oxide.
Aluminum frame
Cells
EVA
Glass
Supporting substratum
Figure 1.13
11Photovoltaic plants
1 Generalities o
n pho
tovo
ltaic (PV
) plants
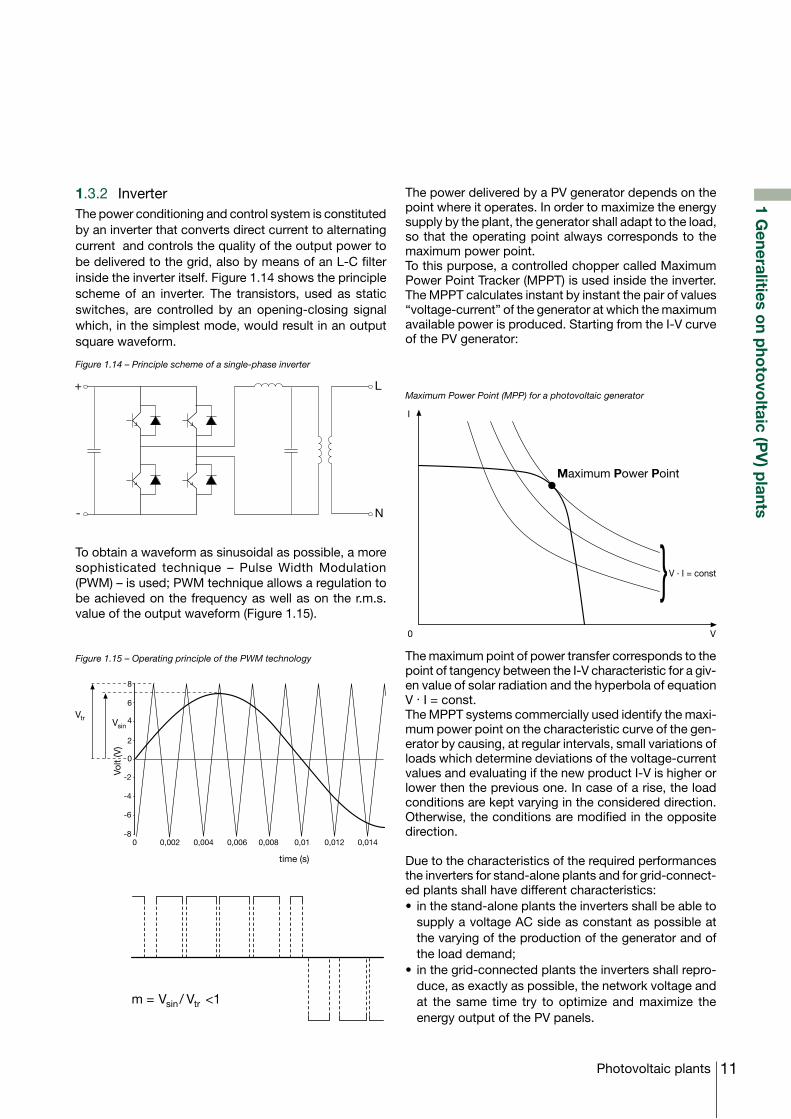
Figure 1.14 – Principle scheme of a single-phase inverter
1.3.2 InverterThe power conditioning and control system is constituted by an inverter that converts direct current to alternating current and controls the quality of the output power to be delivered to the grid, also by means of an L-C filter inside the inverter itself. Figure 1.14 shows the principle scheme of an inverter. The transistors, used as static switches, are controlled by an opening-closing signal which, in the simplest mode, would result in an output square waveform.
To obtain a waveform as sinusoidal as possible, a more sophisticated technique – Pulse Width Modulation (PWM) – is used; PWM technique allows a regulation to be achieved on the frequency as well as on the r.m.s. value of the output waveform (Figure 1.15).
Figure 1.15 – Operating principle of the PWM technology
The power delivered by a PV generator depends on the point where it operates. In order to maximize the energy supply by the plant, the generator shall adapt to the load, so that the operating point always corresponds to the maximum power point. To this purpose, a controlled chopper called Maximum Power Point Tracker (MPPT) is used inside the inverter.The MPPT calculates instant by instant the pair of values “voltage-current” of the generator at which the maximum available power is produced. Starting from the I-V curve of the PV generator:
The maximum point of power transfer corresponds to the point of tangency between the I-V characteristic for a giv-en value of solar radiation and the hyperbola of equation V . I = const. The MPPT systems commercially used identify the maxi-mum power point on the characteristic curve of the gen-erator by causing, at regular intervals, small variations of loads which determine deviations of the voltage-current values and evaluating if the new product I-V is higher or lower then the previous one. In case of a rise, the load conditions are kept varying in the considered direction. Otherwise, the conditions are modified in the opposite direction.
Due to the characteristics of the required performances the inverters for stand-alone plants and for grid-connect-ed plants shall have different characteristics:• inthestand-aloneplantstheinvertersshallbeableto
supply a voltage AC side as constant as possible at the varying of the production of the generator and of the load demand;
• inthegrid-connectedplantstheinvertersshallrepro-duce, as exactly as possible, the network voltage and at the same time try to optimize and maximize the energy output of the PV panels.
+
-
L
N
8
6
4
2
0
-8
-6
-4
-2
0 0,002 0,004 0,006 0,008 0,01 0,012 0,014
VtrVsin
Volt
(V)
time (s)
VtrVsin / <1m =
Maximum Power Point
I
0 V
V . I = const
Maximum Power Point (MPP) for a photovoltaic generator
12
Technical Application Papers
Photovoltaic plants
1 Generalities o
n pho
tovo
ltaic (PV
) plants
1.4 Typologies of photovoltaic panels
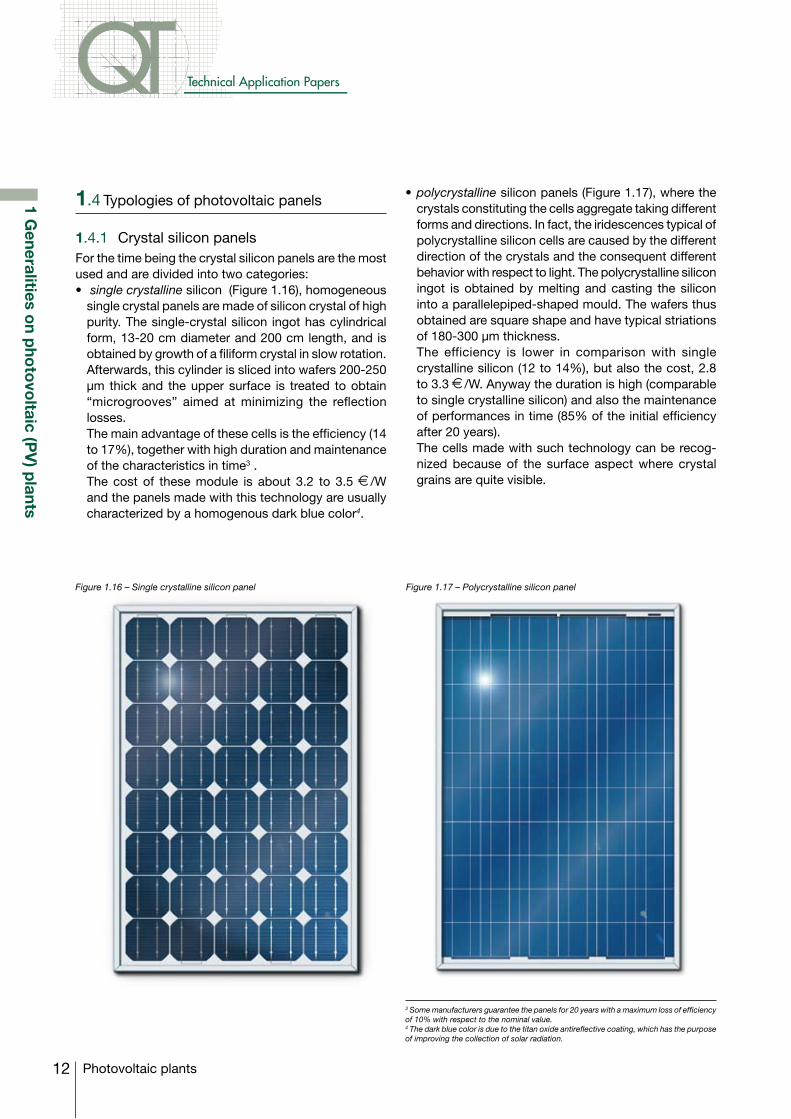
1.4.1 Crystal silicon panelsFor the time being the crystal silicon panels are the most used and are divided into two categories:• single crystalline silicon (Figure 1.16), homogeneous
single crystal panels are made of silicon crystal of high purity. The single-crystal silicon ingot has cylindrical form, 13-20 cm diameter and 200 cm length, and is obtained by growth of a filiform crystal in slow rotation. Afterwards, this cylinder is sliced into wafers 200-250 μm thick and the upper surface is treated to obtain “microgrooves” aimed at minimizing the reflection losses.
The main advantage of these cells is the efficiency (14 to 17%), together with high duration and maintenance of the characteristics in time3 .
The cost of these module is about 3.2 to 3.5 €/W and the panels made with this technology are usually characterized by a homogenous dark blue color4.
3 Some manufacturers guarantee the panels for 20 years with a maximum loss of efficiency of 10% with respect to the nominal value.4 The dark blue color is due to the titan oxide antireflective coating, which has the purpose of improving the collection of solar radiation.
•polycrystalline silicon panels (Figure 1.17), where the crystals constituting the cells aggregate taking different forms and directions. In fact, the iridescences typical of polycrystalline silicon cells are caused by the different direction of the crystals and the consequent different behavior with respect to light. The polycrystalline silicon ingot is obtained by melting and casting the silicon into a parallelepiped-shaped mould. The wafers thus obtained are square shape and have typical striations of 180-300 μm thickness.
The efficiency is lower in comparison with single crystalline silicon (12 to 14%), but also the cost, 2.8 to 3.3 €/W. Anyway the duration is high (comparable to single crystalline silicon) and also the maintenance of performances in time (85% of the initial efficiency after 20 years).
The cells made with such technology can be recog-nized because of the surface aspect where crystal grains are quite visible.
Figure 1.16 – Single crystalline silicon panel Figure 1.17 – Polycrystalline silicon panel
13Photovoltaic plants
1 Generalities o
n pho
tovo
ltaic (PV
) plants
Nowadays the market is dominated by crystal silicon technology, which represents about 90% of it. Such technology is ripe in terms of both obtainable efficiency and manufacturing costs and it will probably continue to dominate the market in the short-medium period. Only some slight improvements are expected in terms of efficiency (new industrial products declare 18%, with a laboratory record of 24.7%, which is considered practically insurmountable) and a possible reduction of the costs linked both to the introduction in the industrial processes of bigger and thinner wafers as well as to the economies of scale. Besides, the PV industry based on such technology uses the surplus of silicon intended for the electronics industry but, due to the constant develop-ment of the last and to the exponential growth of the PV production at an average rate of 40% in the last six years, the availability on the market of raw material to be used in the photovoltaic sector is becoming more limited.
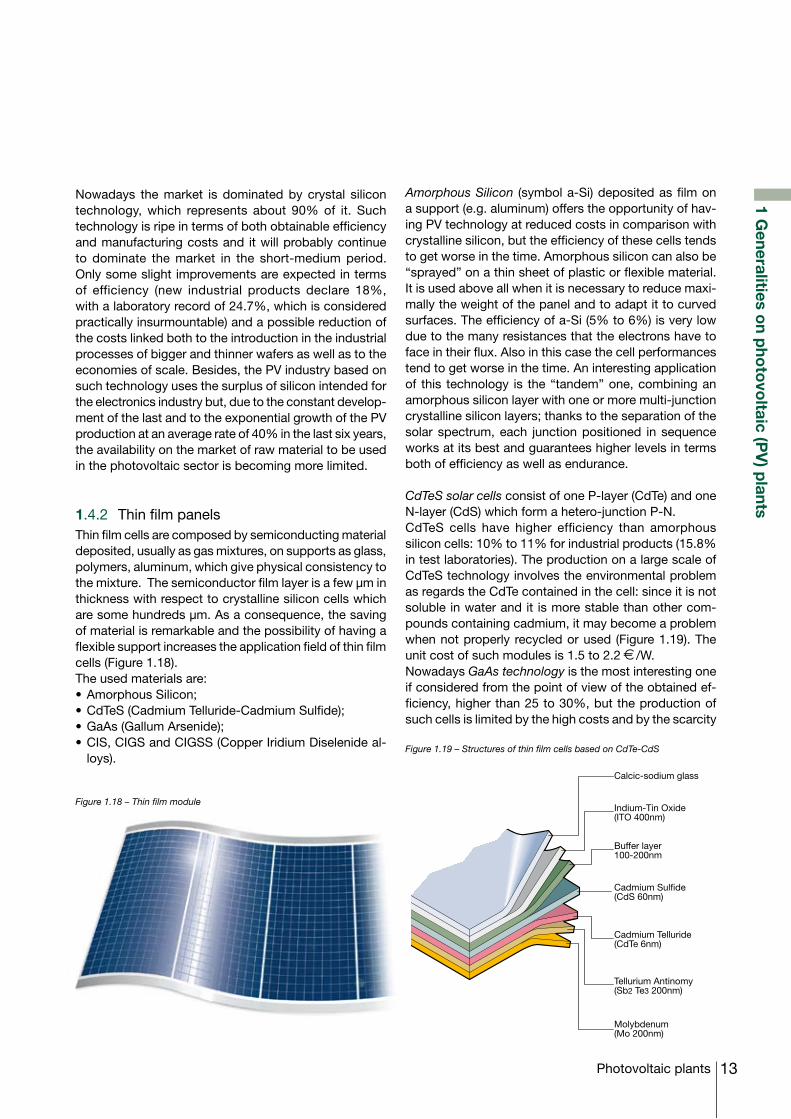
1.4.2 Thin film panelsThin film cells are composed by semiconducting material deposited, usually as gas mixtures, on supports as glass, polymers, aluminum, which give physical consistency to the mixture. The semiconductor film layer is a few μm in thickness with respect to crystalline silicon cells which are some hundreds μm. As a consequence, the saving of material is remarkable and the possibility of having a flexible support increases the application field of thin film cells (Figure 1.18). The used materials are:•AmorphousSilicon;•CdTeS(CadmiumTelluride-CadmiumSulfide);•GaAs(GallumArsenide);•CIS,CIGSandCIGSS(CopperIridiumDiselenideal-
loys).
Amorphous Silicon (symbol a-Si) deposited as film on a support (e.g. aluminum) offers the opportunity of hav-ing PV technology at reduced costs in comparison with crystalline silicon, but the efficiency of these cells tends to get worse in the time. Amorphous silicon can also be “sprayed” on a thin sheet of plastic or flexible material. It is used above all when it is necessary to reduce maxi-mally the weight of the panel and to adapt it to curved surfaces. The efficiency of a-Si (5% to 6%) is very low due to the many resistances that the electrons have to face in their flux. Also in this case the cell performances tend to get worse in the time. An interesting application of this technology is the “tandem” one, combining an amorphous silicon layer with one or more multi-junction crystalline silicon layers; thanks to the separation of the solar spectrum, each junction positioned in sequence works at its best and guarantees higher levels in terms both of efficiency as well as endurance.
CdTeS solar cells consist of one P-layer (CdTe) and one N-layer (CdS) which form a hetero-junction P-N. CdTeS cells have higher efficiency than amorphous silicon cells: 10% to 11% for industrial products (15.8% in test laboratories). The production on a large scale of CdTeS technology involves the environmental problem as regards the CdTe contained in the cell: since it is not soluble in water and it is more stable than other com-pounds containing cadmium, it may become a problem when not properly recycled or used (Figure 1.19). The unit cost of such modules is 1.5 to 2.2 €/W.Nowadays GaAs technology is the most interesting one if considered from the point of view of the obtained ef-ficiency, higher than 25 to 30%, but the production of such cells is limited by the high costs and by the scarcity
Figure 1.18 – Thin film module
Figure 1.19 – Structures of thin film cells based on CdTe-CdS
Indium-Tin Oxide(ITO 400nm)
Calcic-sodium glass
Buffer layer100-200nm
Cadmium Sulfide(CdS 60nm)
Cadmium Telluride(CdTe 6nm)
Tellurium Antinomy(Sb2 Te3 200nm)
Molybdenum(Mo 200nm)
14
Technical Application Papers
Photovoltaic plants
1 Generalities o
n pho
tovo
ltaic (PV
) plants
of the material, which is prevailingly used in the “high speed semiconductors” and optoelectronics industry. In fact, GaAs technology is used mainly for space ap-plications where weights and reduced dimensions play an important role.
CIS/CIGS/CIGSS modules are part of a technology which is still under study and being developed. Silicon is replaced with special alloys such as:•copper,indiumandselenite(CIS);•copper,indium,galliumandselenite(CIGS);•copper, indium, gallium, selenite and sulphur (CIGSS).Nowadays the efficiency is 10 to 11% and the perform-ances remain constant in time; as for single crystalline and polycrystalline silicon a reduction in the production cost is foreseen, for the time being around 2.2-2.5 €/W.
The market share of thin film technologies is still very lim-ited (≈7%), but the solutions with the highest capacities in the medium-long term are being taken into consideration for a substantial price reduction. By depositing the thin film directly on a large scale, more than 5 m2, the scraps, which are typical of the slicing operation to get crystal-line silicon wafers from the initial ingot, are avoided. The deposition techniques are low power consumption processes and consequently the relevant payback time is short, that is only the time for which a PV plant shall be running before the power used to build it has been generated (about 1 year for amorphous silicon thin films against the 2 years of crystalline silicon). In comparison with crystalline silicon modules thin film modules show a lower dependence of efficiency on the operating tem-perature and a good response also when the diffused
5 According to some studies in this field, by 2020 the market share of thin films may reach 30% to 40%.
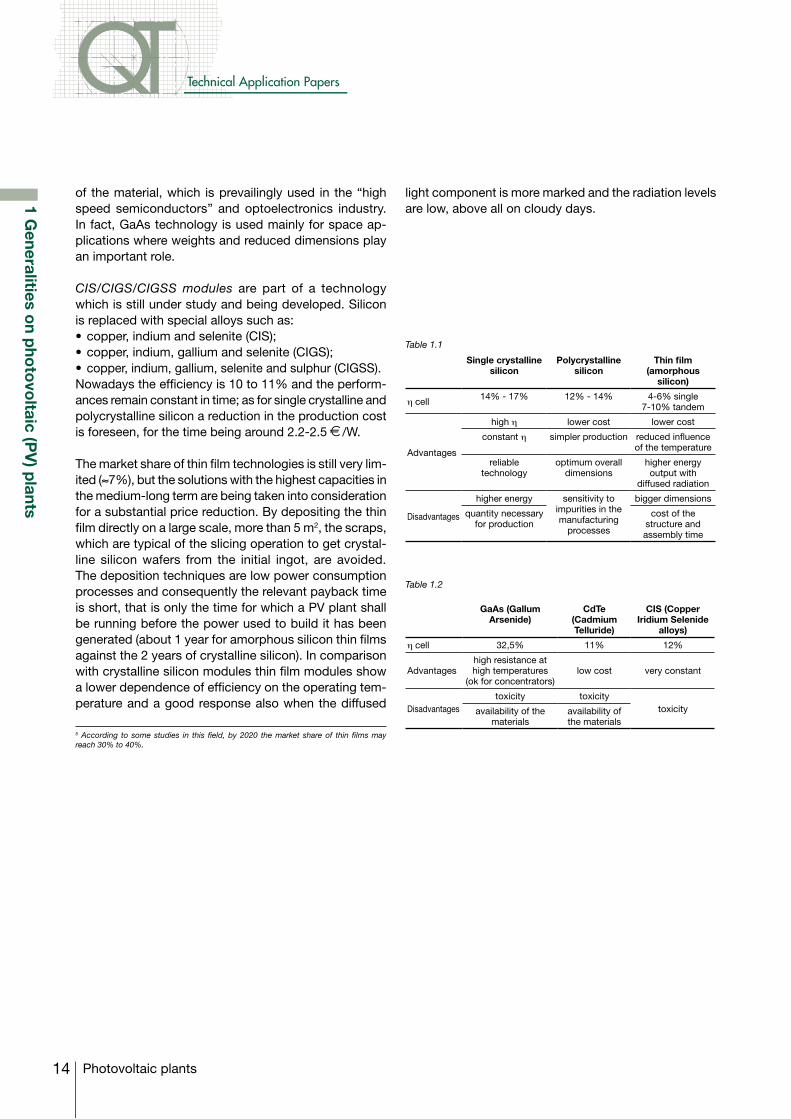
Single crystalline silicon
Polycrystalline silicon
Thin film (amorphous
silicon)
η cell 14% - 17% 12% - 14% 4-6% single7-10% tandem
Advantages
high η lower cost lower cost
constant η simpler production reduced influence of the temperature
reliable technology
optimum overall dimensions
higher energy output with
diffused radiation
Disadvantages
higher energy sensitivity to impurities in the manufacturing
processes
bigger dimensions
quantity necessary for production
cost of the structure and assembly time
GaAs (Gallum Arsenide)
CdTe (Cadmium Telluride)
CIS (Copper Iridium Selenide
alloys)
η cell 32,5% 11% 12%
Advantageshigh resistance at high temperatures
(ok for concentrators)low cost very constant
Disadvantagestoxicity toxicity
toxicityavailability of the materials
availability of the materials
Table 1.1
Table 1.2
light component is more marked and the radiation levels are low, above all on cloudy days.
15Photovoltaic plants
1 Generalities o
n pho
tovo
ltaic (PV
) plants
1.5 Typologies of photovoltaic plants
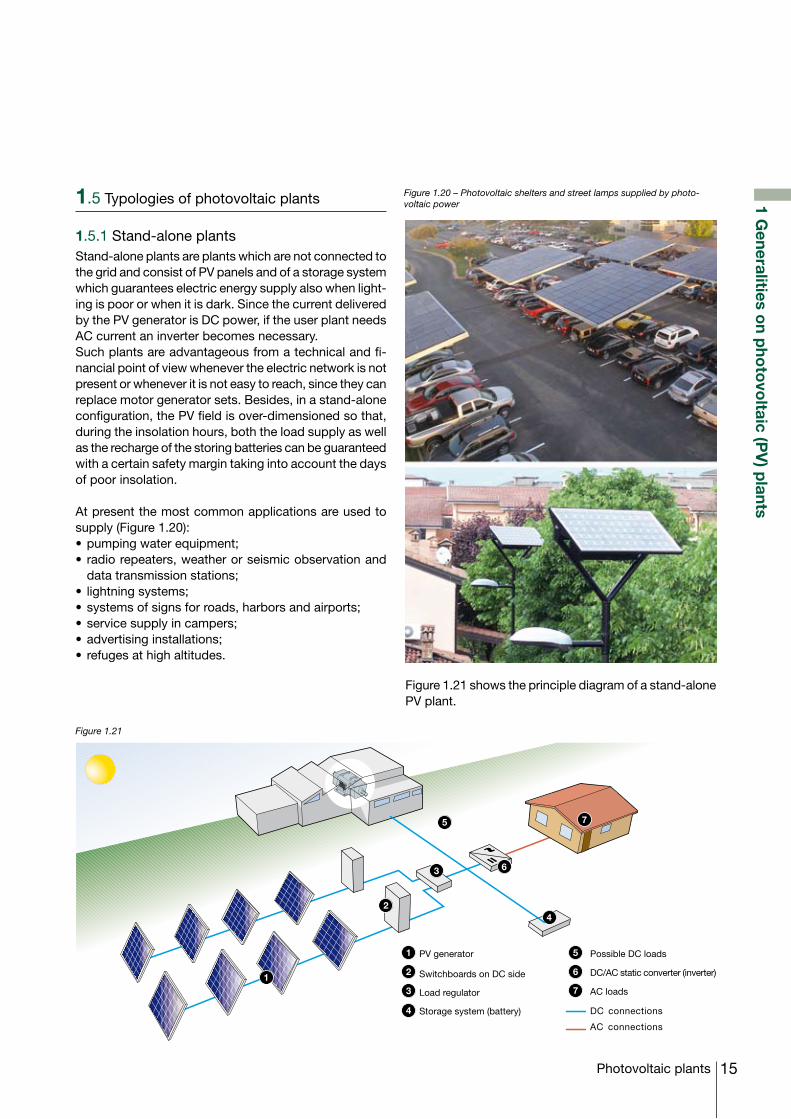
1.5.1 Stand-alone plantsStand-alone plants are plants which are not connected to the grid and consist of PV panels and of a storage system which guarantees electric energy supply also when light-ing is poor or when it is dark. Since the current delivered by the PV generator is DC power, if the user plant needs AC current an inverter becomes necessary. Such plants are advantageous from a technical and fi-nancial point of view whenever the electric network is not present or whenever it is not easy to reach, since they can replace motor generator sets. Besides, in a stand-alone configuration, the PV field is over-dimensioned so that, during the insolation hours, both the load supply as well as the recharge of the storing batteries can be guaranteed with a certain safety margin taking into account the days of poor insolation.
At present the most common applications are used to supply (Figure 1.20):•pumpingwaterequipment;• radiorepeaters,weatherorseismicobservationand
data transmission stations;• lightningsystems;•systemsofsignsforroads,harborsandairports;•servicesupplyincampers;•advertisinginstallations;• refugesathighaltitudes.
Figure 1.20 – Photovoltaic shelters and street lamps supplied by photo-voltaic power
Figure 1.21 shows the principle diagram of a stand-alone PV plant.
Figure 1.21
1
2
3
4
5
6
7
1
2
3
4
5PV generator
Switchboards on DC side
Load regulator
Storage system (battery)
Possible DC loads
DC/AC static converter (inverter)
AC loads
6
7
DC connections
AC connections
16
Technical Application Papers
Photovoltaic plants
1 Generalities o
n pho
tovo
ltaic (PV
) plants
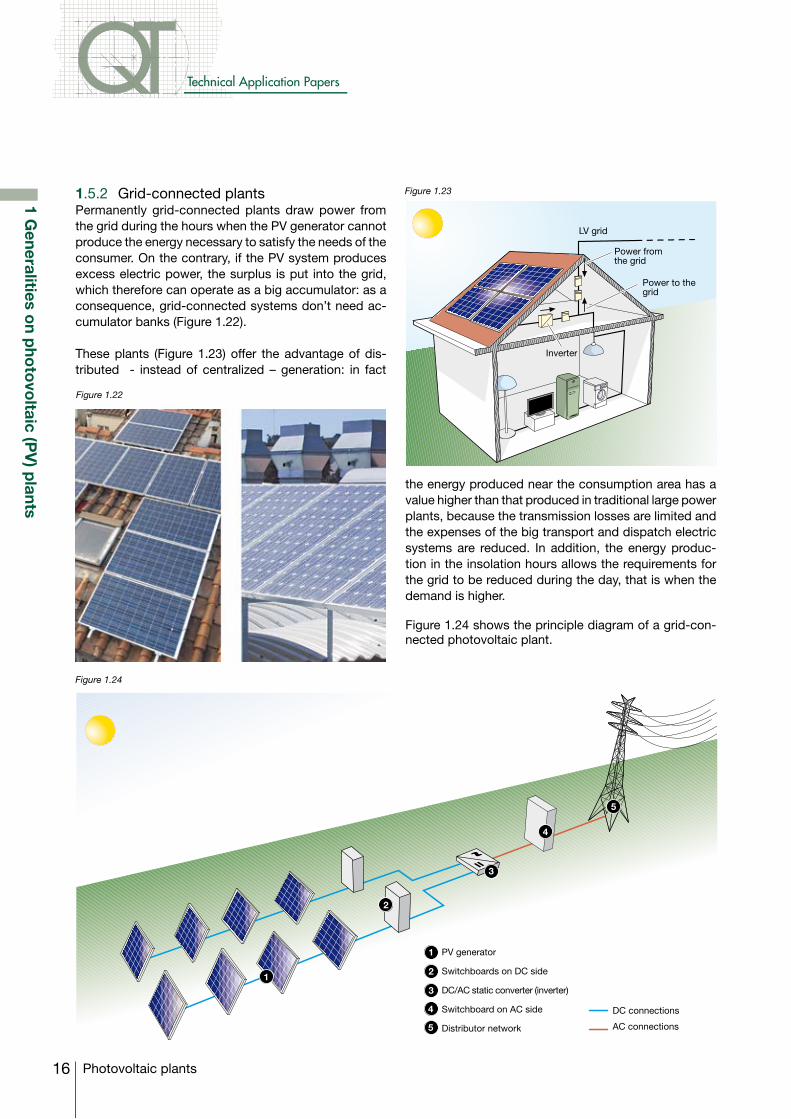
1.5.2 Grid-connected plantsPermanently grid-connected plants draw power from the grid during the hours when the PV generator cannot produce the energy necessary to satisfy the needs of the consumer. On the contrary, if the PV system produces excess electric power, the surplus is put into the grid, which therefore can operate as a big accumulator: as a consequence, grid-connected systems don’t need ac-cumulator banks (Figure 1.22).
These plants (Figure 1.23) offer the advantage of dis-tributed - instead of centralized – generation: in fact
Figure 1.22
the energy produced near the consumption area has a value higher than that produced in traditional large power plants, because the transmission losses are limited and the expenses of the big transport and dispatch electric systems are reduced. In addition, the energy produc-tion in the insolation hours allows the requirements for the grid to be reduced during the day, that is when the demand is higher.
Figure 1.24 shows the principle diagram of a grid-con-nected photovoltaic plant.
Figure 1.24
LV grid
Power to thegrid
Power fromthe grid
Inverter
1
2
3
1
2
3
4
PV generator
Switchboards on DC side
DC/AC static converter (inverter)
Switchboard on AC side
Distributor network
DC connections
AC connections
4
5
5
Figure 1.23
17Photovoltaic plants
1 Generalities o
n pho
tovo
ltaic (PV
) plants
1.6 Intermittence of generation and storage of the produced power
The PV utilization on a large scale is affected by a techni-cal limit due to the uncertain intermittency of production. In fact, the national electrical distribution network can accept a limited quantity of intermittent input power, after which serious problems for the stability of the network can rise. The acceptance limit depends on the network configuration and on the degree of interconnection with the contiguous grids. In particular, in the Italian situation, it is considered dan-gerous when the total intermittent power introduced into the network exceeds a value from 10% to 20% of the total power of the traditional power generation plants.As a consequence, the presence of a constraint due to the intermittency of power generation restricts the real possibility of giving a significant PV contribution to the national energy balance and this remark can be extended to all intermittent renewable sources. To get round this negative aspect it would be necessary to store for sufficiently long times the intermittent electric power thus produced to put it into the network in a more continuous and stable form. Electric power can be stored either in big superconducting coils or converting it into other form of energy: kinetic energy stored in flywheels or compressed gases, gravitational energy in water basins, chemical energy in synthesis fuels and electrochemical energy in electric accumulators (batteries). Through a technical selection of these options according to the requirement of maintaining energy efficiently for days and/or months, two storage systems emerge: that using
batteries and the hydrogen one. At the state of the art of these two technologies, the electrochemical storage seems feasible, in the short-medium term, to store the energy for some hours to some days. Therefore, in rela-tion to photovoltaics applied to small grid-connected plants, the insertion of a storage sub-system consist-ing in batteries of small dimensions may improve the situation of the inconveniences due to intermittency, thus allowing a partial overcoming of the acceptance limit of the network. As regards the seasonal storage of the huge quantity of electric power required to replace petroleum in all the usage sectors, hydrogen seems to be the most suitable technology for the long term since it takes advantage of the fact that solar electric produc-tivity in summer is higher than the winter productivity of about a factor 3. The exceeding energy stored in summer could be used to optimize the annual capacity factor of renewable source power plants, increasing it from the present value of 1500-1600 hours without storage to a value nearer to the average one of the conventional power plants (about 6000 hours). In this case the power from renewable source could replace the thermoelectric one in its role, since the acceptance limit of the grid would be removed.
18
Technical Application Papers
Photovoltaic plants
2 Energ
y pro
ductio
n
2 Energy production
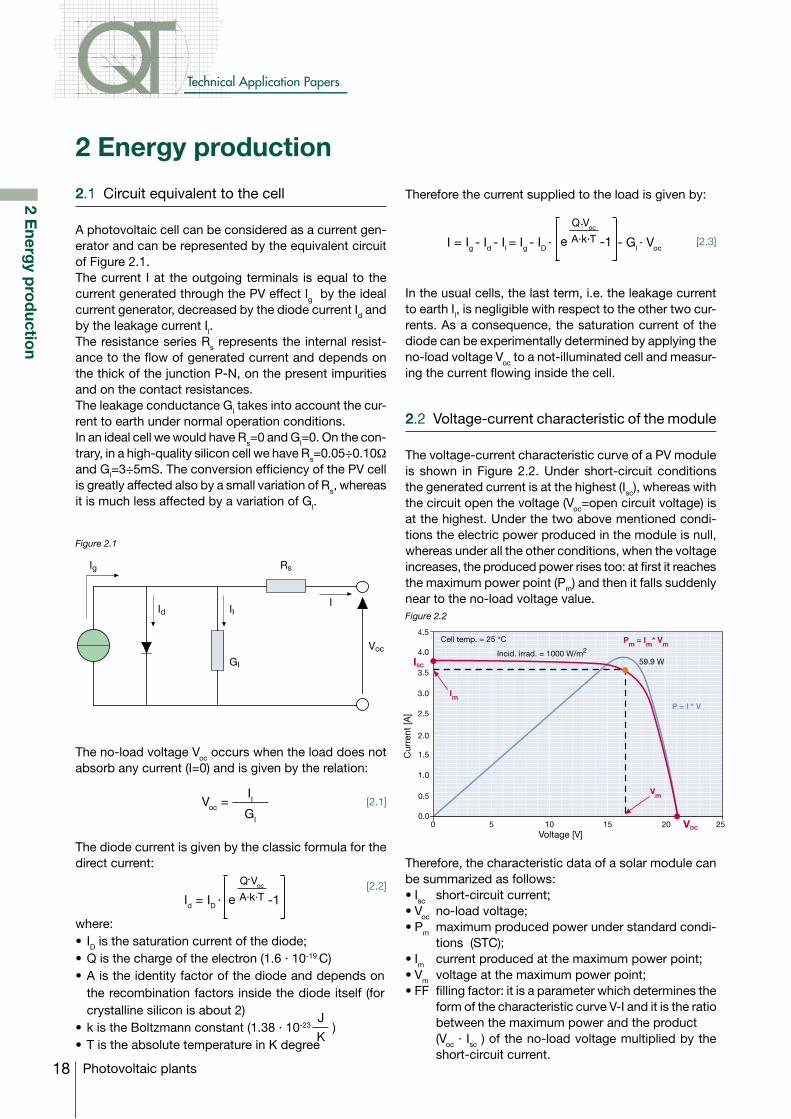
2.1 Circuit equivalent to the cell
A photovoltaic cell can be considered as a current gen-erator and can be represented by the equivalent circuit of Figure 2.1. The current I at the outgoing terminals is equal to the current generated through the PV effect Ig by the ideal current generator, decreased by the diode current Id and by the leakage current Il. The resistance series Rs represents the internal resist-ance to the flow of generated current and depends on the thick of the junction P-N, on the present impurities and on the contact resistances. The leakage conductance Gl takes into account the cur-rent to earth under normal operation conditions. In an ideal cell we would have Rs=0 and Gl=0. On the con-trary, in a high-quality silicon cell we have Rs=0.05÷0.10Ω and Gl=3÷5mS. The conversion efficiency of the PV cell is greatly affected also by a small variation of Rs, whereas it is much less affected by a variation of Gl.
Figure 2.1
Figure 2.2
The no-load voltage Voc occurs when the load does not absorb any current (I=0) and is given by the relation:
Voc =IIGI
[2.1]
[2.2]
[2.3]
The diode current is given by the classic formula for the direct current:
where:• ID is the saturation current of the diode;•Qisthechargeoftheelectron(1.6. 10-19 C)•Aistheidentityfactorofthediodeanddependson
the recombination factors inside the diode itself (for crystalline silicon is about 2)
•kistheBoltzmannconstant(1.38. 10-23 J
K )
•TistheabsolutetemperatureinKdegree
Therefore the current supplied to the load is given by:
In the usual cells, the last term, i.e. the leakage current to earth Il, is negligible with respect to the other two cur-rents. As a consequence, the saturation current of the diode can be experimentally determined by applying the no-load voltage Voc to a not-illuminated cell and measur-ing the current flowing inside the cell.
2.2 Voltage-current characteristic of the module
The voltage-current characteristic curve of a PV module is shown in Figure 2.2. Under short-circuit conditions the generated current is at the highest (Isc), whereas with the circuit open the voltage (Voc=open circuit voltage) is at the highest. Under the two above mentioned condi-tions the electric power produced in the module is null, whereas under all the other conditions, when the voltage increases, the produced power rises too: at first it reaches the maximum power point (Pm) and then it falls suddenly near to the no-load voltage value.
Therefore, the characteristic data of a solar module can be summarized as follows:•Isc short-circuit current;•Voc no-load voltage;•Pm maximum produced power under standard condi-
tions (STC);•Im current produced at the maximum power point;•Vm voltage at the maximum power point;•FF fillingfactor:itisaparameterwhichdeterminesthe
form of the characteristic curve V-I and it is the ratio between the maximum power and the product
(Voc . Isc ) of the no-load voltage multiplied by the
short-circuit current.
RsIg
Id II
GI
Voc
I
Cur
rent
[A]
Voltage [V]
Cell temp. = 25 °C
Incid. irrad. = 1000 W/m2
59.9 W
Im
Vm
Pm = Im* Vm
P = I * V
4.5
4.0
3.5
3.0
2.5
2.0
1.5
1.0
0.5
0.00 5 10 15 20 25
ISC
VOC
Id = ID.
.
-1
Q Voc
A.k.Te
.
-1
Q Voc
A.k.TeI = Ig - Id - Il = Ig - ID. - Gl
. Voc
19Photovoltaic plants
2 Energ
y pro
ductio
n
Figure 2.3
Figure 2.4
[2.4]
[2.5]
[2.6]
[2.7]
[2.8]
Iu = Ig + Ir
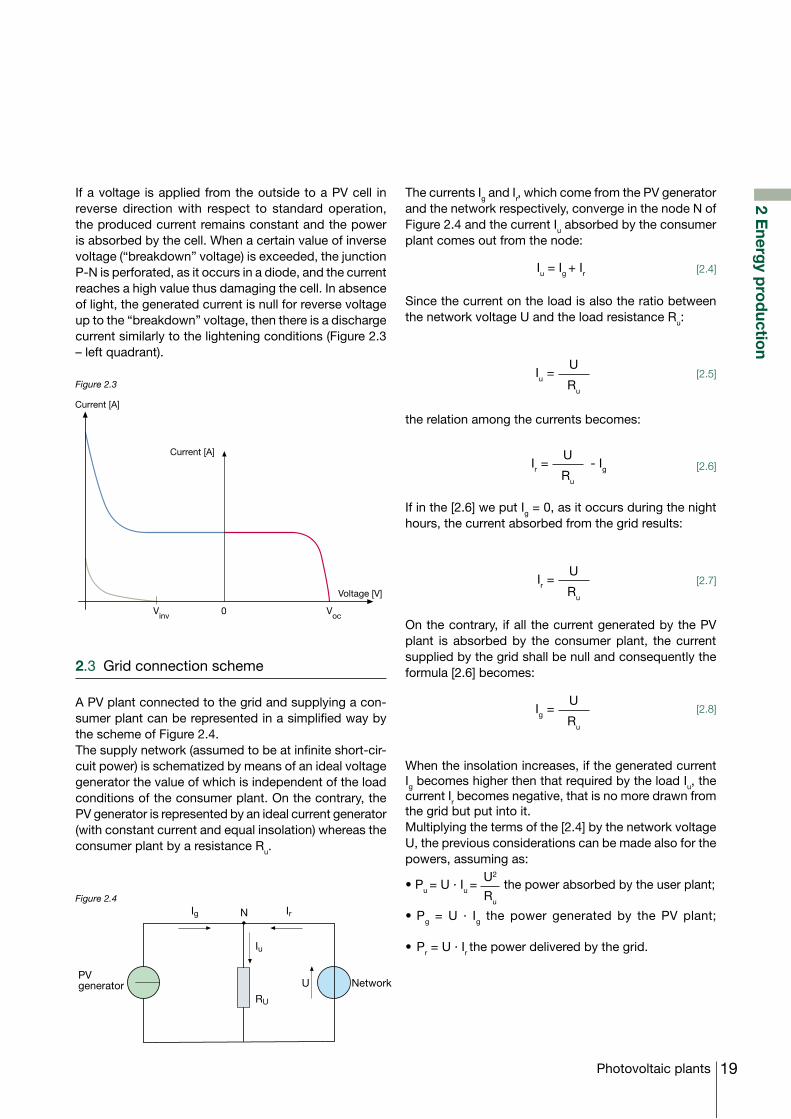
If a voltage is applied from the outside to a PV cell in reverse direction with respect to standard operation, the produced current remains constant and the power is absorbed by the cell. When a certain value of inverse voltage (“breakdown” voltage) is exceeded, the junction P-N is perforated, as it occurs in a diode, and the current reaches a high value thus damaging the cell. In absence of light, the generated current is null for reverse voltage up to the “breakdown” voltage, then there is a discharge current similarly to the lightening conditions (Figure 2.3 – left quadrant).
2.3 Grid connection scheme
A PV plant connected to the grid and supplying a con-sumer plant can be represented in a simplified way by the scheme of Figure 2.4. The supply network (assumed to be at infinite short-cir-cuit power) is schematized by means of an ideal voltage generator the value of which is independent of the load conditions of the consumer plant. On the contrary, the PV generator is represented by an ideal current generator (with constant current and equal insolation) whereas the consumer plant by a resistance Ru.
The currents Ig and Ir, which come from the PV generator and the network respectively, converge in the node N of Figure 2.4 and the current Iu absorbed by the consumer plant comes out from the node:
Since the current on the load is also the ratio between the network voltage U and the load resistance Ru:
Iu =U
Ru
Ir =U
Ru
Ig =U
Ru
Ir =U
- IgRu
the relation among the currents becomes:
If in the [2.6] we put Ig = 0, as it occurs during the night hours, the current absorbed from the grid results:
On the contrary, if all the current generated by the PV plant is absorbed by the consumer plant, the current supplied by the grid shall be null and consequently the formula [2.6] becomes:
When the insolation increases, if the generated current Ig becomes higher then that required by the load Iu, the current Ir becomes negative, that is no more drawn from the grid but put into it.Multiplying the terms of the [2.4] by the network voltage U, the previous considerations can be made also for the powers, assuming as:
•Pu = U . Iu = U2
Ru
the power absorbed by the user plant; •Pg = U . Ig the power generated by the PV plant;
•Pr = U . Ir the power delivered by the grid.
Current [A]
Voltage [V]
Current [A]
Vinv Voc0
IrIg
Iu
RU
UPVgenerator Network
N
20
Technical Application Papers
Photovoltaic plants
AM =P
Posen (h) [2.9]
2 Energ
y pro
ductio
n
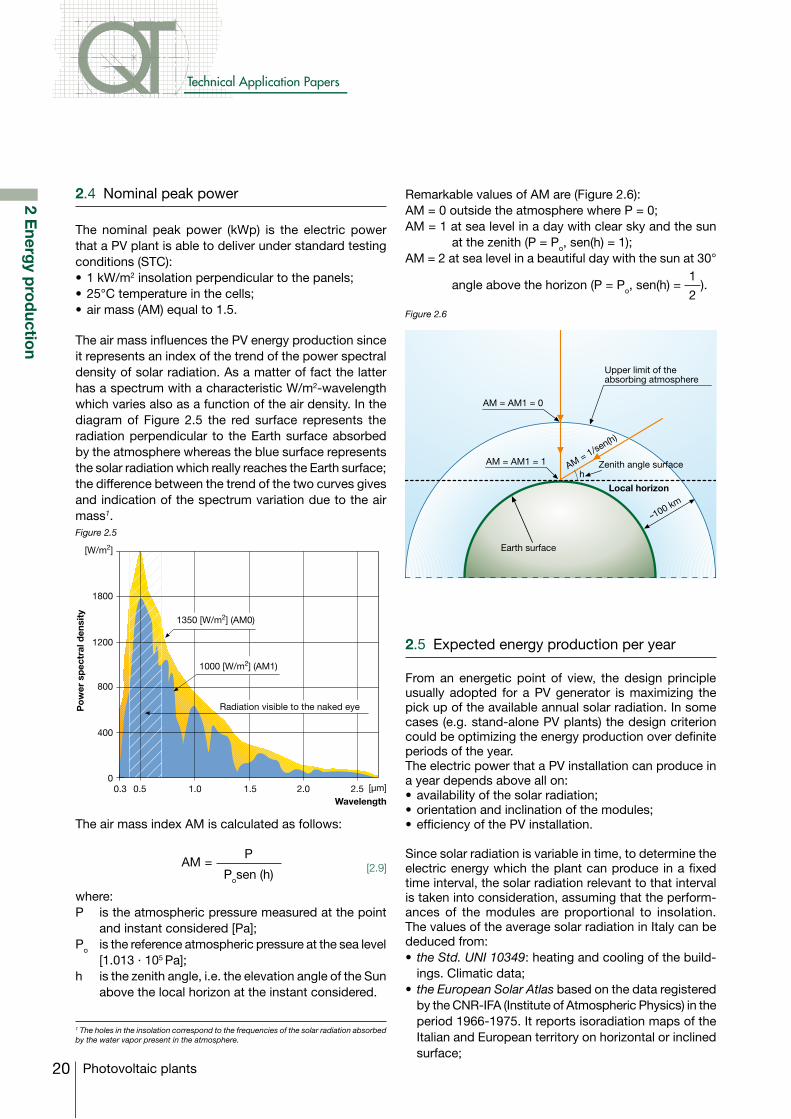
2.4 Nominal peak power
The nominal peak power (kWp) is the electric power that a PV plant is able to deliver under standard testing conditions (STC):•1kW/m2 insolation perpendicular to the panels;•25°Ctemperatureinthecells;•airmass(AM)equalto1.5.
The air mass influences the PV energy production since it represents an index of the trend of the power spectral density of solar radiation. As a matter of fact the latter has a spectrum with a characteristic W/m2-wavelength which varies also as a function of the air density. In the diagram of Figure 2.5 the red surface represents the radiation perpendicular to the Earth surface absorbed by the atmosphere whereas the blue surface represents the solar radiation which really reaches the Earth surface; the difference between the trend of the two curves gives and indication of the spectrum variation due to the air mass1.Figure 2.5
Figure 2.6
1 The holes in the insolation correspond to the frequencies of the solar radiation absorbed by the water vapor present in the atmosphere.
where:P is the atmospheric pressure measured at the point
and instant considered [Pa];Po is the reference atmospheric pressure at the sea level
[1.013 . 105 Pa];h is the zenith angle, i.e. the elevation angle of the Sun
above the local horizon at the instant considered.
The air mass index AM is calculated as follows:
2.5 Expected energy production per year
From an energetic point of view, the design principle usually adopted for a PV generator is maximizing the pick up of the available annual solar radiation. In some cases (e.g. stand-alone PV plants) the design criterion could be optimizing the energy production over definite periods of the year. The electric power that a PV installation can produce in a year depends above all on:•availabilityofthesolarradiation;•orientationandinclinationofthemodules;•efficiencyofthePVinstallation.
Since solar radiation is variable in time, to determine the electric energy which the plant can produce in a fixed time interval, the solar radiation relevant to that interval is taken into consideration, assuming that the perform-ances of the modules are proportional to insolation. The values of the average solar radiation in Italy can be deduced from:• the Std. UNI 10349: heating and cooling of the build-
ings. Climatic data;• the European Solar Atlas based on the data registered
by the CNR-IFA (Institute of Atmospheric Physics) in the period 1966-1975. It reports isoradiation maps of the Italian and European territory on horizontal or inclined surface;
Remarkable values of AM are (Figure 2.6):AM = 0 outside the atmosphere where P = 0;AM = 1 at sea level in a day with clear sky and the sun
at the zenith (P = Po, sen(h) = 1);AM = 2 at sea level in a beautiful day with the sun at 30°
angle above the horizon (P = Po, sen(h) = 1
2).
[W/m2]
1800
1200
800
400
00.3 0.5 1.0 1.5 2.0 2.5
Wavelength
Po
wer
sp
ectr
al d
ensi
ty 1350 [W/m2] (AM0)
1000 [W/m2] (AM1)
Radiation visible to the naked eye
Earth surface
100 km
AM = AM1 = 1
Local horizon
AM = AM1 = 0
AM = 1/sen(h)
hZenith angle surface
Upper limit of theabsorbing atmosphere
21Photovoltaic plants
2 Energ
y pro
ductio
n
Table 2.1
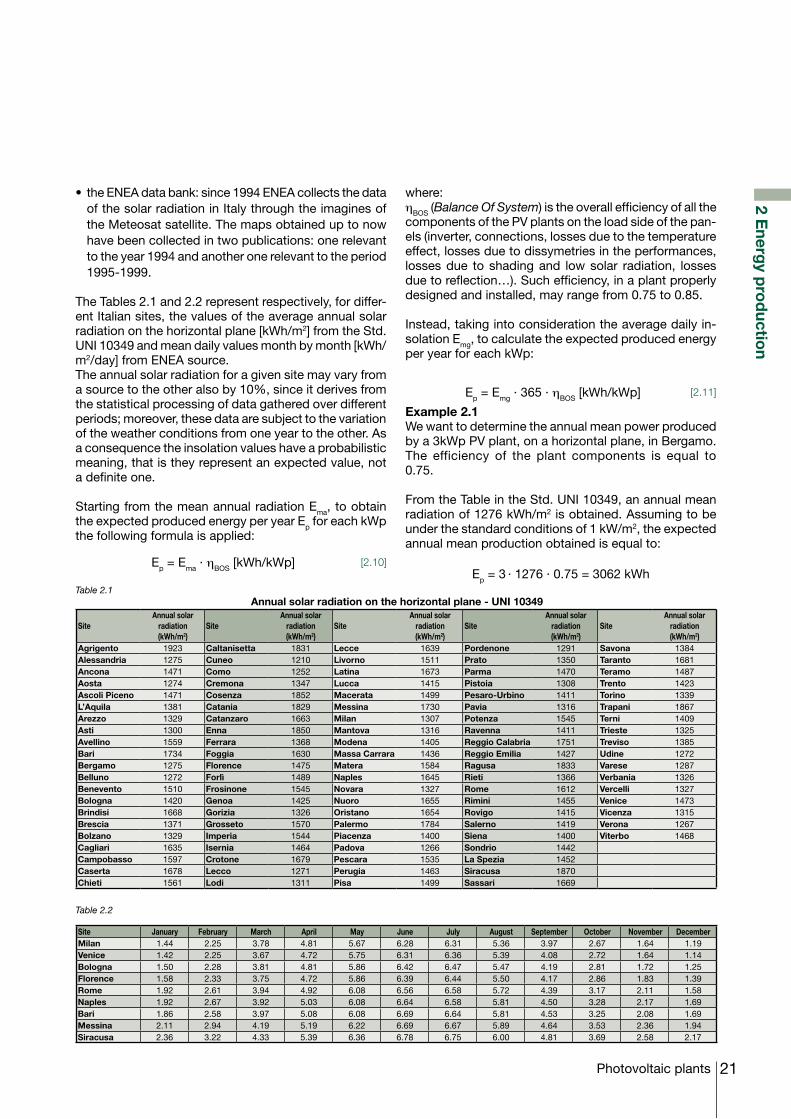
where:ηBOS (Balance Of System) is the overall efficiency of all the components of the PV plants on the load side of the pan-els (inverter, connections, losses due to the temperature effect, losses due to dissymetries in the performances, losses due to shading and low solar radiation, losses due to reflection…). Such efficiency, in a plant properly designed and installed, may range from 0.75 to 0.85.
Instead, taking into consideration the average daily in-solation Emg, to calculate the expected produced energy per year for each kWp:
Example 2.1We want to determine the annual mean power produced by a 3kWp PV plant, on a horizontal plane, in Bergamo. The efficiency of the plant components is equal to 0.75.
From the Table in the Std. UNI 10349, an annual mean radiation of 1276 kWh/m2 is obtained. Assuming to be under the standard conditions of 1 kW/m2, the expected annual mean production obtained is equal to:
Ep = 3 . 1276 . 0.75 = 3062 kWh
• theENEAdatabank:since1994ENEAcollectsthedataof the solar radiation in Italy through the imagines of the Meteosat satellite. The maps obtained up to now have been collected in two publications: one relevant to the year 1994 and another one relevant to the period 1995-1999.
The Tables 2.1 and 2.2 represent respectively, for differ-ent Italian sites, the values of the average annual solar radiation on the horizontal plane [kWh/m2] from the Std. UNI 10349 and mean daily values month by month [kWh/m2/day] from ENEA source.The annual solar radiation for a given site may vary from a source to the other also by 10%, since it derives from the statistical processing of data gathered over different periods; moreover, these data are subject to the variation of the weather conditions from one year to the other. As a consequence the insolation values have a probabilistic meaning, that is they represent an expected value, not a definite one.
Starting from the mean annual radiation Ema, to obtain the expected produced energy per year Ep for each kWp the following formula is applied:
Annual solar radiation on the horizontal plane - UNI 10349
SiteAnnual solar
radiation(kWh/m2)
SiteAnnual solar
radiation(kWh/m2)
SiteAnnual solar
radiation(kWh/m2)
SiteAnnual solar
radiation(kWh/m2)
SiteAnnual solar
radiation(kWh/m2)
Agrigento 1923 Caltanisetta 1831 Lecce 1639 Pordenone 1291 Savona 1384Alessandria 1275 Cuneo 1210 Livorno 1511 Prato 1350 Taranto 1681Ancona 1471 Como 1252 Latina 1673 Parma 1470 Teramo 1487Aosta 1274 Cremona 1347 Lucca 1415 Pistoia 1308 Trento 1423Ascoli Piceno 1471 Cosenza 1852 Macerata 1499 Pesaro-Urbino 1411 Torino 1339L’Aquila 1381 Catania 1829 Messina 1730 Pavia 1316 Trapani 1867Arezzo 1329 Catanzaro 1663 Milan 1307 Potenza 1545 Terni 1409Asti 1300 Enna 1850 Mantova 1316 Ravenna 1411 Trieste 1325Avellino 1559 Ferrara 1368 Modena 1405 Reggio Calabria 1751 Treviso 1385Bari 1734 Foggia 1630 Massa Carrara 1436 Reggio Emilia 1427 Udine 1272Bergamo 1275 Florence 1475 Matera 1584 Ragusa 1833 Varese 1287Belluno 1272 Forlì 1489 Naples 1645 Rieti 1366 Verbania 1326Benevento 1510 Frosinone 1545 Novara 1327 Rome 1612 Vercelli 1327Bologna 1420 Genoa 1425 Nuoro 1655 Rimini 1455 Venice 1473Brindisi 1668 Gorizia 1326 Oristano 1654 Rovigo 1415 Vicenza 1315Brescia 1371 Grosseto 1570 Palermo 1784 Salerno 1419 Verona 1267Bolzano 1329 Imperia 1544 Piacenza 1400 Siena 1400 Viterbo 1468Cagliari 1635 Isernia 1464 Padova 1266 Sondrio 1442Campobasso 1597 Crotone 1679 Pescara 1535 La Spezia 1452Caserta 1678 Lecco 1271 Perugia 1463 Siracusa 1870Chieti 1561 Lodi 1311 Pisa 1499 Sassari 1669
Site January February March April May June July August September October November DecemberMilan 1.44 2.25 3.78 4.81 5.67 6.28 6.31 5.36 3.97 2.67 1.64 1.19Venice 1.42 2.25 3.67 4.72 5.75 6.31 6.36 5.39 4.08 2.72 1.64 1.14Bologna 1.50 2.28 3.81 4.81 5.86 6.42 6.47 5.47 4.19 2.81 1.72 1.25Florence 1.58 2.33 3.75 4.72 5.86 6.39 6.44 5.50 4.17 2.86 1.83 1.39Rome 1.92 2.61 3.94 4.92 6.08 6.56 6.58 5.72 4.39 3.17 2.11 1.58Naples 1.92 2.67 3.92 5.03 6.08 6.64 6.58 5.81 4.50 3.28 2.17 1.69Bari 1.86 2.58 3.97 5.08 6.08 6.69 6.64 5.81 4.53 3.25 2.08 1.69Messina 2.11 2.94 4.19 5.19 6.22 6.69 6.67 5.89 4.64 3.53 2.36 1.94Siracusa 2.36 3.22 4.33 5.39 6.36 6.78 6.75 6.00 4.81 3.69 2.58 2.17
Table 2.2
Ep = Emg . 365 . ηBOS [kWh/kWp] [2.11]
Ep = Ema . ηBOS [kWh/kWp] [2.10]
22
Technical Application Papers
Photovoltaic plants
2 Energ
y pro
ductio
n
2.6 Inclination and orientation of the panels
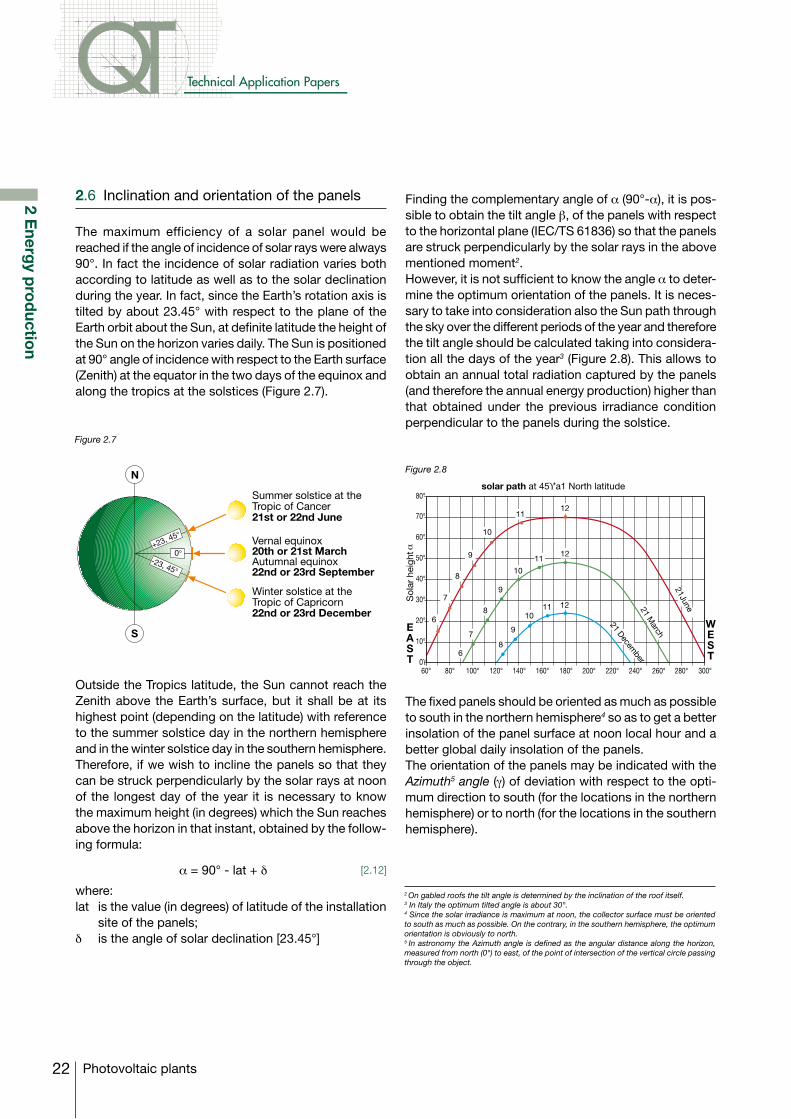
The maximum efficiency of a solar panel would be reached if the angle of incidence of solar rays were always 90°. In fact the incidence of solar radiation varies both according to latitude as well as to the solar declination during the year. In fact, since the Earth’s rotation axis is tilted by about 23.45° with respect to the plane of the Earth orbit about the Sun, at definite latitude the height of the Sun on the horizon varies daily. The Sun is positioned at 90° angle of incidence with respect to the Earth surface (Zenith) at the equator in the two days of the equinox and along the tropics at the solstices (Figure 2.7).
Figure 2.7
Figure 2.8
Outside the Tropics latitude, the Sun cannot reach the Zenith above the Earth’s surface, but it shall be at its highest point (depending on the latitude) with reference to the summer solstice day in the northern hemisphere and in the winter solstice day in the southern hemisphere. Therefore, if we wish to incline the panels so that they can be struck perpendicularly by the solar rays at noon of the longest day of the year it is necessary to know the maximum height (in degrees) which the Sun reaches above the horizon in that instant, obtained by the follow-ing formula:
where:lat is the value (in degrees) of latitude of the installation
site of the panels;d is the angle of solar declination [23.45°]
Finding the complementary angle of α (90°-α), it is pos-sible to obtain the tilt angle β, of the panels with respect to the horizontal plane (IEC/TS 61836) so that the panels are struck perpendicularly by the solar rays in the above mentioned moment2. However, it is not sufficient to know the angle α to deter-mine the optimum orientation of the panels. It is neces-sary to take into consideration also the Sun path through the sky over the different periods of the year and therefore the tilt angle should be calculated taking into considera-tion all the days of the year3 (Figure 2.8). This allows to obtain an annual total radiation captured by the panels (and therefore the annual energy production) higher than that obtained under the previous irradiance condition perpendicular to the panels during the solstice.
The fixed panels should be oriented as much as possible to south in the northern hemisphere4 so as to get a better insolation of the panel surface at noon local hour and a better global daily insolation of the panels. The orientation of the panels may be indicated with the Azimuth5 angle (γ) of deviation with respect to the opti-mum direction to south (for the locations in the northern hemisphere) or to north (for the locations in the southern hemisphere).
2 On gabled roofs the tilt angle is determined by the inclination of the roof itself.3 In Italy the optimum tilted angle is about 30°.4 Since the solar irradiance is maximum at noon, the collector surface must be oriented to south as much as possible. On the contrary, in the southern hemisphere, the optimum orientation is obviously to north.5 In astronomy the Azimuth angle is defined as the angular distance along the horizon, measured from north (0°) to east, of the point of intersection of the vertical circle passing through the object.
N
S
+23, 45°
0°-23, 45°
Summer solstice at theTropic of Cancer21st or 22nd June
Vernal equinox20th or 21st MarchAutumnal equinox22nd or 23rd September
Winter solstice at theTropic of Capricorn22nd or 23rd December
α = 90° - lat + d [2.12]
WEST
EAST
6
7
8
9
10
1112
1211
10
9
8
7
68
9
1011 12
21 December
21 March
21June
Sol
ar h
eigh
t
0ϒ
solar path at 45ϒ'a1 North latitude
23Photovoltaic plants
2 Energ
y pro
ductio
n
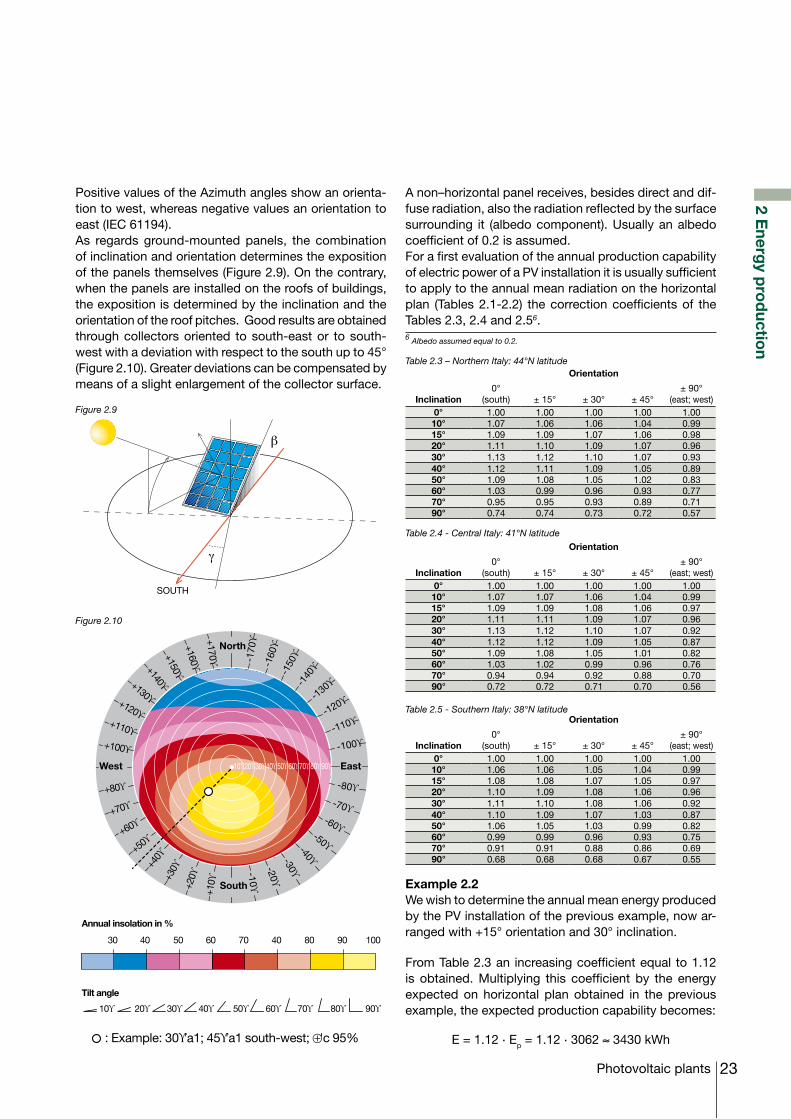
Positive values of the Azimuth angles show an orienta-tion to west, whereas negative values an orientation to east (IEC 61194). As regards ground-mounted panels, the combination of inclination and orientation determines the exposition of the panels themselves (Figure 2.9). On the contrary, when the panels are installed on the roofs of buildings, the exposition is determined by the inclination and the orientation of the roof pitches. Good results are obtained through collectors oriented to south-east or to south-west with a deviation with respect to the south up to 45° (Figure 2.10). Greater deviations can be compensated by means of a slight enlargement of the collector surface.
Figure 2.9
Table 2.3 – Northern Italy: 44°N latitude
Table 2.4 - Central Italy: 41°N latitude
Table 2.5 - Southern Italy: 38°N latitude
Figure 2.10
A non–horizontal panel receives, besides direct and dif-fuse radiation, also the radiation reflected by the surface surrounding it (albedo component). Usually an albedo coefficient of 0.2 is assumed.For a first evaluation of the annual production capability of electric power of a PV installation it is usually sufficient to apply to the annual mean radiation on the horizontal plan (Tables 2.1-2.2) the correction coefficients of the Tables 2.3, 2.4 and 2.56.6 Albedo assumed equal to 0.2.
Inclination
Orientation
0°(south) ± 15° ± 30° ± 45°
± 90°(east; west)
0° 1.00 1.00 1.00 1.00 1.0010° 1.07 1.06 1.06 1.04 0.9915° 1.09 1.09 1.07 1.06 0.9820° 1.11 1.10 1.09 1.07 0.9630° 1.13 1.12 1.10 1.07 0.9340° 1.12 1.11 1.09 1.05 0.8950° 1.09 1.08 1.05 1.02 0.8360° 1.03 0.99 0.96 0.93 0.7770° 0.95 0.95 0.93 0.89 0.7190° 0.74 0.74 0.73 0.72 0.57
Inclination
Orientation
0°(south) ± 15° ± 30° ± 45°
± 90°(east; west)
0° 1.00 1.00 1.00 1.00 1.0010° 1.07 1.07 1.06 1.04 0.9915° 1.09 1.09 1.08 1.06 0.9720° 1.11 1.11 1.09 1.07 0.9630° 1.13 1.12 1.10 1.07 0.9240° 1.12 1.12 1.09 1.05 0.8750° 1.09 1.08 1.05 1.01 0.8260° 1.03 1.02 0.99 0.96 0.7670° 0.94 0.94 0.92 0.88 0.7090° 0.72 0.72 0.71 0.70 0.56
Inclination
Orientation
0°(south) ± 15° ± 30° ± 45°
± 90°(east; west)
0° 1.00 1.00 1.00 1.00 1.0010° 1.06 1.06 1.05 1.04 0.9915° 1.08 1.08 1.07 1.05 0.9720° 1.10 1.09 1.08 1.06 0.9630° 1.11 1.10 1.08 1.06 0.9240° 1.10 1.09 1.07 1.03 0.8750° 1.06 1.05 1.03 0.99 0.8260° 0.99 0.99 0.96 0.93 0.7570° 0.91 0.91 0.88 0.86 0.6990° 0.68 0.68 0.68 0.67 0.55
Example 2.2We wish to determine the annual mean energy produced by the PV installation of the previous example, now ar-ranged with +15° orientation and 30° inclination.
From Table 2.3 an increasing coefficient equal to 1.12 is obtained. Multiplying this coefficient by the energy expected on horizontal plan obtained in the previous example, the expected production capability becomes:
E = 1.12 . Ep = 1.12 . 3062 ≈ 3430 kWh
SOUTH
β
γ
West
-100ϒ
-110ϒ-120ϒ-1
30ϒ-140
ϒ-150
ϒ
-160
ϒ
-170
ϒ
-10ϒ
-20ϒ-30ϒ
-40ϒ
-50ϒ
-60ϒ
-70ϒ
-80ϒ
+170ϒ
+160ϒ
+150ϒ+140ϒ+130ϒ+120ϒ+110ϒ
+100ϒ
+80ϒ
+70ϒ
+60ϒ
+50ϒ
+40ϒ
+30ϒ
+20ϒ
+10ϒ
East
North
South
10ϒ20ϒ30ϒ40ϒ50ϒ60ϒ70ϒ80ϒ90ϒ
30 40 50 60 70 40 80 90 100
Annual insolation in %
Tilt angle
10ϒ 20ϒ 30ϒ 40ϒ 50ϒ 60ϒ 70ϒ 80ϒ 90ϒ
: Example: 30ϒ'a1; 45ϒ'a1 south-west; ⊕'c 95%
24
Technical Application Papers
Photovoltaic plants
2 Energ
y pro
ductio
n
2.7 Voltages and currents in a PV plant
PV modules generate a current from 4 to 10A at a volt-age from 30 to 40V. To get the projected peak power, the panels are electri-cally connected in series to form the strings, which are connected in parallel. The trend is developing strings constituted by as many panels as possible, given the complexity and cost of wiring, in particular of the paral-leling switchboards between the strings. The maximum number of panels which can be connected in series (and therefore the highest reachable voltage) to form a string is determined by the operation range of the inverter (see Chapter 3) and by the availability of the disconnection and protection devices suitable for the voltage reached. In particular, the voltage of the inverter is bound, due to reasons of efficiency, to its power: generally, when using inverter with power lower than 10 kW, the voltage range most commonly used is from 250V to 750V, whereas if the power of the inverter exceeds 10 kW, the voltage range usually is from 500V to 900V.
2.8 Variation in the produced energy
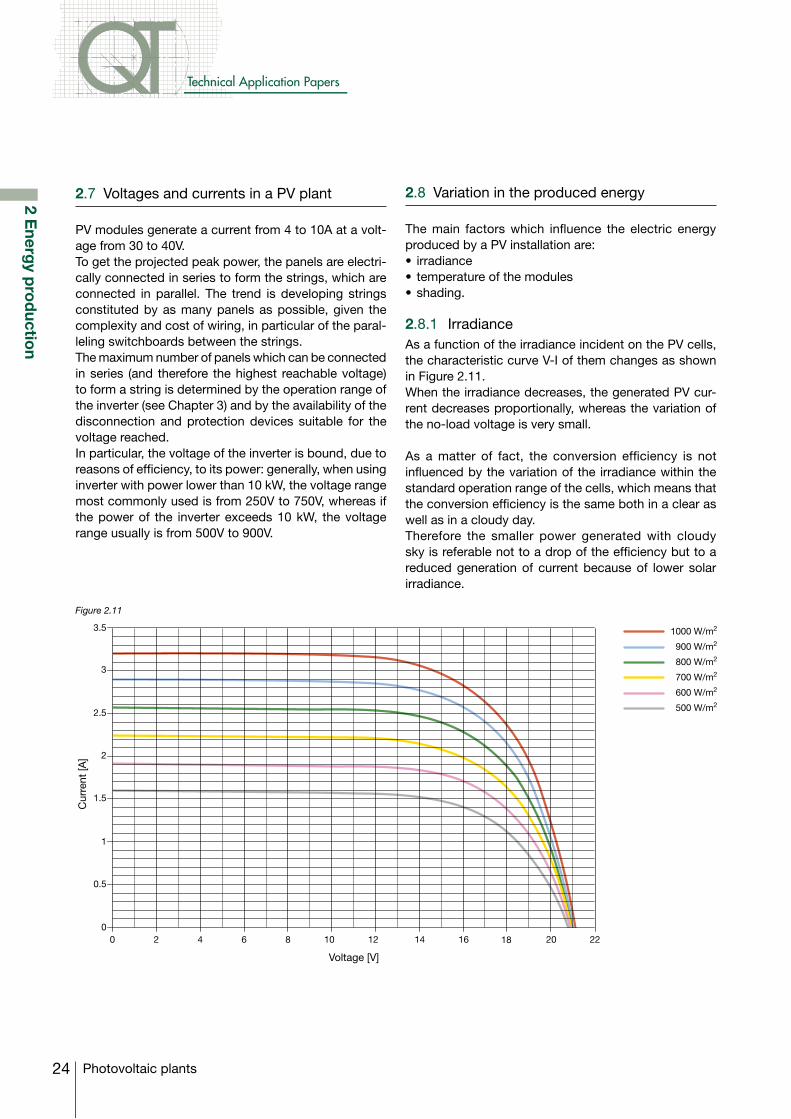
The main factors which influence the electric energy produced by a PV installation are:• irradiance• temperatureofthemodules•shading.
2.8.1 IrradianceAs a function of the irradiance incident on the PV cells, the characteristic curve V-I of them changes as shown in Figure 2.11. When the irradiance decreases, the generated PV cur-rent decreases proportionally, whereas the variation of the no-load voltage is very small.
As a matter of fact, the conversion efficiency is not influenced by the variation of the irradiance within the standard operation range of the cells, which means that the conversion efficiency is the same both in a clear as well as in a cloudy day. Therefore the smaller power generated with cloudy sky is referable not to a drop of the efficiency but to a reduced generation of current because of lower solar irradiance.
Figure 2.11
Cur
rent
[A]
3.5
3
2.5
2
1.5
1
0.5
0
Voltage [V]
0 2 4 6 8 10 12 14 16 18 20 22
1000 W/m2
900 W/m2
800 W/m2
700 W/m2
600 W/m2
500 W/m2
25Photovoltaic plants
2 Energ
y pro
ductio
n
Figure 2.12
Figure 2.13
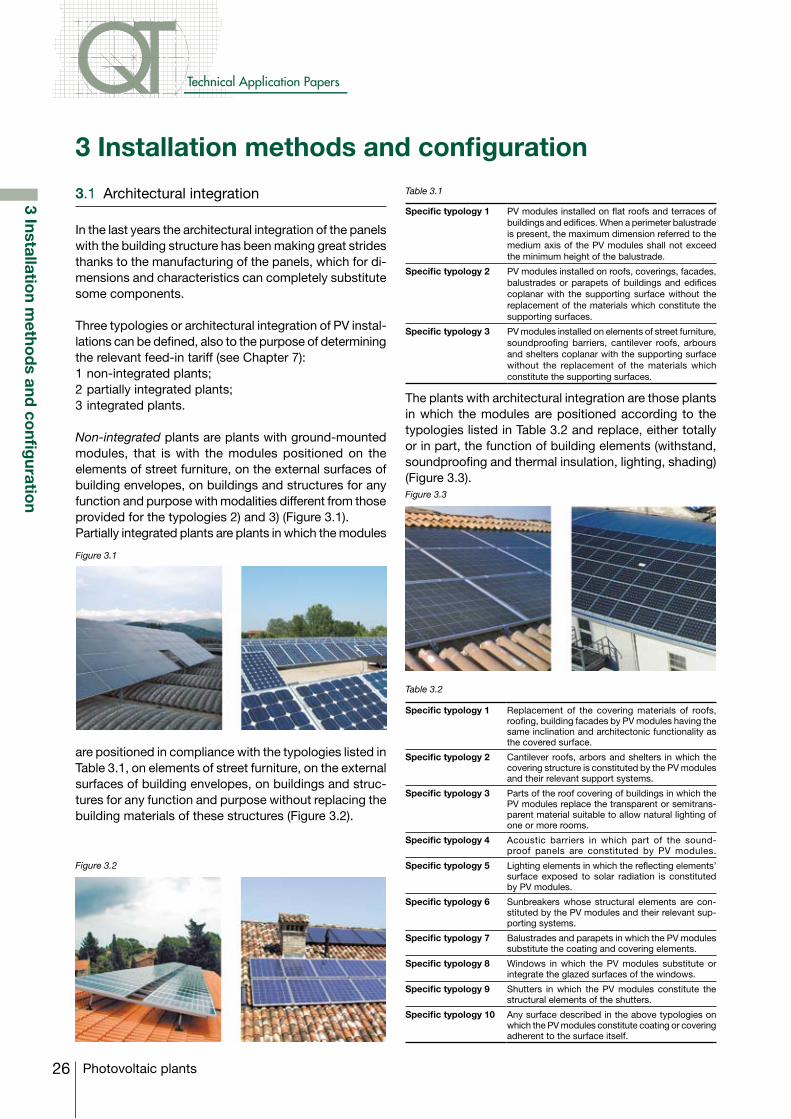
2.8.3 ShadingTaking into consideration the area occupied by the mod-ules of a PV plant, part of them (one or more cells) may be shaded by trees, fallen leaves, chimneys, clouds or by PV panels installed nearby.In case of shading, a PV cell consisting in a junction P-N stops producing energy and becomes a passive load. This cell behaves as a diode which blocks the current produced by the other cells connected in series thus jeopardizing the whole production of the module. Moreover the diode is subject to the voltage of the other cells which may cause the perforation of the junction due to localized overheating (hot spot) and damages to the module.In order to avoid that one or more shaded cells thwart the production of a whole string, some diodes which by-pass the shaded or damaged part of module are inserted at the module level. Thus the functioning of the module is guaranteed even if with reduced efficiency. In theory it would be necessary to insert a by-pass diode in parallel to each single cell, but this would be too onerous for the ratio costs/benefits. Therefore 2÷4 by-pass diodes are usually installed for each module (Figure 2.13).
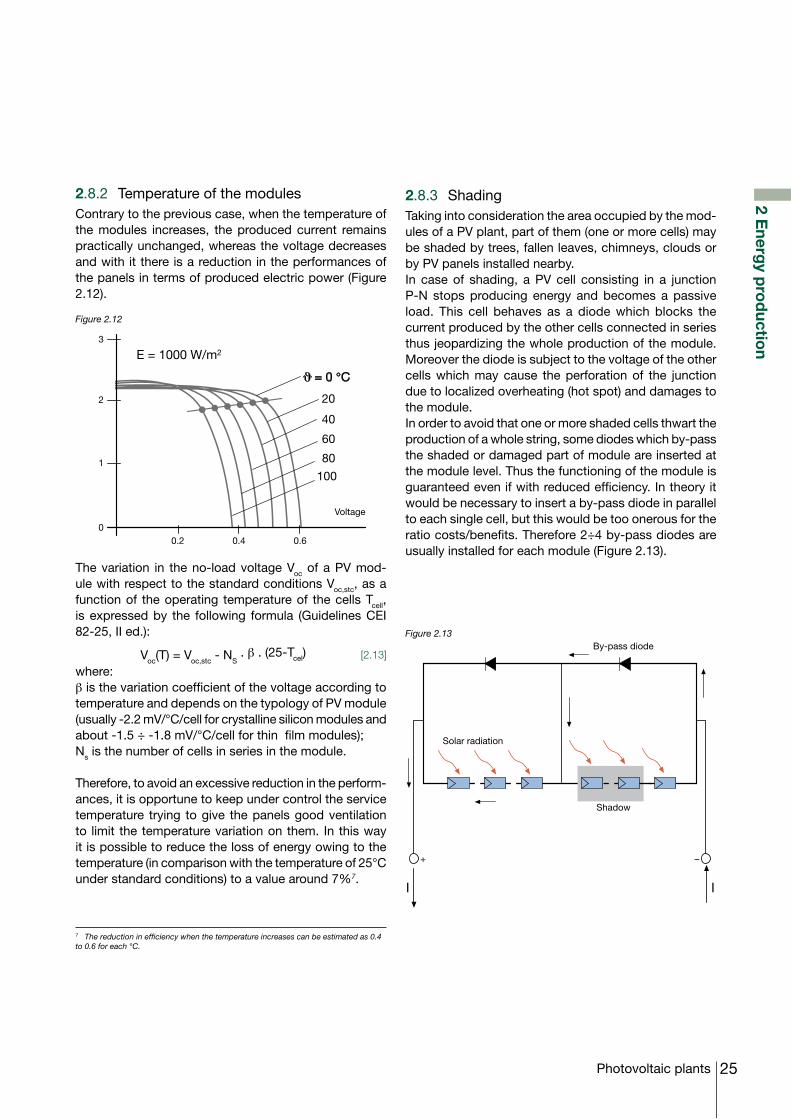
The variation in the no-load voltage Voc of a PV mod-ule with respect to the standard conditions Voc,stc, as a function of the operating temperature of the cells Tcell, is expressed by the following formula (Guidelines CEI 82-25, II ed.):
where:β is the variation coefficient of the voltage according to temperature and depends on the typology of PV module (usually -2.2 mV/°C/cell for crystalline silicon modules and about -1.5 ÷ -1.8 mV/°C/cell for thin film modules);Ns is the number of cells in series in the module.
Therefore, to avoid an excessive reduction in the perform-ances, it is opportune to keep under control the service temperature trying to give the panels good ventilation to limit the temperature variation on them. In this way it is possible to reduce the loss of energy owing to the temperature (in comparison with the temperature of 25°C under standard conditions) to a value around 7%7.
7 The reduction in efficiency when the temperature increases can be estimated as 0.4 to 0.6 for each °C.
2.8.2 Temperature of the modulesContrary to the previous case, when the temperature of the modules increases, the produced current remains practically unchanged, whereas the voltage decreases and with it there is a reduction in the performances of the panels in terms of produced electric power (Figure 2.12).
Voc(T) = Voc,stc - NS . β . (25-Tcel) [2.13]
3
2
1
0
20
40
60
80
100
Voltage
E = 1000 W/m2
0.2 0.4 0.6
–+
I I
Shadow
Solar radiation
By-pass diode
26
Technical Application Papers
Photovoltaic plants
3 Installation m
ethod
s and co
nfig
uration
3 Installation methods and configuration
3.1 Architectural integration
In the last years the architectural integration of the panels with the building structure has been making great strides thanks to the manufacturing of the panels, which for di-mensions and characteristics can completely substitute some components.
Three typologies or architectural integration of PV instal-lations can be defined, also to the purpose of determining the relevant feed-in tariff (see Chapter 7):1 non-integrated plants;2 partially integrated plants; 3 integrated plants.
Non-integrated plants are plants with ground-mounted modules, that is with the modules positioned on the elements of street furniture, on the external surfaces of building envelopes, on buildings and structures for any function and purpose with modalities different from those provided for the typologies 2) and 3) (Figure 3.1).Partially integrated plants are plants in which the modules
Figure 3.1
Figure 3.3
Figure 3.2
Table 3.1
Table 3.2
are positioned in compliance with the typologies listed in Table 3.1, on elements of street furniture, on the external surfaces of building envelopes, on buildings and struc-tures for any function and purpose without replacing the building materials of these structures (Figure 3.2).
Specific typology 1 PV modules installed on flat roofs and terraces of buildings and edifices. When a perimeter balustrade is present, the maximum dimension referred to the medium axis of the PV modules shall not exceed the minimum height of the balustrade.
Specific typology 2 PV modules installed on roofs, coverings, facades, balustrades or parapets of buildings and edifices coplanar with the supporting surface without the replacement of the materials which constitute the supporting surfaces.
Specific typology 3 PV modules installed on elements of street furniture, soundproofing barriers, cantilever roofs, arbours and shelters coplanar with the supporting surface without the replacement of the materials which constitute the supporting surfaces.
The plants with architectural integration are those plants in which the modules are positioned according to the typologies listed in Table 3.2 and replace, either totally or in part, the function of building elements (withstand, soundproofing and thermal insulation, lighting, shading) (Figure 3.3).
Specific typology 1 Replacement of the covering materials of roofs, roofing, building facades by PV modules having the same inclination and architectonic functionality as the covered surface.
Specific typology 2 Cantilever roofs, arbors and shelters in which the covering structure is constituted by the PV modules and their relevant support systems.
Specific typology 3 Parts of the roof covering of buildings in which the PV modules replace the transparent or semitrans-parent material suitable to allow natural lighting of one or more rooms.
Specific typology 4 Acoustic barriers in which part of the sound-proof panels are constituted by PV modules.
Specific typology 5 Lighting elements in which the reflecting elements’ surface exposed to solar radiation is constituted by PV modules.
Specific typology 6 Sunbreakers whose structural elements are con-stituted by the PV modules and their relevant sup-porting systems.
Specific typology 7 Balustrades and parapets in which the PV modules substitute the coating and covering elements.
Specific typology 8 Windows in which the PV modules substitute or integrate the glazed surfaces of the windows.
Specific typology 9 Shutters in which the PV modules constitute the structural elements of the shutters.
Specific typology 10 Any surface described in the above typologies on which the PV modules constitute coating or covering adherent to the surface itself.
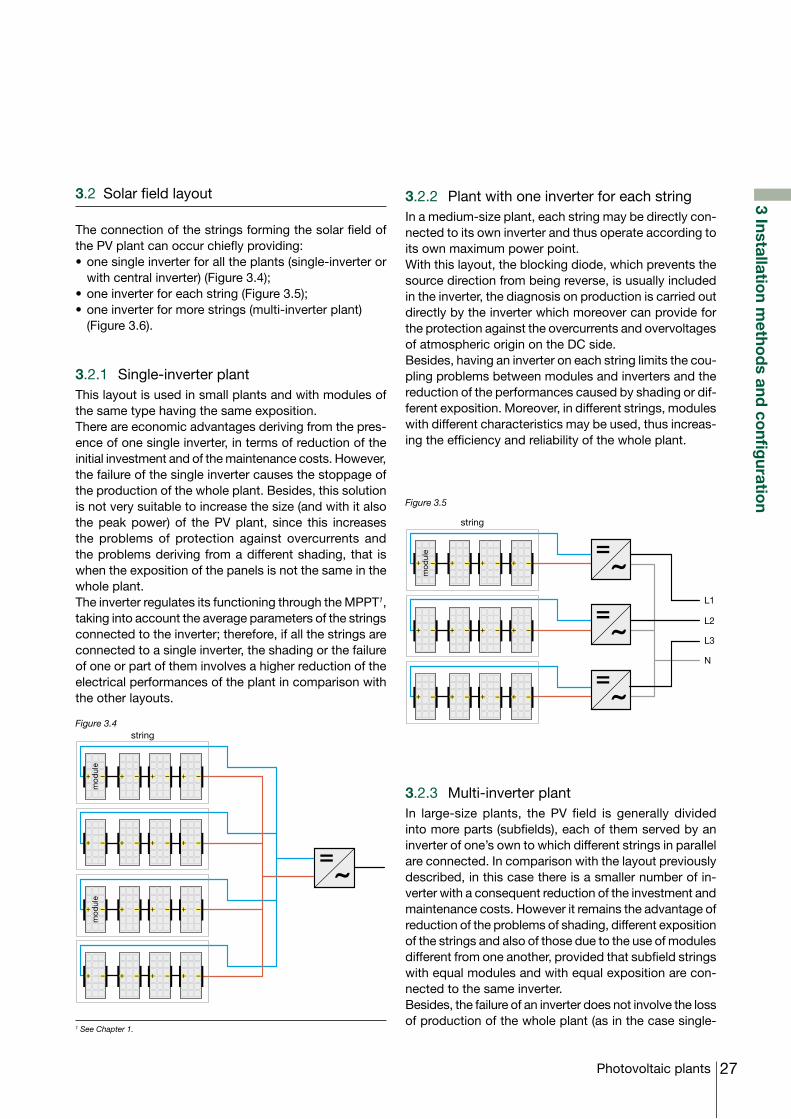
27Photovoltaic plants
3 Installation m
ethod
s and co
nfig
uration
Figure 3.4
Figure 3.5
3.2 Solar field layout
The connection of the strings forming the solar field of the PV plant can occur chiefly providing:•onesingleinverterforalltheplants(single-inverteror
with central inverter) (Figure 3.4);•oneinverterforeachstring(Figure3.5);•oneinverterformorestrings(multi-inverterplant) (Figure 3.6).
3.2.1 Single-inverter plant This layout is used in small plants and with modules of the same type having the same exposition. There are economic advantages deriving from the pres-ence of one single inverter, in terms of reduction of the initial investment and of the maintenance costs. However, the failure of the single inverter causes the stoppage of the production of the whole plant. Besides, this solution is not very suitable to increase the size (and with it also the peak power) of the PV plant, since this increases the problems of protection against overcurrents and the problems deriving from a different shading, that is when the exposition of the panels is not the same in the whole plant.The inverter regulates its functioning through the MPPT1, taking into account the average parameters of the strings connected to the inverter; therefore, if all the strings are connected to a single inverter, the shading or the failure of one or part of them involves a higher reduction of the electrical performances of the plant in comparison with the other layouts.
1 See Chapter 1.
3.2.2 Plant with one inverter for each stringIn a medium-size plant, each string may be directly con-nected to its own inverter and thus operate according to its own maximum power point. With this layout, the blocking diode, which prevents the source direction from being reverse, is usually included in the inverter, the diagnosis on production is carried out directly by the inverter which moreover can provide for the protection against the overcurrents and overvoltages of atmospheric origin on the DC side.Besides, having an inverter on each string limits the cou-pling problems between modules and inverters and the reduction of the performances caused by shading or dif-ferent exposition. Moreover, in different strings, modules with different characteristics may be used, thus increas-ing the efficiency and reliability of the whole plant.
3.2.3 Multi-inverter plantIn large-size plants, the PV field is generally divided into more parts (subfields), each of them served by an inverter of one’s own to which different strings in parallel are connected. In comparison with the layout previously described, in this case there is a smaller number of in-verter with a consequent reduction of the investment and maintenance costs. However it remains the advantage of reduction of the problems of shading, different exposition of the strings and also of those due to the use of modules different from one another, provided that subfield strings with equal modules and with equal exposition are con-nected to the same inverter.Besides, the failure of an inverter does not involve the loss of production of the whole plant (as in the case single-
mod
ule
string
mod
ule
string
L1
L2
L3
N
mod
ule
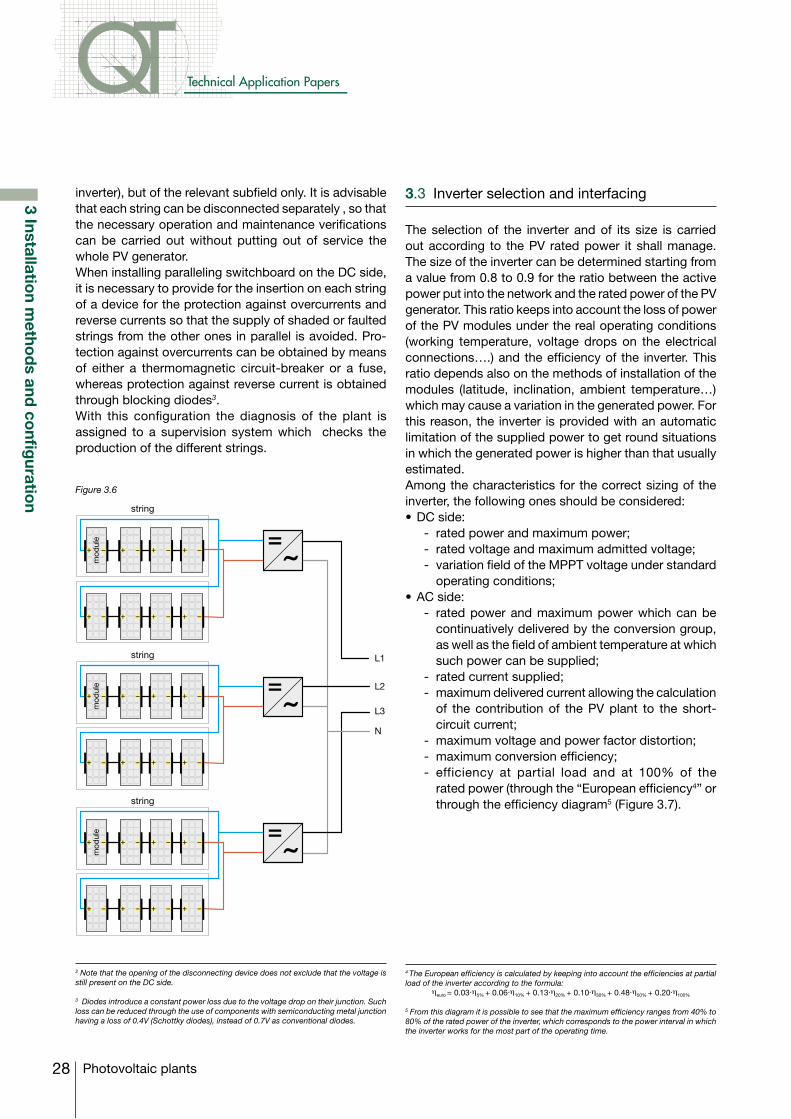
28
Technical Application Papers
Photovoltaic plants
inverter), but of the relevant subfield only. It is advisable that each string can be disconnected separately , so that the necessary operation and maintenance verifications can be carried out without putting out of service the whole PV generator.When installing paralleling switchboard on the DC side, it is necessary to provide for the insertion on each string of a device for the protection against overcurrents and reverse currents so that the supply of shaded or faulted strings from the other ones in parallel is avoided. Pro-tection against overcurrents can be obtained by means of either a thermomagnetic circuit-breaker or a fuse, whereas protection against reverse current is obtained through blocking diodes3.With this configuration the diagnosis of the plant is assigned to a supervision system which checks the production of the different strings.
Figure 3.6
2 Note that the opening of the disconnecting device does not exclude that the voltage is still present on the DC side.
3 Diodes introduce a constant power loss due to the voltage drop on their junction. Such loss can be reduced through the use of components with semiconducting metal junction having a loss of 0.4V (Schottky diodes), instead of 0.7V as conventional diodes.
3.3 Inverter selection and interfacing
The selection of the inverter and of its size is carried out according to the PV rated power it shall manage. The size of the inverter can be determined starting from a value from 0.8 to 0.9 for the ratio between the active power put into the network and the rated power of the PV generator. This ratio keeps into account the loss of power of the PV modules under the real operating conditions (working temperature, voltage drops on the electrical connections….) and the efficiency of the inverter. This ratio depends also on the methods of installation of the modules (latitude, inclination, ambient temperature…) which may cause a variation in the generated power. For this reason, the inverter is provided with an automatic limitation of the supplied power to get round situations in which the generated power is higher than that usually estimated.Among the characteristics for the correct sizing of the inverter, the following ones should be considered:•DCside: - rated power and maximum power; - rated voltage and maximum admitted voltage; - variation field of the MPPT voltage under standard
operating conditions;•ACside: - rated power and maximum power which can be
continuatively delivered by the conversion group, as well as the field of ambient temperature at which such power can be supplied;
- rated current supplied; - maximum delivered current allowing the calculation
of the contribution of the PV plant to the short-circuit current;
- maximum voltage and power factor distortion; - maximum conversion efficiency; - efficiency at partial load and at 100% of the
rated power (through the “European efficiency4” or through the efficiency diagram5 (Figure 3.7).
4 The European efficiency is calculated by keeping into account the efficiencies at partial load of the inverter according to the formula:
ηeuro = 0.03.η5% + 0.06.η10% + 0.13.η20% + 0.10.η30% + 0.48.η50% + 0.20.η100%
5 From this diagram it is possible to see that the maximum efficiency ranges from 40% to 80% of the rated power of the inverter, which corresponds to the power interval in which the inverter works for the most part of the operating time.
3 Installation m
ethod
s and co
nfig
uration
string
string
string
L1
L2
L3
N
mod
ule
mod
ule
mod
ule
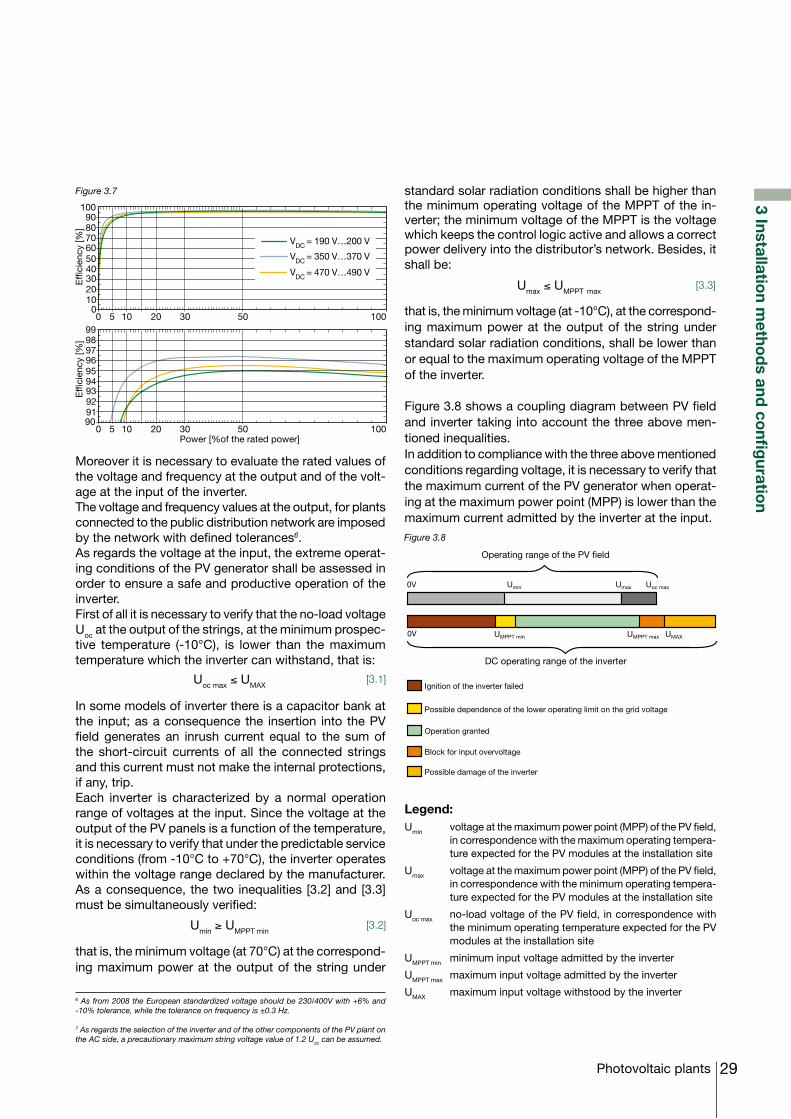
29Photovoltaic plants
Figure 3.8
Figure 3.7
Moreover it is necessary to evaluate the rated values of the voltage and frequency at the output and of the volt-age at the input of the inverter. The voltage and frequency values at the output, for plants connected to the public distribution network are imposed by the network with defined tolerances6. As regards the voltage at the input, the extreme operat-ing conditions of the PV generator shall be assessed in order to ensure a safe and productive operation of the inverter.First of all it is necessary to verify that the no-load voltage Uoc at the output of the strings, at the minimum prospec-tive temperature (-10°C), is lower than the maximum temperature which the inverter can withstand, that is:
Uoc max ≤ UMAX[3.1]
In some models of inverter there is a capacitor bank at the input; as a consequence the insertion into the PV field generates an inrush current equal to the sum of the short-circuit currents of all the connected strings and this current must not make the internal protections, if any, trip. Each inverter is characterized by a normal operation range of voltages at the input. Since the voltage at the output of the PV panels is a function of the temperature, it is necessary to verify that under the predictable service conditions (from -10°C to +70°C), the inverter operates within the voltage range declared by the manufacturer. As a consequence, the two inequalities [3.2] and [3.3] must be simultaneously verified:
Umin ≥ UMPPT min[3.2]
that is, the minimum voltage (at 70°C) at the correspond-ing maximum power at the output of the string under
10090807060504030201000 5 10 20 30 50 100
Effi
cien
cy [%
]
99989796959493929190
0 5 10 20 30 50 100
Effi
cien
cy [%
]
Power [%of the rated power]
VDC = 190 V…200 V
VDC = 350 V…370 V
VDC = 470 V…490 V
6 As from 2008 the European standardized voltage should be 230/400V with +6% and -10% tolerance, while the tolerance on frequency is ±0.3 Hz.
7 As regards the selection of the inverter and of the other components of the PV plant on the AC side, a precautionary maximum string voltage value of 1.2 Uoc can be assumed.
standard solar radiation conditions shall be higher than the minimum operating voltage of the MPPT of the in-verter; the minimum voltage of the MPPT is the voltage which keeps the control logic active and allows a correct power delivery into the distributor’s network. Besides, it shall be:
Umax ≤ UMPPT max[3.3]
that is, the minimum voltage (at -10°C), at the correspond-ing maximum power at the output of the string under standard solar radiation conditions, shall be lower than or equal to the maximum operating voltage of the MPPT of the inverter.
Figure 3.8 shows a coupling diagram between PV field and inverter taking into account the three above men-tioned inequalities. In addition to compliance with the three above mentioned conditions regarding voltage, it is necessary to verify that the maximum current of the PV generator when operat-ing at the maximum power point (MPP) is lower than the maximum current admitted by the inverter at the input.
Operating range of the PV field
DC operating range of the inverter
0V Umin
0V
Ignition of the inverter failed
Possible dependence of the lower operating limit on the grid voltage
Operation granted
Block for input overvoltage
Possible damage of the inverter
Umax Uoc max
UMPPT min UMPPT max UMAX
Legend:Umin voltage at the maximum power point (MPP) of the PV field,
in correspondence with the maximum operating tempera-ture expected for the PV modules at the installation site
Umax voltage at the maximum power point (MPP) of the PV field, in correspondence with the minimum operating tempera-ture expected for the PV modules at the installation site
Uoc max no-load voltage of the PV field, in correspondence with the minimum operating temperature expected for the PV modules at the installation site
UMPPT min minimum input voltage admitted by the inverter
UMPPT max maximum input voltage admitted by the inverter
UMAX maximum input voltage withstood by the inverter
3 Installation m
ethod
s and co
nfig
uration
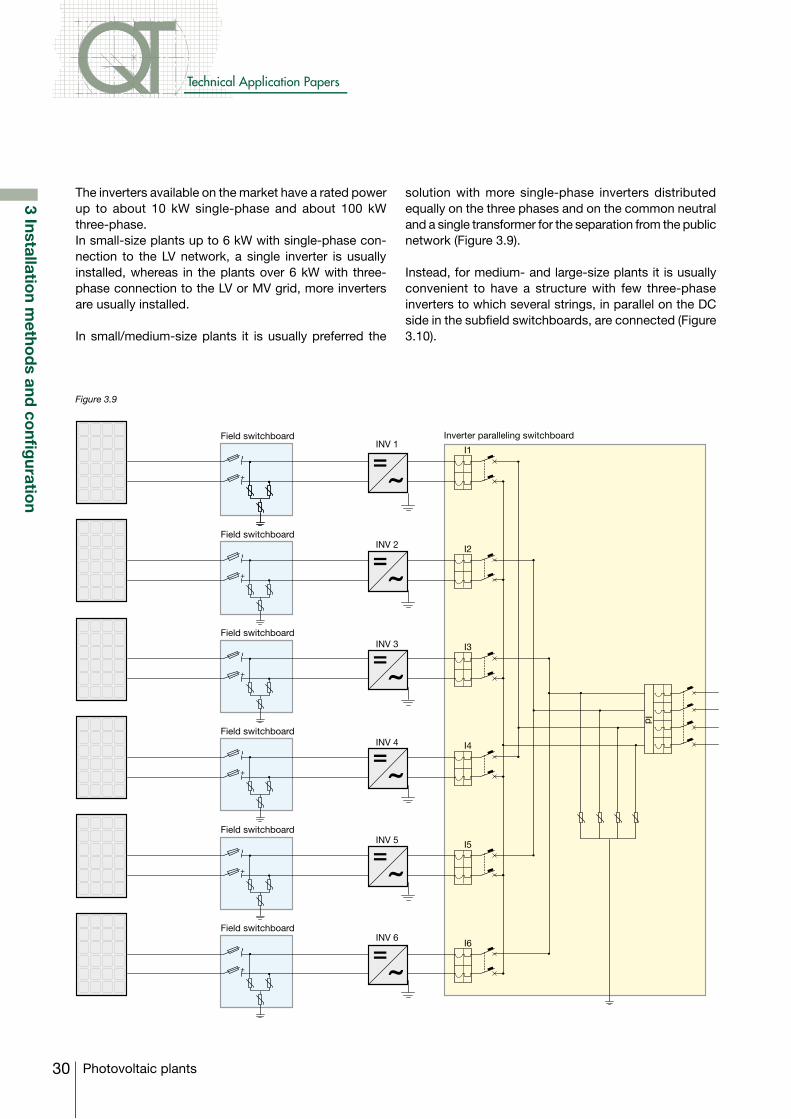
30
Technical Application Papers
Photovoltaic plants
3 Installation m
ethod
s and co
nfig
uration
The inverters available on the market have a rated power up to about 10 kW single-phase and about 100 kW three-phase.In small-size plants up to 6 kW with single-phase con-nection to the LV network, a single inverter is usually installed, whereas in the plants over 6 kW with three-phase connection to the LV or MV grid, more inverters are usually installed.
In small/medium-size plants it is usually preferred the
Figure 3.9
solution with more single-phase inverters distributed equally on the three phases and on the common neutral and a single transformer for the separation from the public network (Figure 3.9).
Instead, for medium- and large-size plants it is usually convenient to have a structure with few three-phase inverters to which several strings, in parallel on the DC side in the subfield switchboards, are connected (Figure 3.10).
INV 1
INV 2
INV 3
INV 4
INV 5
INV 6
I1
I2
I3
I4
I5
I6
Field switchboard
Field switchboard
Field switchboard
Field switchboard
Field switchboard
Field switchboard
Inverter paralleling switchboard
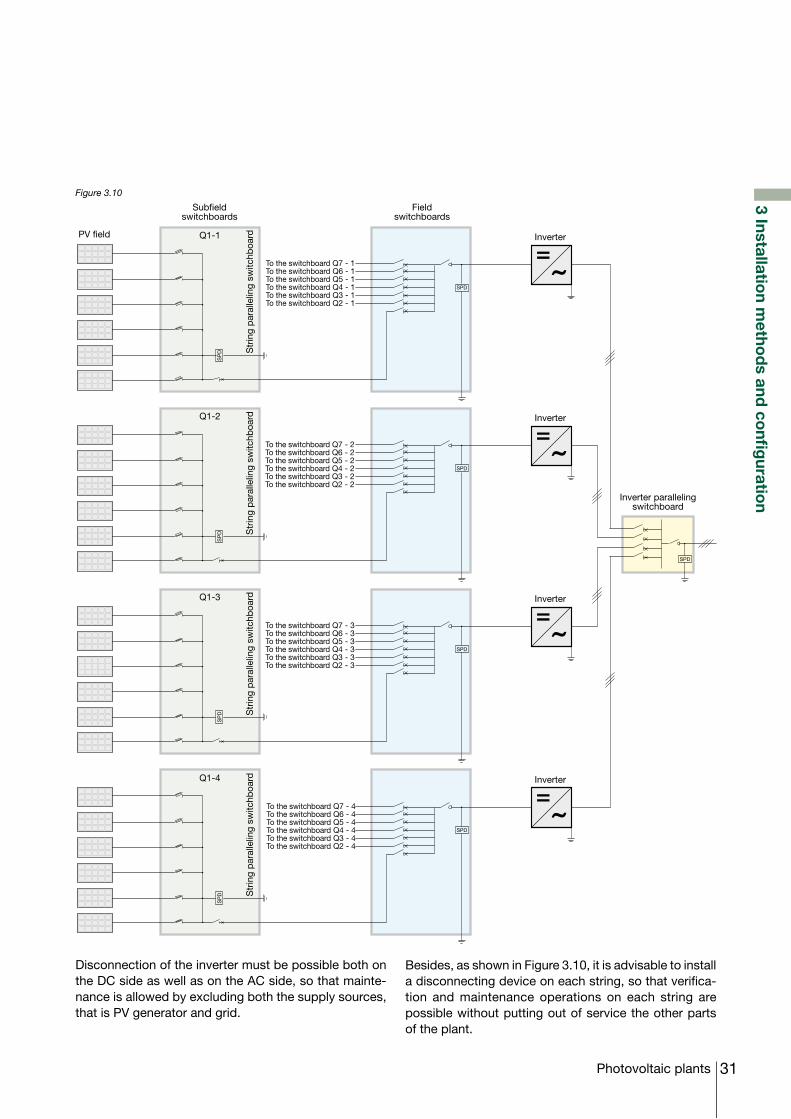
31Photovoltaic plants
3 Installation m
ethod
s and co
nfig
uration
Figure 3.10
Disconnection of the inverter must be possible both on the DC side as well as on the AC side, so that mainte-nance is allowed by excluding both the supply sources, that is PV generator and grid.
Besides, as shown in Figure 3.10, it is advisable to install a disconnecting device on each string, so that verifica-tion and maintenance operations on each string are possible without putting out of service the other parts of the plant.
PV field
Inverter parallelingswitchboard
Q1-1 Inverter
Q1-2 Inverter
Q1-3 Inverter
Q1-4 Inverter
To the switchboardQ2-1To the switchboardQ3-1To the switchboardQ4-1To the switchboardQ5-1To the switchboardQ6-1To the switchboard Q7-1
To the switchboardQ2-2To the switchboardQ3-2To the switchboardQ4-2To the switchboardQ5-2To the switchboardQ6-2To the switchboard Q7-2
To the switchboardQ2-3To the switchboardQ3-3To the switchboardQ4-3To the switchboardQ5-3To the switchboardQ6-3To the switchboardQ7-3
To the switchboardQ2-4To the switchboardQ3-4To the switchboardQ4-4To the switchboardQ5-4To the switchboardQ6-4To the switchboardQ7-4
Str
ing
par
alle
ling
switc
hboa
rdS
trin
g p
aral
lelin
g sw
itchb
oard
Str
ing
par
alle
ling
switc
hboa
rdS
trin
g p
aral
lelin
g sw
itchb
oard
Subfieldswitchboards
Fieldswitchboards
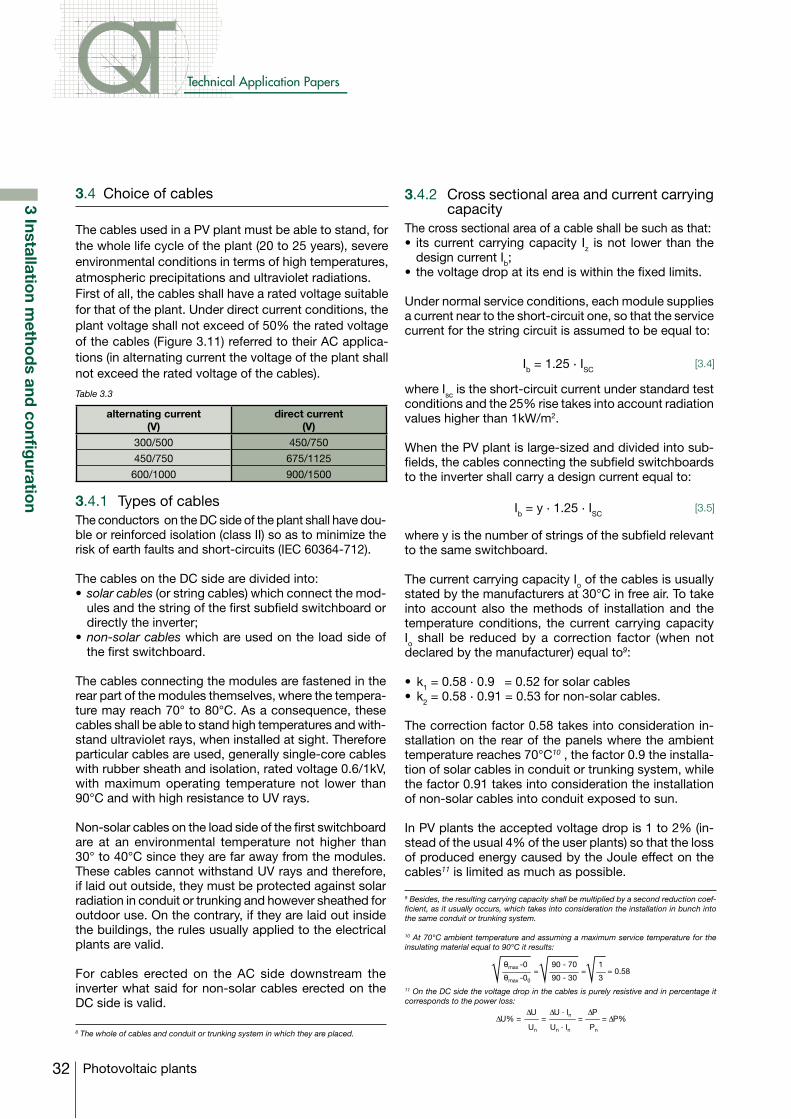
32
Technical Application Papers
Photovoltaic plants
3.4 Choice of cables
The cables used in a PV plant must be able to stand, for the whole life cycle of the plant (20 to 25 years), severe environmental conditions in terms of high temperatures, atmospheric precipitations and ultraviolet radiations.First of all, the cables shall have a rated voltage suitable for that of the plant. Under direct current conditions, the plant voltage shall not exceed of 50% the rated voltage of the cables (Figure 3.11) referred to their AC applica-tions (in alternating current the voltage of the plant shall not exceed the rated voltage of the cables).
Table 3.3
3 Installation m
ethod
s and co
nfig
uration
alternating current (V)
direct current (V)
300/500 450/750
450/750 675/1125
600/1000 900/1500
3.4.1 Types of cablesThe conductors on the DC side of the plant shall have dou-ble or reinforced isolation (class II) so as to minimize the risk of earth faults and short-circuits (IEC 60364-712).
The cables on the DC side are divided into:•solar cables (or string cables) which connect the mod-
ules and the string of the first subfield switchboard or directly the inverter;
•non-solar cables which are used on the load side of the first switchboard.
The cables connecting the modules are fastened in the rear part of the modules themselves, where the tempera-ture may reach 70° to 80°C. As a consequence, these cables shall be able to stand high temperatures and with-stand ultraviolet rays, when installed at sight. Therefore particular cables are used, generally single-core cables with rubber sheath and isolation, rated voltage 0.6/1kV, with maximum operating temperature not lower than 90°C and with high resistance to UV rays.
Non-solar cables on the load side of the first switchboard are at an environmental temperature not higher than 30° to 40°C since they are far away from the modules. These cables cannot withstand UV rays and therefore, if laid out outside, they must be protected against solar radiation in conduit or trunking and however sheathed for outdoor use. On the contrary, if they are laid out inside the buildings, the rules usually applied to the electrical plants are valid.
For cables erected on the AC side downstream the inverter what said for non-solar cables erected on the DC side is valid.
3.4.2 Cross sectional area and current carrying capacity
The cross sectional area of a cable shall be such as that:• itscurrentcarryingcapacity Iz is not lower than the
design current Ib;• thevoltagedropatitsendiswithinthefixedlimits.
Under normal service conditions, each module supplies a current near to the short-circuit one, so that the service current for the string circuit is assumed to be equal to:
Ib = 1.25 . ISC[3.4]
where Isc is the short-circuit current under standard test conditions and the 25% rise takes into account radiation values higher than 1kW/m2.
When the PV plant is large-sized and divided into sub-fields, the cables connecting the subfield switchboards to the inverter shall carry a design current equal to:
Ib = y . 1.25 . ISC[3.5]
where y is the number of strings of the subfield relevant to the same switchboard.
The current carrying capacity Io of the cables is usually stated by the manufacturers at 30°C in free air. To take into account also the methods of installation and the temperature conditions, the current carrying capacity Io shall be reduced by a correction factor (when not declared by the manufacturer) equal to9:
• k1 = 0.58 . 0.9 = 0.52 for solar cables• k2 = 0.58 . 0.91 = 0.53 for non-solar cables.
The correction factor 0.58 takes into consideration in-stallation on the rear of the panels where the ambient temperature reaches 70°C10 , the factor 0.9 the installa-tion of solar cables in conduit or trunking system, while the factor 0.91 takes into consideration the installation of non-solar cables into conduit exposed to sun.
In PV plants the accepted voltage drop is 1 to 2% (in-stead of the usual 4% of the user plants) so that the loss of produced energy caused by the Joule effect on the cables11 is limited as much as possible.
8 The whole of cables and conduit or trunking system in which they are placed.
9 Besides, the resulting carrying capacity shall be multiplied by a second reduction coef-ficient, as it usually occurs, which takes into consideration the installation in bunch into the same conduit or trunking system.
10 At 70°C ambient temperature and assuming a maximum service temperature for the insulating material equal to 90°C it results:
11 On the DC side the voltage drop in the cables is purely resistive and in percentage it corresponds to the power loss:
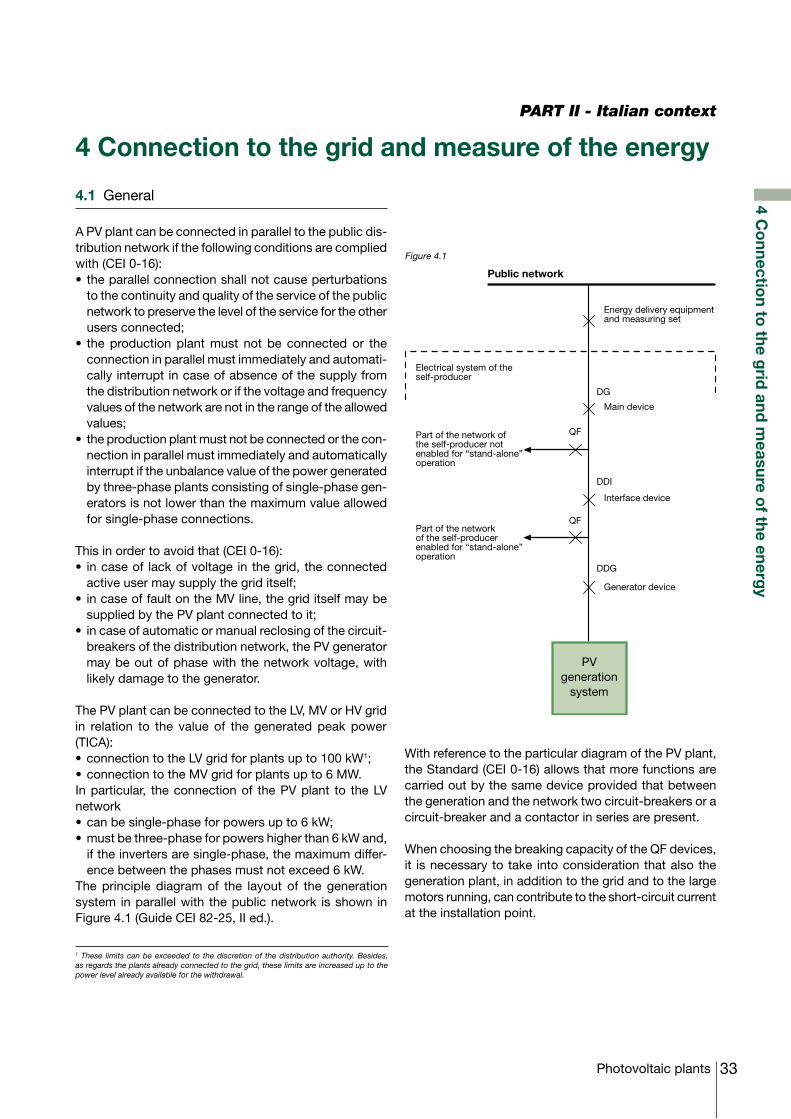
33Photovoltaic plants
4 Co
nnection to
the grid
and m
easure of the energ
y
4 Connection to the grid and measure of the energy
PART II - Italian context
4.1 General
A PV plant can be connected in parallel to the public dis-tribution network if the following conditions are complied with (CEI 0-16):• theparallelconnectionshallnotcauseperturbations
to the continuity and quality of the service of the public network to preserve the level of the service for the other users connected;
• theproductionplantmust not be connectedor theconnection in parallel must immediately and automati-cally interrupt in case of absence of the supply from the distribution network or if the voltage and frequency values of the network are not in the range of the allowed values;
• theproductionplantmustnotbeconnectedorthecon-nection in parallel must immediately and automatically interrupt if the unbalance value of the power generated by three-phase plants consisting of single-phase gen-erators is not lower than the maximum value allowed for single-phase connections.
This in order to avoid that (CEI 0-16):• incaseof lackofvoltage inthegrid,theconnected
active user may supply the grid itself;• incaseoffaultontheMVline,thegriditselfmaybe
supplied by the PV plant connected to it; • incaseofautomaticormanualreclosingofthecircuit-
breakers of the distribution network, the PV generator may be out of phase with the network voltage, with likely damage to the generator.
The PV plant can be connected to the LV, MV or HV grid in relation to the value of the generated peak power (TICA):•connectiontotheLVgridforplantsupto100kW1;•connectiontotheMVgridforplantsupto6MW.In particular, the connection of the PV plant to the LV network•canbesingle-phaseforpowersupto6kW;•mustbethree-phaseforpowershigherthan6kWand,
if the inverters are single-phase, the maximum differ-ence between the phases must not exceed 6 kW.
The principle diagram of the layout of the generation system in parallel with the public network is shown in Figure 4.1 (Guide CEI 82-25, II ed.).
1 These limits can be exceeded to the discretion of the distribution authority. Besides, as regards the plants already connected to the grid, these limits are increased up to the power level already available for the withdrawal.
With reference to the particular diagram of the PV plant, the Standard (CEI 0-16) allows that more functions are carried out by the same device provided that between the generation and the network two circuit-breakers or a circuit-breaker and a contactor in series are present.
WhenchoosingthebreakingcapacityoftheQFdevices,it is necessary to take into consideration that also the generation plant, in addition to the grid and to the large motors running, can contribute to the short-circuit current at the installation point.
Figure 4.1
Public network
PVgeneration
system
Energy delivery equipmentand measuring set
Electrical system of theself-producer
Part of the network ofthe self-producer notenabled for “stand-alone”operation
Part of the networkof the self-producerenabled for “stand-alone”operation
Main device
Interface device
Generator device
DG
QF
DDI
QF
DDG
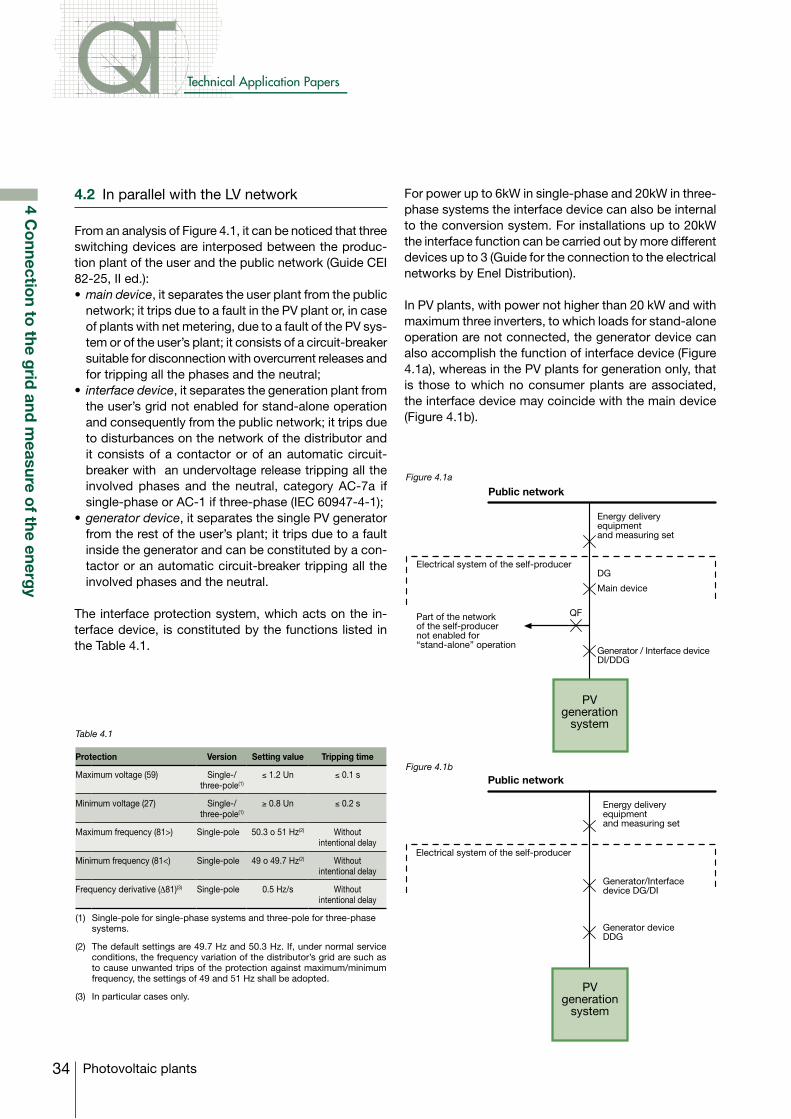
34
Technical Application Papers
Photovoltaic plants
4 Co
nnection to
the grid
and m
easure of the energ
y
4.2 In parallel with the LV network
From an analysis of Figure 4.1, it can be noticed that three switching devices are interposed between the produc-tion plant of the user and the public network (Guide CEI 82-25, II ed.):•main device, it separates the user plant from the public
network; it trips due to a fault in the PV plant or, in case of plants with net metering, due to a fault of the PV sys-tem or of the user’s plant; it consists of a circuit-breaker suitable for disconnection with overcurrent releases and for tripping all the phases and the neutral;
• interface device, it separates the generation plant from the user’s grid not enabled for stand-alone operation and consequently from the public network; it trips due to disturbances on the network of the distributor and it consists of a contactor or of an automatic circuit-breaker with an undervoltage release tripping all the involved phases and the neutral, category AC-7a if single-phase or AC-1 if three-phase (IEC 60947-4-1);
•generator device, it separates the single PV generator from the rest of the user’s plant; it trips due to a fault inside the generator and can be constituted by a con-tactor or an automatic circuit-breaker tripping all the involved phases and the neutral.
The interface protection system, which acts on the in-terface device, is constituted by the functions listed in the Table 4.1.
Protection Version Setting value Tripping time
Maximum voltage (59) Single-/three-pole(1)
≤ 1.2 Un ≤ 0.1 s
Minimum voltage (27) Single-/three-pole(1)
≥ 0.8 Un ≤ 0.2 s
Maximum frequency (81>) Single-pole 50.3 o 51 Hz(2) Without intentional delay
Minimum frequency (81<) Single-pole 49 o 49.7 Hz(2) Without intentional delay
Frequency derivative (∆81)(3) Single-pole 0.5 Hz/s Without intentional delay
(1) Single-pole for single-phase systems and three-pole for three-phase systems.
(2) The default settings are 49.7 Hz and 50.3 Hz. If, under normal service conditions, the frequency variation of the distributor’s grid are such as to cause unwanted trips of the protection against maximum/minimum frequency, the settings of 49 and 51 Hz shall be adopted.
(3) In particular cases only.
Table 4.1
For power up to 6kW in single-phase and 20kW in three-phase systems the interface device can also be internal to the conversion system. For installations up to 20kW the interface function can be carried out by more different devices up to 3 (Guide for the connection to the electrical networks by Enel Distribution).
In PV plants, with power not higher than 20 kW and with maximum three inverters, to which loads for stand-alone operation are not connected, the generator device can also accomplish the function of interface device (Figure 4.1a), whereas in the PV plants for generation only, that is those to which no consumer plants are associated, the interface device may coincide with the main device (Figure 4.1b).
Figure 4.1a
Figure 4.1b
Public network
PVgeneration
system
Energy deliveryequipmentand measuring set
Electrical system of the self-producer
Part of the networkof the self-producernot enabled for“stand-alone” operation
Main device
Generator / Interface deviceDI/DDG
DG
QF
Public network
PVgeneration
system
Energy deliveryequipmentand measuring set
Electrical system of the self-producer
Generator/Interfacedevice DG/DI
Generator deviceDDG
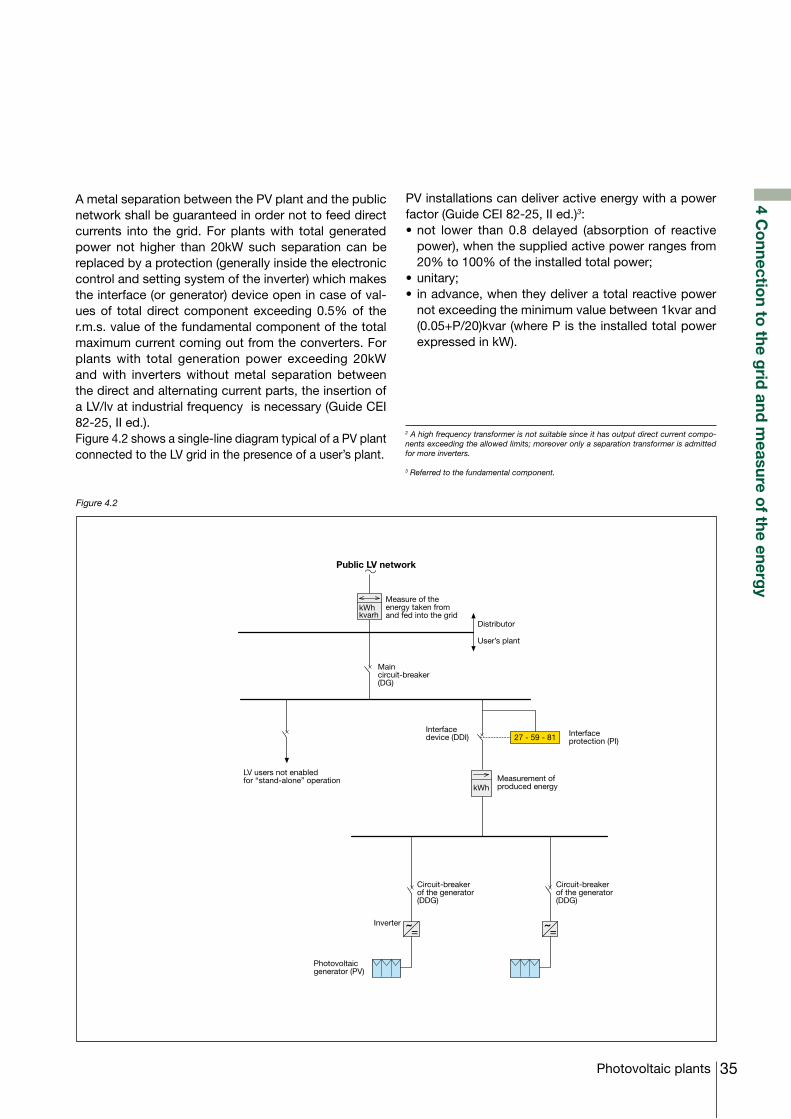
35Photovoltaic plants
4 Co
nnection to
the grid
and m
easure of the energ
y
Figure 4.2
A metal separation between the PV plant and the public network shall be guaranteed in order not to feed direct currents into the grid. For plants with total generated power not higher than 20kW such separation can be replaced by a protection (generally inside the electronic control and setting system of the inverter) which makes the interface (or generator) device open in case of val-ues of total direct component exceeding 0.5% of the r.m.s. value of the fundamental component of the total maximum current coming out from the converters. For plants with total generation power exceeding 20kW and with inverters without metal separation between the direct and alternating current parts, the insertion of a LV/lv at industrial frequency is necessary (Guide CEI 82-25, II ed.).Figure 4.2 shows a single-line diagram typical of a PV plant connected to the LV grid in the presence of a user’s plant.
PV installations can deliver active energy with a power factor (Guide CEI 82-25, II ed.)3:•not lower than 0.8 delayed (absorption of reactive
power), when the supplied active power ranges from 20% to 100% of the installed total power;
•unitary;• inadvance,whentheydeliveratotalreactivepower
not exceeding the minimum value between 1kvar and (0.05+P/20)kvar (where P is the installed total power expressed in kW).
2 A high frequency transformer is not suitable since it has output direct current compo-nents exceeding the allowed limits; moreover only a separation transformer is admitted for more inverters.
3 Referred to the fundamental component.
Circuit-breakerof the generator(DDG)
Circuit-breakerof the generator(DDG)
Inverter
Photovoltaicgenerator (PV)
kWh
27 - 59 - 81 Interfaceprotection (PI)
Measurement ofproduced energy
Interfacedevice (DDI)
LV users not enabledfor “stand-alone” operation
Public LV network
kWhkvarh
Measure of theenergy taken fromand fed into the grid
Maincircuit-breaker(DG)
Distributor
User’s plant
36
Technical Application Papers
Photovoltaic plants
4 Co
nnection to
the grid
and m
easure of the energ
y
4.3 In parallel with the MV network
The main device consists of (CEI 0 -16):•a three-pole circuit-breaker inwithdrawable version
with opening trip unit;•ora three-polecircuit-breakerwithopening tripunit
and three-pole switch- disconnector to be installed on the supply side of the circuit-breaker.
As regards the opening command of the main device due to the intervention of the main protection, an undervoltage coil must be used because if, for any reason, the supply voltage of the main protection lacks, the opening of the main device occurs also in case of absence of the com-mand coming from the main protection.The general protection includes (CEI 0-16):•anovercurrentreleasewiththreetripthresholds,one
with inverse time-delay I> (overload threshold 51), two with constant time I>> (threshold with intentional delay 51) and I>>> (instantaneous threshold 50);
•a zero-sequence overcurrent release 51Nwith twoconstant time trip thresholds Io> and Io>>, one for the single-phase earth faults and one for the double single-phase earth faults, or a directional zero-sequence overcurrent release with two thresholds 67N.1 and 67N.2 , one for the selection of internal faults in case of networks with compensated neutral and one in case of insulated neutral, in addition to the zero-sequence overcurrent release with one threshold for the double single-phase earth faults.
The interface device can be positioned both on the MV as well as on the LV side. If this device is installed on the MV part of the plant, it can consists of (CEI 0-16 Interpretation Sheet):•a three-pole circuit-breaker inwithdrawable version
with undervoltage opening release or •athree-polecircuit-breakerwithundervoltageopening
release and a switch-disconnector installed either on the supply or on the load side of the circuit-breaker5.
For plants with more PV generators, as a rule, the inter-face device shall be one and such as to exclude at the same time all the generators, but more interface devices
are allowed provided that the trip command of each protection acts on all the devices, so that an anomalous condition detected by a single protection disconnects all the generators from the network6.If single-phase inverters with power up to 10kW are used, the interface protection system can be integrated into the converter itself for total generated powers not higher than 30kW (CEI 0-16 Interpretation Sheet).Moreover, since the inverters used in PV plants work as current generators and not as voltage generators it is not necessary to integrate into the interface protection also the zero-sequence overvoltage protections (59N) and the additional protection against failed opening of the interface device (Guide CEI 82-25, II ed.). The interface protection system consists of the functions listed in the Table 4.2 (CEI 0-16 Interpretation Sheet).
Protection Setting valueFault extinction
timeIntentional
delay
Maximum voltage (59) ≤ 1.2 Un ≤ 170 ms 100 ms
Minimum voltage (27) ≥ 0.7 Un ≤ 370 ms 300 ms
Maximum frequency (81>) 50.3 Hz ≤ 170 ms 100 ms
Minimum frequency (81<) 49.7 Hz ≤ 170 ms 100 ms
Table 4.2
As regards the generator device, what pointed out for the parallel connection with the LV part is valid.
The Figures 4.3 and 4.4 show two typical diagrams for the connection of the MV network of a PV plant. In particular the diagram of Figure 4.3 shows a plant equipped with more single-phase inverters and in which the interface device is positioned on the LV. This configuration is typical of plants with power up to one hundred kW. Instead larger plants use three-phase inverters with one or more LV/MV transformers and the interface device is generally positioned on the MV (Figure 4.4).
4 Protection 67N is required when the contribution to the single-phase ground fault ca-pacitive current of the MV grid of the user exceeds the 80% of the setting current fixed by the distributor for the protection 51N. In practice, when the MV cables of the user exceed the length of:
•400mforgridswithUn=20kV•533mforgridswithUn=15kV.
5 The possible presence of two switch-disconnectors (one on the supply side and one on the load side) shall be considered by the user according to the need of safety during maintenance operations.
6 When a PV plant (with total power not higher than 1 MW) is added to plants connected to the grid since more than a year, it is possible to install no more than three interface devices and each of them can subtend maximum 400 kW (CEI 0-16 Interpretation Sheet).
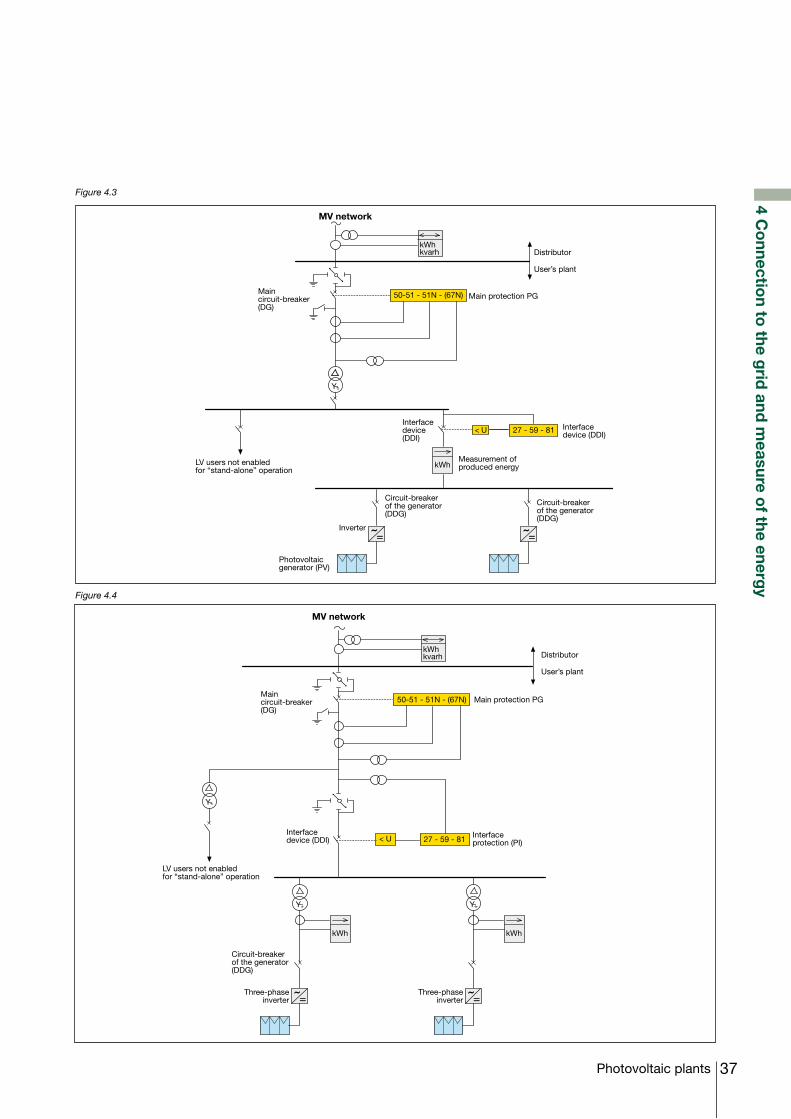
37Photovoltaic plants
4 Co
nnection to
the grid
and m
easure of the energ
y
Figure 4.3
Figure 4.4
MV network
Distributor
User’s plant
kWhkvarh
50-51 - 51N - (67N) Main protection PG
kWh
Interfacedevice(DDI)
27 - 59 - 81
Inverter
Circuit-breakerof the generator(DDG)
Circuit-breakerof the generator(DDG)
Photovoltaicgenerator (PV)
Measurement ofproduced energy
Interfacedevice (DDI)
LV users not enabledfor “stand-alone” operation
Maincircuit-breaker(DG)
< U
kWhkvarh
50-51 - 51N - (67N)
< U 27 - 59 - 81
kWh
Three-phaseinverter
Circuit-breakerof the generator(DDG)
kWh
MV network
Distributor
User’s plant
Main protection PG
Interfacedevice (DDI)
LV users not enabledfor “stand-alone” operation
Maincircuit-breaker(DG)
Three-phaseinverter
Interfaceprotection (PI)
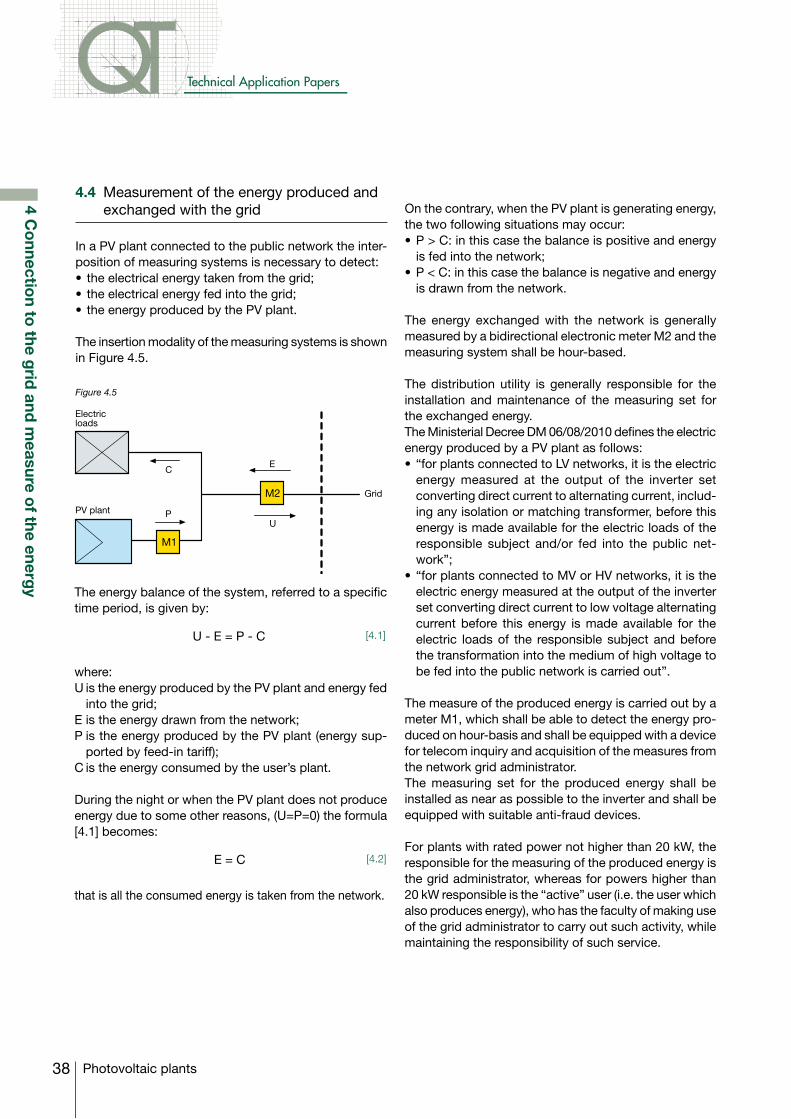
38
Technical Application Papers
Photovoltaic plants
4 Co
nnection to
the grid
and m
easure of the energ
y
4.4 Measurement of the energy produced and exchanged with the grid
In a PV plant connected to the public network the inter-position of measuring systems is necessary to detect:• theelectricalenergytakenfromthegrid;• theelectricalenergyfedintothegrid;• theenergyproducedbythePVplant.
The insertion modality of the measuring systems is shown in Figure 4.5.
Figure 4.5
The energy balance of the system, referred to a specific time period, is given by:
U - E = P - C [4.1]
where:U is the energy produced by the PV plant and energy fed
into the grid;E is the energy drawn from the network; P is the energy produced by the PV plant (energy sup-
ported by feed-in tariff);C is the energy consumed by the user’s plant.
During the night or when the PV plant does not produce energy due to some other reasons, (U=P=0) the formula [4.1] becomes:
E = C [4.2]
that is all the consumed energy is taken from the network.
On the contrary, when the PV plant is generating energy, the two following situations may occur:•P>C:inthiscasethebalanceispositiveandenergy
is fed into the network; •P<C:inthiscasethebalanceisnegativeandenergy
is drawn from the network.
The energy exchanged with the network is generally measured by a bidirectional electronic meter M2 and the measuring system shall be hour-based.
The distribution utility is generally responsible for the installation and maintenance of the measuring set for the exchanged energy. The Ministerial Decree DM 06/08/2010 defines the electric energy produced by a PV plant as follows:•“forplantsconnectedtoLVnetworks,itistheelectric
energy measured at the output of the inverter set converting direct current to alternating current, includ-ing any isolation or matching transformer, before this energy is made available for the electric loads of the responsible subject and/or fed into the public net-work”;
•“forplantsconnectedtoMVorHVnetworks,itistheelectric energy measured at the output of the inverter set converting direct current to low voltage alternating current before this energy is made available for the electric loads of the responsible subject and before the transformation into the medium of high voltage to be fed into the public network is carried out”.
The measure of the produced energy is carried out by a meter M1, which shall be able to detect the energy pro-duced on hour-basis and shall be equipped with a device for telecom inquiry and acquisition of the measures from the network grid administrator. The measuring set for the produced energy shall be installed as near as possible to the inverter and shall be equipped with suitable anti-fraud devices.
For plants with rated power not higher than 20 kW, the responsible for the measuring of the produced energy is the grid administrator, whereas for powers higher than 20 kW responsible is the “active” user (i.e. the user which also produces energy), who has the faculty of making use of the grid administrator to carry out such activity, while maintaining the responsibility of such service.
M1
M2
PV plant
Electricloads
C
PU
E
Grid
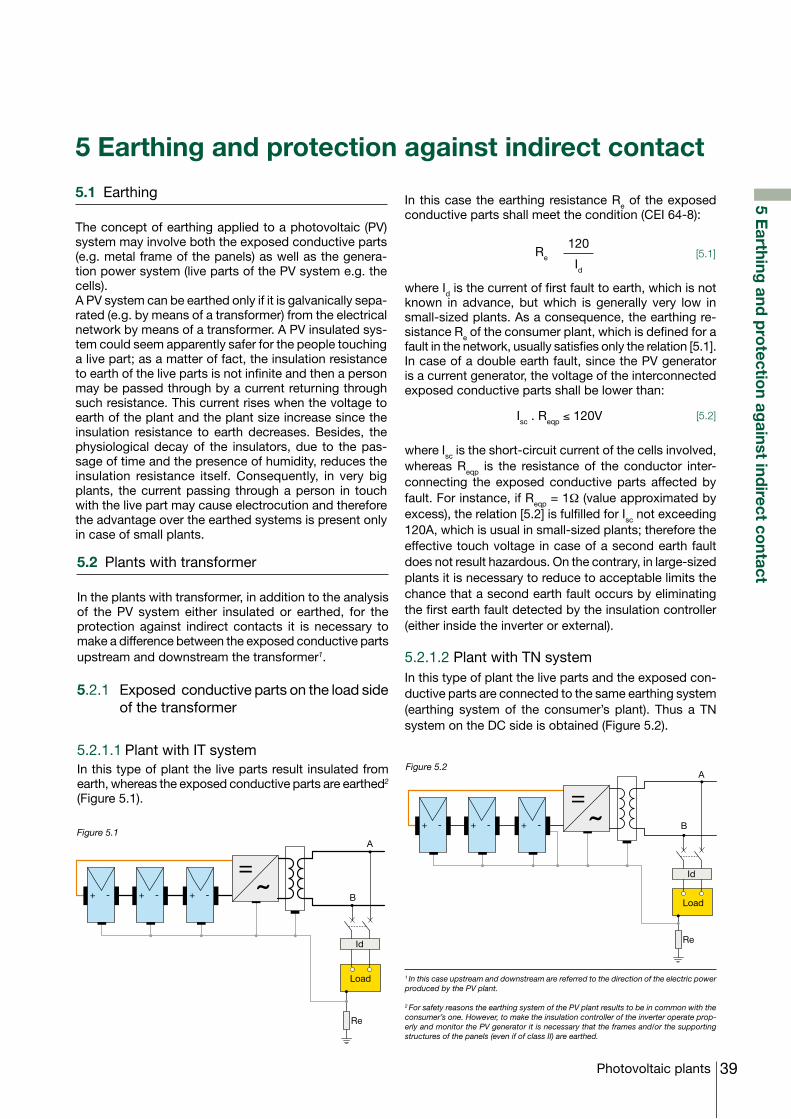
39Photovoltaic plants
5 Earthing
and p
rotectio
n against ind
irect contact
Figure 5.1
Figure 5.2
5.1 Earthing
The concept of earthing applied to a photovoltaic (PV) system may involve both the exposed conductive parts (e.g. metal frame of the panels) as well as the genera-tion power system (live parts of the PV system e.g. the cells). A PV system can be earthed only if it is galvanically sepa-rated (e.g. by means of a transformer) from the electrical network by means of a transformer. A PV insulated sys-tem could seem apparently safer for the people touching a live part; as a matter of fact, the insulation resistance to earth of the live parts is not infinite and then a person may be passed through by a current returning through such resistance. This current rises when the voltage to earth of the plant and the plant size increase since the insulation resistance to earth decreases. Besides, the physiological decay of the insulators, due to the pas-sage of time and the presence of humidity, reduces the insulation resistance itself. Consequently, in very big plants, the current passing through a person in touch with the live part may cause electrocution and therefore the advantage over the earthed systems is present only in case of small plants.
5 Earthing and protection against indirect contact
1 In this case upstream and downstream are referred to the direction of the electric power produced by the PV plant. 2 For safety reasons the earthing system of the PV plant results to be in common with the consumer’s one. However, to make the insulation controller of the inverter operate prop-erly and monitor the PV generator it is necessary that the frames and/or the supporting structures of the panels (even if of class II) are earthed.
5.2 Plants with transformer
In the plants with transformer, in addition to the analysis of the PV system either insulated or earthed, for the protection against indirect contacts it is necessary to make a difference between the exposed conductive parts upstream and downstream the transformer1.
5.2.1 Exposed conductive parts on the load side of the transformer
5.2.1.1 Plant with IT system In this type of plant the live parts result insulated from earth, whereas the exposed conductive parts are earthed2 (Figure 5.1).
+ - + - + -
Id
Load
Re
B
A
In this case the earthing resistance Re of the exposed conductive parts shall meet the condition (CEI 64-8):
Re
120
Id[5.1]
where Id is the current of first fault to earth, which is not known in advance, but which is generally very low in small-sized plants. As a consequence, the earthing re-sistance Re of the consumer plant, which is defined for a fault in the network, usually satisfies only the relation [5.1]. In case of a double earth fault, since the PV generator is a current generator, the voltage of the interconnected exposed conductive parts shall be lower than:
Isc . Reqp ≤ 120V [5.2]
where Isc is the short-circuit current of the cells involved, whereas Reqp is the resistance of the conductor inter-connecting the exposed conductive parts affected by fault. For instance, if Reqp = 1Ω (value approximated by excess), the relation [5.2] is fulfilled for Isc not exceeding 120A, which is usual in small-sized plants; therefore the effective touch voltage in case of a second earth fault does not result hazardous. On the contrary, in large-sized plants it is necessary to reduce to acceptable limits the chance that a second earth fault occurs by eliminating the first earth fault detected by the insulation controller (either inside the inverter or external).
5.2.1.2 Plant with TN systemIn this type of plant the live parts and the exposed con-ductive parts are connected to the same earthing system (earthing system of the consumer’s plant). Thus a TN system on the DC side is obtained (Figure 5.2).
+ - + - + -
Id
Load
Re
B
A
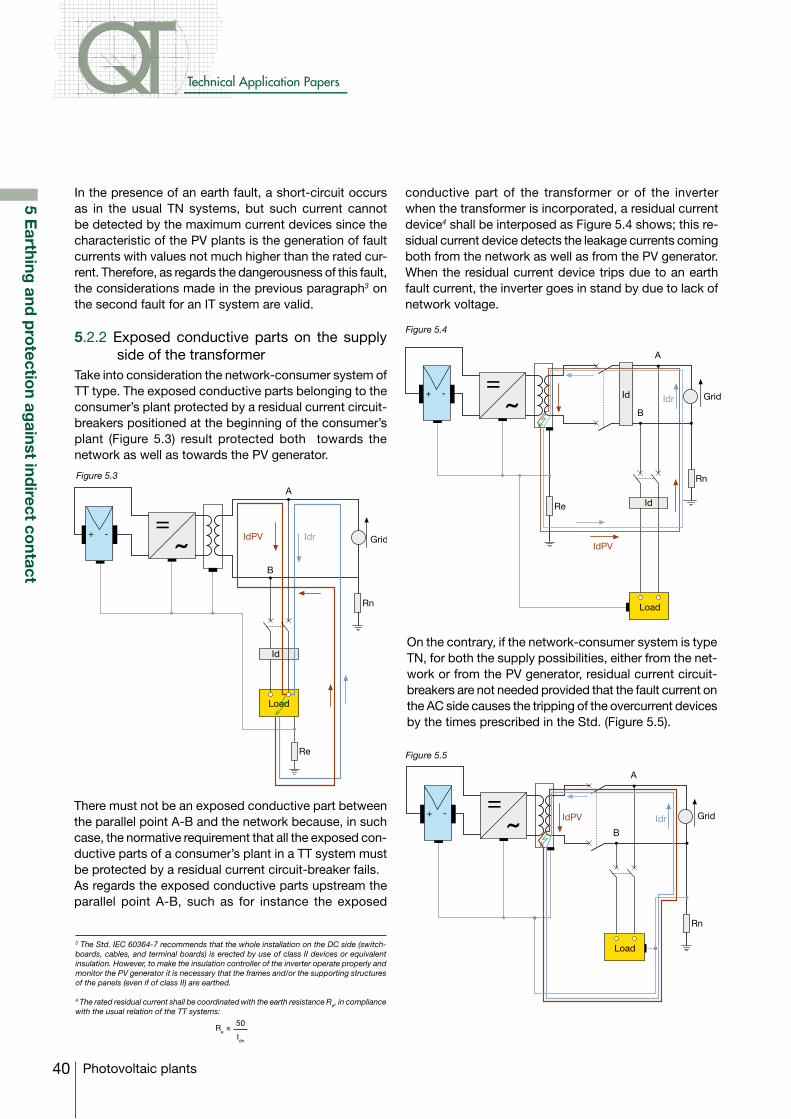
40
Technical Application Papers
Photovoltaic plants
5 Earthing
and p
rotectio
n against ind
irect contact
In the presence of an earth fault, a short-circuit occurs as in the usual TN systems, but such current cannot be detected by the maximum current devices since the characteristic of the PV plants is the generation of fault currents with values not much higher than the rated cur-rent. Therefore, as regards the dangerousness of this fault, the considerations made in the previous paragraph3 on the second fault for an IT system are valid.
5.2.2 Exposed conductive parts on the supply side of the transformer
Take into consideration the network-consumer system of TT type. The exposed conductive parts belonging to the consumer’s plant protected by a residual current circuit-breakers positioned at the beginning of the consumer’s plant (Figure 5.3) result protected both towards the network as well as towards the PV generator.
3 The Std. IEC 60364-7 recommends that the whole installation on the DC side (switch-boards, cables, and terminal boards) is erected by use of class II devices or equivalent insulation. However, to make the insulation controller of the inverter operate properly and monitor the PV generator it is necessary that the frames and/or the supporting structures of the panels (even if of class II) are earthed.
4 The rated residual current shall be coordinated with the earth resistance Re, in compliance with the usual relation of the TT systems:
Re≤
50
Idn
Figure 5.3
Figure 5.4
Figure 5.5
There must not be an exposed conductive part between the parallel point A-B and the network because, in such case, the normative requirement that all the exposed con-ductive parts of a consumer’s plant in a TT system must be protected by a residual current circuit-breaker fails.As regards the exposed conductive parts upstream the parallel point A-B, such as for instance the exposed
conductive part of the transformer or of the inverter when the transformer is incorporated, a residual current device4 shall be interposed as Figure 5.4 shows; this re-sidual current device detects the leakage currents coming both from the network as well as from the PV generator. When the residual current device trips due to an earth fault current, the inverter goes in stand by due to lack of network voltage.
On the contrary, if the network-consumer system is type TN, for both the supply possibilities, either from the net-work or from the PV generator, residual current circuit-breakers are not needed provided that the fault current on the AC side causes the tripping of the overcurrent devices by the times prescribed in the Std. (Figure 5.5).
+ -
B
A
Rn
Id
Re
IdrIdPV
Load
Grid
+ -
B
A
Rn
Idr
IdPV
Re
Grid
Id
Id
Load
+ -
B
A
Rn
IdrIdPV Grid
Load

41Photovoltaic plants
5 Earthing
and p
rotectio
n against ind
irect contact
Figure 5.6
5.3 Plants without transformer
In case of absence of the separation transformer between the PV installation and the network, the PV installation itself shall be insulated from earth in its active parts be-coming an extension of the supply network, generally with a point connected to earth (TT or TN system).As regards the exposed conductive parts of the con-sumer’s plant and upstream the parallel point A-B, from a conceptual point of view, what described in clause 5.2.2 is still valid.
On the DC side an earth fault on the exposed conduc-tive parts determines the tripping of the residual current circuit-breaker positioned downstream the inverter (Fig-ure 5.6). After the tripping of the residual current device, the inverter goes in stand by due to the lack of network voltage, but the fault is supplied by the PV generator. Since the PV system is type IT, the considerations made in clause 5.2.2.1 are valid.
For earth faults on the DC side and on the exposed conductive parts upstream the parallel point A-B, the residual current circuit-breaker on the load side of the inverter is passed through by a residual current which is not alternating. Therefore such device must be of type B5, unless the inverter is by construction such as not to inject DC earth fault currents (IEC 60364-7)6.
5 The residual current device of type B detects the following typologies of earth fault currents: •alternating(alsoatfrequencyexceedingthenetworkone,e.g.upto1000Hz); •pulsatingunidirectional; •direct.
6 The Std. CEI EN 62040-1 prescribes that the protection of the UPS (including an inverter) against earth faults is realized by using residual current devices type B (for three-phase UPS) and type A (for single-phase UPS), whenever an earth fault current with DC components may be possible according to the UPS design.
+ - + - + -
Idtype B
Rn
Re
Idr
IdPV
B
A
Load
Grid
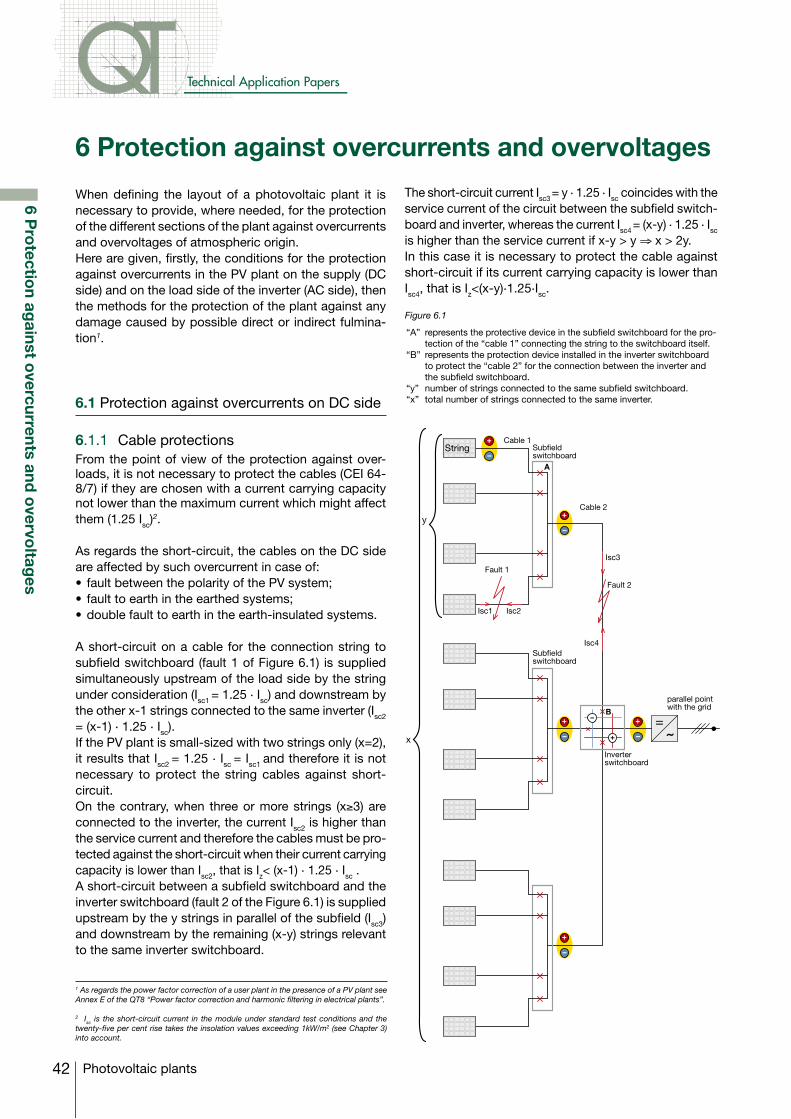
42
Technical Application Papers
Photovoltaic plants
6 Pro
tection ag
ainst overcurrents and
overvo
ltages
When defining the layout of a photovoltaic plant it is necessary to provide, where needed, for the protection of the different sections of the plant against overcurrents and overvoltages of atmospheric origin.Here are given, firstly, the conditions for the protection against overcurrents in the PV plant on the supply (DC side) and on the load side of the inverter (AC side), then the methods for the protection of the plant against any damage caused by possible direct or indirect fulmina-tion1.
6.1 Protection against overcurrents on DC side
6.1.1 Cable protectionsFrom the point of view of the protection against over-loads, it is not necessary to protect the cables (CEI 64-8/7) if they are chosen with a current carrying capacity not lower than the maximum current which might affect them (1.25 Isc)
2.
As regards the short-circuit, the cables on the DC side are affected by such overcurrent in case of: • faultbetweenthepolarityofthePVsystem;• faulttoearthintheearthedsystems;•doublefaulttoearthintheearth-insulatedsystems.
A short-circuit on a cable for the connection string to subfield switchboard (fault 1 of Figure 6.1) is supplied simultaneously upstream of the load side by the string under consideration (Isc1 = 1.25 . Isc) and downstream by the other x-1 strings connected to the same inverter (Isc2
= (x-1) . 1.25 . Isc).If the PV plant is small-sized with two strings only (x=2), it results that Isc2 = 1.25 . Isc = Isc1 and therefore it is not necessary to protect the string cables against short-circuit. On the contrary, when three or more strings (x≥3) are connected to the inverter, the current Isc2 is higher than the service current and therefore the cables must be pro-tected against the short-circuit when their current carrying capacity is lower than Isc2, that is Iz< (x-1) . 1.25 . Isc .A short-circuit between a subfield switchboard and the inverter switchboard (fault 2 of the Figure 6.1) is supplied upstream by the y strings in parallel of the subfield (Isc3) and downstream by the remaining (x-y) strings relevant to the same inverter switchboard.
6 Protection against overcurrents and overvoltages
The short-circuit current Isc3 = y . 1.25 . Isc coincides with the service current of the circuit between the subfield switch-board and inverter, whereas the current Isc4 = (x-y) . 1.25 . Isc is higher than the service current if x-y > y ⇒ x > 2y. In this case it is necessary to protect the cable against short-circuit if its current carrying capacity is lower than Isc4, that is Iz<(x-y).1.25.Isc.
1 As regards the power factor correction of a user plant in the presence of a PV plant see Annex E of the QT8 “Power factor correction and harmonic filtering in electrical plants”.
2 Isc is the short-circuit current in the module under standard test conditions and the twenty-five per cent rise takes the insolation values exceeding 1kW/m2 (see Chapter 3) into account.
“A” represents the protective device in the subfield switchboard for the pro-tection of the “cable 1” connecting the string to the switchboard itself.
“B” represents the protection device installed in the inverter switchboard to protect the “cable 2” for the connection between the inverter and the subfield switchboard.
“y” number of strings connected to the same subfield switchboard.“x” total number of strings connected to the same inverter.
Figure 6.1
+
–
+
–
+
–
+
–
+
–
StringCable 1
Cable 2
Fault 1
Isc2Isc1
Subfieldswitchboard
Subfieldswitchboard
–
+
B
Inverterswitchboard
parallel pointwith the grid
Isc3
Isc4
y
A
Fault 2
x
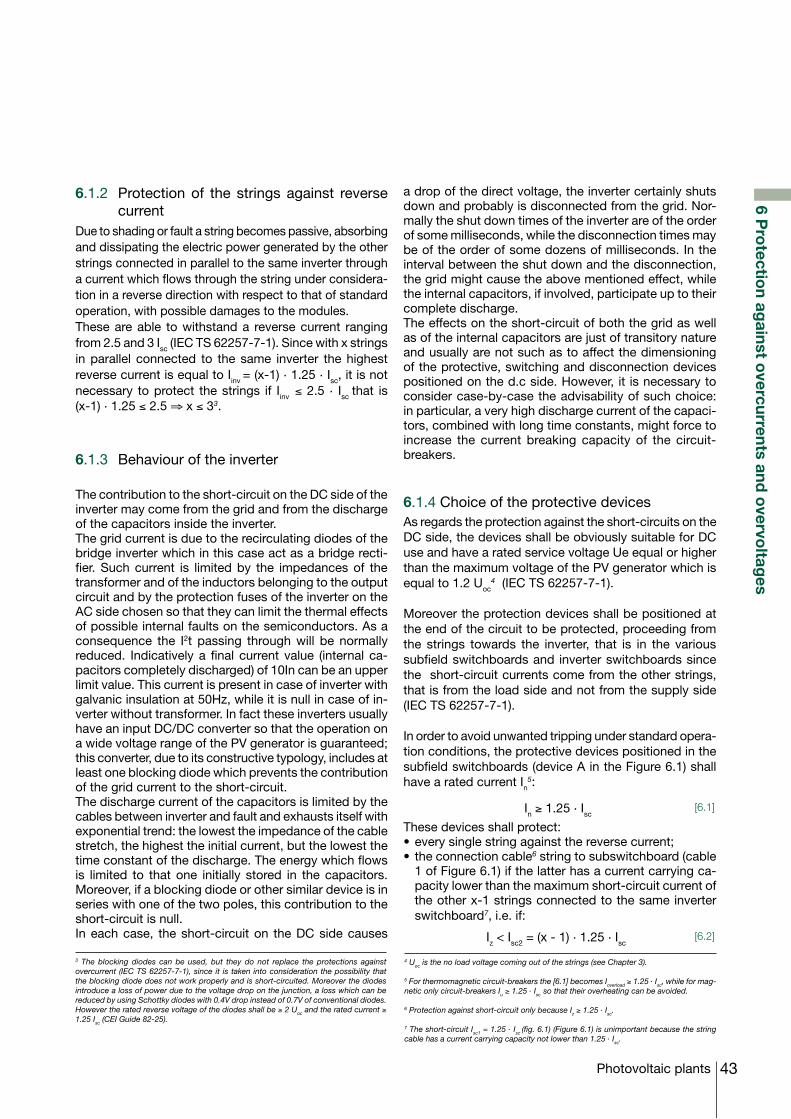
43Photovoltaic plants
6 Pro
tection ag
ainst overcurrents and
overvo
ltages
6.1.2 Protection of the strings against reverse current
Due to shading or fault a string becomes passive, absorbing and dissipating the electric power generated by the other strings connected in parallel to the same inverter through a current which flows through the string under considera-tion in a reverse direction with respect to that of standard operation, with possible damages to the modules. These are able to withstand a reverse current ranging from 2.5 and 3 Isc (IEC TS 62257-7-1). Since with x strings in parallel connected to the same inverter the highest reverse current is equal to Iinv = (x-1) . 1.25 . Isc, it is not necessary to protect the strings if Iinv ≤ 2.5 . Isc that is (x-1) . 1.25 ≤ 2.5 ⇒ x ≤ 33.
6.1.3 Behaviour of the inverter The contribution to the short-circuit on the DC side of the inverter may come from the grid and from the discharge of the capacitors inside the inverter.The grid current is due to the recirculating diodes of the bridge inverter which in this case act as a bridge recti-fier. Such current is limited by the impedances of the transformer and of the inductors belonging to the output circuit and by the protection fuses of the inverter on the AC side chosen so that they can limit the thermal effects of possible internal faults on the semiconductors. As a consequence the I2t passing through will be normally reduced. Indicatively a final current value (internal ca-pacitors completely discharged) of 10In can be an upper limit value. This current is present in case of inverter with galvanic insulation at 50Hz, while it is null in case of in-verter without transformer. In fact these inverters usually have an input DC/DC converter so that the operation on a wide voltage range of the PV generator is guaranteed; this converter, due to its constructive typology, includes at least one blocking diode which prevents the contribution of the grid current to the short-circuit. The discharge current of the capacitors is limited by the cables between inverter and fault and exhausts itself with exponential trend: the lowest the impedance of the cable stretch, the highest the initial current, but the lowest the time constant of the discharge. The energy which flows is limited to that one initially stored in the capacitors. Moreover, if a blocking diode or other similar device is in series with one of the two poles, this contribution to the short-circuit is null.In each case, the short-circuit on the DC side causes
3 The blocking diodes can be used, but they do not replace the protections against overcurrent (IEC TS 62257-7-1), since it is taken into consideration the possibility that the blocking diode does not work properly and is short-circuited. Moreover the diodes introduce a loss of power due to the voltage drop on the junction, a loss which can be reduced by using Schottky diodes with 0.4V drop instead of 0.7V of conventional diodes. However the rated reverse voltage of the diodes shall be ≥ 2 Uoc and the rated current ≥ 1.25 Isc (CEI Guide 82-25).
a drop of the direct voltage, the inverter certainly shuts down and probably is disconnected from the grid. Nor-mally the shut down times of the inverter are of the order of some milliseconds, while the disconnection times may be of the order of some dozens of milliseconds. In the interval between the shut down and the disconnection, the grid might cause the above mentioned effect, while the internal capacitors, if involved, participate up to their complete discharge. The effects on the short-circuit of both the grid as well as of the internal capacitors are just of transitory nature and usually are not such as to affect the dimensioning of the protective, switching and disconnection devices positioned on the d.c side. However, it is necessary to consider case-by-case the advisability of such choice: in particular, a very high discharge current of the capaci-tors, combined with long time constants, might force to increase the current breaking capacity of the circuit-breakers.
6.1.4 Choice of the protective devicesAs regards the protection against the short-circuits on the DC side, the devices shall be obviously suitable for DC use and have a rated service voltage Ue equal or higher than the maximum voltage of the PV generator which is equal to 1.2 Uoc
4 (IEC TS 62257-7-1).
Moreover the protection devices shall be positioned at the end of the circuit to be protected, proceeding from the strings towards the inverter, that is in the various subfield switchboards and inverter switchboards since the short-circuit currents come from the other strings, that is from the load side and not from the supply side (IEC TS 62257-7-1).
In order to avoid unwanted tripping under standard opera-tion conditions, the protective devices positioned in the subfield switchboards (device A in the Figure 6.1) shall have a rated current In
5:
In ≥ 1.25 . Isc[6.1]
These devices shall protect:•everysinglestringagainstthereversecurrent;• theconnectioncable6 string to subswitchboard (cable
1 of Figure 6.1) if the latter has a current carrying ca-pacity lower than the maximum short-circuit current of the other x-1 strings connected to the same inverter switchboard7, i.e. if:
Iz < Isc2 = (x - 1) . 1.25 . Isc[6.2]
4 Uoc is the no load voltage coming out of the strings (see Chapter 3).
5 For thermomagnetic circuit-breakers the [6.1] becomes Ioverload ≥ 1.25 . Isc, while for mag-netic only circuit-breakers Iu ≥ 1.25 . Isc so that their overheating can be avoided.
6 Protection against short-circuit only because Iz ≥ 1.25 . Isc.
7 The short-circuit Isc1=1.25. Isc (fig. 6.1) (Figure 6.1) is unimportant because the string cable has a current carrying capacity not lower than 1.25 . Isc.
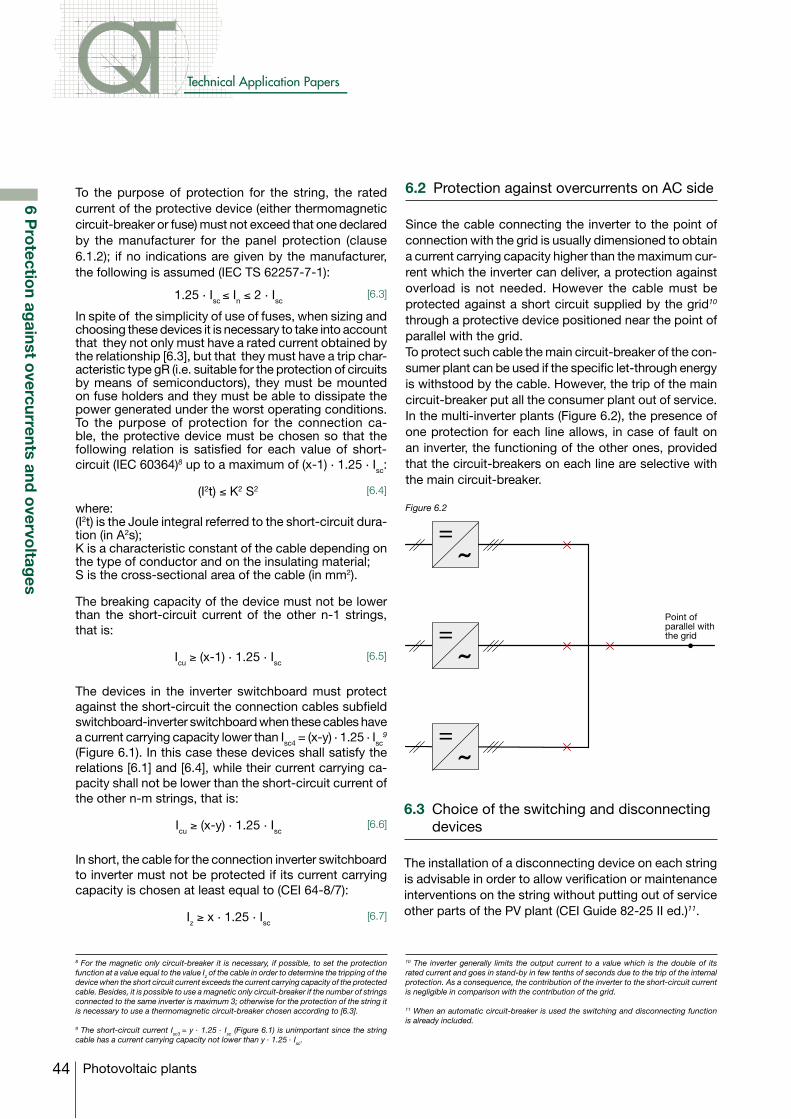
44
Technical Application Papers
Photovoltaic plants
6 Pro
tection ag
ainst overcurrents and
overvo
ltages
6.2 Protection against overcurrents on AC side
Since the cable connecting the inverter to the point of connection with the grid is usually dimensioned to obtain a current carrying capacity higher than the maximum cur-rent which the inverter can deliver, a protection against overload is not needed. However the cable must be protected against a short circuit supplied by the grid10 through a protective device positioned near the point of parallel with the grid. To protect such cable the main circuit-breaker of the con-sumer plant can be used if the specific let-through energy is withstood by the cable. However, the trip of the main circuit-breaker put all the consumer plant out of service. In the multi-inverter plants (Figure 6.2), the presence of one protection for each line allows, in case of fault on an inverter, the functioning of the other ones, provided that the circuit-breakers on each line are selective with the main circuit-breaker.
Figure 6.2
6.3 Choice of the switching and disconnecting devices
The installation of a disconnecting device on each string is advisable in order to allow verification or maintenance interventions on the string without putting out of service other parts of the PV plant (CEI Guide 82-25 II ed.)11.
10 The inverter generally limits the output current to a value which is the double of its rated current and goes in stand-by in few tenths of seconds due to the trip of the internal protection. As a consequence, the contribution of the inverter to the short-circuit current is negligible in comparison with the contribution of the grid.
11 When an automatic circuit-breaker is used the switching and disconnecting function is already included.
To the purpose of protection for the string, the rated current of the protective device (either thermomagnetic circuit-breaker or fuse) must not exceed that one declared by the manufacturer for the panel protection (clause 6.1.2); if no indications are given by the manufacturer, the following is assumed (IEC TS 62257-7-1):
1.25 . Isc ≤ In ≤ 2 . Isc
[6.3]
In spite of the simplicity of use of fuses, when sizing and choosing these devices it is necessary to take into account that they not only must have a rated current obtained by the relationship [6.3], but that they must have a trip char-acteristic type gR (i.e. suitable for the protection of circuits by means of semiconductors), they must be mounted on fuse holders and they must be able to dissipate the power generated under the worst operating conditions. To the purpose of protection for the connection ca-ble, the protective device must be chosen so that the following relation is satisfied for each value of short-circuit (IEC 60364)8 up to a maximum of (x-1) . 1.25 . Isc:
(I2t) ≤ K2 S2 [6.4]
where: (I2t) is the Joule integral referred to the short-circuit dura-tion (in A2s);K is a characteristic constant of the cable depending on the type of conductor and on the insulating material;S is the cross-sectional area of the cable (in mm2).
The breaking capacity of the device must not be lower than the short-circuit current of the other n-1 strings, that is:
Icu ≥ (x-1) . 1.25 . Isc [6.5]
The devices in the inverter switchboard must protect against the short-circuit the connection cables subfield switchboard-inverter switchboard when these cables have a current carrying capacity lower than Isc4 = (x-y) . 1.25 . Isc
9 (Figure 6.1). In this case these devices shall satisfy the relations [6.1] and [6.4], while their current carrying ca-pacity shall not be lower than the short-circuit current of the other n-m strings, that is:
Icu ≥ (x-y) . 1.25 . Isc [6.6]
In short, the cable for the connection inverter switchboard to inverter must not be protected if its current carrying capacity is chosen at least equal to (CEI 64-8/7):
Iz ≥ x . 1.25 . Isc [6.7]
8 For the magnetic only circuit-breaker it is necessary, if possible, to set the protection function at a value equal to the value Iz of the cable in order to determine the tripping of the device when the short circuit current exceeds the current carrying capacity of the protected cable. Besides, it is possible to use a magnetic only circuit-breaker if the number of strings connected to the same inverter is maximum 3; otherwise for the protection of the string it is necessary to use a thermomagnetic circuit-breaker chosen according to [6.3].
9 The short-circuit current Isc3 = y . 1.25 . Isc (Figure 6.1) is unimportant since the string cable has a current carrying capacity not lower than y . 1.25 . Isc.
Point ofparallel withthe grid
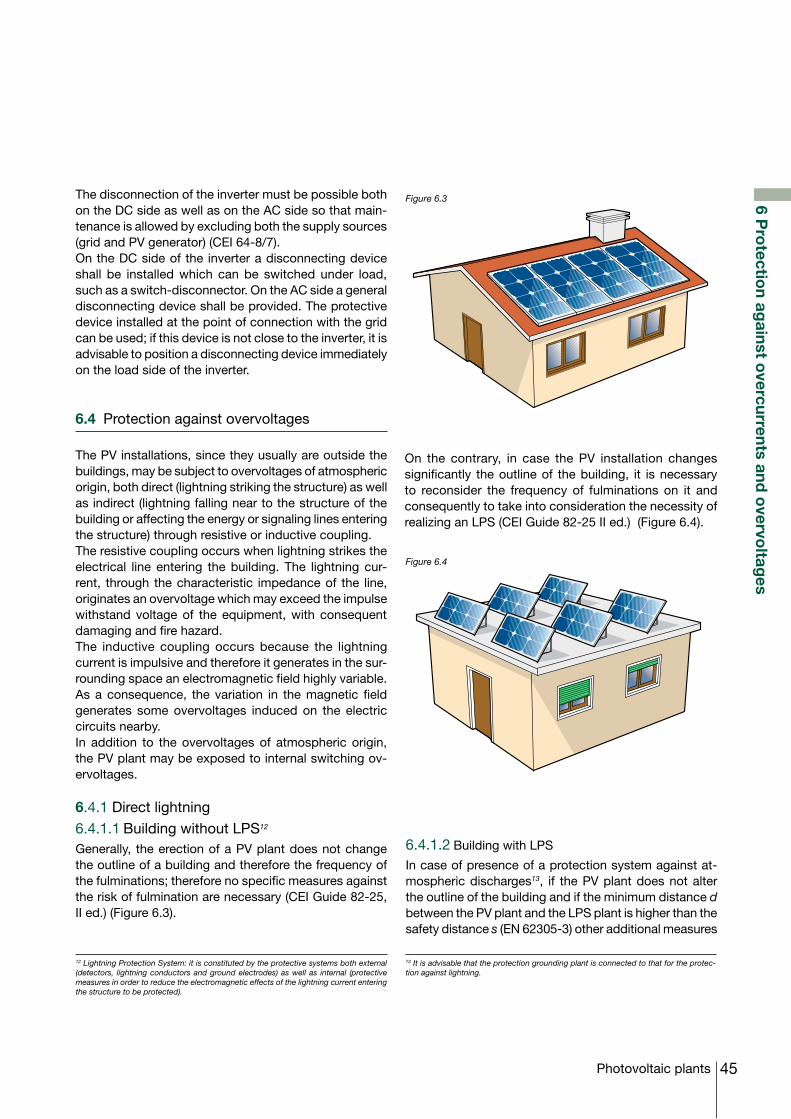
45Photovoltaic plants
6 Pro
tection ag
ainst overcurrents and
overvo
ltages
Figure 6.3
Figure 6.4
The disconnection of the inverter must be possible both on the DC side as well as on the AC side so that main-tenance is allowed by excluding both the supply sources (grid and PV generator) (CEI 64-8/7). On the DC side of the inverter a disconnecting device shall be installed which can be switched under load, such as a switch-disconnector. On the AC side a general disconnecting device shall be provided. The protective device installed at the point of connection with the grid can be used; if this device is not close to the inverter, it is advisable to position a disconnecting device immediately on the load side of the inverter.
6.4 Protection against overvoltages
The PV installations, since they usually are outside the buildings, may be subject to overvoltages of atmospheric origin, both direct (lightning striking the structure) as well as indirect (lightning falling near to the structure of the building or affecting the energy or signaling lines entering the structure) through resistive or inductive coupling.The resistive coupling occurs when lightning strikes the electrical line entering the building. The lightning cur-rent, through the characteristic impedance of the line, originates an overvoltage which may exceed the impulse withstand voltage of the equipment, with consequent damaging and fire hazard.The inductive coupling occurs because the lightning current is impulsive and therefore it generates in the sur-rounding space an electromagnetic field highly variable. As a consequence, the variation in the magnetic field generates some overvoltages induced on the electric circuits nearby. In addition to the overvoltages of atmospheric origin, the PV plant may be exposed to internal switching ov-ervoltages.
6.4.1 Direct lightning
6.4.1.1 Building without LPS12
Generally, the erection of a PV plant does not change the outline of a building and therefore the frequency of the fulminations; therefore no specific measures against the risk of fulmination are necessary (CEI Guide 82-25, II ed.) (Figure 6.3).
12 Lightning Protection System: it is constituted by the protective systems both external (detectors, lightning conductors and ground electrodes) as well as internal (protective measures in order to reduce the electromagnetic effects of the lightning current entering the structure to be protected).
On the contrary, in case the PV installation changes significantly the outline of the building, it is necessary to reconsider the frequency of fulminations on it and consequently to take into consideration the necessity of realizing an LPS (CEI Guide 82-25 II ed.) (Figure 6.4).
6.4.1.2 Building with LPS
In case of presence of a protection system against at-mospheric discharges13, if the PV plant does not alter the outline of the building and if the minimum distance d between the PV plant and the LPS plant is higher than the safety distance s (EN 62305-3) other additional measures
13 It is advisable that the protection grounding plant is connected to that for the protec-tion against lightning.
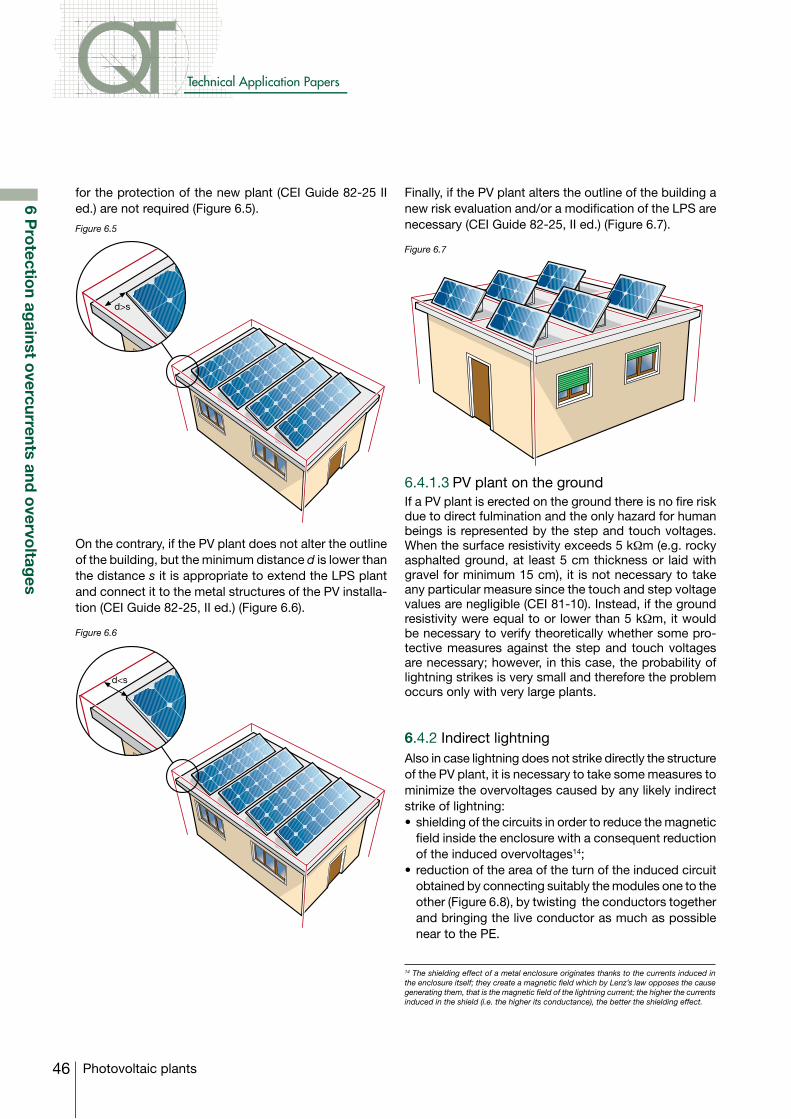
46
Technical Application Papers
Photovoltaic plants
6 Pro
tection ag
ainst overcurrents and
overvo
ltages
Finally, if the PV plant alters the outline of the building a new risk evaluation and/or a modification of the LPS are necessary (CEI Guide 82-25, II ed.) (Figure 6.7).
Figure 6.7
6.4.1.3 PV plant on the groundIf a PV plant is erected on the ground there is no fire risk due to direct fulmination and the only hazard for human beings is represented by the step and touch voltages. When the surface resistivity exceeds 5 kΩm (e.g. rocky asphalted ground, at least 5 cm thickness or laid with gravel for minimum 15 cm), it is not necessary to take any particular measure since the touch and step voltage values are negligible (CEI 81-10). Instead, if the ground resistivity were equal to or lower than 5 kΩm, it would be necessary to verify theoretically whether some pro-tective measures against the step and touch voltages are necessary; however, in this case, the probability of lightning strikes is very small and therefore the problem occurs only with very large plants.
6.4.2 Indirect lightningAlso in case lightning does not strike directly the structure of the PV plant, it is necessary to take some measures to minimize the overvoltages caused by any likely indirect strike of lightning:•shieldingofthecircuitsinordertoreducethemagnetic
field inside the enclosure with a consequent reduction of the induced overvoltages14;
• reductionoftheareaoftheturnoftheinducedcircuitobtained by connecting suitably the modules one to the other (Figure 6.8), by twisting the conductors together and bringing the live conductor as much as possible near to the PE.
14 The shielding effect of a metal enclosure originates thanks to the currents induced in the enclosure itself; they create a magnetic field which by Lenz’s law opposes the cause generating them, that is the magnetic field of the lightning current; the higher the currents induced in the shield (i.e. the higher its conductance), the better the shielding effect.
Figure 6.5
Figure 6.6
for the protection of the new plant (CEI Guide 82-25 II ed.) are not required (Figure 6.5).
On the contrary, if the PV plant does not alter the outline of the building, but the minimum distance d is lower than the distance s it is appropriate to extend the LPS plant and connect it to the metal structures of the PV installa-tion (CEI Guide 82-25, II ed.) (Figure 6.6).
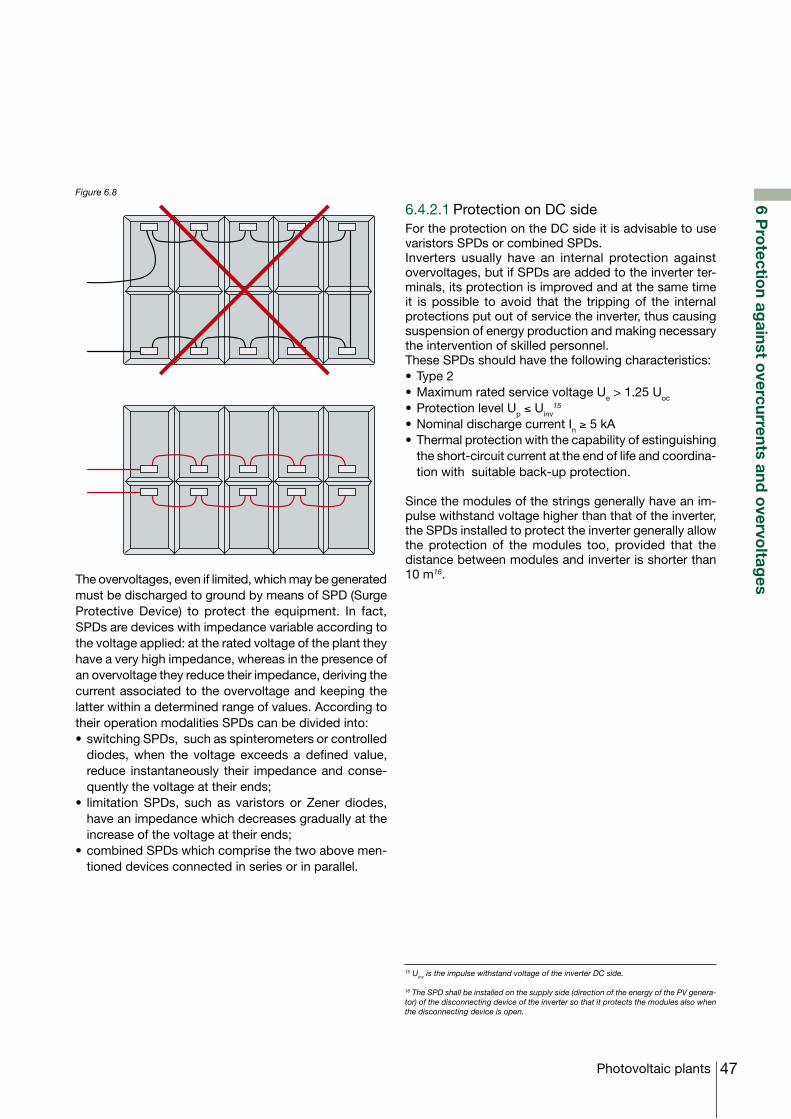
47Photovoltaic plants
6 Pro
tection ag
ainst overcurrents and
overvo
ltages
Figure 6.8
The overvoltages, even if limited, which may be generated must be discharged to ground by means of SPD (Surge Protective Device) to protect the equipment. In fact, SPDs are devices with impedance variable according to the voltage applied: at the rated voltage of the plant they have a very high impedance, whereas in the presence of an overvoltage they reduce their impedance, deriving the current associated to the overvoltage and keeping the latter within a determined range of values. According to their operation modalities SPDs can be divided into:•switchingSPDs,suchasspinterometersorcontrolled
diodes, when the voltage exceeds a defined value, reduce instantaneously their impedance and conse-quently the voltage at their ends;
• limitationSPDs, such as varistors or Zener diodes,have an impedance which decreases gradually at the increase of the voltage at their ends;
•combinedSPDswhichcomprisethetwoabovemen-tioned devices connected in series or in parallel.
6.4.2.1 Protection on DC side
For the protection on the DC side it is advisable to use varistors SPDs or combined SPDs.Inverters usually have an internal protection against overvoltages, but if SPDs are added to the inverter ter-minals, its protection is improved and at the same time it is possible to avoid that the tripping of the internal protections put out of service the inverter, thus causing suspension of energy production and making necessary the intervention of skilled personnel.These SPDs should have the following characteristics:•Type2•MaximumratedservicevoltageUe > 1.25 Uoc
•ProtectionlevelUp ≤ Uinv15
•NominaldischargecurrentIn ≥ 5 kA•Thermalprotectionwiththecapabilityofestinguishing
the short-circuit current at the end of life and coordina-tion with suitable back-up protection.
Since the modules of the strings generally have an im-pulse withstand voltage higher than that of the inverter, the SPDs installed to protect the inverter generally allow the protection of the modules too, provided that the distance between modules and inverter is shorter than 10 m16.
15 Uinv is the impulse withstand voltage of the inverter DC side.
16 The SPD shall be installed on the supply side (direction of the energy of the PV genera-tor) of the disconnecting device of the inverter so that it protects the modules also when the disconnecting device is open.
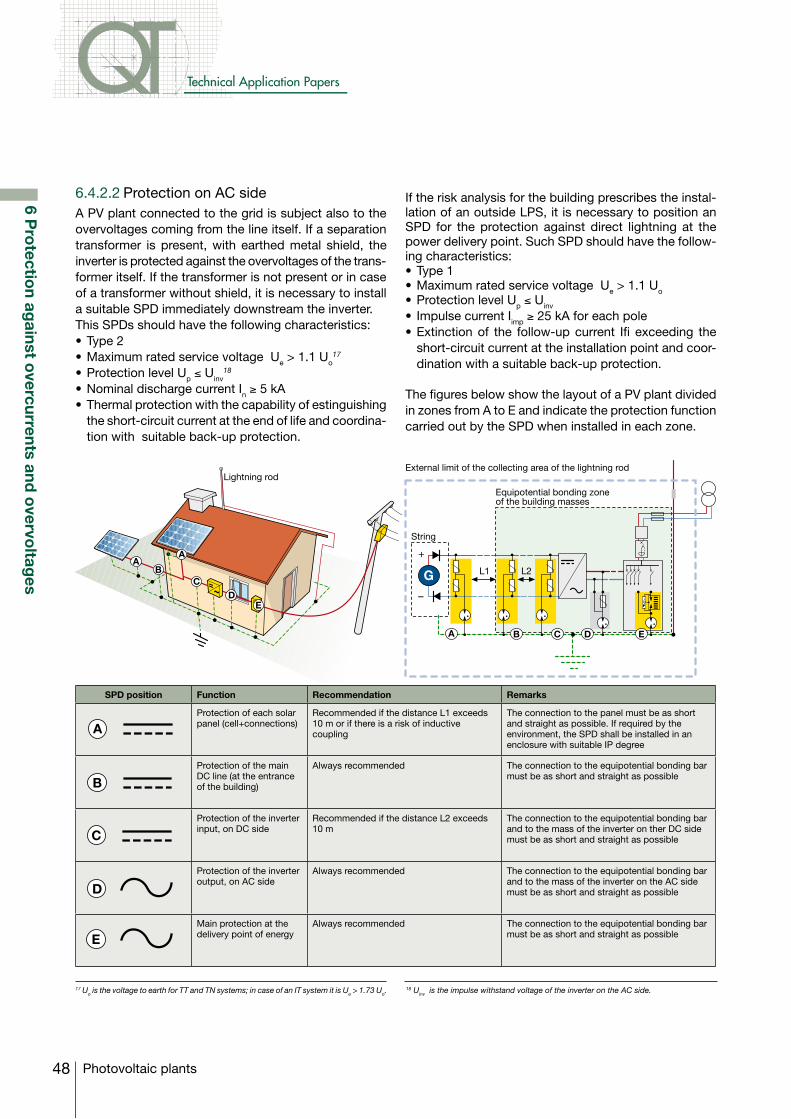
48
Technical Application Papers
Photovoltaic plants
6 Pro
tection ag
ainst overcurrents and
overvo
ltages
6.4.2.2 Protection on AC sideA PV plant connected to the grid is subject also to the overvoltages coming from the line itself. If a separation transformer is present, with earthed metal shield, the inverter is protected against the overvoltages of the trans-former itself. If the transformer is not present or in case of a transformer without shield, it is necessary to install a suitable SPD immediately downstream the inverter.This SPDs should have the following characteristics:•Type2•MaximumratedservicevoltageUe > 1.1 Uo
17 •ProtectionlevelUp ≤ Uinv
18
•NominaldischargecurrentIn ≥ 5 kA•Thermalprotectionwiththecapabilityofestinguishing
the short-circuit current at the end of life and coordina-tion with suitable back-up protection.
If the risk analysis for the building prescribes the instal-lation of an outside LPS, it is necessary to position an SPD for the protection against direct lightning at the power delivery point. Such SPD should have the follow-ing characteristics:•Type1•MaximumratedservicevoltageUe > 1.1 Uo •ProtectionlevelUp ≤ Uinv • ImpulsecurrentIimp ≥ 25 kA for each pole •Extinctionof the follow-upcurrent Ifi exceeding the
short-circuit current at the installation point and coor-dination with a suitable back-up protection.
The figures below show the layout of a PV plant divided in zones from A to E and indicate the protection function carried out by the SPD when installed in each zone.
17 Uo is the voltage to earth for TT and TN systems; in case of an IT system it is Ue > 1.73 Uo.
18 Uinv is the impulse withstand voltage of the inverter on the AC side.
AB
A
CD
E
G
+
–
A B C D E
String
Equipotential bonding zoneof the building masses
L1 L2
External limit of the collecting area of the lightning rodLightning rod
SPD position Function Recommendation Remarks
A
B
C
D
E
Protection of each solar panel (cell+connections)
Recommended if the distance L1 exceeds 10 m or if there is a risk of inductive coupling
The connection to the panel must be as short and straight as possible. If required by the environment, the SPD shall be installed in an enclosure with suitable IP degreeA
B
C
D
E
Protection of the main DC line (at the entrance of the building)
Always recommended The connection to the equipotential bonding bar must be as short and straight as possible
A
B
C
D
E
Protection of the inverter input, on DC side
Recommended if the distance L2 exceeds 10 m
The connection to the equipotential bonding bar and to the mass of the inverter on ther DC side must be as short and straight as possible
A
B
C
D
E
Protection of the inverter output, on AC side
Always recommended The connection to the equipotential bonding bar and to the mass of the inverter on the AC side must be as short and straight as possible
A
B
C
D
EMain protection at the delivery point of energy
Always recommended The connection to the equipotential bonding bar must be as short and straight as possible
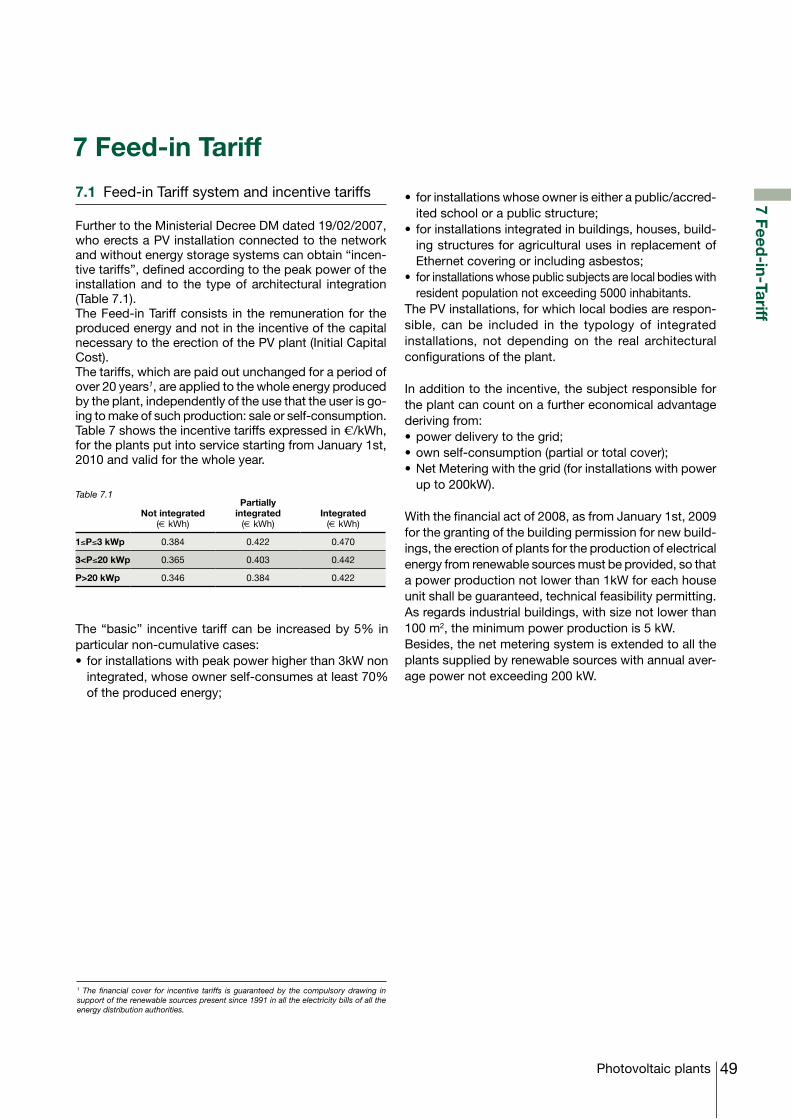
49Photovoltaic plants
7 Feed-in-Tariff
7.1 Feed-in Tariff system and incentive tariffs
Further to the Ministerial Decree DM dated 19/02/2007, who erects a PV installation connected to the network and without energy storage systems can obtain “incen-tive tariffs”, defined according to the peak power of the installation and to the type of architectural integration (Table 7.1). The Feed-in Tariff consists in the remuneration for the produced energy and not in the incentive of the capital necessary to the erection of the PV plant (Initial Capital Cost). The tariffs, which are paid out unchanged for a period of over 20 years1, are applied to the whole energy produced by the plant, independently of the use that the user is go-ing to make of such production: sale or self-consumption. Table 7 shows the incentive tariffs expressed in €/kWh, for the plants put into service starting from January 1st, 2010 and valid for the whole year.
7 Feed-in Tariff
Table 7.1
1 The financial cover for incentive tariffs is guaranteed by the compulsory drawing in support of the renewable sources present since 1991 in all the electricity bills of all the energy distribution authorities.
The “basic” incentive tariff can be increased by 5% in particular non-cumulative cases:• forinstallationswithpeakpowerhigherthan3kWnon
integrated, whose owner self-consumes at least 70% of the produced energy;
• forinstallationswhoseowneriseitherapublic/accred-ited school or a public structure;
• forinstallationsintegratedinbuildings,houses,build-ing structures for agricultural uses in replacement of Ethernet covering or including asbestos;
• forinstallationswhosepublicsubjectsarelocalbodieswithresident population not exceeding 5000 inhabitants.
The PV installations, for which local bodies are respon-sible, can be included in the typology of integrated installations, not depending on the real architectural configurations of the plant.
In addition to the incentive, the subject responsible for the plant can count on a further economical advantage deriving from:•powerdeliverytothegrid;•ownself-consumption(partialortotalcover);•NetMeteringwiththegrid(forinstallationswithpower
up to 200kW).
With the financial act of 2008, as from January 1st, 2009 for the granting of the building permission for new build-ings, the erection of plants for the production of electrical energy from renewable sources must be provided, so that a power production not lower than 1kW for each house unit shall be guaranteed, technical feasibility permitting. As regards industrial buildings, with size not lower than 100 m2, the minimum power production is 5 kW.Besides, the net metering system is extended to all the plants supplied by renewable sources with annual aver-age power not exceeding 200 kW.
Not integrated(€ kWh)
Partially integrated
(€ kWh)Integrated
(€ kWh)
1≤P≤3 kWp 0.384 0.422 0.470
3<P≤20 kWp 0.365 0.403 0.442
P>20 kWp 0.346 0.384 0.422
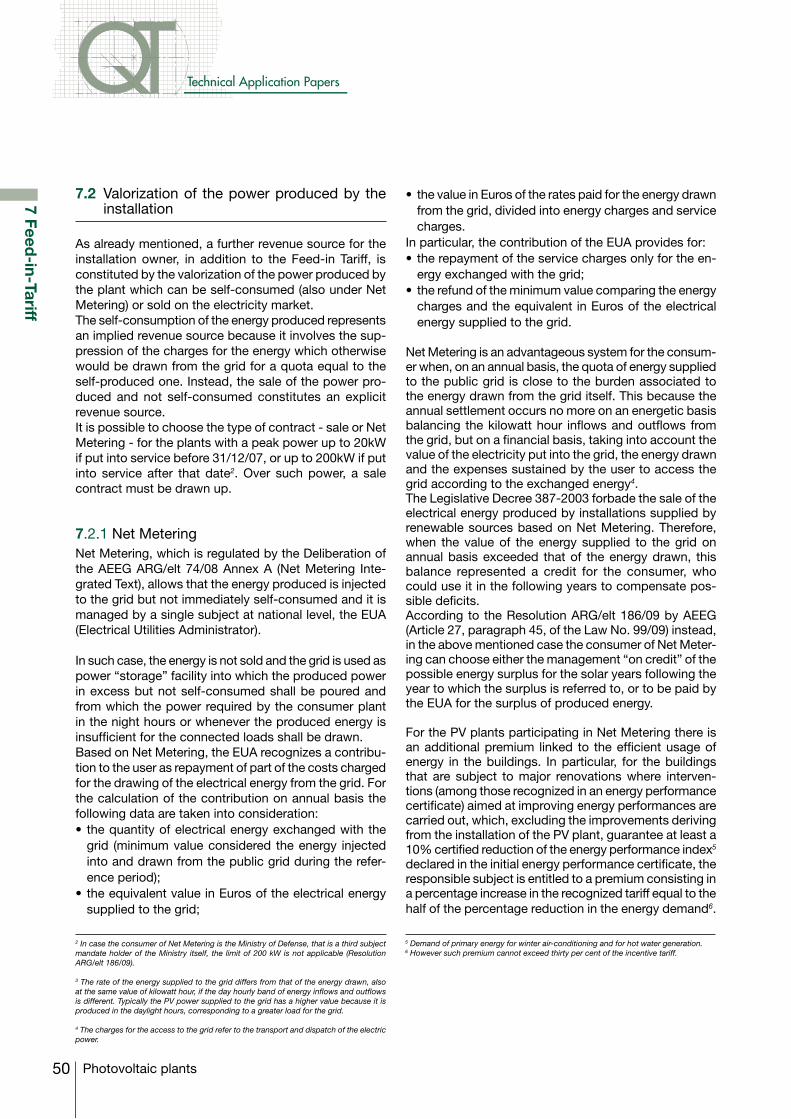
50
Technical Application Papers
Photovoltaic plants
7 Feed-in-Tariff
7.2 Valorization of the power produced by the installation
As already mentioned, a further revenue source for the installation owner, in addition to the Feed-in Tariff, is constituted by the valorization of the power produced by the plant which can be self-consumed (also under Net Metering) or sold on the electricity market. The self-consumption of the energy produced represents an implied revenue source because it involves the sup-pression of the charges for the energy which otherwise would be drawn from the grid for a quota equal to the self-produced one. Instead, the sale of the power pro-duced and not self-consumed constitutes an explicit revenue source. It is possible to choose the type of contract - sale or Net Metering - for the plants with a peak power up to 20kW if put into service before 31/12/07, or up to 200kW if put into service after that date2. Over such power, a sale contract must be drawn up.
7.2.1 Net MeteringNet Metering, which is regulated by the Deliberation of the AEEG ARG/elt 74/08 Annex A (Net Metering Inte-grated Text), allows that the energy produced is injected to the grid but not immediately self-consumed and it is managed by a single subject at national level, the EUA (Electrical Utilities Administrator).
In such case, the energy is not sold and the grid is used as power “storage” facility into which the produced power in excess but not self-consumed shall be poured and from which the power required by the consumer plant in the night hours or whenever the produced energy is insufficient for the connected loads shall be drawn.Based on Net Metering, the EUA recognizes a contribu-tion to the user as repayment of part of the costs charged for the drawing of the electrical energy from the grid. For the calculation of the contribution on annual basis the following data are taken into consideration:• thequantityofelectricalenergyexchangedwiththe
grid (minimum value considered the energy injected into and drawn from the public grid during the refer-ence period);
• theequivalentvalueinEurosoftheelectricalenergysupplied to the grid;
• thevalueinEurosoftheratespaidfortheenergydrawnfrom the grid, divided into energy charges and service charges.
In particular, the contribution of the EUA provides for:• therepaymentoftheservicechargesonlyfortheen-
ergy exchanged with the grid;• therefundoftheminimumvaluecomparingtheenergy
charges and the equivalent in Euros of the electrical energy supplied to the grid.
Net Metering is an advantageous system for the consum-er when, on an annual basis, the quota of energy supplied to the public grid is close to the burden associated to the energy drawn from the grid itself. This because the annual settlement occurs no more on an energetic basis balancing the kilowatt hour inflows and outflows from the grid, but on a financial basis, taking into account the value of the electricity put into the grid, the energy drawn and the expenses sustained by the user to access the grid according to the exchanged energy4.The Legislative Decree 387-2003 forbade the sale of the electrical energy produced by installations supplied by renewable sources based on Net Metering. Therefore, when the value of the energy supplied to the grid on annual basis exceeded that of the energy drawn, this balance represented a credit for the consumer, who could use it in the following years to compensate pos-sible deficits.According to the Resolution ARG/elt 186/09 by AEEG (Article 27, paragraph 45, of the Law No. 99/09) instead, in the above mentioned case the consumer of Net Meter-ing can choose either the management “on credit” of the possible energy surplus for the solar years following the year to which the surplus is referred to, or to be paid by the EUA for the surplus of produced energy.
For the PV plants participating in Net Metering there is an additional premium linked to the efficient usage of energy in the buildings. In particular, for the buildings that are subject to major renovations where interven-tions (among those recognized in an energy performance certificate) aimed at improving energy performances are carried out, which, excluding the improvements deriving from the installation of the PV plant, guarantee at least a 10% certified reduction of the energy performance index5 declared in the initial energy performance certificate, the responsible subject is entitled to a premium consisting in a percentage increase in the recognized tariff equal to the half of the percentage reduction in the energy demand6.
2 In case the consumer of Net Metering is the Ministry of Defense, that is a third subject mandate holder of the Ministry itself, the limit of 200 kW is not applicable (Resolution ARG/elt 186/09).
3 The rate of the energy supplied to the grid differs from that of the energy drawn, also at the same value of kilowatt hour, if the day hourly band of energy inflows and outflows is different. Typically the PV power supplied to the grid has a higher value because it is produced in the daylight hours, corresponding to a greater load for the grid.
4 The charges for the access to the grid refer to the transport and dispatch of the electric power.
5 Demand of primary energy for winter air-conditioning and for hot water generation.6 However such premium cannot exceed thirty per cent of the incentive tariff.
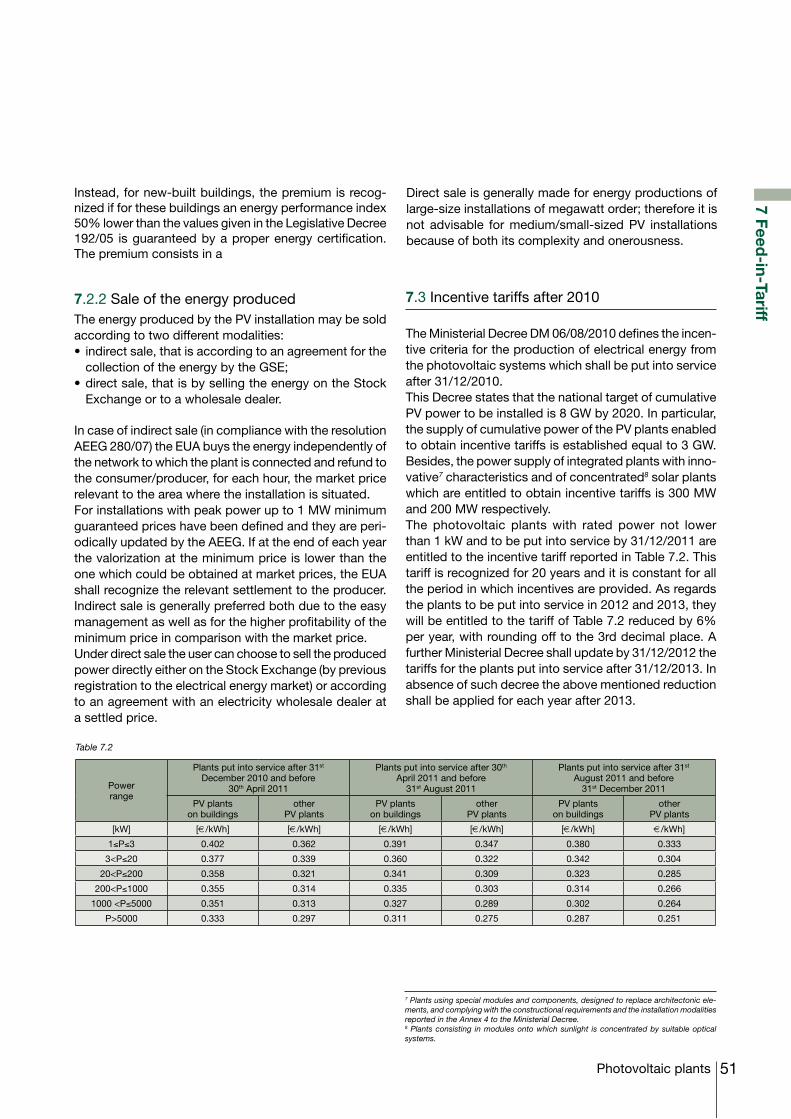
51Photovoltaic plants
Instead, for new-built buildings, the premium is recog-nized if for these buildings an energy performance index 50% lower than the values given in the Legislative Decree 192/05 is guaranteed by a proper energy certification. The premium consists in a
7.2.2 Sale of the energy producedThe energy produced by the PV installation may be sold according to two different modalities:• indirectsale,thatisaccordingtoanagreementforthe
collection of the energy by the GSE;•directsale,thatisbysellingtheenergyontheStock
Exchange or to a wholesale dealer.
In case of indirect sale (in compliance with the resolution AEEG 280/07) the EUA buys the energy independently of the network to which the plant is connected and refund to the consumer/producer, for each hour, the market price relevant to the area where the installation is situated. For installations with peak power up to 1 MW minimum guaranteed prices have been defined and they are peri-odically updated by the AEEG. If at the end of each year the valorization at the minimum price is lower than the one which could be obtained at market prices, the EUA shall recognize the relevant settlement to the producer. Indirect sale is generally preferred both due to the easy management as well as for the higher profitability of the minimum price in comparison with the market price.Under direct sale the user can choose to sell the produced power directly either on the Stock Exchange (by previous registration to the electrical energy market) or according to an agreement with an electricity wholesale dealer at a settled price.
Table 7.2
7 Plants using special modules and components, designed to replace architectonic ele-ments, and complying with the constructional requirements and the installation modalities reported in the Annex 4 to the Ministerial Decree.8 Plants consisting in modules onto which sunlight is concentrated by suitable optical systems.
Power range
Plants put into service after 31st December 2010 and before
30th April 2011
Plants put into service after 30th April 2011 and before
31st August 2011
Plants put into service after 31st August 2011 and before
31st December 2011
PV plantson buildings
other PV plants
PV plantson buildings
other PV plants
PV plantson buildings
other PV plants
[kW] [€/kWh] [€/kWh] [€/kWh] [€/kWh] [€/kWh] €/kWh]
1≤P≤3 0.402 0.362 0.391 0.347 0.380 0.333
3<P≤20 0.377 0.339 0.360 0.322 0.342 0.304
20<P≤200 0.358 0.321 0.341 0.309 0.323 0.285
200<P≤1000 0.355 0.314 0.335 0.303 0.314 0.266
1000 <P≤5000 0.351 0.313 0.327 0.289 0.302 0.264
P>5000 0.333 0.297 0.311 0.275 0.287 0.251
7.3 Incentive tariffs after 2010
The Ministerial Decree DM 06/08/2010 defines the incen-tive criteria for the production of electrical energy from the photovoltaic systems which shall be put into service after 31/12/2010. This Decree states that the national target of cumulative PV power to be installed is 8 GW by 2020. In particular, the supply of cumulative power of the PV plants enabled to obtain incentive tariffs is established equal to 3 GW. Besides, the power supply of integrated plants with inno-vative7 characteristics and of concentrated8 solar plants which are entitled to obtain incentive tariffs is 300 MW and 200 MW respectively.The photovoltaic plants with rated power not lower than 1 kW and to be put into service by 31/12/2011 are entitled to the incentive tariff reported in Table 7.2. This tariff is recognized for 20 years and it is constant for all the period in which incentives are provided. As regards the plants to be put into service in 2012 and 2013, they will be entitled to the tariff of Table 7.2 reduced by 6% per year, with rounding off to the 3rd decimal place. A further Ministerial Decree shall update by 31/12/2012 the tariffs for the plants put into service after 31/12/2013. In absence of such decree the above mentioned reduction shall be applied for each year after 2013.
Direct sale is generally made for energy productions of large-size installations of megawatt order; therefore it is not advisable for medium/small-sized PV installations because of both its complexity and onerousness.
7 Feed-in-Tariff

52
Technical Application Papers
Photovoltaic plants
The electrical energy generated by the PV plants inte-grated with innovative characteristics and by the con-centrated solar plants with rated power not lower than 1 kW and not higher than 5 MW to be put into service by 31/12/2011 shall be entitled to the incentive tariff shown in Tables 7.3 and 7.4 respectively. This tariff is recognized for 20 years and it is constant for all the period in which incentives are provided.
As regards the plants to be put into service in 2012 and 2013, they will be entitled to the tariff of Tables 7.3 and 7.4 reduced by 2% per year, with rounding off to the 3rd decimal place. A further Ministerial Decree shall update by 31/12/2012 the tariffs for the plants put into service after 31/12/2013. In absence of such decree the above mentioned reduc-tion shall be applied for each year after 2013.
Table 7.3 Table 7.4
Power range Relevant tariff
[kW] [€/kWh]
1≤P≤200 0.37
200<P≤1000 0.32
P>1000 0.28
Power range Relevant tariff
[kW] [€/kWh]
1≤P≤20 0.44
20<P≤200 0.40
P>200 0.37
7 Feed-in-Tariff
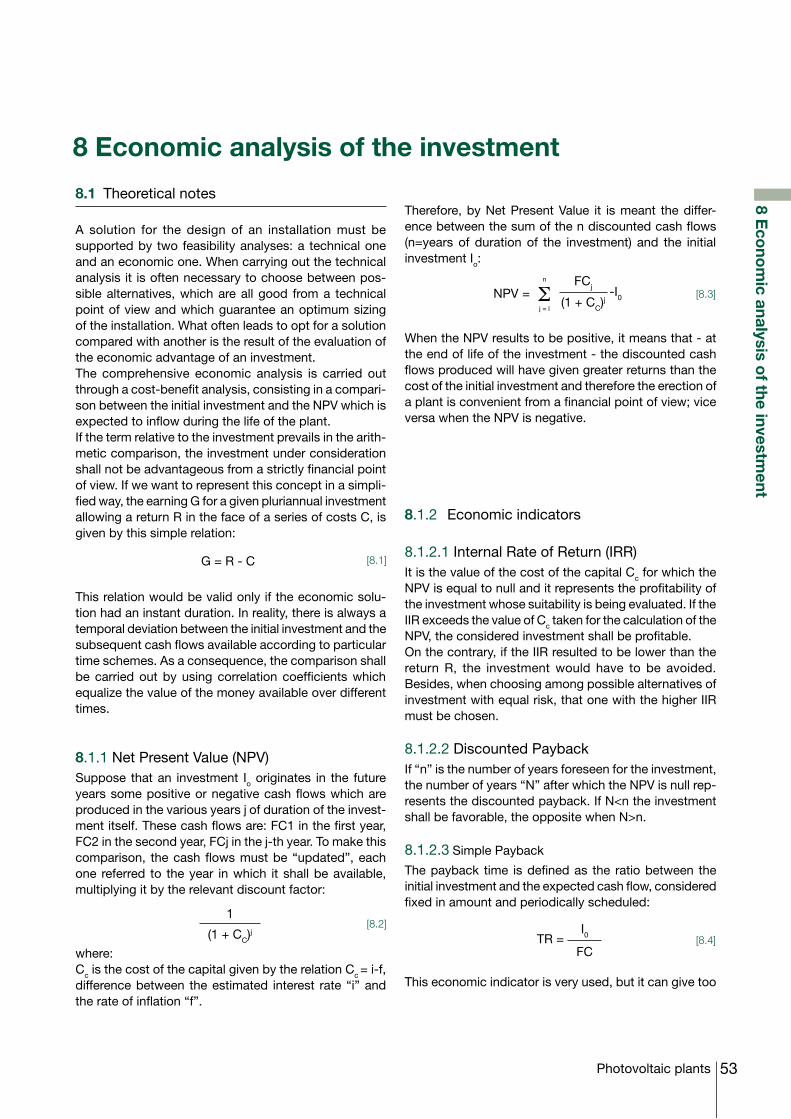
53Photovoltaic plants
8 Eco
nom
ic analysis of the investm
ent
8.1 Theoretical notes
A solution for the design of an installation must be supported by two feasibility analyses: a technical one and an economic one. When carrying out the technical analysis it is often necessary to choose between pos-sible alternatives, which are all good from a technical point of view and which guarantee an optimum sizing of the installation. What often leads to opt for a solution compared with another is the result of the evaluation of the economic advantage of an investment. The comprehensive economic analysis is carried out through a cost-benefit analysis, consisting in a compari-son between the initial investment and the NPV which is expected to inflow during the life of the plant. If the term relative to the investment prevails in the arith-metic comparison, the investment under consideration shall not be advantageous from a strictly financial point of view. If we want to represent this concept in a simpli-fied way, the earning G for a given pluriannual investment allowing a return R in the face of a series of costs C, is given by this simple relation:
G = R - C [8.1]
This relation would be valid only if the economic solu-tion had an instant duration. In reality, there is always a temporal deviation between the initial investment and the subsequent cash flows available according to particular time schemes. As a consequence, the comparison shall be carried out by using correlation coefficients which equalize the value of the money available over different times.
8.1.1 Net Present Value (NPV)Suppose that an investment Io originates in the future years some positive or negative cash flows which are produced in the various years j of duration of the invest-ment itself. These cash flows are: FC1 in the first year, FC2 in the second year, FCj in the j-th year. To make this comparison, the cash flows must be “updated”, each one referred to the year in which it shall be available, multiplying it by the relevant discount factor:
1
(1 + CC)j[8.2]
where:Cc is the cost of the capital given by the relation Cc = i-f, difference between the estimated interest rate “i” and the rate of inflation “f”.
8 Economic analysis of the investment
Therefore, by Net Present Value it is meant the differ-ence between the sum of the n discounted cash flows (n=years of duration of the investment) and the initial investment Io:
NPV =n
Σj = l
FCj -I0(1 + CC)j[8.3]
When the NPV results to be positive, it means that - at the end of life of the investment - the discounted cash flows produced will have given greater returns than the cost of the initial investment and therefore the erection of a plant is convenient from a financial point of view; vice versa when the NPV is negative.
8.1.2 Economic indicators
8.1.2.1 Internal Rate of Return (IRR)It is the value of the cost of the capital Cc for which the NPV is equal to null and it represents the profitability of the investment whose suitability is being evaluated. If the IIR exceeds the value of Cc taken for the calculation of the NPV, the considered investment shall be profitable. On the contrary, if the IIR resulted to be lower than the return R, the investment would have to be avoided. Besides, when choosing among possible alternatives of investment with equal risk, that one with the higher IIR must be chosen.
8.1.2.2 Discounted PaybackIf “n” is the number of years foreseen for the investment, the number of years “N” after which the NPV is null rep-resents the discounted payback. If N<n the investment shall be favorable, the opposite when N>n.
8.1.2.3 Simple Payback
The payback time is defined as the ratio between the initial investment and the expected cash flow, considered fixed in amount and periodically scheduled:
TR = I0
FC[8.4]
This economic indicator is very used, but it can give too
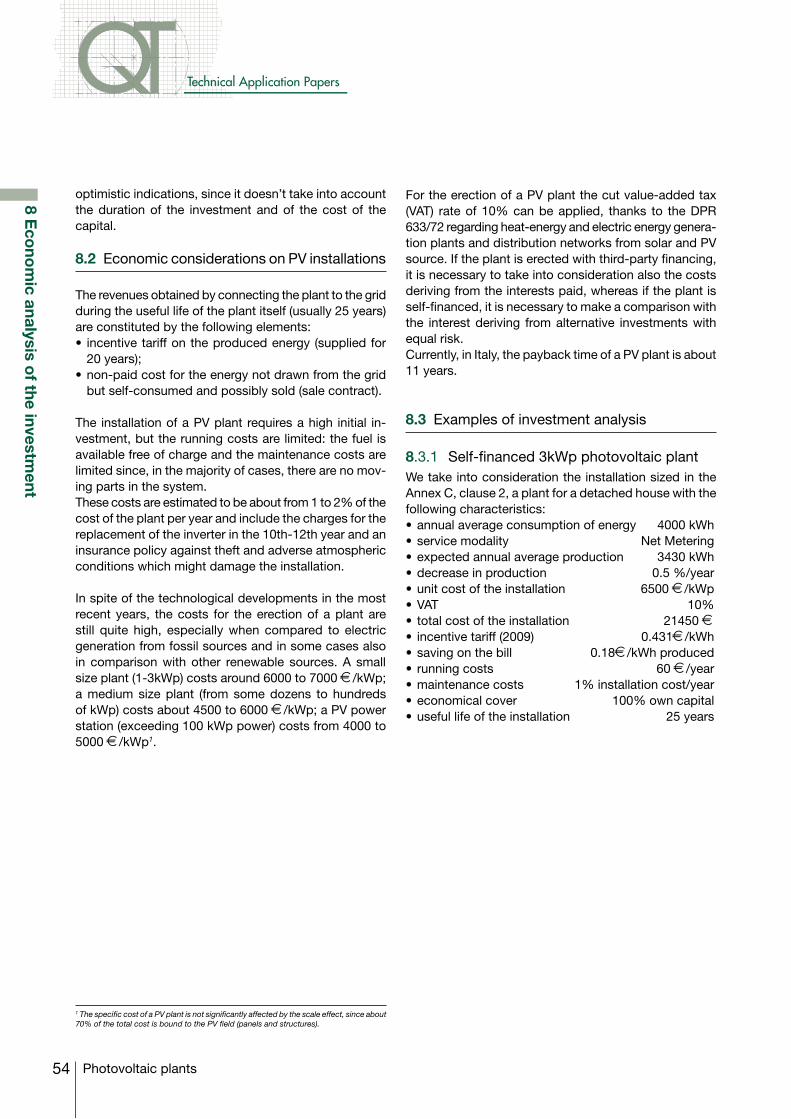
54
Technical Application Papers
Photovoltaic plants
8 Eco
nom
ic analysis of the investm
ent
optimistic indications, since it doesn’t take into account the duration of the investment and of the cost of the capital.
8.2 Economic considerations on PV installations
The revenues obtained by connecting the plant to the grid during the useful life of the plant itself (usually 25 years) are constituted by the following elements:• incentivetariffontheproducedenergy(suppliedfor
20 years);•non-paidcostfortheenergynotdrawnfromthegrid
but self-consumed and possibly sold (sale contract).
The installation of a PV plant requires a high initial in-vestment, but the running costs are limited: the fuel is available free of charge and the maintenance costs are limited since, in the majority of cases, there are no mov-ing parts in the system. These costs are estimated to be about from 1 to 2% of the cost of the plant per year and include the charges for the replacement of the inverter in the 10th-12th year and an insurance policy against theft and adverse atmospheric conditions which might damage the installation.
In spite of the technological developments in the most recent years, the costs for the erection of a plant are still quite high, especially when compared to electric generation from fossil sources and in some cases also in comparison with other renewable sources. A small size plant (1-3kWp) costs around 6000 to 7000 €/kWp; a medium size plant (from some dozens to hundreds of kWp) costs about 4500 to 6000 €/kWp; a PV power station (exceeding 100 kWp power) costs from 4000 to 5000 €/kWp1.
For the erection of a PV plant the cut value-added tax (VAT) rate of 10% can be applied, thanks to the DPR 633/72 regarding heat-energy and electric energy genera-tion plants and distribution networks from solar and PV source. If the plant is erected with third-party financing, it is necessary to take into consideration also the costs deriving from the interests paid, whereas if the plant is self-financed, it is necessary to make a comparison with the interest deriving from alternative investments with equal risk. Currently, in Italy, the payback time of a PV plant is about 11 years.
8.3 Examples of investment analysis
8.3.1 Self-financed 3kWp photovoltaic plantWe take into consideration the installation sized in the Annex C, clause 2, a plant for a detached house with the following characteristics:•annualaverageconsumptionofenergy 4000kWh•servicemodality NetMetering•expectedannualaverageproduction 3430kWh•decreaseinproduction 0.5%/year•unitcostoftheinstallation 6500€/kWp•VAT 10%• totalcostoftheinstallation 21450€• incentivetariff(2009) 0.431€/kWh•savingonthebill 0.18€/kWh produced• runningcosts 60€/year•maintenancecosts 1%installationcost/year•economicalcover 100%owncapital•usefullifeoftheinstallation 25years
1 The specific cost of a PV plant is not significantly affected by the scale effect, since about 70% of the total cost is bound to the PV field (panels and structures).
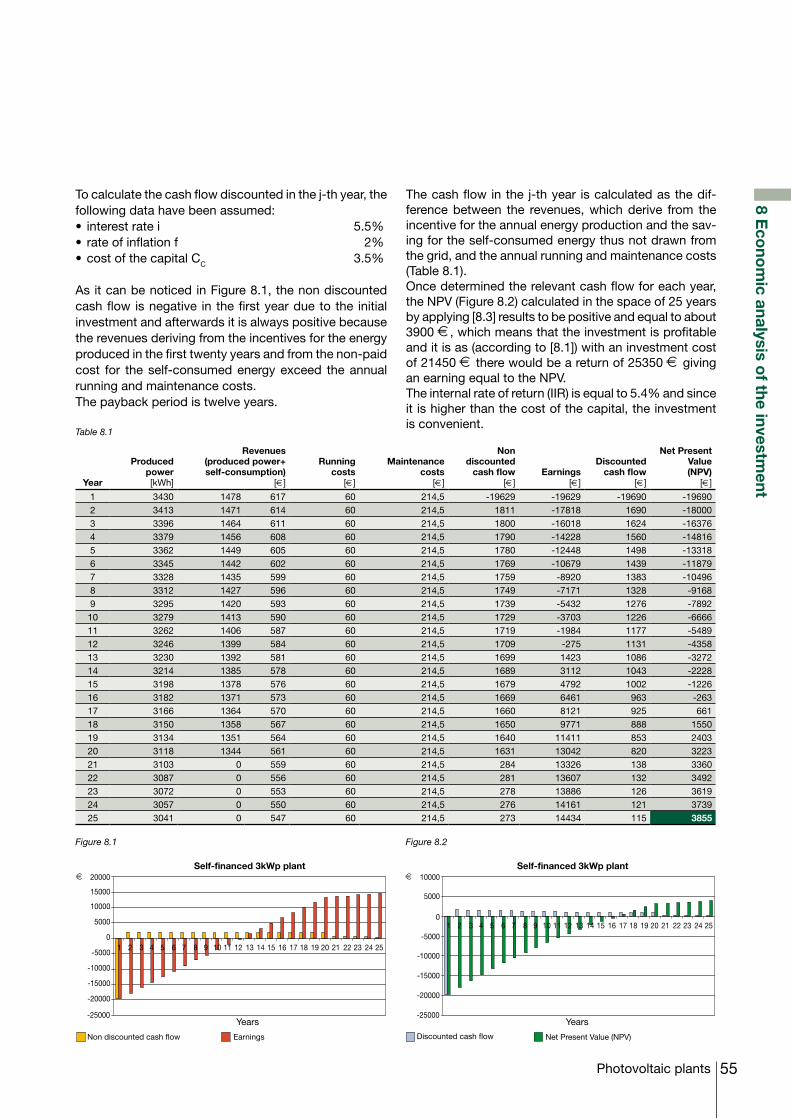
55Photovoltaic plants
8 Eco
nom
ic analysis of the investm
ent
Table 8.1
Figure 8.1 Figure 8.2
Year
Produced power [kWh]
Revenues(produced power+self-consumption)
[€]
Running costs
[€]
Maintenance costs
[€]
Non discounted
cash flow [€]
Earnings [€]
Discounted cash flow
[€]
Net Present Value(NPV)
[€]
1 3430 1478 617 60 214,5 -19629 -19629 -19690 -196902 3413 1471 614 60 214,5 1811 -17818 1690 -180003 3396 1464 611 60 214,5 1800 -16018 1624 -163764 3379 1456 608 60 214,5 1790 -14228 1560 -148165 3362 1449 605 60 214,5 1780 -12448 1498 -133186 3345 1442 602 60 214,5 1769 -10679 1439 -118797 3328 1435 599 60 214,5 1759 -8920 1383 -104968 3312 1427 596 60 214,5 1749 -7171 1328 -91689 3295 1420 593 60 214,5 1739 -5432 1276 -789210 3279 1413 590 60 214,5 1729 -3703 1226 -666611 3262 1406 587 60 214,5 1719 -1984 1177 -548912 3246 1399 584 60 214,5 1709 -275 1131 -435813 3230 1392 581 60 214,5 1699 1423 1086 -327214 3214 1385 578 60 214,5 1689 3112 1043 -222815 3198 1378 576 60 214,5 1679 4792 1002 -122616 3182 1371 573 60 214,5 1669 6461 963 -26317 3166 1364 570 60 214,5 1660 8121 925 66118 3150 1358 567 60 214,5 1650 9771 888 155019 3134 1351 564 60 214,5 1640 11411 853 240320 3118 1344 561 60 214,5 1631 13042 820 322321 3103 0 559 60 214,5 284 13326 138 336022 3087 0 556 60 214,5 281 13607 132 349223 3072 0 553 60 214,5 278 13886 126 361924 3057 0 550 60 214,5 276 14161 121 373925 3041 0 547 60 214,5 273 14434 115 3855
To calculate the cash flow discounted in the j-th year, the following data have been assumed:• interestratei 5.5%• rateofinflationf 2%•costofthecapitalCC 3.5%
As it can be noticed in Figure 8.1, the non discounted cash flow is negative in the first year due to the initial investment and afterwards it is always positive because the revenues deriving from the incentives for the energy produced in the first twenty years and from the non-paid cost for the self-consumed energy exceed the annual running and maintenance costs.The payback period is twelve years.
The cash flow in the j-th year is calculated as the dif-ference between the revenues, which derive from the incentive for the annual energy production and the sav-ing for the self-consumed energy thus not drawn from the grid, and the annual running and maintenance costs (Table 8.1). Once determined the relevant cash flow for each year, the NPV (Figure 8.2) calculated in the space of 25 years by applying [8.3] results to be positive and equal to about 3900 €, which means that the investment is profitable and it is as (according to [8.1]) with an investment cost of 21450 € there would be a return of 25350 € giving an earning equal to the NPV.The internal rate of return (IIR) is equal to 5.4% and since it is higher than the cost of the capital, the investment is convenient.
Self-financed 3kWp plant
Non discounted cash flow Earnings
Years
20000
-25000
15000
10000
5000
0
-5000
-10000
-15000
-20000
1 2 3 4 5 6 7 8 9 10 11 12 13 14 15 16 17 18 19 20 21 22 23 24 25
Self-financed 3kWp plant
Discounted cash flow
Years
10000
-25000
5000
0
-5000
-10000
-15000
-20000
1 2 3 4 5 6 7 8 9 10 11 12 13 14 15 16 17 18 19 20 21 22 23 24 25
Net Present Value (NPV)
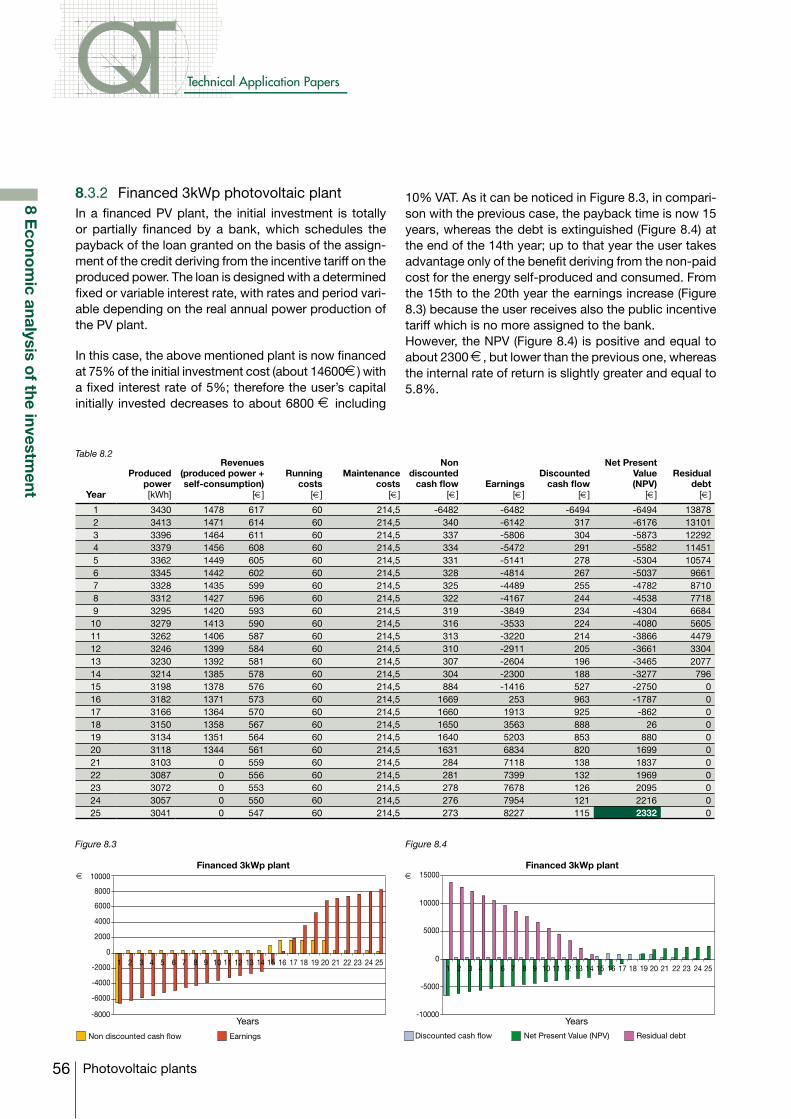
56
Technical Application Papers
Photovoltaic plants
8 Eco
nom
ic analysis of the investm
ent
Year
Produced power [kWh]
Revenues(produced power +self-consumption)
[€]
Runningcosts
[€]
Maintenance costs
[€]
Non discounted
cash flow [€]
Earnings[€]
Discounted cash flow
[€]
Net Present Value(NPV)
[€]
Residual debt
[€]
1 3430 1478 617 60 214,5 -6482 -6482 -6494 -6494 138782 3413 1471 614 60 214,5 340 -6142 317 -6176 131013 3396 1464 611 60 214,5 337 -5806 304 -5873 122924 3379 1456 608 60 214,5 334 -5472 291 -5582 114515 3362 1449 605 60 214,5 331 -5141 278 -5304 105746 3345 1442 602 60 214,5 328 -4814 267 -5037 96617 3328 1435 599 60 214,5 325 -4489 255 -4782 87108 3312 1427 596 60 214,5 322 -4167 244 -4538 77189 3295 1420 593 60 214,5 319 -3849 234 -4304 6684
10 3279 1413 590 60 214,5 316 -3533 224 -4080 560511 3262 1406 587 60 214,5 313 -3220 214 -3866 447912 3246 1399 584 60 214,5 310 -2911 205 -3661 330413 3230 1392 581 60 214,5 307 -2604 196 -3465 207714 3214 1385 578 60 214,5 304 -2300 188 -3277 79615 3198 1378 576 60 214,5 884 -1416 527 -2750 016 3182 1371 573 60 214,5 1669 253 963 -1787 017 3166 1364 570 60 214,5 1660 1913 925 -862 018 3150 1358 567 60 214,5 1650 3563 888 26 019 3134 1351 564 60 214,5 1640 5203 853 880 020 3118 1344 561 60 214,5 1631 6834 820 1699 021 3103 0 559 60 214,5 284 7118 138 1837 022 3087 0 556 60 214,5 281 7399 132 1969 023 3072 0 553 60 214,5 278 7678 126 2095 024 3057 0 550 60 214,5 276 7954 121 2216 025 3041 0 547 60 214,5 273 8227 115 2332 0
Table 8.2
Figure 8.3 Figure 8.4
8.3.2 Financed 3kWp photovoltaic plant In a financed PV plant, the initial investment is totally or partially financed by a bank, which schedules the payback of the loan granted on the basis of the assign-ment of the credit deriving from the incentive tariff on the produced power. The loan is designed with a determined fixed or variable interest rate, with rates and period vari-able depending on the real annual power production of the PV plant.
In this case, the above mentioned plant is now financed at 75% of the initial investment cost (about 14600€) with a fixed interest rate of 5%; therefore the user’s capital initially invested decreases to about 6800 € including
10% VAT. As it can be noticed in Figure 8.3, in compari-son with the previous case, the payback time is now 15 years, whereas the debt is extinguished (Figure 8.4) at the end of the 14th year; up to that year the user takes advantage only of the benefit deriving from the non-paid cost for the energy self-produced and consumed. From the 15th to the 20th year the earnings increase (Figure 8.3) because the user receives also the public incentive tariff which is no more assigned to the bank.However, the NPV (Figure 8.4) is positive and equal to about 2300 €, but lower than the previous one, whereas the internal rate of return is slightly greater and equal to 5.8%.
Financed 3kWp plant
Non discounted cash flow Earnings
Years
10000
-8000
8000
6000
4000
2000
0
-2000
-4000
-6000
1 2 3 4 5 6 7 8 9 10 11 12 13 14 15 16 17 18 19 20 21 22 23 24 25
Financed 3kWp plant
Discounted cash flow Net Present Value (NPV)
Years-10000
15000
10000
5000
0
-5000
Residual debt
1 2 3 4 5 6 7 8 9 10 11 12 13 14 15 16 17 18 19 20 21 22 23 24 25
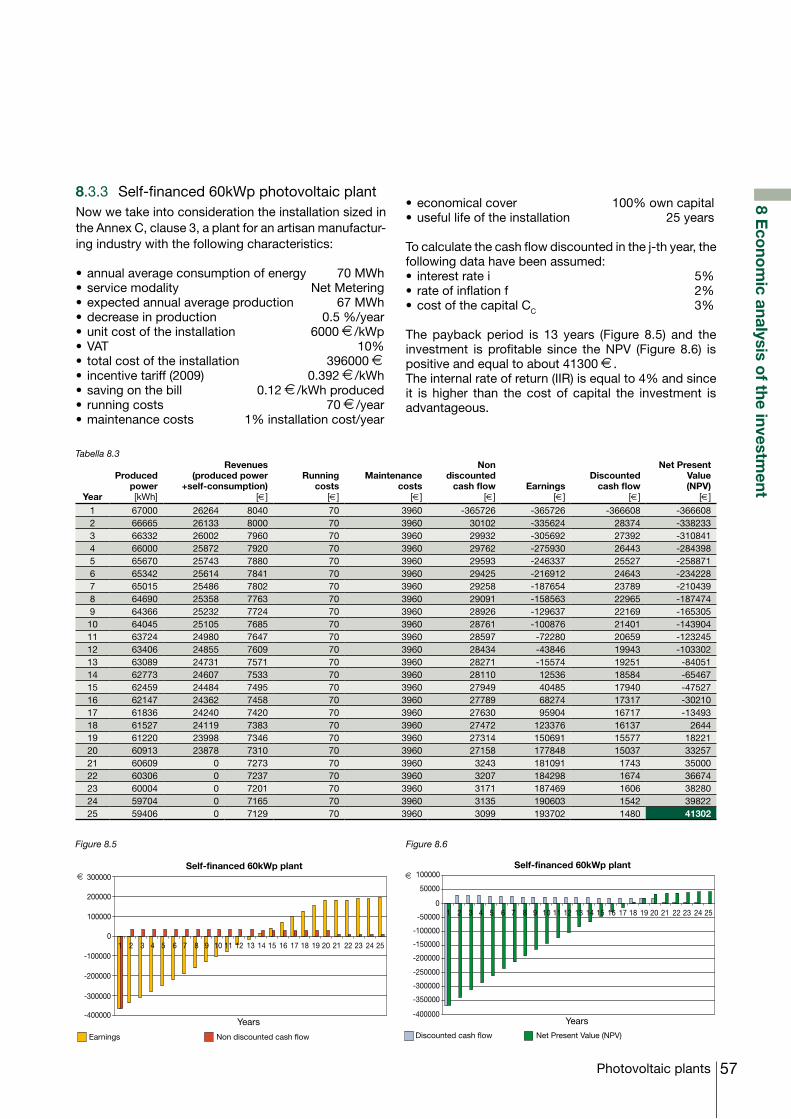
57Photovoltaic plants
8 Eco
nom
ic analysis of the investm
ent
Tabella 8.3
Figure 8.5 Figure 8.6
8.3.3 Self-financed 60kWp photovoltaic plantNow we take into consideration the installation sized in the Annex C, clause 3, a plant for an artisan manufactur-ing industry with the following characteristics:
•annualaverageconsumptionofenergy 70MWh•servicemodality NetMetering•expectedannualaverageproduction 67MWh•decreaseinproduction 0.5%/year•unitcostoftheinstallation 6000€/kWp•VAT 10%• totalcostoftheinstallation 396000€• incentivetariff(2009) 0.392€/kWh•savingonthebill 0.12€/kWh produced• runningcosts 70€/year•maintenancecosts 1%installationcost/year
•economicalcover 100%owncapital•usefullifeoftheinstallation 25years
To calculate the cash flow discounted in the j-th year, the following data have been assumed:• interestratei 5%• rateofinflationf 2%•costofthecapitalCC 3%
The payback period is 13 years (Figure 8.5) and the investment is profitable since the NPV (Figure 8.6) is positive and equal to about 41300 €.The internal rate of return (IIR) is equal to 4% and since it is higher than the cost of capital the investment is advantageous.
Year
Produced power [kWh]
Revenues(produced power
+self-consumption) [€]
Running costs
[€]
Maintenance costs
[€]
Non discounted
cash flow [€]
Earnings [€]
Discounted cash flow
[€]
Net Present Value(NPV)
[€]
1 67000 26264 8040 70 3960 -365726 -365726 -366608 -3666082 66665 26133 8000 70 3960 30102 -335624 28374 -3382333 66332 26002 7960 70 3960 29932 -305692 27392 -3108414 66000 25872 7920 70 3960 29762 -275930 26443 -2843985 65670 25743 7880 70 3960 29593 -246337 25527 -2588716 65342 25614 7841 70 3960 29425 -216912 24643 -2342287 65015 25486 7802 70 3960 29258 -187654 23789 -2104398 64690 25358 7763 70 3960 29091 -158563 22965 -1874749 64366 25232 7724 70 3960 28926 -129637 22169 -165305
10 64045 25105 7685 70 3960 28761 -100876 21401 -14390411 63724 24980 7647 70 3960 28597 -72280 20659 -12324512 63406 24855 7609 70 3960 28434 -43846 19943 -10330213 63089 24731 7571 70 3960 28271 -15574 19251 -8405114 62773 24607 7533 70 3960 28110 12536 18584 -6546715 62459 24484 7495 70 3960 27949 40485 17940 -4752716 62147 24362 7458 70 3960 27789 68274 17317 -3021017 61836 24240 7420 70 3960 27630 95904 16717 -1349318 61527 24119 7383 70 3960 27472 123376 16137 264419 61220 23998 7346 70 3960 27314 150691 15577 1822120 60913 23878 7310 70 3960 27158 177848 15037 3325721 60609 0 7273 70 3960 3243 181091 1743 3500022 60306 0 7237 70 3960 3207 184298 1674 3667423 60004 0 7201 70 3960 3171 187469 1606 3828024 59704 0 7165 70 3960 3135 190603 1542 3982225 59406 0 7129 70 3960 3099 193702 1480 41302
Self-financed 60kWp plant
Earnings Non discounted cash flow
Years
300000
200000
100000
0
-100000
-200000
-300000
-400000
1 2 3 4 5 6 7 8 9 10 11 12 13 14 15 16 17 18 19 20 21 22 23 24 25
Self-financed 60kWp plant
Discounted cash flow Net Present Value (NPV)
Years-400000
100000
50000
-50000
0
-100000
-150000
-200000
-250000
-300000
-350000
1 2 3 4 5 6 7 8 9 10 11 12 13 14 15 16 17 18 19 20 21 22 23 24 25
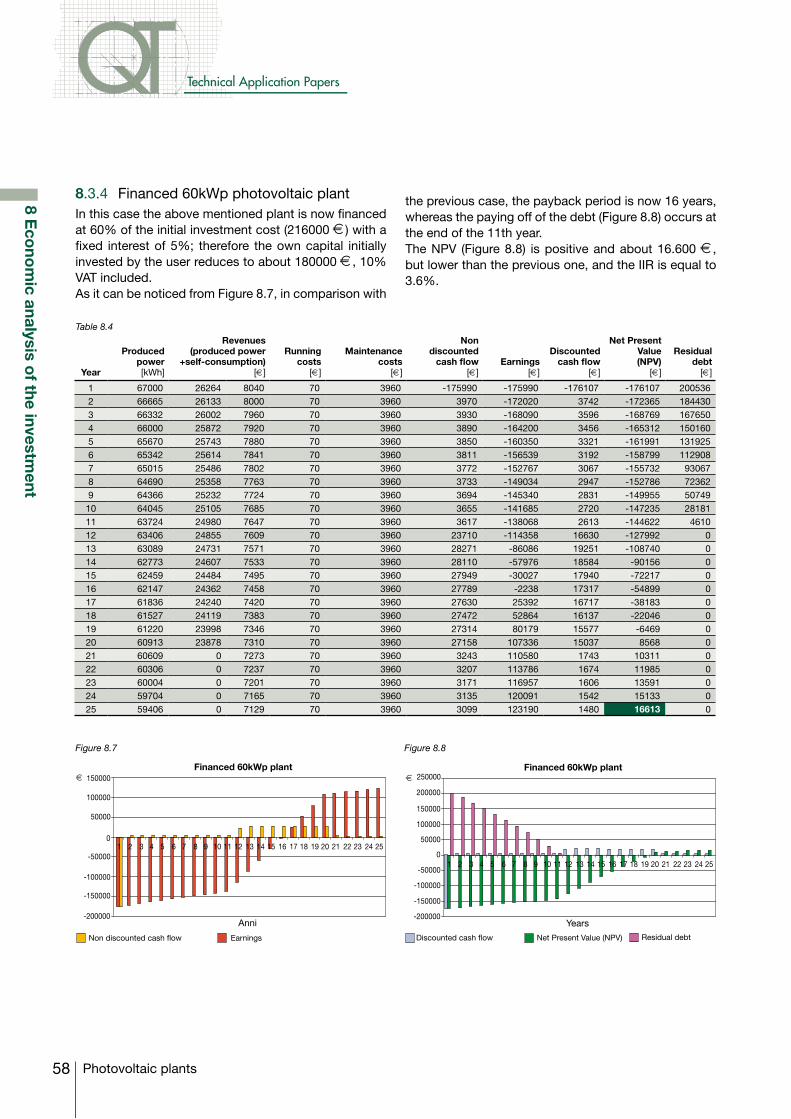
58
Technical Application Papers
Photovoltaic plants
8.3.4 Financed 60kWp photovoltaic plantIn this case the above mentioned plant is now financed at 60% of the initial investment cost (216000 €) with a fixed interest of 5%; therefore the own capital initially invested by the user reduces to about 180000 €, 10% VAT included.As it can be noticed from Figure 8.7, in comparison with
the previous case, the payback period is now 16 years, whereas the paying off of the debt (Figure 8.8) occurs at the end of the 11th year.The NPV (Figure 8.8) is positive and about 16.600 €, but lower than the previous one, and the IIR is equal to 3.6%.
Year
Produced power [kWh]
Revenues(produced power
+self-consumption)[€]
Runningcosts
[€]
Maintenance costs
[€]
Non discounted
cash flow [€]
Earnings[€]
Discounted cash flow
[€]
Net Present Value(NPV)
[€]
Residual debt
[€]
1 67000 26264 8040 70 3960 -175990 -175990 -176107 -176107 2005362 66665 26133 8000 70 3960 3970 -172020 3742 -172365 1844303 66332 26002 7960 70 3960 3930 -168090 3596 -168769 1676504 66000 25872 7920 70 3960 3890 -164200 3456 -165312 1501605 65670 25743 7880 70 3960 3850 -160350 3321 -161991 1319256 65342 25614 7841 70 3960 3811 -156539 3192 -158799 1129087 65015 25486 7802 70 3960 3772 -152767 3067 -155732 930678 64690 25358 7763 70 3960 3733 -149034 2947 -152786 723629 64366 25232 7724 70 3960 3694 -145340 2831 -149955 5074910 64045 25105 7685 70 3960 3655 -141685 2720 -147235 2818111 63724 24980 7647 70 3960 3617 -138068 2613 -144622 461012 63406 24855 7609 70 3960 23710 -114358 16630 -127992 013 63089 24731 7571 70 3960 28271 -86086 19251 -108740 014 62773 24607 7533 70 3960 28110 -57976 18584 -90156 015 62459 24484 7495 70 3960 27949 -30027 17940 -72217 016 62147 24362 7458 70 3960 27789 -2238 17317 -54899 017 61836 24240 7420 70 3960 27630 25392 16717 -38183 018 61527 24119 7383 70 3960 27472 52864 16137 -22046 019 61220 23998 7346 70 3960 27314 80179 15577 -6469 020 60913 23878 7310 70 3960 27158 107336 15037 8568 021 60609 0 7273 70 3960 3243 110580 1743 10311 022 60306 0 7237 70 3960 3207 113786 1674 11985 023 60004 0 7201 70 3960 3171 116957 1606 13591 024 59704 0 7165 70 3960 3135 120091 1542 15133 025 59406 0 7129 70 3960 3099 123190 1480 16613 0
Table 8.4
8 Eco
nom
ic analysis of the investm
entFigure 8.7 Figure 8.8
Financed 60kWp plant
EarningsNon discounted cash flow
Anni
150000
-200000
100000
50000
0
-50000
-100000
-150000
1 2 3 4 5 6 7 8 9 10 11 12 13 14 15 16 17 18 19 20 21 22 23 24 25
Financed 60kWp plant
Discounted cash flow Net Present Value (NPV)
Years-200000
250000
200000
150000
100000
50000
0
-50000
-100000
-150000
Residual debt
1 2 3 4 5 6 7 8 9 10 11 12 13 14 15 16 17 18 19 20 21 22 23 24 25
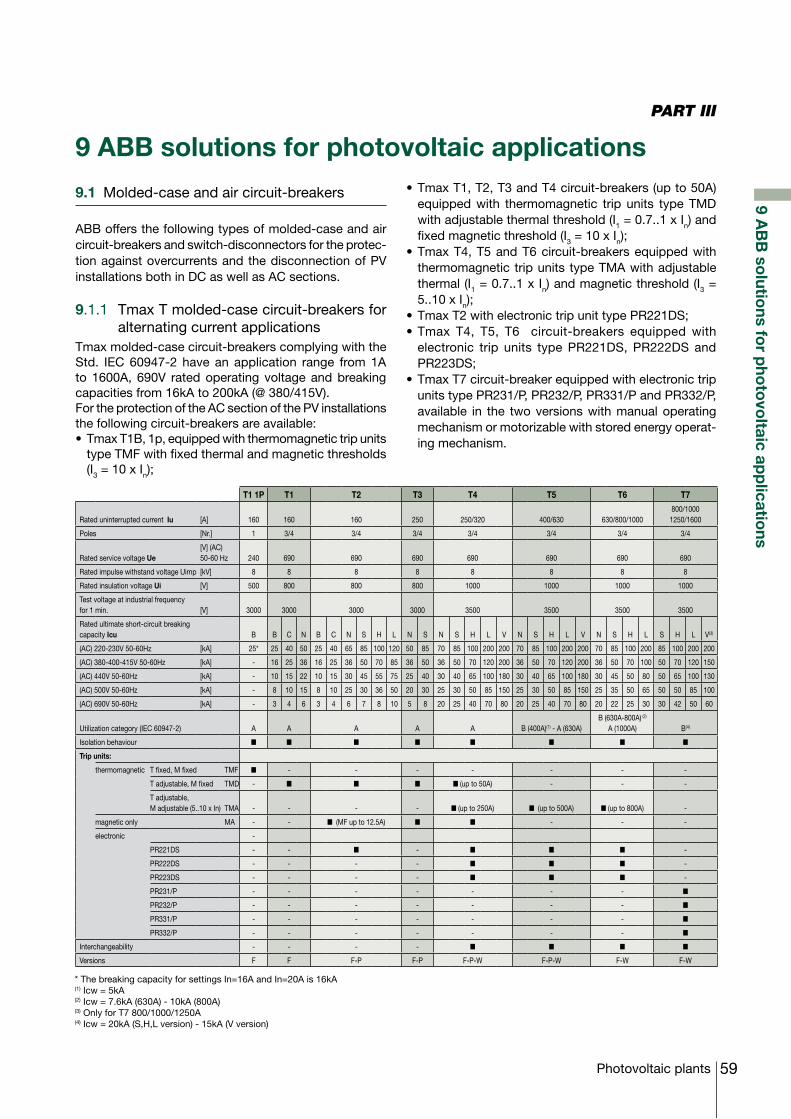
59Photovoltaic plants
9 AB
B so
lutions fo
r pho
tovo
ltaic app
lications
9.1 Molded-case and air circuit-breakers
ABB offers the following types of molded-case and air circuit-breakers and switch-disconnectors for the protec-tion against overcurrents and the disconnection of PV installations both in DC as well as AC sections.
9.1.1 Tmax T molded-case circuit-breakers for alternating current applications
Tmax molded-case circuit-breakers complying with the Std. IEC 60947-2 have an application range from 1A to 1600A, 690V rated operating voltage and breaking capacities from 16kA to 200kA (@ 380/415V).For the protection of the AC section of the PV installations the following circuit-breakers are available:•TmaxT1B,1p,equippedwiththermomagnetictripunits
type TMF with fixed thermal and magnetic thresholds (I3 = 10 x In);
9 ABB solutions for photovoltaic applications
PART III
•TmaxT1,T2,T3andT4circuit-breakers(upto50A)equipped with thermomagnetic trip units type TMD with adjustable thermal threshold (I1 = 0.7..1 x In) and fixed magnetic threshold (I3 = 10 x In);
•TmaxT4,T5andT6circuit-breakersequippedwiththermomagnetic trip units type TMA with adjustable thermal (I1 = 0.7..1 x In) and magnetic threshold (I3 = 5..10 x In);
•TmaxT2withelectronictripunittypePR221DS;•Tmax T4, T5, T6 circuit-breakers equippedwith
electronic trip units type PR221DS, PR222DS and PR223DS;
•TmaxT7circuit-breakerequippedwithelectronictripunits type PR231/P, PR232/P, PR331/P and PR332/P, available in the two versions with manual operating mechanism or motorizable with stored energy operat-ing mechanism.
T1 1P T1 T2 T3 T4 T5 T6 T7
Rated uninterrupted current Iu [A] 160 160 160 250 250/320 400/630 630/800/1000800/10001250/1600
Poles [Nr.] 1 3/4 3/4 3/4 3/4 3/4 3/4 3/4
Rated service voltage Ue[V] (AC) 50-60 Hz 240 690 690 690 690 690 690 690
Rated impulse withstand voltage Uimp [kV] 8 8 8 8 8 8 8 8
Rated insulation voltage Ui [V] 500 800 800 800 1000 1000 1000 1000
Test voltage at industrial frequency for 1 min. [V] 3000 3000 3000 3000 3500 3500 3500 3500
Rated ultimate short-circuit breaking capacity Icu B B C N B C N S H L N S N S H L V N S H L V N S H L S H L V(3)
(AC) 220-230V 50-60Hz [kA] 25* 25 40 50 25 40 65 85 100 120 50 85 70 85 100 200 200 70 85 100 200 200 70 85 100 200 85 100 200 200
(AC) 380-400-415V 50-60Hz [kA] - 16 25 36 16 25 36 50 70 85 36 50 36 50 70 120 200 36 50 70 120 200 36 50 70 100 50 70 120 150
(AC) 440V 50-60Hz [kA] - 10 15 22 10 15 30 45 55 75 25 40 30 40 65 100 180 30 40 65 100 180 30 45 50 80 50 65 100 130
(AC) 500V 50-60Hz [kA] - 8 10 15 8 10 25 30 36 50 20 30 25 30 50 85 150 25 30 50 85 150 25 35 50 65 50 50 85 100
(AC) 690V 50-60Hz [kA] - 3 4 6 3 4 6 7 8 10 5 8 20 25 40 70 80 20 25 40 70 80 20 22 25 30 30 42 50 60
Utilization category (IEC 60947-2) A A A A A B (400A)(1) - A (630A)B (630A-800A) (2)
A (1000A) B(4)
Isolation behaviour n n n n n n n n
Trip units:
thermomagnetic T fixed, M fixed TMF n - - - - - - -
T adjustable, M fixed TMD - n n n n (up to 50A) - - -
T adjustable, M adjustable (5..10 x In) TMA - - - - n (up to 250A) n (up to 500A) n (up to 800A) -
magnetic only MA - - n (MF up to 12.5A) n n - - -
electronic -
PR221DS - - n - n n n -
PR222DS - - - - n n n -
PR223DS - - - - n n n -
PR231/P - - - - - - - n
PR232/P - - - - - - - n
PR331/P - - - - - - - n
PR332/P - - - - - - - n
Interchangeability - - - - n n n n
Versions F F F-P F-P F-P-W F-P-W F-W F-W
* The breaking capacity for settings In=16A and In=20A is 16kA(1) Icw = 5kA(2) Icw = 7.6kA (630A) - 10kA (800A)(3) Only for T7 800/1000/1250A(4) Icw = 20kA (S,H,L version) - 15kA (V version)
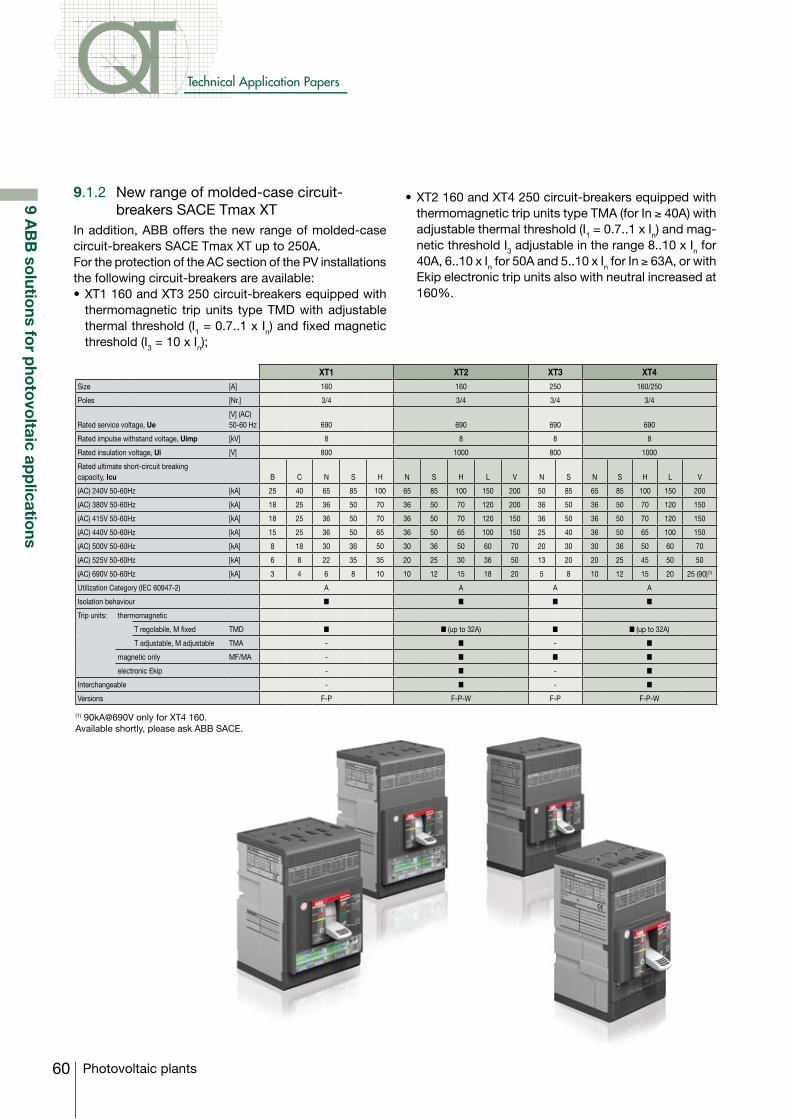
60
Technical Application Papers
Photovoltaic plants
9 AB
B so
lutions fo
r pho
tovo
ltaic app
lications
9.1.2 New range of molded-case circuit-breakers SACE Tmax XT
In addition, ABB offers the new range of molded-case circuit-breakers SACE Tmax XT up to 250A. For the protection of the AC section of the PV installations the following circuit-breakers are available:•XT1160andXT3250circuit-breakersequippedwith
thermomagnetic trip units type TMD with adjustable thermal threshold (I1 = 0.7..1 x In) and fixed magnetic threshold (I3 = 10 x In);
•XT2160andXT4250circuit-breakersequippedwiththermomagnetic trip units type TMA (for In ≥ 40A) with adjustable thermal threshold (I1 = 0.7..1 x In) and mag-netic threshold I3 adjustable in the range 8..10 x In for 40A, 6..10 x In for 50A and 5..10 x In for In ≥ 63A, or with Ekip electronic trip units also with neutral increased at 160%.
XT1 XT2 XT3 XT4Size [A] 160 160 250 160/250
Poles [Nr.] 3/4 3/4 3/4 3/4
Rated service voltage, Ue[V] (AC) 50-60 Hz 690 690 690 690
Rated impulse withstand voltage, Uimp [kV] 8 8 8 8
Rated insulation voltage, Ui [V] 800 1000 800 1000
Rated ultimate short-circuit breaking capacity, Icu B C N S H N S H L V N S N S H L V
(AC) 240V 50-60Hz [kA] 25 40 65 85 100 65 85 100 150 200 50 85 65 85 100 150 200
(AC) 380V 50-60Hz [kA] 18 25 36 50 70 36 50 70 120 200 36 50 36 50 70 120 150
(AC) 415V 50-60Hz [kA] 18 25 36 50 70 36 50 70 120 150 36 50 36 50 70 120 150
(AC) 440V 50-60Hz [kA] 15 25 36 50 65 36 50 65 100 150 25 40 36 50 65 100 150
(AC) 500V 50-60Hz [kA] 8 18 30 36 50 30 36 50 60 70 20 30 30 36 50 60 70
(AC) 525V 50-60Hz [kA] 6 8 22 35 35 20 25 30 36 50 13 20 20 25 45 50 50
(AC) 690V 50-60Hz [kA] 3 4 6 8 10 10 12 15 18 20 5 8 10 12 15 20 25 (90)(1)
Utilization Category (IEC 60947-2) A A A A
Isolation behaviour n n n n
Trip units: thermomagnetic
T regolabile, M fixed TMD n n (up to 32A) n n (up to 32A)
T adjustable, M adjustable TMA - n - n
magnetic only MF/MA - n n n
electronic Ekip - n - n
Interchangeable - n - n
Versions F-P F-P-W F-P F-P-W
(1) 90kA@690V only for XT4 160. Available shortly, please ask ABB SACE.
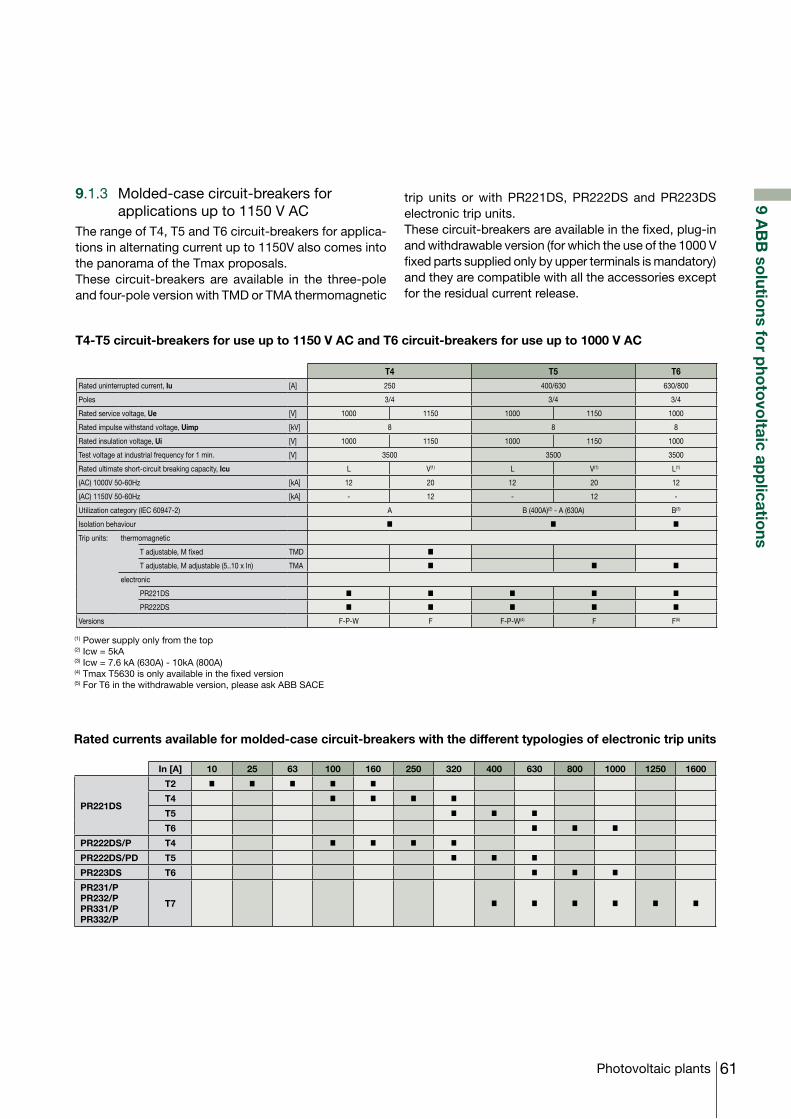
61Photovoltaic plants
9 AB
B so
lutions fo
r pho
tovo
ltaic app
lications
9.1.3 Molded-case circuit-breakers for applications up to 1150 V AC
The range of T4, T5 and T6 circuit-breakers for applica-tions in alternating current up to 1150V also comes into the panorama of the Tmax proposals.These circuit-breakers are available in the three-pole and four-pole version with TMD or TMA thermomagnetic
trip units or with PR221DS, PR222DS and PR223DS electronic trip units.These circuit-breakers are available in the fixed, plug-in and withdrawable version (for which the use of the 1000 V fixed parts supplied only by upper terminals is mandatory) and they are compatible with all the accessories except for the residual current release.
T4-T5 circuit-breakers for use up to 1150 V AC and T6 circuit-breakers for use up to 1000 V AC
(1) Power supply only from the top(2) Icw = 5kA(3) Icw = 7.6 kA (630A) - 10kA (800A)(4) Tmax T5630 is only available in the fixed version(5) For T6 in the withdrawable version, please ask ABB SACE
In [A] 10 25 63 100 160 250 320 400 630 800 1000 1250 1600
PR221DS
T2 n n n n n
T4 n n n n
T5 n n n
T6 n n n
PR222DS/P T4 n n n n
PR222DS/PD T5 n n n
PR223DS T6 n n n
PR231/PPR232/PPR331/PPR332/P
T7 n n n n n n
Rated currents available for molded-case circuit-breakers with the different typologies of electronic trip units
T4 T5 T6Rated uninterrupted current, Iu [A] 250 400/630 630/800
Poles 3/4 3/4 3/4
Rated service voltage, Ue [V] 1000 1150 1000 1150 1000
Rated impulse withstand voltage, Uimp [kV] 8 8 8
Rated insulation voltage, Ui [V] 1000 1150 1000 1150 1000
Test voltage at industrial frequency for 1 min. [V] 3500 3500 3500
Rated ultimate short-circuit breaking capacity, Icu L V(1) L V(1) L(1)
(AC) 1000V 50-60Hz [kA] 12 20 12 20 12
(AC) 1150V 50-60Hz [kA] - 12 - 12 -
Utilization category (IEC 60947-2) A B (400A)(2) - A (630A) B(3)
Isolation behaviour n n n
Trip units: thermomagnetic
T adjustable, M fixed TMD n
T adjustable, M adjustable (5..10 x In) TMA n n n
electronic
PR221DS n n n n n
PR222DS n n n n n
Versions F-P-W F F-P-W(4) F F(5)
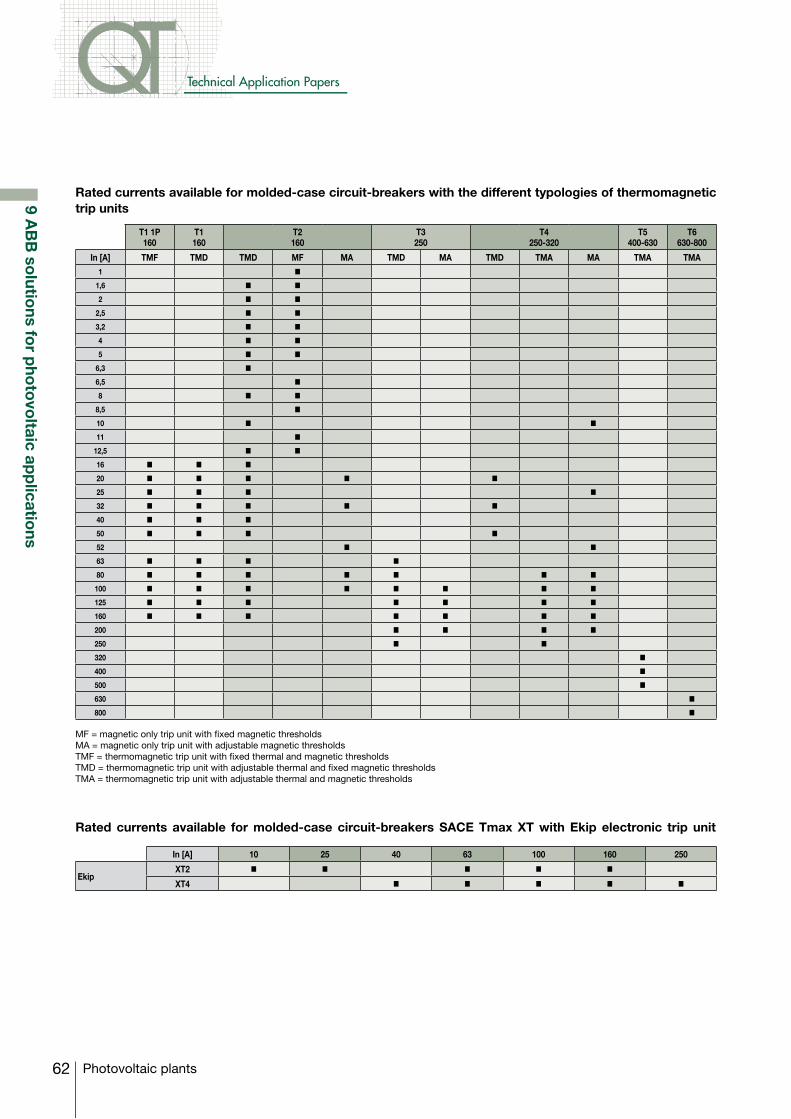
62
Technical Application Papers
Photovoltaic plants
9 AB
B so
lutions fo
r pho
tovo
ltaic app
lications
T1 1P160
T1160
T2160
T3250
T4250-320
T5400-630
T6630-800
In [A] TMF TMD TMD MF MA TMD MA TMD TMA MA TMA TMA1 n
1,6 n n
2 n n
2,5 n n
3,2 n n
4 n n
5 n n
6,3 n
6,5 n
8 n n
8,5 n
10 n n
11 n
12,5 n n
16 n n n
20 n n n n n
25 n n n n
32 n n n n n
40 n n n
50 n n n n
52 n n
63 n n n n
80 n n n n n n n
100 n n n n n n n n
125 n n n n n n n
160 n n n n n n n
200 n n n n
250 n n
320 n
400 n
500 n
630 n
800 n
Rated currents available for molded-case circuit-breakers with the different typologies of thermomagnetic trip units
MF = magnetic only trip unit with fixed magnetic thresholds MA = magnetic only trip unit with adjustable magnetic thresholds TMF = thermomagnetic trip unit with fixed thermal and magnetic thresholds TMD = thermomagnetic trip unit with adjustable thermal and fixed magnetic thresholds TMA = thermomagnetic trip unit with adjustable thermal and magnetic thresholds
Rated currents available for molded-case circuit-breakers SACE Tmax XT with Ekip electronic trip unit
In [A] 10 25 40 63 100 160 250
EkipXT2 n n n n n
XT4 n n n n n
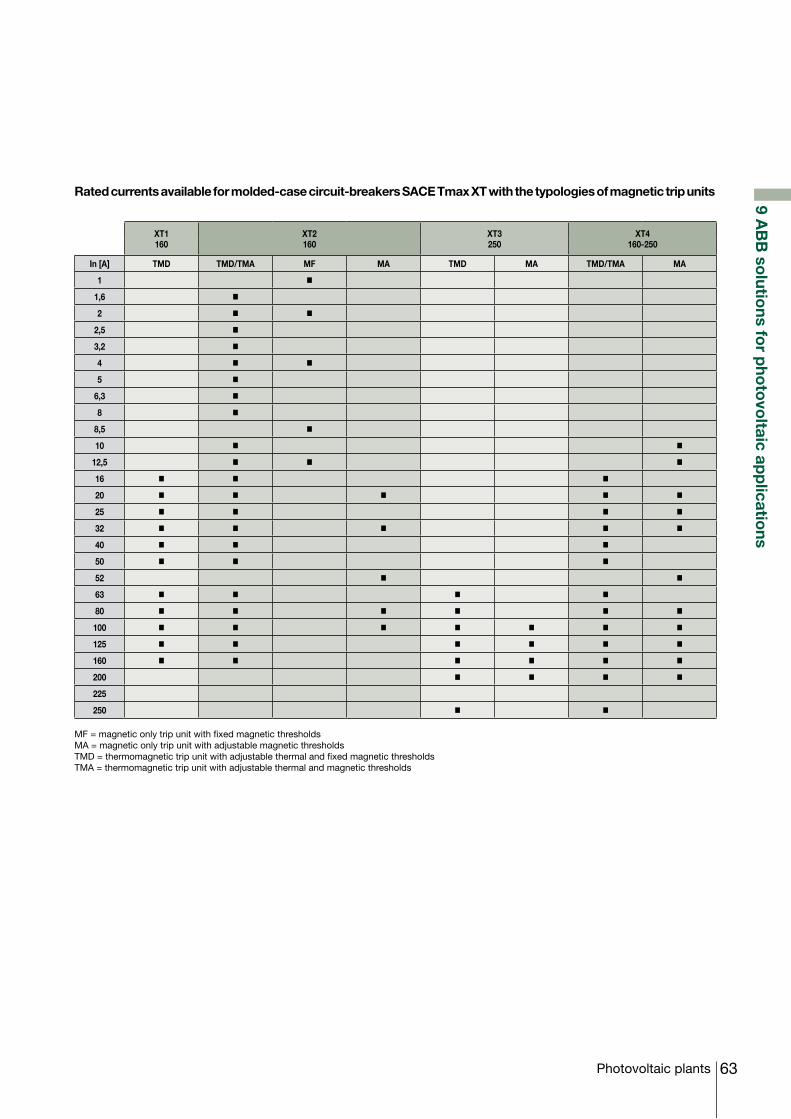
63Photovoltaic plants
9 AB
B so
lutions fo
r pho
tovo
ltaic app
lications
Rated currents available for molded-case circuit-breakers SACE Tmax XT with the typologies of magnetic trip units
XT1160
XT2160
XT3250
XT4160-250
In [A] TMD TMD/TMA MF MA TMD MA TMD/TMA MA
1 n
1,6 n
2 n n
2,5 n
3,2 n
4 n n
5 n
6,3 n
8 n
8,5 n
10 n n
12,5 n n n
16 n n n
20 n n n n n
25 n n n n
32 n n n n n
40 n n n
50 n n n
52 n n
63 n n n n
80 n n n n n n
100 n n n n n n n
125 n n n n n n
160 n n n n n n
200 n n n n
225
250 n n
MF = magnetic only trip unit with fixed magnetic thresholds MA = magnetic only trip unit with adjustable magnetic thresholds TMD = thermomagnetic trip unit with adjustable thermal and fixed magnetic thresholds TMA = thermomagnetic trip unit with adjustable thermal and magnetic thresholds
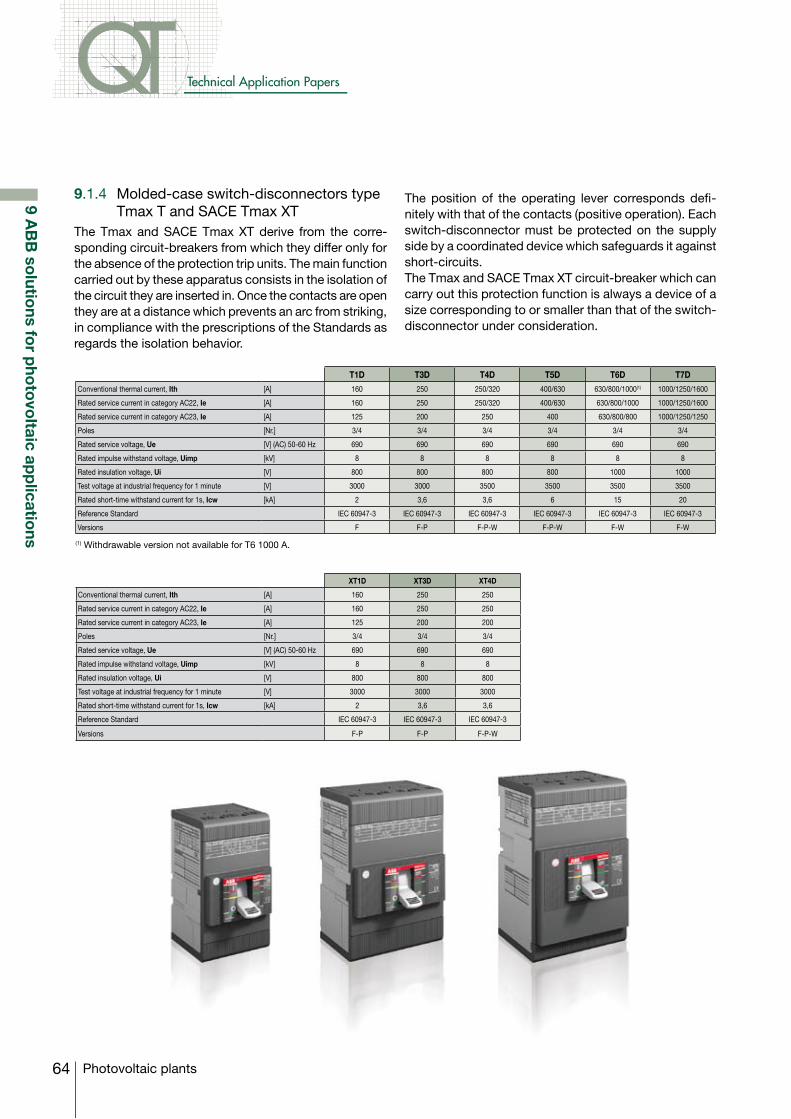
64
Technical Application Papers
Photovoltaic plants
9 AB
B so
lutions fo
r pho
tovo
ltaic app
lications
9.1.4 Molded-case switch-disconnectors type Tmax T and SACE Tmax XT
The Tmax and SACE Tmax XT derive from the corre-sponding circuit-breakers from which they differ only for the absence of the protection trip units. The main function carried out by these apparatus consists in the isolation of the circuit they are inserted in. Once the contacts are open they are at a distance which prevents an arc from striking, in compliance with the prescriptions of the Standards as regards the isolation behavior.
The position of the operating lever corresponds defi-nitely with that of the contacts (positive operation). Each switch-disconnector must be protected on the supply side by a coordinated device which safeguards it against short-circuits. The Tmax and SACE Tmax XT circuit-breaker which can carry out this protection function is always a device of a size corresponding to or smaller than that of the switch-disconnector under consideration.
XT1D XT3D XT4D
Conventional thermal current, Ith [A] 160 250 250
Rated service current in category AC22, Ie [A] 160 250 250
Rated service current in category AC23, Ie [A] 125 200 200
Poles [Nr.] 3/4 3/4 3/4
Rated service voltage, Ue [V] (AC) 50-60 Hz 690 690 690
Rated impulse withstand voltage, Uimp [kV] 8 8 8
Rated insulation voltage, Ui [V] 800 800 800
Test voltage at industrial frequency for 1 minute [V] 3000 3000 3000
Rated short-time withstand current for 1s, Icw [kA] 2 3,6 3,6
Reference Standard IEC 60947-3 IEC 60947-3 IEC 60947-3
Versions F-P F-P F-P-W
T1D T3D T4D T5D T6D T7DConventional thermal current, Ith [A] 160 250 250/320 400/630 630/800/1000(1) 1000/1250/1600
Rated service current in category AC22, Ie [A] 160 250 250/320 400/630 630/800/1000 1000/1250/1600
Rated service current in category AC23, Ie [A] 125 200 250 400 630/800/800 1000/1250/1250
Poles [Nr.] 3/4 3/4 3/4 3/4 3/4 3/4
Rated service voltage, Ue [V] (AC) 50-60 Hz 690 690 690 690 690 690
Rated impulse withstand voltage, Uimp [kV] 8 8 8 8 8 8
Rated insulation voltage, Ui [V] 800 800 800 800 1000 1000
Test voltage at industrial frequency for 1 minute [V] 3000 3000 3500 3500 3500 3500
Rated short-time withstand current for 1s, Icw [kA] 2 3,6 3,6 6 15 20
Reference Standard IEC 60947-3 IEC 60947-3 IEC 60947-3 IEC 60947-3 IEC 60947-3 IEC 60947-3
Versions F F-P F-P-W F-P-W F-W F-W
(1) Withdrawable version not available for T6 1000 A.
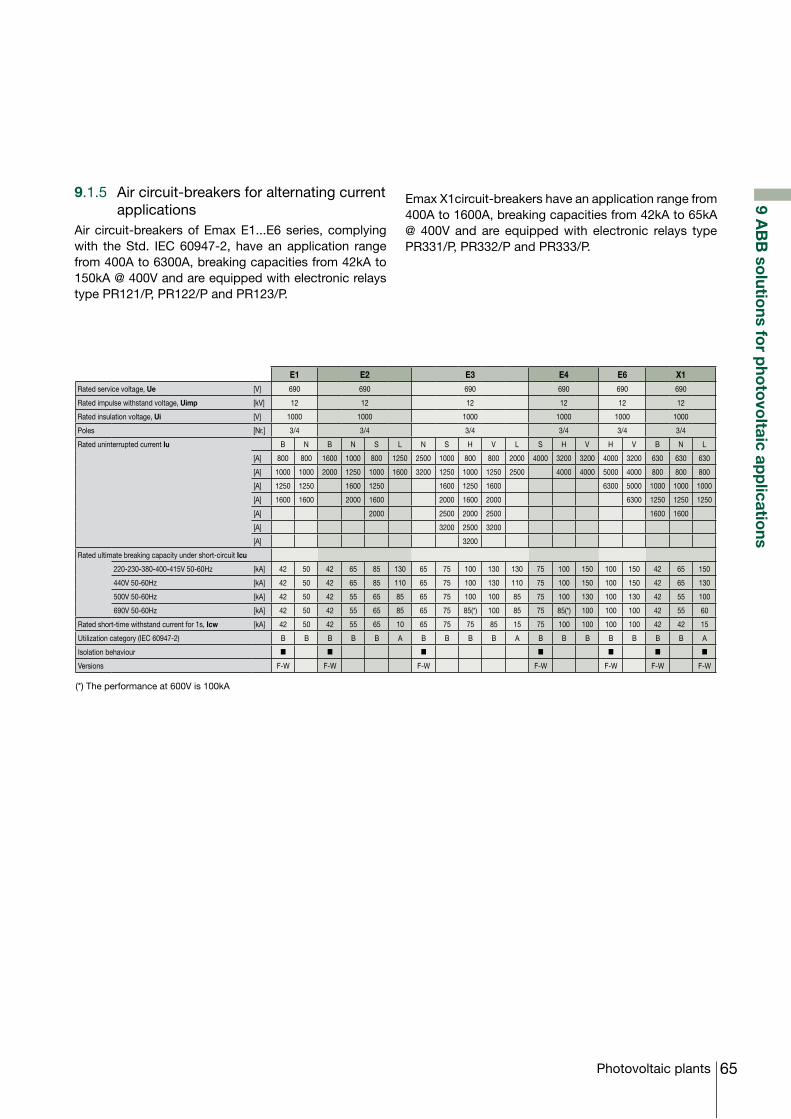
65Photovoltaic plants
9 AB
B so
lutions fo
r pho
tovo
ltaic app
lications
9.1.5 Air circuit-breakers for alternating current applications
Air circuit-breakers of Emax E1...E6 series, complying with the Std. IEC 60947-2, have an application range from 400A to 6300A, breaking capacities from 42kA to 150kA @ 400V and are equipped with electronic relays type PR121/P, PR122/P and PR123/P.
Emax X1circuit-breakers have an application range from 400A to 1600A, breaking capacities from 42kA to 65kA @ 400V and are equipped with electronic relays type PR331/P, PR332/P and PR333/P.
E1 E2 E3 E4 E6 X1Rated service voltage, Ue [V] 690 690 690 690 690 690
Rated impulse withstand voltage, Uimp [kV] 12 12 12 12 12 12
Rated insulation voltage, Ui [V] 1000 1000 1000 1000 1000 1000
Poles [Nr.] 3/4 3/4 3/4 3/4 3/4 3/4
Rated uninterrupted current Iu B N B N S L N S H V L S H V H V B N L
[A] 800 800 1600 1000 800 1250 2500 1000 800 800 2000 4000 3200 3200 4000 3200 630 630 630
[A] 1000 1000 2000 1250 1000 1600 3200 1250 1000 1250 2500 4000 4000 5000 4000 800 800 800
[A] 1250 1250 1600 1250 1600 1250 1600 6300 5000 1000 1000 1000
[A] 1600 1600 2000 1600 2000 1600 2000 6300 1250 1250 1250
[A] 2000 2500 2000 2500 1600 1600
[A] 3200 2500 3200
[A] 3200
Rated ultimate breaking capacity under short-circuit Icu
220-230-380-400-415V 50-60Hz [kA] 42 50 42 65 85 130 65 75 100 130 130 75 100 150 100 150 42 65 150
440V 50-60Hz [kA] 42 50 42 65 85 110 65 75 100 130 110 75 100 150 100 150 42 65 130
500V 50-60Hz [kA] 42 50 42 55 65 85 65 75 100 100 85 75 100 130 100 130 42 55 100
690V 50-60Hz [kA] 42 50 42 55 65 85 65 75 85(*) 100 85 75 85(*) 100 100 100 42 55 60
Rated short-time withstand current for 1s, Icw [kA] 42 50 42 55 65 10 65 75 75 85 15 75 100 100 100 100 42 42 15
Utilization category (IEC 60947-2) B B B B B A B B B B A B B B B B B B A
Isolation behaviour n n n n n n n
Versions F-W F-W F-W F-W F-W F-W F-W
(*) The performance at 600V is 100kA
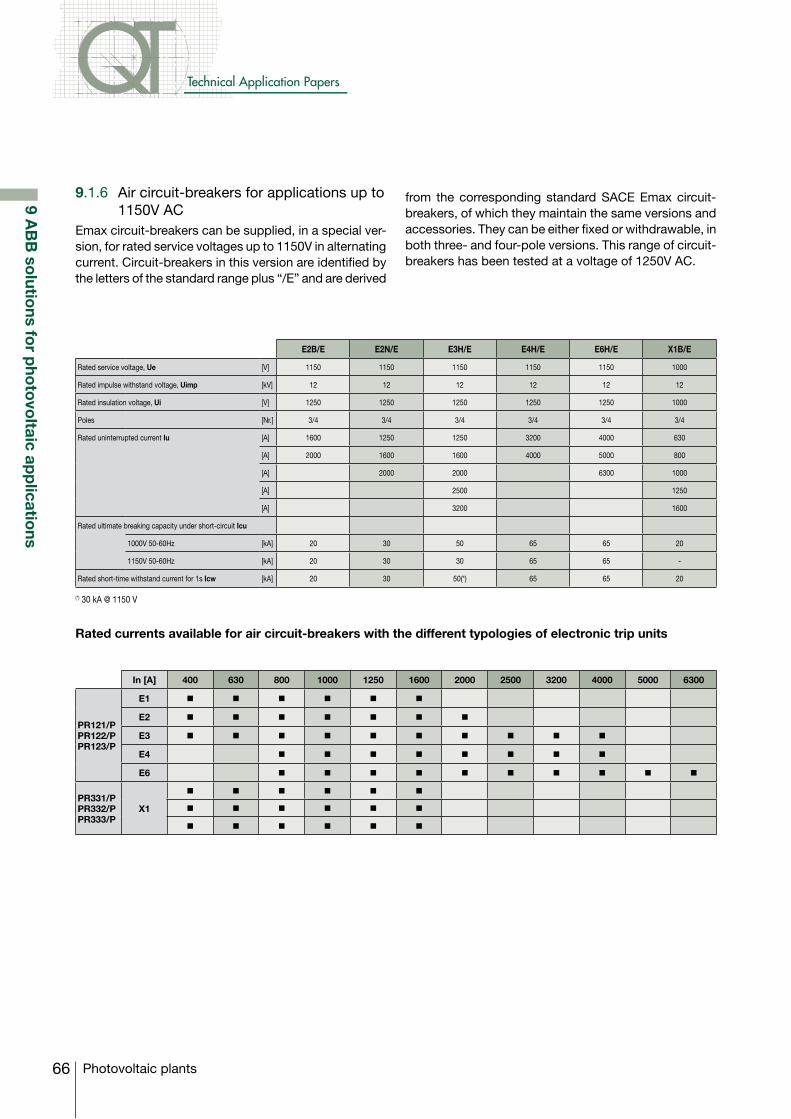
66
Technical Application Papers
Photovoltaic plants
9.1.6 Air circuit-breakers for applications up to 1150V AC
Emax circuit-breakers can be supplied, in a special ver-sion, for rated service voltages up to 1150V in alternating current. Circuit-breakers in this version are identified by the letters of the standard range plus “/E” and are derived
from the corresponding standard SACE Emax circuit-breakers, of which they maintain the same versions and accessories. They can be either fixed or withdrawable, in both three- and four-pole versions. This range of circuit-breakers has been tested at a voltage of 1250V AC.
E2B/E E2N/E E3H/E E4H/E E6H/E X1B/E
Rated service voltage, Ue [V] 1150 1150 1150 1150 1150 1000
Rated impulse withstand voltage, Uimp [kV] 12 12 12 12 12 12
Rated insulation voltage, Ui [V] 1250 1250 1250 1250 1250 1000
Poles [Nr.] 3/4 3/4 3/4 3/4 3/4 3/4
Rated uninterrupted current Iu [A] 1600 1250 1250 3200 4000 630
[A] 2000 1600 1600 4000 5000 800
[A] 2000 2000 6300 1000
[A] 2500 1250
[A] 3200 1600
Rated ultimate breaking capacity under short-circuit Icu
1000V 50-60Hz [kA] 20 30 50 65 65 20
1150V 50-60Hz [kA] 20 30 30 65 65 -
Rated short-time withstand current for 1s Icw [kA] 20 30 50(*) 65 65 20
(*) 30 kA @ 1150 V
In [A] 400 630 800 1000 1250 1600 2000 2500 3200 4000 5000 6300
PR121/PPR122/PPR123/P
E1 n n n n n n
E2 n n n n n n n
E3 n n n n n n n n n n
E4 n n n n n n n n
E6 n n n n n n n n n n
PR331/PPR332/PPR333/P
X1
n n n n n n
n n n n n n
n n n n n n
9 AB
B so
lutions fo
r pho
tovo
ltaic app
lications
Rated currents available for air circuit-breakers with the different typologies of electronic trip units
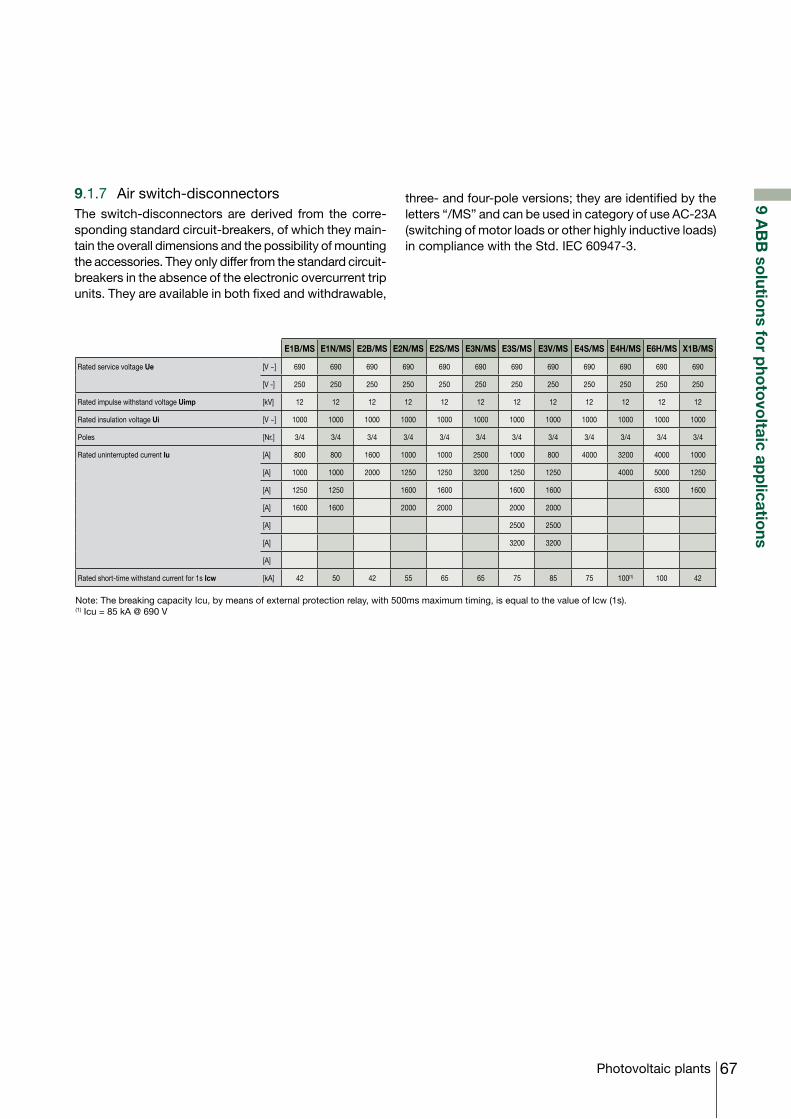
67Photovoltaic plants
9.1.7 Air switch-disconnectorsThe switch-disconnectors are derived from the corre-sponding standard circuit-breakers, of which they main-tain the overall dimensions and the possibility of mounting the accessories. They only differ from the standard circuit-breakers in the absence of the electronic overcurrent trip units. They are available in both fixed and withdrawable,
three- and four-pole versions; they are identified by the letters “/MS” and can be used in category of use AC-23A (switching of motor loads or other highly inductive loads) in compliance with the Std. IEC 60947-3.
E1B/MS E1N/MS E2B/MS E2N/MS E2S/MS E3N/MS E3S/MS E3V/MS E4S/MS E4H/MS E6H/MS X1B/MS
Rated service voltage Ue [V ~] 690 690 690 690 690 690 690 690 690 690 690 690
[V -] 250 250 250 250 250 250 250 250 250 250 250 250
Rated impulse withstand voltage Uimp [kV] 12 12 12 12 12 12 12 12 12 12 12 12
Rated insulation voltage Ui [V ~] 1000 1000 1000 1000 1000 1000 1000 1000 1000 1000 1000 1000
Poles [Nr.] 3/4 3/4 3/4 3/4 3/4 3/4 3/4 3/4 3/4 3/4 3/4 3/4
Rated uninterrupted current Iu [A] 800 800 1600 1000 1000 2500 1000 800 4000 3200 4000 1000
[A] 1000 1000 2000 1250 1250 3200 1250 1250 4000 5000 1250
[A] 1250 1250 1600 1600 1600 1600 6300 1600
[A] 1600 1600 2000 2000 2000 2000
[A] 2500 2500
[A] 3200 3200
[A]
Rated short-time withstand current for 1s Icw [kA] 42 50 42 55 65 65 75 85 75 100(1) 100 42
Note: The breaking capacity Icu, by means of external protection relay, with 500ms maximum timing, is equal to the value of Icw (1s).(1) Icu = 85 kA @ 690 V
9 AB
B so
lutions fo
r pho
tovo
ltaic app
lications
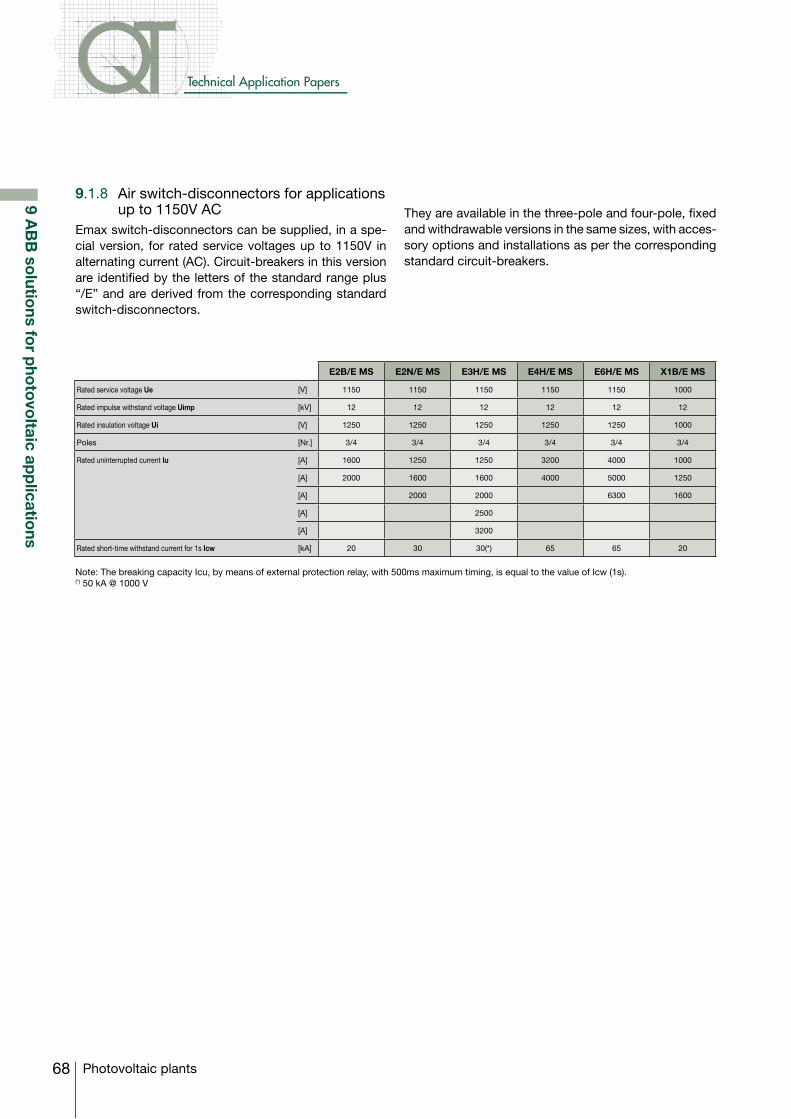
68
Technical Application Papers
Photovoltaic plants
9 AB
B so
lutions fo
r pho
tovo
ltaic app
lications
9.1.8 Air switch-disconnectors for applications up to 1150V AC
Emax switch-disconnectors can be supplied, in a spe-cial version, for rated service voltages up to 1150V in alternating current (AC). Circuit-breakers in this version are identified by the letters of the standard range plus “/E” and are derived from the corresponding standard switch-disconnectors.
They are available in the three-pole and four-pole, fixed and withdrawable versions in the same sizes, with acces-sory options and installations as per the corresponding standard circuit-breakers.
E2B/E MS E2N/E MS E3H/E MS E4H/E MS E6H/E MS X1B/E MS
Rated service voltage Ue [V] 1150 1150 1150 1150 1150 1000
Rated impulse withstand voltage Uimp [kV] 12 12 12 12 12 12
Rated insulation voltage Ui [V] 1250 1250 1250 1250 1250 1000
Poles [Nr.] 3/4 3/4 3/4 3/4 3/4 3/4
Rated uninterrupted current Iu [A] 1600 1250 1250 3200 4000 1000
[A] 2000 1600 1600 4000 5000 1250
[A] 2000 2000 6300 1600
[A] 2500
[A] 3200
Rated short-time withstand current for 1s Icw [kA] 20 30 30(*) 65 65 20
Note: The breaking capacity Icu, by means of external protection relay, with 500ms maximum timing, is equal to the value of Icw (1s). (*) 50 kA @ 1000 V
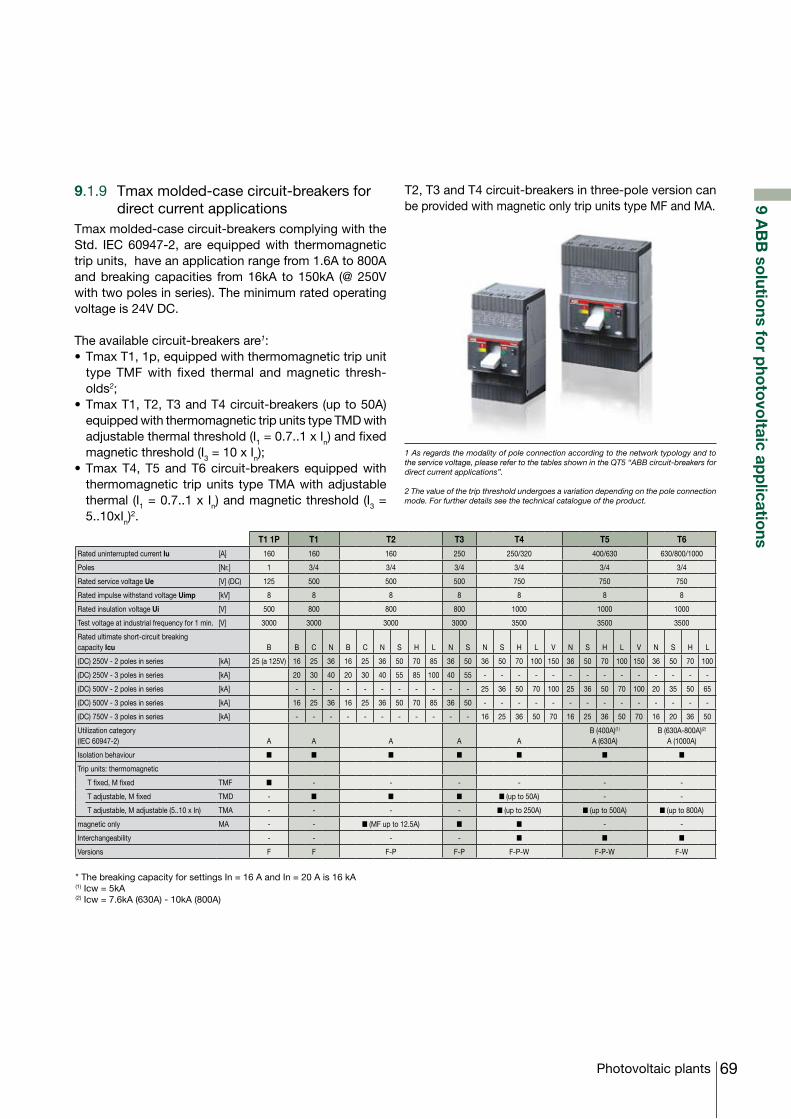
69Photovoltaic plants
9 AB
B so
lutions fo
r pho
tovo
ltaic app
lications
9.1.9 Tmax molded-case circuit-breakers for direct current applications
Tmax molded-case circuit-breakers complying with the Std. IEC 60947-2, are equipped with thermomagnetic trip units, have an application range from 1.6A to 800A and breaking capacities from 16kA to 150kA (@ 250V with two poles in series). The minimum rated operating voltage is 24V DC.
The available circuit-breakers are1: •TmaxT1,1p,equippedwiththermomagnetictripunit
type TMF with fixed thermal and magnetic thresh-olds2;
•TmaxT1,T2,T3andT4circuit-breakers(upto50A)equipped with thermomagnetic trip units type TMD with adjustable thermal threshold (I1 = 0.7..1 x In) and fixed magnetic threshold (I3 = 10 x In);
•TmaxT4, T5andT6circuit-breakers equippedwiththermomagnetic trip units type TMA with adjustable thermal (I1 = 0.7..1 x In) and magnetic threshold (I3 = 5..10xIn)
2.
T2, T3 and T4 circuit-breakers in three-pole version can be provided with magnetic only trip units type MF and MA.
1 As regards the modality of pole connection according to the network typology and to the service voltage, please refer to the tables shown in the QT5 “ABB circuit-breakers for direct current applications”.
2 The value of the trip threshold undergoes a variation depending on the pole connection mode. For further details see the technical catalogue of the product.
T1 1P T1 T2 T3 T4 T5 T6Rated uninterrupted current Iu [A] 160 160 160 250 250/320 400/630 630/800/1000
Poles [Nr.] 1 3/4 3/4 3/4 3/4 3/4 3/4
Rated service voltage Ue [V] (DC) 125 500 500 500 750 750 750
Rated impulse withstand voltage Uimp [kV] 8 8 8 8 8 8 8
Rated insulation voltage Ui [V] 500 800 800 800 1000 1000 1000
Test voltage at industrial frequency for 1 min. [V] 3000 3000 3000 3000 3500 3500 3500
Rated ultimate short-circuit breaking capacity Icu B B C N B C N S H L N S N S H L V N S H L V N S H L
(DC) 250V - 2 poles in series [kA] 25 (a 125V) 16 25 36 16 25 36 50 70 85 36 50 36 50 70 100 150 36 50 70 100 150 36 50 70 100
(DC) 250V - 3 poles in series [kA] 20 30 40 20 30 40 55 85 100 40 55 - - - - - - - - - - - - - -
(DC) 500V - 2 poles in series [kA] - - - - - - - - - - - 25 36 50 70 100 25 36 50 70 100 20 35 50 65
(DC) 500V - 3 poles in series [kA] 16 25 36 16 25 36 50 70 85 36 50 - - - - - - - - - - - - - -
(DC) 750V - 3 poles in series [kA] - - - - - - - - - - - 16 25 36 50 70 16 25 36 50 70 16 20 36 50
Utilization category (IEC 60947-2) A A A A A
B (400A)(1) A (630A)
B (630A-800A)(2) A (1000A)
Isolation behaviour n n n n n n n
Trip units: thermomagnetic
T fixed, M fixed TMF n - - - - - -
T adjustable, M fixed TMD - n n n n (up to 50A) - -
T adjustable, M adjustable (5..10 x In) TMA - - - - n (up to 250A) n (up to 500A) n (up to 800A)
magnetic only MA - - n (MF up to 12.5A) n n - -
Interchangeability - - - - n n n
Versions F F F-P F-P F-P-W F-P-W F-W
* The breaking capacity for settings In = 16 A and In = 20 A is 16 kA(1) Icw = 5kA(2) Icw = 7.6kA (630A) - 10kA (800A)
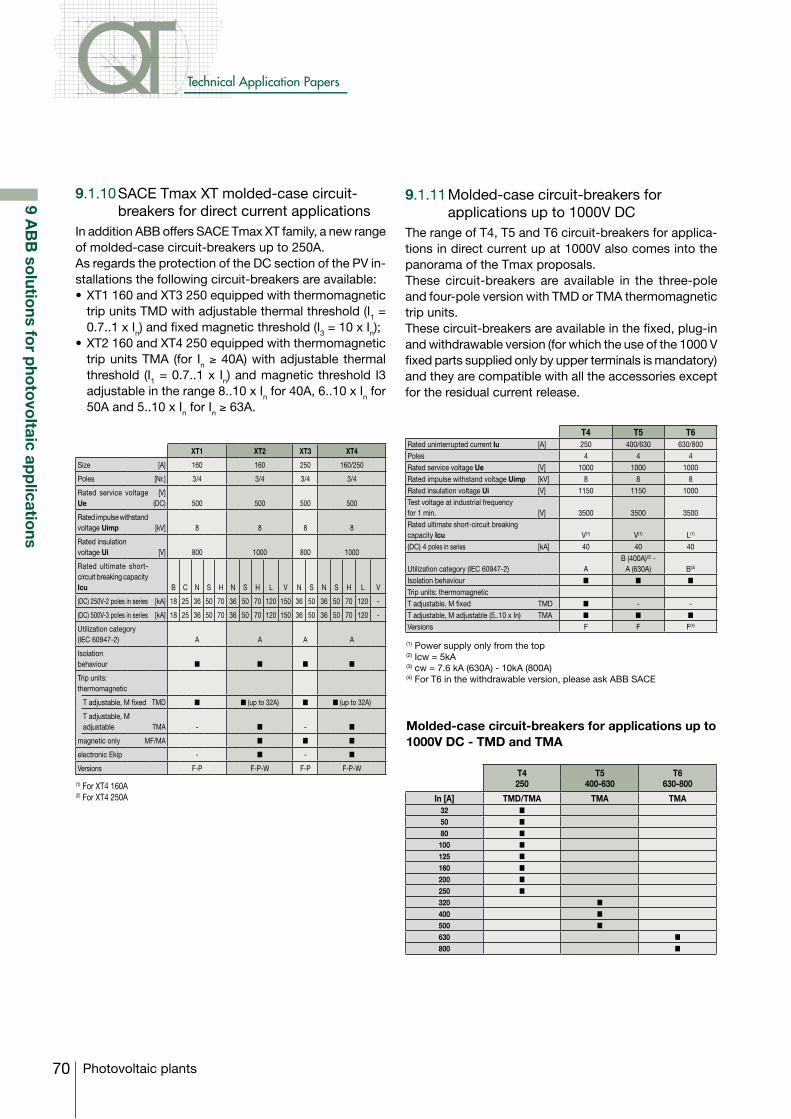
70
Technical Application Papers
Photovoltaic plants
9 AB
B so
lutions fo
r pho
tovo
ltaic app
lications
9.1.11 Molded-case circuit-breakers for applications up to 1000V DC
The range of T4, T5 and T6 circuit-breakers for applica-tions in direct current up at 1000V also comes into the panorama of the Tmax proposals. These circuit-breakers are available in the three-pole and four-pole version with TMD or TMA thermomagnetic trip units. These circuit-breakers are available in the fixed, plug-in and withdrawable version (for which the use of the 1000 V fixed parts supplied only by upper terminals is mandatory) and they are compatible with all the accessories except for the residual current release.
T4 T5 T6Rated uninterrupted current Iu [A] 250 400/630 630/800Poles 4 4 4Rated service voltage Ue [V] 1000 1000 1000Rated impulse withstand voltage Uimp [kV] 8 8 8Rated insulation voltage Ui [V] 1150 1150 1000Test voltage at industrial frequency for 1 min. [V] 3500 3500 3500Rated ultimate short-circuit breaking capacity Icu V(1) V(1) L(1)
(DC) 4 poles in series [kA] 40 40 40
Utilization category (IEC 60947-2) AB (400A)(2) -
A (630A) B(3)
Isolation behaviour n n n
Trip units: thermomagneticT adjustable, M fixed TMD n - -T adjustable, M adjustable (5..10 x In) TMA n n n
Versions F F F(4)
(1) Power supply only from the top (2) Icw = 5kA (3) cw = 7.6 kA (630A) - 10kA (800A) (4) For T6 in the withdrawable version, please ask ABB SACE
T4250
T5400-630
T6630-800
In [A] TMD/TMA TMA TMA32 n
50 n
80 n
100 n
125 n
160 n
200 n
250 n
320 n
400 n
500 n
630 n
800 n
Molded-case circuit-breakers for applications up to 1000V DC - TMD and TMA
9.1.10 SACE Tmax XT molded-case circuit-breakers for direct current applications
In addition ABB offers SACE Tmax XT family, a new range of molded-case circuit-breakers up to 250A. As regards the protection of the DC section of the PV in-stallations the following circuit-breakers are available:•XT1160andXT3250equippedwiththermomagnetic
trip units TMD with adjustable thermal threshold (I1 = 0.7..1 x In) and fixed magnetic threshold (I3 = 10 x In);
•XT2160andXT4250equippedwiththermomagnetictrip units TMA (for In ≥ 40A) with adjustable thermal threshold (I1 = 0.7..1 x In) and magnetic threshold I3 adjustable in the range 8..10 x In for 40A, 6..10 x In for 50A and 5..10 x In for In ≥ 63A.
XT1 XT2 XT3 XT4
Size [A] 160 160 250 160/250
Poles [Nr.] 3/4 3/4 3/4 3/4
Rated service voltage Ue
[V] (DC) 500 500 500 500
Rated impulse withstand voltage Uimp [kV] 8 8 8 8
Rated insulation voltage Ui [V] 800 1000 800 1000
Rated ultimate short-circuit breaking capacity Icu B C N S H N S H L V N S N S H L V
(DC) 250V-2 poles in series [kA] 18 25 36 50 70 36 50 70 120 150 36 50 36 50 70 120 -
(DC) 500V-3 poles in series [kA] 18 25 36 50 70 36 50 70 120 150 36 50 36 50 70 120 -
Utilization category (IEC 60947-2) A A A A
Isolation behaviour n n n n
Trip units:thermomagnetic
T adjustable, M fixed TMD n n (up to 32A) n n (up to 32A)
T adjustable, M adjustable TMA - n - n
magnetic only MF/MA n n n
electronic Ekip - n - n
Versions F-P F-P-W F-P F-P-W
(1) For XT4 160A(2) For XT4 250A
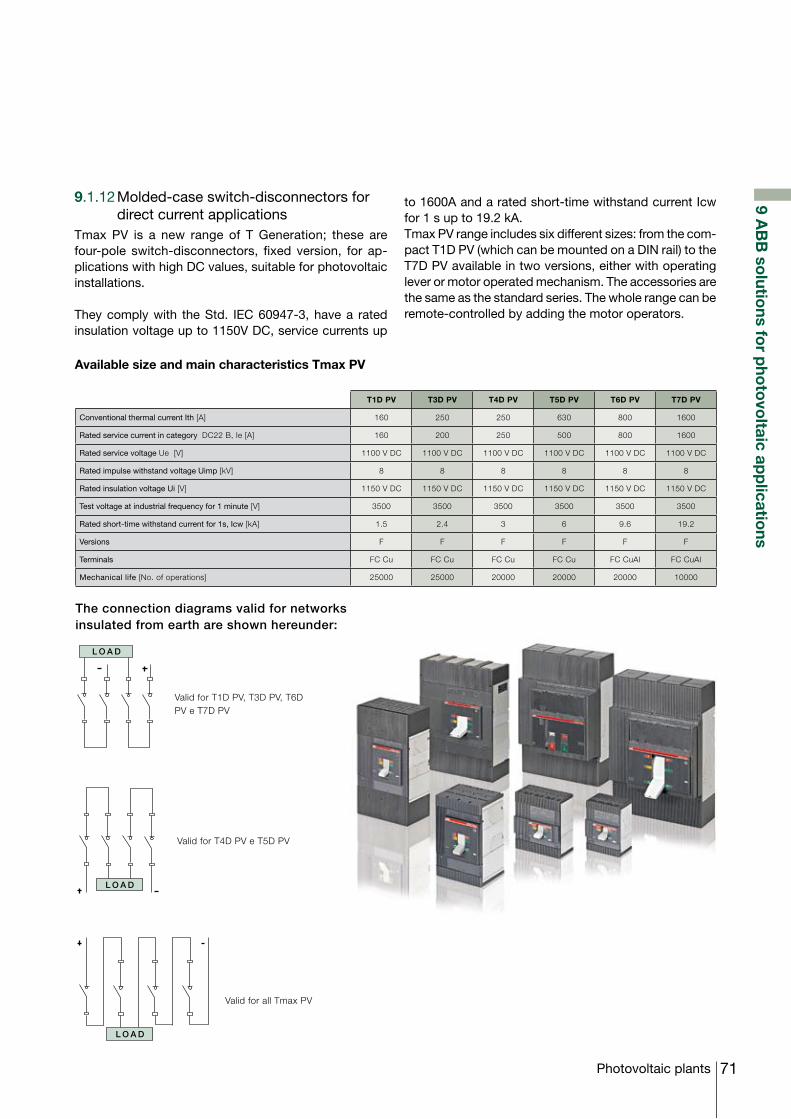
71Photovoltaic plants
9 AB
B so
lutions fo
r pho
tovo
ltaic app
lications
9.1.12 Molded-case switch-disconnectors for direct current applications
Tmax PV is a new range of T Generation; these are four-pole switch-disconnectors, fixed version, for ap-plications with high DC values, suitable for photovoltaic installations.
They comply with the Std. IEC 60947-3, have a rated insulation voltage up to 1150V DC, service currents up
Available size and main characteristics Tmax PV
T1D PV T3D PV T4D PV T5D PV T6D PV T7D PV
Conventional thermal current Ith [A] 160 250 250 630 800 1600
Rated service current in category DC22 B, Ie [A] 160 200 250 500 800 1600
Rated service voltage Ue [V] 1100 V DC 1100 V DC 1100 V DC 1100 V DC 1100 V DC 1100 V DC
Rated impulse withstand voltage Uimp [kV] 8 8 8 8 8 8
Rated insulation voltage Ui [V] 1150 V DC 1150 V DC 1150 V DC 1150 V DC 1150 V DC 1150 V DC
Test voltage at industrial frequency for 1 minute [V] 3500 3500 3500 3500 3500 3500
Rated short-time withstand current for 1s, Icw [kA] 1.5 2.4 3 6 9.6 19.2
Versions F F F F F F
Terminals FC Cu FC Cu FC Cu FC Cu FC CuAl FC CuAl
Mechanical life [No. of operations] 25000 25000 20000 20000 20000 10000
to 1600A and a rated short-time withstand current Icw for 1 s up to 19.2 kA. Tmax PV range includes six different sizes: from the com-pact T1D PV (which can be mounted on a DIN rail) to the T7D PV available in two versions, either with operating lever or motor operated mechanism. The accessories are the same as the standard series. The whole range can be remote-controlled by adding the motor operators.
The connection diagrams valid for networks insulated from earth are shown hereunder:
Valid for T1D PV, T3D PV, T6D PV e T7D PV
Valid for T4D PV e T5D PV
Valid for all Tmax PV
L O A D
L O A D
L O A D
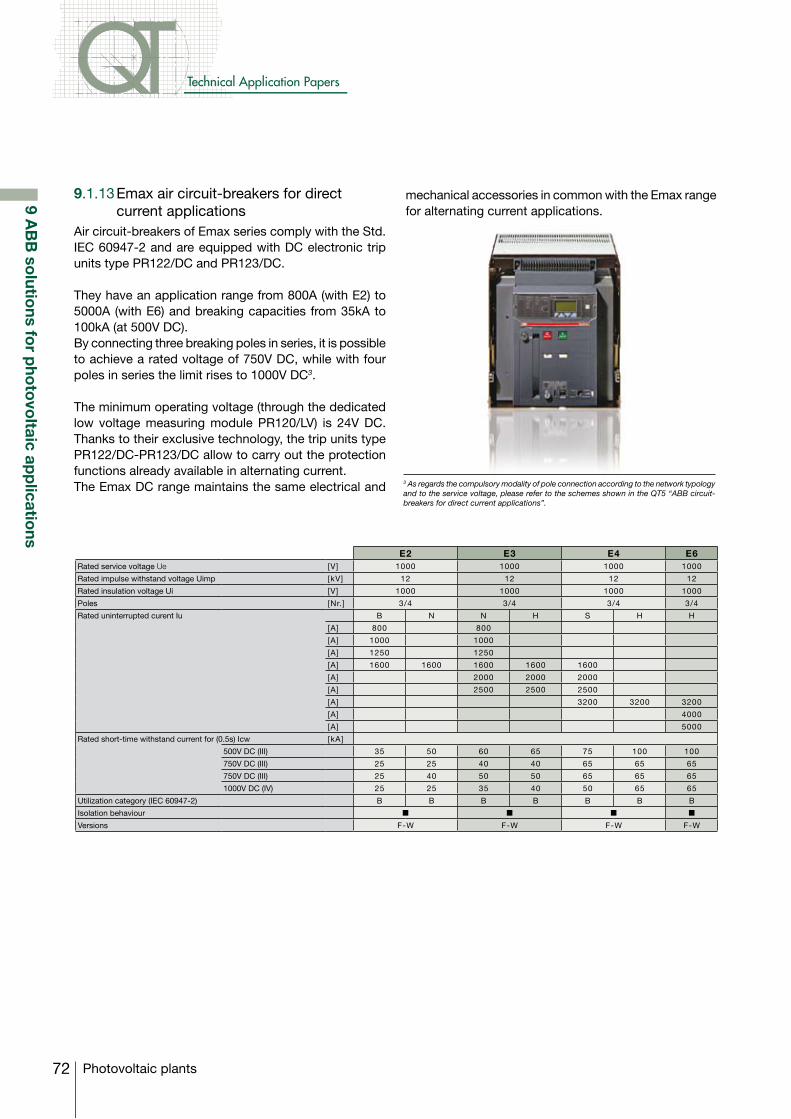
72
Technical Application Papers
Photovoltaic plants
9 AB
B so
lutions fo
r pho
tovo
ltaic app
lications
9.1.13 Emax air circuit-breakers for direct current applications
Air circuit-breakers of Emax series comply with the Std. IEC 60947-2 and are equipped with DC electronic trip units type PR122/DC and PR123/DC.
They have an application range from 800A (with E2) to 5000A (with E6) and breaking capacities from 35kA to 100kA (at 500V DC). By connecting three breaking poles in series, it is possible to achieve a rated voltage of 750V DC, while with four poles in series the limit rises to 1000V DC3.
The minimum operating voltage (through the dedicated low voltage measuring module PR120/LV) is 24V DC. Thanks to their exclusive technology, the trip units type PR122/DC-PR123/DC allow to carry out the protection functions already available in alternating current. The Emax DC range maintains the same electrical and 3 As regards the compulsory modality of pole connection according to the network typology
and to the service voltage, please refer to the schemes shown in the QT5 “ABB circuit-breakers for direct current applications”.
E2 E3 E4 E6Rated service voltage Ue [V] 1000 1000 1000 1000
Rated impulse withstand voltage Uimp [kV] 12 12 12 12
Rated insulation voltage Ui [V] 1000 1000 1000 1000
Poles [Nr.] 3/4 3/4 3/4 3/4
Rated uninterrupted curent Iu B N N H S H H
[A] 800 800
[A] 1000 1000
[A] 1250 1250
[A] 1600 1600 1600 1600 1600
[A] 2000 2000 2000
[A] 2500 2500 2500
[A] 3200 3200 3200
[A] 4000
[A] 5000
Rated short-time withstand current for (0.5s) Icw [kA]
500V DC (III) 35 50 60 65 75 100 100
750V DC (III) 25 25 40 40 65 65 65
750V DC (III) 25 40 50 50 65 65 65
1000V DC (IV) 25 25 35 40 50 65 65
Utilization category (IEC 60947-2) B B B B B B B
Isolation behaviour n n n n
Versions F-W F-W F-W F-W
mechanical accessories in common with the Emax range for alternating current applications.
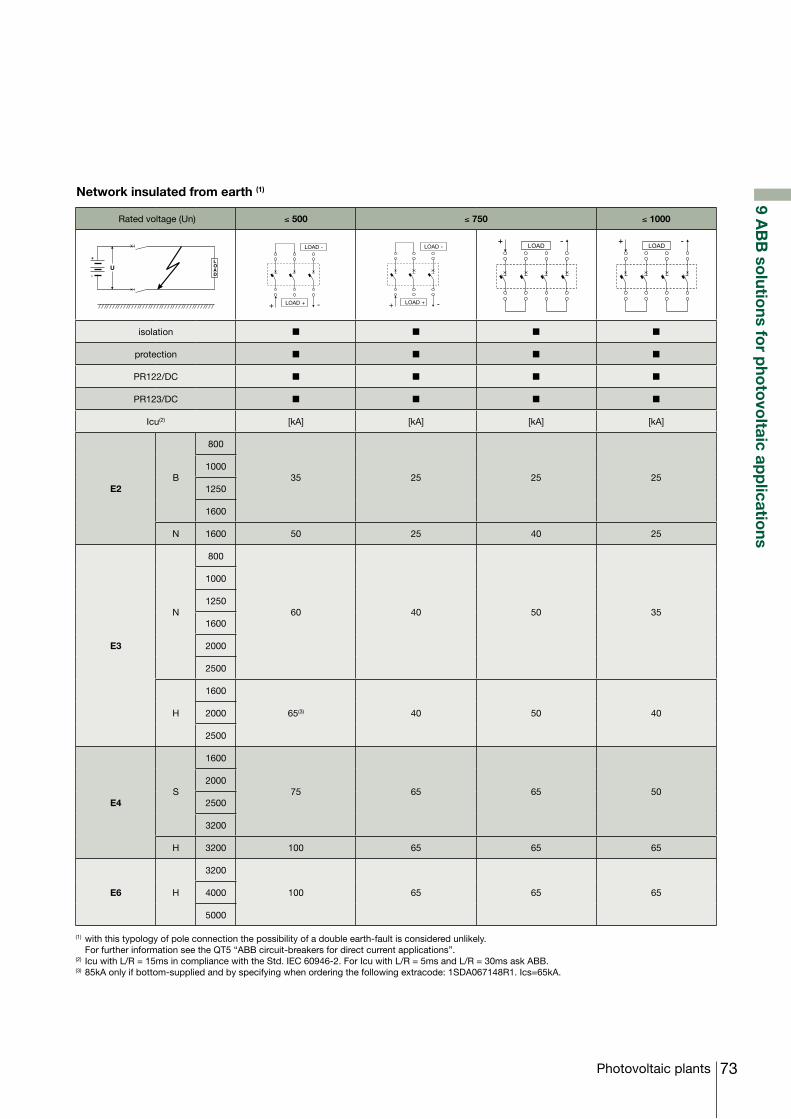
73Photovoltaic plants
9 AB
B so
lutions fo
r pho
tovo
ltaic app
lications
Rated voltage (Un) ≤ 500 ≤ 750 ≤ 1000
+
-
LOAD
+ -
LOAD -
LOAD + + -
LOAD -
LOAD +
isolation n n n n
protection n n n n
PR122/DC n n n n
PR123/DC n n n n
Icu(2) [kA] [kA] [kA] [kA]
E2B
800
35 25 25 251000
1250
1600
N 1600 50 25 40 25
E3
N
800
60 40 50 35
1000
1250
1600
2000
2500
H
1600
65(3) 40 50 402000
2500
E4S
1600
75 65 65 502000
2500
3200
H 3200 100 65 65 65
E6 H
3200
100 65 65 654000
5000
(1) with this typology of pole connection the possibility of a double earth-fault is considered unlikely. ForfurtherinformationseetheQT5“ABBcircuit-breakersfordirectcurrentapplications”.(2) Icu with L/R = 15ms in compliance with the Std. IEC 60946-2. For Icu with L/R = 5ms and L/R = 30ms ask ABB.(3) 85kA only if bottom-supplied and by specifying when ordering the following extracode: 1SDA067148R1. Ics=65kA.
Network insulated from earth (1)
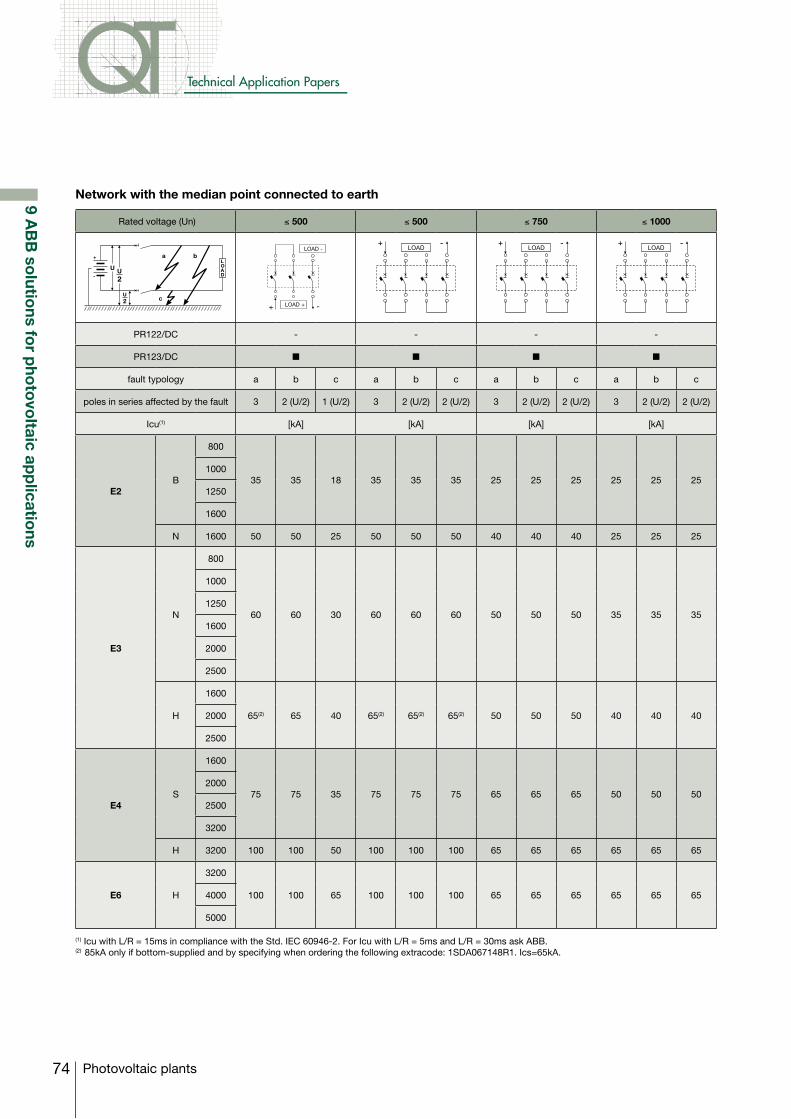
74
Technical Application Papers
Photovoltaic plants
9 AB
B so
lutions fo
r pho
tovo
ltaic app
lications
Rated voltage (Un) ≤ 500 ≤ 500 ≤ 750 ≤ 1000
+
- 2
2
LOAD
+ -
LOAD -
LOAD +
PR122/DC - - - -
PR123/DC n n n n
fault typology a b c a b c a b c a b c
poles in series affected by the fault 3 2 (U/2) 1 (U/2) 3 2 (U/2) 2 (U/2) 3 2 (U/2) 2 (U/2) 3 2 (U/2) 2 (U/2)
Icu(1) [kA] [kA] [kA] [kA]
E2B
800
35 35 18 35 35 35 25 25 25 25 25 251000
1250
1600
N 1600 50 50 25 50 50 50 40 40 40 25 25 25
E3
N
800
60 60 30 60 60 60 50 50 50 35 35 35
1000
1250
1600
2000
2500
H
1600
65(2) 65 40 65(2) 65(2) 65(2) 50 50 50 40 40 402000
2500
E4S
1600
75 75 35 75 75 75 65 65 65 50 50 502000
2500
3200
H 3200 100 100 50 100 100 100 65 65 65 65 65 65
E6 H
3200
100 100 65 100 100 100 65 65 65 65 65 654000
5000
Network with the median point connected to earth
(1) Icu with L/R = 15ms in compliance with the Std. IEC 60946-2. For Icu with L/R = 5ms and L/R = 30ms ask ABB.(2) 85kA only if bottom-supplied and by specifying when ordering the following extracode: 1SDA067148R1. Ics=65kA.
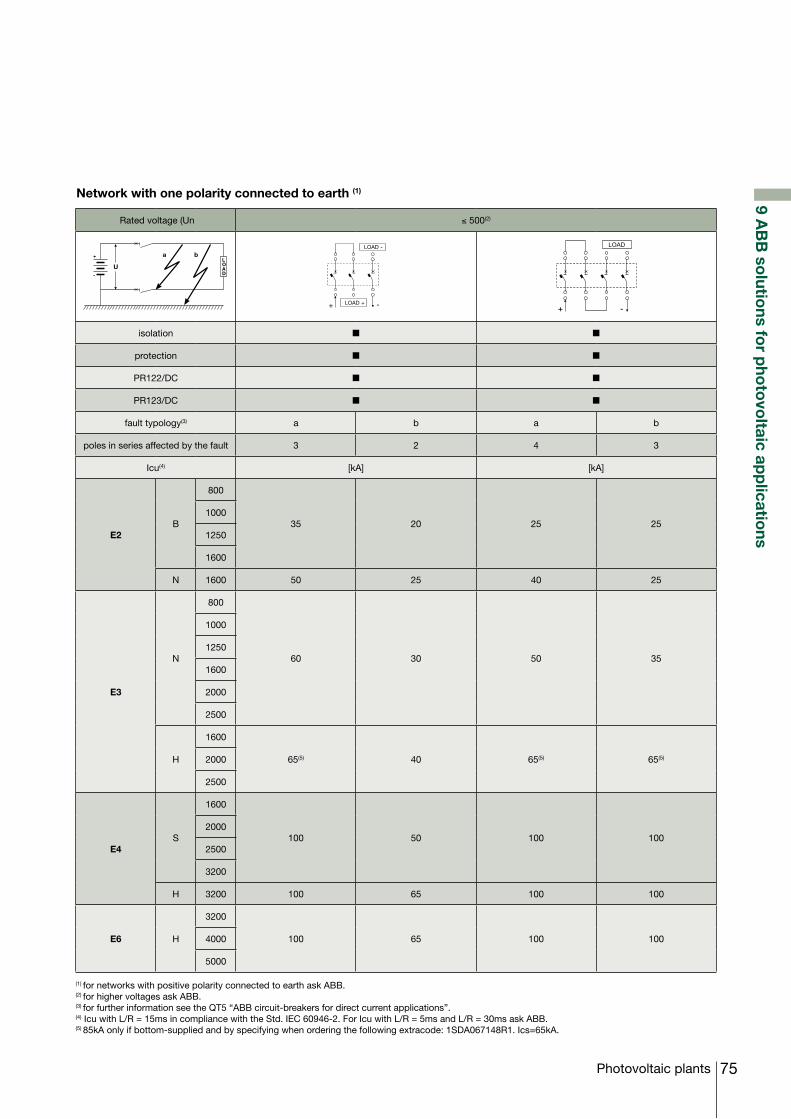
75Photovoltaic plants
9 AB
B so
lutions fo
r pho
tovo
ltaic app
lications
Rated voltage (Un ≤ 500(2)
+
-
LOAD
+ -
LOAD -
LOAD +
isolation n n
protection n n
PR122/DC n n
PR123/DC n n
fault typology(3) a b a b
poles in series affected by the fault 3 2 4 3
Icu(4) [kA] [kA]
E2B
800
35 20 25 251000
1250
1600
N 1600 50 25 40 25
E3
N
800
60 30 50 35
1000
1250
1600
2000
2500
H
1600
65(5) 40 65(5) 65(5)2000
2500
E4S
1600
100 50 100 1002000
2500
3200
H 3200 100 65 100 100
E6 H
3200
100 65 100 1004000
5000
Network with one polarity connected to earth (1)
(1) for networks with positive polarity connected to earth ask ABB.(2) for higher voltages ask ABB.(3) forfurtherinformationseetheQT5“ABBcircuit-breakersfordirectcurrentapplications”.(4) Icu with L/R = 15ms in compliance with the Std. IEC 60946-2. For Icu with L/R = 5ms and L/R = 30ms ask ABB.(5) 85kA only if bottom-supplied and by specifying when ordering the following extracode: 1SDA067148R1. Ics=65kA.
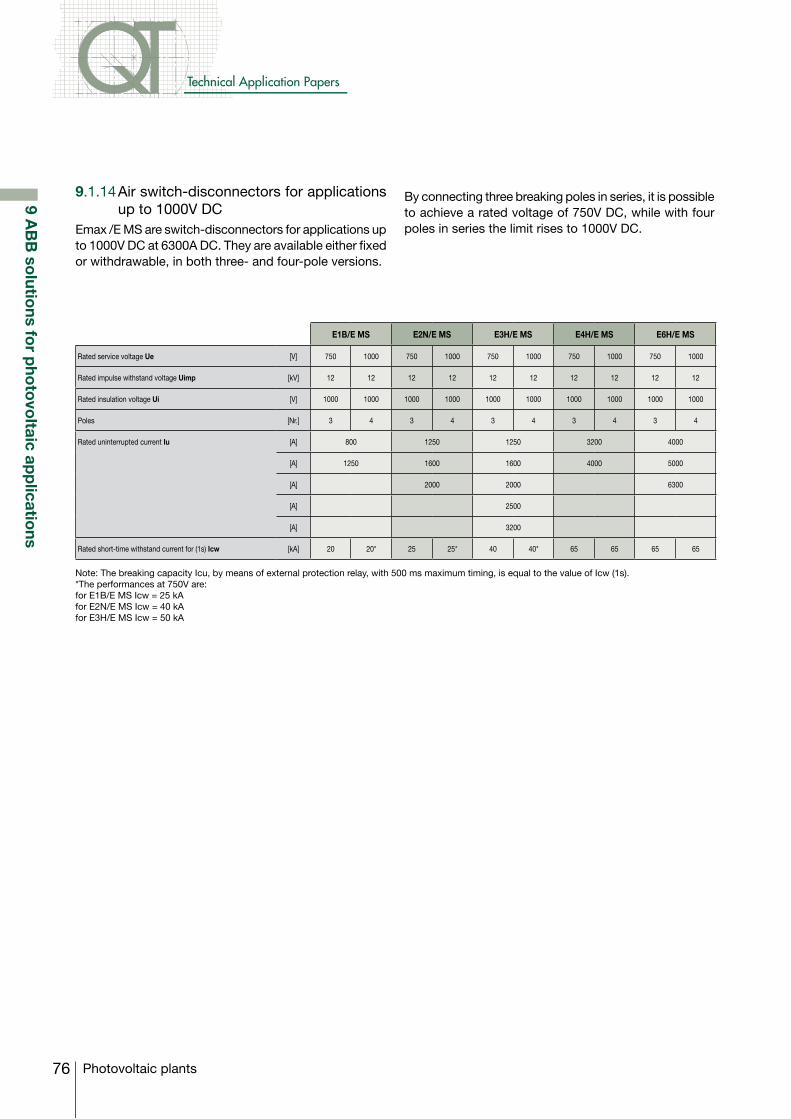
76
Technical Application Papers
Photovoltaic plants
9 AB
B so
lutions fo
r pho
tovo
ltaic app
lications
9.1.14 Air switch-disconnectors for applications up to 1000V DC
Emax /E MS are switch-disconnectors for applications up to 1000V DC at 6300A DC. They are available either fixed or withdrawable, in both three- and four-pole versions.
By connecting three breaking poles in series, it is possible to achieve a rated voltage of 750V DC, while with four poles in series the limit rises to 1000V DC.
E1B/E MS E2N/E MS E3H/E MS E4H/E MS E6H/E MS
Rated service voltage Ue [V] 750 1000 750 1000 750 1000 750 1000 750 1000
Rated impulse withstand voltage Uimp [kV] 12 12 12 12 12 12 12 12 12 12
Rated insulation voltage Ui [V] 1000 1000 1000 1000 1000 1000 1000 1000 1000 1000
Poles [Nr.] 3 4 3 4 3 4 3 4 3 4
Rated uninterrupted current Iu [A] 800 1250 1250 3200 4000
[A] 1250 1600 1600 4000 5000
[A] 2000 2000 6300
[A] 2500
[A] 3200
Rated short-time withstand current for (1s) Icw [kA] 20 20* 25 25* 40 40* 65 65 65 65
Note: The breaking capacity Icu, by means of external protection relay, with 500 ms maximum timing, is equal to the value of Icw (1s).*The performances at 750V are:for E1B/E MS Icw = 25 kAfor E2N/E MS Icw = 40 kAfor E3H/E MS Icw = 50 kA
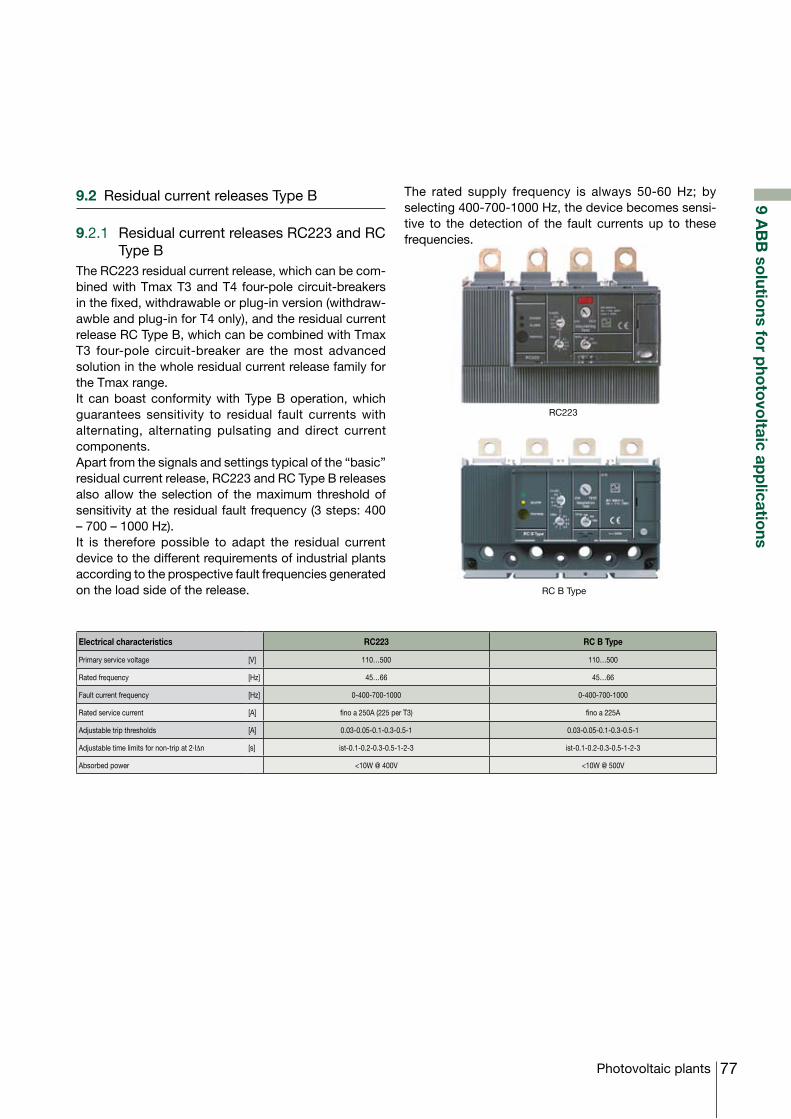
77Photovoltaic plants
9 AB
B so
lutions fo
r pho
tovo
ltaic app
lications
9.2 Residual current releases Type B
9.2.1 Residual current releases RC223 and RC Type B
The RC223 residual current release, which can be com-bined with Tmax T3 and T4 four-pole circuit-breakers in the fixed, withdrawable or plug-in version (withdraw-awble and plug-in for T4 only), and the residual current release RC Type B, which can be combined with Tmax T3 four-pole circuit-breaker are the most advanced solution in the whole residual current release family for the Tmax range. It can boast conformity with Type B operation, which guarantees sensitivity to residual fault currents with alternating, alternating pulsating and direct current components. Apart from the signals and settings typical of the “basic” residual current release, RC223 and RC Type B releases also allow the selection of the maximum threshold of sensitivity at the residual fault frequency (3 steps: 400 – 700 – 1000 Hz). It is therefore possible to adapt the residual current device to the different requirements of industrial plants according to the prospective fault frequencies generated on the load side of the release.
Electrical characteristics RC223 RC B Type
Primary service voltage [V] 110…500 110…500
Rated frequency [Hz] 45…66 45…66
Fault current frequency [Hz] 0-400-700-1000 0-400-700-1000
Rated service current [A] fino a 250A (225 per T3) fino a 225A
Adjustable trip thresholds [A] 0.03-0.05-0.1-0.3-0.5-1 0.03-0.05-0.1-0.3-0.5-1
Adjustable time limits for non-trip at 2∙I∆n [s] ist-0.1-0.2-0.3-0.5-1-2-3 ist-0.1-0.2-0.3-0.5-1-2-3
Absorbed power <10W @ 400V <10W @ 500V
RC223
RC B Type
The rated supply frequency is always 50-60 Hz; by selecting 400-700-1000 Hz, the device becomes sensi-tive to the detection of the fault currents up to these frequencies.
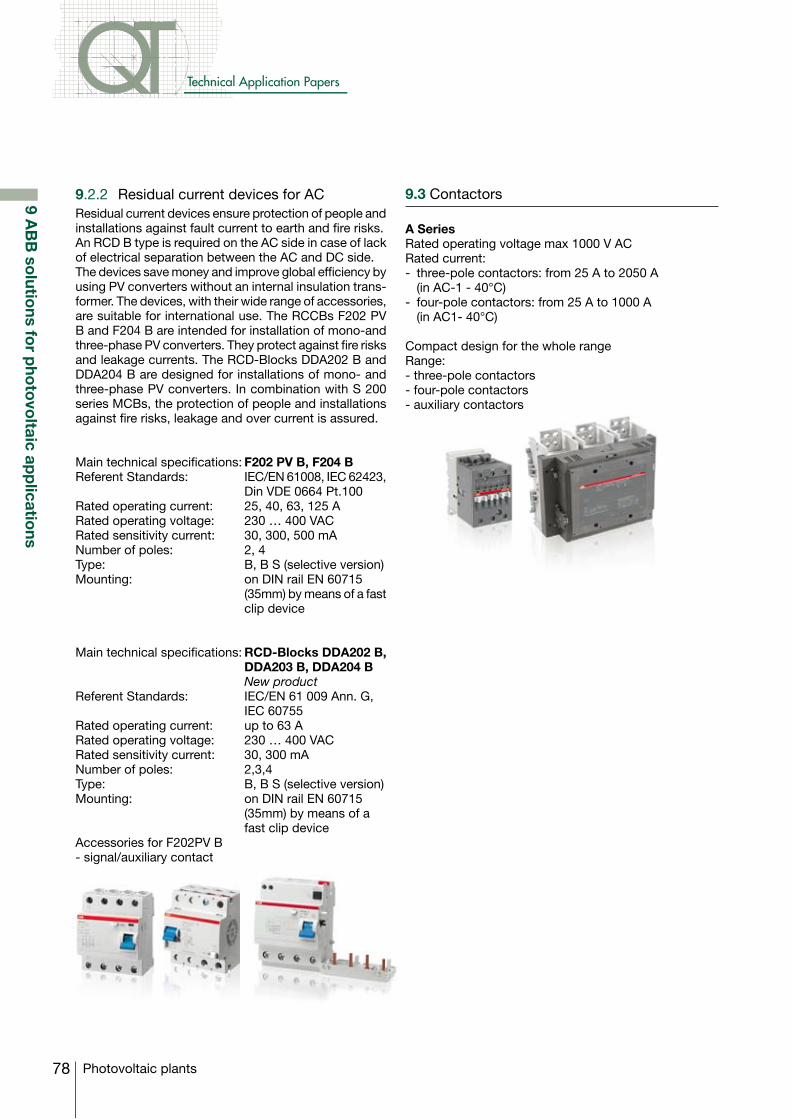
78
Technical Application Papers
Photovoltaic plants
9 AB
B so
lutions fo
r pho
tovo
ltaic app
lications
9.2.2 Residual current devices for ACResidual current devices ensure protection of people and installations against fault current to earth and fire risks. An RCD B type is required on the AC side in case of lack of electrical separation between the AC and DC side.The devices save money and improve global efficiency by using PV converters without an internal insulation trans-former. The devices, with their wide range of accessories, are suitable for international use. The RCCBs F202 PV B and F204 B are intended for installation of mono-and three-phase PV converters. They protect against fire risks and leakage currents. The RCD-Blocks DDA202 B and DDA204 B are designed for installations of mono- and three-phase PV converters. In combination with S 200 series MCBs, the protection of people and installations against fire risks, leakage and over current is assured.
Main technical specifications: F202 PV B, F204 BReferent Standards: IEC/EN 61008, IEC 62423, Din VDE 0664 Pt.100Rated operating current: 25, 40, 63, 125 ARated operating voltage: 230 … 400 VACRated sensitivity current: 30, 300, 500 mANumber of poles: 2, 4Type: B, B S (selective version)Mounting: on DIN rail EN 60715 (35mm) by means of a fast
clip device
Main technical specifications: RCD-Blocks DDA202 B, DDA203 B, DDA204 B New product
Referent Standards: IEC/EN 61 009 Ann. G, IEC 60755Rated operating current: up to 63 ARated operating voltage: 230 … 400 VACRated sensitivity current: 30, 300 mANumber of poles: 2,3,4Type: B, B S (selective version)Mounting: on DIN rail EN 60715
(35mm) by means of a fast clip device
Accessories for F202PV B- signal/auxiliary contact
9.3 Contactors
A SeriesRated operating voltage max 1000 V AC Rated current:- three-pole contactors: from 25 A to 2050 A (in AC-1 - 40°C)- four-pole contactors: from 25 A to 1000 A (in AC1- 40°C)
Compact design for the whole range Range:- three-pole contactors- four-pole contactors- auxiliary contactors
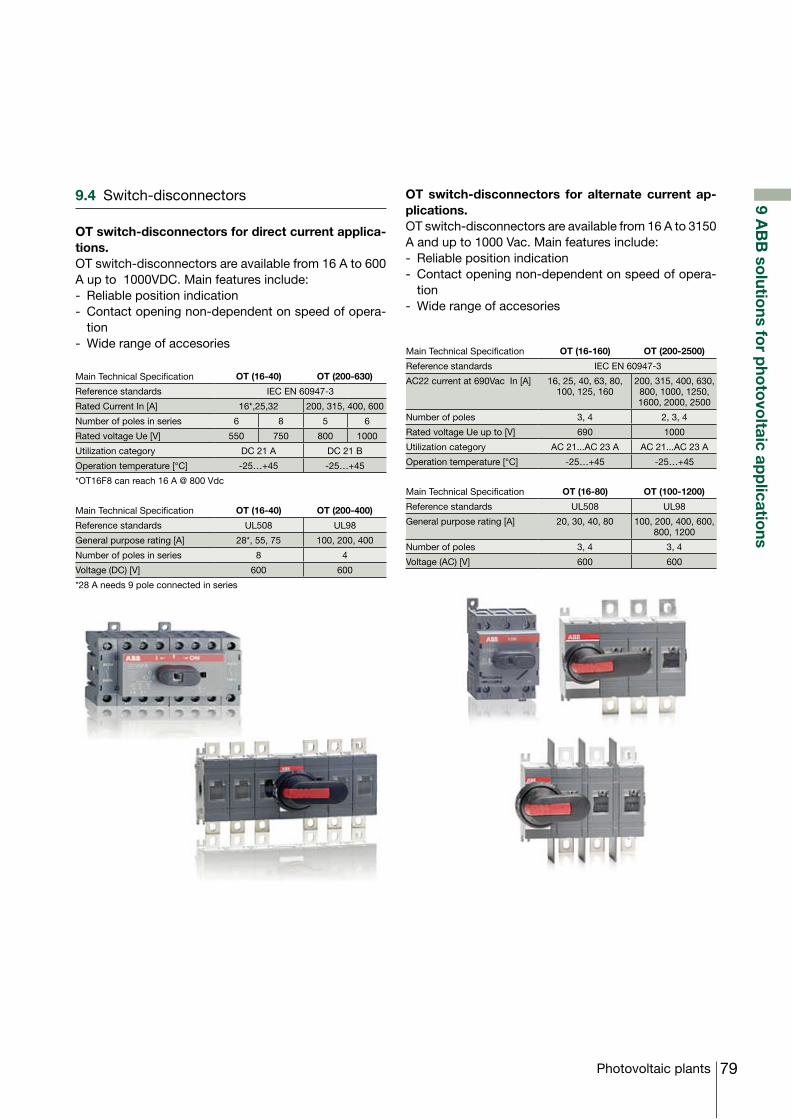
79Photovoltaic plants
9 AB
B so
lutions fo
r pho
tovo
ltaic app
lications
9.4 Switch-disconnectors
OT switch-disconnectors for direct current applica-tions.OT switch-disconnectors are available from 16 A to 600 A up to 1000VDC. Main features include:- Reliable position indication- Contact opening non-dependent on speed of opera-
tion- Wide range of accesories
OT switch-disconnectors for alternate current ap-plications.OT switch-disconnectors are available from 16 A to 3150 A and up to 1000 Vac. Main features include:- Reliable position indication- Contact opening non-dependent on speed of opera-
tion- Wide range of accesories
Main Technical Specification OT (16-40) OT (200-630)
Reference standards IEC EN 60947-3
Rated Current In [A] 16*,25,32 200, 315, 400, 600
Number of poles in series 6 8 5 6
Rated voltage Ue [V] 550 750 800 1000
Utilization category DC 21 A DC 21 B
Operation temperature [°C] -25…+45 -25…+45
*OT16F8 can reach 16 A @ 800 Vdc
Main Technical Specification OT (16-40) OT (200-400)
Reference standards UL508 UL98
General purpose rating [A] 28*, 55, 75 100, 200, 400
Number of poles in series 8 4
Voltage (DC) [V] 600 600
*28 A needs 9 pole connected in series
Main Technical Specification OT (16-160) OT (200-2500)
Reference standards IEC EN 60947-3
AC22 current at 690Vac In [A] 16, 25, 40, 63, 80, 100, 125, 160
200, 315, 400, 630, 800, 1000, 1250, 1600, 2000, 2500
Number of poles 3, 4 2, 3, 4
Rated voltage Ue up to [V] 690 1000
Utilization category AC 21...AC 23 A AC 21...AC 23 A
Operation temperature [°C] -25…+45 -25…+45
Main Technical Specification OT (16-80) OT (100-1200)
Reference standards UL508 UL98
General purpose rating [A] 20, 30, 40, 80 100, 200, 400, 600, 800, 1200
Number of poles 3, 4 3, 4
Voltage (AC) [V] 600 600
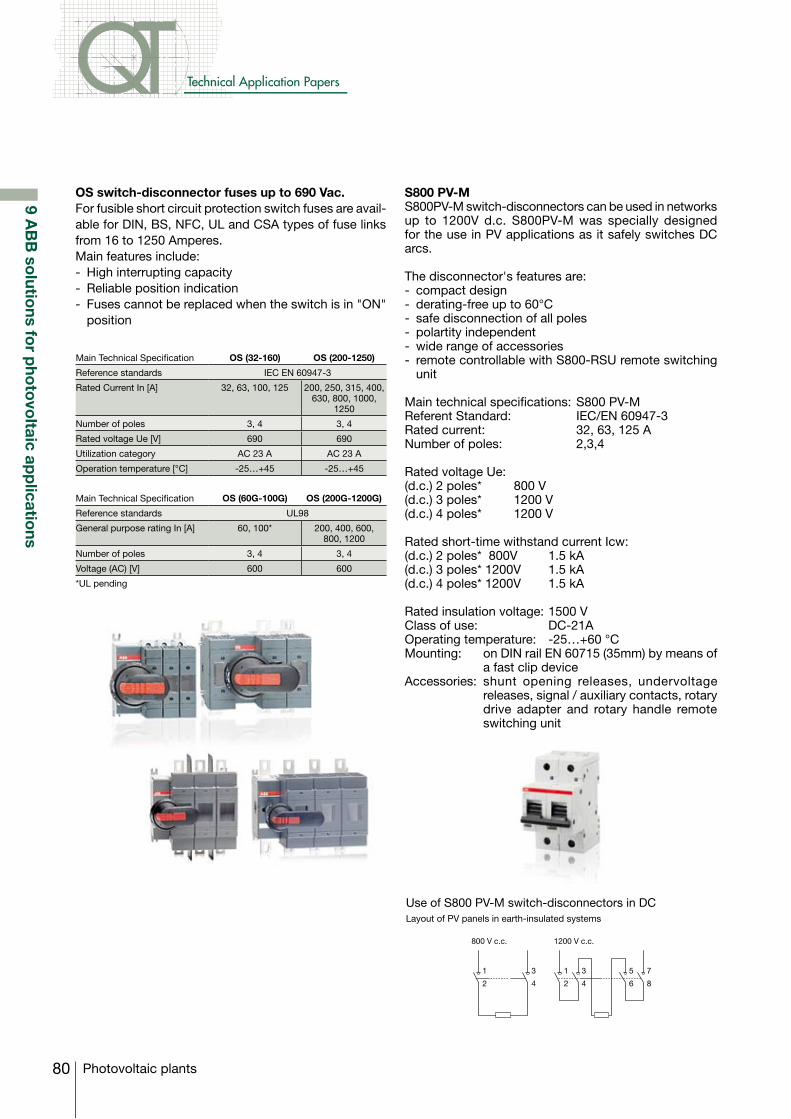
80
Technical Application Papers
Photovoltaic plants
Use of S800 PV-M switch-disconnectors in DCLayout of PV panels in earth-insulated systems
1
2
3
4
800 V c.c. 1200 V c.c.
1
2
3
4
5
6
7
8
S800 PV-MS800PV-M switch-disconnectors can be used in networks up to 1200V d.c. S800PV-M was specially designed for the use in PV applications as it safely switches DC arcs.
The disconnector's features are:- compact design- derating-free up to 60°C- safe disconnection of all poles- polartity independent- wide range of accessories- remote controllable with S800-RSU remote switching
unit
Main technical specifications: S800 PV-MReferent Standard: IEC/EN 60947-3Rated current: 32, 63, 125 ANumber of poles: 2,3,4
Rated voltage Ue: (d.c.) 2 poles* 800 V(d.c.) 3 poles* 1200 V(d.c.) 4 poles* 1200 V
Rated short-time withstand current Icw:(d.c.) 2 poles* 800V 1.5 kA(d.c.) 3 poles* 1200V 1.5 kA(d.c.) 4 poles* 1200V 1.5 kA
Rated insulation voltage: 1500 VClass of use: DC-21AOperating temperature: -25…+60 °CMounting: on DIN rail EN 60715 (35mm) by means of
a fast clip deviceAccessories: shunt opening releases, undervoltage
releases, signal / auxiliary contacts, rotary drive adapter and rotary handle remote switching unit
OS switch-disconnector fuses up to 690 Vac.For fusible short circuit protection switch fuses are avail-able for DIN, BS, NFC, UL and CSA types of fuse links from 16 to 1250 Amperes.Main features include:- High interrupting capacity- Reliable position indication- Fuses cannot be replaced when the switch is in "ON"
position
Main Technical Specification OS (32-160) OS (200-1250)
Reference standards IEC EN 60947-3
Rated Current In [A] 32, 63, 100, 125 200, 250, 315, 400, 630, 800, 1000,
1250
Number of poles 3, 4 3, 4
Rated voltage Ue [V] 690 690
Utilization category AC 23 A AC 23 A
Operation temperature [°C] -25…+45 -25…+45
Main Technical Specification OS (60G-100G) OS (200G-1200G)
Reference standards UL98
General purpose rating In [A] 60, 100* 200, 400, 600, 800, 1200
Number of poles 3, 4 3, 4
Voltage (AC) [V] 600 600
*UL pending
9 AB
B so
lutions fo
r pho
tovo
ltaic app
lications
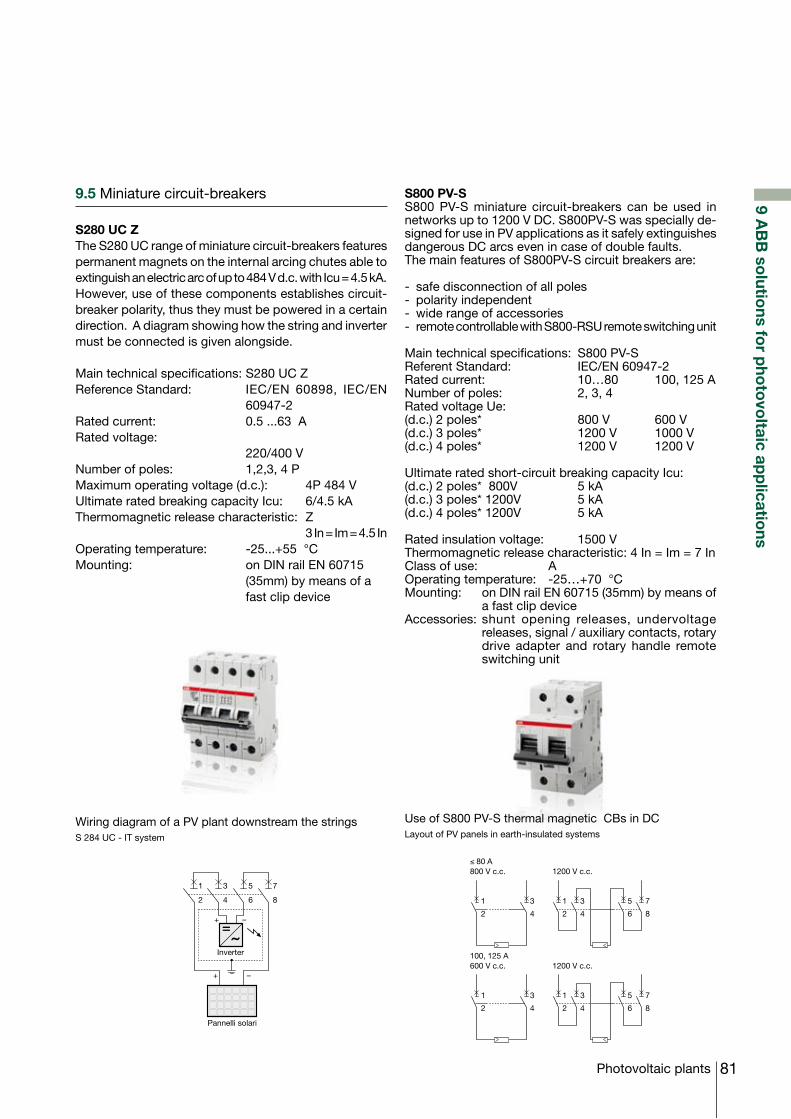
81Photovoltaic plants
1
2
3
4
600 V c.c. 1200 V c.c.
1
2
3
4
5
6
7
8
100, 125 A
1
2
3
4
800 V c.c. 1200 V c.c.
1
2
3
4
5
6
7
8
≤ 80 A
Wiring diagram of a PV plant downstream the stringsS 284 UC - IT system
Use of S800 PV-S thermal magnetic CBs in DCLayout of PV panels in earth-insulated systems
9.5 Miniature circuit-breakers
S280 UC ZThe S280 UC range of miniature circuit-breakers features permanent magnets on the internal arcing chutes able to extinguish an electric arc of up to 484 V d.c. with Icu = 4.5 kA. However, use of these components establishes circuit-breaker polarity, thus they must be powered in a certain direction. A diagram showing how the string and inverter must be connected is given alongside.
Main technical specifications: S280 UC ZReference Standard: IEC/EN 60898, IEC/EN
60947-2Rated current: 0.5 ...63 ARated voltage:
220/400 VNumber of poles: 1,2,3, 4 PMaximum operating voltage (d.c.): 4P 484 V Ultimate rated breaking capacity Icu: 6/4.5 kAThermomagnetic release characteristic: Z 3 In = Im = 4.5 InOperating temperature: -25...+55 °C Mounting: on DIN rail EN 60715
(35mm) by means of a fast clip device
S800 PV-SS800 PV-S miniature circuit-breakers can be used in networks up to 1200 V DC. S800PV-S was specially de-signed for use in PV applications as it safely extinguishes dangerous DC arcs even in case of double faults.The main features of S800PV-S circuit breakers are:
- safe disconnection of all poles- polarity independent- wide range of accessories- remote controllable with S800-RSU remote switching unit
Main technical specifications: S800 PV-SReferent Standard: IEC/EN 60947-2Rated current: 10…80 100, 125 ANumber of poles: 2, 3, 4Rated voltage Ue: (d.c.) 2 poles* 800 V 600 V(d.c.) 3 poles* 1200 V 1000 V(d.c.) 4 poles* 1200 V 1200 V
Ultimate rated short-circuit breaking capacity Icu:(d.c.) 2 poles* 800V 5 kA(d.c.) 3 poles* 1200V 5 kA(d.c.) 4 poles* 1200V 5 kA
Rated insulation voltage: 1500 VThermomagnetic release characteristic: 4 In = Im = 7 InClass of use: AOperating temperature: -25…+70 °C Mounting: on DIN rail EN 60715 (35mm) by means of
a fast clip deviceAccessories: shunt opening releases, undervoltage
releases, signal / auxiliary contacts, rotary drive adapter and rotary handle remote switching unit
Pannelli solari
Inverter
–+
–+
1
2
3
4
5
6
7
8
9 AB
B so
lutions fo
r pho
tovo
ltaic app
lications
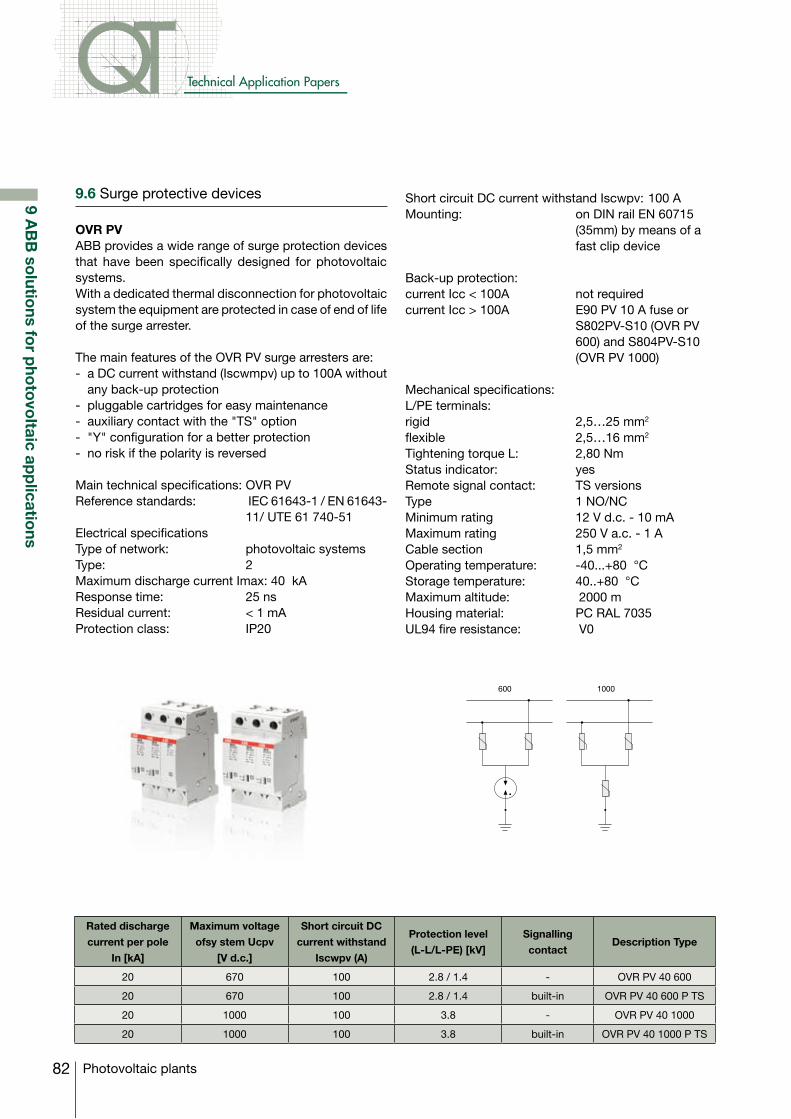
82
Technical Application Papers
Photovoltaic plants
9.6 Surge protective devices
OVR PVABB provides a wide range of surge protection devices that have been specifically designed for photovoltaic systems. With a dedicated thermal disconnection for photovoltaic system the equipment are protected in case of end of life of the surge arrester.
The main features of the OVR PV surge arresters are:- a DC current withstand (Iscwmpv) up to 100A without
any back-up protection- pluggable cartridges for easy maintenance- auxiliary contact with the "TS" option- "Y" configuration for a better protection- no risk if the polarity is reversed
Main technical specifications: OVR PVReference standards: IEC 61643-1 / EN 61643-
11/ UTE 61 740-51Electrical specificationsType of network: photovoltaic systemsType: 2Maximum discharge current Imax: 40 kAResponse time: 25 nsResidual current: < 1 mA Protection class: IP20
600 1000
9 AB
B so
lutions fo
r pho
tovo
ltaic app
lications
Short circuit DC current withstand Iscwpv: 100 AMounting: on DIN rail EN 60715
(35mm) by means of a fast clip device
Back-up protection: current Icc < 100A not requiredcurrent Icc > 100A E90 PV 10 A fuse or
S802PV-S10 (OVR PV 600) and S804PV-S10 (OVR PV 1000)
Mechanical specifications:L/PE terminals:rigid 2,5…25 mm2
flexible 2,5…16 mm2
Tightening torque L: 2,80 NmStatus indicator: yesRemote signal contact: TS versionsType 1 NO/NC Minimum rating 12 V d.c. - 10 mAMaximum rating 250 V a.c. - 1 ACable section 1,5 mm2 Operating temperature: -40...+80 °CStorage temperature: 40..+80 °CMaximum altitude: 2000 mHousing material: PC RAL 7035UL94 fire resistance: V0
Rated discharge
current per pole
In [kA]
Maximum voltage
ofsy stem Ucpv
[V d.c.]
Short circuit DC
current withstand
Iscwpv (A)
Protection level
(L-L/L-PE) [kV]
Signalling
contactDescription Type
20 670 100 2.8 / 1.4 - OVR PV 40 600
20 670 100 2.8 / 1.4 built-in OVR PV 40 600 P TS
20 1000 100 3.8 - OVR PV 40 1000
20 1000 100 3.8 built-in OVR PV 40 1000 P TS
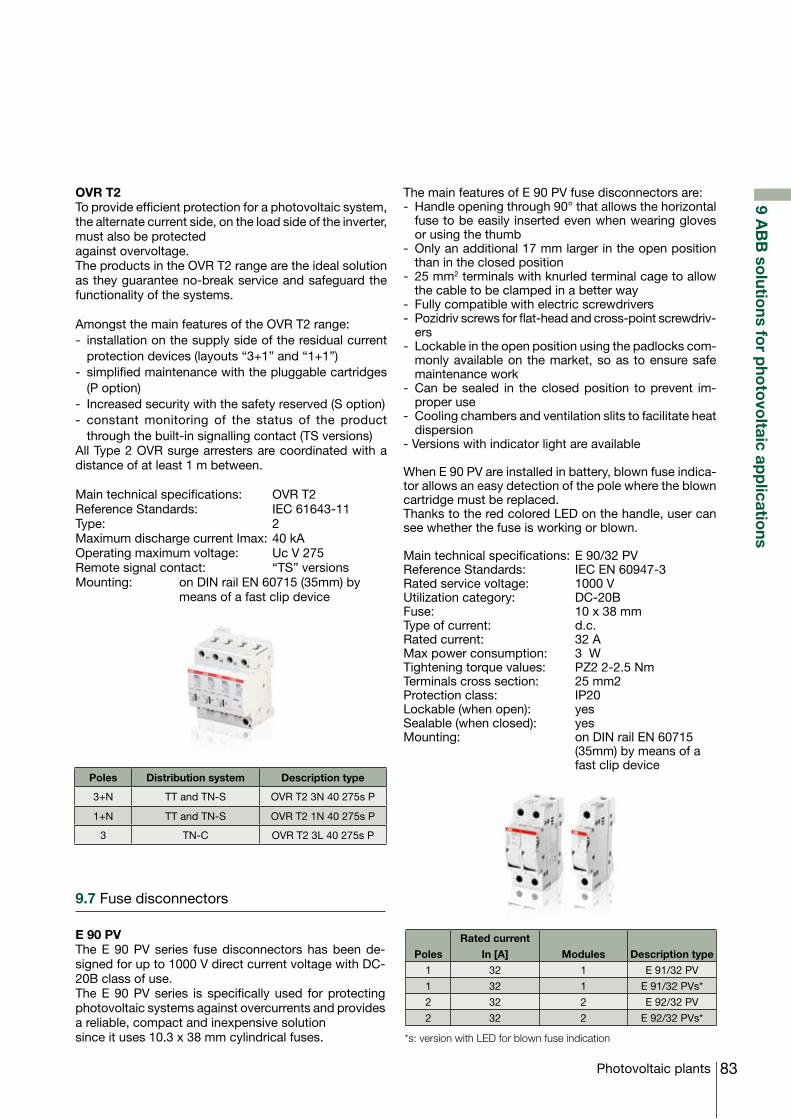
83Photovoltaic plants
OVR T2To provide efficient protection for a photovoltaic system, the alternate current side, on the load side of the inverter, must also be protectedagainst overvoltage. The products in the OVR T2 range are the ideal solution as they guarantee no-break service and safeguard the functionality of the systems.
Amongst the main features of the OVR T2 range:- installation on the supply side of the residual current
protection devices (layouts “3+1” and “1+1”)- simplified maintenance with the pluggable cartridges
(P option)- Increased security with the safety reserved (S option)- constant monitoring of the status of the product
through the built-in signalling contact (TS versions)All Type 2 OVR surge arresters are coordinated with a distance of at least 1 m between.
Main technical specifications: OVR T2Reference Standards: IEC 61643-11Type: 2Maximum discharge current Imax: 40 kAOperating maximum voltage: Uc V 275Remote signal contact: “TS” versionsMounting: on DIN rail EN 60715 (35mm) by
means of a fast clip device
Poles Distribution system Description type
3+N TT and TN-S OVR T2 3N 40 275s P
1+N TT and TN-S OVR T2 1N 40 275s P
3 TN-C OVR T2 3L 40 275s P
9.7 Fuse disconnectors
E 90 PVThe E 90 PV series fuse disconnectors has been de-signed for up to 1000 V direct current voltage with DC-20B class of use. The E 90 PV series is specifically used for protecting photovoltaic systems against overcurrents and provides a reliable, compact and inexpensive solutionsince it uses 10.3 x 38 mm cylindrical fuses.
The main features of E 90 PV fuse disconnectors are:- Handle opening through 90° that allows the horizontal
fuse to be easily inserted even when wearing gloves or using the thumb
- Only an additional 17 mm larger in the open position than in the closed position
- 25 mm2 terminals with knurled terminal cage to allow the cable to be clamped in a better way
- Fully compatible with electric screwdrivers- Pozidriv screws for flat-head and cross-point screwdriv-
ers- Lockable in the open position using the padlocks com-
monly available on the market, so as to ensure safe maintenance work
- Can be sealed in the closed position to prevent im-proper use
- Cooling chambers and ventilation slits to facilitate heat dispersion
- Versions with indicator light are available
When E 90 PV are installed in battery, blown fuse indica-tor allows an easy detection of the pole where the blown cartridge must be replaced. Thanks to the red colored LED on the handle, user can see whether the fuse is working or blown.
Main technical specifications: E 90/32 PVReference Standards: IEC EN 60947-3Rated service voltage: 1000 V Utilization category: DC-20BFuse: 10 x 38 mmType of current: d.c.Rated current: 32 AMax power consumption: 3 W Tightening torque values: PZ2 2-2.5 NmTerminals cross section: 25 mm2Protection class: IP20Lockable (when open): yesSealable (when closed): yesMounting: on DIN rail EN 60715
(35mm) by means of a fast clip device
Poles
Rated current
In [A] Modules Description type
1 32 1 E 91/32 PV
1 32 1 E 91/32 PVs*
2 32 2 E 92/32 PV
2 32 2 E 92/32 PVs*
*s: version with LED for blown fuse indication
9 AB
B so
lutions fo
r pho
tovo
ltaic app
lications
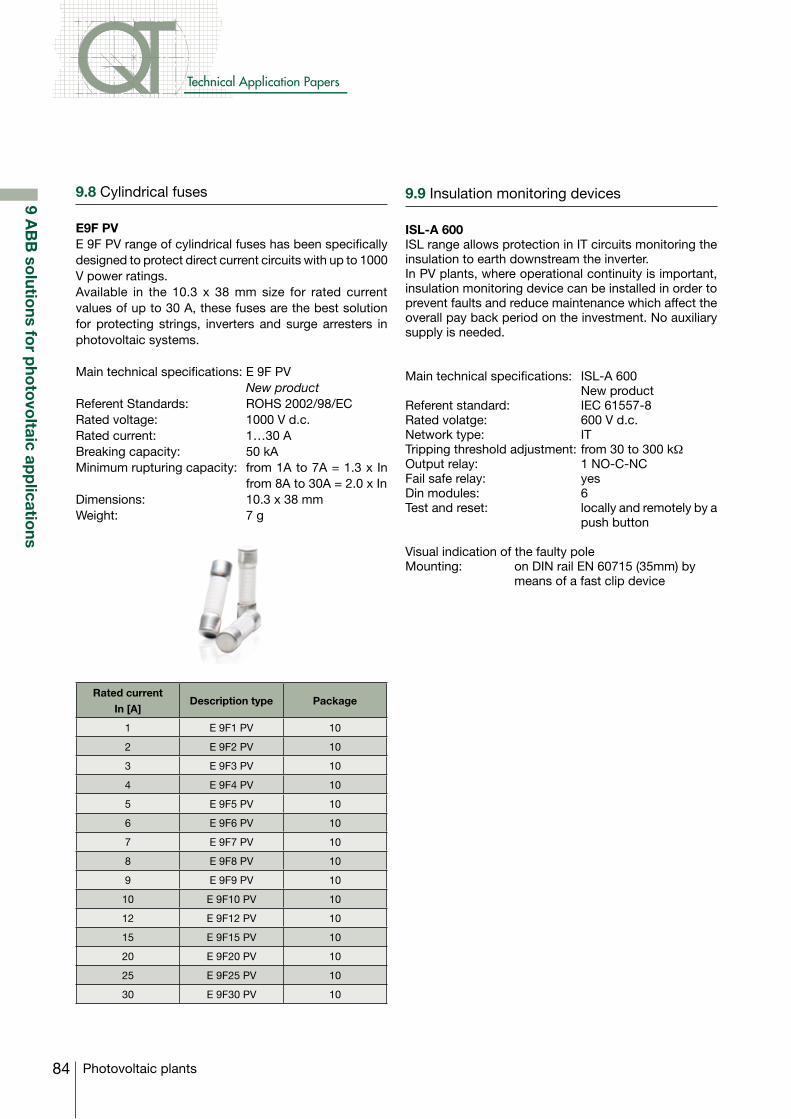
84
Technical Application Papers
Photovoltaic plants
9.8 Cylindrical fuses
E9F PVE 9F PV range of cylindrical fuses has been specifically designed to protect direct current circuits with up to 1000 V power ratings. Available in the 10.3 x 38 mm size for rated current values of up to 30 A, these fuses are the best solution for protecting strings, inverters and surge arresters in photovoltaic systems.
Main technical specifications: E 9F PV New product
Referent Standards: ROHS 2002/98/ECRated voltage: 1000 V d.c.Rated current: 1…30 ABreaking capacity: 50 kAMinimum rupturing capacity: from 1A to 7A = 1.3 x In
from 8A to 30A = 2.0 x InDimensions: 10.3 x 38 mmWeight: 7 g
9.9 Insulation monitoring devices
ISL-A 600ISL range allows protection in IT circuits monitoring the insulation to earth downstream the inverter.In PV plants, where operational continuity is important, insulation monitoring device can be installed in order to prevent faults and reduce maintenance which affect the overall pay back period on the investment. No auxiliary supply is needed.
Main technical specifications: ISL-A 600 New product
Referent standard: IEC 61557-8Rated volatge: 600 V d.c.Network type: ITTripping threshold adjustment: from 30 to 300 kΩOutput relay: 1 NO-C-NCFail safe relay: yes Din modules: 6Test and reset: locally and remotely by a
push button
Visual indication of the faulty poleMounting: on DIN rail EN 60715 (35mm) by
means of a fast clip device
Rated current
In [A]Description type Package
1 E 9F1 PV 10
2 E 9F2 PV 10
3 E 9F3 PV 10
4 E 9F4 PV 10
5 E 9F5 PV 10
6 E 9F6 PV 10
7 E 9F7 PV 10
8 E 9F8 PV 10
9 E 9F9 PV 10
10 E 9F10 PV 10
12 E 9F12 PV 10
15 E 9F15 PV 10
20 E 9F20 PV 10
25 E 9F25 PV 10
30 E 9F30 PV 10
9 AB
B so
lutions fo
r pho
tovo
ltaic app
lications
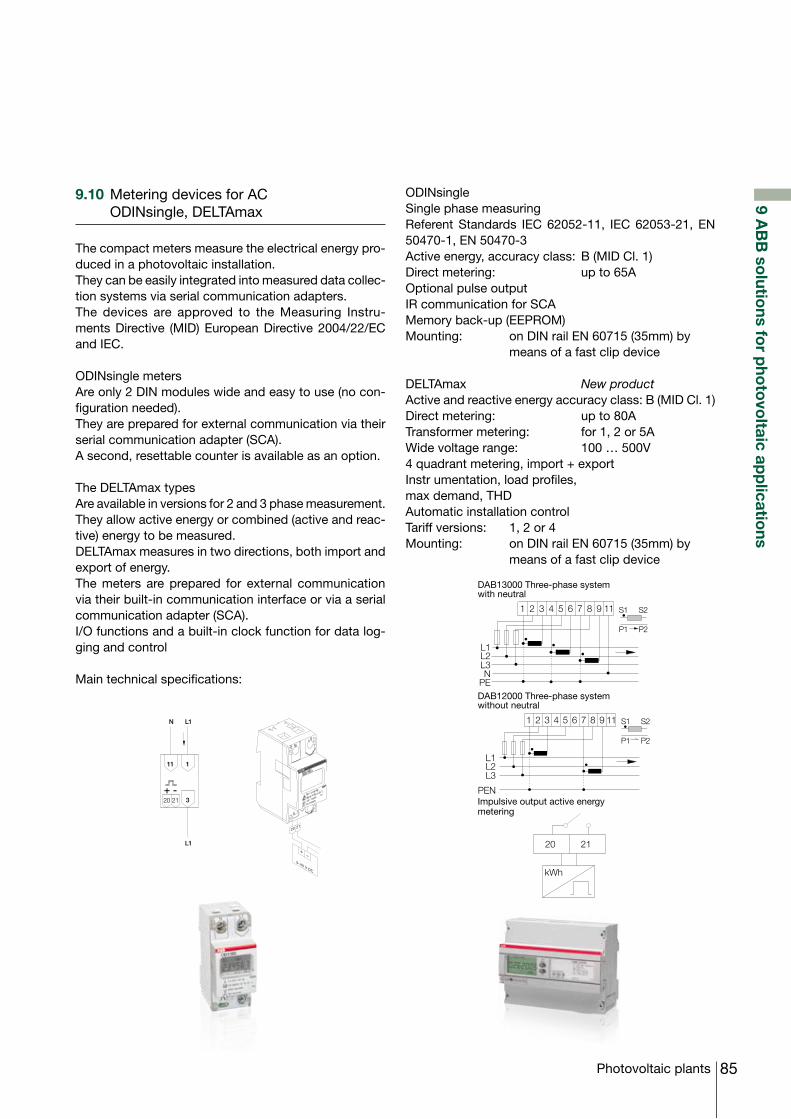
85Photovoltaic plants
9 AB
B so
lutions fo
r pho
tovo
ltaic app
lications
9.10 Metering devices for AC ODINsingle, DELTAmax
The compact meters measure the electrical energy pro-duced in a photovoltaic installation. They can be easily integrated into measured data collec-tion systems via serial communication adapters. The devices are approved to the Measuring Instru-ments Directive (MID) European Directive 2004/22/EC and IEC.
ODINsingle metersAre only 2 DIN modules wide and easy to use (no con-figuration needed). They are prepared for external communication via their serial communication adapter (SCA). A second, resettable counter is available as an option.
The DELTAmax typesAre available in versions for 2 and 3 phase measurement. They allow active energy or combined (active and reac-tive) energy to be measured.DELTAmax measures in two directions, both import and export of energy.The meters are prepared for external communication via their built-in communication interface or via a serial communication adapter (SCA).I/O functions and a built-in clock function for data log-ging and control
Main technical specifications:
ODINsingle Single phase measuringReferent Standards IEC 62052-11, IEC 62053-21, EN 50470-1, EN 50470-3Active energy, accuracy class: B (MID Cl. 1)Direct metering: up to 65AOptional pulse outputIR communication for SCAMemory back-up (EEPROM)Mounting: on DIN rail EN 60715 (35mm) by
means of a fast clip device
DELTAmax New productActive and reactive energy accuracy class: B (MID Cl. 1)Direct metering: up to 80ATransformer metering: for 1, 2 or 5AWide voltage range: 100 … 500V4 quadrant metering, import + exportInstr umentation, load profiles,max demand, THDAutomatic installation controlTariff versions: 1, 2 or 4Mounting: on DIN rail EN 60715 (35mm) by
means of a fast clip device
N L1
L1
20 21 3
111
L1
1 2 3 4 5 6 7 8 9
L2L3N
PE
11 S1 S2
P1 P2
L1L2L3
PEN
1 2 3 4 5 6 7 8 9 11 S1 S2
P1 P2
kWh
20 21
DAB12000 Three-phase systemwithout neutral
DAB13000 Three-phase systemwith neutral
Impulsive output active energymetering
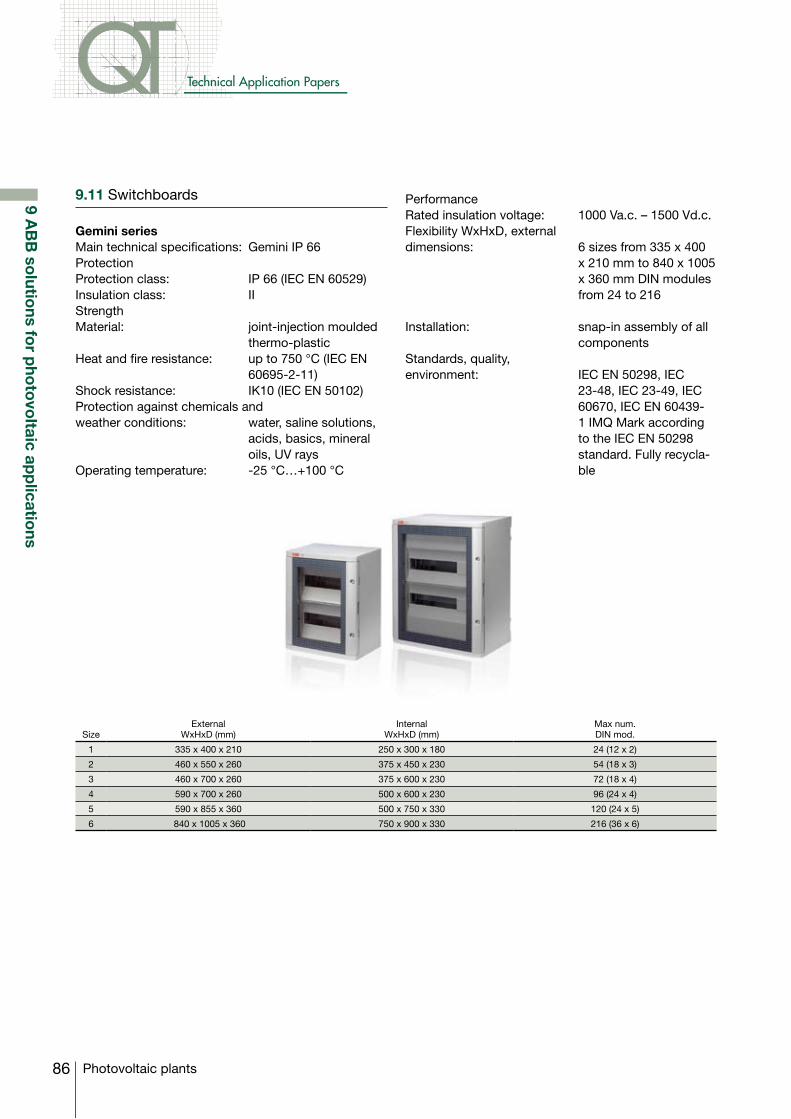
86
Technical Application Papers
Photovoltaic plants
9 AB
B so
lutions fo
r pho
tovo
ltaic app
lications
9.11 Switchboards
Gemini series Main technical specifications: Gemini IP 66ProtectionProtection class: IP 66 (IEC EN 60529)Insulation class: II StrengthMaterial: joint-injection moulded
thermo-plasticHeat and fire resistance: up to 750 °C (IEC EN
60695-2-11)Shock resistance: IK10 (IEC EN 50102)Protection against chemicals andweather conditions: water, saline solutions,
acids, basics, mineral oils, UV rays
Operating temperature: -25 °C…+100 °C
Size External
WxHxD (mm)Internal
WxHxD (mm)Max num.DIN mod.
1 335 x 400 x 210 250 x 300 x 180 24 (12 x 2)
2 460 x 550 x 260 375 x 450 x 230 54 (18 x 3)
3 460 x 700 x 260 375 x 600 x 230 72 (18 x 4)
4 590 x 700 x 260 500 x 600 x 230 96 (24 x 4)
5 590 x 855 x 360 500 x 750 x 330 120 (24 x 5)
6 840 x 1005 x 360 750 x 900 x 330 216 (36 x 6)
PerformanceRated insulation voltage: 1000 Va.c. – 1500 Vd.c.Flexibility WxHxD, external dimensions: 6 sizes from 335 x 400
x 210 mm to 840 x 1005 x 360 mm DIN modules from 24 to 216
Installation: snap-in assembly of all components
Standards, quality, environment: IEC EN 50298, IEC
23-48, IEC 23-49, IEC 60670, IEC EN 60439-1IMQMarkaccordingto the IEC EN 50298 standard. Fully recycla-ble

87Photovoltaic plants
9 AB
B so
lutions fo
r pho
tovo
ltaic app
lications
9.12 Wall-mounted consumer units
Europa seriesThe Europa series wall-mounted consumer units feature IP65 protection which makes them ideal for installation outdoors. This means that they can be used for making string boxes on the load side of photovoltaic strings.The main features of the Europa series wall-mounted consumer units: - class II insulation- manufactured in self-extinguishing thermoplastic mate-
rial able to withstand abnormal heat and fire up to 650 °C (glow wire test) in compliance with IEC 60695-2-11 standards
- installation temperature: -25 °C to +60 °C- rated insulation voltage: 1000 V a.c.; 1500 V d.c.- shock resistance: 6 joules (IK 08 degrees)- pull-out DIN channel holder frame for more convenient
bench wiring.Can be disassembled (and re-assembled by means of a snap-fit mechanism) to make the individual wires easier to route- 53, 68 and 75 mm depth switchgear can be installed- models with 8 or more modules equipped with bi-metal
and rigid flanges for easier insertion of pipes and ca-bles
- consumer units in compliance with IEC 23-48, IEC 23-49andIEC60670standards-IMQMark
9.13 Junction boxes
Degree of protection: IP 65ABB also provides IP65 polycarbonate junction boxes that are perfect for use in outdoor installations.
The main features of the junction boxes are:- class II insulation- manufactured in self-extinguishing thermoplastic
material able to withstand abnormal heat and fire up to 960 °C (glow wire test) in compliance with IEC 60695-2-11 standards
- installation temperature: -25 °C to +60 °C- rated insulation voltage: 1000 V a.c.; 1500 V d.c.- shock resistance: 20 joules (IK 10 degrees)- junction boxes in compliance with IEC 23-48 and IEC
60670 standards-IMQMark
Description Type Dimensions
IP65 consumer unit P/smoke grey 4M 140 x 220 x 140
IP65 consumer unit P/smoke grey 8M 205 x 220 x 140
IP65 consumer unit P/smoke grey 12M 275 x 220 x 140
IP65 consumer unit P/smoke grey 8M 1 row 380 x 220 x 140
IP65 consumer unit P/smoke grey 24M 2 rows 275 x 370 x 140
IP65 consumer unit P/smoke grey 36M 2 rows 380 x 370 x 140
Description Type Dimensions
Box IP65 PC 140 x 220 x 140
Box IP65 PC 205 x 220 x 140
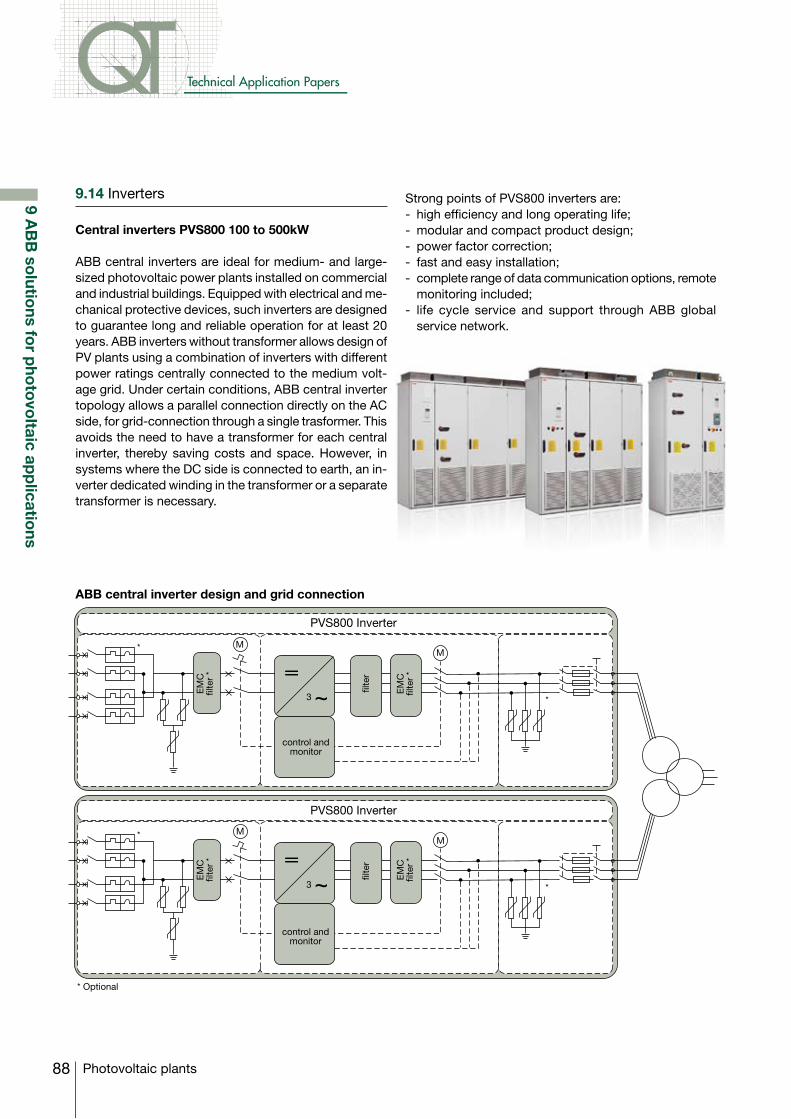
88
Technical Application Papers
Photovoltaic plants
9.14 Inverters
Central inverters PVS800 100 to 500kW
ABB central inverters are ideal for medium- and large-sized photovoltaic power plants installed on commercial and industrial buildings. Equipped with electrical and me-chanical protective devices, such inverters are designed to guarantee long and reliable operation for at least 20 years. ABB inverters without transformer allows design of PV plants using a combination of inverters with different power ratings centrally connected to the medium volt-age grid. Under certain conditions, ABB central inverter topology allows a parallel connection directly on the AC side, for grid-connection through a single trasformer. This avoids the need to have a transformer for each central inverter, thereby saving costs and space. However, in systems where the DC side is connected to earth, an in-verter dedicated winding in the transformer or a separate transformer is necessary.
Strong points of PVS800 inverters are:- high efficiency and long operating life; - modular and compact product design;- power factor correction;- fast and easy installation;- complete range of data communication options, remote
monitoring included;- life cycle service and support through ABB global
service network.
ABB central inverter design and grid connection
EM
Cfil
ter
*E
MC
filte
r *
control andmonitor
control andmonitor
EM
Cfil
ter
*E
MC
filte
r *
filte
rfil
ter
3
3
MM
MM
*
*
* Optional
PVS800 Inverter
PVS800 Inverter
*
*
9 AB
B so
lutions fo
r pho
tovo
ltaic app
lications
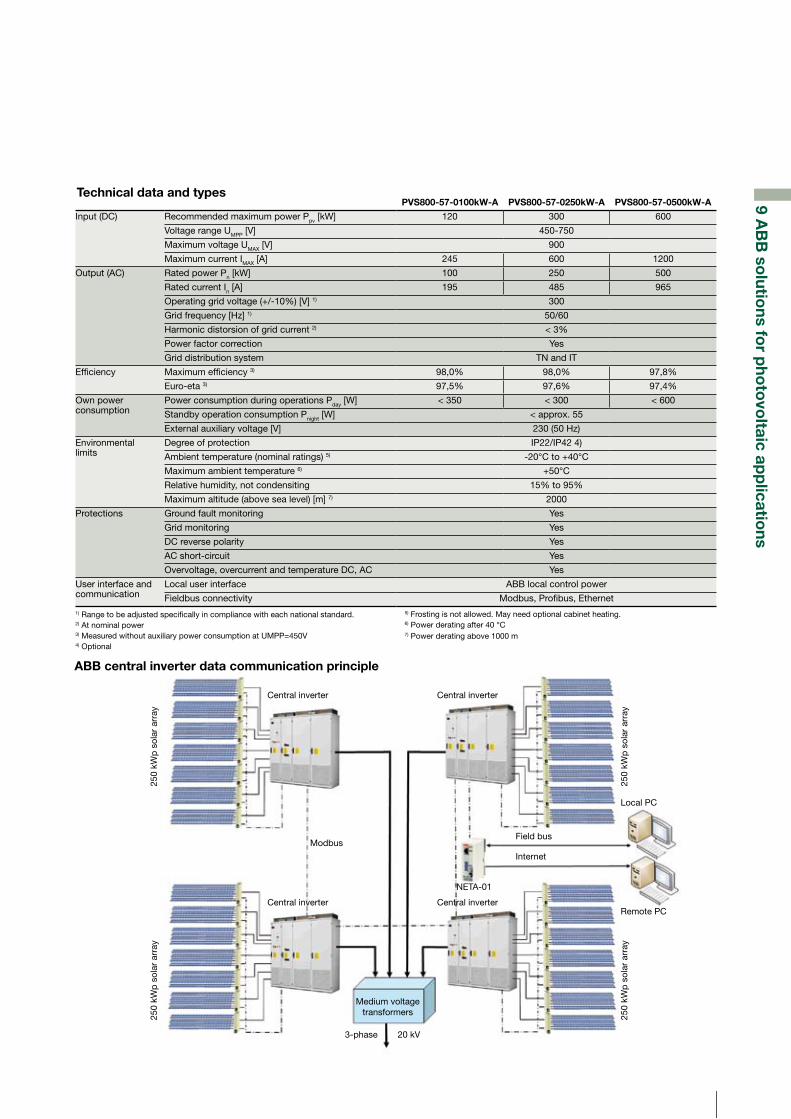
89Photovoltaic plants
Central inverter
Central inverter
Central inverter
Central inverter
Medium voltagetransformers
20 kV3-phase
ModbusField bus
Local PC
Remote PC
Internet
NETA-01
250
kWp
sol
ar a
rray
250
kWp
sol
ar a
rray
250
kWp
sol
ar a
rray
250
kWp
sol
ar a
rray
PVS800-57-0100kW-A PVS800-57-0250kW-A PVS800-57-0500kW-A
Input (DC) Recommended maximum power Ppv [kW] 120 300 600
Voltage range UMPP [V] 450-750
Maximum voltage UMAX [V] 900
Maximum current IMAX [A] 245 600 1200
Output (AC) Rated power Pn [kW] 100 250 500
Rated current In [A] 195 485 965
Operating grid voltage (+/-10%) [V] 1) 300
Grid frequency [Hz] 1) 50/60
Harmonic distorsion of grid current 2) < 3%
Power factor correction Yes
Grid distribution system TN and IT
Efficiency Maximum efficiency 3) 98,0% 98,0% 97,8%
Euro-eta 3) 97,5% 97,6% 97,4%
Own power consumption
Power consumption during operations Pday [W] < 350 < 300 < 600
Standby operation consumption Pnight [W] < approx. 55
External auxiliary voltage [V] 230 (50 Hz)
Environmentallimits
Degree of protection IP22/IP42 4)
Ambient temperature (nominal ratings) 5) -20°C to +40°C
Maximum ambient temperature 6) +50°C
Relative humidity, not condensiting 15% to 95%
Maximum altitude (above sea level) [m] 7) 2000
Protections Ground fault monitoring Yes
Grid monitoring Yes
DC reverse polarity Yes
AC short-circuit Yes
Overvoltage, overcurrent and temperature DC, AC Yes
User interface and communication
Local user interface ABB local control power
Fieldbus connectivity Modbus, Profibus, Ethernet 1) Range to be adjusted specifically in compliance with each national standard. 2) At nominal power 3) Measured without auxiliary power consumption at UMPP=450V4) Optional
Technical data and types
ABB central inverter data communication principle
5) Frosting is not allowed. May need optional cabinet heating. 6) Power derating after 40 °C 7) Power derating above 1000 m
9 AB
B so
lutions fo
r pho
tovo
ltaic app
lications

90
Technical Application Papers
Photovoltaic plants
9 AB
B so
lutions fo
r pho
tovo
ltaic app
lications
9.15 Terminal blocks
Compliance with the Standards IEC 60947-7-1, IEC 60947-7-2Parallel interconnections availableSelf-extinguishing material V0
Screw connectionVoltage: max 1000 VCurrent: max 415 ACross sectional area: max 240 mm2 Self-stripping connection (ADO system)Voltage: max 1000 VCurrent: max 32 ACross sectional area: max 4 mm2Available also in the version ADO screw-clamp
Spring connectionVoltage: max 800 VCurrent: max 125 ACross sectional area: max 35 mm2
New SNK SeriesScrew connectionVoltage: max 1.000 VCurrent: max 232 ACross sectional area: max 95 mm2
9.16 Motors
Low Voltage asynchronous motors Aluminum motorsAvailable both in standard as well as in self-braking versionPower: from 0.06 kW to 1.1 kWPoles: 2, 4, 6, 8Voltage: up to 690 VProtection: IP 55
Main advantages:- high reliability- reduced maintenance- designed to operate under critical environmental condi-
tions
Brushless motors Series 9CAbsolute feedback transducer Emergency brake Overload: up to 4 times the rated value Inrush torque: up to 90 NmCompact overall dimensions
Main advantages:- compact dimensions - sturdy construction in IP 65- uniformity of rotation al low rpm- high inrush torques
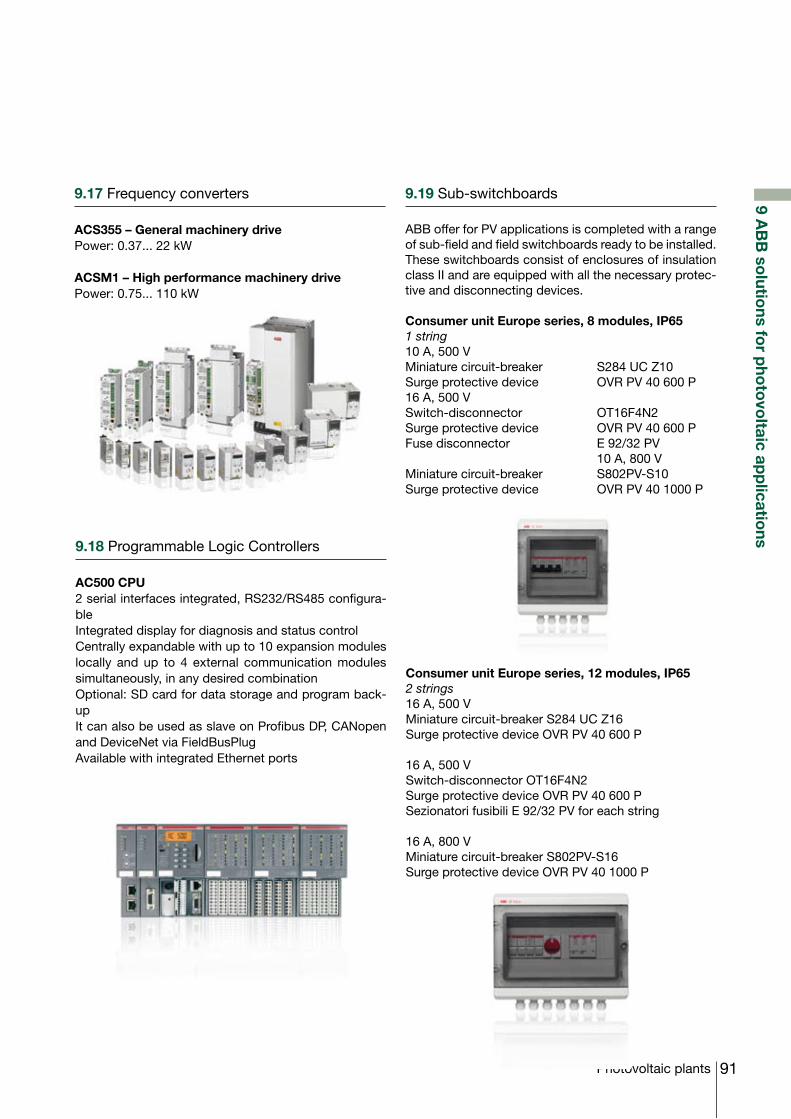
91Photovoltaic plants
9 AB
B so
lutions fo
r pho
tovo
ltaic app
lications
9.17 Frequency converters
ACS355 – General machinery drivePower: 0.37... 22 kW
ACSM1 – High performance machinery drivePower: 0.75... 110 kW
9.19 Sub-switchboards
ABB offer for PV applications is completed with a range of sub-field and field switchboards ready to be installed. These switchboards consist of enclosures of insulation class II and are equipped with all the necessary protec-tive and disconnecting devices.
Consumer unit Europe series, 8 modules, IP651 string10 A, 500 VMiniature circuit-breaker S284 UC Z10Surge protective device OVR PV 40 600 P16 A, 500 VSwitch-disconnector OT16F4N2Surge protective device OVR PV 40 600 PFuse disconnector E 92/32 PV 10 A, 800 VMiniature circuit-breaker S802PV-S10Surge protective device OVR PV 40 1000 P
9.18 Programmable Logic Controllers
AC500 CPU2 serial interfaces integrated, RS232/RS485 configura-bleIntegrated display for diagnosis and status controlCentrally expandable with up to 10 expansion modules locally and up to 4 external communication modules simultaneously, in any desired combinationOptional: SD card for data storage and program back-upIt can also be used as slave on Profibus DP, CANopen and DeviceNet via FieldBusPlugAvailable with integrated Ethernet ports
Consumer unit Europe series, 12 modules, IP652 strings16 A, 500 VMiniature circuit-breaker S284 UC Z16Surge protective device OVR PV 40 600 P
16 A, 500 VSwitch-disconnector OT16F4N2Surge protective device OVR PV 40 600 PSezionatori fusibili E 92/32 PV for each string
16 A, 800 VMiniature circuit-breaker S802PV-S16Surge protective device OVR PV 40 1000 P
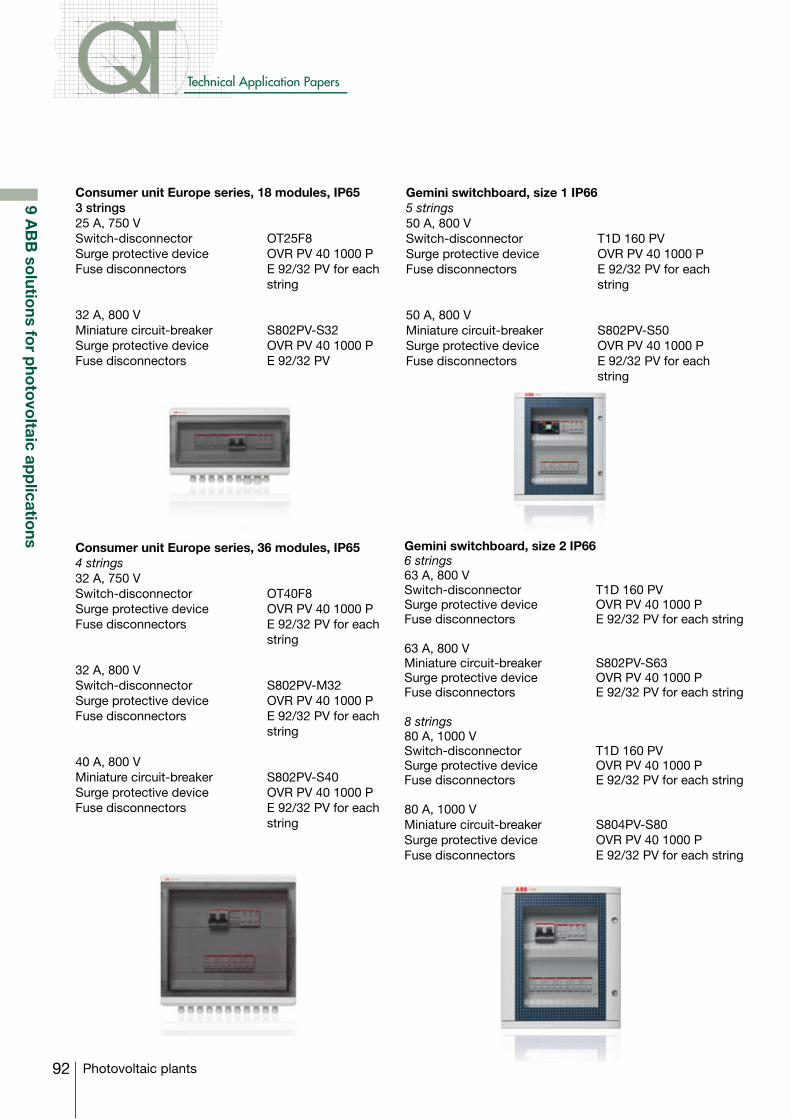
92
Technical Application Papers
Photovoltaic plants
Consumer unit Europe series, 18 modules, IP653 strings25 A, 750 VSwitch-disconnector OT25F8Surge protective device OVR PV 40 1000 PFuse disconnectors E 92/32 PV for each string
32 A, 800 VMiniature circuit-breaker S802PV-S32Surge protective device OVR PV 40 1000 PFuse disconnectors E 92/32 PV
Consumer unit Europe series, 36 modules, IP654 strings32 A, 750 VSwitch-disconnector OT40F8Surge protective device OVR PV 40 1000 PFuse disconnectors E 92/32 PV for each string
32 A, 800 VSwitch-disconnector S802PV-M32Surge protective device OVR PV 40 1000 PFuse disconnectors E 92/32 PV for each string
40 A, 800 VMiniature circuit-breaker S802PV-S40Surge protective device OVR PV 40 1000 PFuse disconnectors E 92/32 PV for each string
Gemini switchboard, size 1 IP665 strings50 A, 800 VSwitch-disconnector T1D 160 PVSurge protective device OVR PV 40 1000 PFuse disconnectors E 92/32 PV for each string
50 A, 800 VMiniature circuit-breaker S802PV-S50Surge protective device OVR PV 40 1000 PFuse disconnectors E 92/32 PV for each string
Gemini switchboard, size 2 IP666 strings63 A, 800 VSwitch-disconnector T1D 160 PVSurge protective device OVR PV 40 1000 PFuse disconnectors E 92/32 PV for each string
63 A, 800 VMiniature circuit-breaker S802PV-S63Surge protective device OVR PV 40 1000 PFuse disconnectors E 92/32 PV for each string
8 strings80 A, 1000 VSwitch-disconnector T1D 160 PVSurge protective device OVR PV 40 1000 PFuse disconnectors E 92/32 PV for each string
80 A, 1000 VMiniature circuit-breaker S804PV-S80Surge protective device OVR PV 40 1000 PFuse disconnectors E 92/32 PV for each string
9 AB
B so
lutions fo
r pho
tovo
ltaic app
lications
93Photovoltaic plants
Annex A: New panel technologies
Annex A
: New
panel techno
log
ies
A.1 Emerging technologies
New different technologies are being the subject of research and development activities. These emerging technologies can be divided into two typologies on the ground of their inspiring concept: • lowcost,whichincludes“dyesensitized”cells,organic
cells and hybrid cells based on inorganic-organic na-nocompounds (DSSC);
•highefficiency,whichinvolvesdifferentapproachestoget some cells which can exceed the theoretical limit of solar conversion efficiency for a single junction, that is 31% without concentration 40.8% at the maximum possible concentration (OSC).
Dye sensitized solar cells (DSSC – also known as Grät-zel cells from the name of their inventor) consist of a glass or plastic sub-layer with the following elements deposited one upon the other: a thin film conductive transparent electrode, a porous nanocrystal layer of the semiconductive titanium dioxide (Ti02), dye molecules (metal-organic complexes of ruthenium) distributed on the Ti02 surface, an electrolyte formed by an organic sol-vent and a redox pair as iodide/trioxide and a platinum-catalyzed counter electrode. Unlike traditional cells, the function of sunlight absorption and generation of electric charges is separated from the transportation function of charges. In fact the dye molecules absorb light and create the electron-hole pairs, the electrons are injected into Ti02 and transported up to the contact area, the redox pair provide the dye with the yielded electron by closing the internal circuit with the rear electrode (where the electrons from the external circuits are drawn). The main advantage of such technology is represented by the possibility of depositing the different materials on a large area by low-cost processes, but this type of cells has limited conversion efficiencies (<11%) and above all has a stability against exposure to atmospheric agents and to solar radiation of few years.Production costs are expected to reach about 0.5 €/W.
Organic solar cells (OSC) consist of a conductive trans-parent electrode (ITO on glass or plastic), an active mate-rial constituted by organic molecules or polymers and a metallic counter-electrode. In the OSC the absorption of the sunlight and the liberation of electric charges occur through the organic material which is responsible also for transporting the charges generated by PV effect to the electrodes. The most efficient organic cells (but they reach only some percentage point) are inspired by the chlorophyll photosynthesis process: they use a mixture of compounds as the vegetal pigments, e.g. the anthocy-
anins derived from the fruits of the forest, or the polymers and the molecules synthesized in order to maximize the absorption of solar radiation.
In the hybrid cells the active material can be a mixture of organic molecules and of nanoparticles of inorganic compounds (e.g. carbon nanotubes).Organic semiconductors have the capabilities necessary to reach in the medium-long term the aim of producing PV panels at low cost, since they can be synthesized and then deposited, at low temperature and with a low industrial cost, on a large area also on flexible sub-layers. For the time being the main limit of this typology is its conversion efficiency (<7%). Moreover, further studies on the stability and life time of these devices should be carried out. The activities in progress for the high efficiency are aimed above all at producing multiple devices positioned in series, in which each of the junctions is designed and realized with a specific material for photogeneration in a specific interval of the solar radiation spectrum.Since each single junction needs a different energy to determine the transfer of the electrons from the valence band to the conduction band, it is possible to use the en-ergy of a greater number of photons than solar radiation, with a conversion efficiency higher than 30% (theoretical limit 50%). Among the most promising solutions there is therealizationofquantumdot(QD)siliconbasedcells.In this case the photoactive material consists of silicon nanocrystals with nearly spherical form and diameter smaller than 7 nm, embedded in a matrix of silicon-based dielectric material, such as silicon oxide, silicon nitride or silicon carbide. By controlling the dimensions and density of the dots it is possible to provide the material with the most suitable characteristics to exploit part of the solar spectrum. A material suitable for photovoltaics shall consist of a more or less regular lattice of silicon QDwithsomenmdiameteratadistanceofabout1nmin a silicon nitride or carbide matrix. An alternative approach for high efficiency is using con-centration systems able to separate, through dichroic materials, the different chromatic components of the incident solar radiation, sending it to different physically separated cells, each able to exploit at the best a part of the solar spectrum. This approach avoids the use of the expensive multijunction cells and reduces the problem of the temperature rise of the PV cells present in the traditional concentration systems.By far the modules based on such technologies are not available on the market even if the first pilot production lines are being set up. The estimated time to have organic cells with commercial diffusion is around ten years. Figure A.1 shows the forecast of the market share for
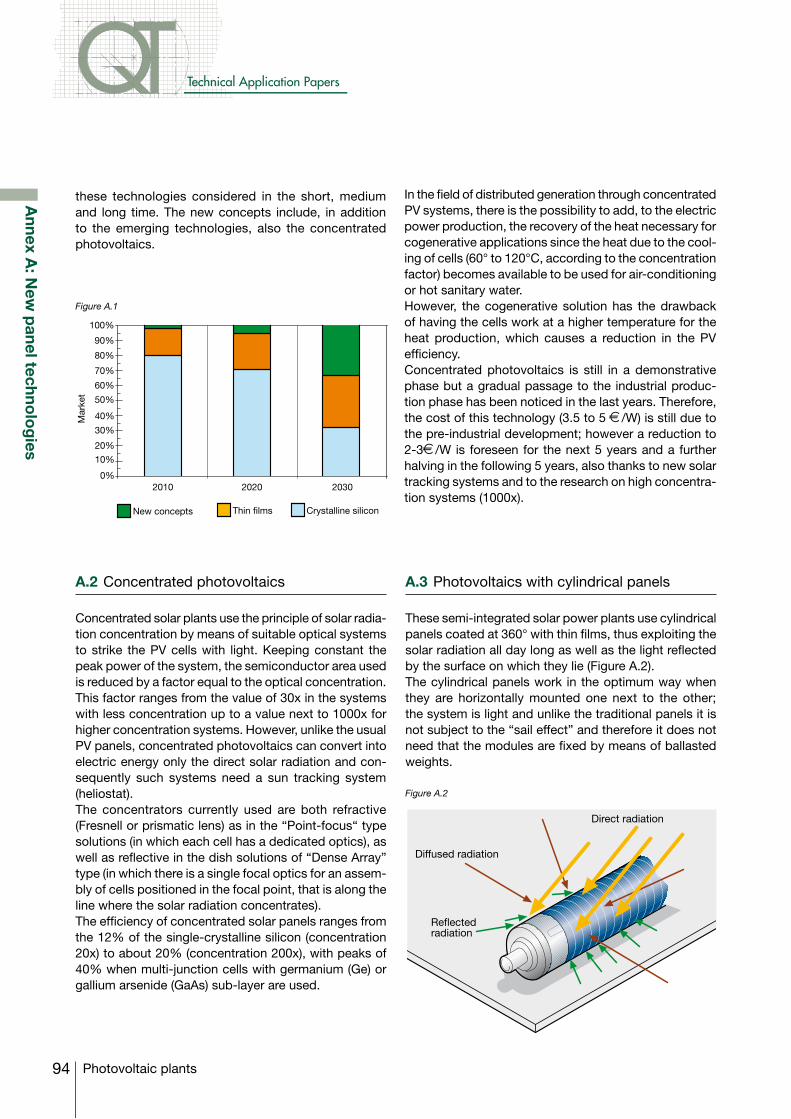
94
Technical Application Papers
Photovoltaic plants
Annex A
: New
panel techno
log
ies
these technologies considered in the short, medium and long time. The new concepts include, in addition to the emerging technologies, also the concentrated photovoltaics.
Figure A.1
Figure A.2
A.2 Concentrated photovoltaics
Concentrated solar plants use the principle of solar radia-tion concentration by means of suitable optical systems to strike the PV cells with light. Keeping constant the peak power of the system, the semiconductor area used is reduced by a factor equal to the optical concentration. This factor ranges from the value of 30x in the systems with less concentration up to a value next to 1000x for higher concentration systems. However, unlike the usual PV panels, concentrated photovoltaics can convert into electric energy only the direct solar radiation and con-sequently such systems need a sun tracking system (heliostat). The concentrators currently used are both refractive (Fresnell or prismatic lens) as in the “Point-focus“ type solutions (in which each cell has a dedicated optics), as well as reflective in the dish solutions of “Dense Array” type (in which there is a single focal optics for an assem-bly of cells positioned in the focal point, that is along the line where the solar radiation concentrates).The efficiency of concentrated solar panels ranges from the 12% of the single-crystalline silicon (concentration 20x) to about 20% (concentration 200x), with peaks of 40% when multi-junction cells with germanium (Ge) or gallium arsenide (GaAs) sub-layer are used.
In the field of distributed generation through concentrated PV systems, there is the possibility to add, to the electric power production, the recovery of the heat necessary for cogenerative applications since the heat due to the cool-ing of cells (60° to 120°C, according to the concentration factor) becomes available to be used for air-conditioning or hot sanitary water. However, the cogenerative solution has the drawback of having the cells work at a higher temperature for the heat production, which causes a reduction in the PV efficiency.Concentrated photovoltaics is still in a demonstrative phase but a gradual passage to the industrial produc-tion phase has been noticed in the last years. Therefore, the cost of this technology (3.5 to 5 €/W) is still due to the pre-industrial development; however a reduction to 2-3€/W is foreseen for the next 5 years and a further halving in the following 5 years, also thanks to new solar tracking systems and to the research on high concentra-tion systems (1000x).
A.3 Photovoltaics with cylindrical panels
These semi-integrated solar power plants use cylindrical panels coated at 360° with thin films, thus exploiting the solar radiation all day long as well as the light reflected by the surface on which they lie (Figure A.2). The cylindrical panels work in the optimum way when they are horizontally mounted one next to the other; the system is light and unlike the traditional panels it is not subject to the “sail effect” and therefore it does not need that the modules are fixed by means of ballasted weights.
2010 2020 2030
100%
90%
80%
70%
60%
50%
40%
30%
20%
10%
0%
Mar
ket
New concepts Thin films Crystalline silicon
Direct radiation
Diffused radiation
Reflectedradiation
95Photovoltaic plants
Annex B
: Other renew
able energ
y sources
Annex B: Other renewable energy sources
B.1 introduction
Renewable energies are those forms of energy generated by sources which due to their intrinsic characteristic are regenerated or are not “exhaustible” in a “human” time scale and whose use does not jeopardize the natural resources for the future generations.
As a consequence, the sun, the sea, the Earth’s heat are usually considered as "renewable power sources", that is sources whose present use does not jeopardize their availability in the future; on the contrary, the “non renewable” ones are limited for the future, both since they have long formation periods, higher than those of effective consumption (in particular, fossil fuels such as petroleum, coal, natural gas), and since they are present in reserves which are not inexhaustible on a human time scale.
If the strict definition of “renewable energy” is the above mentioned one, as a synonym also the expressions “sustainable energy” and ”alternative energy sources" are often used. However, there are slight differences; as a matter of fact sustainable energy is a method of production and use of energy allowing a sustainable development, thus including also the aspect of efficiency of energy uses. Instead alternative energy sources are all the sources different from hydrocarbons, that is deriving from non fossil materials. Therefore, there is not a single definition of the whole of renewable sources, since in different circles there are different opinions as regards the inclusion of one or more sources in the group of the "renewable” ones.
B.2 Wind power
Eolic energy is the product of the conversion of the kinetic energy of wind into other energy forms, mainly into electric energy. The devices suitable for this type of transformation are called aerogenerators or wind turbines.An aerogenerator requires a minimum wind velocity (cut-in) of 3-5 m/s and deliver the nameplate capacity at a wind velocity of 12-14 m/s. At high speeds the generator is blocked by the braking system for safety reasons. The block can be carried out by means of real brakes which slow down the rotor or with methods based on the stall phenomenon, “hiding” the blades from the wind. There are also aerogenerators with variable pitch blades which adjust to the wind direction, thus keeping constant the power output. The revolutions per minute (RPM) of the aerogenerator are very variable since the wind speed
is variable; however, since the network frequency must be constant, the rotors are connected to inverters for the control of the voltage and frequency at which the energy is put into the network. Kinematics of the wind generator is characterized by low frictions and with them by low overheating, therefore no refrigeration system (oil and water) is needed with a remarkable reduction in the maintenance cost.
The environmental impact has always been an important deterrent to the installation of these plants. In fact, in most cases, the windiest places are the peaks and the slopes of the mountain relieves, where wind-powered plants are visible also from a great distance, with a landscape impact not always tolerable.
Another problem, which is quite important when consid-ering large scale production, is the intermittency of the generated electric power. As a matter of fact, the wind, similarly to the sun and contrary to the conventional power sources, doesn’t deliver power in a homogene-ous and continuative way and, in particular, it cannot be controlled so that the produced power can be adapted to the load requirement. Moreover, the authorities charged with the control of the air traffic in some countries have recently raised doubts about the installation of new wind plants since these could interfere with radars, which can-not easily eliminate the echoes due to the wind towers because of their high RCS (Radar Cross Section)1.
In spite of all these ties, in many European countries the spreading of eolic parks is increasing just thanks to their ease of installation and reduced maintenance, and the possibility of exploiting not only the mainland, but also the open sea, with the so-called off-shore plants.
B.3 Biomass energy source
Biomass usable for energy production purposes consists of all those living materials which can be used directly as fuels or transformed into liquid or gaseous fuels, in the conversion plants, for a more convenient and wider usage. The term biomass includes heterogeneous materi-als, from the forest residues to the wastes of the wood transformation industry or of the zoo technical farms. Generally speaking all the organic materials deriving from photosynthetic reactions may be defined as biomass.
1 Radar cross section (RCS) is a measure of how detectable an object is with a radar since when radar waves are beamed at a target, only a certain amount are reflected back. A number of different factors determine how much electromagnetic energy returns to the source, such as the angles created by surface plane intersections. For example, a stealth aircraft (which is designed to be undetectable) will have design features that give it a low RCS, as opposed to a passenger airliner that will have a high RCS.
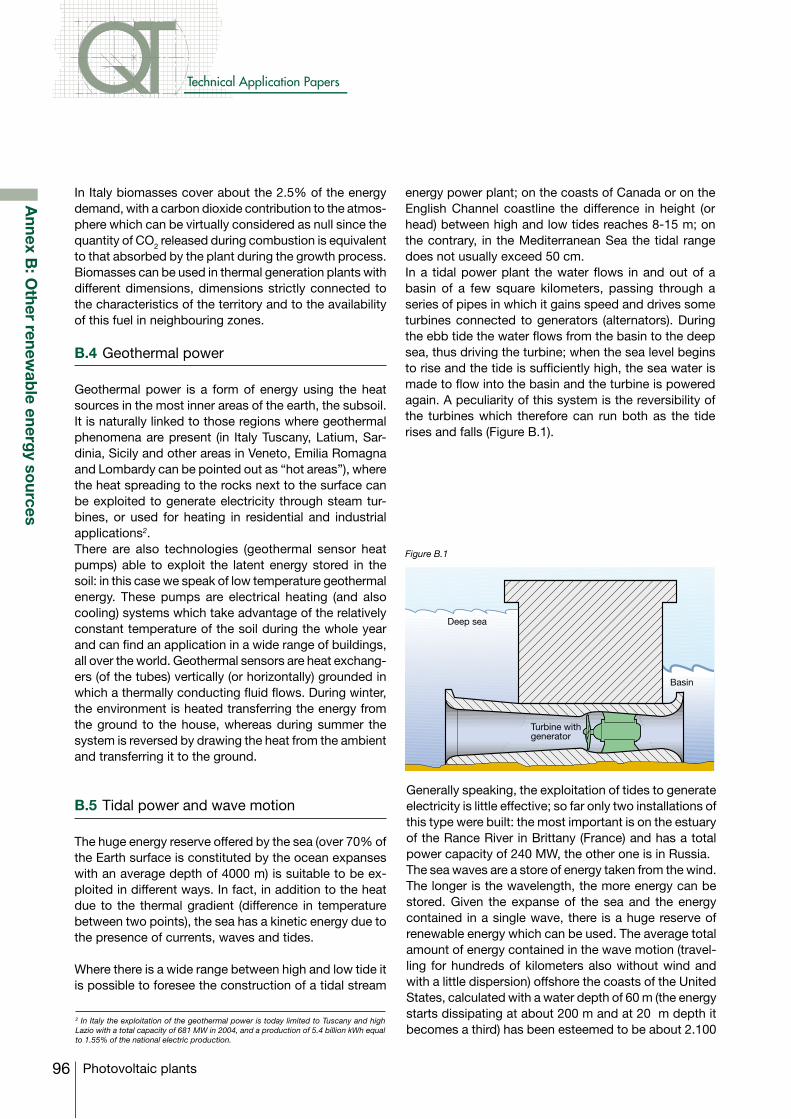
96
Technical Application Papers
Photovoltaic plants
In Italy biomasses cover about the 2.5% of the energy demand, with a carbon dioxide contribution to the atmos-phere which can be virtually considered as null since the quantity of CO2 released during combustion is equivalent to that absorbed by the plant during the growth process. Biomasses can be used in thermal generation plants with different dimensions, dimensions strictly connected to the characteristics of the territory and to the availability of this fuel in neighbouring zones.
B.4 Geothermal power
Geothermal power is a form of energy using the heat sources in the most inner areas of the earth, the subsoil. It is naturally linked to those regions where geothermal phenomena are present (in Italy Tuscany, Latium, Sar-dinia, Sicily and other areas in Veneto, Emilia Romagna and Lombardy can be pointed out as “hot areas”), where the heat spreading to the rocks next to the surface can be exploited to generate electricity through steam tur-bines, or used for heating in residential and industrial applications2.There are also technologies (geothermal sensor heat pumps) able to exploit the latent energy stored in the soil: in this case we speak of low temperature geothermal energy. These pumps are electrical heating (and also cooling) systems which take advantage of the relatively constant temperature of the soil during the whole year and can find an application in a wide range of buildings, all over the world. Geothermal sensors are heat exchang-ers (of the tubes) vertically (or horizontally) grounded in which a thermally conducting fluid flows. During winter, the environment is heated transferring the energy from the ground to the house, whereas during summer the system is reversed by drawing the heat from the ambient and transferring it to the ground.
B.5 Tidal power and wave motion
The huge energy reserve offered by the sea (over 70% of the Earth surface is constituted by the ocean expanses with an average depth of 4000 m) is suitable to be ex-ploited in different ways. In fact, in addition to the heat due to the thermal gradient (difference in temperature between two points), the sea has a kinetic energy due to the presence of currents, waves and tides.
Where there is a wide range between high and low tide it is possible to foresee the construction of a tidal stream
2 In Italy the exploitation of the geothermal power is today limited to Tuscany and high Lazio with a total capacity of 681 MW in 2004, and a production of 5.4 billion kWh equal to 1.55% of the national electric production.
energy power plant; on the coasts of Canada or on the English Channel coastline the difference in height (or head) between high and low tides reaches 8-15 m; on the contrary, in the Mediterranean Sea the tidal range does not usually exceed 50 cm. In a tidal power plant the water flows in and out of a basin of a few square kilometers, passing through a series of pipes in which it gains speed and drives some turbines connected to generators (alternators). During the ebb tide the water flows from the basin to the deep sea, thus driving the turbine; when the sea level begins to rise and the tide is sufficiently high, the sea water is made to flow into the basin and the turbine is powered again. A peculiarity of this system is the reversibility of the turbines which therefore can run both as the tide rises and falls (Figure B.1).
Figure B.1
Generally speaking, the exploitation of tides to generate electricity is little effective; so far only two installations of this type were built: the most important is on the estuary of the Rance River in Brittany (France) and has a total power capacity of 240 MW, the other one is in Russia.The sea waves are a store of energy taken from the wind. The longer is the wavelength, the more energy can be stored. Given the expanse of the sea and the energy contained in a single wave, there is a huge reserve of renewable energy which can be used. The average total amount of energy contained in the wave motion (travel-ling for hundreds of kilometers also without wind and with a little dispersion) offshore the coasts of the United States, calculated with a water depth of 60 m (the energy starts dissipating at about 200 m and at 20 m depth it becomes a third) has been esteemed to be about 2.100
Annex B
: Other renew
able energ
y sources
Deep sea
Basin
Turbine withgenerator
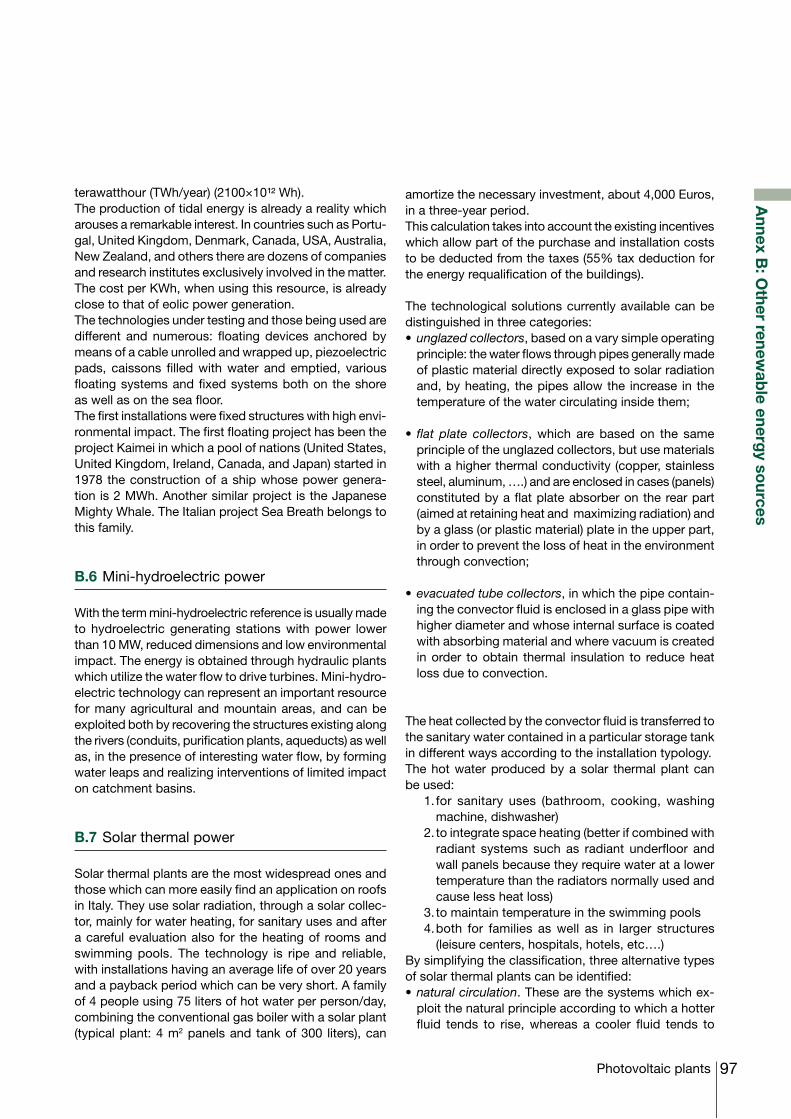
97Photovoltaic plants
terawatthour (TWh/year) (2100×10¹² Wh).The production of tidal energy is already a reality which arouses a remarkable interest. In countries such as Portu-gal, United Kingdom, Denmark, Canada, USA, Australia, New Zealand, and others there are dozens of companies and research institutes exclusively involved in the matter. The cost per KWh, when using this resource, is already close to that of eolic power generation.The technologies under testing and those being used are different and numerous: floating devices anchored by means of a cable unrolled and wrapped up, piezoelectric pads, caissons filled with water and emptied, various floating systems and fixed systems both on the shore as well as on the sea floor.The first installations were fixed structures with high envi-ronmental impact. The first floating project has been the project Kaimei in which a pool of nations (United States, United Kingdom, Ireland, Canada, and Japan) started in 1978 the construction of a ship whose power genera-tion is 2 MWh. Another similar project is the Japanese Mighty Whale. The Italian project Sea Breath belongs to this family.
B.6 Mini-hydroelectric power
With the term mini-hydroelectric reference is usually made to hydroelectric generating stations with power lower than 10 MW, reduced dimensions and low environmental impact. The energy is obtained through hydraulic plants which utilize the water flow to drive turbines. Mini-hydro-electric technology can represent an important resource for many agricultural and mountain areas, and can be exploited both by recovering the structures existing along the rivers (conduits, purification plants, aqueducts) as well as, in the presence of interesting water flow, by forming water leaps and realizing interventions of limited impact on catchment basins.
B.7 Solar thermal power
Solar thermal plants are the most widespread ones and those which can more easily find an application on roofs in Italy. They use solar radiation, through a solar collec-tor, mainly for water heating, for sanitary uses and after a careful evaluation also for the heating of rooms and swimming pools. The technology is ripe and reliable, with installations having an average life of over 20 years and a payback period which can be very short. A family of 4 people using 75 liters of hot water per person/day, combining the conventional gas boiler with a solar plant (typical plant: 4 m2 panels and tank of 300 liters), can
Annex B
: Other renew
able energ
y sources
amortize the necessary investment, about 4,000 Euros, in a three-year period. This calculation takes into account the existing incentives which allow part of the purchase and installation costs to be deducted from the taxes (55% tax deduction for the energy requalification of the buildings).
The technological solutions currently available can be distinguished in three categories:•unglazed collectors, based on a vary simple operating
principle: the water flows through pipes generally made of plastic material directly exposed to solar radiation and, by heating, the pipes allow the increase in the temperature of the water circulating inside them;
•flat plate collectors, which are based on the same principle of the unglazed collectors, but use materials with a higher thermal conductivity (copper, stainless steel, aluminum, ….) and are enclosed in cases (panels) constituted by a flat plate absorber on the rear part (aimed at retaining heat and maximizing radiation) and by a glass (or plastic material) plate in the upper part, in order to prevent the loss of heat in the environment through convection;
•evacuated tube collectors, in which the pipe contain-ing the convector fluid is enclosed in a glass pipe with higher diameter and whose internal surface is coated with absorbing material and where vacuum is created in order to obtain thermal insulation to reduce heat loss due to convection.
The heat collected by the convector fluid is transferred to the sanitary water contained in a particular storage tank in different ways according to the installation typology. The hot water produced by a solar thermal plant can be used: 1. for sanitary uses (bathroom, cooking, washing
machine, dishwasher) 2. to integrate space heating (better if combined with
radiant systems such as radiant underfloor and wall panels because they require water at a lower temperature than the radiators normally used and cause less heat loss)
3. to maintain temperature in the swimming pools 4. both for families as well as in larger structures
(leisure centers, hospitals, hotels, etc….) By simplifying the classification, three alternative types of solar thermal plants can be identified:•natural circulation. These are the systems which ex-
ploit the natural principle according to which a hotter fluid tends to rise, whereas a cooler fluid tends to
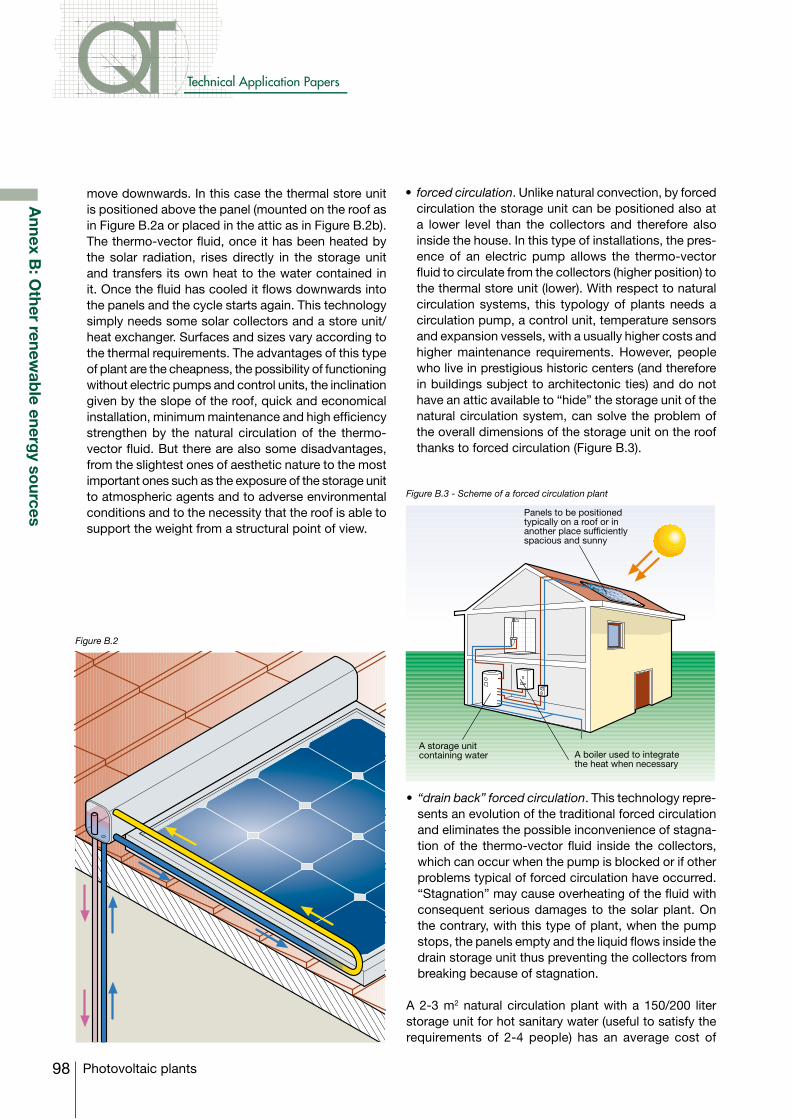
98
Technical Application Papers
Photovoltaic plants
Annex B
: Other renew
able energ
y sources
move downwards. In this case the thermal store unit is positioned above the panel (mounted on the roof as in Figure B.2a or placed in the attic as in Figure B.2b). The thermo-vector fluid, once it has been heated by the solar radiation, rises directly in the storage unit and transfers its own heat to the water contained in it. Once the fluid has cooled it flows downwards into the panels and the cycle starts again. This technology simply needs some solar collectors and a store unit/heat exchanger. Surfaces and sizes vary according to the thermal requirements. The advantages of this type of plant are the cheapness, the possibility of functioning without electric pumps and control units, the inclination given by the slope of the roof, quick and economical installation, minimum maintenance and high efficiency strengthen by the natural circulation of the thermo-vector fluid. But there are also some disadvantages, from the slightest ones of aesthetic nature to the most important ones such as the exposure of the storage unit to atmospheric agents and to adverse environmental conditions and to the necessity that the roof is able to support the weight from a structural point of view.
Figure B.2
Figure B.3 - Scheme of a forced circulation plant
• forced circulation. Unlike natural convection, by forced circulation the storage unit can be positioned also at a lower level than the collectors and therefore also inside the house. In this type of installations, the pres-ence of an electric pump allows the thermo-vector fluid to circulate from the collectors (higher position) to the thermal store unit (lower). With respect to natural circulation systems, this typology of plants needs a circulation pump, a control unit, temperature sensors and expansion vessels, with a usually higher costs and higher maintenance requirements. However, people who live in prestigious historic centers (and therefore in buildings subject to architectonic ties) and do not have an attic available to “hide” the storage unit of the natural circulation system, can solve the problem of the overall dimensions of the storage unit on the roof thanks to forced circulation (Figure B.3).
•“drain back” forced circulation. This technology repre-sents an evolution of the traditional forced circulation and eliminates the possible inconvenience of stagna-tion of the thermo-vector fluid inside the collectors, which can occur when the pump is blocked or if other problems typical of forced circulation have occurred. “Stagnation” may cause overheating of the fluid with consequent serious damages to the solar plant. On the contrary, with this type of plant, when the pump stops, the panels empty and the liquid flows inside the drain storage unit thus preventing the collectors from breaking because of stagnation.
A 2-3 m2 natural circulation plant with a 150/200 liter storage unit for hot sanitary water (useful to satisfy the requirements of 2-4 people) has an average cost of
Panels to be positionedtypically on a roof or inanother place sufficientlyspacious and sunny
A storage unitcontaining water A boiler used to integrate
the heat when necessary
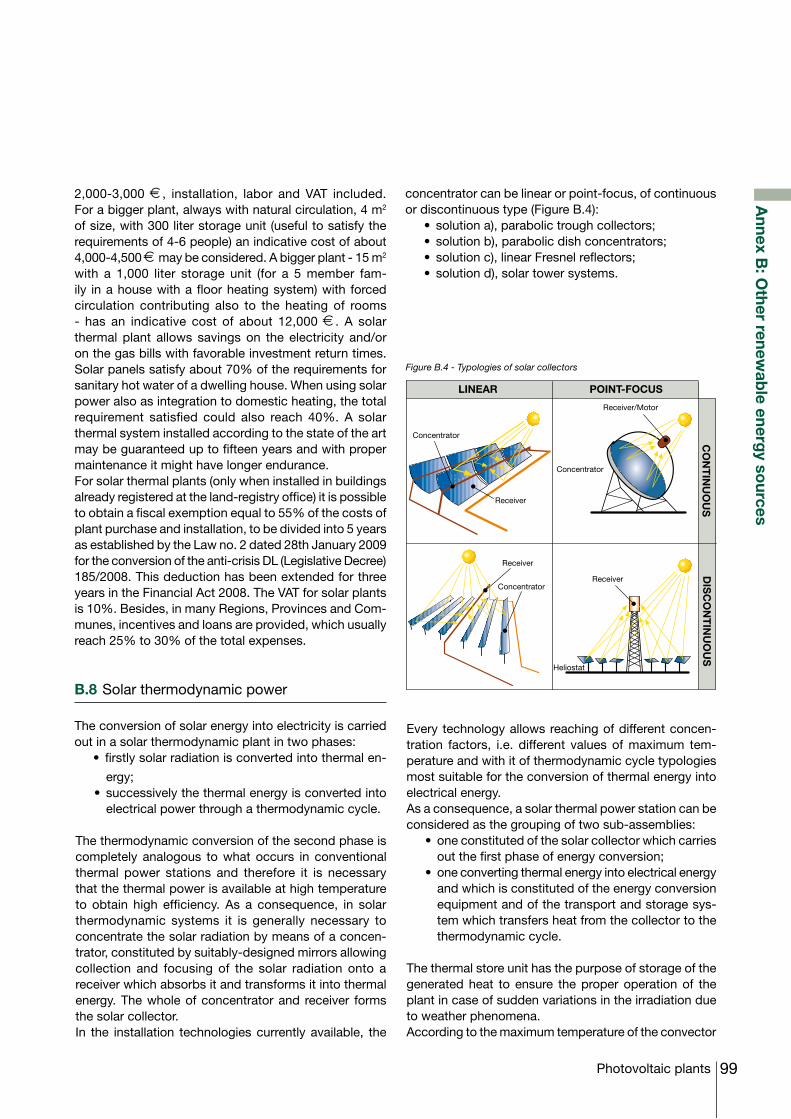
99Photovoltaic plants
Annex B
: Other renew
able energ
y sources
Figure B.4 - Typologies of solar collectors
2,000-3,000 €, installation, labor and VAT included. For a bigger plant, always with natural circulation, 4 m2 of size, with 300 liter storage unit (useful to satisfy the requirements of 4-6 people) an indicative cost of about 4,000-4,500 € may be considered. A bigger plant - 15 m2 with a 1,000 liter storage unit (for a 5 member fam-ily in a house with a floor heating system) with forced circulation contributing also to the heating of rooms - has an indicative cost of about 12,000 €. A solar thermal plant allows savings on the electricity and/or on the gas bills with favorable investment return times. Solar panels satisfy about 70% of the requirements for sanitary hot water of a dwelling house. When using solar power also as integration to domestic heating, the total requirement satisfied could also reach 40%. A solar thermal system installed according to the state of the art may be guaranteed up to fifteen years and with proper maintenance it might have longer endurance.For solar thermal plants (only when installed in buildings already registered at the land-registry office) it is possible to obtain a fiscal exemption equal to 55% of the costs of plant purchase and installation, to be divided into 5 years as established by the Law no. 2 dated 28th January 2009 for the conversion of the anti-crisis DL (Legislative Decree) 185/2008. This deduction has been extended for three years in the Financial Act 2008. The VAT for solar plants is 10%. Besides, in many Regions, Provinces and Com-munes, incentives and loans are provided, which usually reach 25% to 30% of the total expenses.
B.8 Solar thermodynamic power
The conversion of solar energy into electricity is carried out in a solar thermodynamic plant in two phases: • firstlysolarradiationisconvertedintothermalen-
ergy; • successivelythethermalenergyisconvertedinto
electrical power through a thermodynamic cycle.
The thermodynamic conversion of the second phase is completely analogous to what occurs in conventional thermal power stations and therefore it is necessary that the thermal power is available at high temperature to obtain high efficiency. As a consequence, in solar thermodynamic systems it is generally necessary to concentrate the solar radiation by means of a concen-trator, constituted by suitably-designed mirrors allowing collection and focusing of the solar radiation onto a receiver which absorbs it and transforms it into thermal energy. The whole of concentrator and receiver forms the solar collector.In the installation technologies currently available, the
concentrator can be linear or point-focus, of continuous or discontinuous type (Figure B.4): • solutiona),parabolictroughcollectors; • solutionb),parabolicdishconcentrators; • solutionc),linearFresnelreflectors; • solutiond),solartowersystems.
Every technology allows reaching of different concen-tration factors, i.e. different values of maximum tem-perature and with it of thermodynamic cycle typologies most suitable for the conversion of thermal energy into electrical energy.As a consequence, a solar thermal power station can be considered as the grouping of two sub-assemblies: • oneconstitutedofthesolarcollectorwhichcarries
out the first phase of energy conversion; • oneconvertingthermalenergyintoelectricalenergy
and which is constituted of the energy conversion equipment and of the transport and storage sys-tem which transfers heat from the collector to the thermodynamic cycle.
The thermal store unit has the purpose of storage of the generated heat to ensure the proper operation of the plant in case of sudden variations in the irradiation due to weather phenomena.According to the maximum temperature of the convector
Receiver
Concentrator
Concentrator
Receiver/Motor
Receiver
Heliostat
Concentrator
Receiver
LINEAR POINT-FOCUS
CO
NT
INU
OU
SD
ISC
ON
TIN
UO
US
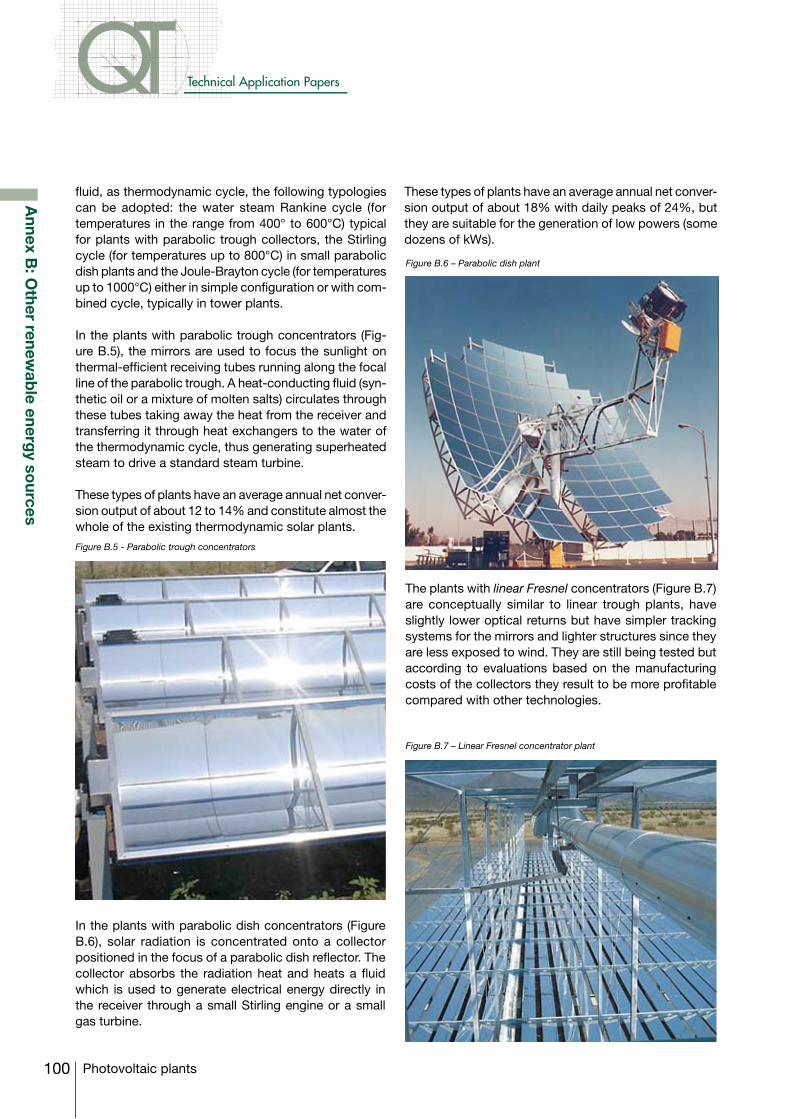
100
Technical Application Papers
Photovoltaic plants
fluid, as thermodynamic cycle, the following typologies can be adopted: the water steam Rankine cycle (for temperatures in the range from 400° to 600°C) typical for plants with parabolic trough collectors, the Stirling cycle (for temperatures up to 800°C) in small parabolic dish plants and the Joule-Brayton cycle (for temperatures up to 1000°C) either in simple configuration or with com-bined cycle, typically in tower plants.
In the plants with parabolic trough concentrators (Fig-ure B.5), the mirrors are used to focus the sunlight on thermal-efficient receiving tubes running along the focal line of the parabolic trough. A heat-conducting fluid (syn-thetic oil or a mixture of molten salts) circulates through these tubes taking away the heat from the receiver and transferring it through heat exchangers to the water of the thermodynamic cycle, thus generating superheated steam to drive a standard steam turbine.
These types of plants have an average annual net conver-sion output of about 12 to 14% and constitute almost the whole of the existing thermodynamic solar plants.
Figure B.5 - Parabolic trough concentrators
Figure B.6 – Parabolic dish plant
Figure B.7 – Linear Fresnel concentrator plant
In the plants with parabolic dish concentrators (Figure B.6), solar radiation is concentrated onto a collector positioned in the focus of a parabolic dish reflector. The collector absorbs the radiation heat and heats a fluid which is used to generate electrical energy directly in the receiver through a small Stirling engine or a small gas turbine.
These types of plants have an average annual net conver-sion output of about 18% with daily peaks of 24%, but they are suitable for the generation of low powers (some dozens of kWs).
The plants with linear Fresnel concentrators (Figure B.7) are conceptually similar to linear trough plants, have slightly lower optical returns but have simpler tracking systems for the mirrors and lighter structures since they are less exposed to wind. They are still being tested but according to evaluations based on the manufacturing costs of the collectors they result to be more profitable compared with other technologies.
Annex B
: Other renew
able energ
y sources
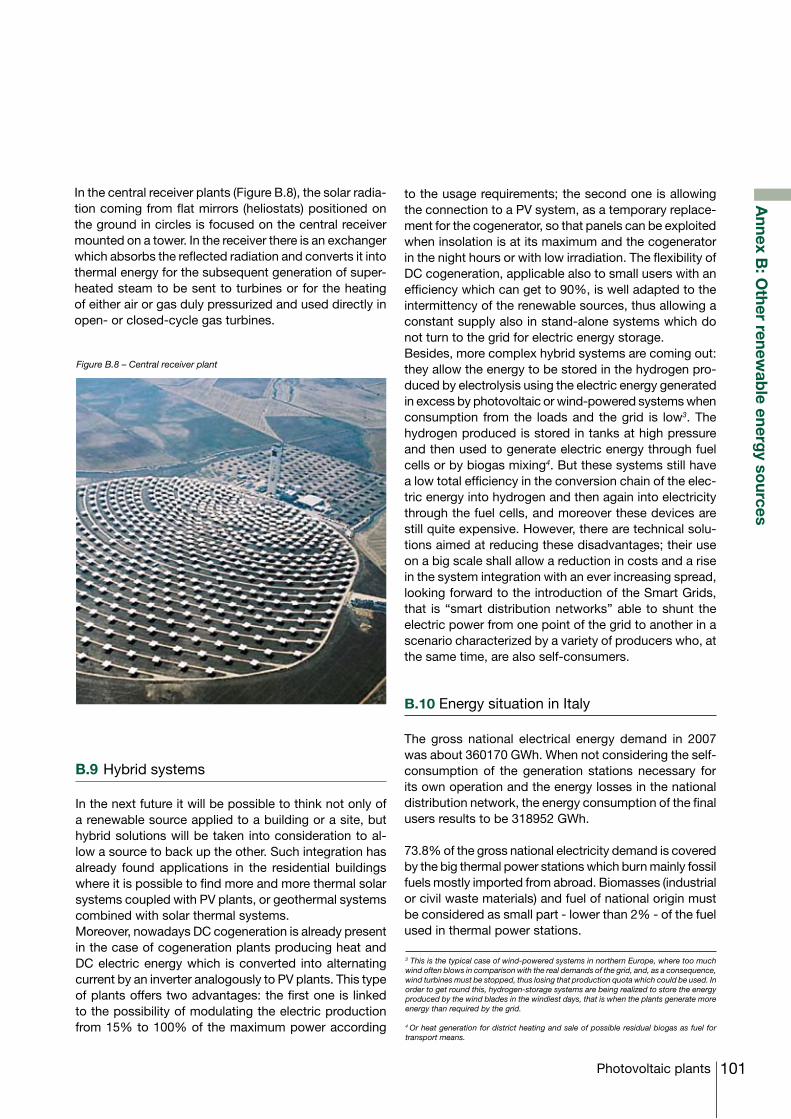
101Photovoltaic plants
Figure B.8 – Central receiver plant
Annex B
: Other renew
able energ
y sources
In the central receiver plants (Figure B.8), the solar radia-tion coming from flat mirrors (heliostats) positioned on the ground in circles is focused on the central receiver mounted on a tower. In the receiver there is an exchanger which absorbs the reflected radiation and converts it into thermal energy for the subsequent generation of super-heated steam to be sent to turbines or for the heating of either air or gas duly pressurized and used directly in open- or closed-cycle gas turbines.
B.9 Hybrid systems
In the next future it will be possible to think not only of a renewable source applied to a building or a site, but hybrid solutions will be taken into consideration to al-low a source to back up the other. Such integration has already found applications in the residential buildings where it is possible to find more and more thermal solar systems coupled with PV plants, or geothermal systems combined with solar thermal systems.Moreover, nowadays DC cogeneration is already present in the case of cogeneration plants producing heat and DC electric energy which is converted into alternating current by an inverter analogously to PV plants. This type of plants offers two advantages: the first one is linked to the possibility of modulating the electric production from 15% to 100% of the maximum power according
to the usage requirements; the second one is allowing the connection to a PV system, as a temporary replace-ment for the cogenerator, so that panels can be exploited when insolation is at its maximum and the cogenerator in the night hours or with low irradiation. The flexibility of DC cogeneration, applicable also to small users with an efficiency which can get to 90%, is well adapted to the intermittency of the renewable sources, thus allowing a constant supply also in stand-alone systems which do not turn to the grid for electric energy storage.Besides, more complex hybrid systems are coming out: they allow the energy to be stored in the hydrogen pro-duced by electrolysis using the electric energy generated in excess by photovoltaic or wind-powered systems when consumption from the loads and the grid is low3. The hydrogen produced is stored in tanks at high pressure and then used to generate electric energy through fuel cells or by biogas mixing4. But these systems still have a low total efficiency in the conversion chain of the elec-tric energy into hydrogen and then again into electricity through the fuel cells, and moreover these devices are still quite expensive. However, there are technical solu-tions aimed at reducing these disadvantages; their use on a big scale shall allow a reduction in costs and a rise in the system integration with an ever increasing spread, looking forward to the introduction of the Smart Grids, that is “smart distribution networks” able to shunt the electric power from one point of the grid to another in a scenario characterized by a variety of producers who, at the same time, are also self-consumers.
B.10 Energy situation in Italy
The gross national electrical energy demand in 2007 was about 360170 GWh. When not considering the self-consumption of the generation stations necessary for its own operation and the energy losses in the national distribution network, the energy consumption of the final users results to be 318952 GWh.
73.8% of the gross national electricity demand is covered by the big thermal power stations which burn mainly fossil fuels mostly imported from abroad. Biomasses (industrial or civil waste materials) and fuel of national origin must be considered as small part - lower than 2% - of the fuel used in thermal power stations.
3 This is the typical case of wind-powered systems in northern Europe, where too much wind often blows in comparison with the real demands of the grid, and, as a consequence, wind turbines must be stopped, thus losing that production quota which could be used. In order to get round this, hydrogen-storage systems are being realized to store the energy produced by the wind blades in the windiest days, that is when the plants generate more energy than required by the grid.
4 Or heat generation for district heating and sale of possible residual biogas as fuel for transport means.
102
Technical Application Papers
Photovoltaic plants
Other important energy sources are the renewable ones (hydroelectric, geothermal, wind and photovoltaic sources) which contribute to the national demand with a share equal to 13.4% of the total amount.These are the main sources for the national production of energy; they allow to generate a gross amount of energy equal to about 313887GWh per year.The remaining part necessary to cover the national needs is imported from abroad and is 12.8% of the total amount.
B.10.1 Non renewable energiesAs already seen, most part of the national demand is covered by the production of the thermal power sta-tions with the aid of fossil fuel. Italy cannot count on a remarkable reserve of this type of fuel and consequently almost the total amount of the raw material is imported from abroad approximately according to the following percentages: - natural gas about 65.2%;- coal about 16.6%;- petroleum products about 8.6%;- minor fuel sources, prevalently of fossil nature (petro-leum coke), about 7.3%.The above data depict Italy as the fourth international importer of natural gas (mainly from Russia and Alge-ria and for lower amounts from Norway, Libya and the Netherlands). Although the energy amount produced from petroleum is remarkably decreased in favor of that derived from natural gas, Italy remains the European country depending most on petroleum for the production of electrical energy.
B.10.2 Renewable energiesA national plan providing for the establishment of re-newable energy sources which can guarantee optimum performances and at the same time reduce pollution risks is fundamental to comply with the dictates of the Kyoto Protocol. In Italy most generation of electricity through renewable sources derives from the hydroelectric plants (defined as classic renewable sources) located mainly in the Alps and in some Apennine areas; they generate about 10.7% of the gross national energy demand. Other renewable energy sources are geothermal generat-ing stations (essentially in Tuscany), which produce 1.5% of the electricity required. “New” renewable sources such as wind technology (with eolic parks spread above all in Sardinia and in the Southern Apennine Mountains) generate about 1.1% of the required electric power, whereas lower percentages of about 0.01%, which correspond to about 39 GWh of the total amount, are produced by solar technology in grid-connected or stand-alone systems. A higher percentage with a production of about 2.3% of the total energy demand is covered by thermal power stations or incinerators through the combustion of biomasses, industrial or urban waste materials, gases derived by primary industrial processes (steelworks, blast furnaces, and refineries).
Annex B
: Other renew
able energ
y sources
103Photovoltaic plants
Annex C
: Dim
ensioning
examp
les of p
hoto
voltaic p
lants
Annex C: Dimensioning examples of photovoltaic plants
C.1 Introduction
Here are two dimensioning examples of a photovoltaic power plant grid-connected in parallel to a preexisting user plant. The first example refers to a small grid-con-nected PV plant typical of a familiar end user, whereas the second one refers to a higher power plant to be installed in an artisan industry. In both cases the user plants are connected to the LV public utility network with earthing systems of TT type; the exposed conductive parts of the PV plants shall be connected to the already existing earthing system, but the live parts of the PV plant shall remain isolated. Finally, the prospective short-circuit current delivered by the distribution network is assumed to be 6kA line-to-neutral in the first example and 15kA three-phase in the second one.
C.2 3kWp PV plant
We wish to carry out dimensioning of a PV plant for a detached house situated in the province of Bergamo; the plant shall be connected to the LV public utility network based on net metering. This house is already connected to the public network with 3kW contractual power and an average annual consumption of about 4000 kWh.The side of the roof (gabled roof) in which the panels shall be partially integrated has a surface of 60 m2, is sloped with a tilt angle β of 30° and is +15° (Azimut angle γ) south oriented. 3 kWp is the power plant size decided, so that the power demand of the user is satisfied as much as possible; with reference to the example 2.2 of Chapter 2, the expected production per year, considering an efficiency of the plant components of 0.75, is about 3430 kWh.
Choice of panelsBy using polycrystalline silicon panels, by 175 W power per unit, 17 panels are needed, a value obtained by the relation 3000/175=17. The panels are assumed to be all connected in series in a single string.The main characteristics of the generic panel declared by the manufacturer are:• RatedpowerPMPP
1 175 W• Efficiency 12.8%• VoltageVMPP 23.30 V• CurrentIMPP 7.54 A• No-loadvoltage 29.40V• Short-circuitcurrentIsc 8.02A• Maximumvoltage 1000V• TemperaturecoefficientPMPP -0.43%/°C
1 MPP identifies the electrical quantities at their maximum power point under standard radiance conditions.
• TemperaturecoefficientU -0.107V/°C• Dimensions 2000x680x50mm• Surface 1.36m2
• Insulation classII
Therefore the total surface covered by the panels shall be equal to 1.36 x 17 ≈ 23 m2, which is smaller than the roof surface available for the installation.By assuming -10°C and +70°C as minimum and maxi-mum temperatures of the panels and by considering that the temperature relevant to the standard testing condi-tions is about 25°C, with the formula [2.13] the voltage variation of a PV module, in comparison with the standard conditions, can be obtained.• Maximumno-loadvoltage 29.40+0.107. (25+10) = 33.13V• MinimumvoltageMPP 23.30+0.107. (25-70) = 18.50V• MaximumvoltageMPP 23.30+0.107. (25+10) = 27.03V
For safety purpose and as precautionary measures, for the choice of the plant components the higher value between the maximum no-load voltage and the 120% of the no-load voltage of the panels (note 7, Chapter 3) is considered. In this specific case, the reference volt-age results to be equal to 1.2 . 29.40 = 35.28V, since it is higher than 33.13V.Electrical characteristics of the string: • VoltageMPP 17x23.30=396V• CurrentMPP 7.54A• Maximumshort-circuitcurrent 1.25x8.02=10A• Maximumno-loadvoltage 17x35.28=599.76V• MinimumvoltageMPP 17x18.50=314.58V• MaximumvoltageMPP 17x27.03=459.50V
Choice of the inverterDue to the small power of the PV plant and to carry out the direct connection with the LV single-phase network, a single-phase inverter is chosen which converts direct current to alternating current thanks to the PWM control and IGBT bridge. This inverter is equipped with an output toroidal transformer to guarantee the galvanic isolation between the electric grid and the PV plant; it has input and output filters for the suppression of the emission disturbances - both conducted as well as radiated - and an isolation sensor to earth for the PV panels. It is equipped with the Maximum Power Point Tracker (MPPT), and with the interface device with the relevant interface protection.
104
Technical Application Papers
Photovoltaic plants
Annex C
: Dim
ensioning
examp
les of p
hoto
voltaic p
lants
Technical characteristics:• Inputratedpower 3150W• OperatingvoltageMPPTontheDCside 203-600V• MaximumvoltageontheDCside 680V• MaximuminputcurrentontheDCside 11.5A• OutputratedpowerontheACside 3000W• RatedvoltageontheACside 230V• Ratedfrequency 50Hz• Powerfactor 1• Maximumefficiency 95.5%• Europeanefficiency 94.8%
To verify the correct connection string-inverter (see Chap-ter 3) first of all it is necessary to verify that the maximum no-load voltage at the ends of the string is lower than the maximum input voltage withstood by the inverter:
599.76 V < 680 V (OK)
In addition, the minimum voltage MPP of the string shall not to be lower than the minimum voltage of the inverter MPPT:
314.58 V > 203 V (OK)
whereas the maximum voltage MPP of the string shall not be higher than the maximum voltage of the inverter MPPT:
459.50 V < 600 V (OK)
Finally, the maximum short-circuit current of the string shall not exceed the maximum short-circuit current which the inverter can withstand on the input:
10 A < 11.5 A (OK)
Choice of cablesThe panels are connected one to another in series through the cables L1* and the string thus obtained is connected to the field switchboard immediately on the supply side of the inverter using solar single-core cables L2 having the following characteristics:• cross-sectionalarea2.5mm2 • ratedvoltageUo/U 600/1000V AC – 1500V DC• operatingtemperature -40+90°C• currentcarryingcapacityinfreeairat60°C(twoadjacentca-
bles) 35 A• correctionfactorofcurrentcarryingcapacityat70°C 0.91• maximumtemperatureofthecableunder overload conditions 120 °C
The current carrying capacity Iz of the solar cables in-stalled in conduit at the operating temperature of 70°C results to be equal to (see Chapter 3):
Iz = 0.9 . 0.91 . I0 = 0.9 . 0.91 . 35 ≈ 29A
where 0.9 represents the correction factor for installation of the solar cables in conduit or in cable trunking.The carrying capacity is higher than the maximum short-circuit current of the string:
Iz > 1.25 . Isc = 10A
The frames of the panels and the supporting structure of the string are earthed through a cable N07V-K, yellow-green with 2.5 mm2 cross-section. The connection of the field switchboard to the inverter is carried out using two single-core cables N07V-K (450/750V) with 2.5 mm2 cross-sectional area and length L3=1m in conduit, with current carrying capacity of 24A, that is higher than the maximum string current.The connections between the inverter and the meter of the produced power (length L4=1m) and between the meter and the main switchboard of the detached house (length L5=5m) are carried out using three single-core cables N07V-K (F+N+PE) with 2.5 mm2 cross-sectional area in conduit, with current carrying capacity of 21A, which is higher than the output rated current of the in-verter on the AC side:
Iz >
Pn =3000
= 13AVn . cosϕn 230 . 1
Verification of the voltage dropHere is the calculation of the voltage drop on the DC side of the inverter to verify that it does not exceed 2%, so that the loss of energy produced is lower than this percentage (see Chapter 3).Length of the cables with 2.5 mm2 cross-section:• connectionbetweenthestringpanels(L1):(17-1)x1m=16m• connectionbetweenstringandswitchboard(L2): 15m• connectionbetweenswitchboardandinverter(L3): 1m• totallength 16+15+1=32m
Therefore the percentage voltage drop results :
∆U% =Pmax . (ρ1 . L1 . ρ2 . 2. L2 + ρ2 . 2 . L3) . 100 = ↵
s . U2
→ 3000 . (0.021 . 16 + 0.018 . 2 . 15 + 0.018 . 2 . 1) . 100 = 0.7%2.5 . 3962
2 The voltage drop of the generated power between inverter and meter is disregarded be-
cause of the limited length of the connection cables (1m). For the connection cables string-
switchboard and switchboard-inverter the resistivity of copper at 30°C ρ2= 0.018 Ω . mm2
m,
is considered, whereas for the connection cables between panels an ambient temperature
of 70°C is considered; therefore ρ1 = 0.018 . [1+0.004 . (70 - 30)] = 0.021 Ω . mm2
.m
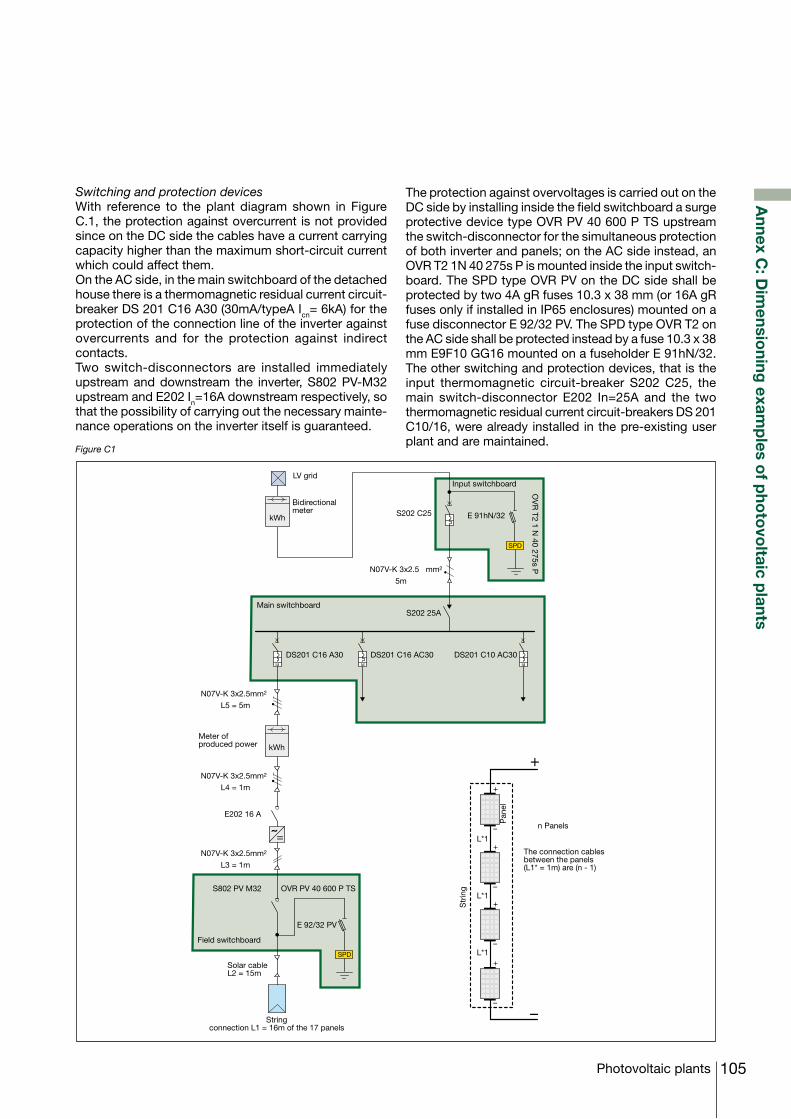
105Photovoltaic plants
Annex C
: Dim
ensioning
examp
les of p
hoto
voltaic p
lants
Switching and protection devicesWith reference to the plant diagram shown in Figure C.1, the protection against overcurrent is not provided since on the DC side the cables have a current carrying capacity higher than the maximum short-circuit current which could affect them.On the AC side, in the main switchboard of the detached house there is a thermomagnetic residual current circuit-breaker DS 201 C16 A30 (30mA/typeA Icn= 6kA) for the protection of the connection line of the inverter against overcurrents and for the protection against indirect contacts. Two switch-disconnectors are installed immediately upstream and downstream the inverter, S802 PV-M32 upstream and E202 In=16A downstream respectively, so that the possibility of carrying out the necessary mainte-nance operations on the inverter itself is guaranteed.
The protection against overvoltages is carried out on the DC side by installing inside the field switchboard a surge protective device type OVR PV 40 600 P TS upstream the switch-disconnector for the simultaneous protection of both inverter and panels; on the AC side instead, an OVR T2 1N 40 275s P is mounted inside the input switch-board. The SPD type OVR PV on the DC side shall be protected by two 4A gR fuses 10.3 x 38 mm (or 16A gR fuses only if installed in IP65 enclosures) mounted on a fuse disconnector E 92/32 PV. The SPD type OVR T2 on the AC side shall be protected instead by a fuse 10.3 x 38 mm E9F10 GG16 mounted on a fuseholder E 91hN/32. The other switching and protection devices, that is the input thermomagnetic circuit-breaker S202 C25, the main switch-disconnector E202 In=25A and the two thermomagnetic residual current circuit-breakers DS 201 C10/16, were already installed in the pre-existing user plant and are maintained.
Figure C1
LV grid
Bidirectionalmeter
Main switchboard
Pan
el
Str
ing
n Panels
The connection cablesbetween the panels(L1* = 1m) are (n - 1)
Meter ofproduced power
Solar cableL2 = 15m
Stringconnection L1 = 16m of the 17 panels
OVR PV 40 600 P TS
kWh S202 C25
OV
R T2 1 N
40 275s P
Id Id
S202 25A
DS201 C16 A30Id
kWh
N07V-K 3x2.5 mm2
5m
N07V-K 3x2.5mm2
L5 = 5m
+
–
+
–
+
–
+
–
–
+
L*1
L*1
L*1
N07V-K 3x2.5mm2
L4 = 1m
E202 16 A
N07V-K 3x2.5mm2
L3 = 1m
S802 PV M32
DS201 C16 AC30 DS201 C10 AC30
SPD
SPD
E 91hN/32
E 92/32 PV
Input switchboard
Field switchboard
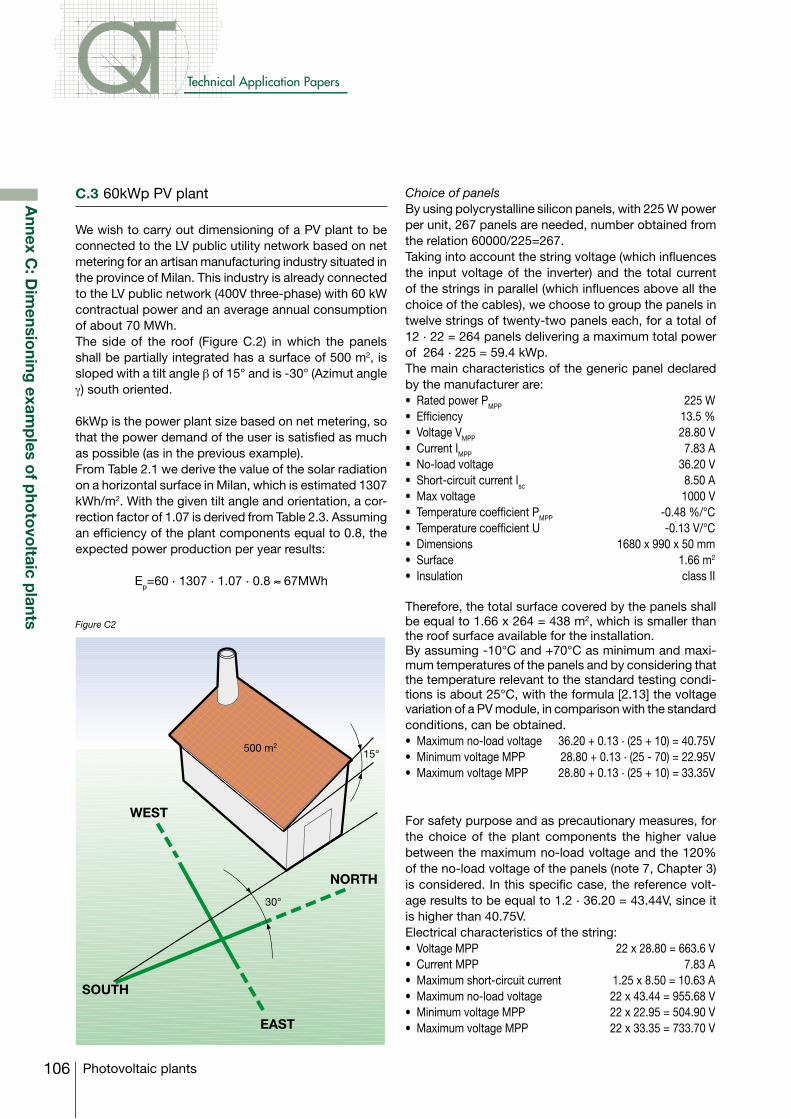
106
Technical Application Papers
Photovoltaic plants
Annex C
: Dim
ensioning
examp
les of p
hoto
voltaic p
lants
C.3 60kWp PV plant
We wish to carry out dimensioning of a PV plant to be connected to the LV public utility network based on net metering for an artisan manufacturing industry situated in the province of Milan. This industry is already connected to the LV public network (400V three-phase) with 60 kW contractual power and an average annual consumption of about 70 MWh.The side of the roof (Figure C.2) in which the panels shall be partially integrated has a surface of 500 m2, is sloped with a tilt angle β of 15° and is -30° (Azimut angle γ) south oriented. 6kWp is the power plant size based on net metering, so that the power demand of the user is satisfied as much as possible (as in the previous example).From Table 2.1 we derive the value of the solar radiation on a horizontal surface in Milan, which is estimated 1307 kWh/m2. With the given tilt angle and orientation, a cor-rection factor of 1.07 is derived from Table 2.3. Assuming an efficiency of the plant components equal to 0.8, the expected power production per year results:
Ep=60 . 1307 . 1.07 . 0.8 ≈ 67MWh
Figure C2
Choice of panelsBy using polycrystalline silicon panels, with 225 W power per unit, 267 panels are needed, number obtained from the relation 60000/225=267. Taking into account the string voltage (which influences the input voltage of the inverter) and the total current of the strings in parallel (which influences above all the choice of the cables), we choose to group the panels in twelve strings of twenty-two panels each, for a total of 12 . 22 = 264 panels delivering a maximum total power of 264 . 225 = 59.4 kWp.The main characteristics of the generic panel declared by the manufacturer are:• RatedpowerPMPP 225 W• Efficiency 13.5%• VoltageVMPP 28.80 V• CurrentIMPP 7.83 A• No-loadvoltage 36.20V• Short-circuitcurrentIsc 8.50 A• Maxvoltage 1000V• TemperaturecoefficientPMPP -0.48 %/°C• TemperaturecoefficientU -0.13V/°C• Dimensions 1680x990x50mm• Surface 1.66m2
• Insulation classII
Therefore, the total surface covered by the panels shall be equal to 1.66 x 264 = 438 m2, which is smaller than the roof surface available for the installation.By assuming -10°C and +70°C as minimum and maxi-mum temperatures of the panels and by considering that the temperature relevant to the standard testing condi-tions is about 25°C, with the formula [2.13] the voltage variation of a PV module, in comparison with the standard conditions, can be obtained.• Maximumno-loadvoltage 36.20+0.13. (25 + 10) = 40.75V• MinimumvoltageMPP 28.80+0.13. (25 - 70) = 22.95V• MaximumvoltageMPP 28.80+0.13. (25 + 10) = 33.35V
For safety purpose and as precautionary measures, for the choice of the plant components the higher value between the maximum no-load voltage and the 120% of the no-load voltage of the panels (note 7, Chapter 3) is considered. In this specific case, the reference volt-age results to be equal to 1.2 . 36.20 = 43.44V, since it is higher than 40.75V.Electrical characteristics of the string: • VoltageMPP 22x28.80=663.6V• CurrentMPP 7.83A• Maximumshort-circuitcurrent 1.25x8.50=10.63A• Maximumno-loadvoltage 22x43.44=955.68V• MinimumvoltageMPP 22x22.95=504.90V• MaximumvoltageMPP 22x33.35=733.70V
500 m2
SOUTH
NORTH
WEST
EAST
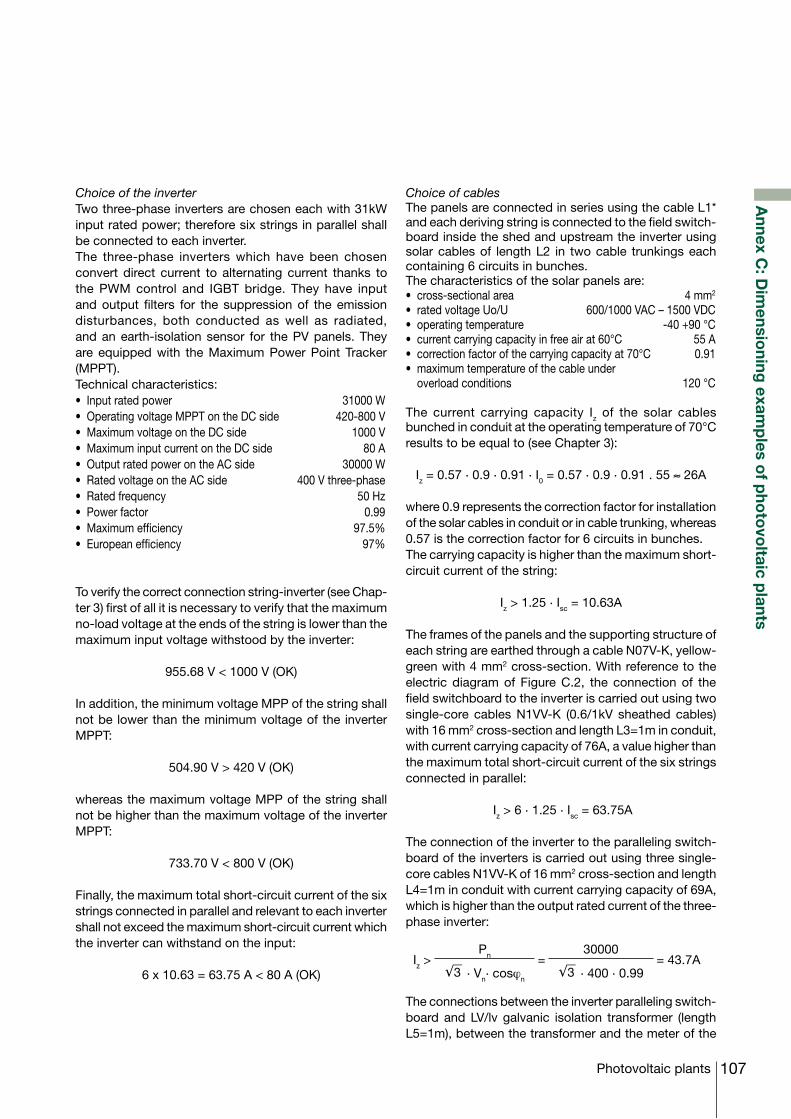
107Photovoltaic plants
Annex C
: Dim
ensioning
examp
les of p
hoto
voltaic p
lants
Choice of the inverterTwo three-phase inverters are chosen each with 31kW input rated power; therefore six strings in parallel shall be connected to each inverter.The three-phase inverters which have been chosen convert direct current to alternating current thanks to the PWM control and IGBT bridge. They have input and output filters for the suppression of the emission disturbances, both conducted as well as radiated, and an earth-isolation sensor for the PV panels. They are equipped with the Maximum Power Point Tracker (MPPT).Technical characteristics:• Inputratedpower 31000W• OperatingvoltageMPPTontheDCside 420-800V• MaximumvoltageontheDCside 1000V• MaximuminputcurrentontheDCside 80A• OutputratedpowerontheACside 30000W• RatedvoltageontheACside 400Vthree-phase• Ratedfrequency 50Hz• Powerfactor 0.99• Maximumefficiency 97.5%• Europeanefficiency 97%
To verify the correct connection string-inverter (see Chap-ter 3) first of all it is necessary to verify that the maximum no-load voltage at the ends of the string is lower than the maximum input voltage withstood by the inverter:
955.68 V < 1000 V (OK)
In addition, the minimum voltage MPP of the string shall not be lower than the minimum voltage of the inverter MPPT:
504.90 V > 420 V (OK)
whereas the maximum voltage MPP of the string shall not be higher than the maximum voltage of the inverter MPPT:
733.70 V < 800 V (OK)
Finally, the maximum total short-circuit current of the six strings connected in parallel and relevant to each inverter shall not exceed the maximum short-circuit current which the inverter can withstand on the input:
6 x 10.63 = 63.75 A < 80 A (OK)
Choice of cablesThe panels are connected in series using the cable L1* and each deriving string is connected to the field switch-board inside the shed and upstream the inverter using solar cables of length L2 in two cable trunkings each containing 6 circuits in bunches.The characteristics of the solar panels are:• cross-sectionalarea 4mm2 • ratedvoltageUo/U 600/1000VAC–1500VDC• operatingtemperature -40+90°C• currentcarryingcapacityinfreeairat60°C 55A• correctionfactorofthecarryingcapacityat70°C 0.91• maximumtemperatureofthecableunder overload conditions 120 °C
The current carrying capacity Iz of the solar cables bunched in conduit at the operating temperature of 70°C results to be equal to (see Chapter 3):
Iz = 0.57 . 0.9 . 0.91 . I0 = 0.57 . 0.9 . 0.91 . 55 ≈ 26A
where 0.9 represents the correction factor for installation of the solar cables in conduit or in cable trunking, whereas 0.57 is the correction factor for 6 circuits in bunches.The carrying capacity is higher than the maximum short-circuit current of the string:
Iz > 1.25 . Isc = 10.63A
The frames of the panels and the supporting structure of each string are earthed through a cable N07V-K, yellow-green with 4 mm2 cross-section. With reference to the electric diagram of Figure C.2, the connection of the field switchboard to the inverter is carried out using two single-core cables N1VV-K (0.6/1kV sheathed cables) with 16 mm2 cross-section and length L3=1m in conduit, with current carrying capacity of 76A, a value higher than the maximum total short-circuit current of the six strings connected in parallel:
Iz > 6 . 1.25 . Isc = 63.75A
The connection of the inverter to the paralleling switch-board of the inverters is carried out using three single-core cables N1VV-K of 16 mm2 cross-section and length L4=1m in conduit with current carrying capacity of 69A, which is higher than the output rated current of the three-phase inverter:
Iz >Pn =
30000= 43.7A
. Vn. cosϕn . 400 . 0.99
The connections between the inverter paralleling switch-board and LV/lv galvanic isolation transformer (length L5=1m), between the transformer and the meter of the
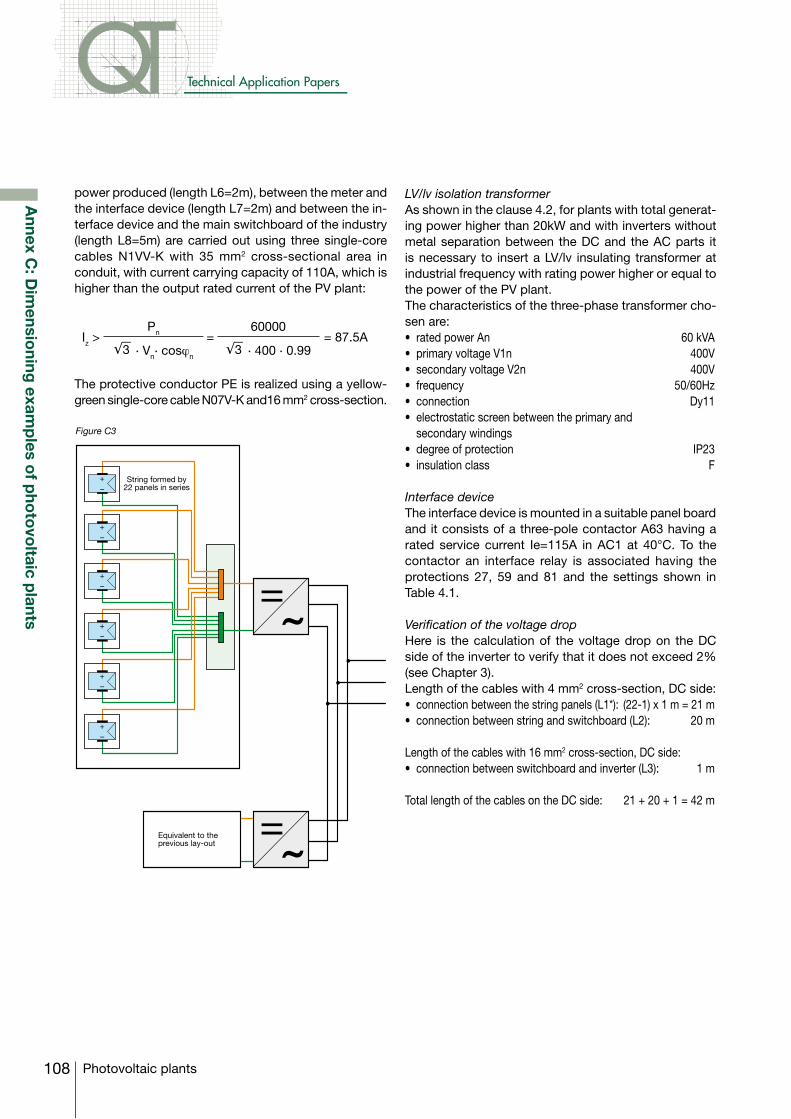
108
Technical Application Papers
Photovoltaic plants
power produced (length L6=2m), between the meter and the interface device (length L7=2m) and between the in-terface device and the main switchboard of the industry (length L8=5m) are carried out using three single-core cables N1VV-K with 35 mm2 cross-sectional area in conduit, with current carrying capacity of 110A, which is higher than the output rated current of the PV plant:
Iz >
Pn =60000
= 87.5A . Vn
. cosϕn . 400 . 0.99
The protective conductor PE is realized using a yellow-green single-core cable N07V-K and16 mm2 cross-section.
Figure C3
LV/lv isolation transformer As shown in the clause 4.2, for plants with total generat-ing power higher than 20kW and with inverters without metal separation between the DC and the AC parts it is necessary to insert a LV/lv insulating transformer at industrial frequency with rating power higher or equal to the power of the PV plant. The characteristics of the three-phase transformer cho-sen are:• ratedpowerAn 60kVA• primaryvoltageV1n 400V• secondaryvoltageV2n 400V• frequency 50/60Hz• connection Dy11• electrostaticscreenbetweentheprimaryand secondary windings• degreeofprotection IP23• insulationclass F
Interface deviceThe interface device is mounted in a suitable panel board and it consists of a three-pole contactor A63 having a rated service current Ie=115A in AC1 at 40°C. To the contactor an interface relay is associated having the protections 27, 59 and 81 and the settings shown in Table 4.1.
Verification of the voltage dropHere is the calculation of the voltage drop on the DC side of the inverter to verify that it does not exceed 2% (see Chapter 3).Length of the cables with 4 mm2 cross-section, DC side:• connection between the string panels (L1*): (22-1) x 1 m = 21 m• connectionbetweenstringandswitchboard(L2): 20m
Length of the cables with 16 mm2 cross-section, DC side:• connectionbetweenswitchboardandinverter(L3): 1m
Total length of the cables on the DC side: 21 + 20 + 1 = 42 m
Annex C
: Dim
ensioning
examp
les of p
hoto
voltaic p
lants
String formed by22 panels in series
+–
+–
+–
+–
+–
+–
Equivalent to theprevious lay-out
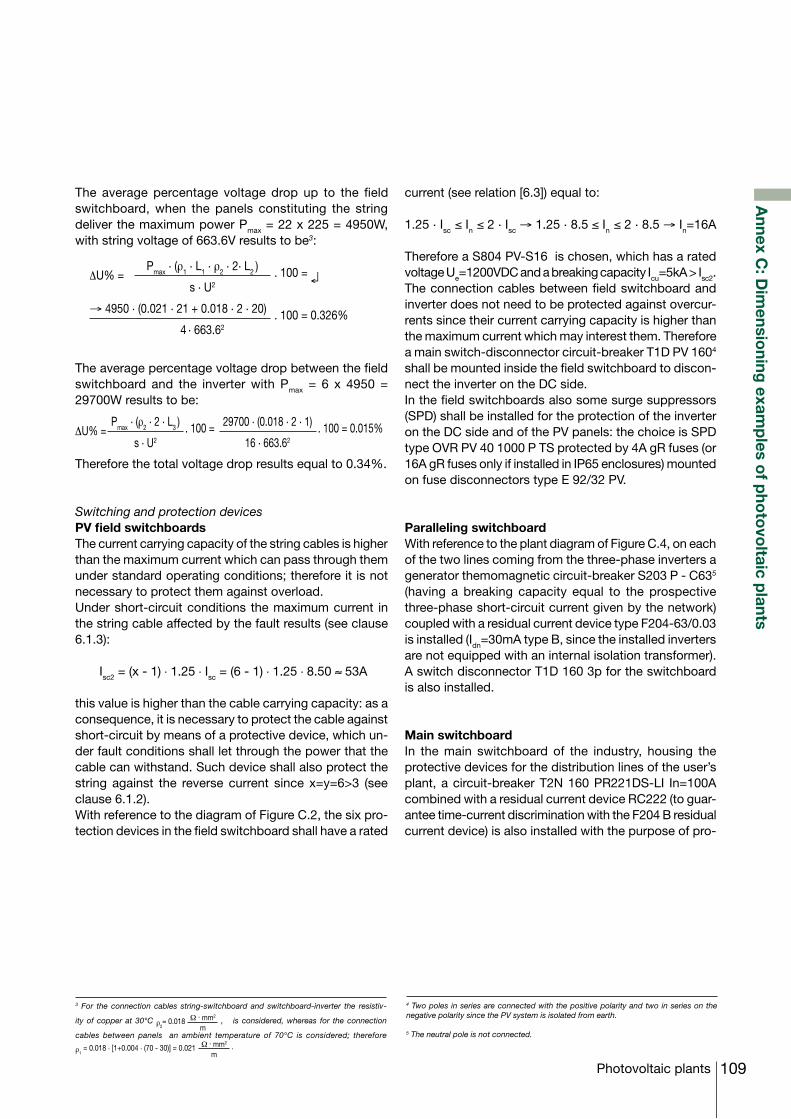
109Photovoltaic plants
3 For the connection cables string-switchboard and switchboard-inverter the resistiv-
ity of copper at 30°C ρ2= 0.018 Ω . mm2
m , is considered, whereas for the connection
cables between panels an ambient temperature of 70°C is considered; therefore
ρ1 = 0.018 . [1+0.004 . (70 - 30)] = 0.021 Ω . mm2 .
m
4 Two poles in series are connected with the positive polarity and two in series on the negative polarity since the PV system is isolated from earth.
5 The neutral pole is not connected.
The average percentage voltage drop up to the field switchboard, when the panels constituting the string deliver the maximum power Pmax = 22 x 225 = 4950W, with string voltage of 663.6V results to be3:
∆U% =Pmax . (ρ1 . L1 . ρ2 . 2. L2 ) . 100 = ↵
s . U2
→ 4950 . (0.021 . 21 + 0.018 . 2 . 20) . 100 = 0.326%4 . 663.62
The average percentage voltage drop between the field switchboard and the inverter with Pmax = 6 x 4950 = 29700W results to be:
∆U% =Pmax . (ρ2 . 2 . L3 ) . 100 = 29700 . (0.018 . 2 . 1) . 100 = 0.015%
s . U2 16 . 663.62
Therefore the total voltage drop results equal to 0.34%.
Switching and protection devicesPV field switchboardsThe current carrying capacity of the string cables is higher than the maximum current which can pass through them under standard operating conditions; therefore it is not necessary to protect them against overload.Under short-circuit conditions the maximum current in the string cable affected by the fault results (see clause 6.1.3):
Isc2 = (x - 1) . 1.25 . Isc = (6 - 1) . 1.25 . 8.50 ≈ 53A
this value is higher than the cable carrying capacity: as a consequence, it is necessary to protect the cable against short-circuit by means of a protective device, which un-der fault conditions shall let through the power that the cable can withstand. Such device shall also protect the string against the reverse current since x=y=6>3 (see clause 6.1.2).With reference to the diagram of Figure C.2, the six pro-tection devices in the field switchboard shall have a rated
current (see relation [6.3]) equal to:
1.25 . Isc ≤ In ≤ 2 . Isc → 1.25 . 8.5 ≤ In ≤ 2 . 8.5 → In=16A
Therefore a S804 PV-S16 is chosen, which has a rated voltage Ue=1200VDC and a breaking capacity Icu=5kA > Isc2.The connection cables between field switchboard and inverter does not need to be protected against overcur-rents since their current carrying capacity is higher than the maximum current which may interest them. Therefore a main switch-disconnector circuit-breaker T1D PV 1604 shall be mounted inside the field switchboard to discon-nect the inverter on the DC side.In the field switchboards also some surge suppressors (SPD) shall be installed for the protection of the inverter on the DC side and of the PV panels: the choice is SPD type OVR PV 40 1000 P TS protected by 4A gR fuses (or 16A gR fuses only if installed in IP65 enclosures) mounted on fuse disconnectors type E 92/32 PV.
Paralleling switchboardWith reference to the plant diagram of Figure C.4, on each of the two lines coming from the three-phase inverters a generator themomagnetic circuit-breaker S203 P - C635 (having a breaking capacity equal to the prospective three-phase short-circuit current given by the network) coupled with a residual current device type F204-63/0.03 is installed (Idn=30mA type B, since the installed inverters are not equipped with an internal isolation transformer).A switch disconnector T1D 160 3p for the switchboard is also installed.
Main switchboardIn the main switchboard of the industry, housing the protective devices for the distribution lines of the user’s plant, a circuit-breaker T2N 160 PR221DS-LI In=100A combined with a residual current device RC222 (to guar-antee time-current discrimination with the F204 B residual current device) is also installed with the purpose of pro-
Annex C
: Dim
ensioning
examp
les of p
hoto
voltaic p
lants
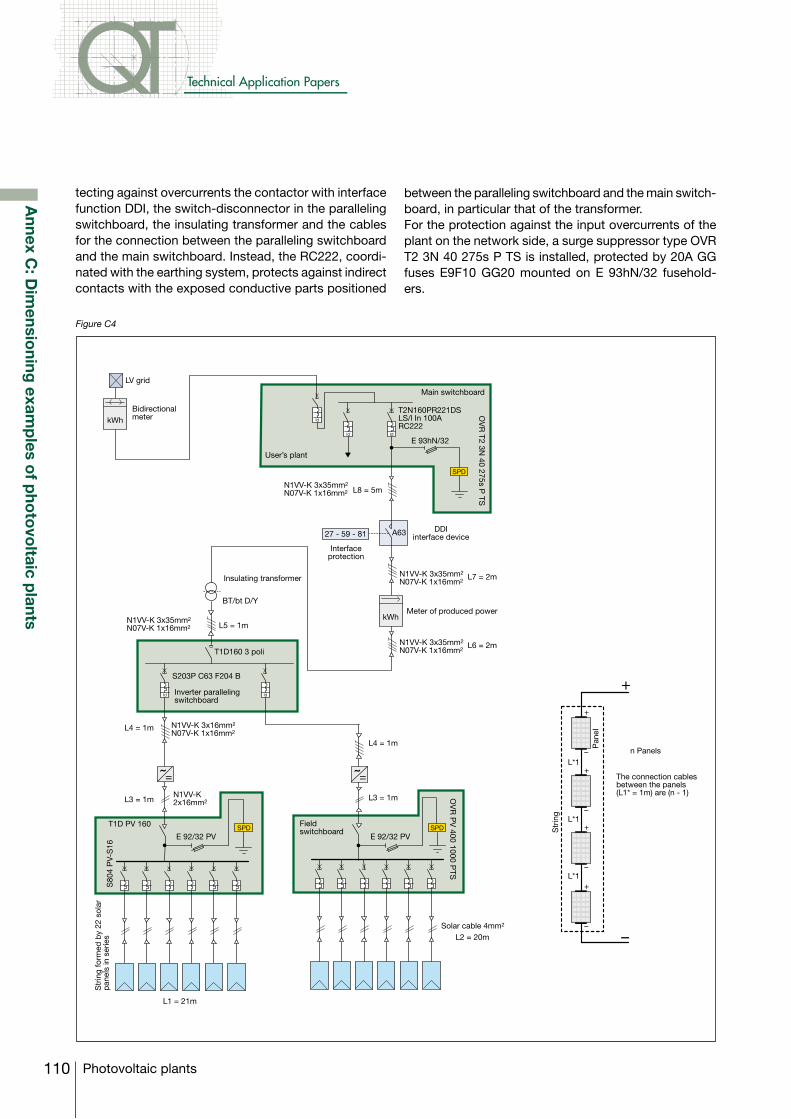
110
Technical Application Papers
Photovoltaic plants
Annex C
: Dim
ensioning
examp
les of p
hoto
voltaic p
lants
tecting against overcurrents the contactor with interface function DDI, the switch-disconnector in the paralleling switchboard, the insulating transformer and the cables for the connection between the paralleling switchboard and the main switchboard. Instead, the RC222, coordi-nated with the earthing system, protects against indirect contacts with the exposed conductive parts positioned
between the paralleling switchboard and the main switch-board, in particular that of the transformer. For the protection against the input overcurrents of the plant on the network side, a surge suppressor type OVR T2 3N 40 275s P TS is installed, protected by 20A GG fuses E9F10 GG20 mounted on E 93hN/32 fusehold-ers.
Figure C4
LV grid
BidirectionalmeterkWh
OV
R T2 3N
40 275s P TS
+
–
+
–
+
–
+
–
–
+
L*1
L*1
L*1
N1VV-K 3x35mm2
N07V-K 1x16mm2
Id
Id Id
kWh
A6327 - 59 - 81
T2N160PR221DSLS/l In 100ARC222
E 93hN/32
Id
L8 = 5m
N1VV-K 3x35mm2
N07V-K 1x16mm2 L7 = 2m
N1VV-K 3x35mm2
N07V-K 1x16mm2 L6 = 2m
Id
BT/bt D/Y
N1VV-K 3x35mm2
N07V-K 1x16mm2 L5 = 1m
T1D160 3 poli
S203P C63 F204 B
L4 = 1m
L3 = 1m
N1VV-K 3x16mm2
N07V-K 1x16mm2
N1VV-K2x16mm2
L4 = 1m
L3 = 1m
T1D PV 160
S80
4 P
V-S
16
L1 = 21m
L2 = 20m
OV
R P
V 400 1000 P
TS
SPD
SPD SPDE 92/32 PVE 92/32 PV
Main switchboard
Pan
el
Str
ing
n Panels
The connection cablesbetween the panels(L1* = 1m) are (n - 1)
Str
ing
form
ed b
y 22
sol
arp
anel
s in
ser
ies
User’s plant
Interfaceprotection
DDIinterface device
Meter of produced power
Insulating transformer
Inverter parallelingswitchboard
Solar cable 4mm2
Fieldswitchboard

QT10Photovoltaic plants
QT11Guidelines to the construction of a low-voltage switchgear and controlgear assembly complying with the Standards IEC 61439 Part 1 and Part 2
QT9Bus communication with ABB circuit-breakers
QT8Power factor correction and harmonic filtering in electrical plants
QT7Three-phase asynchronous motorsGeneralities and ABB proposals for the coordina-tion of protective devices
Technical Application PapersQT1
Low voltage selectivity with ABB circuit-breakers
QT2MV/LV trasformer substations: theory and exam-ples of short-circuit calculation
QT3Distribution systems and protection against indi-rect contact and earth fault
QT4ABB circuit-breakers inside LV switchboards
QT5ABB circuit-breakers for direct current applications
QT6Arc-proof low voltage switchgear and controlgear assemblies


1SD
C00
7109
G02
02 -
11/2
010
Contact us
ABB SACEA division of ABB S.p.A.L.V. BreakersVia Baioni, 3524123 Bergamo - Italy Tel.: +39 035 395 111 Fax: +39 035 395306-433
www.abb.com
The data and illustrations are not binding. We reserve the right to modify the contents of this document on the basis of technical development of the products, without prior notice.
Copyright 2010 ABB. All rights reserved.