Tech Report Two - engr.psu.edu · Architecture Due to the historic nature of Henderson North, built...
17
Tech Report Two Building and Plant Energy Analysis Biobehavioral Health Building The Pennsylvania State University | Biobehavioral Health Building | University Park, PA | Mechanical | Ling | Jake Copley
Transcript of Tech Report Two - engr.psu.edu · Architecture Due to the historic nature of Henderson North, built...

Tech Report Two
Building and Plant Energy Analysis
Biobehavioral Health Building
The Pennsylvania State University | Biobehavioral Health Building | University Park, PA | Mechanical | Ling | Jake Copley

Table of Contents
Tech Report Two 1
Executive Summary 1
Building Overview 2
Occupant 2
Primary Project Team 2
Architecture 3
Mechanical System Summary 4
System Design Load Estimation 4
Load Assumptions 4
Walls 4
Occupancy and Ventilation 4
Infiltration 4
Lighting and Equipment Loads 5
Weather Data 5
Schedules 5
Results 5
Energy Consumption and Operating Costs 6
Biobehavioral Health Building | University Park, PA | Mechanical | Ling | Jake Copley | Tech Report Two Rev 1 | 12/9/2011
The Pennsylvania State University | Architectural Engineering Senior Thesis 1

Assumptions 6
Results 6
Building Emission Rates 8
References 10
Appendix 11
Biobehavioral Health Building | University Park, PA | Mechanical | Ling | Jake Copley | Tech Report Two Rev 1 | 12/9/2011
The Pennsylvania State University | Architectural Engineering Senior Thesis 2

Tech Report Two
Executive SummaryThe purpose of tech report two is to conduct a load and energy analysis of the Biobehavioral Health Building (BBH) and determine its heating and cooling loads, annual operating costs and cost per square foot. DesignBuilder v1.4.0.056 with EnergyPlus v2.1.0 was used for the load analysis and energy consumption of BBH.
After a simulation was completed the modeled heating and cooling loads were compared with the minimum loads specified in the construction documents. The annual operating costs and costs per square foot for BBH were also compared with values determined by the mechanical engineer’s energy model results.
A 3-D model was created using DesignBuilder and simulations were run within DesignBuilding using EnergyPlus simulation software. The results from DesignBuilder were also compared to the results of the mechanical engineers energy model who used Carrier HAP v4.4. It was determined that BBH consumes about 56 kBTU/SF-year. BBH is calculated to cost $1.28/SF-year or $119,265 per year.
Biobehavioral Health Building | University Park, PA | Mechanical | Ling | Jake Copley | Tech Report Two Rev 1 | 12/9/2011
The Pennsylvania State University | Architectural Engineering Senior Thesis 1

Building OverviewThe Biobehavioral Health Building (BBH) is a
93,500 square foot new construction building located at The Pennsylvania State University Main Campus, in University Park, PA and a overall project cost of $48.1 million. There are four floors above ground, one below and a mechanical penthouse. The site was originally home to a parking lot and an existing 12,000 square foot Henderson Bridge Building, which was building in 1958. The new Biobehavioral Health Building is located south of the Henderson North Building between the Old Main lawn and the HUB lawn (Figure 1). It’s expected completion date is November of 2012.
OccupantBiobehavioral Health, from the College of Health and Human Development, will occupy the majority of the first floor and the entire second floor. On the third floor is space allocated for The Prevention Research Center. The Center for Aging and the Center for Human Development and Family Research in Diverse Contexts share the fourth floor. Each floor consists of a mix of offices, projects and research spaces. The ground floor contains a 200 seat lecture hall and the first floor has two 35 seat general purpose classrooms.
Primary Project Team
Owner The Pennsylvania State University www.opp.psu.eduArchitect Bohlin Cywinski Jackson www.bcj.com
CM Massaro CM Services www.massarocorporation.comMEP/Fire Protection Bruce E. Brooks Associates www.brucebrooks.comStructural Engineer Robert Silman Associates www.rsapc.com
Civil Engineer Gannett Fleming, Inc. www.gannettfleming.comLandscape Architect Michael Vergason www.vergason.netGeotech Consultant CMT Laboratories, Inc. www.cmtlaboratories.com
GC L.S. Fiore www.lsfiore.com
Biobehavioral Health Building | University Park, PA | Mechanical | Ling | Jake Copley | Tech Report Two Rev 1 | 12/9/2011
The Pennsylvania State University | Architectural Engineering Senior Thesis 2
Figure 1: Arial view from Bing.com showing location.

ArchitectureDue to the historic nature of Henderson North, built in 1933, the BBH was designed to be aesthetically complimentary to Henderson North. The differences between the two buildings are responses to the growth of sustainable design and the need for student activities. The building is served with main double loaded corridors down the middle of the building connecting the three main entrances on the east and west sides of the building. General purpose classrooms are located on the ground and first floor for ease of access for students. Offices, project and research spaces are located on the upper floors.
Limestone and brick clad the building paying their respects to Henderson North. The limestone veneer wraps into the main entry ways on both the east and west entrances. All three entrances are located on heavy cross campus traffic areas. The West entrance is off the Old Main lawn (Figure 2). Another entrance is located on the HUB lawn (Figure 3) on the Northeast corner of the building along with the third entrance on the Southeast corner (Figure 4). Salvaged Elm wood from the Penn State Campus can be seen as accent pieces, benches and cabinetry throughout the building.
BBH has two main sustainable features. The first is a green roof that covers approximately fifty percent of the roof area. Second, complimenting the green roof is a cistern that collects rainwater runoff to be used for landscape maintenance. The use of a cistern is one of the first buildings to use the concept to reduce storm runoff into the storm system reducing the stress on the system during a heavy rain storm. BBH is located in the University Planned District (UPD). Per Pennsylvania State University standards, Penn State requires all future buildings on the Penn State Campuses must be LEED Certified. To help improve energy efficiency, BBH has been design to be in conformance with the International Energy Conservation Code.
The facade is very similar to Henderson North with limestone veneer up to the second floor followed by brick on the remaining floors. There are also limestone accent pieces around the building again in similar fashion to Henderson North. On the northeast and southeast corners of the building there are glass curtain walls surrounding the main stairwell and entrances.
Biobehavioral Health Building | University Park, PA | Mechanical | Ling | Jake Copley | Tech Report Two Rev 1 | 12/9/2011
The Pennsylvania State University | Architectural Engineering Senior Thesis 3
Figure 4: Southeast entrance.
Figure 3: Entrance off the HUB lawn.
Figure 2: West entrance off Old Main lawn.

Mechanical System SummaryThe mechanical system of the Biobehavioral Health Building is composed of six variable air volume air handling units with economizers. The air handlers are divided by zone, AHU-1 and 5 service the core of the building, AHU-2 serves the classrooms, AHU-3 and 4 serve the south and north offices respectively and finally AHU-6 serves the conference rooms. BBH also uses perimeter radiant heat.
BBH is fed off the campus steam and chilled water loops which provide all heating and cooling needs along with domestic hot water requirements. Steam from the campus loop is fed through a plate heat exchanger which transfers heat to the building hot water loops.
System Design Load Estimation
Load AssumptionsAn energy load analysis was performed to determine heating and cooling loads along with annual operating costs and a cost per square foot basis. The information below are the data used to compute the estimated heating and cooling loads.
WallsThe U-values shown in Table 2.1 were calculated from walls sections found in the construction documents. There are several wall types used throughout the building but only a few were used as typical conditions
Table 2.1: Wall U-valuesConstruction
Table 2.1: Wall U-valuesTable 2.1: Wall U-valuesU-value (BTU/h SF F) Source
External Walls
Floors
Green Roof
Pitched Roof
Window
0.082 CD's0.578 CD's0.044 CD's0.066 CD's0.423 Assumption
Occupancy and VentilationOccupied outdoor airflow (OA) rates from the air handling unit schedules were used and average over the total occupied space in the building. This average occupied OA rate was determined to be 0.147CFM/SF. The building was assumed to follow an occupancy activity level of a typical office building. Occupancy schedules are used for HVAC controlled (Table2.3). The occupant density (people/SF) was determined to be about 1 person/100 SF, this was determined using the estimated occupancy from design documents.
InfiltrationThe infiltration rate was assumed to be 0.5 air changes per hour. No infiltration was given in the construction documents so an assumption was made to account for infiltration effects.
Biobehavioral Health Building | University Park, PA | Mechanical | Ling | Jake Copley | Tech Report Two Rev 1 | 12/9/2011
The Pennsylvania State University | Architectural Engineering Senior Thesis 4
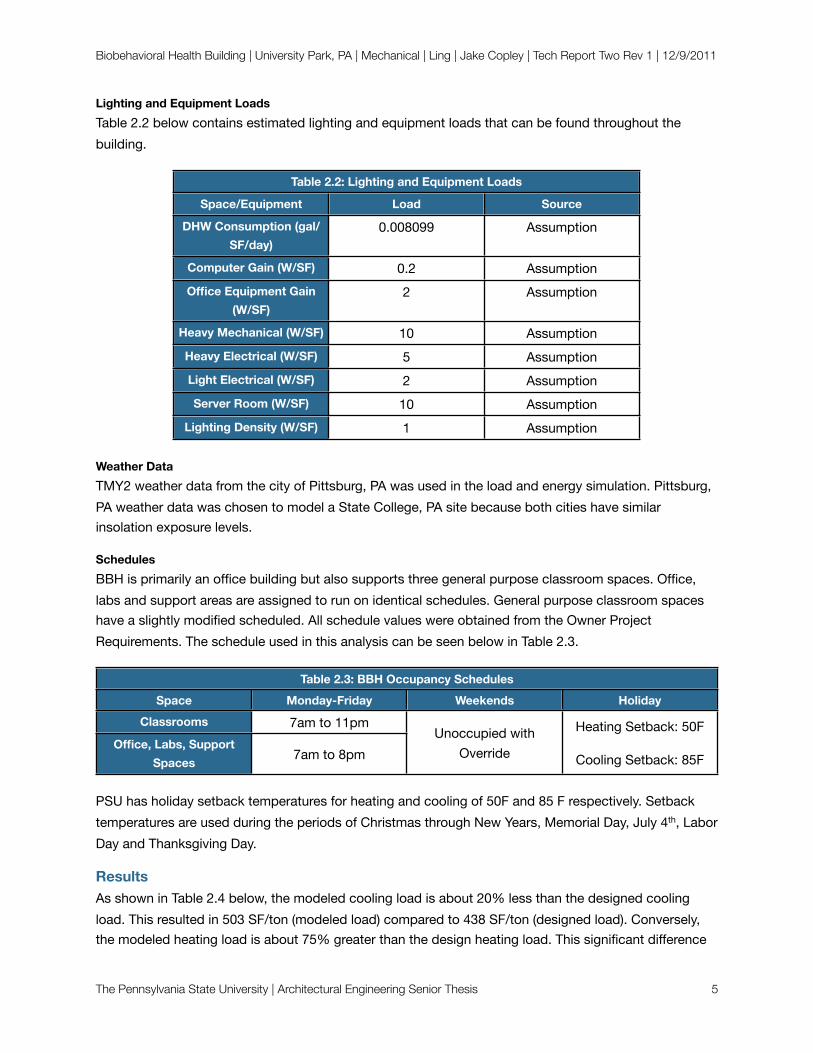
Lighting and Equipment LoadsTable 2.2 below contains estimated lighting and equipment loads that can be found throughout the building.
Table 2.2: Lighting and Equipment Loads
Space/Equipment
Table 2.2: Lighting and Equipment LoadsTable 2.2: Lighting and Equipment Loads
Load Source
DHW Consumption (gal/SF/day)
Computer Gain (W/SF)
Office Equipment Gain (W/SF)
Heavy Mechanical (W/SF)
Heavy Electrical (W/SF)
Light Electrical (W/SF)
Server Room (W/SF)
Lighting Density (W/SF)
0.008099 Assumption
0.2 Assumption2 Assumption
10 Assumption5 Assumption2 Assumption10 Assumption1 Assumption
Weather DataTMY2 weather data from the city of Pittsburg, PA was used in the load and energy simulation. Pittsburg, PA weather data was chosen to model a State College, PA site because both cities have similar insolation exposure levels.
SchedulesBBH is primarily an office building but also supports three general purpose classroom spaces. Office, labs and support areas are assigned to run on identical schedules. General purpose classroom spaces have a slightly modified scheduled. All schedule values were obtained from the Owner Project Requirements. The schedule used in this analysis can be seen below in Table 2.3.
Table 2.3: BBH Occupancy SchedulesSpace
Table 2.3: BBH Occupancy SchedulesTable 2.3: BBH Occupancy SchedulesTable 2.3: BBH Occupancy SchedulesMonday-Friday Weekends Holiday
Classrooms
Office, Labs, Support Spaces
7am to 11pmUnoccupied with
Override
Heating Setback: 50F
Cooling Setback: 85F7am to 8pmUnoccupied with
Override
Heating Setback: 50F
Cooling Setback: 85F
PSU has holiday setback temperatures for heating and cooling of 50F and 85 F respectively. Setback temperatures are used during the periods of Christmas through New Years, Memorial Day, July 4th, Labor Day and Thanksgiving Day.
ResultsAs shown in Table 2.4 below, the modeled cooling load is about 20% less than the designed cooling load. This resulted in 503 SF/ton (modeled load) compared to 438 SF/ton (designed load). Conversely, the modeled heating load is about 75% greater than the design heating load. This significant difference
Biobehavioral Health Building | University Park, PA | Mechanical | Ling | Jake Copley | Tech Report Two Rev 1 | 12/9/2011
The Pennsylvania State University | Architectural Engineering Senior Thesis 5

could be the result of variations in the assumptions made for each of the separate models, such as conductance values used for walls, roofs, slabs and windows. Other internal loads were neglected due to the lack of information and for simplification.
Table 2.4: Modeled vs. Designed Heating and Cooling LoadsSystemTable 2.4: Modeled vs. Designed Heating and Cooling LoadsTable 2.4: Modeled vs. Designed Heating and Cooling Loads
Load SF Per BasisCooling Modeled (Tons)
Cooling Designed (Tons)
Heating Modeled (kBTU/hr)
Heating Designed (kBTU/hr)
Modeled SA CFM
Design SA CFM
155 503 SF/ton178 438 SF/ton3073 25 SF/kBTU
1758 44 SF/kBTU
65907 0.845 CFM/SF69900 0.896 CFM/SF
Energy Consumption and Operating Costs
AssumptionsBBH receives all its energy through campus distribution loops, from various central plant/distribution sites. Table 2.5 shows the campus rates used for estimated annual operating costs.
Table 2.5: Energy RatesFuel
Table 2.5: Energy RatesCampus Rates
Electricity ($/kWh)
Chilled Water ($/ton-hour)
Steam ($/1000lb)
0.093870.2224.59
ResultsTable 2.6 below shows the distribution of energy use by the various building systems. Figure 5 below shows a breakdown of the percentage of energy use by each system in the building, this can be used to help determine where future energy savings could occur. As shown in Table 2.6 and Figure 2.5 the heating load dominates all other loads by using 53% of the buildings total energy demand. The building system with the next largest load is the plug load at 20% of the total building demand.
Table 2.6: Annual Building LoadsSource
Table 2.6: Annual Building LoadsTable 2.6: Annual Building LoadsTable 2.6: Annual Building LoadsTable 2.6: Annual Building LoadsTable 2.6: Annual Building LoadsTable 2.6: Annual Building LoadskBTU kWh Ton-hour Lbs Steam
(x1000)Utility Rate Cost ($/Year)
Heating
Cooling
DHW
Plug Load
2,364,136 692,889 - 1,980 24.59 $48,689680,158 199,343 56,680 - 0.22 $12,470173,522 50,856 - 145 24.59 $3,574914,994 268,169 - - 0.09387 $25,173
Biobehavioral Health Building | University Park, PA | Mechanical | Ling | Jake Copley | Tech Report Two Rev 1 | 12/9/2011
The Pennsylvania State University | Architectural Engineering Senior Thesis 6

Table 2.6: Annual Building LoadsSource
Table 2.6: Annual Building LoadsTable 2.6: Annual Building LoadsTable 2.6: Annual Building LoadsTable 2.6: Annual Building LoadsTable 2.6: Annual Building LoadsTable 2.6: Annual Building LoadskBTU kWh Ton-hour Lbs Steam
(x1000)Utility Rate Cost ($/Year)
Lighting
System Fans
System Pumps
Total
770,221 225,739 - - 0.09387 $21,19075,824 22,223 - - 0.09387 $2,086221,155 64,817 - - 0.09387 $6,084
5,200,010 1,524,036 433,334 4,355 - $119,265
With a total building area of 93,500 SF, BBH consumes about 56kBTU/SF or 16 kWh/SF-year and costs about $1.28/SF-year.
Heating Cooling DHW Plug Load LightingSystem Fans System Pumps
4%1%
15%
18%
3%13%
45%
Figure 5: Building Load Distribution
Biobehavioral Health Building | University Park, PA | Mechanical | Ling | Jake Copley | Tech Report Two Rev 1 | 12/9/2011
The Pennsylvania State University | Architectural Engineering Senior Thesis 7

Building Emission RatesEmissions rates were calculated base on the total energy consumption of BBH. BBH is located in the Eastern Region according to the National Renewable Energy Laboratory (NREL) shown in Figure 6 below. The amount of pollutant per kWh of electricity and per ton of coal was obtained from the NREL Energy and Emissions Report.
Figure 6: NREC Interconnections
Table 2.7: Annual Pollutant from Electrical and Cooling LoadPollutant
Table 2.7: Annual Pollutant from Electrical and Cooling LoadTable 2.7: Annual Pollutant from Electrical and Cooling LoadTable 2.7: Annual Pollutant from Electrical and Cooling LoadLb of Pollutant per kWh
of ElectricitykWh of Electricity per
YearTotal Amount of Pollutant
per Year (lbs)
CO2
Nox
Sox
PM10
Total lbs of Pollutant
1.64
780291
12796770.003
7802912341
0.00857780291
66870.0000416
780291
32- - 1288738
Biobehavioral Health Building | University Park, PA | Mechanical | Ling | Jake Copley | Tech Report Two Rev 1 | 12/9/2011
The Pennsylvania State University | Architectural Engineering Senior Thesis 8

The PSU west campus steam plant was assumed to be a commercial coal fired boiler using bituminous coal.
Table 2.8: Annual Pollutant from Steam Consumption (Coal Fuel)Pollutant
Table 2.8: Annual Pollutant from Steam Consumption (Coal Fuel)Table 2.8: Annual Pollutant from Steam Consumption (Coal Fuel)Table 2.8: Annual Pollutant from Steam Consumption (Coal Fuel)Lb of Pollutant per Ton of
CoalTons of Coal Consumed Total Amount of Pollutant
per Year (lbs)
CO2
Nox
Sox
PM10
Total lbs of pollutant
5260
156
82056011.5
1561794
3.32156
5184
156
624- - 823496
Table 2.7 and 2.8 above show the amount of CO2, Nox, Sox and particulate matter (PM10) produce from the combustion process use to generate electricity for the electrical demand and steam for the steam demand, respectively. Comparing the pounds of pollutant per kWh and ton of coal, you can see the low efficiency in the process of generating electricity. As shown above in Figure 5, the heating load dominates all other loads in the building and this load is met via steam supply. The process of converting the energy in coal to heat in steam for building use is much higher than that of electricity generation and distribution. On the contrary, coal as a fuel is very dirty and you can see that the total pounds of pollutant generate by coal in less than that produced in the process of generating electricity but the particulate matter generated from producing steam is almost 20 times greater than the amount generated by producing electricity.
Biobehavioral Health Building | University Park, PA | Mechanical | Ling | Jake Copley | Tech Report Two Rev 1 | 12/9/2011
The Pennsylvania State University | Architectural Engineering Senior Thesis 9
References
ASHRAE. (2007). Standard 62.1 - 2007, Ventilation for Acceptable Indoor Air Quality. Atlanta, GA: American Society of Heating Refrigeration and Air Conditioning Engineers, Inc.
ASHRAE. (2007). Standard 90.1 - 2007, Energy Standard for Buildings Except Low-Rise Residential Buildings. Atlanta, GA: American Society of Heating Refrigeration and Air Conditioning Engineers, Inc.
Bohlin Cywinski Jackson. Architectural Construction Documents. Wilkes-Barre, PA.
Bruce E. Brooks & Associates. Electrical Construction Documents. Philadelphia, PA.
Bruce E. Brooks & Associates. Mechanical Construction Documents. Philadelphia, PA.
Copley, Jake. Project Charter - Biobehavioral Health Building. Working Paper. University Park, PA: Penn State, 2011. Print
NREL. (2007). Source Energy and Emissions Factors for Energy Use in Buildings. Midwest Research Institute: National Renewable Energy Laboratory.
Steam Services - Fact Sheet. Working Paper. University Park, PA: Penn State, 2007. Print.
Utility Fact Sheet. Tech. University Park, PA: Penn State, 2010. Print
Biobehavioral Health Building | University Park, PA | Mechanical | Ling | Jake Copley | Tech Report Two Rev 1 | 12/9/2011
The Pennsylvania State University | Architectural Engineering Senior Thesis 10

Appendix
See attached spreadsheets.
Biobehavioral Health Building | University Park, PA | Mechanical | Ling | Jake Copley | Tech Report Two Rev 1 | 12/9/2011
The Pennsylvania State University | Architectural Engineering Senior Thesis 11

Pollutant CalculationsPollutant CalculationsPollutant CalculationsPollutant CalculationsPollutant CalculationsPollutant CalculationsPollutant CalculationsHeating DHW Total
Specific Heat of Liquid Water (BTU/LbF)Specific Heat of Steam (BTU/Lb)Heat of VaporizationTi(F)Coal Heat Capacity (BTU/Lb)Boiler Efficiency
Heating BTU’sLb SteamLb CoalTons of CoalTons of Coal/1000lb of SteamLbs CO2/Ton CoalLbs Nox/Ton CoalLbs Sox/Ton CoalLbs PM10/Ton Coal
1 1 1
1300 1300 1300
1000 1000 1000
57 57 5713600 13600 13600
0.60 0.60 0.60
2364136000 173522000 2537658000
1818566.1538 1818.5661538 133478.46154 133.47846154 1952044.6154173833.52941 12758.970588 186592.5144.86127451 10.63247549 155.493750.0796568627
5260 761970.30392 5260 55926.821078 5260 817897.125
11.5 1665.9046569 11.5 122.27346814 11.5 1788.178125
3.32 480.93943137 3.32 35.299818627 3.32 516.23925
4 579.44509804 4 42.529901961 4 621.975

Biobehavioral Health BuildingBiobehavioral Health BuildingSim SoftwareSim Software
Biobehavioral Health BuildingBiobehavioral Health BuildingDesignbuilder - EnergyPlus Source/Assumption
Activity Occupant Density (P/SF)
Activity
DHW Consumption rate (gal/SF/day)
Activity
Heating Setpoint (F)
Activity
Heating Set Back (F)
Activity
Cooling Setpoint (F)
Activity
Cooling Set Back (F)
Activity
Fresh air (CFM/SF)
Activity
Computer Gain (W/SF)
Activity
Office Equipment Gain (W/SF)
Construction External Walls (U-Value [BTU/hSFF])
Construction
Flat Roof (U-Value [BTU/hSFF])
Construction
Pitched Roof (Unoccupied) (U-Value [BTU/hSFF])
Construction
Internal Partitions (U-Value [BTU/hSFF])
Construction
Floors (U-Value [BTU/hSFF])
Construction
Airtightness (ac/h)Openings Glazing Type (U-Value
[BTU/hSFF])Lighting Lighting Density (W/
SF)Lighting
Luminaire TypeHVAC TemplateHVAC
System AvailabilityHVAC
Night Cycle Control
HVAC
Fan Efficiency (%)
HVAC
Fan Placement
HVAC
Part-Load Power Coefficients
Heating FuelHeatingDesign Margin
Heating
Heat Generation CoP
Heating
Distribution Losses (%)
Heating
Coil Type
Heating
Off Coil AIr Temp Setpoint (F)
Heating
Heating Coil setpoint Reset Type
Heating
Reheat Coil TypeCooling FuelCooling
Design MarginCooling
Chiller CoP
Cooling
Condenser Type
Cooling
Distribution Losses (%)
Cooling
Coil Type
Cooling
Cooling Coil Setpoint (F)
Cooling
Cooling Coil Setpoint Reset Type
DHW TypeDHWDHW CoP
DHW
Fuel
DHW
Delivery Temp (F)
DHW
Mains Supply Temperature (F)
0.009 Building Average
0.007 Default
70 OPR60 OPR75 OPR85 OPR
0.147 Occupied OA Average from Cd’s0.2 Default2 Assumed Receptacle Equipment Load (All Spaces)
0.081 Tech 1
0.047 Tech 1
0.047 Tech 1
0.576 Composition
0.578 Composition
0.5 Default0.423 Assumption
1 90.1 = 1.2 W/SF, Takeoff = 0.6W/SF
Recessed Lighting Schedule (Average for all spaces)VAV with Terminal Reheat Cd’s
Classroom: 7am-11pm, All Other Spaces: 7am-8pm OPRStay Off Cd’s
80 TakeoffBlow Through Cd’s
VFD Cd’s
Waste Heat Modeled Approach1 Assumption1 Modeled Approach5 Default
Hot Water Cd’s57 Cd’s
Outdoor Air Temperature Reset Cd’s
Hot Water Cd’sWaste Heat Default
1 Default1 Default
Water Cooled Loop properties5 Default
Chilled Water Cd’s55 Cd’s
Outdoor Air Temperature Reset Cd’s
Instantaneous DHW Only Modeled Approach1 Modeled Approach
Waste Heat Modeled Approach170 Cd’s57 Assumed Ground Temp
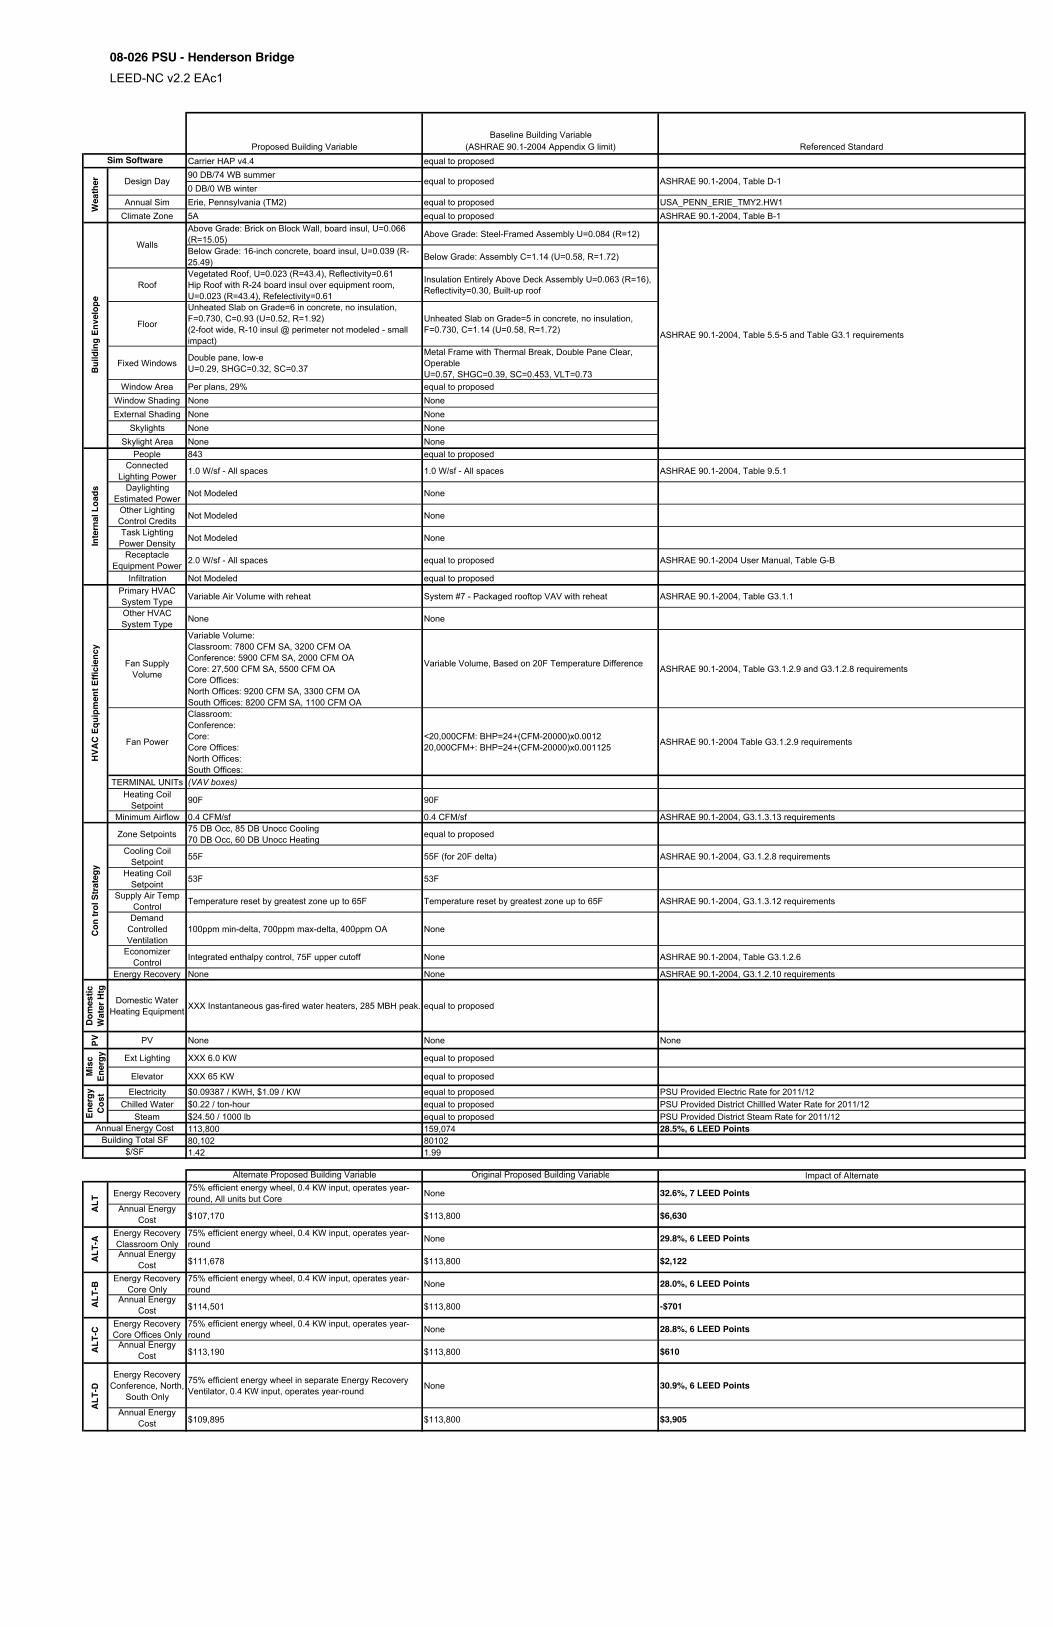
08-026 PSU - Henderson BridgeLEED-NC v2.2 EAc1
Baseline Building VariableProposed Building Variable (ASHRAE 90.1-2004 Appendix G limit) Referenced Standard
Carrier HAP v4.4 equal to proposed90 DB/74 WB summer0 DB/0 WB winter
Annual Sim Erie, Pennsylvania (TM2) equal to proposed USA_PENN_ERIE_TMY2.HW1Climate Zone 5A equal to proposed ASHRAE 90.1-2004, Table B-1
Above Grade: Brick on Block Wall, board insul, U=0.066 (R=15.05) Above Grade: Steel-Framed Assembly U=0.084 (R=12)
Below Grade: 16-inch concrete, board insul, U=0.039 (R-25.49) Below Grade: Assembly C=1.14 (U=0.58, R=1.72)
RoofVegetated Roof, U=0.023 (R=43.4), Reflectivity=0.61Hip Roof with R-24 board insul over equipment room, U=0.023 (R=43.4), Refelectivity=0.61
Insulation Entirely Above Deck Assembly U=0.063 (R=16), Reflectivity=0.30, Built-up roof
Floor
Unheated Slab on Grade=6 in concrete, no insulation, F=0.730, C=0.93 (U=0.52, R=1.92)(2-foot wide, R-10 insul @ perimeter not modeled - small impact)
Unheated Slab on Grade=5 in concrete, no insulation, F=0.730, C=1.14 (U=0.58, R=1.72)
Fixed Windows Double pane, low-eU=0.29, SHGC=0.32, SC=0.37
Metal Frame with Thermal Break, Double Pane Clear, OperableU=0.57, SHGC=0.39, SC=0.453, VLT=0.73
Window Area Per plans, 29% equal to proposedWindow Shading None NoneExternal Shading None None
Skylights None NoneSkylight Area None None
People 843 equal to proposedConnected
Lighting Power 1.0 W/sf - All spaces 1.0 W/sf - All spaces ASHRAE 90.1-2004, Table 9.5.1
Daylighting Estimated Power Not Modeled None
Other Lighting Control Credits Not Modeled None
Task Lighting Power Density Not Modeled None
Receptacle Equipment Power 2.0 W/sf - All spaces equal to proposed ASHRAE 90.1-2004 User Manual, Table G-B
Infiltration Not Modeled equal to proposedPrimary HVAC System Type Variable Air Volume with reheat System #7 - Packaged rooftop VAV with reheat ASHRAE 90.1-2004, Table G3.1.1
Other HVAC System Type None None
Fan Supply Volume
Variable Volume:Classroom: 7800 CFM SA, 3200 CFM OAConference: 5900 CFM SA, 2000 CFM OACore: 27,500 CFM SA, 5500 CFM OACore Offices: North Offices: 9200 CFM SA, 3300 CFM OASouth Offices: 8200 CFM SA, 1100 CFM OA
Variable Volume, Based on 20F Temperature Difference ASHRAE 90.1-2004, Table G3.1.2.9 and G3.1.2.8 requirements
Fan Power
Classroom: Conference: Core: Core Offices: North Offices: South Offices:
<20,000CFM: BHP=24+(CFM-20000)x0.001220,000CFM+: BHP=24+(CFM-20000)x0.001125 ASHRAE 90.1-2004 Table G3.1.2.9 requirements
TERMINAL UNITs (VAV boxes)Heating Coil
Setpoint 90F 90F
Minimum Airflow 0.4 CFM/sf 0.4 CFM/sf ASHRAE 90.1-2004, G3.1.3.13 requirements
Zone Setpoints 75 DB Occ, 85 DB Unocc Cooling70 DB Occ, 60 DB Unocc Heating equal to proposed
Cooling Coil Setpoint 55F 55F (for 20F delta) ASHRAE 90.1-2004, G3.1.2.8 requirements
Heating Coil Setpoint 53F 53F
Supply Air Temp Control Temperature reset by greatest zone up to 65F Temperature reset by greatest zone up to 65F ASHRAE 90.1-2004, G3.1.3.12 requirements
Demand Controlled Ventilation
100ppm min-delta, 700ppm max-delta, 400ppm OA None
Economizer Control Integrated enthalpy control, 75F upper cutoff None ASHRAE 90.1-2004, Table G3.1.2.6
Energy Recovery None None ASHRAE 90.1-2004, G3.1.2.10 requirements
Dom
estic
W
ater
Htg
Domestic Water Heating Equipment XXX Instantaneous gas-fired water heaters, 285 MBH peak. equal to proposed
PV PV None None None
Ext Lighting XXX 6.0 KW equal to proposed
Elevator XXX 65 KW equal to proposed
Electricity $0.09387 / KWH, $1.09 / KW equal to proposed PSU Provided Electric Rate for 2011/12Chilled Water $0.22 / ton-hour equal to proposed PSU Provided District Chillled Water Rate for 2011/12
Steam $24.50 / 1000 lb equal to proposed PSU Provided District Steam Rate for 2011/12113,800 159,074 28.5%, 6 LEED Points80,102 801021.42 1.99
Alternate Proposed Building Variable Original Proposed Building Variable Impact of Alternate
Energy Recovery 75% efficient energy wheel, 0.4 KW input, operates year-round, All units but Core None 32.6%, 7 LEED Points
Annual Energy Cost $107,170 $113,800 $6,630
Energy Recovery Classroom Only
75% efficient energy wheel, 0.4 KW input, operates year-round None 29.8%, 6 LEED Points
Annual Energy Cost $111,678 $113,800 $2,122
Energy Recovery Core Only
75% efficient energy wheel, 0.4 KW input, operates year-round None 28.0%, 6 LEED Points
Annual Energy Cost $114,501 $113,800 -$701
Energy Recovery Core Offices Only
75% efficient energy wheel, 0.4 KW input, operates year-round None 28.8%, 6 LEED Points
Annual Energy Cost $113,190 $113,800 $610
Energy Recovery Conference, North,
South Only
75% efficient energy wheel in separate Energy Recovery Ventilator, 0.4 KW input, operates year-round None 30.9%, 6 LEED Points
Annual Energy Cost $109,895 $113,800 $3,905
ASHRAE 90.1-2004, Table 5.5-5 and Table G3.1 requirements
Wea
ther Design Day equal to proposed ASHRAE 90.1-2004, Table D-1
Bui
ldin
g En
velo
pe
Sim Software
Walls
Ener
gy
Cos
tM
isc
Ener
gyC
on tr
ol S
trate
gyH
VAC
Equ
ipm
ent E
ffici
ency
Inte
rnal
Loa
ds
Building Total SF$/SF
Annual Energy Cost
ALT
-DA
LTA
LT-A
ALT
-BA
LT-C