
Teachers as Policy Implementers Authors: Jamie Brett ...101877/datastream/PDF/... · A single case...
222
Persistent link: http://hdl.handle.net/2345/3812 This work is posted on eScholarship@BC, Boston College University Libraries. Boston College Electronic Thesis or Dissertation, 2014 Copyright is held by the author, with all rights reserved, unless otherwise noted. Turning Around Schools: A View From Teachers as Policy Implementers Authors: Jamie Brett Chisum, Anna Carollo Cross, Jill S. Geiser, Charles Alexander Grandson IV
Transcript of Teachers as Policy Implementers Authors: Jamie Brett ...101877/datastream/PDF/... · A single case...

Persistent link: http://hdl.handle.net/2345/3812
This work is posted on eScholarship@BC,Boston College University Libraries.
Boston College Electronic Thesis or Dissertation, 2014
Copyright is held by the author, with all rights reserved, unless otherwise noted.
Turning Around Schools: A View FromTeachers as Policy Implementers
Authors: Jamie Brett Chisum, Anna Carollo Cross, Jill S.Geiser, Charles Alexander Grandson IV

BOSTON COLLEGE
Lynch School of Education
Department of Educational Leadership and Higher Education
Professional School Administrator Program (PSAP)
TURNING AROUND SCHOOLS: A VIEW FROM TEACHERS AS POLICY IMPLEMENTERS
A single case study that examines how Turnaround policy implementation is influenced by policy sense-making
Dissertation in Practice
by
JAMIE B. CHISUM
with Anna Carollo Cross, Jill S. Geiser, and Charles A. Grandson IV
submitted in partial fulfillment
of the requirements for the degree of Doctor of Education
May 2014

© Copyright by Jamie B. Chisum, Anna Carollo Cross, Jill S. Geiser, and Charles A. Grandson IV
© Copyright, Chapter 4: Jamie B. Chisum, 2014

i
TURNING AROUND SCHOOLS: A VIEW FROM THE TEACHERS
A single case study that examines how Turnaround policy implementation is
influenced by policy sense-making
By Jamie B. Chisum
Dr. Rebecca Lowenhaubt, Dissertation Chair
Abstract
This single case study examines how stakeholders of a local education agency
(LEA) understand and implement state turnaround policy for its chronically
underperforming schools. While there is ample research on how to improve chronically
underperforming schools, that research becomes limited when looking at turnaround
implementation actions that are in response to policy mandates. This qualitative study
uses the theory frame of policy sense-making to identify how implementers come to
understand turnaround policy and to explore how that sense-making impacts their
implementation decisions.
The study findings were that teachers recognized three main stages of turnaround.
In the first stage building principals used directive leadership to build a unified vision.
Implementers reported that this unified vision was partly brought about by the removal of
any teaching staff not in line with the principal’s turnaround plan. The second stage of
turnaround centered on building teacher capacity through internal and external
professional development. Internal professional development meant creating multiple
ii
meeting configurations where teachers could stay in touch with the turnaround process,
offer input, and continually learn from each other. External professional development
involved developing teacher skills to more effectively and more rapidly raise student
achievement. Findings from across four different implementer groups pointed to the
importance of building teachers’ ability to understand and use data to improve their
instruction as well as student learning. Time for both types of professional development
came largely from the introduction of extended learning time (ELT) that was paid for
through state and federal grant monies. In the third stage teachers worried about the
sustainability of turnaround once the resources from state and federal grants were
gone. Hope for sustainability was found most present within the bonds formed by
teachers who grew to rely on and trust one another during the arduous work of school
turnaround.

iii
TURNING AROUND SCHOOLS:
A VIEW FROM THE POLICY IMPLEMENTERS A single case study which examines how turnaround policy implementation is influenced by policy sense-making
EXECUTIVE SUMMARY
DISSERTATION IN PRACTICE
BOSTON COLLEGE
Jamie B. Chisum Anna Carollo Cross
Jill S. Geiser Charles A. Grandson IV
March 2014

iv
Research conducted and report produced in partial fulfillment of the requirements for the degree of Doctor of Education.
Dissertation Committee
Rebecca Lowenhaupt , Ph.D., Dissertation Chair Assistant Professor, Department of Educational Leadership and Higher Education, Lynch School of Education, Boston College
Patrick McQuillan, Ph.D. Associate Professor, Department of Teacher Education, Special Education and Curriculum and Instruction, Lynch School of Education, Boston College
Oscar Santos Ed.D. Head of School, Cathedral High School, Boston, Ma. Lauri Johnson, Ph.D. Associate Professor, Coordinator, Professional School Administrator Program (PSAP), Department of Educational Leadership and Higher Education
Acknowledgements
We would like to thank the teachers, school leaders, superintendent/central office personnel, and school board members who generously gave of their time to participate in interviews with members of the research team. Their perspectives and expertise were invaluable towards making this research possible.

v
CONTEXT OF THE STUDY
Improving chronically underperforming schools, has been identified
as one of the nation's top priorities. Reforming schools has required not
only a significant investment of federal, state and community tax dollars
but has also served as a lightning rod for issues of accountability and
equity for underserved students. The successful implementation of
education reform policies leading to “turning around” schools or the
entire Local Education Agency (LEA) can significantly influence student
lives.
Raising student achievement is the goal of education reform policy
implementation, but implementing school reform policy, is a complex and
multi-layered endeavor that involves multiple stakeholders. As the
consequences for failing to meet state driven accountability measures
increases, it is critical that LEA leaders and communities understand how
to navigate successfully from policy intent to policy implementation in the
local context. Data from this study can inform leaders as to where
potential gaps exist and how to develop strategies to accomplish the
stated goals.
This research examined how multiple stakeholder groups in a LEA
viewed their roles in the implementation of turnaround
policies. Additionally, the research examined what factors influenced
policy implementer understanding. The implementer groups studied
included; school board members, superintendent/central office
personnel, building leaders and teachers.
The LEA in this study is a semi-urban school system serving ten-
thousand students who represent an increasingly diverse population. The
community is challenged by high unemployment, poverty, limited local
financial resources to support education and a LEA that is precariously

vi
balanced between maintaining local control of its schools or risk takeover
by a state entity. During the time of this study, the LEA was engaged in an
aggressive campaign to turnaround its most recently designated
underperforming schools and was under state mandate to address the
growing student achievement gap. The LEA had successfully turned
around two of its schools in the last year and was about to embark on a
planning process to develop a strategy for turning around another
underperforming school.
LEA leadership had identified a few important strategies that it felt
were needed to turnaround a failing school based on previous
turnaround experiences. Many of those strategies had been
implemented after the school had been designated by the state as
underperforming. The superintendent/central office staff, teachers,
school leaders and school board members each had policy roles in
turning around schools in the LEA. Through interviews, document analysis,
and observations of meetings these interwoven studies examined how
each implementer group understood their role and whether their
understanding ultimately affected implementation of the policy itself.
The study focused the initial research on four key areas. It first
examined the current legislation and the process for designating
underperforming schools. Then the study examined research on the
characteristics of underperforming schools and effective turnaround
practices. Researchers reviewed the current literature on policy
implementation and identified sense-making as a theoretical lens and
finally, reviewed the literature for internal and external factors that might
affect policy sense-making. As the researchers assessed and analyzed
the study data, several ideas began to emerge. Factors such as role
definition, data, communication, resources, context, culture, trust, social

vii
and political capital all contribute to how implementers go about the
business of making sense of what they are being asked to do. The results
of this study are intended to offer guidance and recommendations to the
LEA and community leaders who are responsible for implementing
turnaround policies. This study is also intended to add to the theoretical
and practical research literature on how turnaround policies are
implemented in the local context and what factors influence local
implementers.
RESEARCH
SCHOOL EFFECTIVENESS, POLICY IMPLEMENTATION AND SENSE MAKING
In reviewing the literature, researchers explored the intersection
between chronically underperforming schools, turnaround policy intent,
policy implementation and the overarching factors that influence
implementers as they create meaning in turnaround situations.
The researchers began by looking at the literature that examines
how turnaround schools are defined by Kutash, Nico, Gorin, Rahn &
Tallant (2010) and then related it to the work of Murphy & Meyers (2008)
Duke, Tucker, Salmonowicz, Levy & Saunders, (2005), Corallo & McDonald
(2001), Gezi (1990) and Clubine, Knight, Schnieider & Smith (2001) on the
challenging conditions that contribute to chronically underperforming
schools such as poverty, stress, student mobility, low parent involvement
and poor home-school collaborations. The strengths or weaknesses of
leadership, teacher quality and teacher morale were also cited as factors
in chronically underperforming schools. To examine these concepts
further, researchers reviewed the work of Fullan (2006), Hargreaves (2004),
Leithwood (2010) Murphy & Meyers (2008) and McQuillan & Salomon-
Fernandez (2008).

viii
Turning around schools requires knowing not only what contributes
negatively to underperforming schools but also identifying the conditions
that contribute positively to creating an effective school environment. The
research of Mintrop (2004), and Bryk et.al, (2010) speaks to the
importance of shared vision, goals and shared values as one way in which
to improve schools.
The purpose of our research was to examine how specific state
legislation, which outlines policy requirements for school turnaround, is put
into practice by identified implementers. To understand the theoretical
framework behind policy implementation research we turned to a review
of the work of researchers who argue that successful policy
implementation of systemic reform is complex and may be influenced by
the politics of the policy adoption, how the policy problem is framed and
even the language and symbols used to communicate the intent of the
policy (Hess, 1999; Honig, 2006; Malen, 2006; McLaughlin, 2006; Hill, 2006,
Smylie & Evans, 2006). To provide a theoretical construct for
understanding how individual policy implementers understand and
interpret policies and their intended meaning, what the study will define
as “sense-making,” the researchers referred to the work of Weick (1995)
and Honig et. al, (2006).
METHODOLOGY
This research examined how turnaround work is implemented
according to the state turnaround legislation. Looking at the research
questions through a single case study design, the research team was able
to gain a deeper understanding of how each stakeholder group made
sense of the turnaround policy and how that sense-making influenced
their decisions and actions around policy implementation. The LEA
selected was one that had already been engaged in the process of

ix
implementing turnaround policy, with at least one level D school in the
LEA, and with participation in the turnaround work by the four
implementer groups that were the focus of this study, school board,
superintendent/central office, school leadership and teachers. In this LEA,
there are total of 16 schools (with one school closed in spring 2013). In
addition to the one high school, there are nine elementary schools, three
middle schools, one pre-K through grade 7 school, one therapeutic high
school, and one therapeutic middle school. The LEA is considered a Level
D district by the state, a designation that resulted from one or more
schools in the LEA failing to meet student achievement goals relative to
student performance on the state assessment system. Presently there are
four level A schools, one level B school, seven level C schools and one
level D school.
Once the LEA was selected, the research team utilized several data
collection tools in order to have multiple sources of data and use
triangulation in our analysis (Yin, 2009). These included observations,
document review, and interviews. Participants were selected purposefully
for interviews based on their participation in turnaround policy
implementation (Creswell, 2012). Teachers came from level D schools and
school leaders came from level C as well as level D schools. Participants
also included the superintendent, central office personnel and school
board members. This participant sampling allowed the research team to
gather data from each of the four implementer groups.
Once data was collected, the team coded and analyzed to look
for themes. Using Dedoose coding software, the team coded the
interviews, both collaboratively, for the purposes of calibration, and
individually (Hill, et. al, 1997). Codes were modified as part of the coding
process and as suggested by the data. From there, each of the research

x
team members identified the major themes for their implementer group.
That was followed by an analysis of the themes across the implementer
groups that led to recommendations for the district. Below summarizes
these themes and recommendations.
FINDINGS
SCHOOL LEADERS
The findings in this study show that there are influences on school
leaders’ sense-making and that this sense-making occurs primarily around
three areas, policy requirements, diagnosis, and effective practice. This
sense-making then leads school leaders to exercise specific strategies and
leadership moves when they take on the tasks of turning around a
chronically underperforming school.
Sense-making begins with the elements that influence school
leaders’ understanding of the turnaround policy and process. There were
three primary influences on sense-making, which led to implementation
decisions: 1) previous experience, which generated background
knowledge around school turnaround, 2) communication with other
stakeholders and implementers, and 3) consideration of school context all
factored into how school leaders understood the policy. Each one of
these influences impacted specific areas of sense-making.
Table 1: The Relationship Between Sense-making Influences and Areas
and Implementation Decisions
Influences on Sense-making
Areas of Sense-making
Implementation Decisions
Communication Policy Requirements [1. What does the policy say about staffing and resources?]
Organize Staff Utilize Resources

xi
Communication School Context
Diagnosis [2. What are the strengths and weaknesses of the school?]
Use Data to Diagnose
Communication Background Knowledge
Effective Practices [3. What practice will leverage strengths and address weaknesses?]
Focus on Instruction Communicate a Vision
Build Capacity
Working in tandem with each other, these three influences shaped
how school leaders thought about their current turnaround situation.
Context had a role in the diagnosis of the school. Previous experience
had a role in decisions about practices that would be effective in
targeting the needs of the school. Communication was the one influence
that impacted all areas of sense-making as school leaders were able to
hear input from other stakeholders and implementers. Table 1 shows the
relationship between the influences on sense-making, the areas of sense-
making and the implementation decisions. With each of the areas of
sense-making there were key questions that school leaders asked. This
table depicts the questions in a certain order. While there is not necessarily
a clean division between each of these questions in terms of their order,
generally, school leaders asked about the policy requirements early on in
the process. Questions about the school’s strengths and weaknesses then
quickly followed. Once diagnosis was underway, they then began to look
at the effective practices for turnaround implementation. These then led
to a range of implementation decisions and actions.
These implementation actions aligned with specific areas of sense-
making. From the questions about policy requirements came decisions
about how to organize staff and utilize resources. Staffing decisions
occurred relative to the staffing authority afforded by the regulations to
move staff in and out of the building. Yet, school leaders that did not
xii
have that authority, often looked to reorganizing positions or repositioning
staff members to put people in places that would maximize their strengths.
Similarly, decisions about how to use resources were made based on what
became available through level D designation. School leaders who
received additional funding, used it to implement programs such as ELT
and wraparound. However, schools that did not have additional funding
focused their school improvement on the practices that could be
implemented despite a dearth of resources. In this way, resources were
not only a question of what is available, but also about how best to use
what is there.
The process of diagnosing the school for its strengths and
weaknesses led school leaders to make data use a critical part of
turnaround. In fact, the prevalence of data in sense-making and
implementation of turnaround is notable. It was at the crux of school
diagnosis, it helped school leaders explain to their staffs the criteria of
designation as outlined in the policy, and it became a significant part of
implementation as school leaders put data at the forefront of teaching
and learning in their buildings. Data was a driving force in efforts to
improve schools in this LEA as it guided how implementers changed their
practice, and elements of sense-making and implementation stemmed
from how school leaders interpreted the data.
Finally, questions about what practices would effectively move the
school forward led to implementation decisions to focus on instruction,
communicate a vision, and build capacity. These actions stemmed from
two key areas: diagnosis of the school and background knowledge. The
diagnosis highlighted the areas on which to focus improvements and to
identify practices to target those areas. Background knowledge was
applicable particularly where school leaders had turnaround experience.

xiii
They often entered into new turnaround situations already with a body of
knowledge about effective practices from which to draw. In this LEA, the
school leaders saw that these three implementation actions, focusing on
instruction, communicating a vision and building capacity, would prove
to be effective in raising student achievement in their schools.
The influences of communication, background knowledge, and
context had key roles in how school leaders made sense of their
turnaround work. They shaped how school leaders viewed their schools,
how they understood what the turnaround work would entail, and how
they decided the steps needed to develop a school that is a place that
facilitates learning among its students. For school leaders approaching
turnaround work, they should leverage these influences to push their
thinking around diagnosing and identifying effective ways to raise school
performance.
TEACHERS
Findings in the teacher study not only fit nicely with the literature
written about turnaround work in general, but went further and drilled into
those general findings to provide much more specific recommendations
for practitioners.
The first finding from the literature had to do with the importance of
creating a shared vision at the school needing turnaround. Teachers are
the most important resource in turnaround (Murphy & Meyers, 2008) and
the most important thing a school leader needs to do with all the teachers
and other administrators in their building is to clearly articulate a shared

xiv
vision of how the turnaround will happen. Successful leaders in low-
performing schools drive the work at hand by communicating and
maintaining a highly focused vision and mission that is about student
learning (Clubine, et al., 2001; Duke, 2006; Gezi, 1990; Jacobson, Johnson,
Ylmaki, & Giles, 2005; Leithwood, Harris & Strauss, 2010; Murphy, 2010;
Murphy & Meyers, 2008; Picucci, Brownson, Kahlert, & Sobel, 2002; Potter,
Reynolds, & Chapman, 2002; Salmonowicz, 2009; Duke et al., 2005). The
finding of this particular study showed that for teachers it was very clear
that this vision had to come from the building principal, it needed to
come at the very beginning of the turnaround process and it very likely
needed to happen with the help of involuntarily transferring teachers who
were not on board with the vision out of the building.
The creation of a shared vision by changing the staff of a building
until all the teachers were on board with the principal was a very precise
description from the teachers of the first step in the turnaround process at
both the turned around school and the newly designated one. This first
step was necessarily described by teachers from both schools and
members of the central office as being directive in nature. They talked
with great passion and detail about the reassignment process as a part of
getting the staff in place that could and would do the work leaders saw
as necessary for turnaround. At the turned around school, teachers
described the principal of the beginning stage of turnaround as “her way
or the highway” and went on to say that if people didn’t do what that
principal said she would make their life a “living hell” until they either did
change or left. Another teacher described a second principal she had
worked for at another turnaround elementary school in the city as
someone who, “… got what she want(ed) by throwing keys in meetings,
slamming books against the wall, flipping over chairs.” Two of the three
turnaround principals referenced in this study were described as having

xv
this type of intimidating and strict control at the start of the process. There
was no distribution of leadership during this stage of the process.
A second stage of the turnaround process for the teachers of these
schools also fits with one of the second recommendations that came out
of the literature review that centered on the building of teacher capacity
through professional development. Richard Elmore’s famous “reciprocity
of accountability,” which asserts that teachers need to be provided with
additional capacity if schools expect them to perform different tasks or
familiar tasks at a higher level (Elmore, 2004). Teachers at both these
schools stressed the importance of their professional development. The
researcher defined this from their comments as internal professional
development they got from each other through all of their school, grade,
and department meetings as well as other informal conversations they
had with colleagues at lunch, during their prep periods, and even in out
of work settings. This was also defined as the external professional
development they got from outside presenters on topics ranging from
“guided discipline” to changing the tone of their school to data training
that helped them develop skills to improve their students’ learning based
on findings in their assessments. They specifically identified training on
how to use data to improve instruction as necessary to move their schools
forward and this matches with much of the literature as well (Clubine et
al., 2001; Corallo & McDonald, 2001; Duke et al., 2005; Stein,
2012). Teachers at these schools both identified extended learning time
as necessary to be able to engage in both kinds of professional growth. It
is in this second stage of turnaround as this study defined it that teachers
understand their practices have changed and in the turned around
school it is where they saw student growth through data on internal and
external assessments.

xvi
A second finding from the literature had to do with the importance
of teacher voice in the turnaround process. Creating a culture where
leadership can be shared makes the job doable for the principal, but also
makes the work more meaningful for the rest of the people being asked
to do it. “Sustainable leadership spreads. It sustains as well as depends
upon the leadership of others” (Hargreaves & Fink, 2006). The finding of
this study is that teachers in these schools did not recognize they had any
leadership role in the turnaround process until the principal was certain
the shared vision for the school had been clearly articulated. The
teachers in this study thought it necessary for teacher voice to come after
the right people were put into place, and the vision of the principal
specifically had been clearly articulated as the vision for turning around
the school.
The third stage of the turnaround continuum for these teachers is
rooted in a fear about the sustainability of their improvement. This was
true of both the turned around school who was currently in the third stage
and the newly designated school that was concerned about what would
happen if they ever made it to the stage where their data had
improved. Teachers described to me a fear that they could lose valuable
resources of time, money, and even motivation when the watchful eye of
the state and its’ grant funds disappeared as result of the school’s
improved designation. In the interview done with two teachers from the
turnaround school they described their fear this way:
But how are you going to sustain it? …We still have wellness but the grant was cut this year. Our professional development was already cut this year. We had separate math and science days in the summer and that was totally cut. Most teachers still participated but it wasn’t paid and they didn’t have the regular consultants that

xvii
we usually do come in. Look at the amount of PD we had this year versus last, all these years, beyond already taken away.
These were two of the most positive teachers we interviewed in terms of
being proud of what they and their school had been able to
accomplish. They spoke passionately about how well the teachers there
worked together and how advanced they felt when talking to teachers
from other places because they had had so much professional
development. Yet they still had this fear about how they were possibly
going to be able to sustain this same improvement they were so proud of.
Where the researcher found hope for sustainability in this study had
to do with the relational trust that was established at the turned around
schools. The creation of this culture of trust happened over time when
teachers worked together with the common goal of improving their
students’ achievement. Here teachers described how they sustained
each other when they were having bad days, how they could go into
each other’s classrooms looking for ideas or inspiration and even how
they became so close they went on vacations together and attended
each other’s weddings. The fear for turnaround schools is that the policy
will overtake the people when it comes to focusing on what is important
to do in this work. “If truth is the first casualty of war, then trust is the first
fatality of imposed reform” (Hargreaves & Fink, 2006, p. 212). The fact that
trust was not dead at the turned around school may be one of their
greatest successes and their hope for sustaining their improvement.
SCHOOL BOARD MEMBERS
The focus of this study was to examine the role of school boards in
turnaround policy implementation. School boards have an important part

xviii
to play in the implementation of education policy because of their role as
democratically elected representatives of the community’s voice in
determining the education of its children. Because of their legislative
authority and because they are agents of the community’s interests, the
school board can influence the ways in which policies are implemented
(Rice, Delagardelle, Buckton, Jons, Lueders & Vens, 2001; Hess, 2010)
In general, findings in this study indicate that school boards make
sense of their roles and responsibilities by responding to internal as well as
external factors and influences. First, findings indicated that the role of
school boards has become ambiguous and undefined as their historical
roles have evolved, state activism has increased and the requirements of
education reform legislation and the competing interests of turnaround
legislation have become intertwined. Second, when faced with trying to
make sense of their roles in turnaround, school board members reverted
to the role they most closely identified with and understood best, that of
approving budgets and allocating resources. School board sense-making
was also influenced by two factors; communication and the role of a
dissenting voice.
The first finding indicated that the school board’s turnaround role in
this LEA was undefined and sometimes misunderstood by board members
as well as other policy implementers. School board members were caught
between balancing their political roles as elected officials and agents of
state policy with their community roles as education advocates and
community members. The role of school boards described in turnaround
legislation is inconsistent with education reform legislation and contributes
to the lack of clarity. For instance, education reform legislation calls for
school boards to play an active role in approving policy and establishing
goals for the LEA but turnaround legislation limits the role of the school
board. In this LEA, an increase in state activism and the superintendent’s

xix
influence coupled with a decrease in school board authority contributed
to the lack of clarity for members trying to make sense of their roles and
responsibilities. Opportunities for formal training to help school board
members clarify and make sense of their specific role in a turnaround
district were limited. While members were aware of their four areas of
legislative responsibility they tended to focus primarily on two; selecting
and evaluating the superintendent and setting the budget, both areas
where they felt they had the most expertise and influence. District goal
setting and policy development and implementation were seen as the
work of the administration and building level leaders with the school
board as a supporting actor.
As a result of school board members viewing their role in turnaround
policy as one of budget and resources members focused on how to
acquire and allocate resources, and how to distribute them equitably.
They viewed long-term sustainability of turnaround as one of their primary
concerns particularly since the district was heavily dependent on outside
funding sources. Members viewed relationships, alliances and their
understanding of the political landscape as important levers in solving the
resource puzzle. In order to prioritize resources school board members
relied on the direction and guidance of the superintendent. While limited,
members benefited from opportunities to engage in direct contact with
front line implementers who could translate the resource needs to board
members. Board members used these opportunities to create shared
understanding of the resource needs and were then able to use the
information to advocate for additional resources from the community.
Board members viewed their resource role in three distinct ways; as
facilitators, as bridge builders and as navigators. As facilitators, they
brokered internal discussions to help them understand the resource needs,
as bridge builders they interpreted and translated the districts needs to
xx
the community and as navigators they negotiated their way through the
complex budget and finance environment of the city and state to access
needed resources for the district.
A number of influencing factors were identified that also
contributed to school board turnaround sense-making. Communication
with internal and external stakeholders was key. School board members
relied on communication from the superintendent as the central conduit
for distributing, interpreting, clarifying and making sense of turnaround
policies. The effectiveness of the superintendent’s use of data to
communicate turnaround information, an influencing factor found with
other implementer groups, was viewed as mixed by board members.
Members understood the importance of using data to guide their decision
making, however they often lacked the background knowledge, training
and expertise to use it successfully. Communication from external agents
such as the State Education Agency (SEA) was also identified as
influencing school board sense-making. Members viewed the intervention
of state monitors from diverse perspectives. While members understood
that the resources and support that came with state intervention were
invaluable to the district, they still viewed themselves as the experts of the
local context. As such, they viewed themselves as the community’s voice
when faced with mandates that conflicted with the values and beliefs of
the community.
In addition to communication as an influencing factor in turnaround
policy sense-making, the role of a dissenting voice also emerged as a
factor. Dissenting voice in this study was viewed as one way to make
sense of turnaround policies and requirements. “Sense-making through
arguing” as noted by Wieck is central to organizational sense-making. In
this study school board members functioned as a collective group and
made sense of the information before them as part of a social process.

xxi
Their own beliefs, actions and expectations provided the structure through
which sense-making occurred (Weick, 1995). The role of the dissenting
voice contributed to sense-making by providing the opportunity for
members to challenge each other and argue, what researchers have
cited as a natural part of the process of sense-making. By engaging in
sense-making through arguing board members clarified strategic ideas,
potentially leading to more effective group decision making (Kayes &
Kayes, 2012). Constructively engaging rather than suppressing dissenting
voices can be an important strategy for strengthening rather than
weakening sense-making. Turning around schools calls for creative and
new ways of thinking, suppressing dissent can limit the expression of
diverse beliefs, alternative views of the world, and ideas for improvement
that may be exactly what is needed to increase student achievement.
As elected officials, school board members answer only to the
electorate. They have an important role to play as representatives of the
democratic process. Because of this, they may be the only implementers
uniquely positioned to contribute to policy sense-making by engaging in
debate, dissent and arguing as strategies for clarifying policy intentions
and implementation.
SUPERINTENDENT/CENTRAL OFFICE
The superintendent and selected central office administrators within
the LEA are often the initial implementers of school and district turnaround
policy. This study seeks to understand the role of central office in
turnaround policy sense-making by collecting data on the superintendent
and central office administrator sense-making and its impact on policy
implementation. While recent research on school improvement has
focused on school improvement actions and responsibilities of principals
and teachers, this study seeks to address the research gap of the essential

xxii
role of school districts offices in school turnaround and improvement. In
seeking to understand how district leaders make sense of turnaround
policy implementation to support school turnaround, the findings revealed
the superintendent and central office administrators found strong
superintendent leadership, monitoring and support schools, strategic
distribution of resources, and management of human capital as key
implementer actions.
The first finding encompassed superintendent leadership and the it’s
essential role in moving forward turnaround work. Multiple interviewees
attributed student achievement gains and therefore successful policy
implementation to the superintendent’s ability to effectively
communicate with the community and build relationships with key
stakeholders. The superintendent also established for central office
administrators that their purpose is to support schools, and that they work
for schools, schools don’t work for them. Additionally, central office
administrators, teachers, and principals noted more of a central office
presence within their schools and an increased emphasis on teaching
and learning during professional development.
This case study also revealed that the LEA’s central office staff
provided a support, monitoring, and accountability framework for it’s
schools. The school review partner process is created to provide support
to the schools principal and teachers and to serve as a thought partner
for the school’s improvement processes. More frequent and better
aligned monitoring of student achievement data and of the effectiveness
of instructional initiatives. Additionally, accountability is provided for
principals and central office staff to ensure alignment of vision and follow
through with instructional initiatives. While these practices are not
perfectly and fully embedded within every facet of the district’s work,

xxiii
there are key shifts that have taken place alongside the LEA’s turnaround,
and it’s turnaround of two chronically underperforming schools.
The third major area of finding is in the realm of access to financial
and human resources to support school and system-wide turnaround. The
case study LEA has limited resources like most urban districts, and often-
times resources are key levers in school and system-wide turnaround.
While some implementers, teachers and principals, believed that resource
allocation varied across schools, central office implementers viewed
resource allocation as equitable. For human resources, the superintendent
provided building principals with latitude and control over the
management of human capital. The superintendent also provided
intentional leadership around making it clear to central office staff and
principals that they could either join the district’s turnaround philosophy or
be asked to leave the district.
Recommendations for school system leaders / practitioners include
next steps for various stakeholders within the turnaround process including,
school boards, superintendents, and central office administrators. School
boards of urban school districts with turnaround schools should consider
the leadership competencies of superintendent candidates look at some
of the leadership moves of the superintendent in this case study in
developing a profile of their leadership needs. Superintendents have a
complex and multi-faceted set of responsibilities and could reflect on their
own leadership competencies to ensure successful implementation of
turnaround policy. Superintendent’s also have responsibility for the sense-
making of central office administrators to ensure alignment with the
organizational vision. Finally, it’s recommended that central office
administrators touch schools in meaningful ways to ensure support,
monitoring, and accountability.

xxiv
The superintendent and select central office administrators within the LEA
are often the initial implementers of school and district turnaround policy.
RECOMMENDATIONS
Our study looked at sense-making of policy implementation from
the perspective of four different implementer groups in a single district’s
chronically underperforming schools. Examining the four implementer
groups, school board, superintendent/central office, school leadership,
and teachers, we wanted to understand the role sense-making played in
what the implementers actually did and what they thought was effective
to improve school performance. The research team looked at the findings
of each of the implementers groups and identified recommendations for
the LEA around communication, the importance of data, and the use of
resources to support turnaround.
RECOMMENDATION ONE: INCREASE COMMUNICATION BETWEEN IMPLEMENTERS
A common theme that emerged from the findings was that there is
a need for the turnaround policy to be communicated on a continual
basis up and down the implementer chain. With the understanding that
increased communication helps to facilitate sense-making, we looked at
how facilitating communication between all parties increased their
understanding of what they were being asked to do. We found structures
in place in the local education agency for this communication to
happen. Specifically, technical communication between and among the
implementers was already being done and implementers had a
functional understanding of what turnaround was and what the school
had to do in order to be successful. While this technical communication
was in place, we found that communication that centered implementer

xxv
sense-making more on their beliefs about their role and expectations
rather than merely on the technical requirements of the policy was
needed. With the aim to facilitate sense-making, the research team
identified three ways to strengthen communication, which focus on better
defining the communication that takes place within current
communication structures.
The first recommendation is about using the building principal
meetings with central office staff to develop a common language around
what it means to turn around underperforming schools. Because sense-
making around expectations and role was prevalent in the findings, these
meetings can include discussion about these two important elements of
sense-making. The common language and wisdom gleaned through
communication at these principal and central office meetings would also
be valuable for the principals of schools who are not yet designated as
level D schools. Explicit communication about what has led to turnaround
success in other schools would be invaluable for school leaders
throughout the district, especially those whose schools are level C. Central
Office staff can discuss with building leaders the different scenarios of
schools that resulted or did not result in successful school improvement.
The second recommendation around communication is to bring
community involvement into the implementation of turnaround through
an extension of the Local Stakeholders Group (LSG). Comprised primarily
of community members, school staff, and central office staff, the LSG
submits recommendations to the superintendent who uses those
recommendations to develop the turnaround plan for the local
education agency. The policy does not require further action by the LSG,
which means that community participation in the work of turning around
the school can be reduced. Here, there is opportunity to extend the role
of the LSG to the implementation phase of the turnaround plan, which

xxvi
would increase the engagement and responsibility of the community to
contribute to turnaround efforts. One way to do this is through consistent
meetings, possibly through the redesign team. Consistent meetings about
the progress of the school will help keep everyone informed and would
help to facilitate sense-making not only for the educators in the school
building and district, but also for the larger school community.
Another recommendation pertains to communication with the
school board. The findings reflect a need for the school board to have an
opportunity to have more clarification about their expectations and role
in turnaround. The school board has four areas of authority: budget,
policy, evaluation of the superintendent and collective bargaining. These
areas of authority are impacted by the turnaround legislation in that the
school board has been grappling with how to make sense of their role in
the context of the school district’s focus on implementing turnaround
policy. More explicit communication among the school board may help
their understanding of the significant questions they have about their role
and expectations in turnaround. Whether this is done through workshops
or other professional development opportunities, the school board may
benefit from these conversations that allow them to further their sense-
making about what it means to be a school board member of a
turnaround district.
A final recommendation about communication would be around
paying special attention to the role of collaboration in the turnaround
process at all levels. In our study one of our theoretical lenses was the role
of social capital in policy implementation. This theory posits that what
actually gets implemented depends on who the implementers know and
trust. Building trust by improving collaborative working relationships,
between and among all implementer levels, through transparent

xxvii
communication will help insure consistency of understanding in terms of
what is actually to be implemented in the turnaround process. In authentic
collaboration there is room for working with dissenting voices who may in
fact have much to offer in terms of improving the work of turnaround
along the way.
RECOMMENDATION TWO : SPECIFY A TRANSPARENT PROCESS FOR ALLOCATING RESOURCES
The findings indicated that implementers have questions about how
resources are allocated throughout the LEA. There is confusion about why
some schools get certain resources that other schools do not. This
recommendation to specify a transparent process for allocating resources
intends to alleviate some of this confusion.
As limited resources challenge the LEA, a process needs to define
the priorities that guide how resources are distributed to specific programs
and schools. By being explicit about these priorities for school
improvement, all implementer groups, including school board,
superintendent/ central office, principals, and teachers, would have a
better understanding of where the resources should go and why. For
example, the LEA can clarify their framework for resource allocation
based on school level, programming, and student needs. This framework
should include details of funding streams for academic programs,
extracurricular programs, additional pay for teachers, and other areas
essential to effective implementation of turnaround policy. Another
example is to make transparent how staffing is allocated. Staff allocation
includes teacher excising if they have not union protection and/or staff
“opt-out” which means teachers choosing to transfer to other schools in
the city after the new designation. Transparency may involve identifying
xxviii
how teacher “opt-out” of level D schools occurs with the aim to ensure
consistency of implementation of “opt-out” across schools.
This recommendation involves assessing the time provisioning of
central office administrator’s delivery of support and monitoring across
high priority (level D and C) schools. Currently, the perception among
some in the LEA is that level D schools receive more support and attention
from central office than other schools in the district. Clarifying this LEA’s
system to monitor school-level support from central office administrators
would ensure clear and equitable support. This would help to assuage the
concerns that level D schools receive the most attention and support.
This LEA makes decisions about how resources are allocated to
schools and programs across the district. The recommendation here is
about making these decisions more transparent. This would help to
alleviate confusion about resource allocation and the perception that
some schools in the LEA receive more support than others.
RECOMMENDATION THREE: DEVELOP THE CAPACITY OF ALL IMPLEMENTERS TO WORK WITH DATA.
An area that became prevalent in the findings across implementer
groups was the use of data. It is apparent that data is at the crux of
school improvement efforts as it became one of the most talked-about
areas of school improvement by teachers, school leaders, central office
personnel, and school board members. Indeed, the LEA has strengths
regarding the capacity of implementers to use data where building and
LEA leaders, along with numerous teachers, understand the importance
using data and prioritize its role in school improvement. Although data is a
significant part of school and LEA improvement planning, findings point to

xxix
inconsistencies with the level of comfort and ability different implementers
have with data analysis. The recommendation here is to increase
capacity so that there is more consistency in terms of how implementers
understand and use the data. Central office plays a key role in this
recommendation in that they would need to set the stage around how to
use data in school improvement planning.
One opportunity to build capacity for analyzing data among
teachers is to bring them together to share data analysis practices. While
teachers interact with other teachers in their own schools, and perhaps
informally with teachers in other schools, more formal structures could
allow this to occur more prevalently. Giving teachers opportunities to
collaborate across schools would increase their contact with other
teachers around best practices of data. This could open up new ideas
and ways of using data to inform their instruction.
Sharing of best practices can also occur among school leaders.
Currently, school leaders meet with central office personnel, along with
members of their faculty, to analyze data in their data review meetings. In
addition, there are meetings that occur with central office, including the
superintendent, and principals of all the schools in the LEA. As school
leaders work together to build their own skills around applying data
analysis to school improvement, there is opportunity here to look more at
how they can lead their staffs through the process. Findings suggest that
there is some inconsistency in how school leaders lead their staffs through
the process of analyzing data and using that analysis to improve practice.
School leaders might benefit from more in-depth conversations around
how to effectively lead faculty in conversations about the data.
Another opportunity for building better understanding of the data is
with the community of this LEA. This begins with working with school board
xxx
to promote their sense-making of the data. Findings suggest that school
board has little interaction with data and have fewer opportunities than
the educators in the schools to analyze the data. Focusing some meetings
and/or sessions with school board on looking at the data would help to
increase their understanding of and how it informs turnaround. These
conversations do not necessarily need to be overly cumbersome in detail.
Rather, they might give an overview of what the data is saying about the
LEA and why designations occur. This then would put school board
members in a position to discuss with their constituencies about the
turnaround work that is happening in the LEA. While school board
meetings are perhaps likely places for this communication, and indeed
discussions around data have occurred there, opportunities offered
outside the context of a school board meeting may be beneficial. This
may lead to a more informed community about what the data means in
terms of their schools’ performance.
RECOMMENDATION FOUR: COMMUNICATE A CLEAR VISION OF LEADERSHIP FOR THE LEA
Looking at the findings across the four implementer groups, it
became clear that the groups were looking at turnaround differently and
focusing on different aspects of the turnaround process. They were
expressing different priorities about what needed to be done to improve
the schools. There appeared to be a lack of interdependence among the
different implementer groups. That is, they tended to operate in silos,
distinct from each other, and often not in tune to what other
implementers were thinking or doing with the turnaround work.
There were several places where this lack of interdependence was
apparent. Central office directors spoke about the importance of their

xxxi
monitoring role and how they worked with school leaders to put practices
in place to improve school performance. Yet, school leaders did not talk
much about this and were more focused on how they were working with
their staffs. Teachers described a style of leadership in their schools at the
beginning phase of turnaround that was directive, whereas, when school
leaders described their approach, it resembled more of an instructional
leadership approach. The school board was knowledgeable about the
responsibilities given to them under education reform but they were less
clear on their role in turnaround. The other three implementer groups
rarely mentioned the school board, indicating that the school board
leadership role was not prevalent in their view. This lack of
interdependence may be attributed to the fact that a clear vision from
the LEA about what implementers should be thinking and doing to raise
school performance was absent. Rather, some implementers were relying
on the policy to set their vision for them. That is, upon designation, their
vision was about doing what was necessary to exit turnaround status
within a specific timeframe. Implementers did not speak about any kind of
long-range vision that the LEA established about leading turnaround. LEA
leaders did not describe whether they saw the LEA as a system whose
parts should be working together towards a common vision or how they
envisioned the system supporting learning at the building level.
For this LEA, a clear vision of leadership is needed to help guide and
sustain school improvement. When talking about turnaround leadership at
the school building level, Leithwood et al. (2010) emphasize the
importance of vision when they recommend turnaround leaders engage
their staffs in developing the vision of a school as a source of motivation to
commit to the work of school turnaround. In implementing this suggestion
at the LEA level, this LEA would bring implementer groups more into
alignment with each other and with the LEA in terms of how they

xxxii
implement turnaround. Fullan (2006) who also focuses on turnaround
leadership at the building level, discusses the need to implement systemic
reform by using a “trilevel development solution” that includes alignment
between the state, LEA, and school. Establishing this alignment requires
conversation, face to face interactions and the co-construction of
meaning that are integral to the sense-making described by researchers
(Weick, 1995; Datnow, 2006). In this LEA, the relationships between the
district, community and the school is critical where all three work need to
work in concert with each other. A vision of leadership would strengthen
those relationships and help to create the interdependence needed for
implementers of turnaround policy to be working in the same direction.
Strengthening the interdependence between implementer groups can
also be reinforced by making sure that all voices are represented,
including dissenting voices. This common vision would not be about
merely exiting or avoiding turnaround status. Rather, it would be about the
kinds of educational experiences that leadership would create for
students that transcend what the turnaround policy mandates.
CONCLUSION
This research generated insights into what educators in this LEA think
and do as they implement turnaround policy. Emerging from these insights
are recommendations that are intended to enhance the turnaround work
that is already happening across schools in this LEA. Because sense-
making relies so heavily on communication, increasing communication is
suggested here as a way to facilitate understanding of turnaround policy.
Yet, this understanding goes beyond knowing the policy requirements.
Communication can help educators in the district better understand their
role and expectations, which are not necessarily outlined in the policy. This
is the process of co-construction as implementers' communication with

xxxiii
each other helps them to make meaning. Also recommended is to
specify a transparent process for allocating resources. This LEA makes
decisions about how resources are distributed across schools and
programs. Yet, the findings in this research suggest that there is some
confusion as to how those decisions are made. Clarifying these decisions
would help to alleviate confusion and increase trust in the process, which
can then help to guide implementers' decisions around turnaround
implementation. The third recommendation about data use comes from
a major theme across the studies about the prevalence of data in school
improvement planning and implementation. This LEA already uses data,
but there are some inconsistencies in the capacity of implementers to
analyze and use data. School leaders, central office personnel, and
teachers, would benefit from collaborative opportunities for work with
data. School board members may need more experience with data in
order to communicate with their constituencies about what the data says
about the schools in the LEA. Providing more opportunities for
implementers to work with data would not only help with school
improvement efforts, but it would also help the community of this LEA to
better understand the data that informs turnaround work of their schools.
These recommendations aim to outline how this LEA can increase its
capacity to exercise successful turnaround of its chronically
underperforming schools. Increased communication can lead to more
sense-making, which can help to guide turnaround implementation
decisions. More transparency about the way resources are distributed can
offer guidance to implementers throughout the LEA about how to
approach turnaround work. Increasing capacity to analyze and use data
would inform decisions that successfully leads to school improvement. As
with most advice about school improvement, this is not offered as a
universal remedy to this LEA's turnaround challenges. Rather, it is intended

xxxiv
to enhance the thinking that goes into school improvement planning and
implementation. That is, these suggestions can help implementers make
sound decisions about what they should do when taking on the immense
task of turning around a chronically under performing school.

xxxv
REFERENCES
Bryk, A.S., & Schneider, B. (2002). Trust in schools: A core resource for improvement. New York, NY: Russell Sage Foundation Clubine, B., Knight, D., Schneider, C., & Smith, P. (2001). Opening doors: Promising lessons from five Texas high schools. Washington, D.C.: Government Printing Office. Retrieved from http://www.gpoaccess.gov/eric/200211/ed465000.pdf. Corallo, C., & McDonald, D. (2001). What works with low-performing
schools: A review of research literature on low-performing schools. (Report No. EA031549). Charleston, WV: AEL, Inc.
Creswell, J. W. (2012). Education research: Planning, conducting, and evaluating quantitative and qualitative research. Boston, MA: Pearson Education. Datnow, A. (2006) Connections in the policy chain: The
“co-construction” of implementation in comprehensive school reform, In M.I. Honig (Ed.), New directions in education policy implementation, confronting complexity (pp.105-123). Albany, NY: State University of New York Press.
Duke, D. (2006). Keys to sustaining successful school turnarounds. ERS Spectrum, 24(4), 21-35. Duke, D. L., Tucker, P., Belcher, M., Crews, D., Harrison-Coleman, J., &
Higgins, J. (2005). Lift-off: Launching the school turnaround process in 10 Virginia schools. Charlottesville, Vv.: University of Virginia, Partnership for Leaders in Education. Retrieved from www.darden.virginia.edu/uploadedFiles/Centers_of_Excellence/PL/VST/ S-Final.pdf. Duke, D. L., Tucker, P. D., Salmonowicz, M. J., Levy, M., & Saunders, S. (2008).Teachers' guide to school turnarounds. Lanham, MD:
Rowman and Littlefield Education. Elmore, R. F. (2004). School reform from the inside out: Policy, practice,
and performance. Cambridge, MA: Harvard Education Press. Fullan, M. (2006). Turnaround leadership. San Francisco, CA: Jossey-Bass. Gezi, K. (1990). The role of leadership in inner-city schools. Educational ResearchQuarterly, 12(4), 4-11. Hargreaves, A. (2004). Distinction and disgust: The emotional politics of
school failure. International Journal of Leadership in Education, 7(1), 27-41. doi:10.1080/1360312032000154531
Hargreaves, A., & Fink, D. (2006). Sustainable leadership. San Francisco, CA:Jossey-Bass.
Hess, F.M. (2010). Weighing the case for school boards today

xxxvi
and tomorrow: School boards are a flawed form of governance but still serviceable. The more pressing task is to rethink the school district itself. Phi Delta Kappan, 91(6), 15 - 19.
Hess, F.M. (1999). Spinning wheels: The politics of urban school reform. Washington, DC: The Brookings Institution.
Hill, C., Thompson, B., & Williams, E. (1997). A guide to conducting consensual qualitative research. The Counseling Psychologist, 25(4),517-572.
Hill, H.C., (2006). Language matters: How characteristics of language complicate policy implementation. In M.I. Honig (Ed.),
New directions in education policy implementation: Confronting complexity (pp.65-81). Albany, NY: State University of New York Press.
Honig, M.I. (2006) Complexity and policy implementation: Challenges and opportunities for the field. In M.I. Honig (Ed.), New directions in education policy implementation: Confronting complexity (pp.1- 23). Albany, NY: State University of New York Press.
Jacobson, S., Johnson, L., Ylimaki, R., & Giles, C. (2005). Successful leadership in challenging US schools: Enabling principles, enabling schools. Journal of Educational Administration, 43(6), 607-618. doi:10.1108/09578230510625700 Kayes, A., & Kayes, D. C. (2012). The ethics of dissent: The case of David Kelly. World Academy of Science, Engineering and Technology, 66, 6- 24. Retrieved from http://waset.org/publications/1465 Kutash, J., Nico, E., Gorin, E., Rahn, S., & Tallant, K. (2010). The school turnaround field guide. Retrieved from http://www.fsg.org/FSGNews/NewsEventsDetails/ArticleId/20/The- School-Turnaround-Field-Guide.aspx Leithwood, K., Harris, A., & Strauss, T. (2010). Leading school turnaround: How successful leaders transform low-performing schools. San Francisco,California: Jossey-Bass. Malen , B. (2006). Revisiting policy implementation as a political phenomenon: The case for reconstitution policies. In
M.I. Honig (Ed.), New directions in education policy implementation: Confronting complexity (pp.83-104) Albany, NY: State University of New York Press. doi:10.1080/15700763.2010.493633
McLaughlin, M.W. (2006). Implementation Research in Education: Lessons learned, lingering questions and new opportunities.
In M.I. Honig (Ed.), New directions in education policy implementation: Confronting complexity (pp.209-227)
Albany, NY: State University of New York Press. McQuillan, P., & Salomon-Fernandez, Y. (2008). The impact of state
intervention on “under performing” schools in Massachusetts:

xxxvii
Implications for policy and practice. Education Policy Analysis and Archives, 16(18), 1-43
Mintrop, H. (2004). Schools on probation: How accountability works (and doesn't work). New York, NY: Teachers College Press.
Murphy, J. (2010). Turning around failing organizations: Insights for educational leaders. Journal of Educational Change, 11(2), 157-176. doi: 10.1007/s10833-008-9101y
Murphy, J., & Meyers, C. (2008). Turning around failing schools: Leadership lessons from the organizational sciences. Thousand Oaks, CA: Corwin Press. Picucci, A., Brownson, A., Kahlert, R., & Sobel, A. (2002).
Driven to succeed: High-performing, high-poverty, turnaround middle schools. Austin, Texas: Charles A. Dana Center, University of Texas at Austin. Retrieved from: http://www.ia- sb.org/assets/FADFDF72-BE9D-48D7-8CF9-19B823F0CDA1.pdf
Potter, D., Reynolds, D., & Chapman, C. (2002). School improvement for schools facing challenging circumstances: A review of research and practice. School Leadership & Management, 22(3), 243-256. doi:10.1080/1363243022000020381 Rice,R., Delagardelle, M., Buckton, M., Jons, C., Lueders,W., Vens,
M.J.,(2001) The Lighthouse Inquiry: School Board/Superintendent Team Behaviors in School Districts with Extreme Differences in Student Achievement, Iowa Association of School Boards, Retrieved from http://www.ia-sb.org/assets/FADFDF72-BE9D-48D7-8CF9-19B823F0CDA1.pdf
Salmonowicz, M. (2009). Meeting the challenge of school turnaround: Lessons from the intersection of research and practice. Phi Delta Kappan, 91(3),19-24. Smylie, M.A., & Evans, A.E. (2006). Social capital and the problem of
implementation.In M.I. Honig (Ed.), New directions in education policy implementation: Confronting complexity (pp.187-208). Albany, NY: State University of New York Press.
Stein, L. (2012). The art of saving a failing school. Phi Delta Kappan, 93(5), 51 - 55.
Weick, K. E. (1995) Sense-making in organizations. Thousand Oaks,CA; Sage.

xxxviii
Dedication
Throughout the process of writing this dissertation whenever anyone asked me how I was
doing all this, my stock answer was, “It helps that my wife is a saint.” I was not joking. I
dedicate this dissertation to my saintly wife Kristin and my three children Grete, Luke,
and Hadley. It was their constant love and support that got me through many a difficult
moment during the past years. I also dedicate this to my father Nurman Wayne Chisum
who we lost a year before I was able to finish this work. It was his lifelong approach to
his fellow human beings that I carried with me as I connected with my interviewees and
talked about difficult topics at difficult times. Finally, I dedicate this my mother
Elizabeth Chisum, who raised me Irish so I could endure the rigors of life and this task.
xxxix
Acknowledgements
I want to thank my dissertation chair Dr. Rebecca Lowenhaubt for her wisdom,
her time, and her encouragement. If I had not had known this was your first time
chairing a dissertation committee I never would have guessed it. Further, I want to thank
the other members of our committee Dr. Patrick McQuillan and Dr. Oscar Santos. You
all challenged us think and rethink our findings. You questioned our assumptions and
pushed us to new levels of scholarship we could not have ever reached on our own. A
large thanks also goes to Dr. Lauri Johnson who kept us all on track and offered help to
us that was above and beyond her scope of responsibility. Thank you for being there.
Of course I cannot thank the members of the research team enough. It was a
special opportunity for me to work with you all and learn from your experience and
talented leadership abilities. Anna, Jill, and Charles, you each taught me different and
important lessons about leadership that I will never forget. From Jill I learned new
levels of unwavering dedication to the task and to the cause. From Charles I gained a
new understanding of what it is to hang on and keep working when things get most
difficult. From Anna, I gained a deeper appreciation for a commitment to humanity in
the work we do. As challenging a process as this was, I would not have wanted to write
a dissertation any other way. I look forward to staying in touch and seeing the great work
you all will accomplish next.

xl
Table of Contents
CHAPTER ONE 1 Chapter Two 6 Review of the Literature 6
Federal and State Regulations and Policies .................................................................... 6 Understanding Turnaround Schools ............................................................................. 10 Review of Research on Improving Chronically Underperforming Schools ................. 12 How the Literature Relates to This Study ..................................................................... 19
Theoretical Basis for the Study 21 Policy Implementation .................................................................................................. 21 Policy Sense-making ..................................................................................................... 23 Theoretical Frame Synthesis ......................................................................................... 31
Research Gap 33 Chapter 3 35 Methodology 35
The Community Context ............................................................................................... 35 The LEA Context .......................................................................................................... 36 Research Design ............................................................................................................ 41 Case Study Design ........................................................................................................ 41 Sampling ....................................................................................................................... 43 Data Collection ............................................................................................................. 45 Data Analysis ................................................................................................................ 49 Limitations .................................................................................................................... 52
Chapter 4 56 Teachers 56 Author: Jamie Chisum ................................................................................................... 56 Problem Statement ....................................................................................................... 57 Research Questions: 58 The Role of the Teacher in Successful School Turnaround 58
xli
Theoretical frame 70 Sample 72 Data Sources 73 Validity of Findings 74 Limitations 75
Findings ......................................................................................................................... 76
Finding One: The Initial Stage of Turnaround: Directive Leadership to gain a “Shared Vision” 76 Finding Two: Stage Two focused on Professional Development 82 Internal Professional Development 83 Professional Development at the Newly Designated School 87 ELT Pros and Cons at the Turned Around School 89 More Challenges of ELT 91 More Positives of ELT 93 The Importance of PD Around Data Use 95 PD Around Data to Improve Instruction 95 What Teachers Actually Do with the Data 100 Finding Three: Stage Three Equals Worries over Sustainability 103 Resources 103 Attention from the District 105 The Shuffling of Resources 109 A Skeptical View of How Turnaround was Achieved 110 Hope for Sustainability 114
Discussion .................................................................................................................... 116 Research Questions 117 Theoretical frame 117 Synthesis of findings 120 Strengths of Findings 123 Limitations of Findings 124 Recommendations Moving Forward 125
Chapter 5 128 Discussion 128 Recommendations 129

xlii
Recommendation One: Communication Between Implementers ............................... 129 Recommendation Two: Specify a transparent process for allocating resources ......... 137 Recommendation Three: Increase the capacity of implementers to work with data .. 139
Conclusion 146 References 148 Appendix A: Definition of Terms 165 Appendix B: Code Lists 168 Appendix C: Consent to Participate in Interview 171 Appendix D: Semi-Structured Interview Questions 173 Appendix E: Interview Guide 175 Appendix F: Interview Script 176 Appendix G: Observation Protocol 177

1
CHAPTER ONE
INTRODUCTION1
In writing the introduction to the recently released Equity and Excellence Commission
Report, For Each and Every Child, co-chairs Christopher Edley Jr. and Mariano-Florentino
Cuéllar state the case for why improving and turning around our nation's chronically
underperforming schools is critical.
The situation is dire, the agenda urgent. From parent associations to Capitol Hill, from
classroom teachers to the White House—there is work to be done and passion to be spent
by all of us who appreciate the stakes for our children and for the nation’s future. If we
fail in this work, we will forfeit our position of economic and moral leadership. We will
risk the future of our people and of America as we know it (Equity and Excellence
Commission Report, 2013, p.9).
According to the 2012 Children's Defense Fund (CDF) Report on the State of America's
Children, 43% of the children living in poverty live in urban settings where the concentration of
chronically underperforming schools is the highest. Only 68% of the students who enter 9th
grade graduate with a high school diploma. African American and Hispanic males have the most
dismal graduation rates of all, just 43% for Black males and 48% for Hispanic males (Orfield,
Losen, Wald, Swanson, 2001). Education reform is one of the levers, which can be used to
ensure that every school is equipped to provide a high quality education to every student. We 1 This chapter was jointly written by the authors listed and reflects the team approach of this project: Jamie B. Chisum, Anna Carollo Cross , Jill S. Geiser, Charles Grandson IV

2
contend that the development and implementation of effective education policy that aligns with
education reform goals is one way to increase achievement for all students.
Reforming chronically under-performing schools has been identified as one of the
nation's top priorities. In a May 2009 policy speech, Arne Duncan, U.S. Secretary of Education,
articulated his “turnaround” policy initiative and his intent to aggressively move to improve 5000
under-performing schools over five years. In School Year (SY) 2010-2011, the federal
government allocated 14.3 billion dollars via state grants and allocations dedicated to school
improvement. Reforming schools has required not only a significant investment of tax dollars but
has also served as a lightning rod for issues of accountability and equity for all underserved
students. The successful implementation of education reform policies can significantly impact
student lives. Yet implementing education reform policy is neither a simple nor linear process.
Some researchers argue that school reform policy has failed to produce any significant
change despite the fact that a tremendous number of reform efforts have been attempted (Fullan,
1991; Hess, 1999; Murphy, 2010). Others argue that successful implementation of systemic
reform may be affected by the complexity of the policy implementation, the politics of the policy
adoption, how the policy problem is framed and even the language and symbols used to
communicate the intent of the policy (Hess, 1999; Honig, 2006; Malen, 2006; McLaughlin,
2006; Hill, 2006 ). The importance of policy and its implementation is the common thread that
links researchers and ultimately practitioners in the field who are held accountable for decreasing
gaps in student achievement. Understanding and interpreting policies and their intended
meaning, what we will define as “sense-making,” can influence the success or failure of reform
initiatives (Honig, 2006; Weick, 1995).
3
In this state under study, the urgency of understanding how to make sense of and
effectively implement reform policies has immediate and real time implications for educators,
communities and students. In 2009 the United States Congress passed the American Recovery
and Reinvestment Act which re-authorized funding for the School Improvement Grants (SIG)
program, outlining specific requirements for chronically underperforming schools. In January
2010, aligning state law to federal regulations, this state passed legislation that outlines the steps
and timeline required to raise the performance of chronically under-performing schools, within a
3-year period. These chronically underperforming schools are now known as “turnaround
schools.” The overall goal of this policy is to raise the level of school effectiveness so that all
students in the school become well prepared for the next level of education. With a three-year
window in which schools must show significant progress in student achievement or risk further
corrective action, multiple implementer groups including administrators, community members,
teachers and parents each have a significant role to play in developing and implementing plans to
increase student achievement.
Educators are called upon regularly to implement federal and locally-designed policies
and are then held accountable for demonstrating that the implementation of the policy has
yielded positive results. Our assumption is that the implementation of any policy should be
aligned with its goals as much as possible and that implementation acts as a bridge between
realizing the original intent of the policy and the policy itself. We acknowledge that the
implementation of any policy, particularly school reform policy, is a complex and multi-layered
endeavor. Therefore, it is critical to understand how reform policy is being implemented and
whether there are forces that influence the implementation and realization of the original goals.
In the case of turnaround policy, where implementers’ actions are expected to lead to improved

4
outcomes for students in order to meet the intent of the policy, how they understand what they
are being asked to do can make all the difference. With this, we turn to the concept of sense-
making.
Sense-making considers how implementers interpret such policy to better understand
what leads to implementation decisions. For example, if implementers do not deeply understand
or make sense of the policies that are intended to guide the turnaround process, they may
misinterpret the policy goals or they might not understand how it relates to their day-to-day
work. They may dismiss it entirely because it does not have an obvious practical application, or
worse, they may implement it ineffectively. The chances, therefore, of successful
implementation are greatly reduced. If those policies are intended to increase student
achievement and the policy is sabotaged, ignored, or misinterpreted, student access to an
equitable and high quality education may be compromised.
While this research focuses specifically on turnaround policy, it may have broader
implications about the role of sense-making in the process of turning around a school or an entire
local education agency. This research may unearth insights about how implementer sense-
making about policy can lead to school improvement. It may also identify areas of tension or
confusion for implementers as they begin to make sense of the policies, and those outside factors
that influence their understanding and the importance of who and how policy is communicated.
It may also be possible to determine the amount of time and resources each implementer group
takes to gain a full understanding of the policy. Sense-making could influence each
implementer's view of their own ability to engage in the turnaround process and may shape the
decisions they make when faced with the task of turning around a school. It may also affect how
the policy translates into the turnaround plan, which outlines specific steps to inform the work of

5
turning around a school. This study examined the impact of sense-making on policy
implementation by focusing on the following research questions:
1. How do various implementers’ (superintendent/central office, building leaders,
teachers, school board members) make sense of turnaround policy?
2. How does this sense-making influence policy implementation?
3. What factors influence sense-making?
In this single case study, we explored how different implementers in a designated Level
D district make sense of turnaround policy. We begin by presenting an overview of the current
legislation and the process by which schools are designated underperforming. The research
literature on the characteristics of chronically underperforming schools and effective practices
for turnaround school improvement is discussed (Fullan, 2006; Leithwood, 1994), and we review
the current literature on policy implementation and why we chose to view policy implementation
through a theoretical frame that builds upon sense-making as a research construct (Weick, 1995).
A number of internal and external factors that have been identified through the literature and
how they might affect policy sense-making are outlined (Honig, 2006; Malen, 2006; Datnow,
2006). Finally, we present a graphic synthesis of the theoretical frame, which formed the basis
for our study followed by a description of the research design and methodology. Four individual
studies were conducted that each focused on the unique aspects of the sense-making process in
targeted implementer groups: school board members, superintendent/central office, building
leaders, and teachers.

6
Chapter Two
Review of the Literature2
Federal and State Regulations and Policies
Federal policy setting the stage. Recent federal and state regulations outline detailed
requirements about what schools need to do to raise their level of performance. In January of
2002, the U.S. Congress approved “An Act to close the achievement gap with accountability,
flexibility, and choice, so that no child is left behind,” colloquially referred to as No Child Left
Behind (NCLB). The elongated legislative title makes clear that the goal of the federal policy is
to close the achievement gap. The law requires a number of actions from state education
agencies (SEAs) and school districts, including hiring highly qualified educators, notifying
parents on the quality of their child’s education, and requiring states to adopt challenging
academic standards for all students. Perhaps the most important part of the legislation is the
requirement that all schools and districts make Adequate Yearly Progress (AYP), which is the
minimum threshold for improvement schools are required to meet each year. A school that does
not achieve AYP for two consecutive years faces the threat of corrective action. The advent of
NCLB brought attention to measures of school effectiveness and requirements placed upon
schools to perform incrementally or face consequences (Ravitch, 2010).
Analysis of state turnaround policy. With federal policy as a backdrop, legislation
enacted in early 2010 was this state’s interpretation of the NCLB goal to narrow the achievement
gap. The 2010 law addressed chronically underperforming schools by requiring the state
education agency (SEA) to designate or level schools within the framework for district 2 This chapter was jointly written by the authors listed and reflects the team approach of this project: Jamie B. Chisum, Anna Carollo Cross, Jill S. Geiser, Charles Grandson IV

7
accountability and assistance according to student academic performance.[1] Designation of level
includes a range of factors, such as exclusion and drop-out rate, but it is based primarily on
student performance on the state assessment. Designation comes out of a compilation of data,
including the aggregate performance of the school along with the performance of subgroups
identified by race and ethnicity (e.g. African American, Hispanic, etc.), learning profile (e.g.
students with disabilities, English language learners, etc.) and income levels (e.g. low-income).
This is notable because, similar to NCLB, disaggregating the data forces schools to consider the
performance of all its students by highlighting how each subgroup is doing academically. Once
the data is compiled, the state designates schools level C and D based on where they fall relative
to the other schools in their grade level span. The lowest 20 percent of schools in a grade level
span are classified as level C. A subset of those schools, not more than 4 percent, is deemed
eligible for level D status. These are chronically underperforming schools, informally referred to
as “turnaround schools.” It is this level D designation that triggers the turnaround process that is
outlined in the policy. The turnaround requirements also apply to schools designated level F, and
a key element of turnaround for these schools is state takeover. This leveling system is used to
determine where state assistance and intervention is most needed.
The process that school districts must undergo upon level D designation, as outlined in
the turnaround legislation, includes a series of steps to develop a turnaround plan. This process
begins with a local stakeholder group, comprised of members in and outside the school, which
convenes to develop recommendations for a turnaround plan that is submitted to the
superintendent. This part of the policy indicates that the state considers that the community has a
role in the turnaround process. However, the policy does not require that stakeholder groups
participate in the turnaround process beyond the initial phase of making recommendations. Once

8
recommendations are submitted, the superintendent is responsible for the actual development of
the turnaround plan and its implementation. The policy appears to emphasize the role of
educators in the work of implementing the turnaround plan and does not require community
involvement in the implementation stage.
In addition to outlining the process, the legislation dictates specific areas that need to be
addressed in the plan. These include achievement gaps, alternative English language learner
programs, financial planning, social service and health needs, child welfare services and law
enforcement, and workforce development services. The plan must also include measurable
annual goals using a range of data points such as the state assessment system (SAS), student
promotion, graduation, student attendance, student discipline, and family engagement. These
requirements reflect a view that there are a range of factors that impact student learning beyond
what happens in the classroom. The policy requires the school to pay attention to other areas of
social and emotional health as well as the relationship between the school and students’ families.
Schools are also compelled to look at different data points to gain a holistic view of student
performance, which is not only about performance on state assessments.
Finally, there are optional components of the plan. These include, but are not limited to,
reallocation of the budget, expanded school day or year, alteration of the curriculum, job-
embedded professional development, and limiting or changing school district policy. There are
other optional elements that may be subject to collective bargaining, one example of which is
requiring all staff to reapply for employment. These elements allow for some flexibility with
school structures that are often thought of as inflexible. For example, little flexibility is typically
seen with budget and scheduling. These tend to be fixed processes and structures. Yet, this policy
acknowledges that chronically underperforming schools may need to have the leeway to adjust

9
school time and budgets in order to reach turnaround goals. Similarly, the policy opens the door
for districts to engage in collective bargaining on areas that are viewed as critical to turnaround
success, but that need to be agreed upon with the local teachers union.
State legislation outlines the turnaround process that underperforming schools must
undergo with the aim to demonstrate higher student achievement within a 3-year period through
the implementation of a turnaround plan. This is aligned with federal funding regulation that
imposes requirements on school districts in order to qualify for School Improvement Grants
(SIG) and Race to the Top (RTTT) funding. According to that regulation, schools and districts
need to turn around within 2 to 3 years, as measured by student achievement data. A key
requirement is that schools identified, as “turnaround” must implement one of the turnaround
models if they want to be considered for a school improvement grant. These models are labeled
turnaround, restart, school closure, and transformation (Race to the Top Fund, 2009, p. 59763).
When the turnaround plan is developed and the school improvement grants application is
submitted, a turnaround model is chosen. The policy or grant requirements do not state who is
responsible for choosing the model. However, since the superintendent is responsible for the
development of the plan, as noted earlier, it would stand to reason that the superintendent would
likely be a primary voice in the selection of the model. What is notable about these models is that
they all require shifts in staffing, whether that is removal of school leadership and/or part of the
teaching staff. While these models are not mandated interventions of the legislation, they are
prioritized through the school improvement grant requirements in that they are tied to funding
and are not a requirement of the turnaround policy itself. Although this study is not necessarily
looking at the role of the model, we acknowledge that implementers’ perception of the policy

10
and corresponding turnaround work may be influenced by the requirements of the selected
model.
The turnaround policy in the state we studied contains a range of elements that are
intended to facilitate successful turnaround of level D and F designated schools. Although the
policy does not explicitly articulate the practices educators need to exercise to raise academic
performance of their students, its elements suggest that the policy operates on certain
assumptions about what conditions would help to support turnaround efforts. Whether that is
flexibility in structures, attention to a range of factors in learning, or community involvement,
the policy reflects a view that turnaround schools can improve when these elements are
addressed. Furthermore, although the policy does not contain language around specific
turnaround models to use, the state prioritizes the use of the models by attaching it to the funding
that is available to support turnaround efforts. This is important because the turnaround models
involve shifts of staffing that could impact how the educators in and around the school view the
turnaround work.
Understanding Turnaround Schools
The turnaround policy has a specific view of a turnaround school a chronically
underperforming school as measured by student achievement performance data. Yet, those data
points do not reflect the challenging conditions that surround chronically underperforming
schools. In order to fully understand turnaround schools, we look beyond the leveling of schools
that emerges from low performance on state assessments to the conditions of those schools and
their communities. Chronically underperforming schools share many of the same challenging
conditions regardless of whether or not they are labeled a “turnaround school” via the policy.
Therefore, we look to the broad range of literature which examines conditions in schools that are

11
considered underperforming, challenging, and/or high-need in order to fully grasp the nature of
the work that is involved in turning them around.
One condition that appears to be common in chronically underperforming schools is
poverty. The literature reveals that the low socioeconomic status of the school’s population is
often identified as a condition of a low-performing school (Duke, Tucker, Belcher, Crews,
Harrison-Coleman & Higgins, 2005; Murphy & Meyers, 2008). High levels of poverty often
increase the level of stress on a school resulting in a need to provide more services for students
(Corallo & McDonald, 2001). In an opinion article in the New York Times, Reardon (2013)
emphasizes the central role of social and economic status in the success of students in school. He
notes in particular that while small gains have been made in closing the achievement gap
between racial groups, there continues to be a gap between students of different socioeconomic
status, with students living in poverty persistently performing well behind those of their more
affluent peers. This means that schools serving high poverty communities often face the
challenge of raising the academic performance of their low-income students.
Although the home environment of children living in poverty influences their school
performance, the low achievement of poor children is not due solely to family background. Their
school experience also plays a critical role in their academic progress (Gezi, 1990). A number of
areas that impact student achievement are associated with low-performing schools. Poor teacher
quality (Duke et al., 2005; Murphy & Meyers, 2008), high teacher turnover (Corallo &
McDonald, 2001; Murphy & Meyers, 2008) and ineffective leadership (Murphy & Meyers,
2008) are all associated with a school’s inability to effectively show high student achievement.
Other school conditions include a lack of teamwork, curriculum that is not aligned, and
discipline issues (Duke et al., 2005). Educator practices and beliefs also play a role in low

12
student achievement. Blaming students for failure, which often stems from low morale (Murphy
& Meyers, 2008) and low expectations of students (Corallo & McDonald, 2001), is typically
found in underperforming schools. From their findings of a study of the Virginia School
Turnaround Specialist Program (VSTSP), which examined the practices of ten successful
turnaround leaders, Duke et al. (2005) echo these low expectations by describing the conditions
of a dysfunctional culture in which educators assume a punitive and reactionary attitude towards
students displaying a lack of achievement. Low parent involvement is also commonly found in
underperforming schools where communication and collaboration between school and home is
minimal and weak (Clubine, Knight, Schneider, & Smith, 2001). This literature illustrates how
turnaround schools operate in challenging contexts. Rather than view these conditions as barriers
to school improvement, we feel they need to be taken into account when turning around
chronically underperforming schools.
We look to these descriptions of chronically underperforming schools to understand the
kinds of conditions that may exist in current turnaround schools designated under current state
and Federal legislation. These are schools with weak school structures and practices in
communities with high poverty rates. Although all the conditions described above might not
apply to all schools labeled a “turnaround school,” they are common enough to illustrate some of
the challenging conditions that educators face when embarking on the work of turning around
underperforming schools.
Review of Research on Improving Chronically Underperforming Schools
Given this characterization of turnaround schools as schools with challenging conditions,
we examine the research that highlights the practices that have been successful in improving
chronically underperforming schools. Because research on practices for school turnaround in

13
response to policy mandates is lacking, this review is derived from a broad range of research
studies of effective practices in underperforming schools, many of which may not necessarily
have implemented specific policy requirements for school improvement. It is our belief that the
findings from these research studies could aid our understanding of the kinds of practices that
educators might draw on when implementing turnaround policy. If the goal of the policy is to
raise student achievement and to close the achievement gap, what educators do to meet those
ends is paramount, and research on effective practices can potentially inform how they approach
the work. These practices have been examined through a variety of lenses, including motivation,
professional development, development of teacher leaders, vision and goal-setting, data,
instructional time and programming, and collaboration.
Motivation. One of these lenses is the role of motivation in the process of change. Albert
Bandura (1994) defines motivation as the “activation to action.” He argues that people are able to
remain motivated in stressful situations when they believe they have self-efficacy and the ability
to overcome their stressors. What school leaders do can influence how educators motivate
themselves to do turnaround work. Leaders have to instill hope and confidence in the teachers in
order for the work of a turnaround to even be attempted (Murphy & Meyers, 2008). There is a
human element to turning around schools and therefore the emotional impact of the reform
efforts on teachers must be considered in order for the changes to be successful. The school
leader must take into account how it feels for people to go through change in such a stressful
environment (Evans, 1996; Norman, 2010). Motivation is particularly important in light of
policy requirements that are imposed on schools from the state. On the one hand, they might
contribute to the stress that educators feel. On the other hand, mandates that threaten the
elimination of jobs, the closing of schools, and even the public shaming associated with

14
turnaround schools can serve a purpose (Duke, Tucker, Salmonowicz, Levy & Saunders, 2008).
The threat of loss of employment and school closure serve to introduce a crisis into the
turnaround school, particularly if the teachers there did not feel it already. This is akin to
accountability pressure that comes into play when achievement targets must be met in order to
show improvement. It is helpful to leverage this accountability pressure to compel educators to
focus on their performance (Jacobson, Johnson, Ylimaki, & Giles, 2005; Fullan, 2006).
Turnaround work can be fostered by the school leadership, or it can be motivated by policy
mandates with consequences for noncompliance. Regardless of the motivation, educators’ beliefs
about their ability to create sustainable improvement in student achievement are key to turning
around an underperforming school.
Vision and goal setting. Perhaps the practice most frequently cited for raising school
performance centers on vision and mission. Successful leaders in low-performing schools drive
the work at hand by communicating and maintaining a highly focused vision and mission that is
about student learning (Clubine, et al., 2001; Duke, 2006; Gezi, 1990; Jacobson, et al., 2005;
Leithwood, Harris & Strauss, 2010; Murphy, 2010; Murphy & Meyers, 2008; Picucci,
Brownson, Kahlert, & Sobel, 2002; Potter, Reynolds, & Chapman, 2002; Salmonowicz, 2009;
Duke et al., 2005). While the literature has examined this feature in a variety of contexts, it is the
one that is primarily noted as having a significant impact on school improvement success.
Distinguishing between strategies for short-term versus long-term gains, Corallo and McDonald
(2001) note that developing a common vision and mission is one that would result in long-term
gains. Gezi (1990) articulates this critical role of vision when he says, “Leadership seems to
infuse the school not only with the vision but with the positive climate, communication and

15
support that are essential ingredients of a sense of ownership, enthusiasm, commitment and pride
in achievement” (p. 9).
Similar to establishing a vision, goal setting has a significant role in the work of turning
around underperforming schools. Establishing clear goals and priorities is an essential
component of raising the level of performance for any underperforming school (Anderson et al.,
1999; Gezi, 1990; Leithwood et al., 2010; Murphy, 2010; Stein, 2012) with an emphasis on the
use of targets to benchmark progress towards goals (Potter et al., 2002). This points to the
importance of objectives and targets in outlining the improvement goals of the school. Research
points to the importance of having an overall vision of performance for the school along with
specific goals.
Data. Working in tandem with goal setting is the use of data. Some of the research notes
the value of analyzing student achievement data to guide instruction in low performing schools
(Clubine et al., 2001; Corallo & McDonald, 2001; Duke et al., 2005; Stein, 2012). Leithwood et
al. (2010) claim that the leadership practices most associated with successful school turnaround
include monitoring of student learning and overall school progress. They write, “School and
district leaders constantly monitor evidence about the learning of students and the efforts of staff
to improve such learning, continuously adjusting their own decisions and actions in response to
this evidence” (p. 159). Indeed, turnaround schools need to engage in a continual process of self-
analysis in order to monitor progress and determine areas that persistently lag (Murphy &
Meyers, 2008). This reflects how data should be used to ensure progress towards goals already
set, not just in individual classrooms, but also school wide, all of which embodies the process of
measuring accountability. The literature illustrates that there is a strong link between goal setting

16
and using data to measure progress for leaders in underperforming schools and that using data
has a key role in school improvement.
Building capacity. Another key component to improving chronically underperforming
schools is in the area of capacity building. The work of M. Bruce King and Kate Bouchard
(2011) on building organizational capacity in schools defines capacity as the “collective power
of a faculty to strengthen student performance throughout their school” (p. 654). Richard Elmore
(2004) addresses the role of professional development in bridging the gap between performance
and human capacity. An expert on the modern school reform movement, Elmore argues for a
more robust and targeted professional development plan in schools that values the idea of
“reciprocity of accountability,” which asserts that teachers need to be provided with additional
capacity if schools expect them to perform different tasks or familiar tasks at a higher level.
Indeed, professional development is a common means used to increase staff skills and
knowledge to improve their individual and collective performance. Newmann, King, and Young
(2000) further claim that schools that used a comprehensive approach to professional
development were more likely to focus on the long-term consistency, improving teacher
knowledge over time, thereby building capacity. They add that professional development for
principals must ensure they understand the importance of building capacity.
Bringing in external resources is one way to help build capacity. Due to the difficulty of
developing capacity in low performing schools, King and Bouchard (2011) provide insight they
gained from the Wisconsin Idea Leadership Academy (WILA), a hybrid program that combines
the resources of a university school of education, the state education department, a mid-size
urban district, and six schools. They note that the success of the WILA model is that it provides
leadership coaching for school leadership teams, instructional coaching for teachers, cross-lateral

17
networks for sharing of best practices between schools, and alignment between WILA coaches
and state liaisons. School-university partnerships are key external resources as noted by Vernon-
Dotson and Floyd (2012) who found in their research of three K-12 school partnerships with
local universities that external technical assistance provided by universities to teacher teams can
build capacity in schools. Consistent with past school reform movements, the work of school
districts with turnaround schools is to find external resources and service providers to help build
capacity in schools engaged in the current turnaround experiment (Fullan, 2006; Zavadsky,
2012). Given the complexity of improving student achievement in turnaround schools providing
quality professional development for teachers is critical to equipping them for the work of school
turnaround.
Teacher leaders. Another aspect that is addressed in the literature is the importance of
sustained improvement and not just a temporary fix for underperforming schools. One way this
improvement is sustained is through the identification and development of teacher leaders who
will commit to continuing the work over time to realize student achievement gains. In their
research on teacher leadership in the UK, Muijs and Harris (2006) emphasized that being a
teacher leader was not limited to leading a department or team, but instead entailed having any
kind of responsibility for making improvements. They found that teacher leadership was a
significant factor in school improvement as it increased teacher professional learning because
they were able to learn amongst their peers. In fact, teacher leadership is tied to capacity building
as noted by Dinham and Crowther (2011) whose research on building sustainable capacity in
schools found that the distributed leadership model and the relationship between principals and
teacher leaders is a key factor in building school capacity. Defining what teacher leadership
looks like, Vernon-Dotson and Floyd (2012) claim that when teachers become immersed in

18
tackling school challenges with a leadership lens, they are inspired to go above and beyond their
job description and become participants in school-wide change. Furthermore, teachers who
engaged in collaborative leadership experiences felt valued and were more likely to buy into
school initiatives because they were a part of the decision-making process. As a result, teachers
were more likely to implement commonly developed professional development activities and put
strategies into action. Spillane and Coldren (2011) further describe distributed leadership in their
discussion about diagnosis and design for school improvement when they say that it is not only
about the leadership actions, but includes how people communicate in schools and how the
situation influences their interactions. By employing distributed leadership, turnaround schools
can better maximize their resources by engaging faculty in deeper and more meaningful ways
that will help sustain the work.
Collaboration and teamwork. Collaboration and teamwork are also areas that research
has shown to contribute to successful school improvement. Some studies have found that
relationship building coupled with collaboration between stakeholders is key to raising the level
of performance of an underperforming school (Corallo & McDonald, 2001; Duke et al., 2005;
Fullan, 2006; Harris, 2006; Mulford et al., 2008; Murphy & Meyers, 2008). Clubine et al. (2001)
found that in successful turnaround schools, collaboration took several forms, including common
team planning where teachers discussed student progress, curriculum, and instructional goals.
Indeed, this collaboration has a particular role in school reform in that in successful school
turnaround, there is a collective sense of responsibility for student improvement (Anderson et al.,
1999). Yet, collaboration does not always naturally occur without guidance. In her examination
of change efforts in schools with difficult contexts in England, Harris (2006) emphasizes the
need for a leader to be open and honest as they build quality interpersonal relationships. This

19
lays a critical foundation for teamwork and collaboration. In fact, empowerment and a sense of
trust are a critical part of collaboration. Once these are infused into the organization, a
collaborative environment can flourish (Fullan, 2006; Bryk & Schneider, 2002; Harris, 2002).
Educator collaboration can help educators to feel less isolated and more connected to a common
goal of making gains in student learning. In the end, the value of collaboration is its role in
supporting educators in the difficult work of school improvement.
Instructional time and programming. Another significant part of improving
chronically underperforming schools involves focusing on instructional time and examining
instructional programming. Studying three high-poverty elementary schools, Jacobson et al.
(2007) found that successful principals revamped structures, policies, and procedures where
needed and refocused conversations on how to improve student learning. While this applies to
the operation of the school overall, what is suggested is that these structures are needed to
support the instructional programming. Picucci et al. (2002), in their study of school turnaround,
found that schools that showed rapid achievement gains helped to maintain instructional quality
by reducing any distractions to teaching. This included strengthening student management
systems in order to increase teachers’ focus on instruction and less on managing student
behaviors. Leithwood et al. (2010) also discussed the need to eliminate distractions, but more in
terms of buffering staff from “being pulled in directions incompatible with agreed-on
organizational goals” (p. 162). With structures in place to support a focus on teaching and a
reduction of distractions, the time for actual planning and delivery of instruction can be
maximized.
How the Literature Relates to This Study

20
Literature on school improvement, particularly for challenging schools, outline specific
leadership practices that, when implemented effectively, contribute to the success of school
improvement. These practices include attending to staff motivation, building capacity,
developing teacher leaders, setting a vision and goals, using data, maximizing instructional time
and programming, and providing opportunities for collaboration. While literature has uncovered
effective practices to raise school performance, most of the chronically underperforming schools
in these research studies have not necessarily been responding to policy mandates of school
turnaround. Indeed, new legislation now attempts to improve school performance by imposing
general requirements around how turnaround work is to occur. However, the policy does not
articulate the practices educators should use to implement it. That is, the general requirements
are about the process of developing the turnaround plan and elements that must be included. It
does not include language around how educators should approach the work of school turnaround
in order to meet the turnaround goals of raising student achievement. That is left up to the
educators to determine what practice would most likely be effective in raising student
achievement. That is where this body of research comes in. School leaders might turn to these
research studies to understand what practice they should exercise in order to meet the turnaround
goals.
The research on practices that improve the performance of chronically underperforming
schools is ample. Therefore, the purpose of this research is not to explore best practices for
turning around underperforming schools. Rather, we aimed to unearth how turnaround work
occurs as a response to policy mandates, in light of these proven effective practices. As discussed
earlier, educators are responsible for implementing turnaround policy and the practices described
above might inform how they do that, especially given a policy that does not require or even

21
suggest specific practices. With a policy that does not suggest educational practices for
implementers, and a body of research that reveals effective practices in turning around schools,
what is missing is research that looks at what practices educators put in place to implement
turnaround policy. In order to better understand how these implementation decisions are made,
we turned to how educators interpreted and made sense of the policy itself. This may have a
great impact on the implementation and ultimately on the success or failure of the policy.
Theoretical Basis for the Study
Policy Implementation
State legislation requires that turnaround plans lead to rapid academic achievement of
students. The literature review of best practices outlines what is needed to turn around
chronically underperforming schools and policy implementers may use these as guides to know
which actions to take. Whereas the policy articulates the goal of higher student achievement, the
literature answers the question of what to do to reach that outcome.
The theoretical basis for this research first looks at policy implementation as a critical
factor in whether or not practice is aligned with policy goals. Green (1983) provides a theoretical
overview for the relationship between policy and practice through his discussion of excellence,
equity, and equality. He identifies the problem of determining whether the tools of public policy
can impact practice, questioning the nature of public policy and its limitations. He claims that
public policy addresses the common good and not the good of individuals, and further argues
that the tools of policy are primarily aimed to minimize evil, rather than promote benefits.
Green’s work is significant to our study because it points to the role of policy implementation in
22
relation to changing practice. In turnaround schools changing practice is essential to improving
student achievement.
The field of policy implementation research formally emerged during the 1960s. Since
then it has undergone three distinctive generations or waves of research (Honig, 2006). The first
wave focused on what gets implemented. Early research studies looked at policies that were
intended to achieve wide ranging societal goals. The second wave, during the 1970s, focused on
what gets implemented over time, and included a growing recognition of the fact that policy,
people and places mattered to implementation. During the 1980’s a third wave of research
evolved which centered on concerns with what works and the field began to focus on
“implementers’ agency as an important avenue for implementation research” (Honig, 2006, p. 9).
Honig (2006) notes that past treatment of policy implementation in research relied on a
distinction between “successful” policies, those that result in higher student achievement, and
“implementable” policies, those where implementation closely resembles policy design. She
further states that research needs to acknowledge that there is significant complexity involved in
policy implementation and includes the interaction between policies, people and places, and the
demands on implementers. The critical question is about, “what is implementable and what
works for whom, where, when and why” (Honig, 2006, p. 2). Included in this complexity are the
factors that have a role in what implementers do with policy and the actions they take, which
may include their belief systems, background, knowledge, and the contexts that influence what
they can and will do (Honig, 2006). The process that individuals or organizations engage in to
create “understanding” when faced with complex, dissonant or ambiguous circumstances leads to
a more in-depth analysis of the theory base for this study. Here, sense-making may have a
significant role in policy implementation in terms of how implementers understand the policy
23
that dictates turnaround work. This research study looked at how well implementers’
understanding of policy support its execution and if there are influencing factors that impact the
way in which implementers make sense of the policy. Understanding the impact of implementer
sense-making is not only important and practical for school districts who are engaging in
turnaround work in response to policy mandates, but it is also high stakes for the success of
students currently attending chronically underperforming schools.
Policy Sense-making
Defining “understanding” requires a further analysis of a body of research which spans
multiple disciplines and multiple interpretations. Prior researchers from the fields of
organizational psychology, sociology, management science, social anthropology and more
recently education policy implementation have defined this process as “sense-making.”
Organizational psychologist Karl Weick (1995), a key contributor to the development of this
theoretical frame, stated simply, “The concept of sense-making is well named because, literally it
means the making of sense.” Weick (1995) further defined the concept by stating, “how they
(individuals) construct what they construct, why and with what effects, are the central questions
for people interested in sense-making” (p. 4). Weick (1995) grounds his version of sense-making
in seven properties that he argues are most commonly found throughout the sense-making
literature, including; 1) grounded identity construction; 2) retrospective; 3) enactive of sensible
environments; 4) social; 5) ongoing; 6) focused on and by extracted cues; and 7) driven by
plausibility rather than accuracy. He argues that each of the seven properties can be used to
define various characteristics of sense-making. For example, sense-making begins with the
sense-maker (grounded identity construction). An individual’s environment as well as their past
experiences are used in sense-making (retrospective). Individuals can be active participants in

24
constructing the environment they are trying to make sense of (enactive of sensible
environments). They can make sense of something either individually, or as part of a larger
social group (social). The sense-making process has no beginning and no end (ongoing). It is an
iterative process and can be influenced by the cues individuals chose to focus on in the
environment around them (focused on and by extracted cues). Finally, sense-making is not about
truth or getting it right. It is a about creating a story that is plausible and then continually refining
it with more data and observations so that it can withstand criticism (driven by plausibility not
accuracy). (Weick, Sutcliff, & Obstfled, 2005).
In addition to Karl Weick, a number of other researchers have provided their own
theories and interpretations of sense-making. Dervin (1998), whose research centers on
communication and the design of communication systems, uses the sense-making frame to
investigate the interconnectedness between knowledge management and sense-making. Dervin
states, “One of the premises of sense-making is that there is an inherent intertwined connection
between how you look at a situation and what sense of it you are able to construct of it” (p. 11).
The focus of this research was grounded in the field of education and policy
implementation using sense-making as a frame. Weick and Dervin, among others, provide a
broad contextual multidisciplinary research framework to understand sense-making; however,
this research seeks to weave a historical understanding of sense-making with a more
contemporary understanding of the factors that contribute to sense-making in the educational
policy implementation context. More specifically, the research examined sense-making and
turnaround policy through the eyes of multiple policy implementers.
Contemporary implementation research builds on the work of previous decades but has
expanded the field to include the study of three key dimensions in policy design: goals, targets

25
and tools. Other researchers have then begun to offer additional theories such as the role of “co-
construction” in policy implementation (Datnow, 2006), policy implementation and cognition
(Spillane, Reiser & Gomez, 2006), policy implementation as organizational learning (Honig,
2006), policy implementation as a political process (Malen, 2006), and the role of social capital
in policy implementation (Smylie & Evans, 2006), all contributing to an evolving definition of
sense-making and its role in policy implementation. The concept of sense-making is essential to
this study, as we hoped to gain insight into how policy implementers of the state turnaround
legislation make sense of the policy, and what implications their sense-making might have on
how they go about implementing the policy to reach policy goals. The sections below provide
further detail about the various components of sense-making as identified in the literature.
Construction and cognition. The frame begins with a look at how implementers receive
education policy information and make sense of it in light of existing knowledge. Spillane,
Reiser and Gomez, (2006) talk about sense-making in terms of a “reconstruction” of knowledge
for the change implementer. “What is paramount is not simply that implementing agents choose
to respond to the policy but also what they understand themselves to be responding to” (Spillane
et al., 2006, p. 49). When an implementer encounters new research or policy, they combine it
with their existing knowledge and experience to construct new knowledge. It is this interaction
between old knowledge and new information where one creates an understanding of the policy.
Relating to the effective practices described in the literature review above, the role of prior
knowledge may be particularly pertinent. Educators typically have a knowledge base about what
good practice looks like, including best practices around instruction and leadership. When they
encounter policy that dictates certain ways to turn around a school, that prior knowledge would
interact with the policy and inform how the implementer makes sense of the policy and the

26
corresponding work. Spillane et al. (2006) further describe this as cognition. “From a cognitive
perspective, implementation hinges on whether and in what ways local implementing agents'
understanding of policy demands impacts the extent to which they reinforce or alter their
practice” (p. 47). Spillane et al. (2006) argue that understanding is only one discrete factor. How
individuals view the world, the beliefs they hold and how their expectations influence their
actions also contribute to their sense-making. They further argue that learning a new idea may
not be sufficient in and of itself, particularly in the context of reform and restructuring. New
ideas may be in danger of being modified or ignored if they are filtered through the same
existing knowledge schemas that already exist.
Spillane et al. (2006) offer a caveat about interpretation of policy given one’s preexisting
level of expertise. If one’s understanding is limited to the superficial aspects of the policy or
embodies only a rudimentary level of expertise in complex policy implementation, they may
miss the core concepts of the policy and focus entirely on what is similar to their previous
experience, leading to a familiar but ultimately shallow interpretation. The expertise one brings
to their interpretation of a given policy determines their ability to identify key elements of the
policy. Because implementation decisions are influenced by this sense-making, the interaction
between expertise and policy sense-making makes a difference in how policy is implemented at
the ground level (Spillane et al., 2006).
Datnow (2006) argues that this knowledge is also “co-constructed” with other members
of the policy chain. Co-construction relies on multi-directionality, since over time the different
implementers influence each other during the interactions that take place. While policy
implementation tends to assume a linear process, in reality, implementation is not so much a
linear process but one that takes on varying directions. It is the interactions between

27
implementers that lead to these various directions and help implementers construct an
understanding of the policy. Here, the role of communication is salient in that it is through
communication that people begin to make sense of what they need to do to implement the policy.
Another critical part of Datnow’s (2006) co-construction is that one’s understanding of
policy is not divorced from the context in which they are implementing policy. She puts forth a
concept of a relational sense of context, explaining that, “by this we mean that people’s actions
cannot be understood apart from the setting in which they are situated, and reciprocally, the
setting cannot be understood without understanding the actions of the people within it” (p. 107).
When people implement policy, their thinking is shaped by the situation or environment that
surrounds them, which in turn influences the actions they take to implement policy. Important to
consider when examining policy implementation in education, is how educators make sense of
the policy, in the case of this research, turnaround policy, given their existing knowledge and
their context.
Political effect. Malen (2006) provides a framework and case study for assessing the role
of politics on education policy implementation. She argues that implementation is a crucial point
in the policy-making process because it is the point where it actually impacts various
stakeholders. According to Malen (2006), there are “political exchanges” that occur during
implementation that regulate the various interests of stakeholders “because they are value-laden
issues that cannot be resolved solely through the acquisition of empirical evidence or the
application of technical expertise” (Malen, 2006, p. 83). Relationships amongst various policy
implementation actors, although they may or may not acknowledge one another, are forged and
impact the degree to which policy is implemented with fidelity, resisted, or subverted.
Furthermore, because education policies are deeply value-laden and may require reallocation of

28
resources or question utilization of time, reaching resolution is extremely difficult. The author’s
framework draws extensively on the idea of “political games” as a metaphor as originally
proposed by Bardach’s (1977) groundbreaking research. Here Bardach outlined a process various
policy implementers go through in order to achieve specific policy goals.
The key components of the educational policy implementation political frame include an
analysis of the varied interests of actors and their capacity to influence implementation based on
policy currency, and the influence of social and institutional context on implementation. Malen
(2006) explains that policy implementation literature overwhelmingly identifies “policy dilution”
as a major theme. In this instance, the varied interests of implementers erode social reform. The
author further adds:
Even at the local level, deeply rooted traditions of incremental decision making and
broadly held views about occupational survival may prompt district officials to select and enact
policies that “attract...notice” and enhance legitimacy, but do not alter fundamentally, the
orientations and operations of the school system (Malen, 2006, p. 97).
For Malen, the political frame can provide unique insights into policy implementation
and, as the above quotation indicates, various political phenomena and “political games” played
by policy implementers can greatly influence policy outcomes. The insights are key in
understanding the interface between actor’s interests and resources, and policy initiatives,
premises and outcomes.
Social capital. Smylie and Evans (2006) provide insight on the impact social capital can
have on education policy implementation. While social capital is a broad concept, used in
various disciplines and contexts, for the purposes of this study we adopt the definition of social
capital as developed by Smylie and Evans. The authors define social capital an “intangible and

29
abstract resource...[that can act as an agent] to promote certain behaviors within social structures
and it can be accumulated and drawn on to achieve otherwise hard to attain objectives.” (Smylie
& Evans, 2006, p. 189). For Smylie and Evans, social capital contains three major components,
including “social trust, channels of communication, and norms, expectations, and sanctions” (p.
189-190). Trust can determine the extent to which individuals in organization want to collaborate
with one another, based on their confidence in their colleagues, in order to achieve policy goals.
The flow of communication is essential as successfully reaching any goal requires access to new
information and furthermore requires individuals to communicate with one another. Finally,
norms, expectations and sanctions can influence the extent to which individuals are praised or
reprimanded for their actions based on intangible predetermined community standards. Within
these confines, Smylie and Evans argue that social capital can greatly impact policy
implementation and the attainment of policy goals.
At the onset the authors note that implementation research has long known that the will
and capacity of implementers and how they navigate the local context could negatively impact
policy outcomes (p. 189). The authors argue that social capital can have a positive or negative
impact on implementation. “Social capital is not social interaction per se. Social capital is
‘produced’ through social interaction” (p. 189). Furthermore, social capital can be divided into
two components, “trust” and “channels of communication.” These components have implications
on policy implementation because of the open or closed nature of relationships based on trust can
impact whether or not an idea, program, or initiative will thrive.
The authors note that while strong social capital can be key to policy implementation, it
can also act as a conserving force, where entrenched philosophies developed through shared
norms and experiences can impede policy implementation (Smylie & Evans, 2006). They

30
reviewed research conducted by the Chicago Annenberg Research Institute. The Chicago
Annenberg Challenge was a five-year study of decentralized reform initiatives involving efforts
between schools and external partners. Smylie and Evans (2006) note that this study was not 37
necessarily on social capital itself, but that it can be used as a window through which to
understand the role of social capital in the implementation of initiatives. Based on the outcomes
of the Annenberg Challenge, they concluded that both the initial level of social resources and the
nature of and ability to sustain relationships with external partners were two determining factors
indicating strong social capital, which supported implementation. Schools that began with a
stronger base of social resources valued teacher collaboration and had an orientation toward
trust, innovation, and owning student success or failure. Some of the external partners in the
Annenberg Challenge schools found it difficult to sustain relationships and communicate
effectively with teachers in some schools, which led to groups of teachers using social capital to
inhibit the success of reform efforts. The authors conclude their article by arguing that social
capital is something that researchers should continue to pay attention to, as it can aid or inhibit
the success of policy implementation.
The above-mentioned components of policy sense-making each have a unique impact on
how policy is implemented throughout school districts. Whether at the level of the school board,
superintendent/central office, principal and leadership teams, or amongst school faculty,
construction and cognition, the impact of politics, and the impact of social capital can all
substantially affect policy outcomes. Understanding this is important and helpful for district and
school leaders since time and resources are limited. The stakes are high and the impact of not
carefully considering how all of these elements work together and how they shape policy
implementation could be a determining factor in the attainment of policy goals. This could mean

31
that chronically underperforming schools fail to improve within the three-year timeframe as
outlined within the State Legislation (2010). Moreover, as we outlined in the introduction to this
study, for communities and cities that are relying on school and district leaders to produce
educated and productive graduates, failure to turnaround schools has a large impact society.
Therefore this study aimed to gain insight into what it takes to “get it right,” which is an essential
concern of this state’s school and district leaders with level D schools.
Theoretical Frame Synthesis
The theory frames outlined above are represented in the graphic below.
Figure 1.1 Theoretical Framework for how sense-making impacts Turnaround Policy
implementation.
32
The turnaround policy acts as the trigger that begins the process that may ultimately lead
to the goal, improved student achievement. As the policy reaches the policy implementers, a
number of factors influence how the implementers make sense of the policy. As outlined by
Honig (2006), the implementers' beliefs, knowledge and perceptions of their own capacity to
implement the policy come into play. This likely includes prior knowledge about effective
practices to turn around underperforming schools. Karl Weick (1995) outlines the process policy
implementers may go through in trying to understand a policy and maintains that this process is
iterative. He argues that who, what, why, and a person’s past can impact their understanding of
policy. Dervin (1998) explains the link between a subject’s understanding of a policy and their
ability to construct meaning. Spillane et al. (2006) point out cognition is dependent upon one’s
ability to understand a policy and alter their practice as a result. He and his colleagues argue that
it's not enough to be able to grasp new ideas because learning new ideas using old schemas can
be deleterious to success. Datnow (2006) argues that this knowledge is also “co-constructed”
amongst implementers who are responsible for the policy. She further adds that implementer
actions cannot be divorced from their context, and consequently the context is better understood
by assessing the impact of implementer actions on the context. This means that the implementers
actions continuously changes context and therefore context can be better understood through
study of implementer cognition. Malen (2006) provides insight into the types of political
exchanges that take place and the effect they might have on decisions around time and resource.
Malen argues that actions and decisions can become high stakes and uses the concept of
“political games” to describe the impact of politics on policy implementation. Smylie and Evans
(2006) note that social capital has a significant impact on policy implementation. They add that
social capital is not defined as simple human interaction, but instead intentional interactions

33
between implementers. In this context, social capital can be divided into two categories, trust
and communication. Externally the context in which the implementers operate, the influence of
politics, and social processes they engage in make sense of the policy. The perception that there
may or may not be external capacity to successfully implement the policy all converge and
influence the eventual sense-making the policy implementers make of the original policy. Their
understanding guides how the policy will be implemented in the day-to-day context of
turnaround schools. Policy implementation then becomes an iterative process that is ongoing,
constantly refined and modified by new knowledge, new emotions and new understanding or
sense-making (Weick, 1995).
Research Gap Ample literature exists around efforts to turn around underperforming schools. This
includes a wide range of research studies that look at how schools are able to raise the level of
performance of their students in challenging contexts. Studies have shown how certain practices
contribute to successful school turnaround. Yet, not all of these studies look at turnaround in
terms of policies that dictate the turnaround process. In this state the legislation mandates that
schools designated as turnaround schools need to comply with specific requirements to raise
student academic achievement. This informs turnaround work in ways that have not yet been
addressed in the literature. A critical part of this research is that turnaround policies dictate
turnaround efforts to occur within a relatively short timeframe (e.g. 3 years). However,
researchers’ descriptions of all the elements that go into making sense of any policy suggest this
to be a complex and perhaps lengthy process. This research study not only addressed the gap in
the literature about making sense of turnaround policy and how it influences implementation, but
also considered the fact that the policy only allows three years to turn around a school. The gap

34
in turnaround research exists at the intersection of practices that are shown to turn around an
underperforming school and turnaround policy implementation.
Another body of literature looks at the role of policy sense-making in policy
implementation. Focused on policy implementers, this sense-making includes internal or
individual processes (e.g. reconstruction of knowledge) and external influences (e.g. co-
construction and politics). Research studies have examined how sense-making has worked with
specific policies. In these studies, researchers were able to get a glimpse into the sense-making
process in the context of actual policy implementation. However, research on sense-making with
this specific turnaround policy is lacking. This is a matter of practical and urgent importance to
school districts across the state as all stakeholders within the school community are concerned
with improving chronically underperforming schools. With the high stakes nature of this
turnaround school reform effort, the way in which district leaders understand the legislation will
significantly impact the educational success for thousands of students throughout the state.
Successful policy implementation may be dependent upon understanding the policy at
face value and district leaders ensuring that the political context, shared values, capacity, and
colleague sense-making do not negatively impact implementation. Getting it right could mean
positive outcomes for students and schools that have chronically underperformed, which would
ultimately lead to increased student achievement and a change in classification from level D to
level C3 and beyond. The stakes are high as unsuccessful implementation could mean schools
and districts become level F, and risk state take over. More importantly, unsuccessful
3 For the purposes of maintaining anonymity of local education agencies (LEA) and participants, in this study, we use a pseudonyms for each of the levels.

35
implementation results in inferior education, which is detrimental to individuals, families, the
state, and the nation.
Chapter 3
Methodology4
The Community Context The city, which is the site of this research study, is located in the Northeast and its history
and development has followed a path similar to that of most beleaguered industrial mill towns—
intense growth and dramatic decline followed by fits and starts at resurgence. Geography and the
immediate access to both a port of entry and water power from nearby rivers made the
community a desirable location for bringing in raw materials, manufacturing them into goods,
and redistributing them out via the port to other parts of the country. At the height of its power,
the city employed more than 30,000 workers. Thousands of immigrants arrived during the boom
period between 1865 and 1923, coming primarily from Ireland, England, Scotland and Italy as
well as Canada, Portugal and the Azores. As each immigrant group arrived, they proudly claimed
certain parts of the city as their own, most settling in triple decker units built by mill owners and
usually under the spire of a Catholic church. Portuguese immigrants, settled in tight knit
communities that allowed residents to maintain their language, culture and traditions. In 1920,
the population of the community was 120,485, primarily of European descent. Not unlike many
mill cities throughout the country, the city foresaw a bright and long future for its residents and
its community. The city’s decline would be dramatic and difficult to reverse. It began with the
4 This chapter was jointly written by the authors listed and reflects the team approach of this project: Jamie B. Chisum, Anna Carollo Cross, Jill S. Geiser, Charles Grandson IV

36
Depression of the 1930s, followed by the closing of mills and manufacturing plants in the 1940s
and 1950s. An attempt at urban renewal in the 1960s and 1970s created housing and
infrastructure but demolished some close-knit communities in the process. Globalization,
economic hardship, rising unemployment, crime, drugs and failing schools plagued the city
through the 1980s, 1990s and into the 2000s.
The city’s population has steadily declined from its peak in 1920 to 89,220. The vast
majority (87 percent) continues to identify themselves as having European ancestry, but a
growing percentage of the population (29.6 percent) report Latin America, Asia and Africa as
their region of birth. Based on the 2010 Census data, 26 percent of the foreign-born population
entered the United States in 2000 or later. About 34.2 percent of the households speak a language
other than English in the home, and 21.4 percent of the residents live below the poverty level,
double the poverty level for the state. According to a recent study, the poverty rate for children
under 18 is 33.3 percent, which means that one in every three children in the city is currently
living in poverty. Many live as renters in multi-unit structures, remnants of the housing stock
created for mill workers. In terms of educational attainment, 32.5 percent of the adults over the
age of 25 do not hold a high school diploma, a mere 14.1 percent of the adults over 25 hold a
bachelors degree or higher. This is a city under stress, which has struggled to maintain its
identity and its pride. The school system is seen as a key ingredient to improve the quality of life
for its residents and restore the economic future of the city.
The LEA Context
In recent years turning around the city has focused on turning around the public school
system. The LEA has an enrollment of 10,138 students. Over the last ten years the demographics
of the student population has changed both socio-economically and racially. This is significant in

37
that the school system has had to respond to this rapidly shifting demographic as it has worked to
turn around the schools.
Table 1: LEA Demographic Shifts from 2003 to 2013
Population Category 2003 2013
White 77.3% 63.3%
Hispanic 9.0% 19.9%
African American 8.1% 7.0%
Native American 0.6% 0.3%
Asian 5.1% 4.5%
Low-Income 50.9% 77.9%
English Language Learners 5.5% 7.1%
Students w/ Disabilities 14.8% 22.4%
In 2003 the student population was 77.3 percent white, 9 percent Hispanic, 5.1 percent
Asian, 8.1 percent African American, and .6 percent Native American. Since 2003, the Hispanic
population has more than doubled to 19.9 percent, the white population has declined to 63.3
percent, and the percent of African American, Asian and Native American students has remained
relatively constant. The percentages of students who are considered selected populations under
state indicators has also changed over the years. The percentages of students who qualify for free
and reduced lunch increased from 60.5 in 2007 to 77.9 in 2013. Increases are also noted in the
percentages of students whose first language is not English and of students with disabilities. In
2013, the state added a new category to its annual statistics, the percentage of students in the
LEA who qualify as “high needs,” who constitute 81.5 percent of the students who attend the
public schools in this LEA.

38
Two other notable areas of demographics were the graduation and drop-out rates which
exceed that of the state. Interestingly, the largest attrition rate between grades occurs at grade 8
with 32.9 percent of the students choosing to leave the schools.
Table 2: LEA and State 2012 4-Year Graduation and Drop-Out Rates
LEA
State
Population Category
% Graduated
% Dropped Out
% Graduated
% Dropped Out
All Students 69 17.9 84.7 6.9
Male 61.5 23.1 81.8 8
Female 76.8 12.5 87.7 5.7
ELL 44.1 23.5 61.1 18.9
Students w/ Disabilities
35.7 34.3 68.6 12.8
Low Income 64.2 20.6 72.4 13.2
African American 70.1 14.9 73.4 11.3
Asian 90.9 4.5 89.5 3.9
Hispanic 60.8 25.5 65.5 18.1
White 69.6 17 89.7 4.3
This table shows the 4-year high school graduation rate to be 69 percent. The high school
dropout rate at 17.9 percent is almost double that of the state average of 6.9 percent. The largest
groups to drop out of high school are English Language Learners (ELL) students, Hispanic and
Latino students, and students with disabilities. Males drop out of high schools at more than
double the rate of females. These are challenging statistics as they reflect a school system that
struggles to serve a diverse student population.

39
Over the past several years, this LEA has been focused on turning around its
underperforming schools. Schools have moved in and out of turnaround status, with some
showing significant gains in student achievement and others not.
Table 3: 2013 LEA Schools and Their Accountability and Assistance Levels
School School Type Title I Status Accountability and Assistance Level
School 1 Elementary Non-Title I School
Level A
School 2 Elementary Title I School Level C
School 3 Elementary Title I School Level C
School 4 Elementary Title I School Level C
School 5 Elementary Title I School Insufficient data
School 6 Elementary Title I School Level A
School 7 Elementary Non-Title I School
Level A
School 8 Elementary Non-Title I School
Level C
School 9 Elementary Title I School Level D
School 10 Elementary-Middle
Title I School Level B
School 11 Middle Title I School Level C
School 12 (School was closed spring 2013)
Middle Title I School Level D
School 13 Middle Non-Title I School
Level C
School 14 Middle Title I School Level A
School 15 Middle Title I School Insufficient data

40
School 16 High Title I School Insufficient data
School 17 High Non-Title I School
Level C
There are total of 16 schools in the LEA (with one school that closed in spring 2013).
One of the high schools listed here is one of the top ten largest high schools in the state with an
enrollment of 2276. In addition, there are nine elementary schools, three middle schools, one pre-
K through grade 7 school, one therapeutic high school, and one therapeutic middle school. The
LEA is considered a level D system by the state, a designation that results from one or more
schools in the LEA failing to meet student achievement goals relative to student performance on
the state assessment system. Presently, there are four level A schools, one level B school, seven
level C schools and one level D school.
State intervention under NCLB began in the LEA as far back as 2004 when two middle
schools were the first in the state to be designated as “chronically underperforming” based on
their state assessment data. Over the next several years, the achievement levels of the schools
were in flux, moving between periods of growth and decline. When the 2010 state turnaround
legislation was passed, those two schools, along with a third, the pre-k through grade 7 school,
received level D designation, which threw them into a rigorous turnaround process. Growth
occurred in two of these schools over the three-year turnaround process and both schools were
exited out of turnaround status in 2013. Indeed, both schools showed such significant gains that
one moved to level B and the other to level A. In the meantime, the third school that was
originally designated a level D school in 2010, showed a decline in student achievement over the
three year period. For that school, there was impending threat of level F designation, which
would have meant state takeover. With that level F designation a possibility, the LEA decided to

41
close that school in spring 2013 and transfer its staff and students to other schools in the system.
While these schools were nearing the end of their turnaround process, another school was
emerging on the horizon for turnaround status. That school was in level C when it declined to
level D status in 2013. At the time of this research study, that school had just embarked on the
turnaround process.
Research Design
A qualitative design was chosen for this study because this methodology is best used to
address a research problem in which the variables may be unknown, the literature may be limited
and the researcher may need to develop a deeper understanding of the central phenomenon by
exploring the research questions with participants (Creswell, 2012). Qualitative methodology
allowed an in-depth exploration into the research questions: How do implementers’
(superintendent/central office, building leaders, teachers, school board members) make sense of
state turnaround policy? How does this sense-making influence policy implementation? What
factors influence implementer sense-making?
Case Study Design
Case study design was used to explore the sense-making of various stakeholders
implementing the turnaround process as mandated by the state turnaround legislation. Merriam
(2009) notes, “the case study offers a means of investigating complex social units consisting of
multiple variables of potential importance in understanding the phenomenon” (p. 50). Yin (2009)
explains that the case study approach to research is used “...to understand a real-life phenomenon
in depth, but such understanding encompassed important contextual conditions—because they
were highly pertinent to your phenomenon of study...” (p. 18). Given the complexity of sense-

42
making as outlined previously, the case study approach allowed the researchers to understand
how implementation occurred in a specific LEA that was undergoing turnaround work as
dictated by the policy. Yin (2009) discusses various applications of the case study research
design, one of which is a description of a real-life intervention and its context. As noted in the
literature review, efforts to improve chronically underperforming schools have been chronicled
in many research studies. This research offers a unique view of the role of sense-making by
looking at this process through the lens of the implementation of turnaround policy with the aim
to improve school performance. In this case, the intervention was the turnaround policy and the
context was the LEA where implementers were required to put that policy into action. Here, the
context became an important part of this research and, given this, we looked to the case study
approach as one which would produce information that would lead to a deeper understanding of
turnaround policy implementation.
Single case study. Having established the case study as the overall design, this study
investigated the research questions through a single case study method. The research focused on
one LEA, which was identified through the process described in the Unit of Analysis section
below. Yin (2009) points out that single case studies may be representative cases, or “typical”
cases, of a given phenomenon. As a single case study, this research examined the
implementation of turnaround policy in an LEA as representative of the process of
implementation. We were interested in looking at these implementation questions in-depth in one
LEA. A single case study allowed for a deeper understanding of how each stakeholder group
made sense of the turnaround policy and how that sense-making influenced their decisions and
actions around policy implementation. In addition, a single case study was more feasible for this
study given limitations in access to turnaround LEA's and time allotted for data collection.

43
Unit of analysis. Included in a single case study approach was the need to identify the
unit of analysis as well as the theory development. Where the unit of analysis is defined by your
“case,” the theory provides a potential explanation of the phenomenon that the researchers use to
approach their data collection and analysis (Yin, 2009). This research examined how turnaround
work was implemented according to the state turnaround legislation. This policy identifies
turnaround schools through specific criteria and designates those schools as level D schools.
Local education agencies (LEA) that have at least one of their schools designated as a level D
school are then designated level D LEA's and are required to implement the turnaround policy.
For this research, the unit of analysis was a specified level D LEA where the process of
implementing turnaround policy was in process.
Sampling
There were two levels of sampling for this research study: LEA and implementer
selection.
LEA sampling. Because the unit of analysis was the LEA, the one selected for this study
was a level D LEA that was in the process of implementing the turnaround policy. Therefore,
purposeful sampling was used in order to intentionally select a site to learn about the central
phenomenon of turnaround policy implementation (Creswell, 2012). At the time of selection,
there were ten level D LEA’s in the state. Of the ten, two were eliminated due to researcher
affiliation. Of the remaining eight, one level D LEA was chosen based on the following criteria:
1) Access to implementers in the LEA was available.
2) The superintendent was willing to participate in and support the research.
3) The LEA was in the process of implementing the turnaround policy in a level D school.

44
4) The LEA had active participation in policy implementation by all four of the stakeholder
groups identified in this study (superintendent/central office, school leadership, teachers, school
board members).
Participant sampling. Participants for interviews in this study were selected to provide
data about the role of the implementers, which each of the researchers were researching in
individual sections: superintendent/central office personnel, building leaders, teachers,
and school board members. (Interview methodology is discussed below in the data collection
section.) Each of the individual studies had specific sampling approaches that were impacted by
timing and logistics of data collection. In general, though, the participant sampling for this study
included purposeful and snowball sampling. We went into data collection with a preference for
random sampling because, as Creswell (2012) states, the benefit of random sampling is that those
that participate are representative of the population under study. However, when we made initial
contact with the LEA, we found that time constraints precluded our ability to use random
sampling. We had limited time to conduct interviews and, therefore relied on purposeful and
snowball sampling for the selection of interviewees. Purposeful sampling was used when certain
implementers were chosen because their role gave them a specific perspective on turnaround
implementation that might have been different from other implementers. Snowball sampling was
used when educators in the LEA recommended implementers after data collection began. As
Creswell (2012) notes, snowball sampling is often used when it is difficult to know at the outset
of the study, which individuals should participate. In this study, it was difficult to know which
implementers would be willing to participate and snowball sampling allowed the researchers to
identify willing participants.

45
For the umbrella group study, purposeful sampling was used to identify the LEA, which
the researchers did jointly. For each of the individual studies, participant sampling may have
involved either purposeful or snowball sampling. These sampling approaches are further
described in each of the individual studies.
Data Collection
A key part of data collection in this case study research involved the use of multiple
sources of evidence. With multiple sources of data, triangulation can be applied, which in turn
can bolster findings and lead to more convincing conclusions (Yin, 2009). For this case study
research, evidence came from three sources of data: document analysis, interviews, and
observations.
Document analysis. The data collection methods began with document and video
analysis. Creswell (2012) lauds the use of documents to provide valuable evidence in qualitative
research. Yin (2009) echoes the benefit of documents in case studies, stating that they are
unobtrusive in that they are not the result of the case study itself and that they contain exact
details of an event. The document analysis in this research started with an analysis of the state
turnaround legislation. The policy was outlined and dissected to frame the turnaround process
that the LEA was implementing. Further document analysis included some of the LEA’s own
turnaround plans that were written in compliance with the policy as well as state monitoring
documents. Historical documents, media reports, and LEA demographic and achievement data
were included to help gain a deeper understanding of the context. Documents reviewed included
meeting minutes of school board meetings. Because some of these minutes were in the form of a
video recording, document review went beyond actual documents to include some review of

46
recordings. Any document analysis that pertained to individual studies is also described in those
sections.
Interviews. Interviews were conducted to understand implementers’ interpretation of the
turnaround policy. According to Yin (2009), interviews help to provide insight into human
affairs or behavioral events as well as the opinions and attitudes to explain such behavioral
events. For this research, the behavioral event was the implementation of the policy and
interviews aimed to understand those events and accompanying implementers’ attitudes and
opinions. This allowed the researchers to analyze how implementer groups interpreted the policy
and used that interpretation to inform their implementation decisions.
This research study used semi-structured interviews. Patton (2002) discusses the various
types of interviews, noting one structure where an interview guide may be used to provide
guidance regarding the questions asked, while leaving room for probing. Interview guides
provide the same basic lines of inquiry for all interviews; yet, interviewers may be spontaneous
about how to word questions during the interview. A systematic approach for multiple
interviews, the interview guide is a framework that outlines the questions to be asked, the
sequence of questions and the questions to be explored further (Patton, 2002). An interview
guide (See Appendix E) was used to allow us the flexibility to be more personal with our
interviewees, which increased our likelihood of gathering valid data. For this research study,
interviews were semi-structured, which focused on how subjects interpreted the policy and how
that interpretation influenced how they implemented turnaround.
Interviews were conducted by each of the researchers using the same interview process.
We each conducted 6 to 10 interviews for each of our implementer groups, which lasted between
30 and 90 minutes each. A total of 29 implementers were interviewed across the four groups—

47
central office personnel, school board members, school leaders, and teachers. The interview
process began with a consent form signed by the participant (See Appendix C). The interviews
were then conducted using a protocol (See Appendices D and F). Interviews were recorded for
participants who granted permission and then transcribed verbatim. The research team was
sensitive to the fact that the people working in this turnaround LEA were in a potentially
vulnerable situation, both professionally and personally, as there is often a stigma associated
with working in a LEA with a level D designation. The consent form for participants in the study
included language that allowed individuals to opt out of the study or end the interview at any
time without loss or penalty. The consent form also gave flexibility for the participant to choose
not to answer any individual question. The researchers attempted to craft the interview questions
to be sensitive to the vulnerability of participants.
Field test. The methodology also addressed the need to ensure the interview questions
would yield information needed to respond to the overall research questions. As we constructed
the interview questions, we considered the different domains of our research questions and the
kinds of language within each question that would allow significant and pertinent data to emerge.
Yet, one of the concerns was whether the questions would allow this to happen. Weiss (1994)
discusses the benefits of piloting interviews as a field test, which may indicate where the
interview questions are redundant or over weighted in one area and lacking in another. It can also
show where questions are confusing. With this in mind, we tested the interview questions once
with a teacher who was working in a Level D school in a LEA that was not a part of this study.
We then convened to determine if such redundancy or lacking existed and, from there, made any
needed revisions. We went into data collection with a set of interview questions we believed
would yield the data we needed to address the research questions. However, when we began the

48
interviews, we found that we needed to adjust questions to better elicit information related to the
research questions. Some of the adjustments depended on the implementer groups and are
described in the individual studies where pertinent.
Observations. Another data collection tool we used were observations. Observations are
useful in research to document information as it occurs in a specific setting and analyzes actual
behavior (Creswell, 2012). For this research, observations helped the researchers gain insight
into how people processed the ideas put forth by the policy around turnaround work and how
they behaved in terms of implementing these policy ideas. Yin (2009) distinguishes between
formal observations and casual data collection activities. Formal observations entail observing
meetings or other school activities, whereas casual data collection may come from site visits in
the context of conducting interviews. We used observation data obtained casually in the context
of interviewing as well as data from formal observations. Formal observations took place at
school board meetings and one local stakeholder group meeting. For these, we followed
Creswell’s (2012) suggestion for observation protocol and used one that was designed to allow
for a description of the chronological order of events along with a reflection about themes and
quotes. We were non-participant observers and took field notes either during or after the
observation. Creswell (2012) emphasizes the importance of descriptive and reflective field notes,
which involve a description of events along with personal thoughts and insights of the observer.
Our field notes included both descriptive and reflective elements. Field notes were then analyzed
alongside the transcriptions from interviews. The role of observations in data collection differed
for each of the individual studies and is described in more detail in those sections where
applicable.

49
Data Analysis
When analyzing the data, the focus was on extracting data that pertained to the role of
each of the implementers of the turnaround policy. For this, we used a coding process that
allowed key themes to emerge from the data.
Coding. Coding was the first step in our analysis of the data. We coded the interviews
once they were transcribed by an outside agency. Creswell (2012) outlines a coding process for
interview data that includes reading through transcriptions, identifying codes, and collapsing
codes into themes. The analysis of interview data in this research used this coding process in
order to center on key themes, which emerged across the interviews. Miles and Huberman (1994)
discuss the benefits of using a “start list” for coding, which is created prior to fieldwork. The
“start list” contains a list of codes that is devised from the conceptual framework, research
questions, hypotheses, problem areas and any other important variables. Our “start list” included
codes such as collaboration, making sense, communication, student impact, and reflection,
among others, and we used this “start list” (See Appendix B) to begin the coding process.
Once interviews were transcribed, the coding process began by looking at the transcriptions with
the “start list” as a backdrop. That is, we began our analysis according to which information was
consistent with the codes on the start list. We quickly realized that while some of the codes on
the start list were useful, there were several concepts that were not represented on our list.
Therefore, we made adjustments to the list of codes, adding codes and deleting others. As a
group, we established a list of parent codes at the beginning. As individual researchers proceeded
through their coding, they added child codes to the parent codes where needed. We used the
qualitative research software, Dedoose, to code transcripts and to organize our codes.

50
Collaborative coding. The group process utilized in the analysis was key in this research
study. Hill, Thompson, and Williams (1997) describe the process of consensual qualitative
research (CQR) where a team of researchers engages in the process of co-analyzing data. CQR
“...highlights the use of multiple researchers, the process of reaching consensus, and a systematic
way of examining the representativeness of results across cases” (p. 519). It occurs in three main
steps where researchers divide the data into domains, then construct core ideas within the
domains and finally cross analyze to identify consistencies across cases. While the analysis
portion of this research study did not necessarily follow these steps verbatim, the underlying
tenet that informs CQR was pertinent here.
Team members first examine the data independently and then come together to present
and discuss their ideas until they reach a single unified version that all team members
endorse as the best representation of the data. Using several researchers provides a
variety of opinions and perspectives, helps to circumvent the biases of any one person,
and is helpful for capturing the complexity of the data (Hill, Thompson, & Williams,
1997, p. 523).
The group process for this research followed a modified version of CQR, which provided
a structure for the group to code the data together, then to analyze the data individually. As a
collaborative research study, we analyzed one transcript together to determine how to use the
codes from the coding list. From there, we made further adjustments to the list of codes and
established the use of parent and child codes. We agreed that it was possible for individual
researchers to use some codes and not others, depending on their implementer group. Once we
calibrated our coding practices, we coded our interviews individually, and then convened to
compare our coding and to check our calibration. Once all interview transcriptions were coded

51
and individual sections analyzed, we joined together to identify overarching themes that cut
across implementer groups and drew conclusions and potential implications for turnaround
LEA's. Because there were four researchers looking at the data, interrater reliability was
significant. This process of calibrating through co-analyzing the data assisted with interrater
reliability.
Document analysis. As Yin (2009) points out, information from documents should be
corroborated and augmented by evidence from other sources. Documents were examined for
specific details that were not obtained through other sources. The state turnaround legislation had
already been analyzed prior to data collection to gain an understanding of the requirements of
level D schools. Beyond the policy, other documents that were analyzed were documents related
to turnaround work, including the LEA Accelerated Improvement Plan, LEA Recovery Plan, and
a level D school’s School Redesign Grant (SRG) Monitoring Site Visit. We also reviewed media
material as well as LEA performance data to understand the context within which the turnaround
occurred. Consistent with Yin’s (2009) description, document analysis in this research was not
intended to provide definitive findings, but rather to allow for inferences to be made that could
lead to further investigation via other sources of evidence. In this study, document analysis
served to develop further understanding of the LEA, which provided context for the findings.
Document analysis beyond the policy itself involved different roles in each of the individual
studies and is described where applicable.
Drawing conclusions. As we analyzed the data, one way we tested our conclusions was
through structural corroboration. Eisner (1976) highlights the importance of structural
corroboration in his discussion about educational criticism.

52
Structural corroboration is a process that seeks to validate or support one's conclusions
about a set of phenomena by demonstrating how a variety of facts or conditions within
the phenomena support the conclusions drawn. It is a process of demonstrating that the
story hangs together, that the pieces fit. (p. 148)
Although Eisner refers to the process of validating the evaluation of educational practice, this
concept applies to the analysis of data in this study. Because we were intent on ensuring
conclusions were substantiated through the data, we compared what interviewees said about the
various issues within the research topic, with each other, and with observational and document
data. Through this comparison of data, we were able to understand how individual pieces of data
fit together in order to lead to coherent conclusions, particularly relative to the overall
recommendations.
Limitations
The major limitations of this qualitative research were researcher bias, generalizability,
and reliability. We discuss below how these limitations were addressed through the
methodology.
Researcher bias. The role of researcher bias was a consideration in this study,
particularly since all of the researchers currently hold positions as practicing educators
responsible for the implementation of education policy. In at least two cases, researchers were
specifically responsible for the implementation of school turnaround policy. A key component of
qualitative research is that it values direct observation and data gathered from interactions
between the researcher and the research subject. The researcher becomes a research instrument
and therefore brings their own lens to the data collection and analysis. Yin (2011) argues that,
“No lens is free of bias; every lens has subjective and objective qualities” (p. 270). Researchers

53
must maintain a high degree of awareness and self-reflection about the qualities of any “lens”
that might influence either the collection or analysis of the data. In particular, use of interviews
as a source of evidence in qualitative research can strengthen the data collection process as it
allows for targeted questioning. However, it also has inherent weaknesses of bias in self-
reporting, recalling inaccuracies due to time-lapse, and reflexivity, where the participants report
what the interviewer wants to hear (Yin, 2009).
Miles and Huberman (1994) identify two additional sources of researcher bias: (a) the
effects of the researcher on the case and (b) the effects of the case on the researcher. In the first
case, the presence of the researcher can serve as a disruption to the relationships and dynamics
that exist in an institution. In the second instance, the researcher can be seduced by the
environment or the participants. As a result, they might draw conclusions or inferences that may
be influenced by the bias they have developed rather than the facts and data they have collected.
Miles and Huberman (1994) recommend several strategies to mitigate the effects of bias (a) and
bias (b) such as: seeking feedback from colleagues on potential areas of bias by sharing field
notes and observations, purposefully selecting participants who represent dissident voices,
maintaining a focus on the research questions to avoid becoming distracted by other leads, and
paying attention to the possible effects the interview location or the interview process itself may
have on data collection. With these recommendations in mind, through the collaborative coding
process, we discussed at length the themes we were identifying and where our bias may have
filtered in. This helped us to keep our analysis as close to the data as possible, without being
heavily influenced by our biases. In addition, we had dissident voices in our selection of
participants, which we incorporated into our analysis. Similar to the data collection methods, bias
is addressed more specifically in each of the individual sections.

54
Generalizability. One criticism of a single case study approach is that external validity is
weak because the findings may not be generalizable. In comparing single and multiple case
studies, Yin (2009) cautions that using a single case study could have less weight than multiple
case studies and perhaps offer less theoretical replication. As we began to design this single LEA
case study, we knew that generalizability could have been an issue in that the findings may not
have been clearly applicable to other LEA's going through the turnaround process as required by
policy, because conditions between LEA’s vary. This dissertation-in-practice research brought in
the use of theory to help address this limitation of external validity.
The theory centered on the relationship between policy sense-making and implementation
in the context of turning around an underperforming school. That is, the complexity of the
process of policy sense-making, as previously outlined in the theoretical frame of this research,
along with the inherent difficulties of chronically underperforming schools, challenges
implementation of that policy by implementers. With this research design, we aimed to
understand what it meant to be a school going through the turnaround process through the lens of
policy sense-making and implementation. The theory helped to address external validity because
the findings might be generalizable to a broader theory that in turn may be applied to other
contexts. Yin’s (2011) explanation of analytic generalization highlights the importance of the
role of theory in the study in terms of generalizing the findings.
The argument needs to be cast in relation to existing research literature, not the specific
conditions in the actual study. In other words, the goal is to pose the proposition and hypotheses
at a conceptual level higher than that of the specific findings (Typically, this higher level might
have been needed to justify the research importance to study the chosen topic in the first place)
(p. 101).

55
Also helpful to the validity question was how the researchers describe the case. Merriam (1998)
discusses ways of addressing validity, including providing a rich, thick description that shows
that conclusions are reasonable and make sense. In other words, the more thorough the
description of the LEA, the more accurate conclusions would be. The aim of the research was to
provide a detailed description in order to support findings drawn from the data, to allow others to
make their own connection to the study’s conclusions. In this way, the reader would determine to
what extent the findings can be transferred based on the thorough description of the context and
its findings in the case under study (Merriam, 1998). Through a detailed depiction of the case,
this study increased the likelihood the reader would be able to determine whether or not the
findings are transferable to another situation where turnaround policy is being implemented.
Reliability. For case study research, reliability is achieved through specific
documentation of the research process. Yin (2009) points out that case studies that use a protocol
and database have stronger reliability. The protocol is the data collection instrument along with a
specified set of procedures to be followed. A database is developed from the data collection
instruments. Both of these help make it possible for another investigator to replicate the research
procedures. This research study used a protocol that outlined the procedures of all data collection
instruments, including the interviews, observations and document analysis. We also used the
qualitative research software, Dedoose, as our database for interviews, where we were able to
code and analysis transcripts.
In addition we ensured our data quality through a rigorous assessment of our analysis and
conclusions. Miles and Huberman (1994) offer a model that involves thirteen tactics that will
help address this need for a demanding approach to drawing conclusions from the data. These
tactics involve a process of checking the quality of the data, analyzing exceptions to patterns, and

56
checking with skepticism emerging explanations. For this study, the researchers focused on the
following four tactics:
1) Checking for representativeness - Ensuring that the data coming from your sources is
representative of both confirming and dissident voices;
2) Weighting the evidence - Accounting for the fact that some sources provide stronger data in
the analysis based on the participants’ roles, knowledge about the turnaround policy, and their
level of involvement in the work of turning around the school. This weighting of evidence may
differ in the analysis of each individual section because we each focused on a different
implementer group.
3) Checking the meaning of outliers - Scrutinizing outlying data to make sure that analyses to
test the generality of the finding and protect against self-selecting biases;
4) Checking out rival explanations - Keeping in mind a few possible explanations until one
emerges as more compelling as a result of stronger evidence derived from additional data
collection.
These tactics provided a guide for us to analyze the data, identify themes and draw
conclusions. Using all of these tactics, along with the CQR collaborative data analysis approach,
helped us to ensure the validity of our conclusions and alleviate the biases that may have arisen
in our analyses. It also helped us ensure that the narrative we told in the end fit the data we
found.
Chapter 4
Teachers
Author: Jamie Chisum

57
Problem Statement
This study sought to describe the situation of teachers in level D schools. It looked at how
the perceptions and understanding of the district’s turnaround plan has affected the staff’s
motivation and actions to create sustainable student achievement gains. This section was used to
study the teachers’ overall understanding of the turnaround policy and plan, while also
examining teacher attitudes and motivation to implement that plan. The point of this research
was to use the theoretical frame of sense-making by describing the complexity of it for those
furthest along the implementation chain – teachers. Certainly, the effect of the state’s turnaround
legislation on students and their success or failure is the ultimate goal of the turnaround
legislation, but the premise of this study was that the teachers do the work most directly related
to student achievement.
In this research I examined the agency of the teacher as “implementer” (Honig, 2006), in
an attempt to identify the conditions that are necessary for success. It was not my intention to
study the process of sense-making for its own sake, but rather to use sense-making as a tool to
better understand what is helping and what is hindering the teachers' work in turning around their
chronically underperforming school. As stated in the larger study, literature on turnaround
schools in general suggests the need for a clearly articulated shared vision, the role of teacher
voice through inclusion in the process, and ongoing professional support as key factors to the
success of turning around chronically underperforming schools. In this research project I hoped
to describe the extent to which these factors or others exist for teachers as the school and district
seek to create sustained improvement of student performance. In this section I interviewed
teachers who worked in a school that was formerly a turnaround school and teachers in a school

58
currently undergoing turnaround. Additionally, I analyzed the interviews of implementers at the
building leadership and central office levels about the role of teachers in turnaround.
Research Questions:
1. How do teachers make sense of the turnaround policy?
2. How does teacher sense-making affect their implementation of the policy?
a) What factors influence teacher sense-making?
The Role of the Teacher in Successful School Turnaround
There are certainly good reasons for external pressure on turnaround schools, however
forced outside changes are only structural and cannot change the values and beliefs of the people
within them (Hargreaves, 1995; Murphy & Meyers, 2008). Clearly, that is why so many of the
restructuring models call for dramatic excising of staff and principals. Yet, replacing up to fifty
percent of the existing staff (as is possible under the provisions outlined in the Race to the Top
School Improvement Grant requirements) in what are often high poverty areas is not an easy
task. Replacing them with a high quality effective staff is even more difficult (Adeleman &
Taylor, 2011). Many of the applicants for jobs in high poverty and low performing schools tend
to be new teachers, and in the case of many urban schools, they are teachers who have been
shuffled from other parts of the district because of union rules about bumping rights (Murphy &
Meyers, 2008). Just holding on to teachers in a turnaround school is a challenge, because highly
qualified teachers who are allowed to remain at their schools may choose to leave the crisis. Not
enough is known about why teachers choose to leave failing schools and human resource
departments sometimes don’t even do exit interviews to find out, but there is often a high

59
turnover rate regardless of excising (Payne, 2008). Teachers might choose to leave because their
job continues to be threatened by closure, restart, or by being taken over by a charter school if
the improvement benchmarks aren’t reached quickly enough. This is often the staffing
environment schools face as they begin the work of trying to create sustained improvement in
their chronically underperforming school.
Motivation. District and school change clearly takes the work of many people to make
happen, but the change has to start with teachers because they have the most direct influence on
students (Duke et al., 2008). In Turning Around Failing Schools, Joseph Murphy and Coby
Meyers review turnaround literature from the business world to see what lessons can be gleaned
from those experiences. They cite writer after writer who state that the people in the turnaround
situation are the most valuable resource, but the hardest for turnaround leaders to evaluate. They
write, “The first lesson about the organizational work ethic in turnarounds is that people are the
essential ingredient in recovery” (Murphy & Meyers, 2008, p. 226). Managers and workers alike
need to be assessed to see if and how they can be most useful in the turnaround process and
beyond. Leaders have to instill hope and confidence in teachers in order for the work of a
turnaround to even be attempted (Murphy & Meyers, 2008). There is a human element to turning
around schools, and therefore the emotional impact of reform efforts on teachers must be
considered in order for the changes to be successful. As described in the larger study above,
Bandura posits that teachers need to feel a sense of self-efficacy in order to be motivated. They
have to believe they have the opportunity to succeed in their given task (Bandura, 1994). The
school leader must take into account how it feels for teachers to go through a change process in
such a stressful environment (Evans, 1996; Norman, 2010). As Michael Fullan writes, “Take any
hundred books on change, and they all boil down to one word: motivation” (Fullan, 2006, p. 35).

60
Whether it is the new principal or the staff, someone must be a motivator. The people they need
to motivate most to create an effective turnaround culture are the teachers. This can prove a
daunting task. Michael Fullan cites A. Deutschman’s work, Change or Die, that describes how
the odds of a person changing the way they live their life, even after being told they must do so
or die, are nine to one against their doing so (Fullan, 2006). With those kinds of odds, what
chance does a turnaround have in being successful? This is where the federal and state mandates
that threaten the elimination of jobs, the closing of schools, and even the public shaming
associated with turnaround schools can serve a purpose (Duke, et al., 2008). In an article about
the Harley Davidson motorcycle company’s turnaround, Rich Teerlink referred to Maslow’s
famous theory that people rarely engage in something imposed upon them if there isn’t a crisis.
He goes on to write, “But they will commit to a program they help create” (Teerlink, 2000). The
threat of loss of employment and school closure serve to introduce a crisis into the turnaround
school. Since the most important resource a turnaround has to engage are the teachers, it is
essential to take advantage of the combination of tight control typified by theory “E” and the
loose distribution of power found in theory “O” in the creation of an effective school culture
(Fullan, 2006; Leithwood, 2010; Wiseman, 2010). Theory “E” says that the way to run an
organization is to exhibit tight control measures and manage it from the top down. Decision-
making is centrally located and the workers have little say in what is to be done. The opposite
theory is “O.” In these organizations leadership is distributed widely and the culture is highly
collaborative with many voices at the table while decisions are being made. In theory “O,”
teachers have more control of the reform efforts. Their attitudes about what they believe their
students are capable of doing trickle down to the students who come to believe the same things
about themselves. There has to exist a culture where teachers and students believe they are

61
capable of making this transformation or the turnaround will fail (Duke, et al., 2008). Charles
Payne posited a third possibility, that any true reform efforts need a mix of pressure and
democratic process, first to make it happen and second to make it work (Payne, 2010). The
pressure equates to theory “E” which forces implementers to respond to the crisis at hand. The
democratic process is equivalent to theory “O” which states that no reform will be sustainable if
the implementers do not eventually have a voice in the reform process.
Collaboration. One of the key factors in assessing the capacity of any school to change is
the amount of collaboration in the environment. One way to ensure success at this initial stage of
turnaround is by recruiting teachers who seem excited by learning new ways to improve to be a
part of the school’s planning team (Duke et al., 2008). Staff is encouraged to stay or even join a
school where they know they will have a voice in decision-making and the ability to be leaders
themselves (Bryk, Sebring, Allensworth, Luppescu, & Easton, 2010; Duke, 2010). Districts
simply cannot turnaround schools without the help of the teachers. The hurdles in the way of
improving schools are many and complex, so the work of the turnaround principal is to delegate
as much of the work as is warranted or else risk failure from sheer exhaustion alone. Creating a
culture where leadership can be shared makes the job doable for the principal, but also makes the
work more meaningful for the rest of the people involved. “Sustainable leadership spreads. It
sustains as well as depends upon the leadership of others” (Hargreaves & Fink, 2006, p. X).
Hargreaves and Fink (2006) note that an essential feature of distributed authority is not only that
leadership is distributed to teachers, but also received by them. Distributed leadership can be
achieved through staff involvement with induction programs, project management, mentors, and
coaching opportunities for veteran teachers (Duke, 2010). There are many advantages of
distributing leadership to include teachers. When teachers are part of the planning they

62
understand the vision of the change proposal better. Because they are involved with the nuances
of the school and the students who attend it, they will be the first ones to experience the effects
changes when they are implemented. Teachers may therefore have some of the best ideas for
improving the school themselves. When teachers are part of the planning, they also feel a greater
sense of ownership of the improvement projects, and when it comes time to implement the
solutions they can be more efficient at doing so (Murphy & Meyers, 2008). When teachers are
part of not only implementing the project, but were also a part of its creation, then it is more
appropriate for a principal to hold them accountable for the quality of that work. There has to be
a mechanism for removing teachers who are unwilling to do the work of the school improvement
plan. If the teaching staffs of turnaround schools were wise enough to simply fix the schools on
their own they would have likely done so already, so accountability for their actions remains a
necessity. A turnaround leader cannot simply find out what the staff wants and do that. Charles
Payne reminds his readers:
We know that our toughest schools are demoralized. They have weak organizational
infrastructure; infrequent professional interaction among teachers; low levels of teacher
agency, conditioned by a set of negative ideas that many teachers hold about urban
children – ideas tinged, at least, with racial and social-class stereotypes. If those are the
social conditions under which we are working, it seems very strange to think change can
be entirely voluntary. We cannot go into schools where many, if not most, of the
professionals have come to believe the job is impossible and expect to make change by
asking for volunteers. (Payne, 2010, p. 196)
There must be accountability for teachers, even when leadership is distributed. Principals have to
be wary of staff leadership that is selfishly motivated rather than looking out for what is best for

63
students and they have to be up front with teachers about what will happen if student and teacher
performance does not improve (Duke, Tucker, Salmonowicz, Levy, & Saunders, 2008; Fullan,
2006). Student performance has to be the goal of turnaround, not the popularity of the leader; a
strong teacher culture of collaboration is a means to that end (Reeves, 2009). In a turnaround
school, collaborative opportunities are one of the few human supports that make it possible for
teachers to endure the work under these stresses.
It is perhaps more important to build in systems of collaboration for teachers in
turnaround schools where more prescriptive measures of reform often have the effect of
promoting teacher burnout and producing changes that are not sustainable (Hargreaves, 2004).
One key factor in determining the proper balance between the strong leader and distributed
leadership can be gleaned from Leithwood, who posits teachers working under the duress of
turnaround threats (such as the loss of their job) often perform more poorly than they did prior to
the inception of turnaround. He says it is essential for principals to gain teacher trust through
relationship building and empowerment to combat this condition (Leithwood, 2010). Building
relationships is as important as collecting data during this phase and successful turnaround
leaders tend to be men and women who understand people and possess relationship-building
skills (Murphy & Meyers, 2008). Elmore argues that the only way to get staff to internalize
expectations is for a principal to spend the time building relationships with teachers one-on-one
(Elmore, 2004). In studying the turnaround of the Duke medical center in 1996, Jon Meliones
came away with the following insight, “… there is a fine art to communicating with
professionals who know more than you do about their particular subject... You can’t just order
them around. You have to get inside their heads and figure out what they’re going through”
(Meliones, 2000). One of the things multiple researchers suggest to turnaround leaders is the

64
importance of getting a few quick wins early in the turnaround process to show the staff that
progress is possible and that the principal is capable of getting it done (Duke, 2010; Reeves,
2009). Daniel Duke stresses the importance of the new principal winning over the trust of his or
her new faculty by learning the culture of the school, how things have been done, and evaluating
what the relative strengths and weaknesses are. Duke sites an unpublished doctoral dissertation
by Britz (2007) that looked at new middle school turnarounds and found that according to
faculty, 83% of the new principals established credibility in the first 90 days of being on the job.
It is essential in this first phase that principals are out of their office and around the building.
They need to be observing the teachers at their work and having conversations both formally and
informally to come to a deeper understanding of the organization (Murphy & Meyers, 2008).
During this time the leader must put together a team who can make both emergency plans that
focus on the short term and have an eye towards how a longer term strategy will be developed
(Murphy & Meyers, 2008). Murphy and Meyers suggest that the initial emergency plan be for a
period of the first six to twelve months at the longest. This urgency of time actually fits well with
the urgent schedule imposed on turnaround principals to get the job started. One of the fears is
that the reforms imposed during the early stages can have a negative impact on staff morale and
engagement. “If truth is the first casualty of war, then trust is the first fatality of imposed reform”
(Hargreaves & Fink, 2006, p. 212). The level of relational trust in a turnaround school is directly
related to how successful a school will be in improving and sustaining that improvement. Trust is
the glue that holds together the faculty trying to engage in turnaround. They are more likely to
take on conflict, they will be more willing to change their practice, and more of them are likely
to engage in the work of reform when there exists a high degree of relational trust (Byrk et al.,
2010). In a longitudinal study published first in 2003, Byrk and Schneider linked evidence of
65
growing relational trust they found by surveying school stakeholders with growth in student
performance data for several schools in Chicago. They found that there were four specific
considerations when it came to trust; respect, personal regard, competence in core role
responsibilities, and personal integrity (Byrk and Schneider, 2003). Even in business models,
some of the key recommendations are around establishing shared organizational values and
defining the culture in such a way that turnaround improvements can be maintained (Murphy &
Meyers, 2008). Hambrick and Schecter wrote that the initial moves in a turnaround organization
are about “doing different things” rather than “doing things differently” (Hambrick & Schecter,
1983, p. 232). This is a subtle but important distinction for the work of a turnaround schools.
Teachers must be asked to do things they weren’t doing before the turnaround process began and
in order to get them to do that they have to be trained how to do these different things and they
have to trust that doing them will make a difference. Teachers are much more likely to do things
such as work outside the bounds of their contract if they feel someone genuinely cares about
them on a human level (Byrk et al., 2010).
Teachers with leadership responsibilities can help create a culture where everyone better
understands their role in the turnaround process. Murphy and Meyers cited a 2000 study by
Borman that compared the difference between a school that implemented “professional control”
where teachers had a say in the leadership of the school, and one where “administrative control”
was tried. Borman’s study found that the turnaround school using professional control had an
increased rate of attendance and higher reading and math scores than the one with administrative
control (Murphy & Meyers, 2008). Distributed leadership can also lead to greater internal
accountability and school wide capacity (Elmore, 2004; Fullan 2006). A culture of distributed
leadership also allows for new leaders to be grown from within the organization that can help

66
substantially in sustaining the vision and mission of the turnaround improvements (Fullan, 2006;
Hargreaves & Fink, 2006). The research indicated a relationship between distributed leadership
and student outcomes probably because the teachers are more authentically engaged in
improving their practice (Duke, 2010). So a measure of “professional control” can help to
balance the “administrative control” that is being used to hold the school and teachers
accountable for the current crisis. Since many teachers are fired in a turnaround school and the
ones that remain were there when the school began to fail in the first place, new turnaround
principals are likely to find their new staff is initially unprepared to take on the work of
distributed leadership, even if they are willing to do so. Some of these teachers are new to the
profession and for others the tasks of distributed leadership are simply responsibilities no one has
given them before (Payne, 2008). Distributed leadership, when coupled with the establishment of
relational trust as described above, can help to improve teacher investment and engagement
while lightening the load of leading turnaround on any one person, but only if it is established
and supported through communication with the principal and ongoing professional development
support.
Professional Development. Teachers require substantial professional development in
order for change to be sustained in a turnaround school. Research suggests that teachers in
turnaround schools tend to be underprepared to even be in the classroom and are most often
inexperienced (Murphy & Meyers, 2008). Staff needs to believe they either can, or can be trained
to, effectively meet the needs of students in the turnaround school (Duke 2010; Murphy &
Meyers, 2008). For teachers who have spent a considerable amount of time in underperforming
schools there can be what Duke calls an “undermining of self-efficacy” (Duke, 2010, p. 67) and
across the staff this can lead to a collective lack of efficacy that undermines the ability of the

67
whole school to reach kids in crisis. Staff confidence comes from building it up within the
specific areas of need for the specific school in which they work (Duke et al., 2008). Staff
development must be contextually based in order to be effective enough to build confidence and
efficient enough to meet the time pressures of the turnaround context (Elmore, 2004). Here
again, there seems to be a need for balancing the specific needs of each school context with
research proven methods of school improvement like data-driven instruction. Duke recommends
three areas for principals to focus on during the initial professional development phase. The first
is in curriculum alignment with the state standards or common core. The second is in looking at
staffing to ensure teachers are being used in their greatest areas of strength, for example, having
your strongest teachers teaching the students with the highest academic needs. The third is in
actual instructional interventions that will meet the specific areas of need for the students in a
particular school (Duke, 2010). Academic improvements have to remain the focus at all times,
not only because it is how the school will be judged by people on the outside, but because it is
ultimately the proper goal for all schools. In many situations there is a great need for teachers to
learn cultural proficiency in order to understand the diverse needs of the students who attend
turnaround schools (Duke et al., 2008). It is essential that teachers understand who they are being
asked to teach just as much as what they are being asked to teach them. Murphy and Meyers
suggest their own three areas for professional development: (1) the development of individual
skills, (2) the development of highly skilled teams, and (3) skills needed for understanding the
organization itself (Murphy & Meyers, 2008). Often expert groups come from the state or can be
paid to consult at the school from federal grant money and these groups can be helpful in
providing expertise to support the teachers in this endeavor (Murphy & Meyers, 2008). However,
Fullan argues that these outside consultants don’t stay long and that when you couple that with

68
the fact that most turnaround principals do not last long either, this is hardly a recipe for
enhancing sustained improvement for turnaround schools (Fullan, 2006). However, professional
development of this type can prove more successful because teachers have the opportunity to
practice their new skills with their own actual students and with their colleagues through
distributed leadership opportunities. By working together with colleagues, not only are skills
improved, but so too is the relational trust between teachers who display competence, sincerity,
and reliability (Bryk and Schneider, 2002). When teachers engage in professional development
that they can apply in their actual practice, it is more likely to be successful (Elmore, 2004). This
is especially valuable when teachers are able to analyze data created from their newly acquired
skills so they can truly appreciate the implications of that data for their teaching and for student
learning (Slavit, Nelson & Deuel, 2013). Increased confidence and trust among the teachers are
what allows them to take on leadership roles throughout the school and be able to maintain
lasting improvements. Richard Elmore’s famous theory of the “reciprocity of accountability”
says that teachers will be unable to meet new performance expectations unless administrators
support their learning (Elmore, 2004). The demands on teachers in turnaround schools are
tremendous, so Elmore’s theory of reciprocity says that the professional development necessary
to support them must be tremendous as well. There must be specific learning objectives for
teachers just as there are for the students. Elmore’s theory also indicates that when teachers feel
they are being adequately supported through professional development they also feel valued and
are more likely to have trust and confidence in both the people and the process involved in
school turnaround. Professional development helps with the capacity to turn around schools, not
just because of the increased level of skill in the participants, but also in the effect it can have on
the culture because everyone is expected to improve, they have confidence they are able to

69
improve, and they have a strong understanding of the vision for where the school improvement
efforts are going (Murphy & Meyers, 2008). An elementary teacher who was part of an Ontario,
Canada turnaround project said the following about the importance of professional development
for teachers: “If you had to let something go, I’d say give up some funding, but you need that in-
servicing. If there’s not someone there providing it, then you’re a boat without a keel, without
steerage” (Leithwood, 2010). Authority of expertise should trump both authority of experience
and authority of position when it comes to improving student learning (Elmore, 2004). In their
conclusion, Murphy and Meyers (2008) write, “Cooperation and human development are two
elements of capacity building that failing schools sometimes lack but need to move forward” (p.
322). Even the support some turnaround schools receive from federal and state improvement
grants is not enough. Turnaround schools must find ways for teachers to learn from and with
each other in networks because outside support is only going to be available for a limited amount
of time.
The literature focuses on balancing what the writers refer to as Theory “X” or
“administrative control” that typically happens at the start of a turnaround crisis and Theory “O”
or “professional control” that they suggest can begin to be effective as leadership is distributed.
The literature also points heavily to the need for the establishment of trust between all the
implementers. This trust is established when people take the time to work together to
demonstrate what Bryk and Schneider call competence, sincerity, and reliability (Bryk &
Schneider, 2002). When trust is established, leadership in the school can be distributed from
principal to teachers and from teachers to each other. The literature also strongly suggested that
this relational trust is often formed during the necessary work of professional development.
When teachers feel they have been trained properly to do the work being asked of them, they

70
also feel valued (Elmore, 2004). When they see this work being done by their colleagues, they
can feel the culture of the school gaining positive momentum towards student improvement. The
literature also suggests that one specific skill that is necessary for teacher professional
development is the ability to use assessment data to inform their instruction.
What is needed in the turnaround literature is an understanding of the teachers'
experiences in a school undergoing a turnaround process from their viewpoint. It is clear from
the literature that there has been an emphasis on the principal and the essential work of the
building leader in the creation of sustainable school change that balances the goals of the reform
mandate and the voices of teachers. There is even a widespread argument that the turnaround
principal needs to work closely with the staff and bring them on board with the mission and work
in order to be successful. We know from the literature cited that schools are more successful
when teaching staffs are motivated, collaborate with one another, have appropriate leadership
responsibility, and are highly trained to meet the specific needs of their school. Much could be
gleaned from hearing more from the teachers themselves in this process. Since the work of the
school turnaround is so contextually based, it is valuable to hear from the original teachers who
remain in a turnaround school, as well as those teachers who have been added to the staff.
Teacher voice can provide valuable insights about the successes and failures in turning around
chronically underperforming schools.
Theoretical frame
The theoretical frame for this individual study applies the role of sense making to the
views of teachers in a district engaged in the process of implementing state turnaround
legislation policy. I used the specific concepts of social capital, reconstruction, and co-

71
construction to analyze teachers' understanding about what is being required of them and what
they actually do.
Social Capital. Social capital, as defined by Smylie and Evans, can be divided into the
areas of trust and channels of communication (Smylie & Evans, 2006, p. 189). Trust is often
based on teacher networks or learning communities where teachers share common values and
beliefs, such as "all students can learn" (Slavit, Nelson, & Deuel, 2013). Similarly, channels of
communication include not only the formal lines of communication, like missives from
principals or department heads, but also who teachers talk to informally in the staff room or at
lunch. Depending on who teachers communicate with and trust, social capital helps or hinders
the implementation of turnaround policy.
Reconstruction. Reconstruction refers to what Spillane et al. (2006) describe as the
combination of newly communicated information with the teacher’s previous knowledge. The
two are combined to form a new understanding that is reconstructed knowledge. The teachers in
turnaround schools combine what is being asked of them with their experiences as teachers,
often in the same school, to determine whether they will adopt the new directives, adapt them, or
even ignore them.
Co-‐construction. This topic deals with two important factors in policy sense-making. The
first involves Amanda Datnow’s (2006) argument that co-construction occurs as the policy is
communicated down the policy chain. Each communicator re-constructs the information and
passes it along until it reaches, in this case, the teachers at the end of the implementation line. In
this way the policy is not only reconstructed from the receiver’s previous experience and
understanding, but also co-constructed by what the last person in the chain has chosen to share
about it. The second aspect of co-construction, according to Datnow, is that co-construction is

72
heavily influenced by the context in which the policy is being implemented. When people
implement policy, their thinking is shaped by the situation and environment that surrounds them,
which in turn influences the actions they take to implement policy.
Each of these notions about policy implementation are useful in understanding how
teachers make sense of the turnaround policy in their district. By being able to recognize when
teachers are engaged in reconstruction or co-construction and how social capital impacts their
thinking helps me to better understand what teachers say and do about the work of turnaround.
This theoretical lens also enables me to understand the choices teachers make about their work
and how this work is viewed by other implementers.
Methodology
Sample
I interviewed teachers in two turnaround schools. One of the schools was removed from
chronically underperforming status just two months prior to the beginning of my interviews. The
other school was designated as chronically underperforming that same week. I wanted to learn
from teachers who remained in the school after excising because I thought they would have an
interesting perspective about making sense of the turnaround policy in a school they knew so
well. I did speak with some teachers at both the newly designated and the turned around school. I
also interviewed a new teacher in the newly designated building which resulted in a fresh
perspective on what she found upon her arrival at the school. I would have preferred to choose
my participants at random, but I needed the assistance of the building principal in the turned
around school in order to schedule the interviews. I was able to secure two interviews at the
newly designated school after introducing myself at the end of a local stakeholders planning

73
meeting for their turnaround. I followed the methodology outlined above for the larger study but
developed my own codes and themes from the data.
Data Sources
Interviews. As a research team, we constructed our interview protocols in such a way as
to collect data that might be relevant to each implementer group. I began with the same start list
of codes that arose from the sense making framework and then developed emerging codes that
might apply to the role of teachers during the implementation of the state’s turnaround legislation
policy in the given district. In particular, I was interested in looking for evidence of a shared
vision of the turnaround, capacity building through professional development and other supports,
and the inclusion or exclusion of teacher voice in the creation and ongoing adaptation of the
official plan. My hope was to be able to interview at least eight teachers for this research study. I
was able to interview ten. The methodology also required some follow-up interviews as new
questions emerged from my data. In those cases, the follow up questions were answered through
email exchanges with the participants.
Document Analysis. Some information for this study was located by examining the
assessment data for the two schools. By reading local newspaper articles about the two schools’
public interactions concerning the state’s turnaround policy, I was able to examine local media
descriptions of the turnaround process to see if there were descriptions of the roles of teachers in
the school’s designation as a level D school, and their role in the implementation of a policy
intended to pull them out of turnaround status. I examined both through the process of document
analysis outlined in the larger study.

74
Observations. I was able to observe a local stakeholders' meeting for the newly
designated school, which involved identifying the factors most responsible for the school’s low
designation. I also attended three different school board meetings in order to better understand
the context of this local education agency and how the board and superintendent addressed the
turnaround requirements. Both observations were useful for triangulating data from the
interviews and documents about the teacher role in implementation. I also collected more casual
observation data while at the school to conduct my teacher interviews. The observation data
helped me to understand certain struggles that played out across different levels of implementers
and deepened my understanding about the role of social capital, reconstruction and co-
construction in the local education agency.
Data Analysis. I interviewed ten teachers. Triangulating teacher interviews with
observations, group interviews with building-based leaders, central office administrators, and
school committee members about teachers, and the document analysis enabled me to construct a
rich and accurate description of the school and district. This study relies on the accuracy of this
description about how teachers made sense of the work they were being asked to do and how this
played into the implementation of the state’s turnaround policy. The description was intended to
find out how closely the reality of how the teacher made sense of what they were being asked to
do in turnaround matched with the intention of the policy, which is to raise the level of student
achievement.
Validity of Findings
Because I worked as a member of a four-person research team I had the advantage of
using my fellow researchers to examine my work and fthe indings from the data. I collected my

75
interview data separately from the other researchers, but had access to our complete set of data
through an online database called Dedoose. We employed a process described by Hill et. al
(1997) as consensual qualitative research were a team of researchers engage in a process of co-
analyzing data. We were all familiar with the data sets from our work in the larger study, and my
research partners reviewed my findings about teacher perspectives, challenged my thinking, and
let me know if they thought I was on the right track. We met weekly throughout the past year to
prepare for our study and we continued to meet through the analysis and writing phases in order
to pull together our umbrella study. Sometimes those meetings were through online video chats,
and other times we met in each other’s homes or the Boston College library.
Limitations
The size of the sample no doubt was a limitation to my study, as well as the size of the
district and schools I was able to access. There were a limited number of local education
agencies within the Northeast region that had chronically underperforming schools and an even
smaller subset of them who were willing to let us use them as subjects for our research. My hope
was to make up for the lack of numbers with a depth of understanding. I felt the more accurate
description I offered my readers of the turnaround situation from teachers' perspectives, the more
the results might resonate with the reader.
Another limitation was that I come to this work as a practitioner who has never worked in
a chronically underperforming district. In fact, much of my career has been spent working in an
affluent, high performing district. In one sense, I brought fresh eyes to the project and very little
sense of the fatigue that comes from working in schools with these stresses. My experience
allowed me to bring a rich comparative analysis to the findings. On the other hand, I lacked the

76
experience to perhaps fully understand the situations that were described to me. I had to work
hard to triangulate my data to be sure the picture was accurate since I could not rely on my own
work experiences. As much as I wanted to represent the teacher’s voice in the turnaround
process, I needed to be sure I really understood what they were saying and why they might be
saying it so I could represent it accurately. In order to do this, I followed up my interviews with
probing questions when necessary. I vetted my assertions with my research partners from the
larger study so they could challenge what might have been easy assumptions from both their own
data about the same district, as well as their own experiences working in level C and D schools.
This was all part of the modified CQR process I described above and that was written about in
more detail in the umbrella study.
Findings
Finding One: The Initial Stage of Turnaround: Directive Leadership to gain a “Shared Vision”
The teachers I interviewed talked a great deal about building-based leadership,
particularly principals. These teachers felt that the principal of the turnaround school needed to
have the power to hire and fire teachers at will in order to create what the literature terms a
“shared vision.” One teacher from the turned around school noted, when referring to the
principal, that it was either “her way or the highway” at the start of the plan. The teachers I
interviewed described that the turnaround process began with tight control and very little teacher
voice in the process. There was a brief period after the local stakeholders group had been formed
when teachers were able to discuss what was wrong at the school and what needed to be done to
fix it. Once the recommendations from that group had been submitted to the superintendent,
however, there was no opportunity for teacher voice until well into the school turnaround process

77
itself. There was not a precise marker for when teacher voice comes back into play, but from
their perspective, teachers don’t have any say until the building principal is sure they are on
board with the shared vision he or she is promoting. Up until that point the teachers felt the
building principal was under a tremendous amount of pressure to develop a vision about how to
fix the school and to eliminate any teachers who were not willing to do the work asked of them.
At the newly designated school, teachers felt they had been consulted about what their school
needed in order to improve, but they did not feel included in the planning about actually
improving it.
One finding is that during the initial stage of a turnaround the situation is so dire that
there is perhaps no room for debate. Interestingly, the principal at the middle school formed her
staff in 2005 and the school did not achieve turned around status until the fall of 2013, a year
after she had to retire for personal reasons. If she had been under the requirements of the current
regulations, she would have failed the time restrictions despite her notion that it should be "her
way or the highway." One teacher made sense of her style of doing things this way, “She could
be very gruff and for some people that was off putting. She had a vision, I guess, and she made
sure that we shared the vision.” Another teacher said, “She was very, very down to earth, very
much this is our mission, this is what we’re doing, we’re all doing it. She had some latitude in
terms of hiring and firing. The union really couldn’t protect you if she wanted to get rid of you if
you weren’t doing your job.” A member of this district’s central office staff who was interviewed
for another part of the larger study, understood the initial stage of implementation this way:
The bar is set high, and that comes from the superintendent down. If there is a principal
that is not setting the bar high, the principal doesn’t last in the District, and if there are
teachers who aren't coming on board to the high mark and the high expectations, they

78
don't last in the District, so we have a high turnover rate, but I can't say if that's a good
thing or a bad thing. That might actually be a good thing.
The principal from the newly designated school agreed with the need to change out staff who
can’t live up to high expectations. She described the teachers at the school this way, “They’re
beginning to see the hard work that we’re going to be assigned to for four years, and not
everybody’s up for that, and not everybody can handle it, and that’s okay, too.” As a result, she
noted that,“… the biggest thing right now is staff. If I had the people, it would work so much
better.” This principal indicated that if she had people who agreed with her, the plan she was
trying to put in place would work more smoothly and easily. It appears that the work of turning
around a chronically underperforming school is so difficult there is the need to have a staff in
place who are up to the task at hand. Teachers understood that this was how the process must
work in order for turnaround to be successful.
From the teacher's perspective, this top down or directive form of leadership at the
beginning of the turnaround process was viewed as a double-edged sword. One teacher from the
newly designated turnaround school described the process over the last month this way:
Immediately, personally, people started fearing for their jobs. And I think the people that
should be fearing for their jobs ARE fearing for their jobs. They’re not stupid. They
know that they’ve been slacking off. They know that their test scores have been in the
toilet. They know that they haven’t been teaching to the best that they can. And I think
that they’re scared. And I think seeing the first round of people go, it scared them even
more. But the fear isn’t making them better, it’s actually making them shut down, some
of them, and they’re not showing that they should be here.

79
The sense this teacher made of teacher layoffs was that some of her colleagues were frozen by
the news and unable to rise to the challenge, even if they had the ability and maybe the will. She
went on to describe how she viewed the current process in which teachers could opt out of the
school:
The day that we found out that we could opt out or that half of us were going to be fired,
or all of us were going to be fired, immediately the tone changed. It was negative.
Everybody, a lot of the older teachers that had been here for a long time, were talking
about well maybe I should opt out, and immediately they were checked out, and I don’t
think they ever came back.
The mindset described here comes at least in part from a fear that teachers could be fired as a
result of their new designation. However, there is no power given to administration from the
turnaround law that takes away the teacher’s union rights to be fired without a process. Power of
this type only comes from the requirements of certain grants that the district had not even applied
for at this point in the process. One of the principals interviewed talked about how she used this
to her advantage when she first arrived at the turned around school. She said, “… no one really
told me what the rules were… I just kind of tried to figure it out. And when I saw that, for
example, the teachers were thinking that I could fire them, I did not disavow them of that. …
They still think that.” This principal used this fear of being fired to her advantage in setting the
tone that teachers needed to be wary of her and what it was she wanted them to be doing at the
school. While this approach of allowing teachers to believe the principal had the power to fire
them at will was clearly unethical, it was also effective, and perhaps even supported by the
central office in the district.

80
Teachers also described other changes that started to take effect in the turnaround school.
One teacher from the turned around middle school described the cycle this way when asked if
teachers had a voice in the process:
Slowly but surely, yes. In the beginning I would say no way. In the middle I’d say
partially and I’d say now definitely. I think that teachers' opinions in the beginning
weren’t necessarily listened to and at the time that made me very angry. But now, looking
back on it, it was one of the worst schools in the state and so why would they listen to
what teachers had already been doing?
This teacher’s view aligns closely with one of the principals interviewed who had formerly
worked at the turned around middle school. He talked about his view of the stages of
implementation, “As that cycle ran its course for the work in early turnaround to be a catalyst for
change and then to build internal capacity and then you phase yourself away.” This “phasing
yourself away” or slowly relinquishing control to your staff, is similar to the perspective that
teachers' voices were not considered in the turned around school until the shared vision of the
principal had been established.
Another view about the principal’s control during turnaround came from teachers'
perspectives at both the turned around school and the newly designated elementary school. One
teacher remarked that she, “… would go into her office and I would want to say something and I
would get it out as quickly as possible and say can I blah blah blah and then I would wait
cautiously for her to either yell or tell me no or yes.” She felt the new principal was a much
better listener and someone she could learn from. Another teacher who had previously been at a
third turnaround school in the district described how early in the process the principal there, “…
got what she want(ed) by throwing keys in meetings, slamming books against the wall, flipping

81
over chairs.” Two of the three turnaround principals referenced in this study were described as
exhibiting this type of intimidating and strict control at the start of the turnaround process.
Teachers definitely had concerns about directive principal leadership. One of the
principals from a level C school described teacher concerns this way, “What tends to happen to
our school is that my teachers don’t feel the support in terms of the baby steps that we’re
making. So they feel that everything is very negative.” There appeared to be a desire for the
building-based leaders to transition from the harsh, staff changing and vision building initial
phase of turnaround to a softer and more understanding listener. The principal at the newly
designated school mixed both of these attributes at the outset of that school’s turnaround. As one
teacher from that school described her understanding of the principal:
If we’re going to come out of this, it’s going to be with her at that helm. She’s been
through this before. She’s smart. She’s realistic. And she’s savvy. And I really think that
she is the perfect person to be doing this with us. She’s there for us all the time. She’s
available 24 … if you need to email her, she’ll get right back to you. She’s welcoming.
Whatever you need, it’s like Vegas, her office. Whatever happens in her office, stays in
her office, and I can’t tell you how good that makes me feel, as somebody that is very
into this and let’s roll up our sleeves, let’s do this, tell me what I can do so I can do it,
show me what to do if I don’t understand it. Let’s do this. And she’s been a huge asset to
this school.
This quotation describes the teacher's desire for the school leader to not only establish a vision,
but also educate the staff and listen to them. The teachers who have been a part of the turned
around school indicate that this process of listening and educating took place after the initial
phase of vision setting. “I think that the leadership change has been wonderful. I think that the

82
previous principal and vice principals were a little old school but only because they had to be
given where our school was.” Another teacher described the contrast this way:
With our old principal… it was you’re going to do it or I’m going to make your life a
living hell, and she did. There are teachers that didn’t do what she wanted and it might
have taken her a year or two, but she got rid of you, maybe to a different school in the
district or, if you were under three years she just laid you off. She was tough. But the
new principal we have is much more understanding and a little more, he gives the power
back to the teachers. He understands that we’re a good staff. He understands that
everyone knows what they’re doing or most people know what they’re doing.
The teachers who have been through the stages of the turnaround process understand that their
opportunity to be heard and nurtured came after the principal used directive leadership and
staffing changes to create a clearly shared vision for the entire staff. There definitely exists
optimism at the newly designated school that a culture of trust can be established as the changes
necessary to turn the school around are made. The newly designated school lacks the advantage
of having been through the process already, but there is clearly hope that the vision setting and
staffing changes can be done with a balanced approach of administrative and professional control
from the principal.
Finding Two: Stage Two focused on Professional Development
The implementers in this district talked about a first stage of turnaround which was
related to getting the staff on board with a shared vision. Once this was achieved, they saw the
next step as the need to increase the capacity of the staff to do the work necessary to improve
their school. Two of the teachers from the middle school who I interviewed together understood

83
the success of the turnaround policy to rest largely on professional development for the staff.
One described the importance of professional development (while the other nodded in
agreement): “You bring somebody in like (our principal) who cracked the whip, told people what
to do and how to do it. I think all stakeholders you have to all be in on it. Again, I feel like
education and professional development is key overall.” They saw the need for the initial stage
of the process, but also don’t think creating a shared vision will turn around the school in and of
itself. The teachers reconstructed knowledge (Spillane et al., 2006) when the administration told
them about their status and what they are going to need to do as a result. The teachers take this
information and match it with everything they currently know about the specific context of their
work to make new sense of the work in which they are engaged. Once the teachers were involved
in the work (as partners on a data team, co-committee members, or simply good colleagues) they
engaged in co-construction (Datnow, 2006) where they made sense of the policy by working
through problems together.
Internal Professional Development
The first layer of professional development involved informing the staff about the
turnaround designation. The initial expectations for the school redesign plan in the turned around
school were communicated from the principal to the staff. One teacher from the turned around
school described how the expectations of the plan were communicated:
… for the most part it was our principal at the time. She would email us and let us know
certain things and stuff like that. I wouldn’t say that the plan, like I said, the plan itself, I
don’t think the inner workings of it....were necessarily communicated to us perfectly. But

84
the umbrella of all the things that it stood for, all the things that are going on, the things
we have to do, why we have to do them, I think that was more what we were focused on.
From direct communication with their principal, the staff at the turned around school began the
sense-making process of what turnaround was about and what their role in the process might be.
Even in the newly designated school, communication came directly from the principal to the
staff. One of the teachers from the newly designated school describes getting emails from the
principal every morning at 4 a.m. From these communications, the teachers needed to reconstruct
what the entire process was about and how it was going to impact what they did. The same
teacher described her sense-making of the plan as forced change:
I think it holds promise and opportunity because obviously whatever was
happening wasn’t working before, and now it’s a forced change. And not only are
they forcing us to change, but they’re actually asking us what we want to change.
Could you get a better gift? I don’t think so. I don’t see any other opportunity
besides burn the school down and starting over brick by brick that you could
really get that much, because some of these people that have been in here 10, 12,
years and they wouldn’t be going anywhere if it wasn’t for this. It would have
never changed on its own. Simple policy changes would never turn this school
around. It’s more than just policy. A lot of it has to do with staff, how they take
the policy and how they implement it.
This excitement and hope comes from a person who doesn’t know the policy, but who does
know her school. She gleaned at least some of this hope from the emails her principal sent to her
each morning at 4 o’clock. One teacher from the turned around school described her former
principal as a “queen” because of all the work she did to bring that school to a better place.

85
Much of the internal professional development took place through the added meetings
that happened at the school once the turnaround process began. Teachers understood these
meetings to be a part of the process of getting better and sustaining the improvement, but did not
talk about it in terms of requirements of the turnaround policy. At these meetings they interacted
with their colleagues and engaged in co-construction in order to come to a new understanding of
what the policy was requiring them to do. In the two-person interview I conducted, one of the
teachers described internal professional development as sharing ideas:
If you’re a new teacher or even a veteran teacher and you go into her room or my room or
one of my colleagues room on this list. These teachers are going to give them ideas. So
everyone is pretty neat about sharing everything, just simple ideas of tests, quizzes,
activities, different assessments, different ideas to get them to learn. During the week we
have a cluster meeting, a full period, a full school improvement plan meeting, which all
of our teachers are familiar with the school improvement plan, which is huge. A lot of
teachers in my degree program, I couldn’t believe all of the people that don’t get to do
these things at regular public schools. This school, I feel, is so far above and beyond of
other schools and districts because of all the time we have clusters, SIP and curriculum
meetings.
A different teacher talked about internal development as joint planning:
And we have common planning… so one day a week I meet with all of the seventh grade
math teachers. Another day of the week I meet with all of the teachers, our cluster
teachers… so what does this student do in your class? They don't do this in mine; how
can we, let me give you my ideas of why it works. So we trade ideas there, and then when
it comes to curriculum, we can say okay, what did you do to teach exponents? What was

86
your strategy, because your kids did really well on that question, so let's bounce ideas off
of each other, so we do that as well.
The teachers at the turned around school learned from each other on a regular basis as both these
quotations describe. It is in these meetings that the teachers were making sense of the day-to-day
work of turnaround. In fact, the teachers from the turned around school still hold these meetings
despite their new designation. What they are describing is an ongoing model of internal
professional development where teachers learn from each other and stay in touch with the
school’s vision for continual improvement. They believe this allows them to constantly grow as
well as stay in touch with the school improvement plan because one of their cyclical meetings is
specifically about this work. The school improvement plan, that state law mandates be written by
each school principal annually, is the continued shared vision of the building even after
turnaround has been achieved. It is also where teachers understand their voice to be an important
part of the turnaround plan. There are multiple committees that the teachers participate in, but the
school improvement planning meeting seemed to be the most important. By including the
teachers in this work on a regular basis throughout the school year the principal at the turned
around school ensured not only that the teachers were continually working together, but also that
they were working on the shared vision embedded within the school improvement plan.
External Professional Development
The teachers at the turned around school talked consistently about how much external
professional development they received and how important it was in general to the school’s
improvement. All the teachers I interviewed at this school talked about the importance of the
external professional development to help them better understand what it is they had to do to
improve the school and their own teaching. One teacher labeled professional development as a

87
perk when she said, “I feel like the plus of working here is we always have professional
development. Every year there’s at least one to three new professional developments or added on
from the year before that give you new ideas, new techniques.” Another teacher spoke about the
range of professional development they had experienced in their time at this school this way, “I
think back to all of the professional development that we had for discipline, for instruction, for
you name it and we had it. We had people in all the time. Some were good and some weren’t so
good, but we always took something away from it and we tried whatever would work for us.”
There were clearly a tremendous amount of resources put into professional development for
issues like guided discipline and data-driven instruction at this school. Teachers understood the
professional development to be necessary for them to understand how to do what was being
asked of them in the turnaround plan. A third teacher spoke of the importance of the culture that
he felt was needed and could only be created with continued support for professional
development at the school. He said, “I think with more time, with more money you can hire more
seminars and hire more speakers and have the time to do the work and the time within the school
day to reflect on it and to practice it and on and on and on and on because we do that all the
time.” This teacher alluded to three important resources; money, time and expertise, that were
required to build teacher capacity in working toward sustained improvement in the building. He
also discussed how the use of these resources to develop the capacity of the people in the
building led to a new way of doing things at this school. With all of the newly developed skills of
these teachers, the culture of the turned around school changed.
Professional Development at the Newly Designated School

88
Since the newly designated school is at the very start of their process, there aren’t nearly
the resources in place to support the type of professional development described above. One
teacher described how much time was allocated to professional development (PD) at the school,
“So PD, I mean it depends, a lot of time we’ll do an hour of PD during the staff meeting, which
is two hours. And then we’ll have a day of PD, a half day, the kids get out at like 12:30 so we’ll
have like four hours of PD.” Professional Development at the newly designated school was
mostly determined by the principal and has been much less focused on when teachers can work
together and when they can get extra support from each other as well. Internal PD is also almost
nonexistent. One teacher said, “So it’s nice because it’s a small school but it’s also a conundrum
because it’s a small school because I only have one other person that I can go and talk to about
Kindergarten stuff, and we don’t have a good relationship. She’s lazy.” Unlike the other school
that is a much larger middle school with departments and teams, there is little structure at this
school for the type of groupings that would allow for some of the internal professional
development that the turned around school found so valuable. The challenge of the size of the
school won’t change, but the personnel and the culture of the school can, and that is likely work
that lies ahead as they work through the turnaround.
Even the coordination of the types of professional development at the newly designated
elementary school has been inconsistent according to the teachers' view. As this teacher noted,
its been variable and they’ve received PD focused on areas they feel they don't need to know
about:
It varies. We have one, now that we’re a Level 4 school, we are allotted one early release
day a month, in which to do that we had to do an evaluation of the school, a school
evaluation. I think PD is actually the area that we need the most work in because it’s not

89
level. Like, I’ll sit there as a Kindergarten teacher and I’ll be learning about open
response for 3rd, 4th, and 5th Grade. And my stuff, like I could be doing centers, I mean
there could be a lot of other ways. I don’t think, I mean as far as policies, we all have to
know that stuff, like as far as data-analysis, that’s new policy, or if we’re going to exempt
a school day, or any of those things. Those are addressed for group.
This teacher feels there needs to be more focus in their school’s approach to professional
development. It either needs to be specific to the individual teacher’s needs, or it needs to be
something relevant to the entire group such as the “new policy” of data-analysis. At this stage of
the turnaround for the newly designated school there isn’t a shared vision in place yet of what the
school needs to turn around. This lack of vision means it is still unclear to them what
professional development will be most effective in this context. There is a clear understanding of
the need for quality PD, yet there is no talk at this school about how the PD has been
transformative or a "perk" as it was described at the turned around school.
ELT Pros and Cons at the Turned Around School
One way that the turned around school was able to move forward in its’ turnaround
process was because they chose to participate in “Extended Learning Time” (ELT). ELT
allowed the teachers to have common planning time for data teams, curriculum teams, School
Improvement Meetings, and time to collaborate with their colleagues. There are two main
schools of thought about Extended Learning Time and its long-term effect on the teachers at the
turned around school. One school of thought is that extended time is essential because it comes
with extra money. The staff at this school works an additional 25% of time beyond the normal
90
teacher contract for the district. As a result, they are compensated an additional 25% of their
salary. There may be teachers who are working at this turned around school because of this
opportunity to make more money. As one staff member described his concern about the money,
I think one of the big concerns teachers have is that at the moment we have this ELT time
and money and we always wonder how long, if ever, that’s going to last or stop. I think a
lot of teachers and administrators fear that when that runs out there’s going to be an
exodus, not that we’re not committed necessarily, but if I’m going to get paid the same
amount of money to work in the small hometown that I, I live … a good drive from here.
If I’m not making more money here, why wouldn’t I go teach in a nice small town as
opposed to a big city?
The implication is that the quality of this school’s staff would decrease if the ELT money was
lost. Several other teachers and at least one building leader worried about his same concern.
The other school of thought was that the extra work hours of ELT are actually very
difficult to sustain. In several of the interviews teachers mentioned how the staff was very young
and several of the teachers told me they were just now starting a family. On the one hand this
was an advantage. A teacher described having a young staff almost as a necessary advantage. He
said, “I think with a younger, more energetic staff, which in some schools you can only get by
getting rid of the older teachers or however you choose to do that, is the way to almost start over.
If you’re a sports fan you know how the Red Sox sort of made that trade and just sort of started
over. If schools could kind of do that more often I think you could just rebuild something like
culture almost immediately.” He understood the young and “energetic” teachers as important to
changing the culture of their turn around school. One worry is that young teachers don’t stay
young forever. In terms of the extended learning time, a young teacher might have the flexibility
91
to work extra hours as a result of not yet having more personal or family obligations to consider.
Another teacher, who was still single, described her worry about the stresses associated with the
long workday:
I think that’s why teachers do leave, because it’s a burnout. As I said, I don’t even have
kids, but there are teachers that do and they go home. I leave my house at 6:20 and I
don’t get home until 4:20. People with kids, and they put the kids to bed at 8:00 or 9:00.
You’ve got two hours with them. People with young babies and children, it’s a long
schedule. And as I said, you bring work home. So you’ve got more work when you get
home.
This same teacher described how the teachers at this school tried to regularly attend sporting and
other extracurricular events at the school in the evenings and on weekends so that the students
knew they cared about them beyond the school day. Many teachers talked about how challenging
the ELT schedule was and alluded to concerns about teacher burnout as a result. A dynamic
culture seemed to be created at the turned around school with professional development and
other activities that went on during extended learning time, yet the teachers noted that it came at
the cost of a great deal of energy on their parts. Questions arose during my interviews about
whether or not the energy required to sustain the pace of the culture at the turned around school
was possible for at least some of the teachers.
More Challenges of ELT
Many of the veteran teachers in the turned around school described how challenging it
was when ELT was first implemented back in 2005. One female teacher noted:

92
That was a brutal day. I think that we were comatose for the first three years anyway.
Seriously. We were here from quarter past 7:00 until 4:15 the first year. It was 30% more
learning time. We tacked the ELT portion on the end of the day so from, what was it,
about 3:00, quarter of three roughly until 4:15 and that was really hard. It was
overwhelming. You couldn’t keep it from being. That’s what I mean, I think that’s why
we bonded, because we were primarily with each other and our kids for eight hours a day
and more. That was probably it and the exhaustion, the exhaustion. There was one year
all I did was go to work, go home and go to bed, go to work, go home and go to bed.
Another teacher from the school confirmed how exhausted teachers felt with the implementation
of ELT:
It was actually a very long day, because we started at, I think it was 10 past 7, but
Monday, Tuesday, Thursday, Friday we ended at 4:15. Wednesdays is when we got out at
2:00, so the kids would leave at 2:00. We would have our meetings then, whether it was
our curriculum or our faculty meeting, and it was absolutely exhausting, exhausting to go
that long of a day.
The adaptation of moving ELT throughout the day helped make the program more effective for
the kids and made it more efficient so the day wouldn’t be quite as long for everyone, but it was
still a challenging schedule to maintain. Teachers made sense of the challenges associated with
ELT as necessary to the work of turning around their school.
The staff also described many positives of the ELT program. There were benefits for
students and faculty alike. In general students got more time to do more interest-based activities.
With the stress of being a chronically underperforming school, academic time had to be
maximized and as a result was focused on instruction in the core areas covered by the state’s

93
standardized tests. One teacher describe the scenario saying, “I mean extra class time for the kids
a lot of times that ends up being enrichment. It's enrichment and intervention. You do get some
intervention time, and we're trying to get to try RTI model here where teachers can take their
kids and say, okay, this was the last benchmark.” With the development of the extra time at
school students could have enrichment activities and teachers could use that time to intervene
where it was helpful to the students who need it. Teachers considered both the enrichment and
interventions to be signs that their role in the turnaround was making a difference for the
students.
More Positives of ELT
The introduction of ELT allowed the staff the time to implement school improvement
goals consistently and to continue to develop professionally. This teacher describes how the
school implemented learning walks in order to deepen the staff’s common understanding of their
concept of student questioning:
Another thing that I was going to say, for a turnaround school is the time allotted,
especially with the ELT. We have a school improvement plan time allotted weekly where
it gives us a chance to do learning walks. We can go as a group from classroom to
classroom and set one focus.
Without the extended learning time teachers would not be as free to conduct these learning walks
and have the follow up conversations afterwards that deepened their understanding of what they
were trying to accomplish in terms of developing more meaningful questions during class
lessons. Teachers believed ELT had a direct impact on their behavior in the classroom and in
turn on the type of learning by students across the school because many of the teachers I

94
interviewed at this school described things such as the increased level of student questioning in
their classrooms.
The teachers at the newly designated school see the value in ELT that could potentially
be instituted in their school as well. One of the benefits of being part of a district that has already
experienced successful turnaround in one school is that the newly designated schools can learn
from the work carried out by their district colleagues. One of the teachers at the newly
designated school had recently visited one of the turned around schools in the district. With this
in mind she made the following comment:
I am a huge advocate for extending the school day because I think that would be a way to
turn around the school. Having less interruptions and more learning time, more
opportunities for learning time even, because I know some of it will just be an
opportunity for some and others will take it and actually use it. So that’s why I have to be
very careful how I say it. I think the opportunity for more learning time would be
advantageous for us, because as it is, I’m like, wow, first bell already. You’d be surprised
how fast the day goes by with 30 kids, you’d be very surprised.
The extra time won’t bring down the number of students in her classroom, but it may give her
more opportunity to work with them on an individual basis. It may also enable all the teachers in
the school the opportunity to work collaboratively, whether by doing learning walks, staying on
top of the latest requirements of the school redesign plan, or being a part of data teams. So while
the teachers at the turned around school may have questioned the sustainability of ELT, the
teachers at the newly designated school are looking forward to what they might be able to do in
terms of instruction and professional development by using extra time effectively that they
cannot accomplish now.

95
The Importance of PD Around Data Use
The concept of data came up in two different ways over the course of the teacher
interviews. The first had to do with data as it relates to helping teachers make sense of the
designation of the school. Teachers were aware that their schools’ data had been at a certain level
and that level had either put them into a chronically underperforming designation or it had pulled
the school out of such a designation. The second and more significant conversation about data
had to do with data to help teachers make sense about how to teach and how to improve student
learning. The data about the school designation was largely communicated through internal
channels in meetings or communications from the building leadership, mostly the principal.
There was a meeting at the newly designated school at the end of this past summer when the
Superintendent herself came to the district to explain their new designation and brought along the
union president to talk to the teachers about what the implications for that could be in terms of
their assignment. The data to inform instruction and to target student-learning goals was a part of
the larger Professional Development plan for the turned around school and seemed at the
forefront of the one being planned at the newly designated building. This professional
development took place both internally and from experts brought into both the district and the
school.
PD Around Data to Improve Instruction
Almost every teacher I interviewed talked unquestioningly about the importance of using
data to improve their instruction and to increase student learning. Many indicated that they were
not prepared to do this when the turnaround process first began, and that they required significant

96
professional development and support in order to become proficient in the skill. The principal in
charge during the turnaround at the middle school discussed how important it was to have a PD
plan that helped teachers understand data use when she said, “If you have a coordinated
professional development plan that’s based on data, whether it’s deficits or strengths, then you
do have a chance for changing the way instruction is delivered, and unless you change the way
instruction is delivered, then nothing else is going to change.” This was part of her shared vision
from stage one of the turnaround. In stage two it was important for teachers to learn how to do
what she understood was necessary to do. Teachers saw that for this principal, data use was the
most important factor for improving instruction and therefore moving the overall data for her
underperforming school. One of the teachers from the turned around school described how this
was accomplished as a whole district initiative,
So a bunch of the schools, it was actually in this building. A bunch of the schools from
Fall River came, like I said. I think there were four of us that sat through the PD learning
how to, okay, 50% of the kids got this question wrong. Why? So you drill it down. s it
the question? Is it the options? Okay, do we need to go back and teach this again? Did we
even teach this at all? So kind of breaking down one question at a time on a test.
The teachers clearly felt the message to them was data needed to be used to improve instruction.
Teachers understood they were being asked to use data to teach the information and skills that
would be useful for students to score better on the state’s standardized tests. Improved state test
data would potentially have a positive impact on schools and the district’s designations. The
same teacher also described how her school went beyond the general PD offered by the district to
create their own school-based data team,

97
I was actually part of the data committee when there was a huge push to let’s look at
data. Let’s use it rather than just take tests, throw it away. Let’s look at the data and see
what the tests are telling us. So I was part of a data committee that went through a three
or four day PD learning how to use data effectively.
This data team was something that remained at the school in order to analyze school data and
also to provide ongoing internal professional development and support for the rest of the school’s
staff. A teacher described how it was used at his school this saying, “We have a school
improvement plan once a week and that was led by the redesign coach. So they would fill us in
on different tasks and things going on and different data to be mindful of and stuff like that.”
The redesign coach was a professional brought in with turnaround grant money to work solely on
the improvement of the school. A large part of their role at the school was to work with the
teachers one-on-one, in small groups, and through the full-staff school improvement meetings to
promote the use of data. At another turnaround school in the district they specifically used their
extended learning time to work on using student data to improve instruction and student learning.
One of the principals interviewed said, “…as part of level 4, they added an hour to their day.
And that was part of the agreement as well. So, I think they had more time to dig into the data.”
People across the district and at all levels showed concerns with both raising teacher
consciousness about the importance of data use as well as raising the teacher’s facility with how
to use it to improve student test scores.
The transition to using data to improve instruction was not an easy one for teachers. It
involved not only the learning of new skills, but also the addition of time for work that hadn’t
previously been a formal part of their practice. One teacher noted that the start of the school’s
data push was, “Very overwhelming, very overwhelming. We had different charts and folders

98
and our department heads wanted us to do charts based on open responses and charts based on
testing and every kid had their own chart and we were doing all this stuff and it was very
overwhelming.” Another teacher described how teachers felt at the start of analyzing the data,
It was a grind. It was a push. We have to look at our numbers, look at our numbers
compared to the state. Look at our numbers compared to the district. How can we get our
students to be successful? These numbers are proving to us that our kids are not
successful. So if other districts and other schools in our district alone are successful how
do we get there? So it was a huge push.
The data referred to here is school-wide data related to the school’s designation, but also
indicates a sense of the shared school vision about looking at data in order to improve. Buy in
wasn’t universal at first, but over time the feelings of staff changed when they were able to see
the school and their students making progress. One teacher described how some of his colleagues
responded:
A lot of people, I think, got upset having to teach to the test sometimes. But now having
these different categories of data and information and stuff like that that we could look at,
each teacher could fine tune themselves and have sort of a better picture of the kids they
have and the kids that are coming in.
None of the eight teachers I interviewed at the turned around school indicated they were
frustrated about having to teach to the test. A common response by teachers to the question about
the dominant expectation about teaching focused on what students should be doing in their
classrooms. One teacher described this expectation:

99
It’s what is expected of us in our classrooms, what a classroom should look like, what
learning should look like, what achievement should look like and how students should
answer questions. It’s not just a yes or no or right answer. It’s this is how I got my
answer. Having students listen to one another, hallway behavior. It’s basically an
understanding that this is what a high achieving school should look like. If there’s a crack
in that, then there’s a crack in the whole turnaround.
Use of higher order thinking skills in class was a part of the shared vision for the school. Again
and again teachers talked about getting kids to use higher order thinking skills to learn, not just
so they could do better on a standardized test. The use of data to improve instruction was clearly
discussed by the principal and teachers as essential to raising student achievement, but the way
teachers knew improvement was happening was the change in student learning behaviors in their
classroom.
The new principal at the turned around school discussed how proficient the teachers had
gotten at using data. At the start of this school year 200 students were added as a result of the
closure of another school in the city to avoid being taken over by the state. This principal noted
that the teachers at his school saw this as an opportunity when it came to data use. He said, “I
mean just to show you how astute the teachers are here. When they heard we were getting these
kids and they were coming from an underperforming school, their first reaction to me was, wow,
there's probably some low scores there. We have a chance to get a really good SGP score.” The
teachers had become so savvy about data and so confident in their abilities to positively impact
their students through their practice that they were sure they would be able to post gains in the
Student Growth Progress (SGP) numbers on standardized tests.

100
At the newly designated school the teachers linked the start of data use to the start of their
turnaround process. One teacher responded to a question about data this way:
So as far as the data goes, I think that once (the data coach) came in, and we were found
to be a Level D school, you have nowhere to work but backwards, so you have to look at
the data, where were we, how can we get to where we want to go, how many points do
we need to make up, and this and that, and the other thing, in order to get to our goal.
And I think working with data is just a logical way to start, because that’s where you
were, that’s what you don’t know.
Despite the efforts of central office to offer PD for teachers about data use throughout the
district, the teachers at this newly designated school didn’t notice a change until it was explained
to them they would be using data to improve. They received both a data coach and a new focus
on data with their designation as a turnaround school.
What Teachers Actually Do with the Data
At the newly designated school one teacher was able to show me charts she had
developed to track the reading and vocabulary progress of her students. She told me the data
coach had given her the template for it just a few weeks earlier and already she was excited to be
able to see student growth and show that growth to her students. It was a start, though surely not
the type of coordinated effort that will be required for school turn around. By contrast, at the
turned around school a teacher described how standardized testing data influenced teaching in
his school:
I can look at their information now with SGP and what school they came from and
different subcategories. It makes it a lot easier. Before I think we were underperforming

101
and everybody just sort of made excuses. But then when you had more information to
look at and it was kind of clear to the teachers what was expected then it was more clear
to the students what was expected and we sort of went from there. I think just simply
being educated in all of that information helped out a bunch.
Here is an example of a teacher who has a clear sense of what the turnaround policy was asking
him to do. He understands the data about designation to be linked to the data around students he
has in his classroom. He also understands the role data-driven instruction has in improving the
performance of his students. He has clearly reconstructed his understanding of how to help the
students in his classroom with the new information he got during the turnaround process. Inside
the classroom another teacher talked about how her practice had changed. She described a
specific change in her practice as a Math teacher, but not in terms of turning around the entire
school:
I think that when I first started teaching I had this notion of, I had this idea of what a
teacher was and it was a teacher in the front of the room, at the board, doing every
problem and I’m the kid doing it in a notebook, doing every problem. It’s so procedural.
My idea of being a math teacher now is the complete opposite. My kids are doing all the
work and I am pushing them to get to that place that they need to be. I’m questioning
them and making them think harder and work harder and in turn they’re learning a
concept instead of a procedure and then they’re able to apply it to other things. So
through these PDs that we have had, through our meetings and discussions on what we
should be doing in our classroom to get kids to where they need to be, my idea of what a
teacher is had to change.

102
In the quotation above the teacher credits the important role PD had in transforming her practice,
but also a real ideological shift on her own part. In the middle of this quotation she switches from
talking about her shift to talking about the rest of her colleagues, saying, “We adapted.” Her
understanding is that this transformation didn’t just take place in her room but in other
classrooms at the same time.
Another teacher described her understanding of what teachers actually did as a result of
the turnaround implementation in terms of an increased focus on the state standards. She
described how the school was changing:
Us really, really focusing, living, breathing, standards, we know what they are. We've
memorized them at this point, so we make sure we absolutely implement them; that they
are using them in like a hands-on format instead of project-based, as opposed to just
working out of a book. Now it's more word problems, so you're relating reading from
ELA and relating it to math, that type of stuff, so we're working through the different
contents and making it cross curriculum, so I think that is bringing up the scores as well.
The teachers made sense of having to focus on the standards because they saw teaching those
standards as the way to improve student performance. This teacher said she thought the reason
for the change was absolutely a result of being designated as a chronically underperforming
school. She understood the intervention of the state as a good thing for the school in terms of
making teachers change their practices for what she saw as the better. She said,
Honestly, yes, there were advantages, because we were under the extremely watchful eye
of the state and you had but no choice to improve, because like some of the teachers that
had been there prior, they weren't going to change their ways. They had their way of

103
teaching, and it wasn’t working, which is why they were at Level D, and those teachers
were let go, and that's...I was one of the replacements.
The introduction of the turnaround policy was seen by teachers as a catalyst for getting teachers
to focus more on standards, move towards more student-centered learning, and begin using data
to inform their instruction to improve student learning.
Finding Three: Stage Three Equals Worries over Sustainability
Teachers in this district understood that their turnaround process began with directive
leadership in order to establish a shared vision of how they needed to improve. They then
understood that teacher capacity for school improvement work had to be enhanced through
ongoing internal and external professional development sessions. At both the school that turned
around and the school looking to do the same, teachers reported a worry about the sustainability
of the turnaround once some of these resources were removed. They were concerned about
losing the external PD they had received. They worried about losing the funding for ELT and
losing motivation since the goal of exiting chronically underperforming status was no longer
present.
Resources
At the school level resources are often seen as coming from the state. The new principal
of the turned around school enjoyed the positive press that came with the new designation, but
almost immediately he began to worry about what the future held for his school:
I know that this school, there were resources in place, and it shouldn't always come down
to money, but a lot of times it does. Do you have the resources to do the work that's

104
needed? So when you look at redesign, when you look at a wraparound zone, when you
look at extended learning time, the state invested quite a bit. It wasn't like they said,
okay, you're level D, you've got to fix it, and see you later. Let us know when it's done.
By the way, we're coming back in three years and the work better be done. They did
provide some resources to do the work.
This principal refers to resources that the state provided his school that helped with wraparound
services that would support children with a wide range of family needs outside of the school day
and resources for redesign. This is what the teachers saw as support for doing what needed to be
done to improve the school’s performance. One of the teachers from the newly designated school
was already concerned about what the loss of grant money might mean:
I don’t know how, with the state pulling back money, the turnaround grant money, what’s
going to happen and what’s going to happen with, like I said, rather than supporting the
other schools they take away from the other schools to have a level A or a level B school.
The next step for the district will be to change its focus and provide time and money to the newly
designated school. This means moving resources away from schools who have improved enough
that they no longer have a chronically underperforming designation.
When I interviewed the teachers at the turned around school they expressed a similar fear
about the loss of resources. They worried that it will challenge the way they’ve been doing their
work and what they will be able to accomplish next. Two of the teachers who were interviewed
together both agreed when one said:
But how are you going to sustain it? …We still have wellness, but the grant was cut this
year. Our professional development was already cut this year. We had separate math and
science days in the summer and that was totally cut. Most teachers still participated, but it

105
wasn’t paid and they didn’t have the regular consultants that we usually do come in.
Look at the amount of PD we had this year versus last, all these years, beyond, already
taken away.
Another teacher at this school noted, “Then that person, the redesign coach sort of position, I
guess, sort of went away and now we don’t have one at all.” Because of the loss of professional
development and support from the redesign coach, the teachers at the turned around school were
concerned about their ability to sustain the improvement they’ve made so far without those
resources.
Perhaps a less obvious loss to the teachers of the turned around school is the loss of
motivation to change. With their new and improved designation, not only are the state resources
gone, but also the motivation to improve that comes from being a failing school. One thoughtful
teacher noted this:
I think we’ve been very successful getting to a level A school. I think the idea of success
or the image of success is probably going to change in terms of what it takes to maintain
it. I don’t really know what it takes to maintain level A in terms of test scores. We had a
very clear goal in mind of where we wanted to go from chronically underperforming to
not so chronically underperforming. I mean it was a huge celebration when we were level
A and I guess I’m sort of left wondering what’s the next goal? I don’t think I realized
until you asked that question. I don’t know what I’m working towards at this point.
A question now arises about whether or not the teachers at this school will have the same level of
motivation to achieve excellence.
Attention from the District

106
With regard to the sustainability of school improvement in this district, teachers talked
about their understanding of what kind of support it took from the central office to achieve their
improvement in the first place. As one teacher from the turned around school noted:
I attribute the time and the money to what made us grow. So my opinion, my simple
answer is give every school the time and the money and watch them grow too. But where
does that money come from? Do taxpayers want to pay it? Will this company give out
grants to every single school? Of course not. They don’t have the money for that. So
that’s the sort of question that’s looming.
In general terms, he saw that improvement came from the time and money that came to the
school and he clearly questions the sustainability of the school’s improvement now that it’s gone.
One of the most tangible representations of support were the school buildings themselves.
The turned around school received a brand new building in 2009. One teacher described its’
impact this way:
I think the number one most enormous thing that I’ve noticed is the new building. I think
coming from the old building to the new building could not have happened at a more
perfect time. I think the old school was just falling apart. Right as we were moving
towards improvement the new school came and those two things together just helped a
lot, the technology, the space, just everything.
In his view the new building helped support the school’s mission to improve by providing a
clean, bright, and well-functioning place in which to teach and learn. Another teacher expressed
what she saw as the dramatic difference: “Especially for our kids, they were always the ones who
got, they were in the crummy building. My God, I have pictures. If you’ve ever seen the old

107
building.” The same teacher goes on to say, “I have a real broadcast studio downstairs. It’s
awesome.”
She refers to the fact that prior to the resources being poured into this school it was much like
the neglected or poor child in the district. One teacher talked about growing up in the city and
being afraid to even go into the old building, let alone work there.
These descriptions differ significantly from the teachers' descriptions of the amount of
attention received by the newly designated school. One teacher from the newly designated school
described her view of the support they’ve received:
They could have circumvented this whole thing. And I’m not going to say that’s true with
every school because it’s not. There’s a lot of issues that go into a Level D. But I think
that redoing all of those other schools, and giving them all of this money to redo these
schools, and leaving the neighborhood school with what, not even an overhang for kids to
stand under, honestly, not a gym, not a swing, not a swing.
The sense she makes is that until the new designation, her school was neglected. She uses the
state of their current facility as an example to prove her point. When I observed the local
stakeholders' group meeting for this school, a strong recommendation was to simply add an
overhang so that there would be a place for students to stand in the morning if it was raining.
This was a strong recommendation because parents had said they sometimes didn’t even bring
their children to school when the weather was bad because they didn’t want their young child to
get wet while they waited for school to open. Many of the people in this neighborhood needed to
drop off their children well before the school opened because they needed to get to work on time.
This reality was in stark contrast to the turned around school with the new broadcast studio that
opened in 2009.

108
A teacher from the newly designated school described the lack of internal support at her
school as well. It isn’t just the old 1904 building that is the problem. She also sees a lack of
staffing regarding the student issues the school must deal with.
We have one school adjustment counselor, and I honestly don’t think she’s … I mean she
works hard but I don’t think she fixes anything. I have kids that run out of the room. She
just brings them back and shuts the door. Like what the hell is that? I have class
disruptions. I have kids flipping chairs and desks over. I have kids running around the
room whipping Legos across the room, whipping food around the kitchen in the play
area. I don’t have anybody, a para, to pull them.
This school is still struggling to support the needs of their children without the provision of
necessary resources. The teacher also described the lack of moral support from anyone at the
central office:
I’ve never gotten an email from (the superintendent) saying, you know guys, we know
you’re a level D school but we know you’re working hard, keep up the good work. We
don’t get anything. We don’t get anything. I feel like they’re very detached. I feel like
they don’t give a shit about us, but that now that they have to because we’re a Level D
school. And I feel like if they had intervened and given a shit before we were a Level D
school we could have turned this whole thing around before.
This teacher thinks that the central office only took notice of what was going on in her school
once it was designated as chronically underperforming. The attention this school is receiving
from the central office feels disingenuous because they believe something should have been done
earlier to help them. The teachers at the newly designated school knew there was a problem
before they were designated, but felt the district did nothing to help them.

109
The Shuffling of Resources
The concern about moving resources from one school to another is central to the worry
about sustainability. As discussed, state resources are removed once schools no longer have the
chronically underperforming designation, but if district resources are also moved or spread
further then even fewer resources remain for schools that have managed to turn around. One
teacher from the newly designated school recounted that she remembered a school committee
member asking this question during the turnaround process for the original schools. She said, “I
went to a school committee meeting and (one member) said what’s going to happen to the other
three middle schools?” That same teacher also recounted a one-on-one conversation she had
with the city’s mayor, who is also the chair of the school committee, where she explained her
understanding of the district’s resourcing:
So I said this may sound abstract to you because you have no children, but this is what I
want you to think about. You have four children and a doctor says to you in order for one
of your children to survive you have to kill the other three yourself. I said does that sound
reasonable to you? He said no. I said well that’s what you have done to the four middle
schools in this city. (The turned around middle school) is alive and the other(s) are dead.
There are no resources, there’s nothing. You’ve shot one of them and the other two are
wounded. He said well, I want all children to be college and career ready. I said well,
they’re not even ready for society, never mind college. And that’s the truth, that’s the
truth. Sorry.
One of the middle schools in the city had to be closed by the school committee in order to keep it
from being taken over by the state. It is also true that the student achievement data at the other
two middle schools had dropped considerably over the time that the fourth school turned around.

110
In 2005 the turned around school was the lowest performing school in the state and today it is in
the highest designation category.
A Skeptical View of How Turnaround was Achieved
One of the teachers at the turned around school described the change she saw over time:
“I feel like everything was changing. Even as my progression at five years, the differences I’ve
seen in the type of teacher, the type of students we see by the time they’re in the 8th grade are
different than the students I saw in 8th grade when I started.” Some people in the district felt that
the reason teachers at the turned around school saw the “type of students we see” changing for
the better was because that indeed what was happening. One of the changes the district made
during the turnaround process was to begin a middle school level gifted and talented program. A
teacher who formerly taught at the turned around school described her opinion of what happened
when the population of the school changed: “So that’s what they do. They just shift children.
That’s what they did at (the turned around) Middle School when I was there. When it went level
D all of the behavior problems went to (the school that is now closed by the district).” The union
president for the district openly questioned the authenticity of the middle school turnaround as
well. She compared it to the other school in the district that turned around: “I think after talking
to the teachers at a (turned around elementary school) and they have what I consider a real,
authentic turnaround, because they kept all their same kids. They didn’t change their structure of
who they were educating.” This was a reference to the turned around middle school and the fact
that they both got rid of some of their troubled students and also gained some of the highest
achieving students in the district through the gifted and talented program. A teacher who worked
at this turned around elementary school noted, “What happened at (the turned around elementary

111
school) was they got smaller class sizes, things that we asked for years. They got smaller class
sizes. They got more, they got a wellness team.” When I asked one of the teachers at the turned
around school about this accusation she responded:
Yes. And you’ll hear that. If you talk to other schools they’ll say well, they have (gifted
and talented). (Gifted and talented), let me tell you, they’re a lot harder to move because
they’re already there and more often than not they slack off and they fall. So my
inclusion classes, my core classes those kids would make huge gains in comparison to my
(gifted and talented) classes.
There isn’t any argument that these students came to the turned around school while they were
still designated as underperforming. The only argument she offers is that the gifted students were
also difficult to teach in their own way. It isn’t possible to disaggregate the impact of the gifted
and talented program’s inclusion on the overall school’s results, but the logical conclusion is that
it would be positive. There is a jump in student data at the turned around school in the years that
the gifted and talented program was phased in. The gifted and talented program began in 2008
for grade 6 only and then progressed for the next two years until each of the grades at the middle
school included a gifted and talented population.
A quick look at the state standardized test scores shows that this school experienced a
huge improvement in their proficient or higher scores after 2008 and followed the same
progression as the gifted and talented population in the school. In 2008 the proficient or higher
percentage for 6th graders at this school was 36% in ELA and 28% in Math. In 2009 the
proficient or higher percentage improved to 49% in ELA and 44% in Math. In 2009 the 7th grade
proficient or higher percentage was 46% in ELA and 33% in Math. In 2010 the 7th grade scores
rose to 54% in ELA and 48% in Math. Similarly, the 2010 8th grade proficient or higher

112
percentage in ELA was 64%, Math was 48%, and Science was 27%. In 2011 those same
categories moved to 67% in ELA, 57% in Math, and 36% in Science. The 2012 data hardly
moved by comparison. The ELA proficient scores were 70%, but Math fell to 54% and Science
to 34%. The tables below indicate this progression. There was no other timespan in the
recorded state data that approaches a similar level of improvement for this school.
Tables 1-3: Turned Around Middle School State Assessment Data Comparisons
Table 1: Assessment Comparison Grade 6
Year Grade Subject Adv/ProfScore
Subject Adv/Prof Score
2008 6 ELA 36 Math 28
2009 6 ELA 49 Math 44
2010 6 ELA 57 Math 44
Note: 2008 was the first year of the gifted and talented program at this school in grade 6. 2009 is the first year assessment scores reflect data from this cohort.
Table 2: Assessment Comparison Grade 7
Year Grade Subject Adv/Prof Score
Subject Adv/Prof Score
2009 7 ELA 46 Math 33
2010 7 ELA 54 Math 48

113
2011 7 ELA 57 Math 38
Note: 2009 was the first year of the gifted and talented program at this school in grade 7. 2010 is the first year assessment scores reflect data from this cohort.
Table 3: Assessment Comparison Grade 8
Year Grade Subject Adv/Prof Score
Subject Adv/Prof Score
Subject Adv/Prof Score
2010 8 ELA 64 Math 48 Science 27
2011 8 ELA 67 Math 57 Science 36
2012 8 ELA 70 Math 54 Science 34
Note: 2010 was the first year of the gifted and talented program at this school in grade 8. 2011 is the first year assessment scores reflect data from this cohort.
There seems to be a correlation at the turned around school between the rise in the state
assessment scores and the beginning of the gifted and talented program. Not only was there a
jump in both ELA and Math scores for the cohort scores beginning in 2009, but it happened
again in 2010 when the first gifted group got their 7th grade scores and in 2011 when the first
gifted group got their 8th grade scores it happened in ELA, Math, and Science. In addition, only
the ELA score for 6th graders made another jump in the second year of the program. All of the
others leveled off or fell in the second year. It appears as if the improved scores that helped
move this school into the level A category may be due in part to the introduction of the gifted
and talented program at their school.

114
Hope for Sustainability
The district cannot sustain its improvement by shifting the gifted and talented program
from one underperforming school to the next. It must also find a solution about how to fund the
ongoing professional development that teachers see as essential to sustaining improvement in
their schools. There is, however, a resource that teachers discussed in their interviews that has
been developed and might be maintained. That resource is the culture of collegiality and
interdependence that has been developed by the staff over time and as a result of engaging in the
difficult work of improving student achievement. Teachers say this is how they survived and
continue to survive difficult times at their school. One teacher described it this way,
Honestly, you have to believe that it's possible and if you work with a staff that believes
it as well, you can stay positive, as opposed to negative, because on the days that I feel
negative, I feel differently. Like my body just feels tired, and it weighs more, like on a
negative day I'm just having an awful day. But on a day when it's a good day, I'm like all
right, let's all bring the positive. To lunch, we laugh. We laugh hysterically at lunch, but
if one is so much as having a bad day, then we bring everybody else down, it's no fun, so
we have to be positive together. We buy into it together, so it's, you have to have
basically staff that will work together.
Another teacher goes further to describe how close the teachers at the turned around schools
became during this time period. She said:
…basically the seventh grade team has become a family, and I know that I'm only
speaking of seventh grade, but I've been in the seventh grade for the nine years, so this is
what's happened. We go out together. Like we go out for people's birthdays, we'll go out
together, or for the holidays we'll go out together. … I only got married a year-and-a-half

115
ago now, but I had two tables, three tables of (people from this school), because there
were just that many people that were just that friendly, so we've just become a family, so
yeah, that's how I look at them.
When I asked about the relationships at the newly designated school, I got very different
responses. Teachers talked about the struggles of other faculty members to do their job and they
questioned their level of commitment. One teacher described her relationships with other staff
members:
I know some people who, outside of school, I absolutely adore and who I would like to,
hey, let’s go to (a bar), let’s go for a drink. And then, those same people professionally, I
would never ask for help because they don’t care. They come here to collect a paycheck
and they come here for summers off.
It may not be that the teachers at the newly designated school will ever develop the closeness of
the 7th grade teachers at the turned around school, but they have not yet been through the process
of turnaround. As a teacher from the turned around school described it, “There were horror
stories at first, when we all first began… but then as the years went on, there were more success
stories rather than horror stories. There were supportive conversations, I mean, we got a good
laugh, no doubt about it, from all the craziness that did occur, but in the end it was supportive
because it ended up making us a family.” Perhaps after sharing the type of commitment
necessary to do this work to improve student achievement the teachers who remain at the newly
designated school might feel a similar bond that could sustain them in their work into the future
after the grant funds and extended learning time has gone away. Perhaps the teachers at the
newly designated school will be able to move from a culture of isolation in terms of internal
professional growth to one where teachers consistently work together, support each other, and

116
learn from each other. One of the clear hopes for sustaining improvement would be to create a
collaborative culture of teachers who trust each other and share a common vision of school goals.
Discussion
In this research project I set out to describe the situation of teachers in level D schools
who were in or had recently been involved in a turnaround process. My study looked at the
perceptions and understanding of the district’s turnaround plan and how it affected the staff’s
motivation and actions to create sustainable student achievement gains. I examined teacher
attitudes and motivation to implement the plan. This research used the theoretical frame of sense-
making to describe the complexity for those furthest along the implementation chain – teachers.
Certainly, the effect of the state’s turnaround legislation on students and their success or failure
is the ultimate goal, but the premise of this study was that the work done by teachers is most
directly related to student achievement.
In this research study I looked at the agency of the teacher as “implementer” (Honig,
2006), in an attempt to identify the conditions that are necessary for success. It was not my
intention to study the process of sense-making for its’ own sake, but rather to use sense-making
as a tool to better understand what was helping and what was hindering teachers' work in turning
around their chronically underperforming school. As stated earlier, literature on turnaround
schools in general suggests the need for a clearly articulated shared vision and the establishment
of relational trust, the role of teacher voice through inclusion in the process, and ongoing
professional support as key factors to the success of turning around chronically underperforming
schools. In this research project I described the extent to which these factors and others existed
for teachers as the school and district sought to create sustained improvement of student

117
performance. I learned this mostly by analyzing the role of teachers from all the stakeholders,
but particularly by hearing the voices of teachers themselves.
Research Questions
My research questions in this study were as follows:
1. How do teachers make sense of the turnaround policy?
2. How does teacher sense-making affect their implementation of the policy?
a) What factors influence teacher sense-making?
Theoretical frame
The theoretical frame for this study sought to take what literature describes about the role
of sense making and apply it to the specific context of actual teachers who are part of a district
turn around process. I found the specific concepts of social capital, the process of reconstruction,
and co-construction descriptive of what teachers understood about what they were asked to do
and what they actually did.
Smylie and Evans (2006) note that social capital can be divided into the two parts of trust
and channels of communication, and that teachers trust other teachers whom they believe think
like them. Trust emerged as a finding for the teachers interviewed only later in the process after
they had gone through the rigors of turning around their school. Teachers who had not yet gone
through the turnaround process were generally very mistrustful and critical of the rest of the staff
at their school. Trust can be developed in teacher networks or learning communities when
teachers share values and beliefs about students' ability to learn (Slavit, Nelson, & Deuel, 2013).
This was absolutely the case in the turned around school as teachers talked over and over again

118
about how closely they bonded with each other at lunch, over a drink after work, or even
vacationing together during their breaks. Similarly, channels of communication included not
only formal lines of communication such as missives from principals or department heads, but
also who teachers talked to informally in the staff room or at lunch. Depending on their lines of
communication, social capital helped or hindered the implementation of turnaround policy. At
the turned around school I heard again and again about the strong bonds between teachers who
had been through the hard work of turnaround together. At first “it was hell” for them, but later
one teacher described how they “became a family.” Their support for each other extended even
beyond the schoolhouse door. The teachers at the turned around school were surrounded by
peers who had gone through the same professional development and attended the same meetings
and so they helped each other make sense of the work they were being asked to do. Teachers at
the newly designated school did not describe their colleagues as this type of resource. They
noted they did not trust each other about professional issues and one teacher even described
going to other schools in the district to find that type of support.
Reconstruction refers to what Spillane, et. al. (2006) describe as the combining of newly
communicated information with, in this case, teacher’s previous knowledge to form a new
understanding that is reconstructed knowledge. Teachers in the turnaround schools studied
combined what was being asked of them with their experiences as teachers. Communication
from meetings and emails was used to help teachers make sense of how they needed to perform
their role both inside and outside the classroom. At the newly designated school the teachers
were very much in the midst of beginning the process of reconstructing their knowledge about
what it means to be a teacher in a turnaround school, what it will mean to their future practice,
and what it will mean to their future as a teacher.

119
Co-construction deals with two important factors in policy sense-making. The first has to
do with Amanda Datnow’s (2006) argument that co-construction occurs as the policy is
communicated down the policy chain. Each communicator re-constructs the information and
passes it along until it reaches, in this case, the teachers at the end of the implementation line. In
this way the policy is not only reconstructed from the receiver’s previous experience and
understanding, but also co-constructed by what the last person in the chain has chosen to share
about it. Sharing at the turned around school took place as a result of the myriad of committees
and meetings that were offered to teachers to work on problems of teaching and learning
together. Between curriculum meetings, school improvement meetings, cluster meetings, and
common planning meetings the turned around school created many formal opportunities for
teachers to co-construct the meaning of what they were being asked to do. In one interview with
two teachers from the turned around school they talked about constantly going into each other’s
classrooms to ask questions and even share successes. They were clearly co-constructing
meaning of their turnaround work. The second aspect of co-construction is heavily influenced by
the context in which the policy is being implemented. When people implement policy, their
thinking is shaped by the situation and environment that surrounds them, which in turn
influences the actions they take to implement policy. In my study I found there to be two distinct
situations even though the two schools were located within the same district. Teachers at the
newly designated school did not talk about collegial sharing or the constant internal professional
development gleaned from multiple cyclical meetings with colleagues. The staff at this school
included only 13 teachers so this may have been why there weren’t as many opportunities to co-
construct meaning of the implementation process as there were in the turnaround school. The
most obvious difference I found in teacher views was directly related to their positions at the
120
opposite ends of the turnaround process. The newly designated school had been notified of their
status only two months prior to the interviews, so they may not have had enough time to engage
in much meaningful co-construction yet. The co-construction I did see observe had more to do
with the reassignment and opt out process for teachers that seemed to be consuming them. I
cannot know if the teachers at the newly designated school will report the same experiences as
their turnaround counterparts, but it is clear they still have some important steps ahead of them.
Synthesis of findings
It was encouraging to me that my findings not only aligned with the literature written
about turnaround work in general, but went further then general findings to provide more
specific recommendations for practitioners. The first finding from the literature relates to the
importance of creating a shared vision. Teachers are the most important resource in the
turnaround process (Murphy & Meyers, 2008), and the most important thing a school leader
needs to do with the staff in their building is to clearly articulate a shared vision of how the
turnaround will happen. Successful leaders in low-performing schools drive the work at hand by
communicating and maintaining a highly focused vision and mission that is focused on student
learning (Clubine, et al., 2001; Duke, 2006; Gezi, 1990; Jacobson, Johnson, Ylimaki, & Giles,
2005; Leithwood, Harris & Strauss, 2010; Murphy, 2010; Murphy & Meyers, 2008; Picucci,
Brownson, Kahlert, & Sobel, 2002; Potter, Reynolds, & Chapman, 2002; Salmonowicz, 2009;
Duke et al., 2005). The findings of this particular study indicated that for teachers this vision has
to come from the building principal at the very beginning of the turnaround process, and it very
likely needed to involve the involuntary transfer of teachers who were not on board with this
vision. The creation of a shared vision through reconstituting the staff of a building until all the

121
teachers were on board with the principal was described by the teachers in both schools as the
first step in the turnaround process and directive in nature. They talked with great passion and
detail about the reassignment process as part of the process of putting a staff in place who could
do the work necessary for turnaround. At the turned around school, teachers described the
response of their principal during the beginning stages of turnaround as “her way or the
highway.” They went on to say that if people didn’t do what that principal said, she would make
their life a “living hell” until they either changed or left. Another teacher described a second
principal she had worked for at another turnaround elementary school in the city as someone
who, “… got what she want(ed) by throwing keys in meetings, slamming books against the wall,
flipping over chairs.” Two of the three turnaround principals referenced in this study were
described as exhibiting this type of intimidating and strict control at the start of the process.
There was no distribution of leadership during this stage of the turnaround process.
The second stage of the turnaround process in this district also fits with recommendations
from the research literature which center on the building of teacher capacity through professional
development. Richard Elmore’s famous “reciprocity of accountability” asserts that teachers need
to be provided with additional capacity if schools expect them to perform different tasks or
familiar tasks at a higher level (Elmore, 2004). Teachers at both schools stressed the importance
of the internal professional development they received from each other through their school,
grade, and department meetings as well as other informal conversations with colleagues at lunch,
during their prep periods, and even in out of work settings. They also noted the external
professional development they received from outside presenters on topics ranging from “guided
discipline,” to changing the tone of their school, to the use of student assessments to improve
learning. Teachers identified data use as necessary to move their schools forward, which aligns

122
with much of the turnaround literature as well (Clubine et al., 2001; Corallo & McDonald, 2001;
Duke et al., 2005; Stein, 2012). Extended learning time was also identified as necessary for
professional growth. It is in this second stage of turnaround, as I’ve defined it, that teachers
understand that their practices have changed and where student growth is evident through
internal and external assessments.
A second finding from the literature has to do with the importance of teacher voice in the
turnaround process. Creating a culture where leadership can be shared makes the job doable for
the principal, but also makes the work more meaningful for the rest of the staff. “Sustainable
leadership spreads. It sustains as well as depends upon the leadership of others” (Hargreaves &
Fink, 2006). My finding in this study is that teachers in these schools did not recognize they had
any leadership role in the turnaround process until the principal had established the shared vision
for the school. For the teachers in this study, teacher voice was possible after the "right" people
were put into place, and the vision of the principal for turning around the school had been clearly
articulated.
The third stage of the turnaround continuum is rooted in teachers' fear about the
sustainability of their improvement. This was true of both the teachers at the turned around
school who were currently in that stage, and teachers at the newly designated school who were
concerned about what would happen if their data improved. Teachers described to me a fear that
they could lose valuable resources of time, money, and even motivation when the watchful eye
of the state and its grant funds disappeared as result of the school’s improved designation. In my
interview with two teachers from the turnaround school they described their fear this way:
But how are you going to sustain it? …We still have wellness but the grant was cut this
year. Our professional development was already cut this year. We had separate math

123
and science days in the summer and that was totally cut. Most teachers still participated
but it wasn’t paid and they didn’t have the regular consultants that we usually do come in.
Look at the amount of PD we had this year versus last, all these years, beyond already
taken away.
These were two of the most positive teachers I interviewed who were proud of what they and
their school had been able to accomplish. They spoke passionately about how well the teachers
in their school worked together and how prepared they felt when talking to teachers from other
places because of their extensive professional development. Yet they still had this fear about
how they were possibly going to be able to sustain the improvement they were so proud of.
My study found hope for sustainability in the relational trust that was established at the
turned around schools. The development of this culture of trust happened over time when
teachers worked together with the common goal of improving their students’ achievement. Here
teachers described how they sustained each other when they were having bad days, how they
could go into each other’s classrooms looking for ideas or inspiration, and even how they
became so close they went on vacations together and attended each other’s weddings. The fear
for turnaround schools is that the policy will overtake the people when it comes to focusing on
what is needed to do this work. “If truth is the first casualty of war, then trust is the first fatality
of imposed reform” (Hargreaves & Fink, 2006, p. 212). The fact that trust was not dead at the
turned around school may be one of their greatest successes and their hope for sustaining their
improvement.
The stages outlined above are exhibited in Chart 1 at the end of this chapter.
Strengths of Findings

124
One of the strengths of my findings lay in the fact that they were consistent between
teachers within the same school and on many topics across both schools. There were several
occasions where the other two schools that had been chronically underperforming were brought
into the discussion to help clarify teachers’ statements. These multiple data sources allowed for
triangulation of my findings and bolstered my conclusions (Yin, 2009). The teachers views were
consistent with the findings about teachers from the three other implementer levels which
enabled me to triangulate my findings. Observation data from the visits to the school sites and
the local stakeholders group was also used to add to the thick rich description of teachers'
experiences in this district.
Another strength involved interviewing teachers from both a school whose data turned
around and another school that was newly designated. I was able to locate these teachers through
purposeful sampling (Creswell, 2012), so they were not hand picked by an administrator or
anyone else in the district. The fact that the newly designated teachers agreed with the teachers
from the turned around school in some of their descriptions about the start of the turnaround
process was important. Common views from both groups of teachers about the importance of
shared vision and the necessary changeover of staffing, for example, ensured that the teachers
from the turned around school were not merely remembering the advantages that they had
experienced.
Limitations of Findings
Although I was able to use data from 27 different interviews, there were many teachers I
did not have the opportunity to speak with. The current principal at the turned around school
scheduled the eight teacher interviews for me and they were very excited to tell me their story.

125
The success they achieved and the positive press they received as a result could have had an
influence on their perspective. For example, their view of the removal of staff who were not on
board with the principal’s vision was far more supportive than it may have been had the
turnaround been a failure.
Another limitation was that I was not able to conduct interviews from either of the other
two schools in the district that had been designated as chronically underperforming. One of the
other schools had been closed the spring before I conducted the study, but there were certainly
teachers from that school working in other parts of the district. No teacher or administrator from
the turned around elementary school in the district was willing to be interviewed. Perspectives
from all four schools in the district would have helped strengthen the findings by including an
even wider range of experiences.
Finally, with only two interviews from the newly designated school means I can't be sure
of the level of data saturation. The fact that there are only 13 teachers in that school means I
interviewed a similar percentage of the staff as I did from the turned around school, however it
was also a self-selected group who were willing to answer my questions. Also, because these
teachers were at the very beginning of the turnaround process, some of their comments about
what would be necessary to succeed were based merely on conjecture.
Recommendations Moving Forward
There are clear worries about the sustainability of any turnaround in this district. This
was true for teachers at the turned around school as well as teachers at the school newly
designated this fall. Despite this, there is a reason for optimism and my recommendation is that
the district find a way to focus on the strength of human relationships amongst its teachers. The

126
staff at the turned around school is highly committed to the children in the school and to each
other as evidenced by their closeness outside the school day. They are highly professional and
exhibited an excellent knowledge about their teaching. They are also highly skilled as a result of
the extensive professional development they’ve received. A specific recommendation is to find a
way to leverage their human resources by developing the leadership of these highly skilled
educators. I am aware that several teachers from this school have been moved into administrative
roles in other schools in the city. Central Office should be wary of plucking too many of these
educators away from the school before others are trained to replace them. If people are the most
important resource in a school, then this school has some powerful resources they need to hold
on to – even if they lose the ELT monies. Maybe the district or school could have an opt in
program for the Extended Learning Time as part of their PD funding. That way, teachers could
choose whether or not they wanted to work the extended learning hours. The worry would be
what happens to the shared vision of a school that has different schedules and different working
options amongst its staff.
The turned around school also has a beautiful new building and a sterling reputation.
These are the resources that they can possibly protect and that may allow this successful culture
to endure. A shared vision, the development of teacher voice, and the development of teacher
professionalism have all been achieved at this school. If those are indeed the three most
important things needed to turn around schools as the literature suggests (an increased focus on
the use of data could be a fourth), then this school may be able to sustain their improvement. Yet
they should not be neglected. There must be ongoing support for them to continue to be
stimulated to use their expertise for the benefit of the children in their school.

127
Chart 1: Stages of Teacher Understanding of Turnaround
Initial Stage: Directive Leadership to Establish a
Shared Vision
Second Stage:
External and Internal Professional Development to Improve
Performance
Third Stage: Loss of Turnaround Resources and Fears about
Sustainability

128
Chapter 5
Discussion5
Our study looked at sense-making of policy implementation from the perspective of four
different implementer groups in a single LEA’s chronically underperforming schools. Sense-
making involves the understanding and interpretation of policies and their intended meanings
and it can influence the success or failure of reform initiatives (Honig, 2006). We wanted to
understand the role sense-making played in what the implementers actually did and what they
thought was effective as a result. Each of the four implementer groups (School Board,
superintendent/central office, school leadership, and teachers) identified the goal of turnaround
as sustainable improvement in the LEA's chronically underperforming schools. Each of the four
researchers in this study examined a different group of implementers and produced individual
findings for the group studied. By looking across our findings from the different levels of
implementation within the same local education agency (LEA) we were able to come up with
important recommendations about communication, the importance of data, and the use of
resources to support turnaround.
In this chapter, we present the following three broad recommendations to help the LEA
reach its stated goal of sustainable improvement from its turnaround policy implementation.
First, there needs to be a focus on improved communication between implementers. By
researching four different implementation levels we were able to identify areas where increased
5 This chapter was jointly written by the authors listed and reflects the team approach of this project: Jamie B. Chisum, Anna Carollo Cross, Jill S. Geiser, Charles Grandson IV

129
communication could aid this process. Our second recommendation involves the need for the
LEA to specify a process for resource allocation. The implementers we studied experienced
frustration over what they perceived as inconsistencies in how resources were distributed across
the LEA. Building a consistent and transparent system of resource allocation would increase trust
and effectiveness. Our third recommendation involves developing the capacity of implementers
to work with data. Over and over again our findings pointed to the value of data to communicate
progress of the school and to inform instruction in the classroom, however the capacity to
understand and work with this valuable tool was inconsistent across implementers. An increased
focus on professional development for all levels of implementers in the area of data use would
aid the process of turning around the failing schools of the LEA.
Recommendations
Recommendation One: Communication Between Implementers
Communication is a broad term that encompasses many important findings from our
individual studies. Because increased communication helps to facilitate sense-making (Datnow,
2006; Honig, 2006), we looked at how facilitating communication between all parties increased
their capacity to make sense of what they were being asked to do. We also examined the
importance of adaptive communication to promote sense-making (Heifitz, Grashaw, Linskey,
2009). Adaptive communication leads to adaptive behaviors and centers more on implementer
beliefs and behaviors rather than merely on the technical requirements of the policy. Finally, the
four of us identified some specific areas where communication can be strengthened.
A finding in each of our four studies involved the need for the turnaround policy to be
communicated on a continual basis throughout the implementer chain from the school board,
superintendent, school leaders, on to teachers and back again. Some of this communication

130
involved the requirements of the plan and what it meant for a school to be named as chronically
underperforming. There were simply things that had to be done for compliance and the
superintendent needed to disseminate that information up to the school board and then down to
principals and teachers. We found traditional structures such as school board and principal
meetings and staff meetings in local schools were in place where this communication might
happen. In the early part of the turnaround implementation this took on a very directive flavor.
Teachers and principals who feared for their jobs were not in a position to debate the merits of
the turnaround plan. Their perceived job at the introduction of this crisis of designation was to
hear the directive communication from their bosses and to perform the task they were being told
to do. This was also true in the case of the superintendent’s communication of the plan to the
school board, even though the board was clearly tasked with hiring and firing the superintendent.
According to the turnaround legislation, the superintendent of the education agency is the person
responsible for writing and communicating the plans to everyone else in the system. Oddly
enough, the superintendent’s communication to the school board in this LEA was also
directive. Members of the committee understood their role in the turnaround process to be
merely doing what the state and the superintendent told them they needed to do. This was clearly
efficient in the early stages of the process. With the need for local education agencies to
complete their turnaround in under three years, the pressure to begin the action phase of any plan
is immense and pushes leaders to spend less time discussing and more time trying to make gains
in student achievement. Directive communication appears to be the most effective way to enter
the process quickly.
Our research suggested that the communication became more complicated during the
next steps of the implementation process. Once the plan for turnaround was communicated,

131
different implementers confronted the realities of putting that plan into action. Inevitably more
communication became necessary. For example, the school board needed to reach out to the
community and begin communicating with people about how they were responding to the new
designation. The superintendent needed to hand off the work of implementation to the members
of the central staff and the building principal in order to be able to attend to all her other tasks.
Finally, building principals needed to enable teachers to change the work they had been doing in
order to improve student results. In the action phase of implementation, communication needed
to be multi-directional and sense made by each implementer (Datnow, 2006; Honig, 2006).
Community members wanted their questions answered and their concerns heard. Principals
needed access to resources from central office to train staff or purchase materials necessary to
follow the plan. Teachers needed to be engaged in what Datnow calls "co-construction" as they
discussed with each other their interpretation of the turnaround process.
The difference between the type of communication needed for an understanding of the
turnaround designation and the communication necessary for an effective implementation of the
plan are essentially the difference between technical and adaptive communication (Heifitz,
Grashow, & Linsky, 2009). Heifitz et al. (2009) define adaptive leadership as, “the practice of
mobilizing people to tackle tough challenges and thrive.” ( p. 2). Our studies found that technical
communication between and among the implementers had already been accomplished. The LEA
knew it was designated as chronically underperforming. From the school board to the teachers,
implementers understood the need for raising test scores. Principals and central office staff
helped to communicate the formal process of how teachers might opt out of working in a
turnaround school. Staff at all levels had a functional understanding of what the turnaround
designation meant and what the school needed to do in order to be successful.

132
However, from our research we identified two areas of need involving adaptive communication.
The first was the need to establish the new beliefs and culture of turnaround. The second was to
answer two essential questions for the individual implementer engaged in turnaround work: 1)
What is my role in turnaround?; and 2) What are the expectations of that role?
During the beginning phase of turnaround the superintendent and building leadership
drafted plans that became the shared vision of the work. This phase relied much more on the
dissemination of information rather than discussion between implementers. The second phase of
implementation relied more heavily on ideas involving co-construction, where implementers
made sense of their role by talking to people in similar roles (Datnow, 2006). They came to a
new understanding of their role in the turnaround process by contextualizing and interpreting
directives by the superintendent or the building leadership through their own experience and
prior knowledge (Spillane et al., 2006). When success was achieved in different places in the
LEA, we found that implementers next needed to create a culture with norms that internalized
the wisdom of this newly formed knowledge. Communication at this stage became far more
complicated because the people who were involved in the work of turnaround were now more
knowledgeable. School Board members saw what worked and what didn’t and began to question
where efficiencies could be found. Central office personnel began to understand patterns in data
and behaviors as a result of their work. Principals spoke about removing themselves to the
background as teachers began to lead improvement initiatives without being asked.
From these findings the research team has derived three ways we believe communication
can be strengthened in this LEA to improve the turnaround process and it's sustainability. Our
recommendations focus on using existing structures and developing better communication
processes that can take place within them. The first recommendation is the use of the building

133
principal meetings with central office staff to develop a common language around what it means
to turn around underperforming schools and to help schools change before they are designated as
underperforming. The second has to do with use of the broad representation of implementors
present in the original local stakeholders group to provide an ongoing planning board throughout
implementation phases. A third way way communication can be strengthened is through an effort
to ensure the school board understands the work of turnaround and their specific role in it.
Within the local education agency we studied, since 2009 there have been four schools
designated as chronically underperforming. Two of these schools have successfully exited and
become a level A and level B school respectively. A third school was closed by the LEA rather
than be allowed to fall to level F status, and a fourth school was newly designated as chronically
underperforming in the fall prior to the beginning of our study. There are lessons to be learned
from all of these cases. Both successful schools have stories to tell about what made a difference
in their turn around efforts. Principals at those schools should be used to offer wisdom to other
schools in the LEA about how to succeed on an ongoing basis. Certainly all school turnaround
contexts have unique elements to them, but within a single education agency there is wisdom to
be shared across schools.
Central Office Principal Meetings. The common language and wisdom gleaned through
communication at these principal and central office meetings would be valuable for the
principals of schools who are not yet designated as chronically underperforming. Principals of all
schools we observed were tracking closely their student performance data and several of the
schools designated as level C were working hard to find ways of avoiding an eventual level D
designation. Explicit communication about how two schools succeeded and how a third failed
would be invaluable for these level C principals. Central Office staff can develop an

134
understanding about these different scenarios by looking across what happened at all three
schools and sharing the information at these meetings. This data should form the basis of the
agency’s plan to support not only the newly designated level D school, but also other schools
who are struggling to avoid such a designation.
Wisdom gained from these principal and central office meetings would also benefit
implementers on the opposite ends of the chain (teachers and school board members) by
communicating plans to improve student learning prior to a chronically underperforming
designation. Opportunities could be created for teachers from turned around schools to share
experiences with the staff in newly designated schools as well as schools that are in danger of
falling to this designation. Principals at the level C schools could begin creating shared visions
for student success and hopefully improve the academic experience of their current students
before an intervention was demanded from the state. Communication should not only focus on
the best (and worst) practices but also on helping teachers and school board members to better
understand the purpose of turnaround as well as the expectations of their role within the policy.
Local Stakeholders Group. Another recommendation is that the composition of the
Local Stakeholders Group (LSG) should be replicated on the school’s redesign team. The LSG is
composed of members of the community at large, the school board, teachers, and administrators
from the school and central office. Some LEA's also include students where developmentally
appropriate. The purpose of the LSG is to come up with a list of recommendations for a
superintendent as he or she develops the turnaround plan for the local education agency. Once
the recommendations are made, however, this group is disbanded. All of the stakeholders on the
group continue to be concerned about the well being of their school, but often the school’s
redesign team does not include anyone from outside the school’s staff. Including a representative

135
group of stakeholders similar to the LSG composition would help to increase communication
between the different stakeholder groups. Consistent meetings about the progress of the school
will help keep everyone informed and could possibly aid in the procurement of resources from
the members of this group. Ongoing input and communication within a redesign team with this
type of constitution could pose a challenge to the building principal’s authority and
accountability without a clear understanding of norms, protocols, and expectations for how these
meetings should be run. The central office representative and the building principal should be in
constant communication over how the group is functioning and revisiting the norms and
expectations whenever necessary to ensure the effectiveness of the team.
Building School Board Capacity. The need for clearer expectations about the role and
responsibility of the school board in an agency's turnaround. This is a specific recommendation
for this education agency despite the fact that there are multiple board members who have
witnessed the turnaround process in three schools in the LEA. School board members have four
areas of authority: budget, policy, evaluation of the superintendent, and collective bargaining.
Turnaround legislation has clouded the board’s responsibilities. Making sense of the committee’s
current role requires direct and explicit conversation. We recommend there be dedicated time for
a school board workshop on turnaround. Professional development for school board members in
turnaround LEA's should be explicit, ongoing, and focus on how they support turnaround efforts
in the local context. Not only does the board need to be clear on what the policy requires of the
local education agency, but they also need a clearer understanding of what their role will be in
the turnaround process moving forward. A lot of attention is provided to the other implementer
groups to make certain they understand their roles and expectations. We believe giving similar

136
attention to the school board would also help facilitate the process of turning around the agency’s
underperforming schools.
Support for Teacher Collaboration. Collaboration and teamwork are areas that
research has shown to contribute to successful school improvement. Some studies have found
that relationship building coupled with collaboration between stakeholders is key to raising the
level of performance of an underperforming school (Corallo & McDonald, 2001; Duke et al.,
2005; Fullan, 2006; Harris, 2006; Mulford et al., 2008; Murphy & Meyers, 2008). A teacher at
the turned around school described how teamwork contributed to school improvement this way,
“There were horror stories at first, when we all first began… but then as the years went on, there
were more success stories rather than horror stories. There were supportive conversations, I
mean, we got a good laugh, no doubt about it, from all the craziness that did occur, but in the end
it was supportive because it ended up making us a family.” This aligns with what literature on
effective school leadership says about building teamwork as an essential element in any school
striving to improve (Marzano, Waters, & McNulty, 2005; Scribner et al., 2011). It is important to
recognize that people are the most important resource in an LEA, and that they are not merely
vessels to hold new information about data use or new student discipline programs. They need
time together to get to know each other so that they can provide internal support for one another
as things get hard and then continue to be hard in the turnaround process. We know a turned
around school benefits any neighborhood it is in, but it cannot fix all the ills faced by today’s
urban and rural poor. Problems will persist well beyond improved student results. The only way
the people in these schools can also persist is as members of a committed team who continually
communicate with each other. Staff must constantly be given time and opportunity to work
together so they don’t feel isolated while working in this difficult environment.

137
Recommendation Two: Specify a transparent process for allocating resources
It is our hope that ensuring a transparent process for school resource allocation will result
in increased equity and fairness and thereby increase trust between implementers. By building
trust implementers can work together more cooperatively and effectively, further ensuring that
the capacity and collective efficacy developed during the turnaround process can be sustained.
Additionally, further development of resource support by pre-identifying struggling schools and
perhaps preempting them, may prevent the number of level D schools in the LEA and the need
for drastic interventions.
Key Elements for Implementing Recommendations As limited resources are available in the LEA, the criteria and priorities about how
resources are distributed to specific programs and schools needs to be developed. By establishing
a baseline for best practices for school improvement, all implementer groups, including school
board, superintendent/central office, principals, and teachers can self-assess the impact of their
actions and decisions in relation to student achievement. The LEA should consider the individual
needs of schools and school context to identify how each school implements these baseline
practices using the school review partner process. After implementers come to a consensus about
the needs of the school and the next steps for intervention, the LEA should consider a way to
measure school resource usage after they are distributed, and how to incorporate a research
function in the process of deciding how to allocate resources.
Funding. The LEA, like many others throughout the state, is grappling with maintaining
services for students in the face of dwindling tax revenues, increased student needs and services,
and the funding cliff derived from the expiration of Race to the Top (RTTT) and other grant
funds. All implementer groups interviewed acknowledged that they did not believe they had

138
enough resources to meet the needs of students. To sustain student achievement gains and
teacher efficacy, the LEA should develop a comprehensive plan that prioritizes programming
and initiatives that will remain or be curtailed when current funding streams diminish.
Additionally, multiple implementer groups interviewed discussed that funding support is only
available to Level D schools, thereby unintentionally incentivizing Level D status. Define a
framework for resource allocation based on school level, programming, and student needs. This
framework should include details of funding streams for academic and extracurricular programs,
additional pay for teachers, full-time equivalents, and other areas essential to effective
implementation of turnaround policy.
Human Resources. It is recommended that the LEA streamline and replicate the most
successful process for teacher “opt-out” of level D schools to ensure consistency of
implementation across schools. This would include providing principals with explicit
professional development on assessing the “fit” of instructional staff members utilizing pre-
determined LEA best practices from past “opt-out” rounds. Implementing a consistent process
across schools that fosters trust, facilitates transparency, and diminishes misalignment between
policy implementer groups may assist with the goal of keeping all implementer groups ultimately
focused on achieving LEA and school goals.
Time. We recommend that the LEA provide a plan for sustainability to ensure continuity
of teacher common planning time and extended learning time services to students. Teachers in
level D schools interviewed feel that they can successfully effectuate change and meet the needs
of students due to the additional collaboration and extended learning time (ELT) opportunities.
While complete replication and scalability may prove challenging, provide educators with
139
opportunities to learn from ELT schools to develop best practices that can be adapted in schools
lacking resources to pay all teachers for ELT.
The LEA should assess the delivery of support and monitoring across high priority (level
D, and C) schools by Central Office administration. A system to monitor school-level support
from central office administrators will ensure clear and equitable support and monitoring. This
would assuage the concerns of teachers and principals that level D schools receive the most
attention and support and counter their stated view that they have to let their schools become
“worse” before they receive attention and support.
Recommendation Three: Increase the capacity of implementers to work with data
An area identified in our findings across implementer groups was the use of data. How
data was used (or not used) was one of the most talked-about areas for school improvement by
teachers, school leaders, central office personnel, and school board members. In this LEA, data
use goes beyond merely examining assessment results to know what schools are eligible for
turnaround support. Rather, educators used the data to tell them what areas of school
improvement need focus and how to improve instruction. This is consistent with literature that
says data is a key in school improvement efforts. Specifically, data is needed to guide instruction,
which is essential to improving performance in underperforming schools. It allows educators to
measure student progress towards goals, and it helps to pinpoint instructional strengths and
weaknesses (Clubine et al., 2001). Indeed, the use of data to guide decisions is considered a
condition for successful school improvement (Potter et al., 2002; Corallo & MacDonald, 2001)
and this LEA makes data an integral part of their turnaround efforts. The data use in this LEA
rests on implementers’ ability to make sense of, or analyze, it, and it is that analysis that guides
improvement efforts. For teachers, improvement is about their instruction. For principals, it is

140
about the school as a whole, and for central office personnel, it is about the LEA as a whole. The
implementer group that is not directly involved with this level of data analysis is the school
board. In fact, the school board seems to have significantly less interaction with the data, which
eclipses their ability to engage in understanding improvement efforts in the LEA.
Although data is a significant part of school and LEA improvement planning, findings
point to inconsistencies with the level of comfort and ability of different implementers to analyze
data. For example, whereas some teachers have facility with data analysis, others feel less
comfortable working with it. This seemed to relate to the phase of the school's turnaround
efforts. At the school that successfully went through the turnaround process, teachers typically
were adept at using the data to inform their practice. On the other hand, in those schools that
were at the beginning of turnaround, teachers tended to have less experience with data analysis.
Similarly, school board members appeared to have minimal experience with looking at school
achievement data and often expressed the desire for better understanding. The implementer
groups who worked the most with the data were school leaders and central office personnel. This
is notable because it marks key leverage points for increasing capacity to use data across the
LEA. Our recommendation is to increase capacity so that there is more consistency in terms of
how implementers understand and use the data.
Ways to Develop Capacity to Work with Data
The LEA has strengths they can build on to increase the capacity of implementers to use
data. Building and LEA leaders, along with numerous teachers, understand the importance of
using data and prioritize its role in school improvement. There is at least one school in the LEA
where data was made central to its improvement efforts and in the end, was successfully turned
around. There is an understanding among school board members that data is relevant to school

141
LEA improvement and recognition of the need to use it in their role as representatives of the
community. While this LEA has already begun paying attention to data in its LEA improvement
efforts, there are a few key actions that can help to increase the capacity of all implementers to
use data that is consistent across schools and across implementer groups. Central office
administrators would need to take the lead in providing opportunities for implementers of the
turnaround process to engage in quality data analysis in order to lead to more informed and
strategic decisions about school improvement.
School leaders and teachers collaborating around data. One opportunity to build
capacity for analyzing data among teachers is to bring them together to share data analysis
practices. While teachers interact with other teachers in their own schools, and perhaps
informally with teachers in other schools, more formal structures could allow this to occur more
frequently. Collaboration is a key element in turnaround. That is, successful turnaround often
depends on the level of collaboration by teachers centered on instruction and problem solving
(Harris, 2002; Picucci et al., 2002; Leithwood et al., 2010; Duke et al., 2005; Clubine et al.,
2001). Providing teachers with opportunities to collaborate across schools around data would
increase their contact with other teachers around best practices and provide new ideas and ways
of using data to inform their instruction.
Sharing of best practices can also occur among school leaders. Currently, school leaders
in the LEA meet with LEA personnel, along with members of their faculty, to analyze data in
their data review meetings. In addition, there are LEA level meetings that occur with central
office, including the superintendent, and principals of all the schools in the LEA. Findings
suggest, however, that there is some inconsistency in how school leaders in this LEA lead data
analysis with their staff and use that analysis to improve practice. There is an opportunity here

142
for school leaders to work together to develop their own skills not only about data analysis for
school improvement, but also about how to lead their staff through the turnaround process.
Increasing community understanding of the data. Developing better understanding of
the data in this LEA also involves the community. This begins with the school board to promote
their sense-making of the data. Findings suggest that school board members have little
interaction with data and less experience than the educators in the schools with making sense of
data in a way that helps them understand the turnaround work. School board members could be
provided with more opportunities to examine the data to increase their understanding. These
conversations do not need to be overly cumbersome in detail. Rather, they might give an
overview of what the data is saying about the LEA and why designations occur. This would put
school board members in a better position to communicate with their constituencies about the
turnaround work that is happening in the LEA. With a greater understanding of the data, they can
dialogue with community members about why some schools are designated as turnaround
schools based on their academic performance. Furthermore, the LEA can work in tandem with
the school board on outreach to the community. Working together, they could provide settings
for dialogues to take place between the LEA and the community about the data. While school
board meetings is perhaps a likely place for this, and our research indicated that indeed
discussions around data have occurred there, opportunities offered outside the context of a school
board meeting may be beneficial. In the end, this may lead to a more informed community who
understand what the data means in terms of the LEA’s performance.
Recommendation Four: Communicate a clear vision of
leadership for the LEA

143
As we listened to what each of the implementers were saying about turnaround, it became
clear that they were looking at turnaround differently and focusing on different aspects of the
turnaround process. They were also expressing different priorities about what needed to be done
to improve the schools. At times, they noted their own lack of clarity about how to turn around
their schools. There appeared to be a lack of interdependence among the different implementer
groups. That is, they tended to operate in silos, distinct from each other, and often not in tune to
what other implementers were thinking or doing with the turnaround work.
There were several places where this lack of interdependence was apparent. The
interviews conducted brought out the most pressing questions and understandings of each of the
implementer groups and at times showed little consistency or connection between each group.
Central office directors spoke about the importance of their monitoring role and how they
worked with school leaders to put practices in place to improve school performance. Yet, school
leaders did not talk much about this and were more focused on how they were working with their
staffs. Teachers described a style of leadership in their schools at the beginning phase of
turnaround that was directive, whereas, when school leaders described their approach, it
resembled more of an instructional leadership approach. The school board was knowledgeable
about the responsibilities given to them under education reform but they were less clear on their
role in turnaround. The other three implementer groups rarely mentioned the school board,
indicating that the school board leadership role was not prevalent in their view. These are
examples of how the different implementer groups were operating within their own spheres of
turnaround work with little connection to each other.
This lack of interdependence may be attributed to the fact that a clear vision from the
LEA about what implementers should be thinking and doing to raise school performance was

144
absent. This became apparent when implementers expressed concern about their ability to sustain
school success after the turnaround period ends. Their concern was twofold: that they would not
be able to continue the work without the additional resources that came with turnaround status
and that they did not know their next goal when their turnaround status ended. This suggests that
at least some implementers were relying on the policy to set their vision for them. That is, upon
designation, their vision was about doing what was necessary to exit turnaround status within a
specific timeframe. Implementers did not speak about any kind of long range vision that the LEA
set about turnaround. When asked to articulate the LEA’s turnaround philosophy many could not
identify one with any specificity. Without that vision articulated by the LEA, the vision many
implementers adopted seemed to be to reach the policy goals of higher student achievement
within a 3-year period. Once that 3-year period ended, some implementers asked “what now?”
This is consistent with the finding that the LEA leaders saw the work of turnaround as occurring
at the school level, coming from the recognition that the heart of the work is where the students
are. However, they did not talk about how they saw the schools as connected with each other as
part of a larger LEA network. They did not describe whether they saw the LEA as a system
whose parts should be working together towards a common vision or how they envisioned the
system supporting learning at the building level.
For this LEA, a clear vision of leadership is needed to help guide and sustain school
improvement. Although turnaround is a focus of some schools, non-turnaround schools are going
through school improvement, some with the aim to avoid level D designation. Therefore, all
schools throughout the LEA would benefit from a more clearly articulated vision of leadership.
When talking about turnaround leadership at the school building level, Leithwood et al. (2010)
emphasize the importance of vision when they recommend turnaround leaders engage their staffs

145
in developing the vision of a school as a source of motivation to commit to the work of school
turnaround. They also suggest using that vision to help guide planning and to ensure that all
decisions align with school goals. In implementing this suggestion at the LEA level, this LEA
would bring implementer groups more into alignment with each other and with the LEA in terms
of how they implement turnaround. Fullan (2006) who also focuses on turnaround leadership at
the building level, discusses the need to implement systemic reform by using a “trilevel
development solution” that includes alignment between the state, LEA, and school.
What has to happen at the school and community level? The [LEA] level? The level of
the state...? the idea is to ‘cause’ developments, along lines of this book, within and across the
three levels. It is not so much seeking alignment as it is experiencing permeable connectivity—
lots of two-way horizontal and vertical mutual influence (p. 74). Establishing this connectivity
and alignment requires conversation, face to face interactions and the co-construction of meaning
that are integral to the sense-making described by researchers (Weick, 1995; Datnow,
2006). This connectivity needs to happen between all three levels Fullan describes above and
requires the state and the LEA to monitor progress on a case by case basis.
This tri-level development solution aptly describes the importance of connecting the
different levels of turnaround, school, community, LEA and state, in terms of how to approach
turnaround work. For the purposes of this recommendation, the focus is on the relationship
between the LEA, community and the school in that all three need to be working in concert with
each other. A vision of leadership in this LEA would strengthen those relationships and help to
create the interdependence needed for implementers of turnaround policy to be working in the
same direction. Strengthening the interdependence between implementer groups can also be
reinforced by making sure that all voices are represented including dissenting voices. Creating a

146
common vision would not be about merely exiting or avoiding turnaround status. Rather, it
would be about the kinds of educational experiences that leadership would create for students
that transcend what the turnaround policy mandates. In fact, creating a common vision for the
entire LEA would benefit schools at all levels of designation and not just those who have been
deemed chronically underperforming. A vision of leadership would help implementers speak the
same language about what they need to focus on and what they need to do to increase the quality
experiences that result in higher student learning in the entire system.
Conclusion This research generated insights into what educators in this LEA think and do as they
implement turnaround policy. Emerging from these insights are recommendations that are
intended to enhance the turnaround work that is already happening across schools in this LEA.
Because sense-making relies so heavily on communication, increasing communication is
suggested here as a way to facilitate understanding of turnaround policy. Yet, this understanding
goes beyond knowing the policy requirements. Communication can help educators in the LEA
better understand their role and expectations, which are not necessarily outlined in the policy.
This enhances the process of co-construction as implementers' communication with each other
helps them to make meaning. Also recommended is to specify a transparent process for
allocating resources. This LEA makes decisions about how resources are distributed across
schools and programs. Yet, the findings from this research study suggest that there is some
confusion as to how those decisions are made. Clarifying these decisions would help to alleviate
confusion and increase trust in the process, which can then help to guide implementers' decisions

147
about turnaround implementation. The third recommendation about data use comes from a major
theme which emerged across the individual studies about the prevalence of data in school
improvement planning and implementation. This LEA already uses data, but there are some
inconsistencies in the capacity of implementers to analyze and use data. School leaders, central
office personnel, and teachers, would benefit from collaborative opportunities for work with
data. School board members may need more experience with data in order to communicate with
their constituencies about what the data says about the schools in the LEA. Providing more
opportunities for implementers to work with data would not only help with school improvement
efforts, but it would also help the community of this LEA to better understand the data that
informs turnaround work in their schools.
These recommendations aim to outline how this LEA can increase its capacity to exercise
successful turnaround of its chronically underperforming schools. Increased communication can
lead to more sense-making, which can help to guide turnaround implementation decisions. More
transparency about the way resources are distributed can offer guidance to implementers
throughout the LEA about how to approach turnaround work. Increasing capacity to analyze and
use data would inform decisions that successfully leads to school improvement. As with most
advice about school improvement, this is not offered as a universal remedy to this LEA's
turnaround challenges. Rather, these recommendations are intended to enhance the thinking that
goes into school improvement planning and implementation. That is, these suggestions can help
implementers make sound decisions about what they should do when taking on the immense task
of turning around a chronically underperforming school.

148
References Adelman, H., & Taylor, L. (2011). Turning around, transforming, and continuously improving
schools: Policy proposals are still based on a two- rather than a three-component
blueprint. International Journal on School Disaffection, 8(1), 22-34.
American Recovery and Reinvestment Act (ARRA) of 2009, Pub. L. No. 111-5, 123 Stat.
115, 516 (Feb. 19, 2009).
Anderson, K., Asera, R., Johnson, J., Jones, B., Liu, H., McClure, R., & Wagstaff, J.
(1999). Hope for urban education: A study of nine high-performing, high-poverty, urban
elementary schools. Washington, D.C.: U.S. Department of Education, Planning and
Evaluation Service. Retrieved from http://www2.ed.gov/PDFDocs/urbaned.pdf.
Bandura, A. (1994). Self-efficacy. In V. S. Ramachaudran (Ed.), Encyclopedia of
human behavior (Vol. 4, pp. 71-81). New York: Academic Press. (Reprinted in H.
Friedman [Ed.], Encyclopedia of mental health. San Diego: Academic Press, 1998).
Bass, B., & Avolio, B. (1993). Transformational leadership and organizational culture.
Public Administration Quarterly, 17(1), 112-121. doi:10.1080/01900699408524907
Berman, S.H., & Camins, A. (2011). Investing in turnaround that endures. Education

149
Week, 21(10), 22-28.
Bryk, A.S., & Schneider, B. (2002). Trust in schools: A core resource for improvement.
New York, NY: Russell Sage Foundation.
Bryk, A. S., Sebring, P. B., Allensworth, E., Luppescu, S., & Easton, J. Q. (2010).
Organizing schools for improvement: Lessons from Chicago. Chicago, IL: University of
Chicago Press.
Calkins, A., Guenther, W., Belfiore, G., & Lash, D. (2007). The turnaround challenge:
Why America’s best opportunity to dramatically improve student achievement lies in our
worst-performing schools. Retrieved from
http://www.massinsight.org/publications/turnaround/51/file/1/pubs/2010/04/15/TheTurna
roundChallenge_MainReport.pdf
Campbell, D.W., & Greene, D. (1994). Defining the leadership role of school boards in
the 21st century. Phi Delta Kappan, 75(5), 391-395.
Children's Defense Fund. (2012). The state of America’s children handbook. Retrieved
from http://www.childrensdefense.org/child-research-data-publications/data/soac-2012-
handbook.pdf
Clubine, B., Knight, D., Schneider, C., & Smith, P. (2001). Opening doors: Promising
lessons from five Texas high schools. Washington, D.C.: Government Printing Office.
Retrieved from http://www.gpoaccess.gov/eric/200211/ed465000.pdf.
Coburn, C. (2001). Collective sense-making about reading: How teachers mediate reading
policy in their professional communities. Educational Evaluation and Policy Analysis,
23(2), 145-170.
Coburn, C.E., Honig, M. I., & Stein, M. K. (2009). What’s the evidence on

150
districts’ use of evidence? In L. J. Bransford, D. J. Stipek, N. J. Vye, L. M. Gomez, & D.
Lam (Eds.), The role of research in educational improvement (pp. 67–88). Cambridge,
MA: Harvard Education Press.
Conley, D. T. (2003). Who governs our schools? Changing roles and responsibilities. New
York N.Y: Teachers College Press.
Copland, M. (2003). Leadership of inquiry: Building and sustaining capacity for school
improvement. Educational Evaluation and Policy Analysis, 25(4), 375-395.
Corallo, C., & McDonald, D. (2001). What works with low-performing schools: A review of
research literature on low-performing schools. (Report No. EA031549). Charleston,
WV: AEL, Inc.
Creswell, J. W. (2012). Education research: Planning, conducting, and evaluating
quantitative and qualitative research. Boston, MA: Pearson Education.
Crowson, R., & Morris, V. C. (1992). The Superintendency and school effectiveness: An
organizational hierarchy perspective. School Effectiveness and School Improvement,
3(1) 69-88. doi: 10.1080/0924345920030106
Cuban, L. (2004). A solution that lost its problem: Centralized policymaking and classroom
gains. In N. Epstein (Ed.), Who’s in charge here? The tangled web of school governance
and policy (pp.104-130). Washington, D.C.: Brookings Institution Press.
Danzberger, J. P., & Usdan, M. D. (1994). Local education governance: Perspectives on
problems and strategies for change. Phi Delta Kappan, 75(5), 366.
Danzberger, J., Carol, L., Cunningham, L., Kirst, M., McCloud, B., & Usdan, M. (1987).
School boards: The forgotten players on the education team. Phi Delta Kappan, 69(1),
53-59.

151
Datnow, A. (2006) Connections in the policy chain: The “co-construction” of
implementation in comprehensive school reform. In M.I. Honig (Ed.), New directions in
education policy implementation: Confronting complexity (pp. 105-123). Albany, NY:
State University of New York Press.
Day, C., Sammons, P., Hopkins, D., Harris, A., Leithwood, K., Gu, Q., Brown, E.,
Ahtaridou, E., & Kington, A. (2009). The impact of school leadership on pupil outcomes:
Final report. (Research Report No. DCSF-RR108). Nottingham, UK: University of
Nottingham. Retrieved from
https://www.education.gov.uk/publications/eOrderingDownload/DCSF-RR108.pdf
Dervarics, C., and O’Brien, E. (2011). Eight characteristics of effective school boards: Full
report. Retrieved from http://www.centerforpubliceducation.org/Main-Menu/Public-
education/Eight-characteristics-of-effective-school-boards/Eight-characteristics-of-
effective-school-boards.html
Dervin, B. (1998). Sense-making theory and practice: An overview of user interests and
knowledge seeking and use. Journal of Knowledge Management, 2(2), 36-46.
Dinham, S., & Crowther, F. (2011). Sustainable school capacity building--one step back,
two steps forward? Journal of Educational Administration, 49(6), 616-623.
Duke, D. (2006). Keys to sustaining successful school turnarounds. ERS Spectrum, 24(4),
21-35.
Duke, D. L., Tucker, P., Belcher, M., Crews, D., Harrison-Coleman, J., & Higgins, J. (2005).
Lift-off: Launching the school turnaround process in 10 Virginia schools. Charlottesville,
Vv.: University of Virginia, Partnership for Leaders in Education. Retrieved from
www.darden.virginia.edu/uploadedFiles/Centers_of_Excellence/PLE/VSTPS Final.pdf.

152
Duke, D. L., Tucker, P. D., Salmonowicz, M. J., Levy, M., & Saunders, S. (2008).
Teachers' guide to school turnarounds. Lanham, MD: Rowman and Littlefield Education.
Duke, D. L. (2010). Differentiating school leadership: Facing the challenge of practice.
Thousand Oaks, CA: Corwin Press.
Duke, D., & Salmonowicz, M. (2010). Key decisions of a first-year ‘turnaround’
principal. Educational Management Administration & Leadership, 38(1), 33-58.
doi: 10.1177/1741143209345450
Eisner, E. (1976). Educational connoisseurship and criticism: Their forms and functions
in educational evaluation. Journal of Aesthetic Education, 10(3/4), 135-150.
Elmore, R. F. (2004). School reform from the inside out: Policy, practice, and
performance. Cambridge, MA: Harvard Education Press.
Epstein, N. (2004). Who’s in charge here? The tangled web of school governance and policy.
Washington, D.C.: Brookings Institution Press.
Evans, R. (1996). The human side of school change: Reform, resistance, and the real-life
problems of innovation. San Francisco, CA: Jossey-Bass.
Feuerstein, A. (2002). Elections, voting, and democracy in local school district governance.
Educational Policy, 16(1), 15-36. doi:10.1177/0895904802016001002
Feuerstein, A., & Dietrich, J. (2003). State standards in the local context: A survey of school
board members and superintendents. Educational Policy, 17(2), 237-256.
doi:10.1177/0895904802250743
Fullan, M. (1991). The new meaning of educational change. New York, NY: Teachers’
College Press.

153
Fullan, M. (2005). Leadership and sustainability: Systems thinkers in action. Thousand Oaks,
CA: Corwin Press.
Fullan, M. (2006). Turnaround leadership. San Francisco, CA: Jossey-Bass.
Gezi, K. (1990). The role of leadership in inner-city schools. Educational Research
Quarterly, 12(4), 4-11.
Giles, C., Johnson, L., Brooks, S., & Jacobson, S. (2005). Building bridges, building
community: Transformational leadership in a challenging urban context. Journal of
School Leadership, 15(5), 519-545.
Glass, T. E., Bjork, L., & Brunner, C. C. (2000). The study of the American school
superintendency 2000: A look at the superintendent of education in the new millennium.
Arlington, VA: American Association of School Administrators.
Goodman, R., & Zimmerman,W. G., (2000). Thinking differently: Recommendations for 21st
century school board/superintendent leadership, governance, and teamwork for high
student achievement. NESDEC, ( Report prepared for Ford Foundation)
EducationalResearch Service, Retrieved from http://www.nesdec.org/research
dev/publications.htm http://www.nesdec.org/research dev/publications.htm
Green, T. F. (1983). Excellence, equity, and equality. In L. S. Shulman, & G. Sykes
(Eds.), Handbook of teaching and policy (pp. 318-341). New York, NY: Longman Inc.
Hallinger, P. (2003). Leading educational change: Reflections on the practice of
instructional and transformational leadership. Cambridge Journal of Education, 33(3),
329-352. doi:10.1080/0305764032000122005
Hambrick, D. (1983). Turnaround strategies for mature industrial-product business units.
Academy of Management Journal, 26(2), 231-248. doi:10.2307/255972

154
Hargreaves, A. (2004). Distinction and disgust: The emotional politics of school failure.
International Journal of Leadership in Education, 7(1), 27-41.
doi:10.1080/1360312032000154531
Hargreaves, A., & Fink, D. (2006). Sustainable leadership. San Francisco, CA: Jossey-
Bass.
Hargreaves, D. H. (1995). School culture, school effectiveness and school improvement.
School Effectiveness & School Improvement, 6(1), 23-46.
Harris, A. (2002). Effective leadership in schools facing challenging contexts. School
Leadership & Management, 22(1), 15-26. doi:10.1080/13632430220143024
Harris, A. (2006). Leading change in schools in difficulty. Journal of Educational
Change, 7(1-2), 9-18. doi: 10.1007/s10833-006-0009-0
Heifetz, R., Grashow, A., & Linsky, M. (2009). The practice of adaptive leadership: Tools
and tactics for changing your organization and the world. Boston, MA: Harvard
Business Press.
Hess, F. M. (2010). Weighing the case for school boards today and tomorrow: School
boards are a flawed form of governance but still serviceable. The more pressing task is to
rethink the school district itself. Phi Delta Kappan, 91(6), 15 - 19.
Hess, F. M. (1999). Spinning wheels: The politics of urban school reform. Washington,
DC: The Brookings Institution.
Hightower, A. M., Knapp, M., Marsh, J. A., & McLaughlin, M. W. (2002). School
districts and instructional renewal: Opening the conversation. New York, NY: Teachers
College Press.
Hill, C., Thompson, B., & Williams, E. (1997). A guide to conducting consensual

155
qualitative research. The Counseling Psychologist, 25(4), 517-572.
Hill, H. C. (2006). Language matters: How characteristics of language complicate policy
implementation. In M. I. Honig (Ed.), New directions in education policy
implementation: Confronting complexity (pp. 65-81). Albany, NY: State University of
New York Press.
Holmes, M. (1995). Educated dissent: Implications of policy disagreement for
educational leadership. In K. Leithwood (Ed.), Effective school district leadership:
Transforming politics into education. Albany, NY: State University of New York Press.
Honig, M. I. (2006) Complexity and policy implementation: Challenges and opportunities
for the field. In M. I. Honig (Ed.), New directions in education policy
implementation: Confronting complexity (pp.1-23). Albany, NY: State University of
New York Press.
Iannaccone, L. (1991). Micropolitics in education, what and why. Education and Urban
Society, 23(4), 465-471.
Jacobson, S., Johnson, L., Ylimaki, R., & Giles, C. (2005). Successful leadership in
challenging US schools: Enabling principles, enabling schools. Journal of Educational
Administration, 43(6), 607-618. doi:10.1108/09578230510625700
Jacobson, S. L., Brooks, S., Giles, C., Johnson, L., & Ylimaki, R. (2007). Successful
leadership in three high-poverty urban elementary schools. Leadership and Policy in
Schools, 6(4), 291-317. doi:10.1080/15700760701431553
Kayes, A., & Kayes, D. C. (2012). The ethics of dissent: The case of David Kelly. World
Academy of Science, Engineering and Technology, 66, 6-24. Retrieved from
http://waset.org/publications/1465

156
King, M.B., & Bouchard, K. (2011). The capacity to build organizational capacity in
schools. Journal of Educational Administration, 49(6), 653-669.
Kowal, J. M., & Ayscue, E. (2005). Turnarounds with new leaders and staff. Chapel Hill,
NC: The Center for Comprehensive School Reform and Improvement. Retrieved from
http://www.centerforcsri.org/pubs/restructuring/KnowledgeIssues4Turnaround.pd
fhttp://www.centerforcsri.org/pubs/restructuring/KnowledgeIssues4Turnaround.p df
Kowal, J. P., Hassel, E. A., & Hassel, B. C. (2009). Successful school turnarounds: Seven steps
for district leaders. Retrieved from
http://www.centerforcsri.org/files/CenterIssueBriefSept09.pdf.
Kutash, J., Nico, E., Gorin, E., Rahn, S., & Tallant, K. (2010). The school turnaround
field guide. Retrieved from
http://www.fsg.org/FSGNews/NewsEventsDetails/ArticleId/20/The-School-Turnaround-
Field-Guide.aspx
Land, D. (2002). Local school boards under review: Their role and effectiveness in
relation to students’ academic achievement, Review of Educational Research, 72(2), 229-
278.
LEA School Board Meetings, December 2009 – December 2013, retrieved on line
Leithwood, K. (1994). Leadership for school restructuring. Educational Administration
Quarterly, 30(4), 498-518. doi:10.1177/0013161X94030004006
Leithwood, K., Harris, A., & Strauss, T. (2010). Leading school turnaround: How
successful leaders transform low-performing schools. San Francisco, California: Jossey-
Bass.
Leithwood, K., & Jantzi, D. (1999). Transformational school leadership effects: A

157
replication. School Effectiveness and School Improvement, 10(4), 451-79.
doi:10.1076/sesi.10.4.451.3495
Lutz, F. W. (1980). Local school board decision-making, a political-anthropological analysis.
Education and Urban Society, 12(4), 452-465.
Malen, B. (2006). Revisiting policy implementation as a political phenomenon: The
case for reconstitution policies. In M. I. Honig (Ed.), New directions in education policy
implementation: Confronting complexity (pp. 83-104) Albany, NY: State University of
New York Press.
Malen, B. (2003). Tightening the grip? The impact of state activism on local school systems.
Educational Policy, 17(2), 195-216. doi: 10.1177/0895904802250736
Marzano, R. J., & Waters, T. (2009). District leadership that works: Striking the right
balance. Bloomington, IN: Solution Tree Press.
Marzano, R. J., Waters, T., & McNulty, B. A. (2005). School leadership that works:
From research to results. Alexandria, VA: ASCD.
Marks, H., & Printy, S. (2003). Principal leadership and school performance: An
integration of transformational and instructional leadership. Educational Administration
Quarterly, 39(3), 370-97. doi:10.1177/0013161X03253412
Mascall, B., & Leithwood, K. (2010). Investing in leadership: The district's role in
managing principal turnover. Leadership & Policy in Schools, 9(4), 367-383.
doi:10.1080/15700763.2010.493633
McCloud, B., & McKenzie, F. (1994). School boards and superintendents in urban
districts. Phi Delta Kappan, 75(5), 384-385.

158
McLaughlin, M.W. (2006). Implementation research in education: Lessons learned,
lingering questions and new opportunities. In M.I. Honig (Ed.), New directions in
education policy implementation: Confronting complexity (pp. 209-227). Albany,
NY: State University of New York Press.
McQuillan, P., & Salomon-Fernandez, Y. (2008). The impact of state intervention on
“underperforming” schools in Massachusetts: Implications for policy and practice.
Education Policy Analysis and Archives, 16(18), 1-43.
Meliones, J. (2000). Saving money, saving lives. Harvard Business Review, 78(6), 57.
Merriam, S. (1998). Qualitative research and case study applications in education.
San Francisco, CA: Jossey-Bass Publishers
Merriam, S. (2009). Qualitative research: A guide to design and implementation. San
Francisco, CA: Jossey-Bass.
Miles, M., & Huberman, M. (1994). Qualitative data analysis: An expanded sourcebook.
Thousand Oaks, CA: Sage Publications.
Mintrop, H. (2004). Schools on probation: How accountability works (and doesn't work).
New York, NY: Teachers College Press.
Muijs, D., & Harris, A. (2006). Teacher led school improvement: Teacher leadership in
the UK. Journal of Teaching and Teacher Education, 22(8), 961-972.
Mulford, B., Kendall, D., Ewington, J., Edmunds, B., Kendall, L., & Silins, H. (2008).
Successful principalship of high-performance schools in high-poverty communities.
Journal of Educational Administration, 46(4), 461-480.
doi:10.1108/09578230810882009
Murphy, J. (2010). Turning around failing organizations: Insights for educational leaders.

159
Journal of Educational Change, 11(2), 157-176. doi: 10.1007/s10833-008-9101y
Murphy, J., & Meyers, C. (2008). Turning around failing schools: Leadership lessons
from the organizational sciences. Thousand Oaks, CA: Corwin Press.
National School Boards Association. (2013). Beliefs and policies. San Francisco, CA.
Retrieved from www.nsba.org.
Newmann, F. M., King, M. B., & Youngs, P. (2000). Professional development that
addresses school capacity: Lessons from urban elementary schools. American Journal of
Education, 108(4), 259- 299.
No Child Left Behind Act of 2001, 20 U.S.C. § 6301 (2002).
Norman, S. J. (2010). The human face of school reform. National Forum of Educational
Administration & Supervision Journal, 28(1), 1-6.
Orfield, G., Losen, D., Wald, J., & Swanson, C. (2004). Losing our future: How minority
youth are being left behind by the graduation rate crisis. Cambridge, MA: The Civil
Rights Project at Harvard University. Retrieved from www.urban.org.
Patton, R. (2002). Qualitative research and evaluation methods. Thousand Oaks, CA:
Sage Publications.
Payne, C. (2010). So much reform, so little change: The persistence of failure in urban
schools. Cambridge, MA: Harvard Education Press.
Picucci, A., Brownson, A., Kahlert, R., & Sobel, A. (2002). Driven to succeed:
High-performing, high-poverty, turnaround middle schools. Austin, Texas: Charles A.
Dana Center, University of Texas at Austin. Retrieved from
http://www.utdanacenter.org/downloads/products/driven/ms_vol2.pdf
Potter, D., Reynolds, D., & Chapman, C. (2002). School improvement for schools facing

160
challenging circumstances: A review of research and practice. School Leadership &
Management, 22(3), 243-256. doi:10.1080/1363243022000020381
Race to the Top Fund: E. Turning around the lowest achieving schools, 74 Fed. Reg.
59763 (2009) (to be codified at 34 CFR Subtitle B, Chapter II).
Ravitch, D. (2010). The death and life of the great American school system: How testing
and choice are undermining education. New York, NY: Basic Books.
Reardon, S. (2013, April 27). No rich child left behind. New York Times.
Retrieved from http://opinionator.blogs.nytimes.com/2013/04/27/no-rich-child-left-
behind/
Reeves, D. B. (2009). Leading change in your school: How to conquer myths, build,
commitment, and get results. Alexandria, VA: ASCD.
Rice, R., Delagardelle, M., Buckton, M., Jons, C., Lueders, W., & Vens, M.J. (2001). The
lighthouse inquiry: School board/superintendent team behaviors in school districts with
extreme differences in student achievement. City: Iowa Association of School Boards.
Retrieved from http://www.ia-sb.org/assets/FADFDF72-BE9D- 48D7-8CF9-
19B823F0CDA1.pdfhttp://www.ia-sb.org/assets/FADFDF72-BE9D- 48D7-8CF9-
19B823F0CDA1.pdf
Richard, J. V., & Kruse, S. D. (2008). Understanding school board members' perceptions of
superintendents' leader behaviors. Mid-Western Educational Researcher, 21(4). 9-15.
Robinson, V., Lloyd, C., & Rowe, K. (2008). The impact of leadership on student
outcomes: An analysis of the differential effects of leadership types. Educational
Administration Quarterly, 44(5), 635-674. doi:10.1177/0013161X08321509

161
Saldaña,J., (2013). The coding manual for qualitative researchers. Thousand Oaks, CA: Sage
Publications.
Salmonowicz, M. (2009). Meeting the challenge of school turnaround: Lessons from the
intersection of research and practice. Phi Delta Kappan, 91(3), 19-24.
SEA, (1995) Advisory on School Governance, retrieved on line.
SEA, (2011) Report to School Board, February 15 meeting, retrieved on line
SEA, (2011) Report to School Board, October 12 meeting, retrieved on line
Scribner, S. M. P., Crow, G. M., Lopez, G. R., & Murtadha, K. (2011). "Successful"
principals: A contested notion for superintendents and principals. Journal of School
Leadership, 21(3), 390-421.
Slavit, D., Nelson, T. H., & Deuel, A. (2013). Teacher groups’ conceptions and uses of
student-learning data. Journal of Teacher Education, 64(1), 8-21.
doi:10.1177/0022487112445517
Smylie, M.A., & Evans, A.E. (2006). Social capital and the problem of implementation.
In M. I. Honig (Ed.), New directions in education policy implementation: Confronting
complexity (pp.187-208). Albany, NY: State University of New York Press.
Spillane, J. P. (1998). State policy and the non-monolithic nature of the local school
district: Organizational and professional considerations. American Educational
Research Journal,35(1), 33-63. Retrieved from http://www.jstor.org/stable/1163451
Spillane, J.P., & Coldren, A. F. (2011). Diagnosis and design for school improvement. New
York: Teachers College Press.
Spillane, J. P., Reiser, B. J., & Gomez, L. M. (2006). Policy implementation and cognition: The
role of human, social, and distributed cognition in framing policy implementation. In

162
M.I. Honig (Ed.), New directions in education policy implementation: Confronting
complexity (pp.47-64). Albany, NY: State University of New York Press.
Spillane, J. P., Resier, B. J., & Reimer, T. (2002). Policy implementation and cognition:
Reframing and refocusing implementation. Review of Educational Research,72(3), 387-
431. doi: 10.3102/00346543072003387
State Legislation, Education Reform Act, (1993).
State General Laws.
State Legislation, Turnaround Act, (2010).
Stein, L. (2012). The art of saving a failing school. Phi Delta Kappan, 93(5), 51 - 55.
Stitzlein, S. (2011). Democratic education in an era of town hall protests. Theory and
Research in Education, 9(1), 73-86. doi:10.1177/1477878510394819
Supovitz, J. (2006). The case for district-based reform. Cambridge, MA; Harvard
University Press.
Teerlink, R. (2000). Harley's leadership U-turn. (brief article). Harvard Business Review,
78(4), 43.
The National Commission on Excellence in Education. (1983). A Nation at risk: The
imperative for educational reform: A report to the nation and the Secretary of
Education, United States Department of Education. Retrieved from
http://datacenter.spps.org/uploads/SOTW_A_Nation_at_Risk_1983.pdfhttp://datacenter.
spps.org/uploads/SOTW_A_Nation_at_Risk_1983.pdf
Togneri, W., & Anderson, S.E. (2003). Beyond islands of excellence: What districts can
do to improve instruction and achievement in all schools. Washington, DC: Learning
First Alliance and the Association for Supervision and Curriculum Development.

163
Tyack, D., & Cuban, L. (1995). Tinkering toward utopia: A century of public school
reform. Cambridge, MA. Harvard University Press
U.S. Census Bureau, (2010)
U.S. Department of Education, (2013). For each and every child—A strategy for education
equity and excellence. Washington, D.C., 2013. Retrieved from
http://www2.ed.gov/about/bdscomm/list/eec/equity-excellence-commission-report
U.S. Department of Education. (2009). Address by the Secretary of Education at the
National Alliance for Public Charter Schools Conference. Retrieved from
https://www2.ed.gov/news/speeches/2009/06/06222009.pdfhttps://www2.ed.gov/news/sp
eeches/2009/06/06222009.pdf
Vernon-Dotson, L. J. & Floyd, L. O. (2012). Building leadership capacity via school
partnerships and teacher teams. The Clearing House: A Journal of Educational
Strategies, Issues and Ideas, 85(1), 38-49.
Villegas, M. (2003). Leading in difficult times: Are urban school boards up to the task? San
Francisco, CA.: WestEd. Retrieved from http://www.wested.org
Weick, K. E., Sutcliff, K. M., & Obstfled, D. (2005) Organizing and the process of sense-
making. Organization Science, 16(4), 409-421. doi: 0.1287/orse.1050.0133
Weick, K. E. (1995) Sense-making in organizations. Thousand Oaks, CA: Sage.
Weiss, R. (1994). Learning from strangers: The art and method of qualitative interview
studies. New York, NY: The Free Press.
Wiseman, L., & McKeown, G. (2010). Multipliers: How the best leaders make everyone
smarter. New York, NY: Harper Business.
Yin, R. (2009). Case study research design and methods. Thousand Oaks, CA: Sage

164
Publications.
Yin, R. (2011). Qualitative research from start to finish. New York, NY: The Guilford
Press.
Zavadsky, H. (2012). School turnarounds: The essential role of districts. Cambridge, MA:
Harvard Education Press.

165
Appendix A: Definition of Terms NCLB - No Child Left Behind Act of 2001, which is the reauthorization of the Elementary and
Secondary Education Act of 1965.
Blueprint for Reform - The Blueprint for Reform is President Obama’s 2010 reauthorization of
the Elementary and Secondary Education Act of 1965.
RTTT - Race to the Top is a grant program designed to spur innovation and reform in the
nation’s K-12 schools. It is funded by the Education Recovery Act, which is part of the
American Recovery and Reinvestment Act of 2009.
SIG - School Improvement Grant. This is a federal grant program authorized under the
Elementary and Secondary Education Act of 1965. They are grants to State Education Agencies
(SEAs) used for competitive grants to Local Education Agencies (LEAs) that demonstrate the
greatest need and the strongest commitment to use the funds to provide adequate resources in
order to rapidly and dramatically improve student achievement in their lowest-performing
schools.
Turnaround legislation - State legislation from 2010 whose stated purpose is to provide
innovation in schools and to turnaround underperforming schools. It was written in part to
respond to the federal requirement that states wishing to qualify for RTTT funds needed to have
their own legislation outlining school improvement requirements that was in line with President
Obama’s Blueprint for Reform.
SRG - School Redesign Grants is a SEA program from SIG that offers competitive grants to
intervene in the lowest performing local LEA's in the state.

166
Level C and D and F School Designation - State schools in the lowest 20% relative to other
schools in their grade span are designated level C. Schools that are the lowest performing from
the level C group are those eligible to be designated as level D schools. Not more than 4% of the
total number of public schools in (the state under study) can be designated as level D. Level F
schools are designated for state takeover.
Local Stakeholder group - Upon being designated a level D school the Superintendent has 30
days within which they must convene a stakeholders group whose task it will be to make
recommendations to the Superintendent for the Turnaround Plan.
Turnaround plan - written by the Superintendent of the LEA based on the recommendations
from the Local Stakeholders group, this plan must be submitted to the SEA for review by the
Commissioner who may choose to approve the plan for up to three years. The plan must include
specific steps and timelines outlined by the state. The plan is designed to be a template for
applications for SRG application.
School redesign team - the job of the school redesign team is to use the Superintendent’s
turnaround plan to create a three-year redesign plan that will serve as the day-to-day roadmap for
implementation. The redesign team is also tasked with overseeing the operation of the plan and
making adjustments based on data and results as needed.
School redesign plan - is the plan written by the school redesign team to serve as the actual
implementation of the Superintendent’s Turnaround Plan. It may include applying for an SRG
and serves in place of the School Improvement Plan (SIP).
Policy implementers - for the purpose of this research study the policy implementers studied
will be limited to members of the school board, central office, the building principal, and
teachers.

167
Four Models of the Federal Redesign Grants
1) Turnaround - Up to 50% of the staff is excised and a new principal is
brought on board to turn around the underperforming school.
2) Restart - school composition is changed by the LEA and may be taken over
by an External Management Organization (EMO), often a charter school.
3) School Closure - the school is closed and the remaining students are
dispersed to other schools within the LEA.
4) Transformation - the LEA attempts to meet the demands for improved student
gains under its current staff and student configuration.
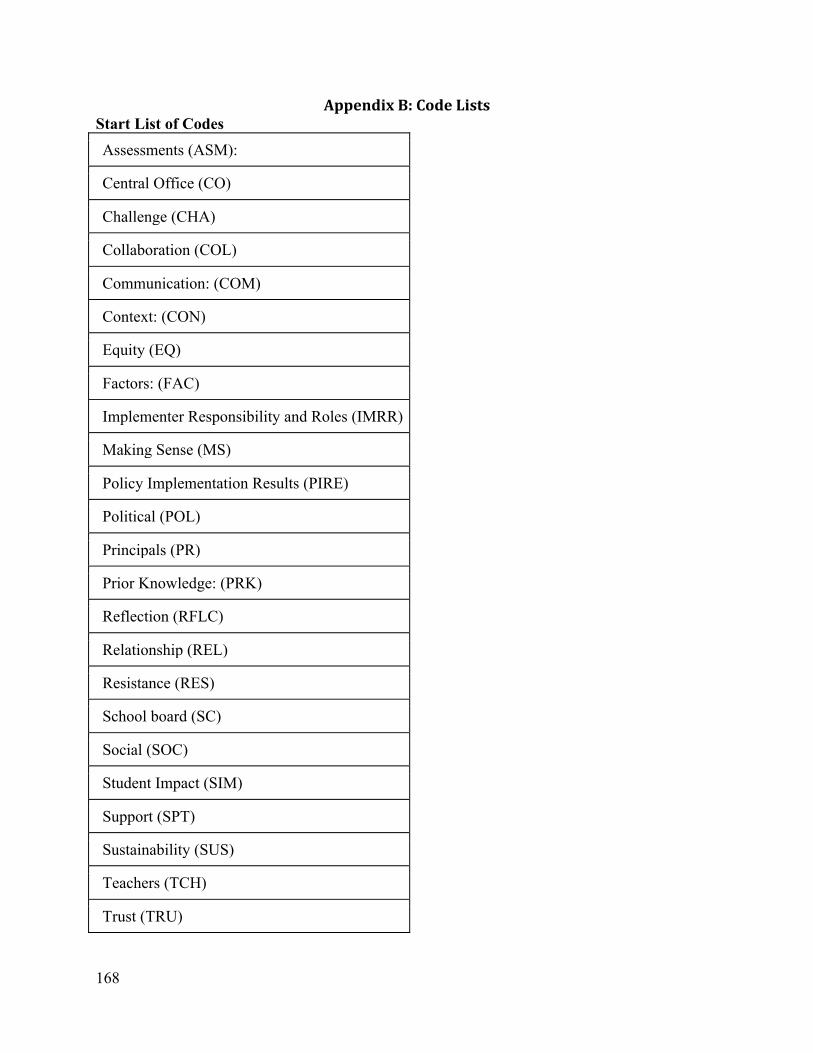
168
Appendix B: Code Lists Start List of Codes Assessments (ASM):
Central Office (CO)
Challenge (CHA)
Collaboration (COL)
Communication: (COM)
Context: (CON)
Equity (EQ)
Factors: (FAC)
Implementer Responsibility and Roles (IMRR)
Making Sense (MS)
Policy Implementation Results (PIRE)
Political (POL)
Principals (PR)
Prior Knowledge: (PRK)
Reflection (RFLC)
Relationship (REL)
Resistance (RES)
School board (SC)
Social (SOC)
Student Impact (SIM)
Support (SPT)
Sustainability (SUS)
Teachers (TCH)
Trust (TRU)

169
Use of data (USD) List of Actual Codes (Parent and Child Codes Included) Communication between Implementers
• Superintendent to Central Office • School Leader to Teacher • School Committee to Superintendent • Superintendent to School Leaders • Between Implementers
Culture/values and beliefs • Culture change • Trust
Resources • Lack of resources • equity of distribution • use of resources • resources to support turnaround
Leadership Behaviors • instructional leadership • distributed leadership • hiring/staffing • directive leadership • shared vision • support/guidance
Collaboration
Sense-making turnaround process sense-making of …
• policy requirements • data • chronic of underperforming contributing factors • state intervention • expectations • directives • roles
Attitude about turnaround
• motivation
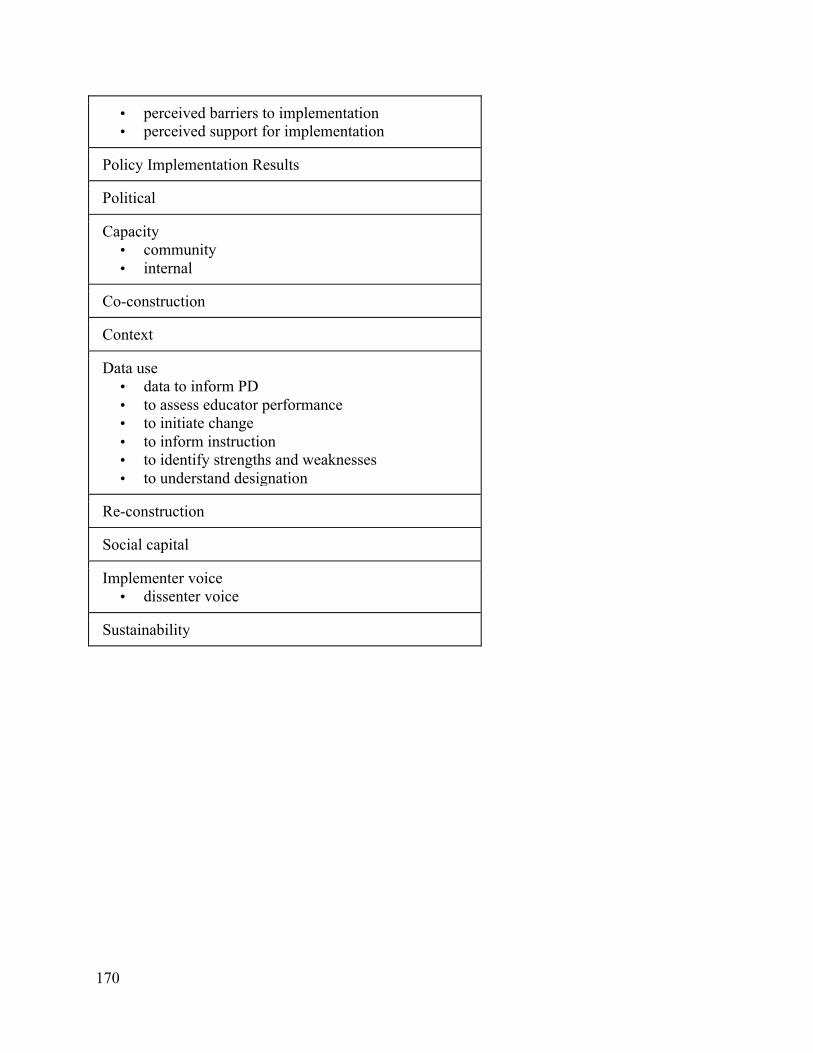
170
• perceived barriers to implementation • perceived support for implementation
Policy Implementation Results
Political
Capacity • community • internal
Co-construction
Context
Data use • data to inform PD • to assess educator performance • to initiate change • to inform instruction • to identify strengths and weaknesses • to understand designation
Re-construction
Social capital
Implementer voice • dissenter voice
Sustainability

171
Appendix C: Consent to Participate in Interview Boston College Lynch School of Education Informed Consent for Participation as a Subject in: Turning Around Schools: A View From the Stakeholders: A study that examines how stakeholder sense-making of turnaround policy influences the planning and implementation of turnaround goals. Investigators: Jamie B. Chisum, Anna Carollo Cross, Jill Geiser, and Charles Grandson. PSAP Ed.D. Class of 2014 Introduction: You are being asked to participate in a research study of the process stakeholders in turnaround LEA's go through to make sense of how to implement turnaround policies. You are being asked to participate because you have a role in the LEA that is directly involved in the implementation of LEA policies in a turnaround LEA. Please read this and feel free to ask any questions you may have before agreeing to be a participant in the study. Type of Consent: Adult Consent Purpose of study The purpose of this study is to examine how stakeholders (school board members, central office personnel, principals and teachers) in turnaround LEA's understand and make sense of their roles in the implementation of turnaround policies. The total number of participants in the study is expected to be 10-20. Members of the research team do not have any financial interest in the study. Description of the Study Procedures If you agree to be a participant in this study, you will be agreeing to participate in a 1-1 ½ hour on site in-person interview or in a location that is mutually agreeable. In addition, if you choose to do so, you will be given the opportunity to review the interview transcript for accuracy; it is estimated that this will take approximately ½ hour. Risks/Discomforts, Benefits of Being in the Study There are no reasonably foreseeable risks to participation. There are no direct benefits to you from participating in the study. However, the findings may be useful to LEA personnel, school board members, and members of the State Departments of Education responsible for communicating or implementing turnaround policies. Understanding the factors that influence the implementation of turnaround policies may raise awareness about how different stakeholders view their roles in the process. You have been selected to participate in this study as an implementer of turnaround policy. Payments/Costs/Voluntary Participation Your participation in this study is completely voluntary. There is no penalty for not participating. There are no payments to you, nor costs to you to participate in the study. Confidentiality The records of this study will be kept confidential. If any published reports are produced as a result of this study, researchers will make every effort to omit or disguise information that may

172
be used to directly identify a participant. All researchers will keep electronic information in a password protected computer file. Audio tape recordings will be held by the individual interviewer until a transcription has been completed and confirmed for accuracy.Those interview recordings will then be destroyed. Access to the records will be limited to the researchers; however, please be aware that the Institutional Review Board and internal Boston College auditors may review the research records. Voluntary Participation/Withdrawal Your participation is voluntary. If you choose not to participate, it will not affect your current or future relations with the University. You are free to withdraw at any time for whatever reason. There is no penalty or loss of benefits for not taking part or for stopping your participation. If any significant findings emerge during the course of the research study that may affect your continued participation you will be notified immediately and the decision to withdraw or continue will be yours. In addition, you may refuse to answer individual questions but continue with participation in the study at any point during the interview process. Dismissal From the Study The investigator(s) may withdraw you from the study at any time for the following reasons: (1) withdrawal is in your best interests, (2) you have failed to comply with the study requirements, or (3) the study is terminated. Contacts and questions The researchers conducting this study are current doctoral students in the PSAP Ed.D program at Boston College: Jamie Chisum, Anna Carollo Cross, Jill Geiser, Charles Grandson For questions or more information concerning this research you may contact a member of the research team: Anna Carollo Cross (508) 875-7851 [email protected] If you have any questions about your rights as a research subject, you may contact: Director, Office for Research Protections, Boston College at (617) 552-4778, or [email protected] Copy of Consent Form You will be given a copy of this form to keep for your records and future reference. Statement of Consent I have read the contents of this consent form and have been encouraged to ask questions. I have received answers to my questions. I give my consent to participate in this study. I have received (or will receive) a copy of this form. Signatures/Dates Study Participant (Print Name)______________________________________________ Participant Signature______________________________________Date____________

173
Appendix D: Semi-Structured Interview Questions We will be interviewing policy implementers in our single case study LEA. We will focus on our stakeholder groups (Teachers, Principals, Central Office Administrators, School board Members). The interview process will begin by having the interviewer go over the consent form and give a brief biography of him or herself in order to disclose any areas of potential biases. Background Questions: 1. How long have you been in the LEA? (member of the community) 2. How long have you been at this school? (serving as a school board, central office) 3. How long have you been in your current role? 4. What is your role? Sense-making 5. What was going through your mind when you first learned that the school/LEA was designated level D? Probe: Did you see any specific concerns or advantages? 6. Did you know it was a possibility? Why? 7. What does the “turnaround plan”(redesign) mean to you? Probe: Why do you think that? Where did you get that from? How did you find out about the turnaround plan or planning process? 8. What do you think the LEA is being asked to do to implement the turnaround plan? Probe: What steps has the LEA taken to implement the turnaround plan? To implement the turnaround plan what have the principal/teachers/school board members/superintendent done? 9. Who do you think is responsible for communicating the requirements of the turnaround plan to you? Probe: Who actually has communicated it to you? 10.Who do you talk to when you have questions about school turnaround? Probe: Where do those conversations take place? Are there any other places you get information? Do people share common understandings about the plan? How does that make you feel? 11. Did you have conversations with colleagues about data before the designation? Probe (if yes): Can you describe those conversations? What did you talk about? How did you talk about it? 12. What is the school/organization turnaround philosophy? Probe: what does that mean? Policy Implementation 13. Who do you think is responsible for understanding the turnaround plan? Probe: How does that understanding look for teachers, principals, central office and school board? 14. What is your role in the turnaround process? Is this role different now than it was before your school became a turnaround school?
174
Probe: If new to the school or new to the role adjust the question. 15. Has your thinking about your role changed since pre-designation? 16. What changes have you observed since the LEA/school was designated a level D school? Probe: Changes in teachers, leadership, community, staff, culture? How would describe the leadership strategy here now and how that is different from before? 17. How have these changes affected you? (personally, behavior, professionally) Probe: What changes have you seen in other people around you?

175
Appendix E: Interview Guide Notes to Interviewer
This interview guide is meant to provide tips for effective interviewing based on the work of Seidman (2006). “Listening is the most important skill in interviewing. The hardest work for many interviewers is to keep quiet and to listen actively” (Seidman, 2006, p. 78). Listen for:
● substance: pay attention to the details of what you are hearing to make sure it is as complete as you want it to be
● inner voice: probe for the thoughts or feelings that may be expressed under the words that are being spoken
● process: listen for substance but remain aware of time, nonverbal cues, pacing and participant fatigue
● Be flexible, ask questions in a different order or skip if the area has already been discussed. ● Focus on collecting data that answers the research questions ● Stay on topic ● Ask follow-up questions that enrich or clarify ● Explore topics if they will add to understanding ● Ask open ended questions, ask participants to “reconstruct” rather than to remember the
situations exactly ● Trust your instincts ● Value silence for participant reflection and thoughtfulness ● Don’t rush ● Don’t answer questions for the interviewee.

176
Appendix F: Interview Script Thank you for participating in today’s interviews. My name is ______________ and I am one of four Boston College Doctoral students working on a research study for our final dissertation. I’d like to explain the study before we begin. We are researching the question of how individuals in turnaround LEA's make sense of the policies they are being asked to implement. At the end of this study we will be preparing a report that will be made available to you if you would like. Would you like to receive a copy? YES/NO Your email?__________________________________ We will be conducting interviews as a team. We will be interviewing principals, central office staff, teachers and school board members, approximately 30 individuals. We will be asking 24 questions of all participants. It will take about 55-60 minutes. The information you share with us today will be confidential. If we do use a quote in the report, it will not be attributed to any particular person. If there are any questions you would like to skip or you would like to stop the interview at any time please let us know. If you have any questions or concerns that you would like to share before we begin the interviews we can stop at this point. Any questions? One of us will be taking notes during the interviews. We will also be taping the interview to make sure we can transcribe your words and comments as accurately as possible. Again we want to assure you that all your responses will be confidential. Shall we begin?
Thank you. Let’s begin with the first question

177
Appendix G: Observation Protocol
Observational Field Notes Setting: Role of Observer Time: Length of Observation:
Description of Event/Object
Reflective Notes


![[MS-AZMP]: Authorization Manager (AzMan) Policy File Format... · 2016. 6. 22. · The AzMan XML policy format is used in order to enable interoperability by implementers. By using](https://static.fdocuments.net/doc/165x107/60af358ece40670cec395f19/ms-azmp-authorization-manager-azman-policy-file-format-2016-6-22.jpg)


