TEACHER BELIEFS ABOUT FACTORS THAT INFLUENCE …
128
ABSTRACT TEACHER BELIEFS ABOUT FACTORS THAT INFLUENCE STUDENT DROPOUT, IMPLICIT THEORIES OF INTELLIGENCE AND SELF-EFFICACY Robin Lenart, EdD Department of Leadership, Educational Psychology and Foundations Northern Illinois University, 2016 Kelly H. Summers and Stephen M. Tonks, Co-Directors This study was an exploratory study examining teacher beliefs about the factors that influence student dropout, their implicit theory of intelligence beliefs, and their self-efficacy beliefs. A three part survey was used in this study. The first part of the survey, an instrument developed for this study, was based on Rumberger’s 2011 Framework for Understanding Dropout. The second instrument was the Theories of Intelligence Scale (TIS; Dweck, 1995) and the third instrument was the Teacher Self Efficacy Scale (TSES; Tschannen-Moran & Hoy, 2001). Participants were 276 secondary teachers. Results indicated that participants placed a higher importance on individual factors than on institutional factors in terms of influence on dropout. Results did not support the hypothesis that positive correlations would exist among the three measured constructs. A positive correlation was found between teachers’ theories of intelligence and their self-efficacy. Further research examining teacher beliefs about the factors that influence student dropout, their beliefs in the malleability of student intelligence, and their own efficacy beliefs is needed.
Transcript of TEACHER BELIEFS ABOUT FACTORS THAT INFLUENCE …

ABSTRACT
TEACHER BELIEFS ABOUT FACTORS THAT INFLUENCE STUDENT DROPOUT,
IMPLICIT THEORIES OF INTELLIGENCE AND SELF-EFFICACY
Robin Lenart, EdD
Department of Leadership, Educational Psychology and Foundations
Northern Illinois University, 2016
Kelly H. Summers and Stephen M. Tonks, Co-Directors
This study was an exploratory study examining teacher beliefs about the factors that
influence student dropout, their implicit theory of intelligence beliefs, and their self-efficacy
beliefs. A three part survey was used in this study. The first part of the survey, an instrument
developed for this study, was based on Rumberger’s 2011 Framework for Understanding
Dropout. The second instrument was the Theories of Intelligence Scale (TIS; Dweck, 1995) and
the third instrument was the Teacher Self Efficacy Scale (TSES; Tschannen-Moran & Hoy,
2001). Participants were 276 secondary teachers. Results indicated that participants placed a
higher importance on individual factors than on institutional factors in terms of influence on
dropout. Results did not support the hypothesis that positive correlations would exist among the
three measured constructs. A positive correlation was found between teachers’ theories of
intelligence and their self-efficacy. Further research examining teacher beliefs about the factors
that influence student dropout, their beliefs in the malleability of student intelligence, and their
own efficacy beliefs is needed.
NORTHERN ILLINOIS UNIVERSITY
DE KALB, ILLINOIS
AUGUST 2016
TEACHER BELIEFS ABOUT FACTORS THAT INFLUENCE STUDENT DROPOUT,
IMPLICIT THEORIES OF INTELLIGENCE AND SELF-EFFICACY
BY
ROBIN LENART
©2016 Robin Lenart
A DISSERTATION SUBMITTED TO THE GRADUATE SCHOOL
IN PARTIAL FULFILLMENT OF THE REQUIREMENTS
FOR THE DEGREE
DOCTOR OF EDUCATION
DEPARTMENT OF LEADERSHIP, EDUCATIONAL PSYCHOLOGY AND
FOUNDATIONS
Doctoral Directors:
Kelly H. Summers and Stephen M. Tonks

ACKNOWLEDGEMENTS
My sincerest gratitude to Dr. Kelly Summers and Dr. Stephen Tonks for their support,
guidance and direction throughout this process.

DEDICATION
To Cade and Natalie

TABLE OF CONTENTS
Page
LIST OF TABLES ............................................................................................................... vi
LIST OF FIGURES ............................................................................................................. vii
LIST OF APPENDICES ...................................................................................................... viii
Chapter
1. INTRODUCTION..................................................................................................... 1
Rationale for the Study................................................................................. 1
Problem Statement…................................................................................... 2
Theoretical Framework................................................................................. 3
Purpose of the Study .................................................................................... 8
Significance of the Study............................................................................. 9
2. REVIEW OF THE LITERATURE…………………………………………...….. 11
Introduction.................................................................................................. 11
Educational Legislation and Policy………………………………………... 11
Measuring Dropout Rates and Associated Data........................................... 16
Factors that Influence Students’ Risk of Dropping Out ............................... 23
The Importance of Teacher Beliefs.............................................................. 35
Implicit Theories of Intelligence .................................................................. 44

v
Chapter Page
Teacher Self-Efficacy.................................................................................... 53
Conclusion ................................................................................................... 57
Research Questions....................................................................................... 58
3. METHOD............................................................................................................... 62
Participants.................................................................................................... 62
Instrumentation and Materials...................................................................... 66
Research Design........................................................................................... 68
Procedure...................................................................................................... 69
4. RESULTS............................................................................................................... 71
Research Question One................................................................................. 71
Research Question Two................................................................................. 75
Research Question Three............................................................................... 76
5. DISCUSSION……………………………………………………………………. 78
Psychometric Properties and Factor Structure.............................................. 79
Importance of Individual and Institutional Factors........................................ 81
Teacher Beliefs About Dropout, Theory of Intelligence and Self-Efficacy.. 84
Strengths……………................................................................................... 88
Limitations …………................................................................................... 89
Directions for Future Research....................................................................... 90
Conclusion and Implications for Practice....................................................... 93
REFERENCES ...................................................................................................................... 95
APPENDICES ...................................................................................................................... 102

LIST OF TABLES
Table Page
1. State Education Twitter Chats by State, Hashtag, Day, Time and
Number of Respondents………………………………………………………………….... 63
2. Participant Demographic Data……………………………………………………………. 65
3. Factor Analysis One: Final Factor Structure for Individual Student Factors ……………. 72
4. Factor Analysis Two: Final Factor Structure for Institutional Factors……………………. 73
5. Descriptive Statistics for Study Variables………………………………………………… 75
6. Intercorrelations Among all Primary Study Variables……………………………………. 77

LIST OF FIGURES
Figure Page
1. Rumberger’s 2011 Framework................................................................................................. 6

LIST OF APPENDICES
Appendix Page
A. FACTORS THAT INFLUENCE DROPOUT..................................................................... 102
B. ITEM WORDING OF TSES SHORT FORM BY SUBSCALE.......................................... 115
C. TIS ITEM WORDING.......................................................................................................... 118

1
CHAPTER 1
INTRODUCTION
Rationale for the Study
At the beginning of the twenty first century, Robert Balfanz stated “the United States is
developing a deep social consensus that American high schools should ensure that all
adolescents graduate from high school prepared for post-secondary schooling and training”
(Balfanz, 2009, p.17). Harvey and Housman (2004) argue “a high-school diploma has become
the essential foundation of economic and civic life in the United States” (p. 18). Given the
growing scarcity and competitiveness for jobs that pay a living wage coupled with the demands
of the global economy for skilled and educated workers, it is difficult to dispute that graduation
from high school is related to economic self-sufficiency. Industries that once provided high-
paying, low-skill employment options for high school dropouts have been replaced with
technology and/or moved to other countries where labor is cheaper (Harvey & Housman, 2004).
A report published in June 2013 by the Georgetown University Center on Education and
the Workforce predicts jobs will increase from approximately 140 million to 165 million through
2020, with 55 million job openings available through a combination of newly created jobs and
retirements. While 65% of these jobs will require at least some college, all of them will require a
high school diploma (Carnevale, Smith & Strohl, 2013). With the majority of jobs available
requiring at least some college, the need for a high school diploma is evident.

2
In spite of statistics indicating the importance of, and need for, a high school diploma,
every year hundreds of thousands of students drop out of high school (Stetser & Stillwell, 2014).
The number of high school dropouts in the United States is problematic because of the negative
outcomes associated with dropping out, including fewer opportunities for gainful employment
(Bureau of Labor Statistics, 2015). Jobs are available but earning potential is limited for students
who drop out of school and do not earn a diploma. Overall, average earnings for workers over
the age of twenty five with a high school diploma are 38% higher than workers without a
diploma (Bureau of Labor Statistics, 2014). Unemployed and low wage earners cost the nation in
lost productivity and reduced income tax contribution (Rumberger, 2001). Dropouts are also
more likely to have health problems, engage in criminal activity, and become dependent on
welfare and other government programs than high school graduates (Rumberger, 1987).
Problem Statement
The problems associated with high school dropout are exacerbated for minorities and
students from low income households. While the U.S. Department of Education reports dropout
rates overall have declined for Whites, Blacks, and Hispanics since the early 1970’s, dropout
rates for Black and Hispanic students have been consistently higher than the national average
(Stark & Noel, 2015). Data on dropout rates collected by the National Center on Educational
Statistics also indicated dropout rates for students from low income households are significantly
higher than students from middle and high income households (Stark & Noel, 2015). Not only
are dropout rates higher, but unemployment rates are also higher for minorities. As of April

3
2016, the unemployment rate for Blacks was 8.8 %, for Hispanics, 6.1 %, and for Whites was 4.3
% with the national average being 4.3 % (Bureau of Labor Statistics, 2016).
Schools are charged with the responsibility of educating all students, regardless of
ethnicity, race, and poverty status. For schools that serve minority and low income students,
disengagement and dropout continue to be significant problems that have detrimental effects on
students, schools and society (Rumberger, 2011). As educational leaders, school administrators
are responsible for ensuring that teachers understand the importance of their role in the
classroom, and that they are implementing pedagogical practices that support student learning to
the greatest extent possible for as many students as possible. Teacher beliefs can affect their
pedagogical practices in the classroom as well as their interactions with students. While student
dropout is influenced by a multitude of factors, there are factors that educators have a significant
impact on, including school and classroom climate, student-teacher relationships, and quality of
instruction that can significantly impact student achievement and help to mitigate the dropout
problem (Hattie, 2009).
Theoretical Framework
A Framework for Understanding Dropout
There are many conceptual frameworks to examine student dropout and most contain an
element of personal or student characteristics, and school or environmental characteristics. For
this study, Rumberger’s (2011) conceptual framework is used (see Figure 1). Rumberger argues
the only way to fully understand the dropout crisis is to examine student dropout within a

4
conceptual framework that acknowledges both individual and institutional factors that influence
student dropout. He argues that due to the complexity of student dropout, it is impossible to
establish causal effects, but it is possible to establish factors and characteristics that can predict
which students are at a higher risk of dropping out (Rumberger, 2001). This conceptual
framework emphasizes individual factors associated with students in three areas: Academic
achievement, educational persistence, and educational attainment. The three major institutional
contexts which influence students are families, schools and communities. While both individual
and institutional factors are equally important, the way they interact can change over time as
students progress through school (Rumberger, 2011).
The first of the four domains of the individual portion of Rumberger’s (2011)
framework, academic performance, considers educational achievement reflected in test scores
and grades, and educational persistence indicated by whether students remain in the same school
(mobility) or remain in school at all (dropout). Educational attainment refers to progressing in
school (earning credits, promoting to the next grade) and completing school by earning a
diploma (Rumberger, 2011). The second domain of the individual portion of the framework is
behaviors. The first factor in this domain is engagement. Rumberger describes engagement as
students being intellectually interested and cognitively involved with their learning, and
displaying behaviors such as compliance, participation in the classroom and work completion.
(Rumberger, 2001). Other factors in the behaviors domain are coursework (the types of courses
students are enrolled in), deviance (misbehavior, drug use, not attending school), peer
associations, and employment. The third domain, attitudes, refers to students’ goals, values and
self-perceptions (perceived competence, perceived autonomy, perceived sense of belonging).
5
The fourth domain, background, refers to student demographics (race, gender), health, prior
academic performance and past school related experiences such as pre- school and summer
school.
Rumberger (2011) argues that individual student factors are influenced by the three major
institutional settings in which students live: family, school, and community. The institutional
portion of the framework considers key features of students’ institutional environments of
family, school and community as they relate to the likelihood that a student will drop out of
school. Factors in the family setting include structure, resources and practices. Family structure
refers to the people who live in a student’s household, and whether it is a single or step parent
household. Family resources refers to socioeconomic status. Family practices refer to the level
of family support a student receives, and parenting style. Factors in the school setting include
student composition, structure, resources, and practices. Student composition includes the overall
racial, gender and socioeconomic makeup of the student population. Resources include the
monetary support that the school receives from the government, quality of facilities, technology,
academic resources, as well as the number and quality of teachers and staff. School practices
include school schedules, rules, procedures, curricular offerings, retention policies and
alternative education offerings. School practices also refer to teacher pedagogical practices in the
classroom. Community refers to the predominant socioeconomic status, values, and racial/ethnic
makeup of the residents in the area where the school is located. Of the three contexts of the
institutional framework, school factors can be most directly affected by educational policy and
practices (Rumberger, 2001). Because teacher beliefs can influence their pedagogical practices
and behaviors in the classroom, which in turn can influence student academic performance, the

6
relationship between teacher beliefs about the causes of student dropout as described in
Rumberger’s framework, teachers’ implicit theories of intelligence and their self-efficacy beliefs
will be examined.
Figure 1. Rumberger’s 2011 Framework
Implicit Theories of Intelligence
Dweck, Chiu and Hong (1995) presented a model for identifying individuals’ implicit
theories and how they relate to beliefs about human actions and outcomes. They define implicit
theories as core beliefs, or mindsets. They argue individuals tend to have one of two distinct sets
of beliefs regarding the malleability of certain traits. Entity theory refers to individuals who
believe attributes such as intelligence are fixed, nonmalleable entities. An entity theory of
intelligence illustrates the belief that although it is possible to learn new things, intelligence is a
fixed trait that cannot be changed or improved significantly. Incremental theory refers to

7
individuals who believe attributes such as intelligence are malleable and can be changed and
developed significantly with effort. An incremental theory of intelligence illustrates the belief
that an individual can increase his or her intelligence by exerting effort to challenging learning
experiences (Dweck et al., 1995). In more recent publications, Dweck refers to implicit theories
as mindsets, with entity theory referred to as “fixed mindset” and incremental theory referred to
as “growth mindset” (Dweck, 2006). Dweck and colleagues (1995) assert that holding one view
over another (entity vs. incremental) influences the way that individuals approach challenging
situations, the way they behave when faced with a difficult task, and what they attribute success
or failure to. Research suggests teachers’ implicit theories of intelligence can influence students’
beliefs about intelligence (Pretzlik, Olsen, Nabuko & Cruz, 2003), which in turn impacts
students’ motivation and achievement (Aronson, Fried, & Good, 2002; Blackwell, Trzesniewski,
& Dweck, 2007;Dweck, 1999).
Teacher Self-Efficacy
Teacher efficacy has been defined as “teachers’ belief or conviction that they can
influence how well students learn, even those who may be difficult or unmotivated” (Guskey &
Passaro, 1994, p.4). Teachers self –efficacy beliefs have been positively correlated to student
achievement (Ashton & Webb, 1986; Ross, 1992), potentially making teacher self-efficacy an
important construct in understanding and preventing student dropout. However, teacher self-
efficacy is context specific; while teachers may feel efficacious teaching certain subjects to
certain students, they may not feel as efficacious in different circumstances with different
students, especially students that may not respond to instruction as expected (Ross, 1994).

8
Teachers’ efficacy beliefs influence their persistence when faced with challenge and their
resilience when setbacks occur (Tschannen-Moran, Hoy & Hoy, 1998).
Teaching students at risk can be a challenging task; when faced with this task, teacher
beliefs can influence the way they approach the challenge. A teacher who believes that school
factors, specifically pedagogical choices and actions, significantly affect student dropout may be
more likely to implement practices that engage students in learning than a teacher who believes
that individual student factors beyond their control have a larger effect on dropout. A teacher
with an incremental theory of intelligence may be more likely to persevere and use a variety of
methods to teach students who are not academically successful, based on the belief that their
efforts will positively impact student intelligence and academic achievement. Teacher beliefs
about the factors that influence dropout and their implicit theory of intelligence may affect their
perceptions of self-efficacy in the classroom.
Purpose of the Study
This study examines the relationships between teacher beliefs about the factors that
influence student dropout, teachers’ implicit theory of intelligence, and teacher self-efficacy.
Reliable and valid instruments exist to measure teachers’ implicit theories of intelligence and
self-efficacy, the Theory of Intelligence Scale (TIS; Dweck, 1995) and the Teacher Self-Efficacy
Scale (TSES; Tschannen-Moran & Hoy, 2001). However, because no instrument exists to
measure teacher beliefs about the factors that influence dropout as Rumberger theorized in his
2011 framework, a survey was created for this study. Examining teacher beliefs about factors
9
influencing student dropout, their beliefs about the malleability of students’ intelligence and
capacity for learning, and their beliefs about their own efficacy when working with challenging
students can contribute to the literature on dropout prevention. A deeper understanding of the
role of teachers in preventing student dropout can help states, school districts and schools
develop and implement more effective dropout prevention strategies and interventions.
Significance of the Study
Teachers are a crucial component of any dropout prevention and/or intervention strategy.
Teachers interact closely with students on a daily basis, and can have a significant influence on a
student’s level of achievement (Hattie, 2009) and subsequent educational outcomes. Rumberger
(2001) argues that student engagement is a crucial factor influencing student dropout or
completion of high school. There are many studies on student perceptions of teacher effect on
student engagement and dropout indicating students believe in the importance of teacher
influence on their success or lack thereof (Brewster & Bowen, 2004; Fall & Roberts, 2012;
Iachini, Buettner, Anderson-Butcher, & Reno, 2013). However, there is little in the research
regarding teacher beliefs about the causes for student dropout and the extent to which teachers
believe they can influence dropout. Teacher beliefs about the aspects of Rumberger’s framework
that are most influential in leading to student dropout, their beliefs about the malleability of their
students’ intelligence, and their perceptions of their ability to influence student learning
outcomes can affect their behaviors in the classroom toward students as well as their pedagogical
practices, thereby influencing student levels of engagement, achievement and attainment. For

10
educational administrators involved in leading teachers and developing school climates
supportive of student learning, knowledge of teacher beliefs about the aspects of Rumberger’s
framework can inform decisions about resource allocation, such as programs to identify and
support struggling students, remediation, credit recovery opportunities for students, and
professional development for teachers who work with students at risk of dropping out.
The following research questions will guide this study:
RQ1: What are the psychometric properties of the survey “Factors that Influence Dropout” and
how do they match up to Rumberger’s framework?
RQ2: What importance do teachers assign to factors leading to student dropout?
RQ3: What are the relationships among teacher beliefs about factors that influence student
dropout, their implicit theory of intelligence beliefs, and self-efficacy beliefs?

11
CHAPTER 2
REVIEW OF THE LITERATURE
Introduction
This study focuses on factors teacher believe influence student dropout, teachers’ implicit
theories of intelligence, and teacher self-efficacy. The literature review contains information on
student dropout and lack of educational attainment in the United States, including how policies
and practices have changed over time in relation to student dropout, and how dropout statistics
are obtained and measured. Additionally, factors influencing student dropout, which include
academic performance (particularly in the ninth grade), family and demographic characteristics,
mobility, and the significance of teacher beliefs about the factors that influence student dropout,
implicit theories of intelligence and teacher self-efficacy are also reviewed.
Educational Legislation and Policy
Since the 1980s schools in the United States have experienced pressure to increase
academic achievement, to focus on college prep courses, and to increase graduation requirements
(Smith & Lincoln, 1988). At the same time, the level of accountability for schools has also
increased (Smith & Lincoln, 1988). While the goal of these changes was to improve student

12
academic performance, it has created an even greater sense of alienation and disengagement
from the school setting for students who have responded negatively to the organization, structure
and expectations of the school environment, which puts many students at risk of school failure
and dropout (Smith & Lincoln, 1988).
In 1983, the National Commission on Educational Excellence published a report entitled
A Nation at Risk. Findings indicated high school students in the United States were academically
lagging behind students in other countries, especially in areas of math and science, the driving
forces behind economic innovation. Findings were divided into four categories: Content,
expectations, time, and teaching. Overall, it was reported that students were not being offered or
pushed into higher level coursework, and average achievement and time spent on homework and
math courses was much lower than average achievement and time spent on homework and math
courses by students in other countries despite the fact that grades were getting better (Gardner,
1983). The commission recommended increased academic standards for high school courses and
increased requirements for graduation. Implementation of the recommended reforms proved
relatively ineffective because of inconsistent implementation and enforcement at the local level
(Carlson & Planty, 2012).
As a follow-up to A Nation at Risk, in 1986 the Carnegie Forum on Education and
Economy published A Nation Prepared: Teachers for the 21st Century. This report called for
increased rigor of teacher preparation programs, higher standards for becoming a teacher and for
professional standards for teachers in practice, as well as increased teacher salaries for added
appeal of the profession for the nation’s top college graduates. Like A Nation at Risk, the report
detailed the components of education reform needed to make our schools competitive with other

13
nations; however, both left the implementation of the recommended reforms to states and local
governments, including one of the most important aspects, funding. How schools in poverty were
to implement the recommended reforms was not addressed, making it difficult, if not impossible,
for schools with the fewest resources and greatest numbers of struggling students unable to
implement them (Sunderman, Kim, & Orfield, 2005).
Although these reports greatly increased public awareness of the need for educational
reform, for many minority students and those living in poverty, reforms were not implemented
due to lack of resources. This issue was examined in Jonathan Kozol’s Savage Inequalities
(1992). Kozol exposed the tiered system of educational opportunities as a significant factor in
creating a disenfranchised population of students and a perpetual underclass. He delivered a
detailed and disturbing description of the lack of educational opportunities available to urban
minority students living in poverty, providing more insight into why the number of students
dropping out of school with few academic and social skills continued to grow. He attributed the
lack of quality education and high dropout rates for students living in poverty to the school
funding system in the United States, which is based on local property taxes. In areas where
property values are very low, even with high tax rates schools cannot be adequately funded. He
argues for schools to be funded equitably through the federal government to create a more
equitable public education system in the United States (Kozol, 1992).
In 2001, major federal education legislation was updated and enacted. As part of the
reauthorization of the Elementary and Secondary Education Act, Congress enacted the No Child
Left Behind Act (NCLB, 2002), increasing the federal government’s role in evaluating the
quality of education in the United States. Prior to NCLB, state and local government entities
14
were primarily responsible for establishing learning standards and evaluating their
implementation. This legislation required states to not only establish learning standards but to
assess all students on a yearly basis. It gave detailed rules for how schools would be evaluated by
standardized test scores. In addition, it required that all teachers be “highly qualified” in the
subject area they were teaching.
The merits of No Child Left Behind and its effects on student achievement and the field
of education in general have been debated since its enactment. One major criticism is the reforms
are mandated by the federal government, but funded by state governments, leaving many schools
unable to fund the mandate (Sunderman et al., 2005). However, prior to NCLB, schools in areas
of poverty were not consistently providing students with a high quality education, as Kozol
illustrated in Savage Inequalities. This legislation attempted to address that fact and provided a
framework for improvement. However, because it was implemented differently among different
districts throughout the United States, and because of the complex interaction of multiple factors
affecting the dropout rate, it is difficult to determine what effect this legislation has had on
dropout rates in areas of poverty, which remain higher than the national average.
The 2009 American Recovery and Reinvestment Act included an incentive for educators
across the country to apply for money through a federal grant program called Race to the Top.
Eighteen states and Washington, DC received funds from the grant. However, the $4.35 billion
allocated represented 1% of the nation’s total education spending; so while the federal
government funded many proposals submitted by states to improve education, it did not address
the fundamental issues associated with local property taxes as the basis for school funding
(American Recovery and Reinvestment Act, 2009). While legislation was enacted to increase the
15
quality of education in the United States, as well as reduce the dropout rate, without legislation to
address other components of this complex problem, such as funding inequities, it seems that
legislation alone cannot significantly reduced the dropout rate. Legislative efforts of the past fifty
years have yet to demonstrate a significant positive impact on school dropout in the United
States.
While educational policy has thus far not solved the problems exacerbated by inequities
in funding and resources in schools throughout the United States, the Every Student Succeeds
Act, recently signed into law by President Obama in December 2015, seeks to address some of
the shortcomings of previous education policy and legislation (specifically the No Child Left
behind Act), by allowing states to determine their own measures of student progress based on
annual standardized testing results. While states will still administer standardized tests annually,
they will not be the only measure of student learning. ESSA allows for multiple measures of
learning and progress, as well as other measures of student success to make school accountability
decisions. Furthermore, the construct of Adequate Yearly Progress, which was set by the federal
government based on schools’ overall standardized test scores, will no longer be used. This
change was based on the premise that standardized tests do not provide a complete picture of
student learning, and unfairly punish schools that are located in areas of poverty, and have
inadequate funding (ESSA, 2015). The Every Student Succeeds Act further attempts to address
the issue of funding inequities by developing a pilot program for a weighted student funding
formula. In this pilot program, schools are allowed greater flexibility in their use of federal Title
I funds in exchange for a commitment to equitable distribution of state and local funds, based on
per pupil expenditures, to their highest poverty school districts. ESSA does not mandate

16
equitable funding structures be implemented at the state level; however, this pilot program
acknowledges that educational funding can have a significant impact on student outcomes.
While policy, legislation and funding are important aspects of the public education
system, they are components of a large, complex institution. The actions of educational leaders
and teachers must be in compliance with the legal requirements set forth by governmental
agencies, and these requirements provide a context and structure for the daily activities that
occur within schools. In this study, teacher beliefs are examined as one component of the
complex public education system that influences its overall effectiveness in providing quality
education to all students, culminating in high school graduation. Because of the complexity of
the problem of student dropout, the solution to this problem will likely be comprehensive, based
on broad components such as legislation and policy, as well as more narrowly focused
components such as teacher beliefs and practices.
Measuring Dropout Rates and Associated Data
Getting an accurate measurement of dropout rates can be difficult due to the ways that
data on student dropout is collected, defined and measured. State education agencies (SEAs)
report student data to the National Center for Education Statistics (NCES), the federal entity that
collects public education data for the United States Department of Education. Data from 2012
and beyond is submitted through the EDFacts system, a digital data management system,
designed to streamline the data collection and reporting process. Additionally, the Current
Population Survey is a statistical survey conducted by the United States Census Bureau for the

17
Bureau of Labor Statistics. This survey is primarily designed to collect data on employment, but
demographic information such as education level is also collected.
There are several different ways to define and calculate the terms dropout and
graduation. NCES defines the event dropout rate as the percentage of students who were
enrolled in grades 9-12 during a given school year, were not enrolled in school during the
following school year, and had not earned a high school diploma or completed a state-or district-
approved education plan (U.S. Department of Education, 2015). This is different than the status
dropout rate, which includes all people ages 16-24 that are not enrolled in school and have not
earned a diploma or a high school credential, making those rates higher than the event dropout
rate (Stetser & Stillwell, 2014). High school completion rate is also measured by NCES, but is
calculated differently than graduation rate. Two of the main differences are that “completion”
includes equivalency certificates and graduation from alternative education programs. It also
does not place a time limit on completion, as graduation rate does (Stetser & Stillwell, 2014).
NCES calculates graduation rates using the Average Freshman Graduation Rate (AFGR),
which became a required reporting statistic for states for the 2011-2012 school year (National
Center for Educational Statistics, 2014). This statistic provides an estimate of the percentage of
high school students who graduate on time by dividing the number of graduates with regular
diplomas by the estimated size of the incoming freshman class four years earlier, expressed as a
percent. NCES also calculates the Adjusted Cohort Graduation Rate (ACGR), which is another
required reporting statistic. From the beginning of ninth grade (or the earliest high school grade)
students who are entering that grade for the first time form a cohort that is “adjusted” by adding
any students who subsequently transfer into the cohort from another state and subtracting any
18
students who subsequently transfer out, emigrate to another country, or die (Stetser & Stillwell,
2014). While the ACGR is more accurate than the AFGR, both statistics can provide a more
accurate reflection of the dropout rate, in that a district may have an event dropout rate for a
school that only represents the number of students who left school that year, not the cumulative
numbers for each of the four years a cohort attends high school. The overall national ACGR was
80% in the 2011-2012 school year, meaning that 80% of students received a regular diploma
within four years’ time (Stetser & Stillwell, 2014). The ACGR varied widely from state to state,
from 59% in the District of Columbia to 89% in Iowa. The overall national ACGR by ethnicity
was 88% for Asian/Pacific Islanders, 86% for White students, 73% for Hispanic students, and
69% for Black students. For economically disadvantaged students the ACGR was 72%, for
students with Limited English Proficiency it was 59% and for students with disabilities it was
61% (Stetser & Stillwell, 2014).
The overall event dropout rate in the United States in 2012 was 3.4%, with significant
variance in event dropout rates for different ethnic groups. Rates were much higher for Hispanic
(6.8%) and Black students (5.4%) than White students (1.6%) (Stark & Noel, 2015). Dropout
rates may be higher than indicated by national statistics; dropout rates for Hispanic and Black
students are estimated to be much higher than the rates calculated by the government (Hauser,
Frederick & Andrew, 2007; Neild & Balfanz, 2006; Tyler & Lofstrum, 2009). Using Current
Population Survey (CPS) data Hauser and colleagues estimated dropout rates to be 11.5% among
whites and others, 18.3% among Blacks, and 21.6% among Hispanics, with dropout rates being
higher for schools located in central cities as compared to suburban schools.

19
The overall status dropout rate in the United States in October 2012 was 6.6%. Status
dropout rates varied by ethnicity; while they have declined for all groups over the past 40 years,
they were higher for Black and Hispanic people (7.5% and 12.7%, respectively) than the status
dropout rate for Whites (4.3%) and Asians (3.3%) (Stark & Noel, 2015).
To illustrate the complexities in calculating accurate dropout and graduation statistics,
Neild and Balfanz (2006) examined data from the Philadelphia Public School database for
approximately 130,000 students enrolled in sixth through twelfth grade to analyze student
dropout patterns and trends. The looked at event or annual dropout data for the 2003-2004 school
year as well as longitudinal cohort graduation rates for the freshman class that entered high
school in 2000. In looking at the 2003-2004 school year data, they found that of the 26, 224
students who left Philadelphia’s public schools, 41% were graduating seniors, 27% transferred to
another school or district, with the remaining number of students (approximately 8,000) left the
district without earning a diploma or indicating that they were transferring to another school or
program. The majority of these students were in grade 10 or lower. Additionally, they divided
the construct of dropout into two categories: formal and informal. Formal dropouts stopped
attending school altogether. Informal dropouts had such low attendance that they were absent
from school more often than they attended. They labeled these groups “dropouts” and “near-
dropouts”, respectively. In addition to the formal dropouts, there were an additional 5,188
students that were classified as “near dropouts”. Researchers then analyzed the data for dropouts
based on ethnicity, socioeconomic status (SES), and gender. They argue that while dropouts and
near dropouts were represented at higher rates among African Americans (17.7%) and Hispanics
(19.4%), rates were high enough among Whites (14.6%) and Asians (11.8%) to be a cause for

20
concern as well. In examining the effects of poverty on dropout rates, they found that schools
with over 75% or more low income students, nearly 26% were dropouts or near dropouts, while
schools with less than 40% low income students, 10% were dropouts or near dropouts. When
examining cohort/status dropout data, they found that among all students who began 9th
grade in
Philadelphia Public Schools in 2001, between 41 and 46% graduated four years later, and
conversely, 27 to 35% of the students had dropped out. This data indicates that event dropout
data does not accurately reflect the number of students from each freshman class that graduates
in four years.
Balfanz and Letgers (2004) used data from the Common Core of Data collected by the
National Center for Education Statistics to examine what they termed the “promoting power” of
high schools throughout the United States. They define this measure as the number of freshman
enrolled at a high school compared to the number of seniors enrolled four years later. While they
acknowledge that this is not the same measure as the graduation or dropout rate, they argue that
is does provide a reliable indicator of whether schools are performing effectively to meet the
goal of having all students graduate within four years, based on the assumption that when the
number of seniors is close to the number of freshman that were enrolled four years earlier, most
of the students remained in school and promoted at each grade level. They used two cut points to
identify high schools as having extremely weak and weak promoting power. Schools with
extremely weak promoting power had 50% or fewer seniors enrolled than freshman four years
earlier, and schools with weak promoting power had 60% or fewer seniors enrolled than
freshman four years earlier. They found that 18% of high schools in the United States with
enrollments of 300 or more students could be classified as having weak promoting power.
21
Further analysis of enrollment data revealed that high schools with weak promoting power are
those that serve high percentages of minority students. Three percent of high schools that enroll
90% or more white students can be classified as having weak promoting power, while 66% of
high schools that enroll 90% or more minority students have weak promoting power. Overall,
approximately 46% of African American students and 39% of Latino students in the United
States attend schools with weak promoting power, in which at 40% of the students that began as
freshman are not enrolled as seniors, compared to 11% of white students in the United States.
Furthermore, data indicated that high schools with the weakest promoting power were
concentrated in urban areas. New York, Chicago, Los Angeles, and Philadelphia were the cities
with the greatest number of weak promoting power high schools (Balfanz & Letgers, 2004).
There are many reasons why it is difficult to get accurate data despite the abundance
being collected by federal government entities such as the National Center for Education
Statistics and housed in federal databases such as the Common Core of Data. States report annual
enrollments, but do not track students over time. For example, states report data used to calculate
event dropout rates once per year in October. A student could be enrolled in October, stop
attending in November and then return the following October and be counted the same as a
student who had attended the entire school year. In schools, principals report student status
according to their interpretations and the information at hand; this may or may not be accurate.
For example, a student may report that they are transferring to another school and not enroll at
another school. There are also reporting discrepancies between states on students who do not
attend school, are incarcerated or who have obtained a General Equivalency Diploma. Students
who drop out before 9th
grade are often not counted at all. Underreporting is common, and

22
neither state nor federal agencies are responsible to check the data (Kaufman, 2004; Orfield,
2004). This can make it difficult to track dropout and graduation trends over time for specific
demographic groups as well as to determine how significant the problem of student dropout is.
In order to develop effective interventions to prevent student dropout, states, school
districts and schools must have an accurate knowledge of the scope of the problem, which in this
case means having an accurate account of the number of students that begin high school but do
not finish. While national and state graduation rates can give an overview, this type of aggregate
data does not accurately reflect the wide discrepancies that exist for minority, economically
disadvantaged students or those with limited English proficiency or disabilities. While NCES is
attempting to address this issue with the development of the EDFacts system, a national student
information database with specific reporting protocols for state reporting does not yet exist.
For the purpose of this study, the terms “graduation” and “high school completion” will
refer to the NCES definition of graduation, meaning that students completed high school with a
diploma within four years. “Dropout” will refer to students who are not enrolled in school, or
have enrolled in a GED program and/or obtained a GED. The reason for the use of these
definitions is that once students leave school, it is difficult to determine their status. Additionally,
employment and educational outcomes for students with a GED are more similar to those for
students that have dropped out than those that obtained a high school diploma (Rumberger,
2011).

23
Factors that Influence Students’ Risk of Dropping Out
Academic Performance in 9th
Grade
As early as first grade, academic and achievement factors can predict likelihood of future
dropouts (Alexander, Entwisle & Kabbani, 2001). Using data from the Baltimore City Public
Schools’ Beginning Schools Study, researchers tracked 800 randomly selected students from first
grade to dropout or graduation. They examined the relationship between dropping out and
socioeconomic status (SES), as well as academic, family, and personal characteristics, including
parent attitudes, general academic performance, grade retention and tracking, and pupil
engagement behaviors and attitudes. Results of the study indicated a strong relationship between
low test scores and poor grades in first grade and eventual student dropout. Fifty-eight percent of
students with low test scores in first grade eventually dropped out, compared with 22 % of
students with high test scores. They also found that 60% of students with D and F grades in first
grade dropped out, compared with 19% of students with A and B grades. Additionally, they
found that retention in first grade was a strong predictor of drop out; 67% of students retained in
first grade eventually dropped out of high school. Resilience factors were also examined in this
study, and results indicated that students who felt engaged in school, based on a self-assessment,
were less likely to drop out. Researchers also found student engagement, as measured by a
teacher evaluation, was a more accurate predictor of student drop out; these trends extended from
first grade to the point of drop out. Parent involvement and attitude toward education correlated
positively to risk of dropping out as well. Students whose parents expressed a positive attitude
24
toward school and their child’s abilities were twice as likely to remain in school as students
whose parents held negative attitudes.
Academic performance in ninth grade holds particular significance as an indicator of
future academic achievement, including high school graduation. In transitioning from eighth to
ninth grade, significant changes can occur in social and academic supports, peer relationships,
sense of school membership, sense of self identity, perceived stressors, GPA, attendance, and
sense of autonomy (Isakson & Jarvis, 1999). Students report a perceived decreased quality of the
school environment, decreased academic, personal, and interpersonal functioning at grade
transitions (Barber & Olsen, 2004). Students also report a decrease in school engagement as well
as an increase in peer engagement (Seidman, Aber, Allen, & French, 1996).
Stearns and Glennie (2006) studied two aspects of the dropout process; whether the
reasons students dropped out of school varied by age and grade levels, and whether ethnic and
gender groups’ reasons for dropping out varied across different age levels and age groups. Data
came from the North Carolina Education Research Data Center at Duke University, which
houses data on every public school student in the state beginning with the 1996-1997 school
year. This information is reported every October for the previous school year’s students. Using
all students in the North Carolina public school system during the 1998-1999 school year as their
sample, they analyzed data from over 200,000 students. Schools reported the reasons for
dropping out, rather than the dropouts reporting the reasons themselves. Researchers compared
dropout reasons by grade, age, gender and ethnicity. Reasons the school reported for dropping
out included academic problems, disciplinary problems (including suspensions, expulsions, and
incarcerations), employment, family reasons (including pregnancy, marriage, and caring for

25
children), and attendance reasons. The researchers found significant variation by grade level,
age, gender, and ethnicity for reasons students drop out of high school. As hypothesized,
employment as a reason for dropout increased with age and grade level. Girls were more likely
to drop out than boys for family reasons, with Latina and African American girls more likely to
do so than White girls. A significantly higher proportion of ninth grade students dropped out for
disciplinary reasons than students in higher grades, with almost 11% of all ninth graders and 9%
of dropouts under the age of 16 dropping out for this reason. Additionally, they found that male
and African American students were more likely to drop out for disciplinary reasons than
females and other ethnicities. Boys were found to be more likely than girls to drop out for
academic reasons, with White boys being more likely to drop out for academic reasons than
other ethnicities.
Roderick and Camburn (1999) reported that in Chicago, over 40% of ninth graders fail
one or more major subjects in the first semester and recovery from this ninth grade failure is
unlikely. The researchers suggested there are individual characteristics of the students, such as
low academic skill level and low levels of family support that contribute to failure. From this
perspective, they state:
We have set up urban schools to fail. They look and attempt to act like suburban schools
with academic curriculums and social and academic demands that urban students are not
capable of given the skills and the resources they bring to school (Roderick & Camburn,
1999, p. 307).
The study also examined ninth grade failure from the perspective of school effects, which
included environmental, institutional and school climate. The study concluded student failure can

26
be attributed to a combination of personal factors (low academic skills and family support) and
institutional factors. The reality being that urban high schools do not have the resources to
support a positive and successful transition during the ninth grade year (Roderick & Camburn,
1999).
In 2005, Allensworth and Easton introduced the “On-Track Indicator” for use in Chicago
Public Schools, to determine whether freshman students were on track to graduating high school
within four years. Students are considered on track if they have accumulated five full course
credits by the end of their freshman year (the amount required to promote to tenth grade), and
have not received more than one failing semester grade in a core class (English, math, science or
social studies). Using data from Chicago Public Schools student database on credits earned by
26,562 freshman enrolled during the 2003-2004 school year, as well as course pass rates for
students enrolled as freshman from 2000-2001 school year through the 2003-2004 school year,
researchers were able to predict student graduation rates using the on track indicator with 80%
accuracy. They found this indicator to be more accurate as a predictor of graduation than student
test scores at the end of eighth grade. They found that even for students entering high school in
the top quartile of test scores, by the end of freshman year, 22% were off track, and only 37%
eventually graduated four years later. At the other end, 68% of students in the bottom quartile of
test scores graduated in four years if they were on track at the end of their freshman year.
Researchers argue student academic test scores, which are frequently used to place students in
courses as well as academic interventions, less accurately predict whether or not a student will
graduate than course failure during the ninth grade. In a 2014 follow up and review article,
Allensworth, Gwynne, Moore and de la Torre (2014) noted research conducted by Allensworth

27
and Easton in 2007 for the Consortium on Chicago School Research supported the 2005
findings. When comparing the on- track indicator’s accuracy of predicting graduation to a model
that combined eighth graders reading and math test scores, gender, race, age when they entered
high school, socioeconomic status, and mobility when entering the middle grades, they could
only accurately predict 65 % of Chicago Public School graduates (Allensworth et al., 2014).
Additionally they found combining the background model with the on track indicator model only
improves its accuracy by about 1%. They go on to suggest this does not mean background
characteristics are not related to high school graduation but rather affect it indirectly by
impacting student performance in school (Allensworth et al., 2014).
Rosenkranz, de la Torre, Stevens, and Allensworth (2014) investigated the question of
why students’ academic performance and levels of engagement decline in 9th
grade. In a mixed
method, longitudinal study that incorporated student grade and attendance data from the Chicago
Public Schools database with student surveys and interviews, researchers followed a cohort of 32
students as they transitioned from eighth to ninth grade, from the 2007-2008 school year to the
2008-2009 school year. They compared grades and attendance data, as well as student reported
data on perceptions of difficulty of work, time and effort spent on homework, as well as the
amount of adult supervision in middle school compared to high school. Researchers found
students’ average grades dropped a half a letter grade for all classes, for both core and non-core
courses. They found similar levels of decline for White, Latino and African American students,
as well as male and female students. This decline was found for high and low achieving students;
overall, 89% of students had the same or lower GPA in ninth grade as they did in eighth grade. A
significant decline occurred in student attendance, with 10.5 average days of absence for students

28
in eighth grade, and 27 average days of absence in ninth grade. To further study the decline in
grades, researchers observed students’ English and math classes during both years, and
interviewed the students during each school year. They found that neither the observers nor the
students characterized ninth grade work as being more difficult than eighth grade work; students
actually characterized ninth grade work as less challenging. Student survey data, when compared
year to year, indicated students put less effort into their schoolwork, spending less time on
studying and homework in ninth grade than they did in eighth grade. Students also reported they
had less adult supervision in ninth grade, making it easier to miss class without consequence and
to opt out of doing their work in class and at home. They reported that while these behaviors
were enforced by adults in eighth grade, they were seen a decisions that students in ninth grade
(Rosenkranz et al., 2014).
Retention in Ninth Grade
Research indicates ninth grade is a point where many students fail to promote to the next
grade and beyond. Using data from NCES and CCD, Haney and colleagues (2005) studied
enrollments of public school students by grade level over a thirty-year period. Their findings
indicate not only has the rate of students leaving school between ninth and tenth grade tripled in
the last thirty years, but enrollment in ninth grade has increased to the point which there is a
disproportionate “bulge” of students in ninth grade.
A meta-analysis of seventeen studies on the relationship between grade retention and
dropout indicated grade retention is one of the most powerful predictors of dropout (Jimerson,

29
Anderson & Whipple, 2002). As previously mentioned, Alexander et al. (2001) found repeating
a grade was a strong predictor of dropout. Results from their longitudinal study of 800 Baltimore
City Public School students indicated that 71% of students retained once eventually dropped out
of high school. For students retained twice, the percentage increased to 80%, and for students
retained in both elementary and middle school the percentage increased to 94%. Retaining
students in ninth grade can be problematic because the students are then older than their grade
level peers, and are closer to the minimum age for dropping out of school, depending on the state
they reside in. Hauser, Frederick and Andrew (2007) argue that “under past, current, and
foreseeable educational regimes, students who are held back typically fail to catch up
academically. Because they are over-age for grade, they are more likely to drop out” (Hauser et
al., 2007, p.1). A study on New York City’s Department of Education found nearly all dropouts
in New York City were at one point overage for grade, and that half of the entering class will
become overage and behind on credits, with the majority of these students being Black or
Hispanic and male (New York City Department of Education, 2006). Students drop out in all
grades of high school, but research indicates up to two thirds of students in urban high schools
drop out at grade ten or lower, with a third at grade nine or lower (Neild & Balfanz, 2006). Even
when students repeat ninth grade, they are not likely to do substantially better than they did the
first time, typically failing at least half their classes and being retained again (Neild & Balfanz,
2006). In their study of on-track indicators, Allensworth and Easton (2005) found only 9% of
students got back on track and graduated on time after being retained in ninth grade.
Researchers have attempted to establish the independent effect of the transition to ninth
grade on dropout. Neild, Stoner-Eby, and Furstenberg (2008) argued that if ninth grade outcomes

30
are reflections of prior student characteristics, then perhaps the focus on ninth grade performance
is unfounded. However, they further argued if ninth grade outcomes are predictors of dropout
despite past student performance, then supporting students through the transition and ensuring
the ninth grade year is successful is warranted. Using data from the Philadelphia Education
Longitudinal Study (PELS), the sample in the Neild and colleagues 2008 study consisted of
2,892 students enrolled as eight graders during the 1995-1996 school year. Dropout rates were
calculated by following the cohort until June of 2000, when they would have graduated after four
years of high school. They also gathered information on students’ age, race and ethnicity, gender,
and previous academic characteristics (derived from test scores) from the school district
database. From a parent survey, they gathered information on parent marital status, education
level of parents, whether the parent received welfare, and whether the child had ever been
retained. From a student survey, they obtained data on student attitudes, behavior and
educational aspirations in eighth grade. They further measured level of student academic and
social engagement with school in eighth grade through student interviews and surveys. They
compared this data to the post survey administered to students the following year in ninth grade.
Results showed that 46% of the students sampled graduated from a Philadelphia public high
school. Fifteen percent were still enrolled but had not earned enough credits to graduate, 12%
had transferred, and 19% had dropped out. Dropout rates varied by school, ranging from almost
0% to almost 40%. Of those who had dropped out, 65.8% had not been promoted at the end of
ninth grade, and 43.9% did not promote beyond ninth grade. After controlling for demographic
and family background characteristics, previous school performance, and pre high school

31
attitudes and ambitions, results of the study indicate that students’ experiences in ninth grade are
predictive of dropout (Neild et al., 2008).
Student Mobility and Attendance
Rumberger and Larson (1998) define student mobility as changing schools at least once
before completing school or dropping out. Using data from the National Educational
Longitudinal Survey, they studied the relationship between student mobility and student dropout.
They tested three models on two groups of students: Eighth grade students in 1988 and then
twelfth grade students in 1992 to examine the incidence, causes, and consequences of student
mobility during high school. They researched the incidence of mobility among high school
students and how that incidence varied among social class groups, the demographic, family and
school factors , and whether changing schools reduces the odds of completing high school.
They used student data from the National Educational Longitudinal Survey of 1988 (NELS:88)
to construct three empirical models to predict the incidence and consequences of school mobility.
They gathered follow up data in 1990, 1992, and 1994. Results indicated more than one quarter
of high school students made non promotional school changes between eighth and twelfth grade.
They found mobility patterns varied by socioeconomic status (SES), with 31% of students in the
lowest quartile changing schools at least once compared to 25% of students in the highest SES
quartile. Additionally they found students who changed high schools were significantly more
likely to have dropped out by twelfth grade than those who had not changed, with the likelihood
of dropout increasing with each school change (Rumberger &Larson, 1998).

32
In their research study on the effects of student mobility on high school dropout, Gasper,
DeLuca and Estacion (2012) argue that the effect of switching schools is difficult to measure, as
the characteristics of students who switch schools are similar to dropouts in terms of prior
academic achievement and engagement. They further argue that switching schools may be one
factor of many that interact to create a long term process of disengagement and eventual dropout,
and that students who switch schools are more likely to have other risk factors and fewer
protective factors to support a successful switch to a new school. They used propensity matching
to compare students who switched schools to students who did not, but who were similar on all
background factors predictive of dropping out. They used data from the National Longitudinal
Survey of Youth 1997 (NLSY97), a nationally representative longitudinal survey of youth who
were 12 to 16 years old on the sampling date of December 31, 1996. The independent variable of
mobility was derived from student retrospective self-reports, while the dependent variable of
dropout was derived from student self-report at each round of the NLSY97. Longitudinal data
were collected on students for eight consecutive years, beginning at the end of students’ eighth
grade year, with a sample size of 2,571. Researchers matched school movers to non-movers
based on propensity scores derived from 177 pre-high school characteristics. Of the 818 school
movers, they matched 797 to counterfactuals, discarding data for the remaining 21 students
without a counterfactual. While they found switching schools increased likelihood of dropping
out between 6 and 9%, the differences between students who switched schools and those who did
not could be accounted for by family structure, previous behavior, and previous academic
performance. Another finding was that student mobility does not affect all students the same
way. For student with a high number of risk factors already, switching schools does not increase

33
the likelihood that they will drop out. For students with few risk factors, switching schools does
not increase the likelihood that they will drop out either. The students from the middle propensity
strata were those whose likelihood of dropout seemed most affected by switching schools
(Gasper et al., 2012).
Student attendance can be considered an observable measure of student engagement with
the school environment as well as a predictor of student dropout. Allensworth and Easton (2007)
demonstrated the relationships between ninth grade attendance and graduation four years later.
Using student attendance data from the Chicago Public Schools database, the results of their data
analysis indicated that as number of absences during freshman year increased, the likelihood of
graduating in four years decreased. Of students who missed 0-4 four days per semester freshman
year, 87% graduated in four years. When the number of absences increased to 5-9 days of
absence per semester freshman year, the percentage of students who graduated in four years fell
to 63%, and continued to decline as number of absences increased. Researchers argue that the
results of this data analysis indicate that missing even one week of school per semester freshman
year can harm a student’s academic performance to the point where chances of graduation
within four years are significantly diminished (Allensworth & Easton, 2007).
Family Structure
In the 1966 landmark report, Equality of Educational Opportunity Study (EEOS), James
Coleman led a team of researchers in conducting a large scale, national study commissioned by
the United States Department of Health, Education, and Welfare to examine and assess the

34
educational opportunities available to different racial and ethnic groups in the United States. The
study consisted of a survey administered to approximately 645,000 first, third, sixth, ninth, and
twelfth grade students from over 4,000 public schools. Principals and teachers also provided data
via questionnaire responses. Data were collected on student age, gender, race and ethnic identity,
socioeconomic background, attitudes toward learning, educational and career goals, and racial
attitudes. Findings from the study indicated that student socioeconomic status, parental education
and family background accounted for most of the variance in student educational outcomes,
including high school completion (Coleman, 1966). In his 1988 study, Social Capital in the
Creation of Human Capital, Coleman identified three forms of what he termed social capital:
Obligations and expectations, information channels, and social norms. Additionally, he specified
that family background is not a singular construct, but can be separated into three components:
financial capital, human capital, and social capital, and all three influence the interactions
between parents and children in regard to education. Financial capital refers to a family’s wealth,
which can provide the resources that can aid student achievement, such as a pace to study at
home and learning materials, while human capital refers to educational background and
capabilities of parents. Social capital refers to how parents influence student achievement
through communication of their attitudes toward schooling and their involvement in their
students schooling in addition to their levels of education and income (Coleman, 1988). He
argues the presence of adults and the attention adults pay to children constitute differing degrees
of social capital. Using data collected from 58,270 tenth and twelfth grade students who
participated in the 1980 National Center for Education Statistic’s High School and Beyond
study, Coleman’s findings indicated students living in single parent households were
35
significantly more likely to drop out of school than students with two parents living in the
household (Coleman, 1988). Rumberger and Larson’s (1998) findings from their study of student
mobility also looked at the relationship between family structures. Their findings indicated that
students from single and step parent families were more likely to change schools and to drop out
of high school than students from two parent families, supporting Coleman’s earlier findings.
Many factors can influence student dropout: overall academic performance, retention,
academic performance in ninth grade, gender, age, socioeconomic status, ethnicity, attendance,
mobility, and family structure. While most of these factors are beyond the control of teachers to
influence, student academic achievement is a factor that teachers can have a significant influence
on. In the next section, I will review the literature on the importance of teacher beliefs as a
component of school related factors that influence student dropout.
The Importance of Teacher Beliefs
Evidence found in the literature on teacher beliefs suggests a correlation between teacher
beliefs and teacher actions and practices. Teacher beliefs about the factors that influence dropout,
their implicit theory of intelligence and their self-efficacy in teaching at risk students can affect
their classroom practices (Fives & Buehl, 2012; Kumar et al., 2015; Rattan et al., 2012,
Woofolk-Hoy; Davis & Pape, 2006). The subsequent connection between teacher practices and
student outcomes has been established in the literature (Hattie, 2009); teacher practices are a
component of the institutional school characteristics in Rumberger’s framework, and unlike
individual factors that schools have little influence over, pedagogical practices that impact

36
student outcomes are completely within the control of schools. Previous research on student
dropout has primarily focused on student perceptions of the causes of dropout; research focused
specifically on teacher beliefs about dropout is less abundant (Knesting-Lund, Reese & Boody,
2013).
In their review of the literature on the construct of teacher beliefs, Fives and Buehl (2012)
discuss the definition of the term belief and its relationship to teacher actions and behaviors in
the classroom. While there are many definitions of beliefs, commonalities in definitions suggest
beliefs are implicit and explicit, exist along a continuum of stability, are activated by context
demands, are interwoven, and exist as integrated systems (Fives & Buehl, 2012). They argue
beliefs serve three functions related to action: Filters, frameworks and guides to action for
teachers. Their model first suggests that teacher beliefs act as filters, in which teachers interpret
events and content through their belief systems and determine what is relevant. Potential filters
may include teacher beliefs about the role of teachers and students. Secondly, beliefs act as
frames in that teachers define a problem or task, or conceptualize a problem at hand through their
belief systems. Potential frames might include teaching practices. Thirdly, beliefs act as guides to
action. Potential guides include self-efficacy and task value (Fives & Buehl, 2012). Teacher
beliefs about factors that influence student dropout, the stability of student intelligence and their
own self-efficacy for successfully teaching students at risk of dropping out can influence the
pedagogical practices they employ when working with students at risk of dropping out.
37
Teacher Beliefs About Factors that Influence Dropout
Bridgeland, DiIulio and Balfanz (2009) conducted a nationally representative survey of
603 high school teachers to study their beliefs about student dropout. Participants who reported
that at least a few students drop out of their schools each year and fail to complete their high
school education were selected for the study. Additionally, researchers conducted focus group
interviews with administrators and teachers who worked in low-income schools with high
dropout rates in urban, suburban, and rural settings to obtain additional data on teacher beliefs
about the factors that influence student dropout. Researchers asked participants about their
beliefs regarding whether or not dropout was a problem in their schools and on a national level,
why students drop out, and what might help students stay in school.
Findings indicated that 59% of teachers rated the national dropout rate as a major
problem, with 11% rating it as a crisis. Thirty five percent of teachers surveyed rated the national
dropout rate as a minor problem or not a problem at all, with 58% of teachers reporting that the
nation’s high schools were doing a good or excellent job. For teachers in schools with a reported
graduation rate of less than 80%, 84% rated the national dropout rate as a major problem or
crisis, yet 64% of them described their own school as doing a good or excellent job. When asked
how many students dropped out of their schools each year, 45% of teachers who reported that
dropout was a major problem or crisis nationally responded that only a few students at their
schools dropped out. Only 9% of teachers surveyed reported that many students dropped out of
their schools. Focus group participants reported that they had difficulty determining the actual
number of students in their school who dropped out due to a lack of tracking systems. They

38
further reported that they often relied on informal methods such as word of mouth to determine
whether or not a student had dropped out. Forty six percent of teachers felt that national
graduation rate statistics were unreliable.
When asked what factors influenced student dropout, the most frequent reason cited was
not enough support at home, with 61% of teachers reporting it as a factor in most cases, and 89%
reporting that it was a factor in at least some cases. Seventy four percent of teachers felt that all
or most of the responsibility for student dropout belonged to their parents. Sixty two percent of
teachers reported that students not being academically prepared for high school was a factor in at
least some cases of dropout. Student attendance was another factor, with 45% of teachers
reporting that excessive absenteeism was a factor influencing dropout in most cases. When asked
how often chronically truant students fell behind in their classwork, 74% of teachers said very
often. Personal reasons were another factor cited, with 78% of participants indicating that
students spending time with peers disengaged from school was a factor in most or some cases of
dropout. Additionally, teachers reported that a student’s need to get a job or support their family
was a factor in most or some cases (48%), students having a child in at least some cases (45%),
and caring for a family member was a factor in at least some cases (38%). Finally, only 20% of
teachers saw a lack of interest in school as a factor in most cases of dropout. When data from a
previous survey of student dropouts was shared with teachers, in which a majority of former
students stated that boredom was a major reason they left high school, 42% of teachers in this
study indicated that they felt students were making excuses for their failure in school. Teachers
in focus groups expressed their frustration at engaging students who were described by some
participants as “lazy” and having “a poor work ethic.”

39
When asked about what might help students stay in school, teachers were given two
statements regarding standards and expectations. The first statement read “we should expect all
students to meet high academic standards and provide extra support to struggling students to help
them meet those standards.” Less than one third of teachers (32%) agreed with this statement.
The second statement read “We should have a separate track to allow students who are not
college bound to get a diploma without achieving standards.” A majority (58%) of teachers
agreed with this statement. Seventy five percent of teachers surveyed indicated that even if
higher standards were demanded of at-risk students, students would not work harder to meet
those standards. When asked which group bore most or all of the responsibility for a student
dropping out, 76% of teachers chose students, 74% chose parents, 19% chose the school system,
18% chose broader society,13% chose elected officials, and 13% indicated that high school
teachers themselves bore most or all of the responsibility for a student dropping out. When asked
to choose which proposals they believed would reduce the dropout rate, 96% of participants
somewhat or strongly favored alternative learning environments, 86% somewhat or strongly
favored expanding college level learning opportunities, 72% somewhat or strongly favored
individualized graduation plans, 72% somewhat or strongly favored a national clearinghouse to
evaluate/disseminate existing research, 70% somewhat or strongly favored a national definition
for graduation rates, and 68% of teachers favored a national attendance requirement age of 18,
supporting struggling students, and enforcing truancy laws. The fact that teachers in this study
overwhelmingly chose students and parents as being primarily responsible for student dropout,
while very few attributed this responsibility to teachers indicates that a majority perceive dropout
as being far more heavily influenced by factors outside of the school.

40
Similar attributions for factors that influence student dropout were found in a study
examining teacher beliefs about African American males in a low performing high school (Lynn,
Bacon, Totten, Bridges III & Jennings, 2010). Findings indicated that teachers blamed students,
their families, and their communities for African American males’ low academic achievement.
Researchers were interested in learning what factors teachers and administrators would attribute
to the consistent underperformance of African American male students on standardized
achievement tests, as well as their disproportionate representation in special education, and
significantly higher dropout rates. At the time of the study, the school district was one of the
lowest performing districts in the state on standardized achievement tests, as well as one of the
largest, with approximately 100,000 students enrolled. The study took place in a high school
with a student population of 953 students, of whom 99% were African American. Forty percent
of students qualified for free and reduced lunch. It was one of the lowest performing schools in
the district. Although the school reported an 84% graduation rate, as measured by the number of
students who graduated divided by the number of students who began the year as seniors,
researchers estimated the African American male dropout rate to be over 50%, based on an
examination and analysis of school records. Participants in the study included 50 teachers,
counselors, and administrators at a low performing high school, as well as a subset of 6 teachers
who participated in ongoing interviews, a focus group, and classroom observations. Of the 50
staff member participants, 40 were African American females, 8 were African American males,
and 2 were White females. Data was collected through a series of focus groups, individual
interviews with staff, and ethnographic observations in the classroom. Data from interviews and
focus groups was recorded and transcribed. Data from all three settings was analyzed to identify

41
themes. Results indicated that about 80% of participants attributed the low performance of
African American students on individual student characteristics, such as their lack of motivation
to learn, their failure to attend classes, their lack of interest in learning, their lack of preparation
for school, their inability to focus, their participation in street culture, and failure to behave
appropriately in class (Lynn et al., 2010). Additionally, almost all participants in the focus
groups and interviews attributed low performance of African American students to home,
community, and school factors, identifying parents as the primary cause of students’ failure to
achieve. Participants further expressed beliefs about the incongruence between African
American cultural mores and the expectations of the school environment, indicating that parents
of African American students do not value education, lack structure in the home environment.
Several participants commented on the school’s inability to sanction parents for students’ low
performance.
Further supporting the findings of the two previously reviewed studies, a study
comparing data from 40 high schools in Kentucky investigated school characteristics related to
high school dropout rates (Christle, Jolivette & Nelson, 2007). Researchers used data from a
purposive sample of the 20 high schools reporting the highest dropout rates and 20 high schools
reporting the lowest dropout rates, according to data from the Kentucky Department of
Education. Additionally, they selected eight high schools (four from each of the two groups), to
conduct more focused research including administrator surveys, teacher interviews, and
observations.
In the first stage of data collection and analysis, researchers compared the two high
school groups on twelve school variables to determine how high schools with the highest dropout

42
rates differed from schools with the lowest dropout rates. In the second stage of data analysis,
researchers collected data on-site via administrator survey, teacher interview, and observations to
gather detailed information on the characteristics and climate of each school. A total of 24 staff
members were interviewed from each group to measure their perceptions of academic
expectations for students, school climate, family involvement, and indication of dropout as a
school problem. Results between the two schools differed in all areas. Twenty three of 24
teachers in the low dropout rate group reported that their schools had high expectations for
students, compared to 20 of the 24 teachers from the high dropout rate group. Eighteen of the
teachers in the low dropout rate group described their school climate as good, with none saying
poor. Sixteen of the teachers in the high dropout rate group said their school climate was good,
with three rating it as poor. Only three of the teachers in the low dropout rate group indicated
that family involvement at their schools was poor, compared to 14 of the teachers in the high
dropout rate schools. Twelve of the teachers in the low dropout rate group said dropout was a
problem, compared to 22 of the teachers in the high dropout rate group. Results of the teacher
interview suggest that teachers in schools with high rates of student dropout perceive parent
involvement as poor, and perceive dropout as a problem at their schools, they perceive their
school climate as good, and perceive the teachers and administrators in their school as having
high expectations for students. The results of this study suggest that teachers in schools with high
dropout rates may attribute factors outside of the school as being more influential on student
dropout than school related factors.
Knesting-Lund, Reese and Boody (2013) investigated teacher perceptions of high school
dropout and perceptions of their role in dropout prevention. In this study, they surveyed 95

43
teachers from two high schools in a Midwestern school district. When asked whether they
believed dropout was a problem at their schools, a majority of teachers surveyed indicated that
they believed dropout was a problem at their schools, and that they believed the problem was
increasing. Teachers were then asked to rate the extent to which they believed twenty specific
factors influenced a student’s decision to drop out of school on a 4 point scale, with ratings from
1 (not at all), to 4 (significantly). The factors identified by teachers as having the most influence
on student dropout were frequent absences (M=3.89), frequent trouble at school (M=3.67),
limited parental support (M=3.62), low academic achievement (M=3.56), and trouble with the
law (M=3.56). Of the 95 teachers who completed the survey, 36 listed additional factors.
Although “limited parental support” was listed as a factor in the rating section, 15 listed it as an
additional factor. Other factors listed were: substance abuse, lack of extracurricular participation,
negative peer influence, curriculum the student perceives as irrelevant, gang involvement,
homelessness, medical reasons, frustration, and low self-esteem.
The survey also assessed teachers’ perceptions of their role in preventing dropout.
Teachers were asked to rate the amount and the type of influence they had over students’
decision to drop out of school on a 4-point scale, from 1 (not at all) to 4 (significant). Results
indicated that teachers felt they were moderately important in school’s efforts to reduce the
number of students who drop out (M=3.30). Of the 95 teachers who participated in the survey,
81 described the type of influence they have over a students’ decision to drop out. Types of
influence were categorized into four themes: relationship building, communicating caring,
motivation and encouragement, and pointing to the future. Almost a quarter of teachers (24.7%)
indicated that displaying concern and care for students was crucial to supporting student

44
persistence and success in school. While several teachers stated that students “need to see the
value in education”, only 11% indicated that it is important for teachers to demonstrate the
necessity of a high school diploma on a students’ future. Eleven percent of teachers stated they
must encourage and motivate their students. Nearly 25% indicated that they have no influence
over student dropout, indicating that outside influences, such as peers and family, and individual
student characteristics were too strong for teachers to overcome through effort (Knesting-Lund et
al., 2013). These results not only supports previous study’s findings that teachers attribute
individual and family factors as being more influential on dropout than school factors, it further
suggests a correlation between teacher beliefs about dropout and their self-efficacy beliefs. In
addition to teachers’ beliefs about the factors that most influence student dropout, another
construct that may affect teachers’ self-efficacy beliefs about their ability to help prevent
students from dropping out is their implicit theories of intelligence beliefs.
Implicit Theories of Intelligence
The relationship between teacher implicit theories of intelligence and teacher actions can
potentially have a significant impact on student achievement. While much of the research
investigating the role of implicit theories of intelligence has focused on students, far fewer have
investigated the role of implicit theories of intelligence in teachers (Gutshall, 2013, Jones,
Bryant, Snyder, & Malone, 2012). The theoretical construct of implicit theory of intelligence
refers to our beliefs about whether intelligence is a stable (entity), or malleable (incremental)
trait. As previously stated, research suggests teachers’ implicit theories of intelligence can

45
influence students’ beliefs about intelligence (Pretzlik et al.,2003; Watanabe, 2006), which in
turn impacts students’ motivation and achievement (Aronson et al., 2002; Blackwell et al., 2007;
Dweck, 1999).
Teacher Beliefs About Intelligence
Teacher beliefs about intelligence have been shown to affect their pedagogical practices
when working with students facing challenges (Rattan et al.,2012; Watanabe, 2006). Researchers
conducted a four part study to investigate the relationship between teacher’s implicit theory of
intelligence and their pedagogical response to students encountering difficulty. Rattan and
colleagues formulated two hypotheses. First, they hypothesized that when confronted with a
student who has demonstrated initial poor performance in a course, teachers with an entity theory
(a belief that intelligence is fixed or nonmalleable) will be more likely than teachers with an
incremental theory (a belief that intelligence is malleable) to conclude that the student has low
ability and comfort them for their low aptitude. Second, they hypothesized that by demonstrating
comforting behaviors toward students, teachers would subtly communicate their belief that the
student has stable low ability along with low expectations, thereby demotivating the student to
put forth more effort to be successful and lowering their expectations for future performance.
In the first study, 41 undergraduates were asked to complete an online survey measuring
their implicit beliefs about intelligence, specifically as it related to math. They were then
presented with a scenario of a seventh grade math student who received a 65% on the first math
test of the year, and asked to imagine themselves as the teacher. Results indicated the more
46
participants favored an entity theory, the more they attributed the single instance of poor
performance to low ability. Additionally, the more participants endorsed an entity rather than
incremental theory, the greater percentage of the grade was attributed to low math intelligence
(42.3%) rather than lack of hard work (30.7%) (Rattan et al., 2012).
In the second study, participants were 95 undergraduates. They were asked to read an
article presenting expert evidence stating that math intelligence was either fixed or malleable,
and were then assessed on their implicit theory of intelligence using the same measure as the first
study. Next, participants read the same student scenario used in the first study. Finally, they were
asked to take the role of the seventh grade math teacher and asked how they would respond to
the student, using a 7 item index indicating the degree to which they would comfort the student.
The items were divided into two subscales: consoling the student for poor performance (e.g.
explaining that not everyone has math talent) and using teaching strategies that could reduce
engagement and future achievement in the subject (e.g. assign less homework). Results indicated
that participants who endorsed an entity theory of intelligence were significantly more likely to
endorse the overall index of comfort-oriented strategies and teaching strategies that could reduce
engagement and achievement (Rattan et al., 2012).
In the third study, Rattan and colleagues investigated whether participants who currently
teach math would make the same judgments and recommend the same responses. Participants
were 41 graduate students who were either math instructors or teaching assistants. They
completed the implicit theories of math intelligence measure then read a student scenario similar
to the first two studies, but modified for the undergraduate teaching context. In this scenario, a
student in an undergraduate section of 20 students failed the first test of the year, and the
47
instructor of the course was conducting individual student conferences to discuss progress.
Results were similar to those from the first and second studies. Participants who endorsed an
entity theory of intelligence were more likely than participants holding an incremental theory of
intelligence to attribute poor student performance on a single test to low math ability, to respond
by comforting students, and to use teaching strategies that could reduce student engagement and
achievement (Rattan et al., 2012).
In the fourth study, researchers investigated whether students receiving comfort oriented
feedback would perceive their professors as having an entity theory about math intelligence and
would feel less supported, encouraged and motivated. Fifty-four undergraduate students
completed an online study in which they were asked to imagine they were in a calculus course at
their university. They were going to meet with their professor to discuss their performance on the
first test of the year. At the meeting they found out they had received a 65%, and were presented
with one of three possible responses from the professor; comfort based, strategy based, and a
control response which contained only two statements of caring that were present in both of the
other responses. Students then completed the four item Perceptions of an Environmental Entity
Theory scale and a four item measure that assessed the degree to which they believed their
professor had low expectations and little investment in their future in the field. Results indicated
feedback manipulation had a significant effect on participants’ perceptions of their professor’s
beliefs about math intelligence malleability. Participants who received the comfort feedback
viewed their professor as having a significantly stronger entity theory than participants in the
strategy feedback or control groups. Additionally, participants who received comfort feedback
reported feeling significantly less encouraged and motivated than those in the strategy or control
48
group, and estimated that their grade would remain the same or close to the low score.
Participants in the strategy feedback group expected their grade to improve (Rattan et al.).
Findings from this study underscore the significance of the relationship between teacher beliefs
about intelligence, teacher interactions with students, and student behaviors.
Teacher beliefs about their students’ intelligence can influence students’ views of their
own intelligence (Pretzlik et al., 2003). Fifty-eight 10 and 11 year old students and two teachers
from London, United Kingdom as well as 47 students, age 5 and 6, and two teachers from
Lisbon, Portugal, participated in the study. Students completed aptitude tests and self-perception
measures for general ability, reading and math. Teachers were asked to rank the students in the
class from “best” to “weakest.” Teacher beliefs about intelligence were also measured.
Researchers found teacher beliefs about student intelligence correlated with students’ beliefs
about their own intelligence and the intelligence of their peers (Pretzlik et al., 2003). Given the
evidence that supports the significance of the relationship between students’ beliefs about their
own intelligence and student achievement (Blackwell et al., 2007; Dweck et al., 1995), findings
from this study suggest a need for further research on the relationship between teacher beliefs
and student beliefs about intelligence.
Student Beliefs About Intelligence
Students’ implicit theories of intelligence have been shown to affect their behaviors
related to school and their subsequent achievement (Blackwell et al., 2007; Dweck et al., 1995).
For students struggling with multiple risk factors, the way they process and respond to academic
challenges can make the difference between success and failure. Dweck et al. (1995) argued that

49
depending on their mindset, students differ widely in their goals, the amount of value they place
on effort, their response to challenge, and their grades during times of adversity. Students with
entity theory mindset tended to have looking smart as their primary academic goal as opposed to
students with incremental theory, whose primary academic goal was learning. Students with
entity theory mindset placed a lower value on effort, help, and strategies, and had a higher
tendency to give up when faced with a challenge than incremental theory mindset students.
Additionally, grades of students with entity theory mindset decreased or remained low during
times of adversity, as opposed to students with incremental theory mindset, whose grades
increased during times of adversity.
Blackwell and colleagues (2007) examined the relationship between students’ implicit
theories of intelligence and their academic achievement in mathematics in a two part study. In
the first study, researchers sought to answer three questions. First, they asked if students’
theories were related to their achievement trajectory over long periods of time. Second, they
asked why theory of intelligence is related to grades. Third, they looked at whether teaching
incremental theory provided an added benefit over a similar academic intervention. Researchers
used data from a longitudinal study of junior high school students and a classroom intervention
study to examine the relationship between theories of intelligence and achievement.
Additionally, they sought to test mediators of this relationship.
Researchers followed four successive cohorts of students entering junior high school over
five years. They assessed their intelligence theory beliefs at the beginning of seventh grade, and
then tracked students’ achievement through seventh and eighth grade. Additionally, they used
this data to test their model of the process linking achievement related beliefs to achievement
50
strategies and actual achievement throughout junior high school. Participants were 373 students
(198 females and 175 males) in four successive seventh grade classes at a junior high school in
New York City. Participants were 55% African American, 27% South Asian, 15% Hispanic, and
3% East Asian and European American. The sample varied in regard to socioeconomic status;
53% percent of participants qualified for free lunch.
Measures of student achievement included national percentile scores on the Citywide
Achievement test administered in the spring of sixth grade, and in the fall and spring of seventh
and eighth grade. Additionally mathematics grades were used as a measure. All of the
participants within the same grade had the same teacher for mathematics. Mathematics grades
were based on tests, homework, a project and class participation. Researchers chose this subject
area because they believed it presented enough of a difficulty level to trigger a response to
challenge that may not occur in subject areas presenting a lower level of challenge.
Researchers developed a set of scales designed to measure implicit theories of
intelligence, as well as the following mediators: goal orientation, beliefs about effort, and
helpless attributions and strategies in response to failure, with students rating items on a six point
Likert scale. Results indicated that an incremental theory belief was positively associated with
positive effort beliefs, learning goals, low helpless attributions, and positive strategies. Data from
the study further indicated that while students with entity and incremental theories did not differ
significantly in math achievement test scores at the beginning of seventh grade, by the end of
eighth grade, scores of students with incremental theory belief increased steadily over two years
and were significantly higher by the spring of eight grade, compared to students with entity
theory beliefs, whose scores declined steadily over the two years. Researchers concluded that

51
students with incremental theory beliefs had more positive motivational beliefs which were
related to higher grades than students with entity theory beliefs (Blackwell et al., 2007).
The second part of this study examined whether teaching students that intelligence is
malleable would lead to higher motivation and higher grades and achievement. Researchers
replicated the intelligence theory beliefs assessment in the fall. In the spring semester they
administered an intervention teaching students about incremental theory, then assessed the
effects on classroom motivation and achievement. A control group receiving no interventions
was used for comparison.
Participants were 99 students (49 female and 50 male) in a seventh grade class at a public
school in New York City (a different school than the first study). Participants were 52% African
American, 45% Latino, and 3% White and Asian. Students in this sample had overall lower
achievement test scores than students in the first study and a higher percentage of them (79%)
were eligible for free or reduced lunch. Final data analysis was based on 48 students in the
experimental group and 43 students in the control group. There was not a significant difference
in academic achievement or baseline motivational constructs between the two groups.
Students in both groups participated in eight workshops over the course of the spring
semester. Four of the sessions contained the same content and format for both groups, while four
of the sessions differed in content. The experimental group received instruction on incremental
theory for four of the sessions, while the control group received instruction on the structure of
memory. Data indicated that while as a whole, the group’s math grades had declined between the
beginning and the end of the fall semester. However, after the intervention was implemented
during the spring semester, grades of students in the experimental group improved significantly,

52
while grades of students in the control group continued to decline. The effect of the incremental
theory intervention was even greater for students who had endorsed entity theory at the
beginning of the year (Blackwell et al., 2007).
Working with a sample of community college students, Aronson and colleagues (2002)
conducted an experiment to determine if encouraging incremental theory thinking would affect
students’ academic engagement and achievement in the classroom. Participants were initially
109 undergraduate students at Stanford University. Thirty participants chose not continue with
the study for a variety of reasons (i.e. time constraints, missed appointments, discomfort with
release of transcript information). Seventy nine males and females were included in the final
analysis (42 Black, 37 White). Participants were randomly assigned to one of three groups.
Students in the first group were told they would be mentoring at-risk middle school students via
a pen pal program. They were given letters written by a fictional seventh grader and asked to
respond. Participants were instructed to impress upon their pen pals the importance of hard work
and perseverance, as well as to emphasize the research on incremental theory and the
malleability of intelligence. Students in the control group did not participate in any activity.
Students in the second group were also asked to write an encouraging letter to a struggling
seventh grader, but in this group they were asked to stress the importance of multiple intelligence
theory. Students in both groups were asked to return a second time and write a similar letter to
another at risk middle school student, and then a third time to take both of their letters and turn it
into a speech advocating either incremental theory or multiple intelligence, respectively. After
the intervention, participants completed a two item survey on their beliefs about the malleability
of intelligence. Several weeks later they were surveyed to reassess their beliefs about the

53
malleability of intelligence in addition to rating their enjoyment of academics, their degree of
identification with academics, and their experience with stereotype threat. Results indicated that
African American students in the malleable intelligence experimental group reported greater
enjoyment of the academic process, greater levels of academic engagement, and obtained higher
grade point averages than students in the two control groups (Aronson et al., 2002).
Teacher beliefs about students, including the factors outside of school that influence
dropout, as well as their implicit intelligence beliefs can help deepen our understanding of the
role that teachers play in preventing student dropout. This study seeks to gain insight into the
relationship between those two facets of teachers’ belief systems and their beliefs about their
ability to influence student outcomes.
Teacher Self-Efficacy
The construct of teacher self-efficacy has been widely studied and established as a
significant factor in teacher and student success. Early measures of teacher self-efficacy include
a study analyzing reading score gains for students between fifth and sixth grade. The study,
conducted with 20 elementary schools in the Los Angeles Unified School District, was published
by the RAND Corporation in 1976. Participants included 81 teachers who completed a survey
that included two items designed to measured teacher self-efficacy by asking teachers to rate
their level of agreement with the following statements: “When it comes right down to it, a
teacher really can’t do much because most of a student’s motivation and performance depends on
his or her home environment” and, “If I try really hard, I can get through to even the most

54
difficult or unmotivated students.” (Armor, 1976). The first item was designed to measure
teachers’ perception of what participants believed teachers can do in general, while the second
item was designed to measure what participants believed they can do personally. Teachers who
strongly agreed with the first statement indicated a belief that factors outside of the control of
teachers and schools are too powerful for teachers to overcome through their own efforts. Strong
agreement with the second statement indicated a belief that improving student learning was
within their power to influence, despite outside factors (Tschannen-Moran et al., 1998). When
they combined personal and general teaching efficacy into a single construct, Armor found that
teacher efficacy predicted significant gains in reading achievement.
Another early instrument designed to measure teacher efficacy was Guskey’s (1981)
Responsibility for Student Achievement. Participants were asked to distribute 100 percentage
points between two alternatives, one attributing the cause of an event to the teacher, and the other
attributing the cause of the same event to factors outside of the teacher’s control. Four types of
causes were offered for success or failure: Specific teaching abilities, the effort put into teaching,
the task difficulty, and luck (Guskey, 1981). These four causes aligned to causal components in
attribution theory (Weiner, 1986). In a later study by Guskey, scores from the RSA were
compared with teacher efficacy scores (measured using the scale from the RAND study), results
indicated that teachers perceived a higher level of efficacy in their ability to influence positive
outcomes than in their ability to prevent negative outcomes (Guskey, 1984).
More recently, Tschannen-Moran and Hoy (2001) developed the Teacher Sense of
Efficacy Scale (TSES) to measure teachers’ perceived level of efficacy. This instrument includes
the two items from the RAND study, as well as additional items developed by the researchers.

55
Researchers examined instruments developed through previous research in the area of efficacy,
notably that of Armor (1976), Guskey (1981), Ashton et al. (1982) and Bandura (1997).
Identifying measurement problems that have arisen with each of these measures, the developed
the TSES as a measure of teacher efficacy beliefs. Their proposal for the use of this measure was
supported by three separate reliability and validity studies, which established reliability and
validity for both the 24 item long form and 12 item short form (Tschannen-Moran &Hoy, 2001).
In their study of the relationship between teacher self-efficacy beliefs, teacher job
satisfaction and student achievement, Caprara, Barbaranelli, Steca, & Malone (2006)
administered a questionnaire to 2,184 teachers in 75 junior high schools deigned to measure their
self-efficacy beliefs and their level of job satisfaction. Data were collected at three points over a
two year period: Student grade data were collected at the end of year one, teacher questionnaire
data were collected midway though year one, and then student grade data were collected at the
end of year two. Researchers compared the results of the questionnaire with each school’s
aggregated average grades at the end of the third year of junior high for two consecutive years.
They hypothesized that students’ academic achievement at the end of the first year would predict
academic achievement at the end of the second year, student academic achievement at the end of
the first year would predict teacher job satisfaction and self-efficacy at the end of the second
year, teachers’ self-efficacy beliefs would contribute significantly to subsequent students’ final
academic achievement, teachers’ self-efficacy beliefs positively influence teachers’ job
satisfaction, and job satisfaction would not contribute to students’ academic achievement unless
accompanied by high perceived self-efficacy (Caprara et al., 2006). Results indicated that
students’ academic achievement at the end of the first year was a strong predictor of student

56
achievement at the end of the second year. Additionally, results indicated that teacher efficacy
beliefs influenced job satisfaction significantly, and was a strong predictor of student
achievement (Caprara et al., 2006).
A recent study investigated the relationship between teachers’ efficacy for supporting at-
risk students and their perceived role in dropout prevention (Knesting-Lund, O’Rourke &
Gabriele, 2015). Researchers considered the possibility that teacher efficacy for supporting at-
risk students could be related to their understanding of high school dropout. Participants were
159 teachers from four Midwestern high schools, two in suburban areas and two in rural areas.
A two part survey was administered. The first part was a survey previously developed by
Knesting-Lund and colleagues (2013) to assess teachers’ perceptions of their role in preventing
dropout and their beliefs about the factors that influence student dropout. The second measure
was an adaptation of Tschannen-Moran and Woofolk-Hoy’s (2001) Teacher Sense of Efficacy
Scale. Teachers in this sample reported as strong sense of self-efficacy for supporting students
at-risk of dropping out. Positive correlations existed between teacher’s sense of efficacy and the
extent to which they perceived the following factors influence dropout: not having a close
relationship with a teacher, not having a sense of belonging at school, believing no one cares if
they drop out, believing adults at school want them to drop out, and school climate. Teachers
with higher efficacy placed a greater emphasis on factors external to the student and within the
school setting, as well as reporting a greater feeling of responsibility for preventing dropout
(Knesting et al., 2015).

57
Conclusion
Institutional and individual factors influence whether a student drops out or stays in
school. While individual factors and institutional factors such as school composition and
available resources are beyond a teacher’s control, other institutional factors such as classroom
practices that influence student academic performance are within the teacher sphere of influence.
Teachers’ implicit theories of intelligence and self- efficacy beliefs have been shown to correlate
to pedagogical practices and student achievement (Rattan et al., 2012; Caprara et al., 2006).
Teachers with an incremental theory of intelligence and high levels of self-efficacy are more
likely to engage in behaviors that have a positive effect on student achievement, such as
persistence with students who do not succeed immediately, and trying new methods for teaching
students who are not successful than teachers with an entity theory of intelligence and low self-
efficacy (Rattan et al., 2012). Teachers who perceive individual student factors to have a strong
influence on dropout are more likely to have lower self-efficacy (Kensting-Lund et al., 2015) and
thereby less likely to persevere and try different methods with struggling students. The
relationships among teacher beliefs about factors that influence dropout, their beliefs about
whether student intelligence is malleable or fixed, and their perceptions about their level of
influence can deepen our understanding of dropout and inform intervention and prevention
strategies.

58
Research Questions
RQ1: What are the psychometric properties of the survey “Factors that Influence Dropout” and
how do they match up to Rumberger’s framework?
RQ2: What importance do teachers assign to factors leading to student dropout?
Rumberger (2011) argues that dropout is a complex construct, and can be best understood
by examining the factors that influence dropout through two separate lenses, the individual and
the institutional. Certain factors are beyond a teacher’s control or influence, such as a student’s
race, gender, family structure, and socioeconomic status. However, as Rumberger argues,
schools and the individuals working within them have the power to leverage a certain amount of
control over institutional factors. For teachers, classroom policies and practices are under their
control to a significant degree. The way that teacher practices manifest themselves within the
classroom can have a significant influence on student perceptions of school and student
achievement (Brewster & Bowen, 2004; Fall & Roberts, 2012; Iachini et al., 2013). While there
is little research on teacher beliefs about student dropout, Lynn et al. (2010) found that the
teachers in their study attributed student failure and dropout to family and individual student
factors far more than institutional factors, including their own practices. Knesting and
colleague’s 2013 study supported these findings, with teachers in their study rating individual
factors as having a more significant influence on dropout than institutional.
59
RQ3: What are the relationships among teacher beliefs about factors that influence student
dropout, their implicit theory of intelligence beliefs, and self-efficacy beliefs?
Dweck and colleagues (1997) argue that individuals tend to have one of two distinct sets
of beliefs regarding the malleability of certain traits. Entity theory refers to individuals who
believe that attributes such as intelligence are fixed and nonmalleable entities. An entity theory
of intelligence illustrates the belief that although it is possible to learn new things, intelligence is
a fixed trait that cannot be changed or improved significantly. Incremental theory refers to
individuals who believe attributes such as intelligence are malleable and can be changed and
developed significantly with effort. An incremental theory of intelligence illustrates the belief
that an individual can increase his or her intelligence by exerting effort to challenging learning
experiences (Dweck et al., 1995). Dweck et al. (1995) assert that holding one view over another
influences the way that individuals approach challenging situations, the way they behave when
faced with a difficult task, and what they attribute success or failure to. Research suggests
teachers’ implicit theories of intelligence can influence students’ beliefs about intelligence
(Pretzlik et al., 2003), which in turn impacts students’ motivation and achievement (Aronson et
al., 2002; Blackwell et al., 2007; Dweck, 1999).
Teachers self –efficacy beliefs have been positively correlated to student achievement
(Ross, 1992, Ashton and Webb, 1986). Teachers’ efficacy beliefs influence their persistence
when faced with challenge and their resilience when setbacks occur (Tschannen-Moran, Hoy &
Hoy, 1998). However, teacher efficacy is context specific; while teachers may feel efficacious
teaching certain subjects to certain students, they may not feel as efficacious in different
circumstances, with different students, especially those that may not respond to instruction as

60
expected (Ross, 1994). Few studies have been conducted to examine the level of influence that
teachers believe they have over student dropout specifically, despite the evidence that supports
student beliefs that teachers have a significant amount of influence (Brewster & Bowen, 2004;
Fall & Roberts, 2012; Iachini et al., 2013). A single pilot study indicated that teacher’s perceived
themselves as having only a moderate level of influence over student dropout (Knesting et al.,
2015). The data collected in relation to this question could add to the body of research on teacher
self-efficacy beliefs regarding their role in dropout prevention.
The relationship between teacher beliefs about the factors that cause students to drop out
and their ability to influence those factors have been examined in a small, pilot study, but further
research is needed to support that relationship. Teachers attributed individual factors as having
more influence on student dropout than institutional factors, and they perceived themselves as
having only a moderate amount of influence over dropout (Knesting et al., 2013). An additional
study examined the relationship between teacher efficacy beliefs and beliefs about the causes of
dropout revealed a positive correlation between teacher efficacy and school related causes
(Knesting et al., 2015). The relationship between teachers’ efficacy beliefs and their implicit
theory of intelligence (entity versus incremental) is important, as both constructs can influence
teacher practices and subsequent student achievement. While research indicates that students’
implicit theories of intelligence can have a significant influence on their perceptions of school
and levels of achievement (Blackwell et al., 2007), and that explicitly teaching students to favor
incremental theory over entity theory positively influences student outcomes (Aronson et al.,
2002), there is little research that examines teacher beliefs about the malleability of student
61
intelligence (Pretzlik et al., 2003). This study will investigate the relationships between all three
constructs.
62
CHAPTER 3
METHOD
Participants
Participants were a purposive sample of middle and high school teachers throughout the
United States. Participants were asked to take an online survey accessed one of three ways:
through an online link posted to weekly Twitter chats, Facebook, or email. Teachers who took
the survey were asked to share the link to the survey with other secondary teachers by retweeting
the link on their Twitter pages, reposting the link on their Facebook pages, or forwarding the link
via email, establishing snowball sampling.
To sample from a national population, the link was shared through statewide weekly
Twitter chats that focus on general education topics. The weekly Twitter chat schedule for each
state is listed in Table 1. A link to the survey was published using each state hashtag during the
weekly chat for two consecutive weeks. Additionally, the link was posted on the author’s
personal Facebook page continuously for the four week data collection period.
A brief description of the survey was included with the link. Demographic questions at
the beginning of the survey were used to determine eligibility. Any respondents who were not
currently working as secondary level (grades 6-12) teachers at the time of data collection were
excluded from the final data analysis. Two hundred seventy six teachers participated in the study.
Of 278 total responses, two were not included in the data due to the fact that they did not teach in

63
Table 1
State Education Twitter Chats by State, Hashtag, Day, Time and Number of Respondents
State Hashtag Day Time Number of Respondents
Alabama #aledchat Mondays 9-10 pm CST 0
Alaska none 0
Arizona #azedchat Wednesday 8-9 pm MST 26
Arkansas #arkedchat Thursdays 8-9 pm CST 1
California #caedchat
#norcalchat
Sundays
Mondays
8-9 pm PST
8-9 pm PST
2
Colorado #COedchat Mondays
(every 4th
)
4-4:45 pm
MST
0
Connecticut #ctedchat Thursdays 8-9 pm EST 0
Delaware #edude 0
Florida #FLedchat Wednesdays 8-9 pm EST 0
Georgia #gaed Thursdays 8-9 pm EST 11
Hawaii #edchatHI Mondays 6pm HST 0
Idaho
#IDedchat Mondays
Wednesdays
7:30-8:30
MST
7-8 pm MST
11
Illinois #iledchat Mondays 9-10 pm CST 85
Indiana #INelearn Thursdays 8-9 pm EST 1
Iowa #iaedchat Sundays 8-9 pm CST 11
Kansas #ksed Mondays 8-9 pm CST 4
Kentucky #kyedchat Thursdays 8-9 pm EST 6
Louisiana #laedchat Tuesdays 7-8 pm CST 0
Maine #edchatme Thursdays 4-5 pm EST 0
Maryland #mdedchat Tuesdays 8-9 pm EST 0
Massachusetts #edchatma Sundays 8-9 pm EST 0
Michigan #miched Wednesdays 8-9 pm EST 3
Mississippi #MSedchat Thursdays 7-8 pm CST 0
Minnesota #mnedchat Tuesdays 8 pm CST 0
Missouri #moedchat 0
Montana #mtedchat Tuesdays 8-9 pm MST 0
Nebraska #nebedchat Wednesdays 8-9 pm CST 0
Nevada #nved 0
New
Hampshire
#nhed Wednesdays 8-9 EST 18
New Jersey #njed Tuesdays 8:30-9:30 pm
EST
0
New Mexico none 1

64
State
Hashtag Day Time Number of Respondents
New York #NYEDChat Mondays 8:30-9:30 pm 3
North
Carolina
#nced Tuesdays
(e/o)
8-9 pm EST 0
North Dakota #ndedchat Wednesdays 8-9 pm CST 0
Ohio #ohedchat Mondays 9-10 pm EST 1
Oklahoma #oklaed 1
Oregon #oredu 22
Pennsylvania #paedchat Thursdays 9-10 pm EST 2
Rhode Island #edchatri Sundays 8-9 pm EST 0
South
Carolina
#sced Sundays 9-10 pm EST 2
South Dakota #sdedchat Tuesdays 8-9 pm CST 30
Tennessee #TNedchat Thursdays 8-9 pm EST 1
Texas #txeduchat
#txed
Sundays
Wednesdays
8-9 pm CST
8:30-9:30 pm
CST
12
Utah #UTedchat Wednesdays 9-10 pm
MST
0
Vermont #vted 0
Virginia #vachat Mondays 8-9 pm EST 1
Washington none 0
West Virginia #wvedchat Thursdays 7:30-8:30 pm
EST
0
Wisconsin #wischat Sundays 8-9 pm CST 1
Wyoming #wyoedchat Sundays 8-9 pm MT 9

65
a high school setting. See Table 2 for participant demographic data. Participants responded
online to the survey via Google form. Participation was anonymous. Survey respondents were
asked to retweet the link on their own Twitter pages, repost the link to their Facebook pages, or
forward the email link to other secondary level teachers. Responses were collected and stored
online during the data collection period. At the end of the data collection period, data was
downloaded, converted to a .CSV format for data analysis, then deleted from Google storage.
Table 2
Participant Demographic Data
Gender N Years
Teaching
N Primary Subject
Area
N Race/Ethnicity N
Male
99
0-5
58
English/LA
48
African American
13
Female
177
6-10
61
Math
46
Asian
5
11-15
63
Social Studies
40
Caucasian/Non-Hispanic
220
16 or more 94 Science 38 Hispanic 16
Other
104
Other
5
Prefer Not to Answer
17

66
Instrumentation and Materials
Three instruments were used for this study. The first instrument, Factors that Influence
Dropout, was created for this study to determine which factors teachers believe influence student
dropout. The factors used to create this survey were taken from Rumberger’s (2011) Framework
for Understanding Dropout. Three questions for each factor were written based on Rumberger’s
description of each factor. Participants were asked to respond to three questions related to each
of the 21 factors influencing dropout, as described in Rumberger’s framework. To establish
consistency through the compiled instrument and to allow respondents the ability to respond with
adequate specificity, a six point scale was selected for the survey (1-strongly disagree to 6-
strongly agree). The purpose of this section of the survey is twofold: To determine teacher
beliefs about the causes of dropout and to validate Rumberger’s framework. Rumberger was
contacted via email to inquire of any validation studies for his framework and he responded that
to his knowledge, none had been conducted to evaluate the full framework (R.W. Rumberger,
personal communication, May 10, 2015).
To establish content validity, seven subject matter experts reviewed the survey. All
responses from the subject matter experts were reviewed and all seven were interviewed by the
researcher to determine if they perceived the questions as appropriately related to the subcales
they intended to measure, and if scaling was appropriate to the survey questions. Responses to
interview questions indicated that the questions did relate appropriately to the subscales, and that
the response scale of 1-6 allowed an adequate range of possible responses. All subject matter
experts currently work as teachers, administrators or professors in the field of education.

67
The second instrument is the three item Theories of Intelligence Scale (TIS; Dweck,
1995). Respondents were asked indicate the extent of their agreement with three statements
regarding intelligence on a 6 point scale. The three statements are “You have a certain amount of
intelligence and you really can’t do much to change it,” “Your intelligence is something about
you that you can’t change very much,” and “You can learn new things but you can’t really
change your basic intelligence.” Scores are averaged to determine an overall implicit theory
score. A stronger level of agreement indicates a stronger incremental theory, and a lower level of
agreement indicates a stronger entity theory.
Dweck and colleagues (1995) measured reliability across sample surveys and found the
internal reliability alpha coefficients for the three-item survey on implicit theory of intelligence
to be high (.94 to .98). Although the questionnaire consists of only three items that all address
entity theory only, they were able to establish validity through several validation studies.
Through these studies, they determined that disagreement with the entity theory indicated
agreement with incremental theory. Additionally, they were able to determine that agreement
with the entity theory statements did not represent an acquiescence set (Dweck et al., 1995).
The Teacher Sense of Efficacy Scale (TSES; Tschannen-Moran & Hoy, 2001) was the
third and final measure used in this study. Tschannen-Moran and Hoy conducted a factor
analysis to test this instrument, and consistently found three moderately correlated factors:
Efficacy in Student Engagement, Efficacy in Instructional Practices, and Efficacy in Classroom
Management. To determine the Efficacy in Student Engagement, Efficacy in Instructional
Practices, and Efficacy in Classroom Management subscale scores, unweighted means of the
items that load on each factor are computed. Generally these groupings are: Short Form Efficacy
68
in Student Engagement: Items 2, 4, 7, 11, Efficacy in Instructional Strategies: Items 5, 9, 10, 12,
Efficacy in Classroom Management: Items 1, 3, 6, 8. The short form was used for this study
because the reliability coefficients are sufficiently close to the long form reliability coefficients.
Tschannen-Moran and Woolfolk Hoy (2001) found the following reliabilities for the short form
that will be used in this study: TSES Mean =7.1(.98); α =.90; Efficacy in Student Engagement
Mean =7.2(.82); α =.81; Efficacy in Instructional Strategies Mean=7.3(.82); α =.86; Efficacy in
Classroom Management Mean=6.7(1.2 ); α =.86.
Research Design
The research design for this study was a quantitative, correlational study. The instrument
created for this study was designed to validate Rumberger’s (2011) Framework for
Understanding Dropout by asking participants to rate the extent to which they believe specific
factors related to the individual student, their families and their communities affect student
dropout. This study is designed to examine the relationship among three constructs: teacher
beliefs about the causes of dropout, teachers’ implicit theories of intelligence, and teacher
efficacy beliefs. The independent variable in this study is teacher beliefs about the causes of
dropout. The dependent variables are teachers’ sense of efficacy and their implicit theories of
intelligence.
69
Procedure
An instrument was created for this study to measure teacher beliefs about the factors that
influence student dropout. The Teacher Sense of Efficacy Scale (TSES) (Tschannen-Moran &
Woolfolk Hoy, 2001) instrument was used to quantify teachers’ sense of efficacy. The three item
Theories of Intelligence Scale (TIS; Dweck, 1995) was used to determine participants’ entity
versus incremental theory in the domain of intelligence. The compiled instruments and
demographic questions were converted into an on-line survey using Google forms. The
demographic questions were used to remove any potential participants who do not meet the
participation criteria.
A link to the electronic survey was shared through statewide weekly Twitter chats that
focus on general education topics in 46 states (see Table 1). Statewide general education chats
were identified by searching Twitter for statewide general education chats for all 50 states. This
information was compiled to create a schedule of statewide general education Twitter chats.
General education chats were selected rather than chats focused on specific topics (e.g.
curriculum, classroom technology) or specific groups (e.g. social studies teachers) to obtain a
broad sample. Only states that scheduled weekly chats were included. Three states (Alaska, New
Mexico and Washington) were excluded because they do not have statewide weekly general
education chats. States whose chats occur less than once per week were also excluded (Colorado,
New York and North Carolina). States whose chats are not scheduled for a specific time, but
rather occur continuously, were assigned a day and time of Wednesdays from 8-9 pm CST,
based on common times that other state chats take place. Three states (California, Idaho, and

70
Texas) have two weekly chats scheduled, so the survey was posted in both. The survey was
posted in 46 weekly general education chats in 44 states. Prior to starting data collection, a
message was sent to the moderators of each of the chats. The message explained the purpose of
the study, asked for their assistance in promoting participation and provided my contact
information. A link to the survey was published using each state hashtag during the specified
weekly chat for four consecutive weeks.
In addition to Twitter chats, the link was posted on the author’s personal Facebook page
continuously for the four week data collection period. Respondents were asked to repost the
survey link on their own Facebook pages.

71
CHAPTER 4
RESULTS
Research Question One
The first research question sought to identify the psychometric properties of the newly
developed Factors that Influence Dropout to determine how survey questions matched up to
Rumberger’s (2011) framework. An initial unforced principal components analysis (PCA) with
promax rotation was conducted and no meaningful factor structure grouping of items was
identified. A second PCA was conducted and one factor was forced for items in the Individual
category (items 1-38 in Appendix A). Items in the Individual category correlated to individual
student factors identified in Rumberger’s framework that could contribute to student dropout. To
establish a scale for the Individual category, all items with a factor loading score of .5 or above
were retained, resulting in a 12-item scale from the initial 38 items. A reliability analysis of the
12 retained items resulted in a Cronbach’s alpha of .83. A third PCA was conducted using items
from the Institutional category (items 39-62 in Appendix A). Items from the Institutional
category correlated to institutional factors identified in Rumberger’s framework that could
contribute to student dropout. Similar to the procedure for the Individual category, all items with
a factor loading of .5 or above were retained, resulting in a 14-item scale from the initial 24
items. A reliability analysis of the remaining 14 items in the Institutional category resulted in a

72
Cronbach’s alpha of .87. See Table 3 and Table 4 for finalized items on both the Institutional
and Individual scales.
Table 3
Factor Analysis One: Final Factor Structure for Individual Student Factors
Item Wording Loading
Item 35: A student whose friends perform well academically has an increased
chance of graduating.
.645
Item 33: The peers that a student spends time with affects their chances of
graduating.
.621
Item 19: Students who perceive themselves as capable of academic success have
an increased likelihood of graduating.
.617
Item 34: A student whose friends have dropped out has an increased chance of
dropping out.
.598
Item 29: Students who have trouble with the law have an increased likelihood of
dropping out.
.583
Item 16: Students who believe that education is important have an increased
likelihood of graduating.
.569
Item 22: Putting effort into school work increases the likelihood a student will
graduate.
.564
Item 30: Students who use drugs and alcohol have an increased chance of
dropping out.
.554
Item 24: Students who participate in extracurricular activities have an increased
likelihood of graduating.
.552
Item 15: Students who drop out don’t have clear goals for their future. .525
Item 32: Students who disrupt class frequently are more likely to drop out. .521
Item 21: Having a sense of belonging at school can help prevent students from
dropping out.
.505

73
Table 4
Factor Analysis Two: Final Factor Structure for Institutional Factors
Item Wording Loading
Item 57: Students who live in areas with high crime rates have an increased
likelihood of dropping out.
.772
Item 60: Students who live in communities in which most members live in
poverty have an increased likelihood of dropping out.
.762
Item 58: Students who live in communities with high levels of gang activity
have an increased likelihood of dropping out.
.733
Item 59: Students who live in communities with few high school graduates have
an increased likelihood of dropping out.
.702
Item 51: Coming from a poor family increases the likelihood that a student will
drop out.
.672
Item 39: Attending schools in which a high number of students live in poverty
increases the likelihood that a student will drop out.
.635
Item 40: Students who attend schools in which a high number of students are
racial minorities have an increased likelihood of dropping out.
.592
Item 49: Students living in an institutional setting (e.g. a group home) have an
increased likelihood of dropping out.
.547
Item 50: Students who live with adults other than their parents have an
increased likelihood of dropping out.
.542
Item 62: Students who live in communities with abundant job opportunities
have an increased likelihood of graduating.
.534
Item 43: Schools with poor facilities and few resources such as textbooks and
computers are more likely to have higher dropout rates than schools
with high quality facilities and abundant resources.
.534
Item 53: A student whose family reads regularly has an increased chance of
graduating.
.503
Item 48: Students living in a two parent household have an increased likelihood
of graduating.
.502
Item 52: A student whose family has access to the internet has an increased
likelihood of graduating.
.501
It was hypothesized that the factor structure for this survey would consist of two factors
(Individual and Institutional) in an unforced principal components analysis. Results of the initial
principal components analysis do not support this hypothesis.

74
It was hypothesized that the factors that teachers identify as influencing student dropout
would match to the factors on Rumberger’s framework. Results of the principal components
analysis partially support this hypothesis in that Institutional and Individual scales were
established only after the second and third PCA’s were conducted with one forced factor.
To further investigate the psychometric properties of the three part instrument used in my
study, additional descriptive analyses were conducted. For Factors that Influence Dropout, a
mean subscale score was determined for each category, Individual and Institutional. For the
Theories of Intelligence Scale (TIS), scores were averaged to determine an overall implicit
theory score. A score of 4.0 or above indicated a stronger entity theory, and a score of 3.0 or
below indicated a stronger incremental theory. The overall mean score for the TIS was (M=2.32,
SD=1.26), indicating that overall, participants in this study endorsed an incremental theory of
intelligence. A reliability analysis resulted in a Cronbach’s alpha of .95. For the Teachers’ Sense
of Efficacy Scale (TSES), to determine the Efficacy in Student Engagement, Efficacy in
Instructional Practices, and Efficacy in Classroom Management subscale scores, unweighted
means of the items that load on each factor were computed. For the TSES, the subscale means
were TSES Engagement (M=6.95, SD=1.23), TSES Instruction (M=7.93, SD=1.02), TSES
Classroom Management (M=7.65, SD=1.06), indicating participants in this study held a
relatively high sense of overall efficacy. A reliability analysis resulted in Cronbach’s alpha of
.94. See Table 5 for descriptive statistics for all primary study variables.

75
Table 5
Descriptive Statistics for Study Variables
Subscales N M (SD) Range Number of
Items
Alpha
Coefficient
Engagement 276 6.95 (1.23) 2-9 4 .78
Instruction 276 7.93 (1.02) 4-9 4 .85
Classroom
Management
276 7.65 (1.06) 3-9 4 .87
Individual
Factors
276 4.96 (.57) 3-6 12 .83
Institutional
Factors
276 4.33 (.69) 2-6 14 .87
TIS 276 2.32 (1.26) 1-6 3 .94
Research Question Two
The second research question sought to determine whether teachers in this sample would
assign a greater level of importance to Individual factors as leading to student dropout rather than
Institutional factors. It was hypothesized that teachers would assign a greater level of importance
to Individual factors than Institutional factors; results support this hypothesis. More specifically,
a paired sample t-test was conducted to compare participant scores for the individual scale and
the institutional scale. There was a significant difference in the scores for the Individual scale
(M=4.96, SD=.57) and the Institutional scale (M=4.33, SD=.69); t(275)=18.671, p<.001,

76
indicating participants assigned a higher level of importance to individual factors as they relate to
student dropout.
Research Question Three
The third research question sought to explore relationships among teacher beliefs about
factors that influence student dropout, their implicit theory of intelligence beliefs, and self-
efficacy beliefs. A correlation analysis was used to examine these relationships. Results of the
correlation analysis among the three primary study variables indicated significant correlations
between all three subscales of the TSES, and significant correlations between all three subscales
of the TSES and the overall TIS mean subscale score. There was a significant correlation
between the Individual and Institutional subscale scores. Significant correlations did not exist
between the Institutional subscale and any of the TSES subscales, nor the TIS subscale. There
was a significant correlation between the Individual subscale and the TSES Instructional
subscale and the TSES Classroom Management subscale, but not the TSES Engagement
subscale. See Table 6 for correlations among all primary study variables.
It was hypothesized that individual factors would positively correlate with an entity
theory of intelligence, and individual factors would negatively correlate with self-efficacy.
Results from the correlational analysis do not support this hypothesis. There was not a significant
correlation between the Individual subscale and TIS subscale and there was not a significant
correlation between the Individual subscale and TSES Engagement subscale. A positive
correlation existed between the Individual subscale and the TSES subscales of Instruction and

77
Engagement, respectively.
Note. *p<.05; **p<.01.,Engagement=Self-Efficacy for Engagement, Instruction=Self-Efficacy for
Instruction, Classroom Management =Self-Efficacy for Classroom Management
Table 6
Intercorrelations Among all Primary Study Variables
1. 2. 3. 4. 5. 6.
1. Engagement --
2. Instruction .664** --
3. Classroom Management .779** .715** --
4. Individual Factors .013 .142* .130* --
5. Institutional Factors .011 .059 .029 .614** --
6. Mindset -.178** -.186** -.146* .099 .115 --

78
CHAPTER 5
DISCUSSION
Much of the research on dropout prevention focuses on individual student factors such as
socioeconomic status, family structure, and peers (Rumberger, 2011). While that information is
helpful in understanding the complex interaction of factors over time that influence a student
prior to dropping out, these factors are largely outside of the influence and control of teachers
and schools. Given the importance of having a quality teacher in the classroom (Hattie, 2009),
and given the role that teacher beliefs may have in shaping teacher practices in the classroom
(Fives & Buehl, 2012; Kumar et al., 2015; Rattan et al., 2012; Woofolk-Hoy, Davis & Pape,
2006), this study sought to investigate the relationships among teacher beliefs about the factors
that influence student dropout, their implicit theory of intelligence beliefs and their self-efficacy
beliefs. High school dropout continues to impact thousands of students, schools and communities
every year; investigating how the beliefs of teachers working with students at risk of dropping
out affect their practices and student outcomes could lead to valuable information that can be
used in designing effective dropout interventions.
In this chapter, I will discuss the study findings as they relate to the research questions
and hypotheses that guided the study. I will then review strengths and limitations of the study,
and conclude with suggested directions for future research and implications for practice.

79
Psychometric Properties and Factor Structure
In the initial principal components analysis, I predicted that a two factor structure would
emerge, indicating that participants recognized the difference between individual and
institutional factors, and that they would assign a different level of importance to individual and
institutional factors as described in Rumberger’s Framework for Understanding Dropout. While
the two factor structure was not evident from the initial analysis, this could be attributed to the
way that the factors are organized on Rumberger’s (2011) framework. Family and Community
factors are included in the Institutional component of the framework, along with schools.
Grouping those factors with the factors on the Individual component of the scale would more
closely resemble a framework composed of Individual and School components. For example,
Lee and Burkham (2003) developed a framework similar to Rumberger’s in that it categorizes
the factors that influence student dropout, but different in the way the factors are categorized and
labeled. Lee and Burkham categorize Individual factors into social risk factors and academic risk
factors. Social risk factors include socioeconomic status, family background and personal
demographics such as gender and race. Academic risk factors include student behaviors and
academic performance. School components are categorized into school social organization and
academic organization. School social organization includes student teacher relationships as well
as student relationships with each other. Academic organization includes types of courses that
students are offered and take, as well as class size. While the factors described by Lee and
Burkam are very similar to Rumberger’s, their organization of factors create an internal (within
the school) and external (individual factors that are beyond schools influence) framework. Lee
80
and Burkam’s framework may more closely resemble the way teachers in this study interpret
these factors, given that 8 of the 14 items on the final Institutional scale referred to students’
families and the communities they live in. For example, item 51 on the Institutional scale refers
to a student’s poverty level; according to Rumberger’s (2011) framework, that factor is
considered part of the institutional setting of family. In Lee and Burkham’s framework, this
factor is considered an individual social risk factor. The organization and categorization of
factors on Rumberger’s (2011) framework may be part of the reason that a two factor structure
did not initially emerge.
When separate Individual and Institutional subscales were developed in the subsequent
factor analyses, the data did more closely align with the research on teacher beliefs about
dropout, in that teachers in this study attributed individual student factors as having a greater
level of importance in influencing student dropout, as was found by Bridgeland et al. (2009),
Lynn et al. (2010), and Knesting-Boody et al. (2013). While this does not indicate teachers in
this study do not understand the importance of school factors (for example, a quality teacher in
the classroom), it could indicate they underestimate the mitigating effects on student
achievement that they as teachers can have over external factors such as peers, family and
socioeconomic status (Hattie, 2009). For example, underestimating the effects of school
controlled factors such as instructional practices and positive student-teacher interactions may
cause teachers to underutilize these practices that support student achievement. It is important
that teachers have a full understanding of the powerful effects of their behaviors in the school
setting can have on student learning and achievement. Teachers in this study attributed mote
importance to individual factors than institutional factors as influencing student; despite their

81
high self-efficacy scores on the TSES, this could indicate they underestimate the amount of their
influence.
Importance of Individual and Institutional Factors
The second research question in this study examined the differences in importance that
teachers ascribed to individual and institutional factors. Teachers in this study ascribed more
importance to individual factors than institutional factors. However, when looking at the items
that comprised both of the scales, the majority of factors that loaded with .5 or better were
factors outside of school, specifically peers, community and family. Only three of the twenty six
items were those that could be influenced by teachers: student beliefs about the importance of
education, student sense of belonging at school, and student perception of their ability to learn.
This relates to Knesting-Boody and colleagues 2015 study which indicated a positive correlation
between teacher self-efficacy and the extent to which teachers perceived the following factors
influence dropout: not having a close relationship with teacher and not having a sense of
belonging at school (both can be influenced by teachers). While there was not a significant
correlation to the overall Institutional scale and any of the TSES subscales, teachers in this study
identified these three factors that can be influenced by teachers as having an influence on student
dropout, and the overall TSES subscale scores indicated that teacher in this study have high
levels of self-efficacy.
Although three of the Institutional scale items related to factors that could be influenced
by teachers, the remaining twenty three items on the Individual and Institutional scales related to
82
factors that are beyond teachers’ control such as peers, community, and family as well as poverty
and minority status. This supports Bridgeland and colleague’s (2009) research, in which teachers
were asked what factors influenced student dropout; the most frequently reason cited was not
enough support at home. Seventy-eight percent of teachers indicated that students who spent
time with peers disengaged from school was a factor in some, or most cases of dropout.
Additionally, when asked which group bore all or most of the responsibility for students
dropping out, 76% of teachers in the study felt that all or most of the responsibility for student
dropout belonged to students, and 74% felt it belonged to parents as well. Further studies reached
similar findings, such as the study by Lynn et al. (2010), in which teachers at a high school in
one of the lowest performing districts in Maryland identified parents as the primary cause of
students’ failure to achieve. In my study, the overwhelming majority (23 of 26) items on the
combined Institutional and Individual scales identified factors such as peers, community, and
family as well as poverty and minority status as influencing student dropout.
Given that almost all of the factors that influence dropout identified by teachers in my
study related to factors outside of the school and beyond teachers’ control, it is possible that
these beliefs are related to their self-efficacy beliefs in way which were not measured in my
study. Knesting-Boody (2013) and colleagues found that one quarter of teachers in their study
indicated that outside influences such as peers and family were too strong of an influence for
teachers to overcome, indicating low self-efficacy in overcoming outside influences. That
statistic represents only about 25 teachers, but when one considers the hundreds of students they
work with every day, year after year, the implications of those self-defeating beliefs become far
more significant. The results of this study are cause for concern, and although results from my

83
study indicated teachers had high levels of self-efficacy, the fact that the majority of factors they
attributed as influencing student dropout were related to factors outside of their control could be
interpreted as contradictory.
While Rumberger (2011) asserts that dropout is highly complex and can be understood
only through the many factors that characterize individual students and the settings they live in,
recent studies indicate a significant number of teachers believe external factors, such as families
and peers, have a strong influence over student dropout, to the extent of being impossible to
overcome through the efforts of teachers and schools (Bridgeland et al.,2009; Lynn et al.,2010;
Knesting-Boody et al., 2015). Given the evidence that supports the connection between beliefs
and practices, these findings indicating teachers do not feel they have enough power to overcome
outside influences on student achievement and attainment are troubling. These beliefs could
negatively influence teacher behaviors and practices when working with students at risk of
dropping out.
Rumberger not only argues that dropout is complex, and that it is influenced by
individual student factors and the institutional settings students live in, he further argues that
different factors can affect students differently at different times. The results from my study and
others indicate teachers believe individual factors that exist outside of the control of schools such
as peers and families are more important than those that exist with the control of schools, such as
teacher practices. This does not mean that Rumberger’s (2011) framework is not valid. It
represents a holistic picture of the influences that can influence student academic attainment, and
it is important not to oversimplify dropout as an isolated event, rather than an event that is a
culmination of years of experiences both in and out of school. The results of this study did not

84
match up to Rumberger’s (2011) framework, possibly because something as complex as his
framework cannot be measured through the survey created for this study, Factors that Influence
Dropout. Developing effective dropout prevention strategies and interventions for students at risk
Teacher Beliefs About Dropout, Theory of Intelligence and Self-Efficacy
The third research question in my study sought to examine the relationship between
teacher beliefs about factors that influence student dropout, their implicit theory of intelligence
beliefs and their self-efficacy beliefs. Results indicated a significant relationship between teacher
self-efficacy beliefs and their implicit theory beliefs. This relationship has not been investigated
in other studies. While it is not surprising that the results of this study indicated that teachers who
believe that intelligence can be improved through effort have strong beliefs in their own abilities
to effectively instruct and engage students, as well as manage a classroom, these results could
also indicate an overall belief that both students and teachers can have a strong influence on
student learning and achievement, and that effort on both sides will yield positive results.
Implicit theory beliefs are an indication on whether or not an individual believes that intelligence
can change through effort. Believing that something can be changed is an important precursor to
believing that one has the capacity to change something, and to what extent. For example, a
teacher holding an incremental theory of intelligence believes that intelligence is malleable and
can be changed through effort. If that teacher has a low performing student in class, they may be
more likely to feel more self-efficacious in helping that student improve their intelligence and
achievement, and may display more perseverance in helping that student improve.
85
The results of my study did not indicate a relationship between teacher beliefs about the
factors that influence student dropout and their implicit theory of intelligence beliefs, nor was
there a relationship between teacher beliefs about the factors that influence student dropout and
their self-efficacy beliefs. This could be due to the previously discussed organization of the
institutional and individual factors on Rumberger’s (2011) framework, specifically factors that
he categorized as institutional that may be considered individual by teachers because they are
outside of the control of the school.
Findings from my study indicate the need for further investigation into the significance of
the role of teacher beliefs and actions in the larger context of dropout prevention, perhaps
through a different framework, separate components of a framework, or a combination of
existing frameworks. This study focused on teacher beliefs about factors that influence dropout
related to a very specific framework (Rumberger, 2011); as a whole, the Insitutional and
Individual subscales did not have significant relationships with their implicit theory of
intelligence beliefs or their self-efficacy beliefs, but examining the relationships between each of
the subcategories (i.e., peers, families) and implicit theories of intelligence and self-efficacy
beliefs may have resulted in significant relationships.
Teachers in this study held a significantly stronger incremental theory of intelligence as
opposed to entity theory beliefs, and held relatively high levels of self-efficacy. These results are
encouraging because they indicate they are more likely to employ academically supportive
behaviors toward students in the classroom, may be less likely to give up on students at risk of
dropping out, and may be more likely to support school policies that benefit students with
multiple risk factors for dropping out. It has been established in the research that teachers’
86
implicit theory of intelligence beliefs and their self-efficacy beliefs influence the way that
individuals approach challenging situations, the way they behave when faced with a difficult
task, to what they attribute success or failure, their persistence when faced with challenge and
their resilience when setbacks occur (Dweck, 1995; Tschannen-Moran, Hoy & Hoy, 1998).
Watanabe (2006) worked with a small inquiry group of six teachers to examine how their beliefs
about intelligence informed their practices, and found that teachers who believed their students
were incapable of learning skills they should have learned in an earlier grade did not attempt to
teach the skills to students, but continued to lament their students lack of knowledge throughout
the study. Research by Oakes, Wells, Jones, and Datnow (1997) indicated that teacher
assumptions and beliefs about student ability and intelligence were correlated to resistance to
policies and practices that provide greater opportunity to students with multiple risk factors for
failure. In their three year, longitudinal case study of ten racially and socioeconomically diverse
high schools, they found that teachers who believed intelligence is a fixed construct were less
likely to support changes such as detracking (assigning students to mixed ability courses) and
calendar revisions that would allow struggling students to have additional calendar days to
complete coursework. While teaching students skills that they should have previously learned, or
teaching students of varying ability and achievement levels in detracked classes are challenging
and difficult tasks, it is important that teachers are willing to face these types of challenges with
not only pedagogical skill, but a belief that they and their students can successfully overcome
challenges to learning and achievement. Teachers have a significant effect on student learning
and subsequent achievement, and are crucial to every student’s educational experience (Hattie,
2009), and therefore the ways they approach and respond to challenges in the classroom are

87
critical. While my study did not find clear relationships between the three aspects of teachers’
belief systems that were measured, further study into the relationship between teacher beliefs,
teacher actions, and student outcomes, specifically in challenging situations such as teaching
students who are at risk of dropping out, could possibly shed more light on the significance of
teacher beliefs as they relate to student outcomes.
Overall, teachers in this study held a significantly stronger incremental theory of
intelligence as opposed to entity theory, and held relatively high levels of self-efficacy, yet they
indicated they felt individual student factors more strongly influenced student dropout than
institutional factors, such as those related to teacher practices. Furthermore, teachers in this study
attributed more significance to factors such as peers, the community and student beliefs and
behaviors, despite having incremental intelligence beliefs and high self-efficacy beliefs. While
the results of my study support the research of Bridgeland et al. (2009) and Knesting-Lund et al.
(2013) in that teachers attributed more importance to individual student factors in influencing
dropout, it does not support the research of Knesting-Lund et al. (2015), which found a positive
correlation between teacher efficacy and institutional factors that were within the control of
schools, such as strong student-teacher relationships and school climate. Given the incremental
theory of intelligence beliefs and high self-efficacy beliefs of teachers in my study, it was
predicted that teachers would assign a higher level of importance to institutional factors that are
within the power of schools and teachers to change; results indicated they assigned more
importance to individual factors which are outside of their control. The seemingly contradictory
relationships among beliefs about factors that influence dropout and self-efficacy beliefs in my
study relates to the results of Christle and colleagues (2007) study, in which teachers in schools

88
with high dropout rates perceived dropout as a problem in their school, and parent involvement
as poor, yet perceived their school climate as good and themselves and the administration as
having high expectations for all students. Bridgeland et al. (2009) found that in schools with less
than an 80% graduation rate, 64% of teachers described their schools as doing a good or
excellent job. Further research is needed on the effects of this incongruity among teacher
perceptions about their students, their schools and themselves and student performance and
achievement.
The results of my study provided some insight into the factors teachers believe influence
student dropout, and contributed to the literature on this complex subject, although they did not
fully validate Rumberger’s 2011 Framework for Understanding Dropout. Additionally, the study
examined these beliefs as they relate to teacher efficacy and implicit theories of intelligence,
which had not been previously studied. Finally, this study supports the need for further research
on the relationship between teacher beliefs, practices and student outcomes.
Strengths
A strength of this study is that it sought to investigate the nature of teacher beliefs about
dropout, as they relate to implicit theory of intelligence beliefs and self-efficacy beliefs. While
there is much in the literature about the latter two well-established constructs, there is limited
research on teacher beliefs about student dropout, teacher beliefs about student dropout as they
relate to sense of efficacy, and virtually no studies that explored the relationship between the
three. Results from this study indicated a significant relationship between teachers’ implicit
89
theory of intelligence beliefs and their self-efficacy beliefs. A survey was created for a complex
theoretical concept, specifically for Rumberger’s Framework for Understanding Dropout; a
survey to measure this conceptual framework did not previously exist. Another strength was that
there were a fairly large number of participants, with variation in race/ethnicity, gender, number
of years teaching, and representation from geographically diverse locations. The use of social
media to contact participants and publicize the study can also be considered a strength as it adds
to the literature on the use of modern technology to conduct survey research. Finally, this
information was reported by those most likely to impact students in a school setting; their views
are important to a study on student dropout.
Limitations
A limitation to the study was sampling bias. Participants self-selected to take part in the
study, resulting in an overall sample population that is not representative of the teaching
population. The teachers who self-selected to participate in the study accessed the survey through
Twitter education chats. Teachers who participate in online education forums and discussions
outside of regularly scheduled work hours may be more likely to spend time to take a survey
than those who do not. Additionally, it is possible that teachers who participate in professional
growth opportunities of their own accord outside of the work day may have a greater belief in the
complexity of factors that influence student dropout, causing them to assign similar importance
to individual and institutional factors, as well as to support an implicit theory of intelligence and
have a higher sense of efficacy in the classroom. A further limitation is that the data was

90
collected through survey only. Interviews and classroom observation data could have provided
additional insights and more specific explanations for teacher beliefs about student dropout.
Finally, a limitation to the data analysis is that the initial factor analysis did not result in a
meaningful factor structure, possibly due to the structure of Rumberger’s (2011) Framework for
Understanding Dropout, as well as the complexity of the framework.
Directions for Future Research
To develop effective dropout interventions, the role of teachers needs to be closely
examined not only by those designing the interventions, but by teachers themselves. Teachers are
asked to reflect on their instructional practices as part of their professional responsibilities;
perhaps they should be asked to reflect on the beliefs that inform their practices as well. As the
people who spend the most time with students, if teachers do not believe that they have the
ability to effectively teach students at risk of dropping out, despite the outside influences beyond
their control, interventions based on teacher practices and interactions with students may not be
as effective as they could be. Future research should focus on how teacher reflection on their
beliefs can be used to improve practices and improve student outcomes.
This study examined teacher beliefs about factors that influence dropout, their implicit
theory of intelligence beliefs and their self-efficacy beliefs. Teacher beliefs about their ability to
effect positive change with struggling students can influence student performance and
achievement, as well as the overall school culture and climate. These beliefs not only can affect
the instructional practices they use, but also the ways that they interact with students. Research
91
on effective schools indicates that school climate and social emotional learning are as important
as academic learning when teaching students at risk. Specifically, developing a professional
culture based on collective efficacy and the belief that all students can learn were identified as
school characteristics that can positively influence student achievement in schools with high
populations of students at risk of failure. A recent study by Rutlege, Cohen-Vogel, Osborne-
Lampkin, and Roberts (2015) indicated that high schools with a large percentage of teachers who
support a positive social emotional climate in addition to rigorous academic beliefs and supports
can increase student achievement. In this study, they conducted a year-long, multilevel
comparative case study on the characteristics of effective urban high schools. Using value-added
methodology, they identified and compared two higher performing high schools in Broward
County, Florida to two lower performing high schools. They found that although the overall
student populations shared similar characteristics (high percentage of low socioeconomic status
students, high percentage of minority students),the two schools that were performing at higher
levels had strong and deliberate structures, programs, and practices that supported students’
academic and social learning needs. While they did not find significant differences between
schools as far as instruction, they found major differences in staff beliefs about their abilities to
influence student success, and the programs and practices in the schools that supported student
achievement (Rutlege et al., 2015). Further research on the relationship between collective and
individual teacher beliefs and how these beliefs inform their relationships with colleagues,
parents and students in their buildings may provide important insight into how to strengthen
these school characteristics.
92
Teachers may have a significant impact on dropout prevention strategies and
interventions, as well as dropout recovery programs. Research indicates that teachers have a
significant effect on student achievement (Hattie, 2009); however, it also indicates that teachers
do not perceive themselves as having the power to prevent student dropout (Bridgeland et al.,
2009; Knesting-Lund et al., 2013). Research by Iachini, Buettner, Anderson-Butcher, and Reno
(2013) indicates that students who have dropped out and re-enrolled perceive teachers as having
a significant influence on dropping out and coming back to school. Students who had dropped
out of high school and then re-enrolled at an alternative recovery school identified the factors
they perceived to influence their success at the recovery school as an individualized approach to
learning with strong support from their teachers, school structure, which included a flexible
schedule that allowed them to attend classes regularly and meet their obligations outside of
school, and a positive school climate. Many of the factors that they identified as contributing to
their success were in direct contrast to the factors they identified as influencing their decision to
drop out of their former school (unsupportive teachers, a rigid schedule and a negative overall
school climate).
Further research on the relationships among teacher beliefs, teacher actions, and student
achievement could have a significant effect on student outcomes and dropout prevention. While
parents hold a significant responsibility for their children’s success or failure in school, if they
are not fulfilling that responsibility, we as educators have to work from a place of acceptance and
belief in our own ability to overcome these obstacles. To support that work, continued research is
needed on identifying and testing practices that are effective for students with multiple risk
factors, especially students of color and those living in poverty, who are most likely to dropout.

93
Much of the research in this area has been conducted with teachers in a specific school, district
or geographic area; future research should include more representative teacher samples, as well
as student perspectives and achievement data. More work has to be done to translate theory about
the importance of teacher beliefs into classroom based instructional practices that can be used by
teachers on a large scale in a variety of instructional settings.
Conclusion and Implications for Practice
A quality teacher can be one of the most influential factors that affect student outcomes.
Given the number of students that drop out of school, and given the fact that dropout rates are far
higher for minority students living in poverty, ensuring that all students have an effective teacher
in the classroom is a critical component of dropout prevention efforts. In his 2011 Framework
for Understanding Dropout, Rumberger argues that student dropout is a complex process,
influenced by individual student factors such as background, attitudes, and behaviors, as well as
the institutional settings of family, school, and community in which students live. In this study, I
suggested teacher beliefs about the factors that influence student dropout, their beliefs about
students potential to learn despite past performance, and their efficacy beliefs about their ability
to successfully teach challenging students and overcome external influences may inform the
pedagogical practices they employ when teaching students who are having academic difficulty
and are nearing the point of dropout. These practices, which include establishing positive
relationships, implementing alternative strategies, holding high expectations, persevering in the

94
face of setbacks, and encouraging a growth mindset in students could have the potential to
increase student achievement and keep students in school.
The responsibility of educating teachers on the research on the importance of teacher
beliefs falls not only with teacher preparation programs, but with Principals and school leaders as
well. The Illinois Performance Standards for School Leaders state that Principals are responsible
for establishing collaborative relationships among teachers, students, parents and families, as
well as developing and maintaining a positive school culture and climate. Principal preparation
programs must ensure that aspiring educational leaders develop an understanding of the
importance of teacher beliefs as they relate to teacher behaviors, and also when implementing
changes in policy, practices and expectations of teacher performance and evaluation. It is
important for educational leaders not only to assess teacher beliefs accurately, but to have honest
discussions with teachers about how these beliefs inform their practice. Finally, it is important
that research on the role of teacher beliefs, how they relate to outward practices and how teacher
practices (both academic and social) relate to student outcomes be used to drive and inform
professional development, teacher preparation programs, principal preparation programs, and
legislation and funding policies to ensure that all students have access to high quality teachers
from pre-k through graduation. Ensuring that every student graduates high school ready to
pursue gainful employment or post-secondary education should be the highest priority of our
educational system.
95
REFERENCES
American Recovery and Reinvestment Act of 2009, H.R. 1 (2009). Retrieved from
https://www.govtrack.us/congress/bills/111/hr1
Alexander, K., Entwisle, D., & Kabbani, N. (2001). The dropout process in life course
perspective: Early risk factors at home and school. The Teachers College
Record, 103(5), 760-822.
Allensworth, E. M., & Easton, J. Q. (2005). The on-track indicator as a predictor of high school
graduation. Consortium on Chicago School Research, University of Chicago.
Allensworth, E. M., & Easton, J. Q. (2007). What matters for staying on track and graduating
in Chicago Public High Schools. Chicago, IL: Consortium on Chicago school research.
Allensworth, E. M., Gwynne, J., Moore, P., & de la Torre, M. (2014). Looking forward to
high school and college: Middle school indicators of readiness in Chicago public
schools. Chicago: University of Chicago Consortium on Chicago School Research, 367,
17.
Armor, D. (1976). Analysis of the school preferred reading program in selected Los Angeles
minority schools.
Aronson, J., Fried, C. B., & Good, C. (2002). Reducing the effects of stereotype threat on
African American college students by shaping theories of intelligence. Journal of
Experimental Social Psychology, 38(2), 113-125.
Ashton, P. T., & Webb, R. B. (1986). Making a difference: Teachers' sense of efficacy and
student achievement. Longman Publishing Group.
Ashton, P. T. (1982). A Study of Teachers' Sense of Efficacy. Final Report, Volume I.
Balfanz, R. (2009). Can the american high school become an avenue of advancement for
all? The Future of Children, 19(1), 17-36.
Balfanz, R., & Legters, N. (2004). Locating the Dropout Crisis. Which High Schools Produce
the Nation's Dropouts? Where Are They Located? Who Attends Them? Report
70. Center for Research on the Education of Students Placed at Risk CRESPAR.
Bandura, A. (1997). Self-efficacy: The exercise of control. Macmillan.
96
Barber, B., & Olsen, J. (2004). Assessing the transition from middle to high school. Journal
of Adolescent Research, 19(1), 3-30.
Behind, N. C. L. (2002). Act of 2001, Pub. L. No. 107-110, § 115. Stat, 1425, 107-110.
Blackwell, L. S., Trzesniewski, K. H., & Dweck, C. S. (2007). Implicit theories of
intelligence predict achievement across an adolescent transition: A longitudinal study and
an intervention. Child development, 78(1), 246-263.
Brewster, A. B., & Bowen, G. L. (2004). Teacher support and the school engagement of
Latino middle and high school students at risk of school failure. Child and Adolescent
Social Work Journal, 21(1), 47-67.
Bridgeland, J. M., Dilulio Jr, J. J., & Balfanz, R. (2009). On the Front Lines of Schools:
Perspectives of Teachers and Principals on the High School Dropout Problem. Civic
Enterprises.
Caprara, G. V., Barbaranelli, C., Steca, P., & Malone, P. S. (2006). Teachers' self-efficacy
beliefs as determinants of job satisfaction and students' academic achievement: A study at
the school level. Journal of school psychology, 44(6), 473-490.
Carlson, D., & Planty, M. (2012). The ineffectiveness of high school graduation credit
requirement reforms a story of implementation and enforcement? Educational
Policy, 26(4), 592-626.
Carnevale, A. P., Smith, N., & Strohl, J. (2013). Recovery: Job growth and education
requirements through 2020.
Christle, C. A., Jolivette, K., & Nelson, C. M. (2007). School characteristics related to high
school dropout rates. Remedial and Special education, 28(6), 325-339.
Coleman, J. S. (1988). Social capital in the creation of human capital. American journal of
sociology, S95-S120.
Coleman, J. S., Campbell, E. Q., Hobson, C. J., McPartland, J., Mood, A. M., Weinfeld, F.
D., & York, R. L. (1966). Equality of educational opportunity: Summary report (Vol. 2).
US Department of Health, Education, and Welfare, Office of Education.
Dweck, C. S., Chiu, C. Y., & Hong, Y. Y. (1995). Implicit theories and their role in
judgments and reactions: A word from two perspectives.Psychological inquiry, 6(4), 267-
285.
Dweck, C. S. (1999). Caution--Praise Can Be Dangerous. American Educator, 23(1), 4-9.

97
Dweck, C. (2006). Mindset: The new psychology of success. Random House.
Every Student Succeeds Act, S.1177 (2015).
Fall, A. M., & Roberts, G. (2012). High school dropouts: Interactions between social context,
self-perceptions, school engagement, and student dropout. Journal of adolescence, 35(4),
787-798.
Fives, H., & Buehl, M. M. (2012). Spring cleaning for the “messy” construct of teachers’
beliefs: What are they? Which have been examined? What can they tell us. APA
educational psychology handbook, 2, 471-499.
Gardner, D. P. (1983). A nation at risk. Washington, D. C.: The National Commission on
Excellence in Education, US Department of Education.
Gasper, J., DeLuca, S., & Estacion, A. (2012). Switching Schools Revisiting the Relationship
Between School Mobility and High School Dropout.American Educational Research
Journal, 49(3), 487-519.
Guskey, T. R. (1981). Measurement of the Responsibility Teachers Assume for Academic
Successes and Failures in the Classroom. Journal of Teacher Education, 32(3), 44-51.
Guskey, T. R. (1984). The influence of change in instructional effectiveness upon the
affective characteristics of teachers. American Educational Research Journal, 21(2), 245-
259.
Guskey, T. R., & Passaro, P. D. (1994). Teacher efficacy: A study of construct
dimensions. American educational research journal, 31(3), 627-643.
Gutshall, C. A. (2013). Teachers’mindsets for students with and without
disabilities. Psychology in the Schools, 50(10), 1073-1083.
Harvey, J., & Housman, N. (2004). Crisis or possibility. Conversations About the American
High School.
Hattie, J. A. C. (2009). Visible learning: A synthesis of 800+ meta-analyses on
achievement. Abingdon: Routledge.
Hauser, R., Frederick, C., & Andrew, M. (2007). Grade retention in the age of
accountability. Standards-Based Reform and the Poverty Gap, edited by Adam Gamoran
(Washington: Brookings Institution Press, 2007), 120-53.
Iachini, A. L., Buettner, C., Anderson-Butcher, D., & Reno, R. (2013). Exploring students'
perceptions of academic disengagement and reengagement in a dropout recovery charter
school setting. Children & Schools, cdt005.

98
Isakson, K., & Jarvis, P. (1999). The adjustment of adolescents during the transition into high
school: A short term longitudinal study. Journal of Youth and Adolescence, 28(1), 1-26.
Jimerson, S. R., Anderson, G. E., & Whipple, A. D. (2002). Winning the battle and losing the
war: Examining the relation between grade retention and dropping out of high
school. Psychology in the Schools, 39(4), 441-457.
Jones, B. D., Bryant, L. H., Snyder, J. D., & Malone, D. (2012). Preservice and inservice
teachers' implicit theories of intelligence. Teacher Education Quarterly, 39(2), 87-101.
Kaufman, P. (2004). The national dropout data collection system: History and the search for
consistency. Dropouts in America: Confronting the graduation rate crisis, 107-130.
Knesting-Lund, K., Reese, D., & Boody, R. (2013). Teachers’ Perceptions of High School
Dropout and Their Role in Dropout Prevention: An Initial Investigation. Journal of
Studies in Education, 3(4), 57-71.
Knesting-Lund, K., O’Rourke, B., & Gabriele, A. (2015). Teachers’ Efficacy for Supporting
At-Risk Students and Their Perceived Role in Dropout Prevention. Journal of Studies in
Education, 5(2), 187-198.
Kozol, J., & Perluss, D. (1992). Savage inequalities: Children in America's
schools. Clearinghouse Rev., 26, 398.
Kumar, R., Karabenick, S. A., & Burgoon, J. N. (2015). Teachers’ implicit attitudes, explicit
beliefs, and the mediating role of respect and cultural responsibility on mastery and
performance-focused instructional practices.Journal of Educational Psychology, 107(2),
533.
Lynn, M., Bacon, J., Totten, T., Bridges, III, T., & Jennings, M. (2010). Examining teachers'
beliefs about African American male students in a low-performing high school in an
African American school district. The Teachers College Record, 112(1).
Lee, V. E., & Burkam, D. T. (2003). Dropping out of high school: The role of school
organization and structure. American Educational Research Journal,40(2), 353-393.
Neild, R. C., & Balfanz, R. (2006). Unfulfilled Promise: The Dimensions and Characteristics
of Philadelphia's Dropout Crisis, 2000-2005. Philadelphia: Philadelphia Youth
Transitions Collaborative.
Neild, R. C., Stoner-Eby, S., & Furstenberg, F. (2008). Connecting entrance and departure:
the transition to ninth grade and high school dropout. Education and Urban
Society, 40(5), 543-569.

99
NYU Steinhardt School of Culture, Education and Human Development, Metropolitan
Center for Urban Education. (2006). A close look at the dropout crisis: Examining black
and latino males in new york city New York University.
Oakes, J., Wells, A., Jones, M., Datnow, A. (1997). Detracking: the social construction of
ability, cultural politics and resistance to reform. The Teachers College Record, 98(3),
482-510.
Orfield, G. (2004). Dropouts in America: Confronting the graduation rate crisis. Harvard
Educational Pub Group.
Prepared, A. N. (1986). Teachers for the 21st Century. The Report of the Task Force on
Teaching as a Profession.
Pretzlik, U., Olsson, J., Nabuco, M. E., & Cruz, I. (2003). Teachers’ implicit view of
intelligence predict pupils’ self-perception as learners. Cognitive Development, 18(4),
579-599.
Rattan, A., Good, C., & Dweck, C. S. (2012). “It's ok—Not everyone can be good at math”:
Instructors with an entity theory comfort (and demotivate) students. Journal of
Experimental Social Psychology, 48(3), 731-737.
Roderick, M., & Camburn, E. (1999). Risk and recovery from course failure in the early
years of high school. American Educational Research Journal, 36(2), 303-343.
Rosenkranz, T., de la Torre, M., Stevens, W. D., & Allensworth, E. M. (2014). Free to fail:
Why grades drop when students enter high school and what adults can do about it.
Ross, J. A. (1992). Teacher efficacy and the effects of coaching on student
achievement. Canadian Journal of Education/Revue canadienne de l'education, 51-65.
Ross, J. A. (1994). Beliefs That Make a Difference: The Origins and Impacts of Teacher
Efficacy.
Rumberger, R. W. (2011). Dropping out. Harvard University Press.
Rumberger, R. W. (1987). High school dropouts: A review of issues and evidence. Review of
educational research, 57(2), 101-121.
Rumberger, R. W. (2001). Why students drop out of school and what can be done. Civil
Rights Project, Harvard University.
Rumberger, R. W., & Larson, K. A. (1998). Student mobility and the increased risk of high
school dropout. American Journal of Education, 1-35.

100
Rutledge, S., Cohen-Vogel, L., Osborne-Lampkin, L., Roberts, R. (2015). Understanding
effective high schools:evidence for personalization for academic and social emotional
learning. American Educational research Journal, 52(6), 1060-1092.
Seidman, E., Aber, J., Allen, L., & French, S. (1996). The impact of the transition to high
school on the self-system and perceived social context of poor urban youth. American
Journal of Community Psychology, 24(4), 489-515.
Smith, R. C., & Lincoln, C. A. (1988). America's Shame, America's Hope: Twelve Million
Youth at Risk.
Stark, P., and Noel, A.M. (2015). Trends in High School Dropout and Completion Rates in
the United States: 1972–2012 (NCES 2015- 015). U.S. Department of Education.
Washington, DC: National Center for Education Statistics. Retrieved February 5, 2016
from http://nces.ed.gov/pubsearch.
Stearns, E., & Glennie, E. J. (2006). When and why dropouts leave high school. Youth &
Society, 38(1), 29-57.
Stetser, M., and Stillwell, R. (2014). Public High School Four-Year On-Time Graduation
Rates and Event Dropout Rates: School Years 2010–11 and 2011–12. First Look (NCES
2014-391). U.S. Department of Education. Washington, DC: National Center for
Education Statistics. Retrieved February 5, 2016 from http://nces.ed.gov/pubsearch.
Sunderman, G. L., Kim, J. S., & Orfield, G. (Eds.). (2005). NCLB meets school realities:
Lessons from the field. Corwin-volume discounts.
Tschannen-Moran, M., Hoy, A. W., & Hoy, W. K. (1998). Teacher efficacy: Its meaning and
measure. Review of educational research, 68(2), 202-248.
Tschannen-Moran, M., & Hoy, A. W. (2001). Teacher efficacy: Capturing an elusive
construct. Teaching and teacher education, 17(7), 783-805.
Tyler, J., & Lofstrom, M. (2009). Finishing high school: Alternative pathways and dropout
recovery. The Future of Children, 19(1), 77-103.
U.S. Department of Education, National Center for Education Statistics. (2015). The condition of
education 2015 (NCES 2015-144). Retrieved from website:
http://nces.ed.gov/fastfacts/display.asp?id=16.
U.S. Department of Labor, Bureau of Labor Statistics. (2016). Employment status of the civilian,
noninstitutional population by race, Hispanic or Latino ethnicity, sex and age, seasonally
adjusted. Retrieved from website: http://www.bls.gov/web/empsit/cpseea04.pdf.
101
U.S. Department of Labor, Bureau of Labor Statistics. (2015). Labor force characteristics by
race and ethnicity, 2014 (USDL-15-1057). Retrieved from website: http:// /opub/reports/race-and-ethnicity/archive/labor-force-characteristics-by-race-and-
ethnicity-2014.pdf.
U.S. Department of Labor, Bureau of Labor Statistics. (2014). Usual weekly earnings of
wage and salary workers fourth quarter of 2013 (USDL-14-0094). Retrieved from
website: http://www.bls.gov/news.release/pdf/wkyeng.pdf.
Watanabe, M. (2006). " Some People Think This School Is Tracked and Some People Don't":
Using Inquiry Groups to Unpack Teachers' Perspectives on Detracking. Theory Into
Practice, 45(1), 24-31.
Weiner, B. (1986). Attribution, emotion, and action. Handbook of motivation and cognition:
Foundations of social behavior, 1, 281-312.
Woolfolk Hoy, A., Davis, H., & Pape, S. J. (2006). Teacher knowledge and
beliefs. Handbook of educational psychology, 2, 715-738.

APPENDIX A
SURVEY “FACTORS THAT INFLUENCE DROPOUT”

103
Appendix A. Survey “Factors that Influence Dropout”
Student Dropout
This survey is designed to measure educator beliefs about the factors that influence student
dropout, teacher beliefs about the malleability of intelligence, and teacher self-efficacy beliefs.
This survey is an anonymous, and no personally identifying information will be collected.
Please answer all of the questions in the survey. Thank you for your participation.
Demographic Information and Consent to Participate in the Study
The following questions will establish consent to use the data from this survey in the study, as
well as obtain non identifying demographic information about respondents.
I agree to participate in this study.*Required
● Yes
● No
Do you currently work as a high school teacher?*Required
● Yes
● No
What state do you currently work in?
How long have you worked as a high school teacher?*Required
● 0-5 years
● 6-10 years
● 11-15 years
● 16 years or more
What subject area do you spend most of your time teaching?*Required
● English/Language Arts
● Math
● Science
● Social Studies
● Other
Approximately what percentage of students in your school qualify for Free and Reduced Lunch?
If you don't know, please leave blank

104
What is your gender?*Required
● Male
● Female
What is your race/ethnicity?*Required
● Hispanic
● African American
● Asian
● Caucasian/non-Hispanic
● Other
● I prefer not to answer
The following section contains statements about individual student characteristics as they
relate to student dropout. Please answer based on the degree to which you agree or disagree
with each statement.
1= strongly disagree 2=disagree 3=somewhat disagree 4=somewhat agree 5=agree
6=strongly agree
1. Male students are more likely than female students to drop out of school.*Required
Strongly Disagree 1 2 3 4 5 6 Strongly Agree
2. Minority students are more likely to drop out than white students.*Required
Strongly Disagree 1 2 3 4 5 6 Strongly Agree
3. Speaking a first language other than English increases a student’s chance of dropping
out.*Required
Strongly Disagree 1 2 3 4 5 6 Strongly Agree
4. Students in good health are more likely to do well in school.*Required
Strongly Disagree 1 2 3 4 5 6 Strongly Agree
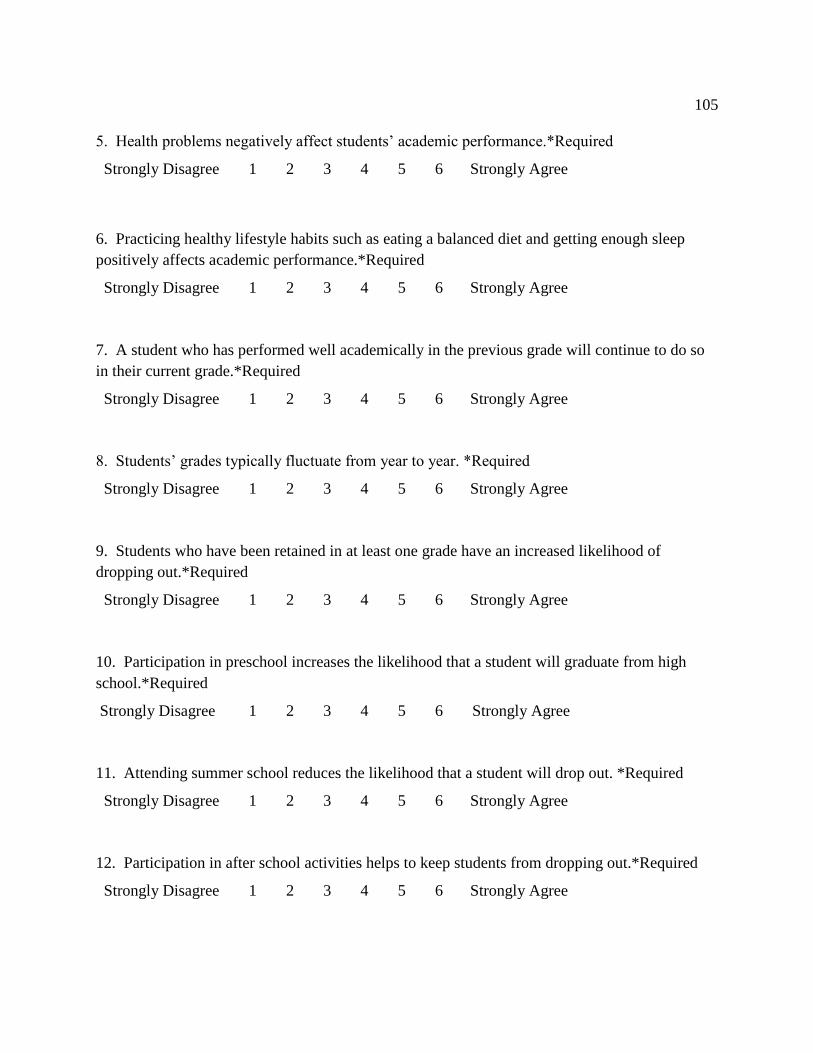
105
5. Health problems negatively affect students’ academic performance.*Required
Strongly Disagree 1 2 3 4 5 6 Strongly Agree
6. Practicing healthy lifestyle habits such as eating a balanced diet and getting enough sleep
positively affects academic performance.*Required
Strongly Disagree 1 2 3 4 5 6 Strongly Agree
7. A student who has performed well academically in the previous grade will continue to do so
in their current grade.*Required
Strongly Disagree 1 2 3 4 5 6 Strongly Agree
8. Students’ grades typically fluctuate from year to year. *Required
Strongly Disagree 1 2 3 4 5 6 Strongly Agree
9. Students who have been retained in at least one grade have an increased likelihood of
dropping out.*Required
Strongly Disagree 1 2 3 4 5 6 Strongly Agree
10. Participation in preschool increases the likelihood that a student will graduate from high
school.*Required
Strongly Disagree 1 2 3 4 5 6 Strongly Agree
11. Attending summer school reduces the likelihood that a student will drop out. *Required
Strongly Disagree 1 2 3 4 5 6 Strongly Agree
12. Participation in after school activities helps to keep students from dropping out.*Required
Strongly Disagree 1 2 3 4 5 6 Strongly Agree
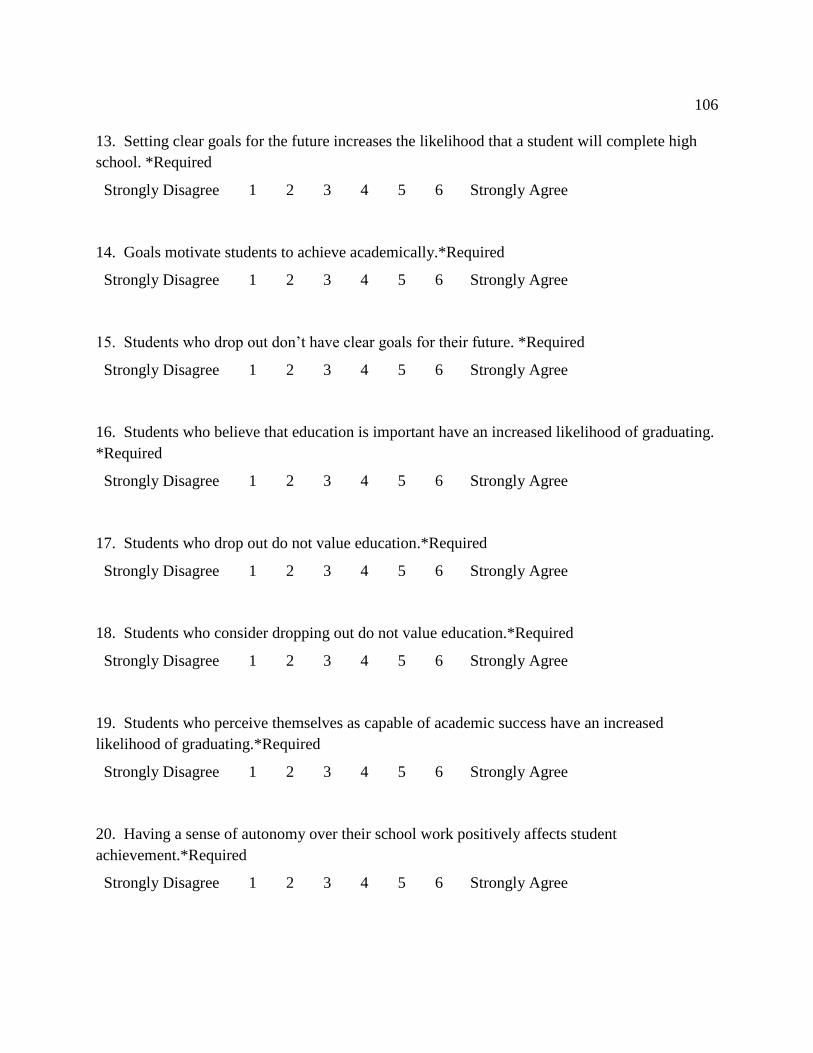
106
13. Setting clear goals for the future increases the likelihood that a student will complete high
school. *Required
Strongly Disagree 1 2 3 4 5 6 Strongly Agree
14. Goals motivate students to achieve academically.*Required
Strongly Disagree 1 2 3 4 5 6 Strongly Agree
15. Students who drop out don’t have clear goals for their future. *Required
Strongly Disagree 1 2 3 4 5 6 Strongly Agree
16. Students who believe that education is important have an increased likelihood of graduating.
*Required
Strongly Disagree 1 2 3 4 5 6 Strongly Agree
17. Students who drop out do not value education.*Required
Strongly Disagree 1 2 3 4 5 6 Strongly Agree
18. Students who consider dropping out do not value education.*Required
Strongly Disagree 1 2 3 4 5 6 Strongly Agree
19. Students who perceive themselves as capable of academic success have an increased
likelihood of graduating.*Required
Strongly Disagree 1 2 3 4 5 6 Strongly Agree
20. Having a sense of autonomy over their school work positively affects student
achievement.*Required
Strongly Disagree 1 2 3 4 5 6 Strongly Agree
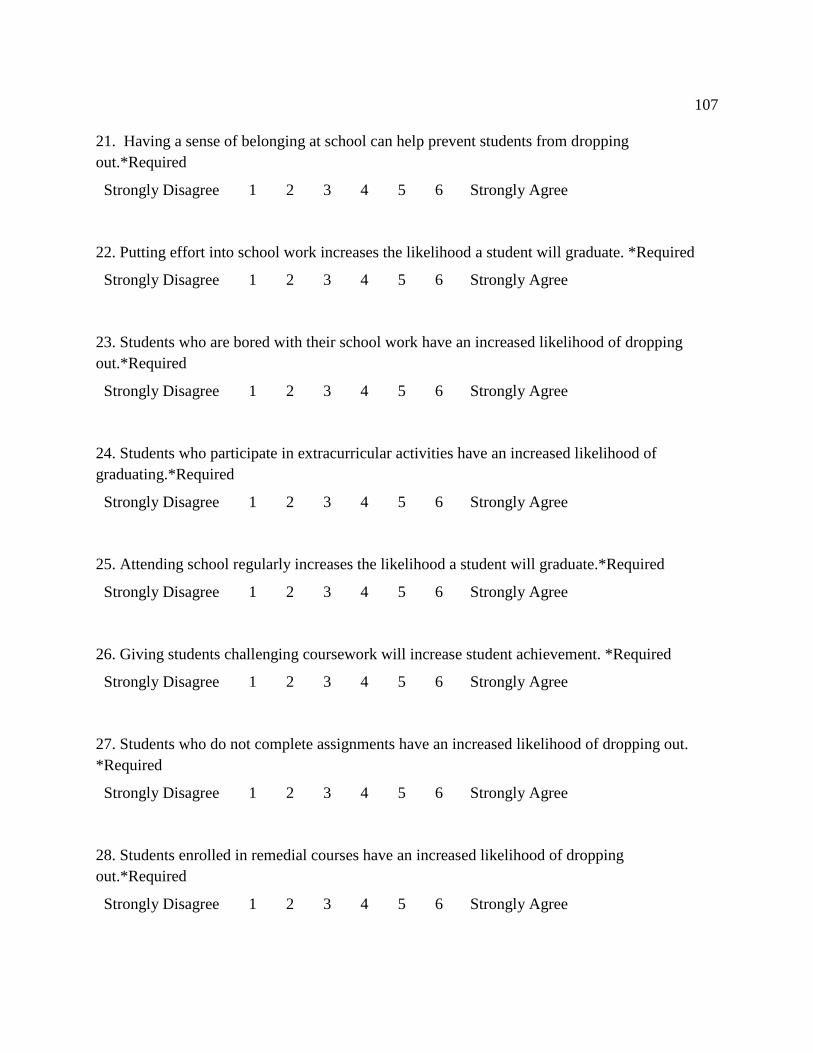
107
21. Having a sense of belonging at school can help prevent students from dropping
out.*Required
Strongly Disagree 1 2 3 4 5 6 Strongly Agree
22. Putting effort into school work increases the likelihood a student will graduate. *Required
Strongly Disagree 1 2 3 4 5 6 Strongly Agree
23. Students who are bored with their school work have an increased likelihood of dropping
out.*Required
Strongly Disagree 1 2 3 4 5 6 Strongly Agree
24. Students who participate in extracurricular activities have an increased likelihood of
graduating.*Required
Strongly Disagree 1 2 3 4 5 6 Strongly Agree
25. Attending school regularly increases the likelihood a student will graduate.*Required
Strongly Disagree 1 2 3 4 5 6 Strongly Agree
26. Giving students challenging coursework will increase student achievement. *Required
Strongly Disagree 1 2 3 4 5 6 Strongly Agree
27. Students who do not complete assignments have an increased likelihood of dropping out.
*Required
Strongly Disagree 1 2 3 4 5 6 Strongly Agree
28. Students enrolled in remedial courses have an increased likelihood of dropping
out.*Required
Strongly Disagree 1 2 3 4 5 6 Strongly Agree

108
29. Students who have trouble with the law have an increased likelihood of dropping out.
*Required
Strongly Disagree 1 2 3 4 5 6 Strongly Agree
30. Students who use drugs and alcohol have an increased chance of dropping out.*Required
Strongly Disagree 1 2 3 4 5 6 Strongly Agree
31. Students with children of their own have an increased chance of dropping out. *Required
Strongly Disagree 1 2 3 4 5 6 Strongly Agree
32. Students who disrupt class frequently are more likely to drop out.*Required
Strongly Disagree 1 2 3 4 5 6 Strongly Agree
33. The peers that a student spends time with affects their chances of graduating.
*Required
Strongly Disagree 1 2 3 4 5 6 Strongly Agree
34. A student whose friends have dropped out has an increased chance of dropping out.
*Required
Strongly Disagree 1 2 3 4 5 6 Strongly Agree
35. A student whose friends perform well academically has an increased chance of
graduating.*Required
Strongly Disagree 1 2 3 4 5 6 Strongly Agree
36. Having a job outside of school positively affects student achievement. *Required
Strongly Disagree 1 2 3 4 5 6 Strongly Agree

109
37. Working outside of school increases the likelihood that a student will drop out. *Required
Strongly Disagree 1 2 3 4 5 6 Strongly Agree
38. Students who work to help support their families have an increased likelihood of dropping
out.*Required
Strongly Disagree 1 2 3 4 5 6 Strongly Agree
The following section contains statements about the institutional settings in which students
live: family, school and community characteristics as they relate to student dropout. Please
answer based on the degree to which you agree or disagree with each statement.
1= strongly disagree 2=disagree 3=somewhat disagree 4=somewhat agree 5=agree
6=strongly agree.
39. Attending schools in which a high number of students live in poverty increases the
likelihood that a student will drop out.*Required
Strongly Disagree 1 2 3 4 5 6 Strongly Agree
40. Students who attend schools in which a high number of students are racial minorities have
an increased likelihood of dropping out.*Required
Strongly Disagree 1 2 3 4 5 6 Strongly Agree
41. Students who attend single gender schools (all male or all female) are less likely to drop out
than students who attend coed schools.*Required
Strongly Disagree 1 2 3 4 5 6 Strongly Agree
42. Schools with a large percentage of high quality teachers are likely to have lower dropout
rates.*Required
Strongly Disagree 1 2 3 4 5 6 Strongly Agree

110
43. Schools with poor facilities and few resources such as textbooks and computers are more
likely to have higher dropout rates than schools with high quality facilities and abundant
resources.*Required
Strongly Disagree 1 2 3 4 5 6 Strongly Agree
44. Schools with large class sizes due to a high student teacher ratio are likely to have a higher
dropout rate than schools with a low student teacher ratio and small class sizes.*Required
Strongly Disagree 1 2 3 4 5 6 Strongly Agree
45. It is important for teachers to try different instructional methods when working with students
at risk of dropping out. *Required
Strongly Disagree 1 2 3 4 5 6 Strongly Agree
46. Teachers who display persistence in teaching struggling students decrease the likelihood
that students will drop out. *Required
Strongly Disagree 1 2 3 4 5 6 Strongly Agree
47. It is important for teachers working with struggling students to give meaningful feedback on
assignments and opportunities for students to redo assignments.*Required
Strongly Disagree 1 2 3 4 5 6 Strongly Agree
48. Students living in a two parent household have an increased likelihood of
graduating.*Required
Strongly Disagree 1 2 3 4 5 6 Strongly Agree
49. Students living in an institutional setting (e.g. a group home) have an increased likelihood of
dropping out.*Required
Strongly Disagree 1 2 3 4 5 6 Strongly Agree
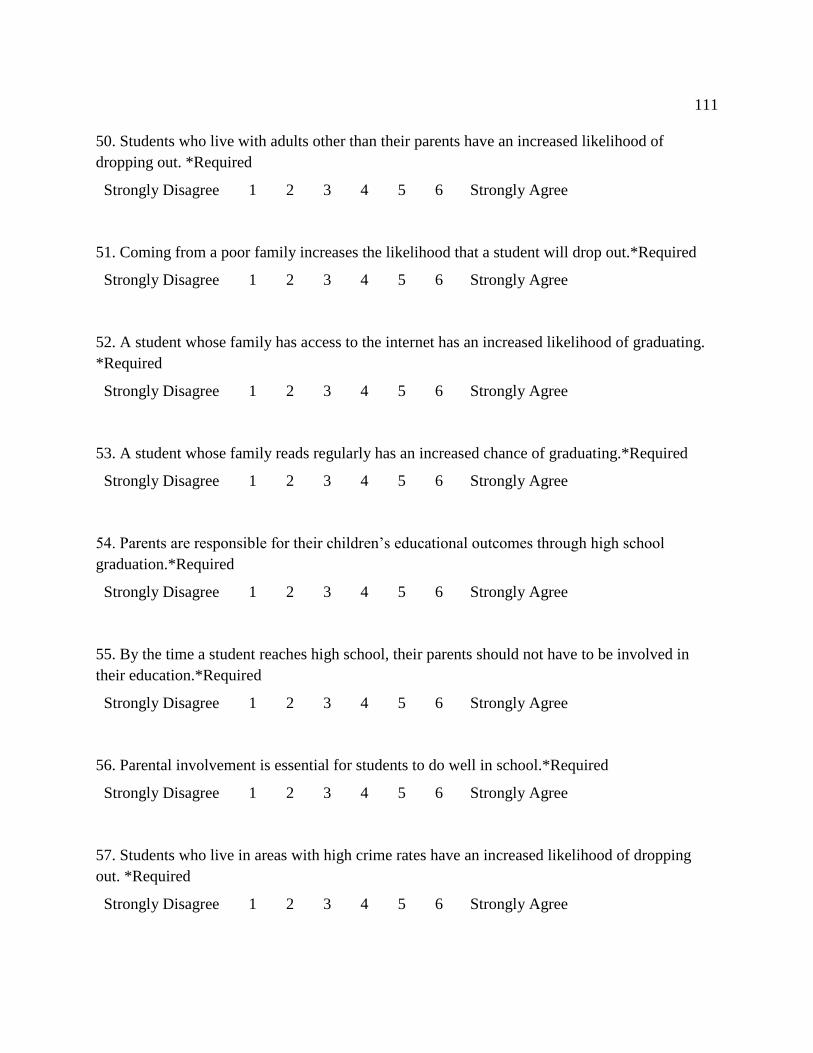
111
50. Students who live with adults other than their parents have an increased likelihood of
dropping out. *Required
Strongly Disagree 1 2 3 4 5 6 Strongly Agree
51. Coming from a poor family increases the likelihood that a student will drop out.*Required
Strongly Disagree 1 2 3 4 5 6 Strongly Agree
52. A student whose family has access to the internet has an increased likelihood of graduating.
*Required
Strongly Disagree 1 2 3 4 5 6 Strongly Agree
53. A student whose family reads regularly has an increased chance of graduating.*Required
Strongly Disagree 1 2 3 4 5 6 Strongly Agree
54. Parents are responsible for their children’s educational outcomes through high school
graduation.*Required
Strongly Disagree 1 2 3 4 5 6 Strongly Agree
55. By the time a student reaches high school, their parents should not have to be involved in
their education.*Required
Strongly Disagree 1 2 3 4 5 6 Strongly Agree
56. Parental involvement is essential for students to do well in school.*Required
Strongly Disagree 1 2 3 4 5 6 Strongly Agree
57. Students who live in areas with high crime rates have an increased likelihood of dropping
out. *Required
Strongly Disagree 1 2 3 4 5 6 Strongly Agree
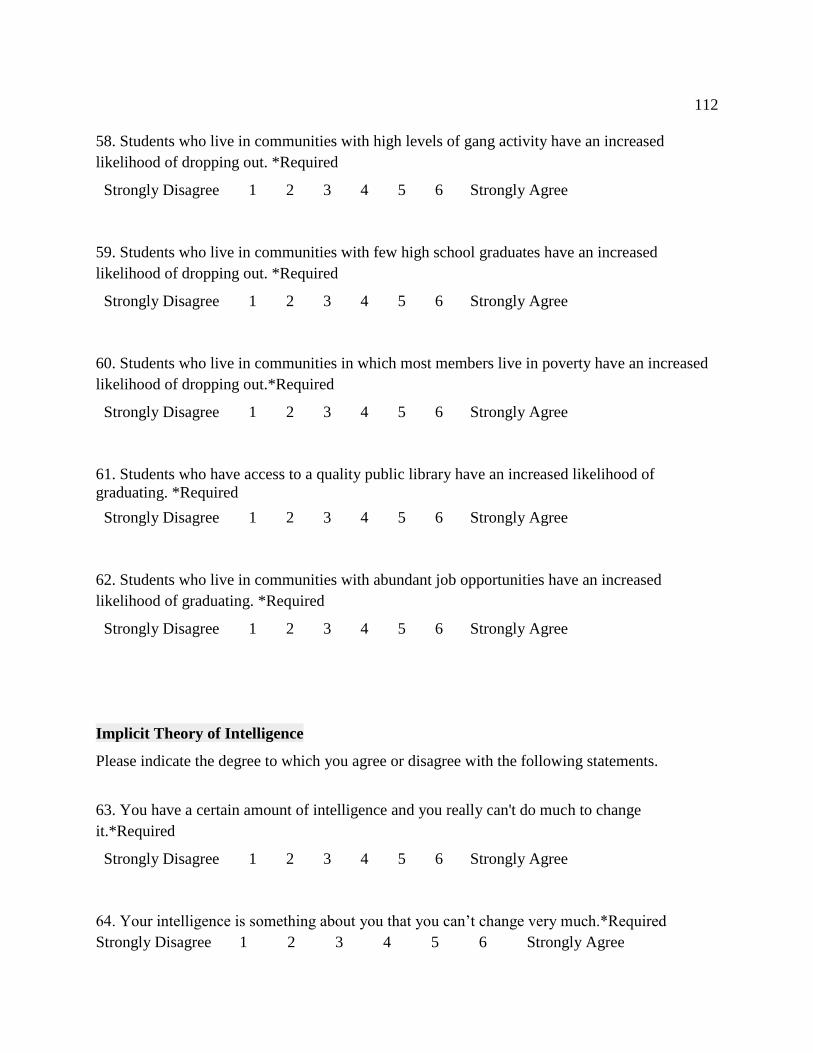
112
58. Students who live in communities with high levels of gang activity have an increased
likelihood of dropping out. *Required
Strongly Disagree 1 2 3 4 5 6 Strongly Agree
59. Students who live in communities with few high school graduates have an increased
likelihood of dropping out. *Required
Strongly Disagree 1 2 3 4 5 6 Strongly Agree
60. Students who live in communities in which most members live in poverty have an increased
likelihood of dropping out.*Required
Strongly Disagree 1 2 3 4 5 6 Strongly Agree
61. Students who have access to a quality public library have an increased likelihood of
graduating. *Required
Strongly Disagree 1 2 3 4 5 6 Strongly Agree
62. Students who live in communities with abundant job opportunities have an increased
likelihood of graduating. *Required
Strongly Disagree 1 2 3 4 5 6 Strongly Agree
Implicit Theory of Intelligence
Please indicate the degree to which you agree or disagree with the following statements.
63. You have a certain amount of intelligence and you really can't do much to change
it.*Required
Strongly Disagree 1 2 3 4 5 6 Strongly Agree
64. Your intelligence is something about you that you can’t change very much.*Required
Strongly Disagree 1 2 3 4 5 6 Strongly Agree

113
65. You can learn new things but you can’t really change your basic intelligence.*Required
Strongly Disagree 1 2 3 4 5 6 Strongly Agree
Teacher Sense of Self-Efficacy Scale
This questionnaire is designed to help us gain a better understanding of
the kinds of things that create difficulties for teachers in their school activities. Please indicate
your opinion about each of the statements below.
66. How much can you do to control disruptive behavior in the classroom? *Required
Nothing 1 2 3 4 5 6 7 8 9 A great deal
67. How much can you do to motivate students who show low interest in school work?
*Required
Nothing 1 2 3 4 5 6 7 8 9 A great deal
68. How much can you do to get students to believe they can do well in school?*Required
Nothing 1 2 3 4 5 6 7 8 9 A great deal
69. How much can you do to help your students value learning?*Required
Nothing 1 2 3 4 5 6 7 8 9 A great deal
70. To what extent can you craft good questions for your students?*Required
Nothing 1 2 3 4 5 6 7 8 9 A great deal
71. How much can you do to get children to follow classroom rules?*Required
Nothing 1 2 3 4 5 6 7 8 9 A great deal

114
72. How much can you do to calm a student who is disruptive or noisy?
*Required
Nothing 1 2 3 4 5 6 7 8 9 A great deal
73. How well can you establish a classroom management system with each group of
students?*Required
Nothing 1 2 3 4 5 6 7 8 9 A great deal
74. How much can you use a variety of assessment strategies?*Required
Nothing 1 2 3 4 5 6 7 8 9 A great deal
75. To what extent can you provide an alternative explanation or example when students are
confused?*Required
Nothing 1 2 3 4 5 6 7 8 9 A great deal
76. How much can you assist families in helping their children do well in school?
*Required
Nothing 1 2 3 4 5 6 7 8 9 A great deal
77. How well can you implement alternative strategies in your classroom?*Required
Nothing 1 2 3 4 5 6 7 8 9 A great deal

APPENDIX B
ITEM WORDING OF TSES SHORT FORM QUESTIONNAIRE BY SUBSCALE
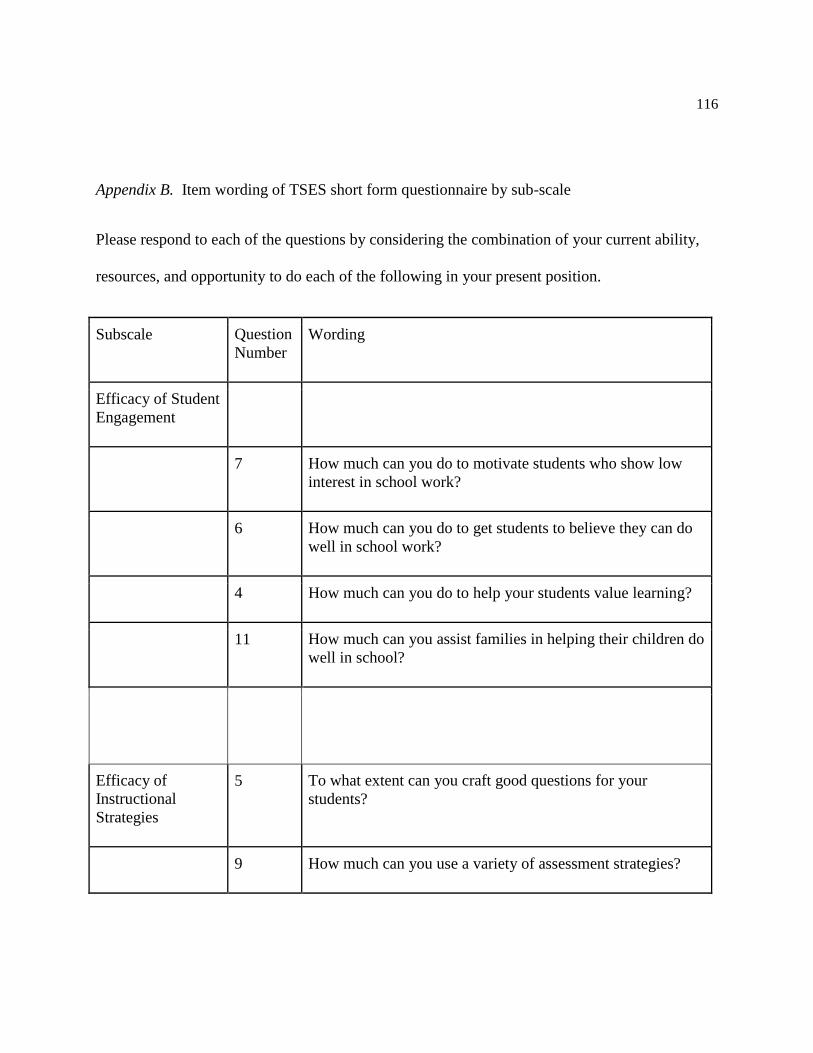
116
Appendix B. Item wording of TSES short form questionnaire by sub-scale
Please respond to each of the questions by considering the combination of your current ability,
resources, and opportunity to do each of the following in your present position.
Subscale Question
Number
Wording
Efficacy of Student
Engagement
7 How much can you do to motivate students who show low
interest in school work?
6 How much can you do to get students to believe they can do
well in school work?
4 How much can you do to help your students value learning?
11 How much can you assist families in helping their children do
well in school?
Efficacy of
Instructional
Strategies
5 To what extent can you craft good questions for your
students?
9 How much can you use a variety of assessment strategies?
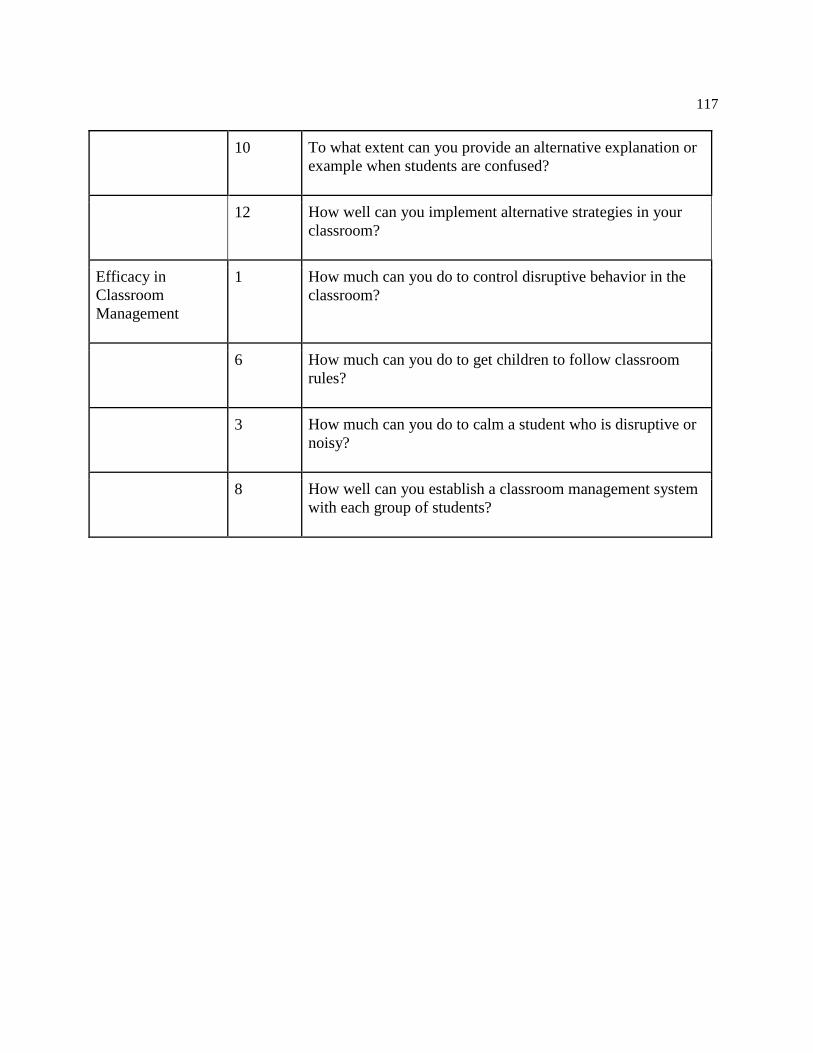
117
10 To what extent can you provide an alternative explanation or
example when students are confused?
12 How well can you implement alternative strategies in your
classroom?
Efficacy in
Classroom
Management
1 How much can you do to control disruptive behavior in the
classroom?
6 How much can you do to get children to follow classroom
rules?
3 How much can you do to calm a student who is disruptive or
noisy?
8 How well can you establish a classroom management system
with each group of students?

112112
APPENDIX C
TIS ITEM WORDING

119
Appendix C. TIS Item wording
1. You have a certain amount of intelligence and you can’t really do much to change it.
2. Your intelligence is something about you that you can’t change very much.
3. You can learn new things, but you can’t really change your basic intelligence.


![Social Influence on Paranormal Beliefs[1]](https://static.fdocuments.net/doc/165x107/577d2aaa1a28ab4e1ea9c316/social-influence-on-paranormal-beliefs1.jpg)