td2014p-000114
21
Improving Overhead Transmission Line Usage Efficiency on a Caribbean Island Power System S. Bahadoorsingh, L. Bhairosingh, S. Sharma, M. Ganness The University of the West Indies | Dept of Electrical and Computer Engineering IEEE PES T&D 2014 Chicago, Illinois 16 th April 2014 1
-
Upload
s-chandru-sadhasivam -
Category
Documents
-
view
13 -
download
1
description
ieee press
Transcript of td2014p-000114
Improving Overhead Transmission Line Usage Efficiency on a
Caribbean Island Power System
S. Bahadoorsingh, L. Bhairosingh, S. Sharma, M. Ganness The University of the West Indies | Dept of Electrical and Computer Engineering
IEEE PES T&D 2014
Chicago, Illinois
16th April 2014
1

Transmission Line Rating Factors
2
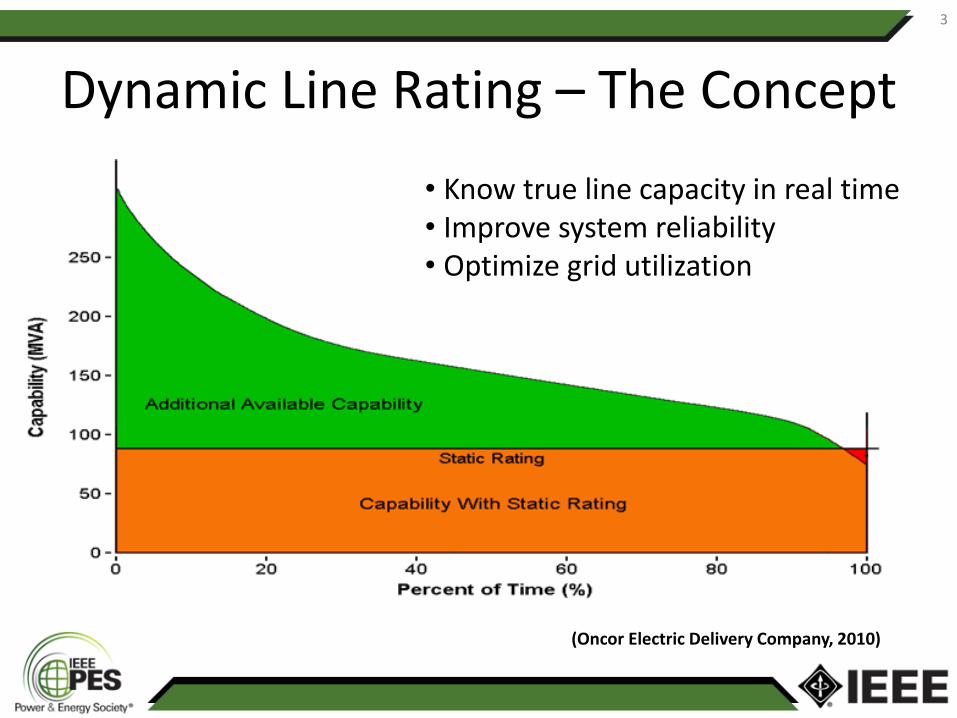
Dynamic Line Rating – The Concept
3
• Know true line capacity in real time • Improve system reliability • Optimize grid utilization
(Oncor Electric Delivery Company, 2010)

Standards
1. IEEE Standard for Calculating the Current-Temperature of Bare Overhead Conductors (IEEE 738-2006)
2. Cigré “Thermal Behaviour of Overhead Conductors”
4

Heat Balance Equation (IEEE 738)
2 ( )r c s cq q q I R T
Heat losses Heat gains
Radiated heat loss
Convected heat loss
Solar heat gain
Joule heating
( )
r c s
c
q q qI
R T
Ampacity
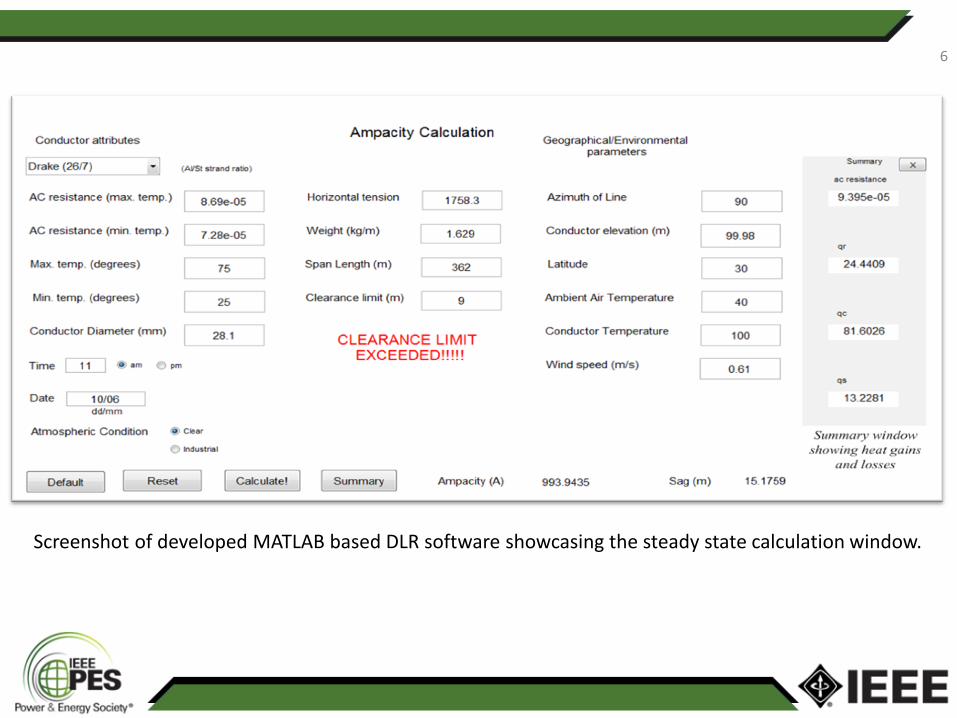
Screenshot of developed MATLAB based DLR software showcasing the steady state calculation window.
6

7

T&TEC Case study Chaguanas East- Chaguanas West Circuit
8
Conductor type: Wolf
Conductor diameter (mm)
AC resistance @ 25°C (Ωm-1)
AC resistance @ 75°C (Ωm-1)
18.1 0.000183 0.000223
Manufacturer Rating (temperate climate): 512 A

Hourly readings for wind speed based on ARMA model and ambient temperature and for July 18th 2012
9
Actual conductor loading for July 18th 2012 and calculated ampacity

Results:
o Highest ampacity calculated was 107% greater than manufacturer’s
rating and 197% higher than actual conductor loading
o Lowest ampacity calculated was 42% higher than manufacturer’s rating
and 103% higher than actual conductor rating
10

Constraints/ Limitations • Lack of real time updating of climatic data
• More loading data needed for lines with climatic data available
Further Work • Effects of DLR on:
o system voltages and losses
o unit commitment
o contingency planning
o protection circuitry
• Cost analysis
11

Conclusion • Electricity transmission traditionally limited by line’s thermal limit
• Static ratings challenged as being overly conservative due to load growth
• DLR provides improved asset management
• T&TEC case study:
o Highest ampacity calculated was 107% greater than manufacturer’s
rating and 197% higher than actual conductor loading
o Lowest ampacity calculated was 42% higher than manufacturer’s rating
and 103% higher than actual conductor rating
• DLR provides progression to a smarter grid
12
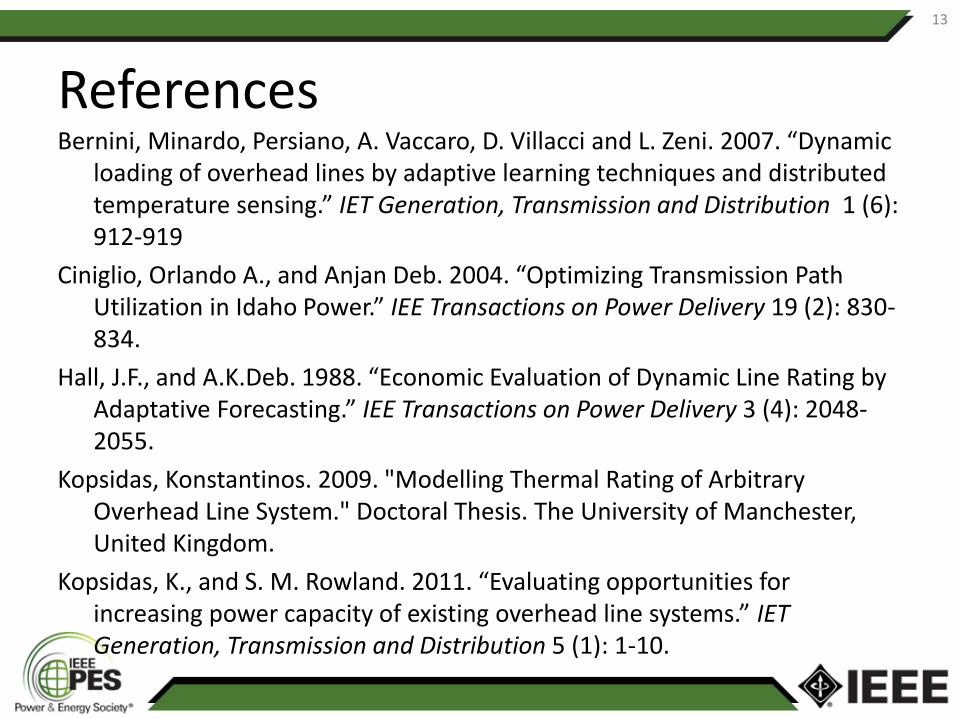
References Bernini, Minardo, Persiano, A. Vaccaro, D. Villacci and L. Zeni. 2007. “Dynamic
loading of overhead lines by adaptive learning techniques and distributed temperature sensing.” IET Generation, Transmission and Distribution 1 (6): 912-919
Ciniglio, Orlando A., and Anjan Deb. 2004. “Optimizing Transmission Path Utilization in Idaho Power.” IEE Transactions on Power Delivery 19 (2): 830-834.
Hall, J.F., and A.K.Deb. 1988. “Economic Evaluation of Dynamic Line Rating by Adaptative Forecasting.” IEE Transactions on Power Delivery 3 (4): 2048-2055.
Kopsidas, Konstantinos. 2009. "Modelling Thermal Rating of Arbitrary Overhead Line System." Doctoral Thesis. The University of Manchester, United Kingdom.
Kopsidas, K., and S. M. Rowland. 2011. “Evaluating opportunities for increasing power capacity of existing overhead line systems.” IET Generation, Transmission and Distribution 5 (1): 1-10.
13

Appendix
14
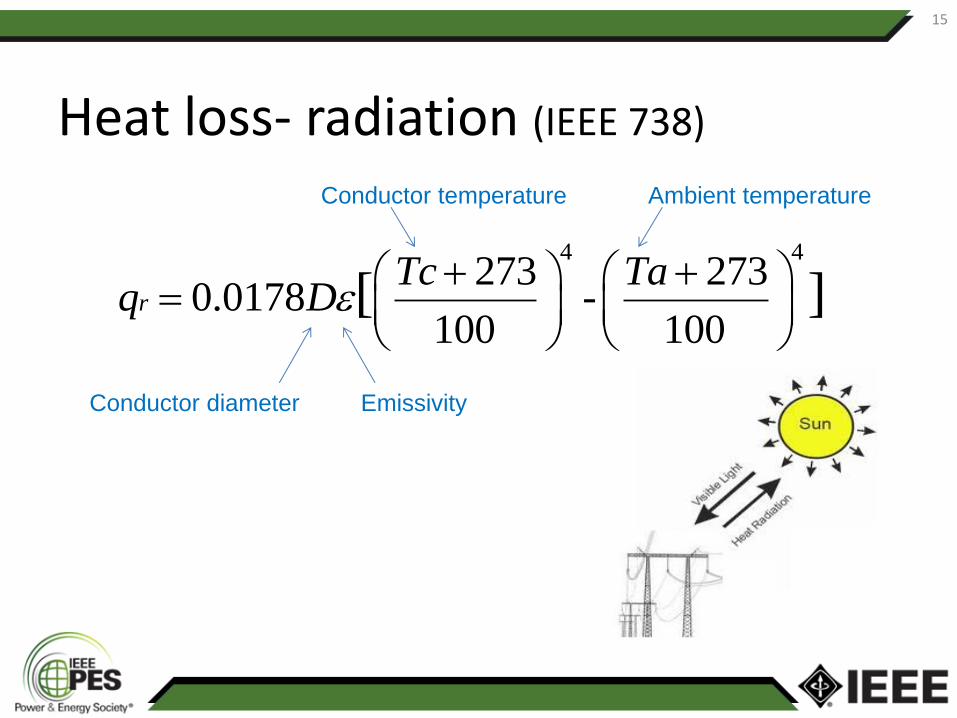
Heat loss- radiation (IEEE 738)
15
4 4273 273
0.0178 -100 100
[ ]rTc Ta
q D
Conductor temperature Ambient temperature
Conductor diameter Emissivity
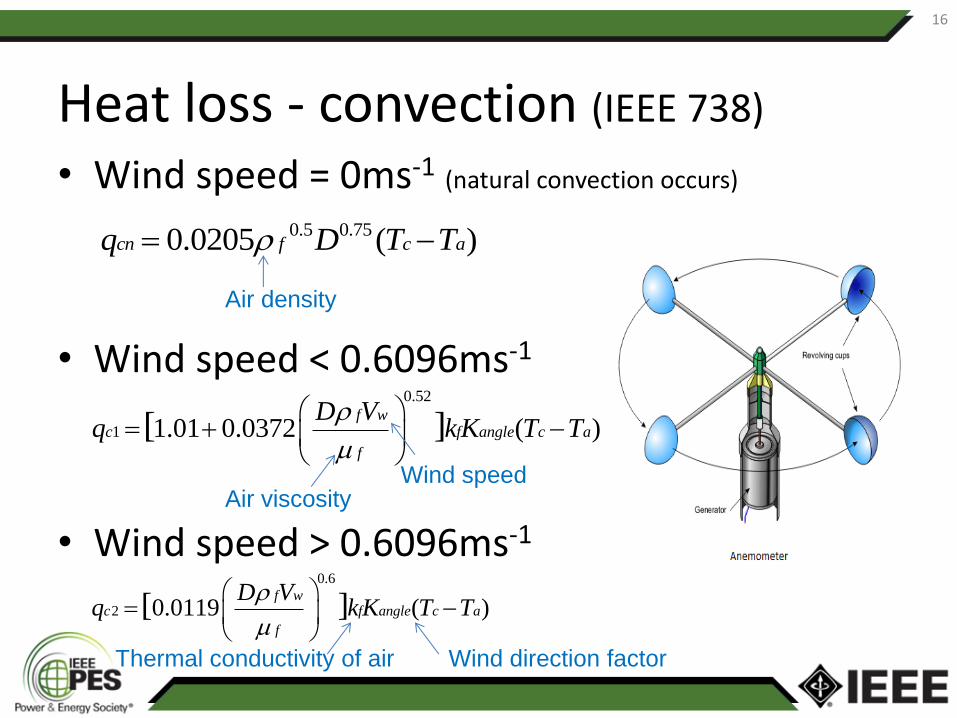
Heat loss - convection (IEEE 738)
• Wind speed = 0ms-1 (natural convection occurs)
• Wind speed < 0.6096ms-1
• Wind speed > 0.6096ms-1
16
0.52
1 1.01 0.0372 ( )[ ]f w
c f angle c a
f
D Vq k K T T
0.6
2 0.0119 ( )[ ]f w
c f angle c a
f
D Vq k K T T
0.5 0.750.0205 ( )cn f c aq D T T
Air density
Wind speed Air viscosity
Thermal conductivity of air Wind direction factor

Heat Gain (IEEE 738)
• Solar heating
17
'sin( )s seq Q A
Absorption coefficient
Total solar and sky radiated heat flux rate
Angle of incidence of sun's rays
Conductor area per unit length
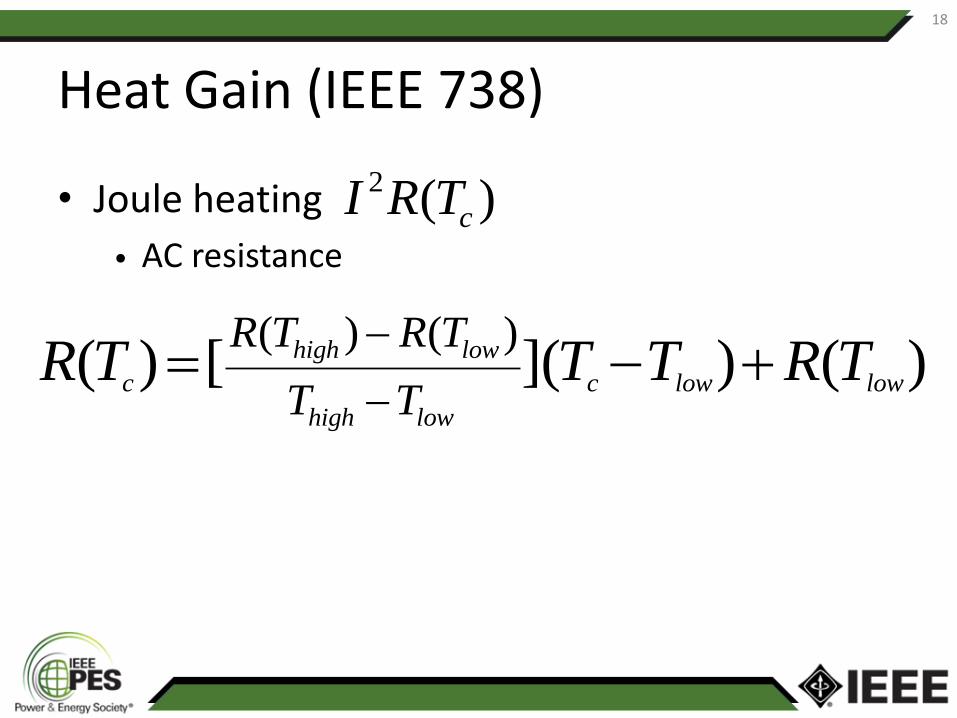
Heat Gain (IEEE 738)
• Joule heating
• AC resistance
18
2 ( )cI R T
( ) ( )( ) [ ]( ) ( )high low
c c low low
high low
R T R T
T TR T T T R T

Non-steady state (IEEE 738)
Fault: Less than 5 minutes
19
2cp
dTmC I R
dt
Total conductor heat capacity
Change in conductor temperature
No heat exchange between the conductor and its environment. Ambient temperature has no effect on the conductor’s temperature. If line were operating below maximum allowable temperature before fault, the heat storage capacity of the conductor allows it to tolerate a higher amount of current for the duration of the fault.

Non-steady state (IEEE 738) Non-steady state: Between 5-30 minutes
20
2 ( )cc r p c s
dTq q mC I R T q
dt
Immediately prior to step change (t=0-)
• Conductor is in thermal equilibrium
• Heat gains = heat losses
Immediately following step change (t=0+)
• Conductor resistance, temperature, heat losses (qr, qc)remain unchanged
• Rate of generation of ohmic losses increase
• Conductor temperature begins to increase

21
(IEEE 738, 2006)