TCRP Synthesis 10 - Transportation Research Board
63
T R A N S I T C O O P E R A T I V E R E S E A R C H P R O G R A M SPONSORED BY The Federal Transit Administration Bus Route Evaluation Standards A Synthesis of Transit Practice Transportation Research Board National Research Council TCRP Synthesis 10
Transcript of TCRP Synthesis 10 - Transportation Research Board
T R A N S I T C O O P E R A T I V E R E S E A R C H P R O G R A M
SPONSORED BY
The Federal Transit Administration
Bus Route Evaluation Standards
A Synthesis of Transit Practice
Transportation Research BoardNational Research Council
TCRP Synthesis 10
TCRP OVERSIGHT AND PROJECTSELECTION COMMITTEE
CHAIRMANWILLIAM W. MILLARPort Authority of Allegheny County
MEMBERSSHARON D. BANKSAC TransitLEE BARNESBarwood, IncGERALD L. BLAIRIndiana County Transit AuthoirtyMICHAEL BOLTONCapital MetroSHIRLEY A. DELIBERONew Jersey Transit CorporationROD DIRIDONSanta Clara County Transit DistrictSANDRA DRAGGOOCATALOUIS J. GAMBACCINISEPTADELON HAMPTONDelon Hampton & AssociatesRICHARD R. KELLYPort Authority Trans-Hudson CorpALAN F. KIEPPERNew York City Transit AuthorityEDWARD N. KRAVITZThe Flxible CorporationROBERT G. LINGWOODBC TransitMIKE MOBEYIsabella County Transportation CommDON S. MONROEPierce TransitPATRICIA S. NETTLESHIPThe Nettleship Group, IncROBERT E. PAASWELLThe City College of New YorkJAMES P. REICHERTReichert Management ServicesLAWRENCE G. REUTERWMATAVICKIE SHAFFERThe Tri-State Transit AuthorityB. R. STOKESATE Management & Service CoMICHAEL S. TOWNESPeninsula Transportation Dist CommFRANK J. WILSONNew Jersey DOT
EX OFFICIO MEMBERSGORDON J. LINTONFTAJACK R. GILSTRAPAPTARODNEY E. SLATERFHWAFRANCIS B. FRANCOISAASHTOROBERT E. SKINNER, JRTRB
TDC EXECUTIVE DIRECTORFRANK J. CIHAKAPTA
SECRETARYROBERT J. REILLYTRB
TRANSPORTATION RESEARCH BOARD EXECUTIVE COMMITTEE 1995
OFFICERS
Chair: LILLIAN C. LIBURDI, Director, Port Department, The Port Authority of New York and New JerseyVice Chair: JAMES W. VAN LOBEN SELS, Director, California Department of TransportationExecutive Director: ROBERT E. SKINNER, JR., Transportation Research Board, National Research Council
MEMBERS
EDWARD H. ARNOLD, Chairman & President, Arnold Industries, IncSHARON D. BANKS, General Manager, Alameda-Contra Costa Transit District, Oakland, CaliforniaBRIAN J. L. BERRY, Lloyd Viel Berkner Regental Professor & Chair, Bruton Center for Development Studies,University of Texas at DallasDWIGHT M. BOWER, Director, Idaho Transportation DepartmentJOHN E. BREEN, The Nasser I Al-Rashid Chair in Civil Engineering, The University of Texas at AustinWILLIAM F. BUNDY, Director, Rhode Island Department of TransportationDAVID BURWELL, President, Rails-to-Trails ConservancyA. RAY CHAMBERLAIN, Vice President, Freight Policy, American Trucking Associations, Inc(Past Chair, 1993)RAY W. CLOUGH, Nishkian Professor of Structural Engineering, Emeritus, University of California, BerkeleyJAMES C. DELONG, Director of Aviation, Denver International AirportJAMES N. DENN, Commissioner, Minnesota Department of TransportationDENNIS J. FITZGERALD, Executive Director, Capital District Transportation AuthorityJAMES A. HAGEN, Chairman & CEO, CONRAILDELON HAMPTON, Chairman & CEO, Delon Hampton & AssociatesLESTER A. HOEL, Hamilton Professor, University of Virginia, Department of Civil EngineeringDON C. KELLY, Secretary and Commissioner of Highways, Transportation Cabinet, KentuckyROBERT KOCHANOWSKI, Executive Director, Southwestern Pennsylvania Regional Planning CommissionJAMES L. LAMMIE, President & CEO, Parsons Brinckerhoff, IncCHARLES P. O'LEARY, JR, Commissioner, New Hampshire Department of TransportationJUDE W. P. PATIN, Secretary, Louisiana Department of Transportation and DevelopmentCRAIG E. PHILIP, President, Ingram Barge CompanyDARREL RENSINK, Director, Iowa Department of TransportationJOSEPH M. SUSSMAN, JR East Professor and Professor of Civil and Environmental Engineering,Massachusetts Institute of Technology MARTIN WACHS, Director, Institute of Transportation Studies, Department of Urban Planning, University ofCalifornia, Los AngelesDAVID N. WORMLEY, Dean of Engineering, Pennsylvania State UniversityHOWARD YERUSALIM, Vice President, KCI Technologics, Inc
EX OFFICIO MEMBERS
MIKE ACOTT, President, National Asphalt Pavement Association (ex officio)ROY A. ALLEN, Vice President, Research and Test Department, Association of American Railroads (exofficio)ANDREW H. CARD, JR, President & CEO, American Automobile Manufacturers Association (ex officio)THOMAS J. DONOHUE, President and CEO, American Trucking Associations, Inc (ex officio)FRANCIS B. FRANCOIS, Executive Director, American Association of State Highway and TransportationOfficials (ex officio)JACK R. GILSTRAP, Executive Vice President, American Public Transit Association (ex officio)ALBERT J. HERBERGER, Maritime Administrator, U.S.Department of Transportation (ex officio)DAVID R. HINSON, Federal Aviation Administrator, U.S.Department of Transportation (ex officio)GORDON J. LINTON, Federal Transit Administrator, U.S.Department of Transportation (ex officio)RICARDO MARTINEZ, Administrator, National Highway Traffic Safety Administration (ex officio)JOLENE M. MOLITORIS, Federal Railroad Administrator, U.S.Department of Transportation (ex officio)DAVE SHARMA, Administrator, Research & Special Programs Administration, U.S.Department ofTransportation (ex officio)RODNEY E. SLATER, Federal Highway Administrator, U.S.Department of Transportation (ex officio)ARTHUR E. WILLIAMS, Chief of Engineers and Commander, U.S.Army Corps of Engineers (ex officio)
TRANSIT COOPERATIVE RESEARCH PROGRAM
Transportation Research Board Executive Committee Subcommittee for TCRPLESTER A. HOEL, University of VirginiaLILLIAN C. LIBURDI, Port Authority of New York and New Jersey (Chair)GORDON J. LINTON, U.S.Department of TransportationWILLIAM W. MILLAR, Port Authority of Allegheny CountyROBERT E. SKINNER, JR., Transportation Research BoardJOSEPH M. SUSSMAN, Massachusetts Institute of TechnologyJAMES W. VAN LOBEN SELS, California Department of Transportation
T R A N S I T C O O P E R A T I V E R E S E A R C H P R O G R A M
Synthesis of Transit Practice 10
Bus Route Evaluation Standards
HOWARD P. BENNBarton-Aschman Associates, Inc.
TOPIC PANEL
BERT ARRILLAGA, Federal Transit AdministrationMARY KAY CHRISTOPHER, Chicago Transit Authority
DAVID R. FIALKOFF, Metro-Dade Transit AgencySTEPHEN T. PARRY, Los Angeles County Metropolitan Transportation Authority
MILLARD L. SEAY, Washington Metropolitan Area Transit AuthorityPETER L. SHAW, Transportation Research Board
STEVEN SILKUNAS, Southeastern Pennsylvania Transportation Authority
TRANSPORTATION RESEARCH BOARDNATIONAL RESEARCH COUNCIL
Research Sponsored by the Federal Transit Administration inCooperation with the Transit Development Corporation
NATIONAL ACADEMY PRESSWashington, D.C. 1995
TRANSIT COOPERATIVE RESEARCH PROGRAM
The nation's growth and the need to meet mobility,environmental, and energy objectives place demands on publictransit systems Current systems, some of which are old and in needof upgrading, must expand service area, increase service frequency,and improve efficiency to serve these demands. Research isnecessary to solve operating problems, to adapt appropriate newtechnologies from other industries, and to introduce innovations intothe transit industry. The Transit Cooperative Research Program(TCRP) serves as one of the principal means by which the transitindustry can develop innovative near-term solutions to meet demandsplaced on it.
The need for TCRP was originally identified in TRB SpecialReport 213--Research for Public Transit: New Directions, publishedin 1987 and based on a study sponsored by the Federal TransitAdministration (FTA). A report by the American Public TransitAssociation (APTA), Transportation 2000, also recognized the needfor local, problem-solving research TCRP, modeled after thelongstanding and successful National Cooperative Highway ResearchProgram, undertakes research and other technical activities inresponse to the needs of transit service providers The scope of viceconfiguration, equipment, facilities, operations, human resources,maintenance, policy, and administrative practices
TCRP was established under FTA sponsorship in July 1992.Proposed by the U S Department of Transportation, TCRP wasauthorized as part of the Intermodal Surface TransportationEfficiency Act of 1991 (ISTEA) On May 13, 1992, a memorandumagreement outlining TCRP operating procedures was executed by thethree cooperating organizations: FTA, the National Academy ofSciences, acting through the Transportation Research Board (TRB),and the Transit Development Corporation, Inc. (TDC), a nonprofiteducational and research organization established by APTA TDC isresponsible for forming the independent governing board, designatedas the TCRP Oversight and Project Selection (TOPS) Committee
Research problem statements for TCRP are solicitedperiodically but may be submitted to TRB by anyone at anytime It isthe responsibility of the TOPS Committee to formulate the researchprogram by identifying the highest priority projects. As part of theevaluation, the TOPS Committee defines funding levels and expectedproducts
Once selected, each project is assigned to an expert panel,appointed by the Transportation Research Board. The panels prepareproject statements (requests for proposals), select contractors, andprovide technical guidance and counsel throughout the life of theproject The process for developing research problem statements andselecting research agencies has been used by TRB in managingcooperative research programs since 1962. As in other TRBactivities, TCRP project panels serve voluntarily withoutcompensation
Because research cannot have the desired impact if productsfail to reach the intended audience, special emphasis is placed ondisseminating TCRP results to the intended end-users of the research:transit agencies, service providers, and suppliers. TRB provides aseries of research reports, syntheses of transit practice, and othersupporting material developed by TCRP research. APTA willarrange for workshops, training aids, field visits, and other activitiesto ensure that results are implemented by urban and rural transitindustry practitioners
The TCRP provides a forum where transit agencies cancooperatively address common operational problems TCRP resultssupport and complement other ongoing transit research and trainingprograms.
TCRP SYNTHESIS 10
Project SA-1ISSN 1073-4880ISBN 0-309-058554Library of Congress Catalog Card No 95-60883
Price $12.00
NOTICE
The project that is the subject of this report was a part of the TransitCooperative Research Program conducted by the TransportationResearch Board with the approval of the Governing Board of theNational Research Council Such approval reflects the GoverningBoard's judgment that the project concerned is appropriate withrespect to both the purposes and resources of the National ResearchCouncil
The members of the technical advisory panel selected tomonitor this project and to review this report were chosen forrecognized scholarly competence and with due consideration for thebalance of disciplines appropriate to the project. The opinions andconclusions expressed or implied are those of the research agencythat performed the research, and while they have been accepted asappropriate by the technical panel, they are not necessarily those ofthe Transportation Research Board, the Transit DevelopmentCorporation, the National Research Council, or the Federal TransitAdministration of the U S. Department of Transportation.
Each report is reviewed and accepted for publication by thetechnical panel according to procedures established and monitored bythe Transportation Research Board Executive Committee and theGoverning Board of the National Research Council
Special Notice
The Transportation Research Board, the Transit DevelopmentCorporation, the National Research Council, and the Federal TransitAdministration (sponsor of the Transit Cooperative ResearchProgram) do not endorse products or manufacturers Trade ormanufacturers' names appear herein solely because they areconsidered essential to the clarity and completeness of the projectreport.
Published reports of the
TRANSIT COOPERATIVE RESEARCH PROGRAM
are available from:
Transportation Research BoardNational Research Council2101 Constitution Avenue, N W Washington, D C 20418
Printed in the United States of America
PREFACE A vast storehouse of information exists on many subjects of concern to the transit industry. Thisinformation has resulted from research and from the successful application of solutions to problems byindividuals or organizations. There is a continuing need to provide a systematic means for compiling thisinformation and making it available to the entire transit community in a usable format. The TransitCooperative Research Program includes a synthesis series designed to search for and synthesize usefulknowledge from all available sources and to prepare documented reports on current practices in subjectareas of concern to the transit industry.
This synthesis series reports on various practices, making specific recommendations whereappropriate but without the detailed directions usually found in handbooks or design manuals.Nonetheless, these documents can serve similar purposes, for each is a compendium of the bestknowledge available on those measures found to be successful in resolving specific problems. The extentto which these reports are useful will be tempered by the user's knowledge and experience in theparticular problem area.
FOREWORDBy Staff
TransportationResearch Board
This synthesis will be of interest to transit agency general managers, as well as operations,scheduling, maintenance, and planning personnel. Information on bus route evaluation standards andcriteria used by transit agencies in the United States and Canada is summarized. The synthesis providesupdated information to the 1984 United States Department of Transportation (U.S. DOT) report entitledBus Service Evaluation Methods: A Review, however, the results are not directly comparable as therespondents, questions asked, and analytical procedures differ in the 1994 synthesis. It does report whatagencies do in the area of bus route, not system, evaluation standards, and how they undertake theseefforts.
Administrators, practitioners, and researchers are continually faced with issues or problems onwhich there is much information, either in the form of reports or in terms of undocumented experienceand practice. Unfortunately, this information often is scattered or not readily available in the literature,and, as a consequence, in seeking solutions, full information on what has been learned about an issue orproblem is not assembled. Costly research findings may go unused, valuable experience may beoverlooked, and full consideration may not be given to the available methods of solving or alleviating theissue or problem. In an effort to correct this situation, the Transit Cooperative Research Program (TCRP)Synthesis Project, carried out by the Transportation Research Board as the research agency, has theobjective of reporting on common transit issues and problems and synthesizing available information.The synthesis reports from this endeavor constitute a TCRP publication series in which various forms ofrelevant information are assembled into single, concise documents pertaining to a specific or closelyrelated issue or problem.
This report of the Transportation Research Board provides transit agency staff with a compilation ofcurrent activity, and data to identify some new standards that have come into play in recent years withregard to route design, schedule design, economics and
productivity, service delivery, and passenger comfort and safety. The status of servicestandards today and changes since 1984, as well as the organization and effectiveness of busservice evaluation activities are presented.
To develop this synthesis in a comprehensive manner and to ensure inclusion ofsignificant knowledge, available information was assembled from numerous sources,including a number of public transportation agencies. A topic panel of experts in the subjectarea was established to guide the researchers in organizing and evaluating the collected data,and to review the final synthesis report.
This synthesis is an immediately useful document that records practices that wereacceptable within the limitations of the knowledge available at the time of its preparation. Asthe processes of advancement continue, new knowledge can be expected to be added to thatnow at hand.
CONTENTS
1 SUMMARY
3 CHAPTER ONE INTRODUCTIONStudy Background, 3
5 CHAPTER TWO SYNTHESIS OVERVIEWMethodology, 5Project Objectives and Industry Review, 6The Classifications of Various Evaluation Standards, 6
9 CHAPTER THREE RESPONDENTS' USE OF SERVICE STANDARDS ANDPERFORMANCE CRITERIA
Route Design Standards, 9Schedule Design Standards, 13Economic and Productivity Standards, 17Service Delivery Standards, 19Passenger Comfort and Safety Standards, 22
23 CHAPTER FOUR THE ADMINISTRATION OF BUS SERVICEEVALUATION ACTIVITIES
The Status of Service Standards and Changes in StatusSince 1984, 23
The Organization of Bus Service Evaluation Activities, 23The Effectiveness of Bus Service Evaluation Actitivies, 24
25 CHAPTER FIVE CONCLUSIONS AND RECOMMENDATIONS FORFUTURE RESEARCH
Emerging Trends, 25
27 REFERENCES
27 BIBLIOGRAPHY
28 APPENDIX A 1984 SURVEY INSTRUMENT
29 APPENDIX B 1994 SURVEY INSTRUMENT
35 APPENDIX C FREQUENCY RESPONSE TO EACH QUESTION
41 APPENDIX D THE STATUS OF STANDARDS AT RESPONDING AGENCIES
44 APPENDIX E CROSS-TABULATIONS, BY SYSTEM SIZE, OF VARIOUSASPECTS OF THE TRAFFIC CHECKING AND CLERKINGFUNCTIONS
46 APPENDIX F CROSS-TABULATION OF VARIOUS OPERATING DATACOLLECTION PRACTICES BY SYSTEM SIZE
49 APPENDIX G DOCUMENTS PROVIDED BY AGENCIES PARTICIPATINGIN THIS SYNTHESIS
51 APPENDIX H GLOSSARY OF TERMS
TCRP COMMITTEE FOR PROJECT J-7
CHAIRJACK REILLYCapital District Transit Authority
MEMBERSGERALD BLAIRIndiana County Transit AuthorityKENNETH J. DUEKERCenter for Urban StudiesALAN J. GIBBSNational Transit InstituteAMIR N. HANNATransportation Research BoardHENRY HIDECole Sherman & Associates, Ltd.MAXINE MARSHALLATE/Ryder ManagementFRANK T. MARTINMetro-Dade Transit AgencyPATRICIA V. McLAUGHLINLos Angeles County Metropolitan Transportation AuthorityBEVERLY G. WARDCenter for Urban Transportation Research
TRB LIAISONROBERT SPICHERTransportation Research Board
COOPERATIVE RESEARCH PROGRAMS STAFFROBERT J. REILLY, Director Cooperative Research ProgramSTEPHEN J. ANDRLE, Manager, TCRPGWEN CHISHOLM SMITH, Project Manager, TCRP
TCRP SYNTHESIS STAFFSTEPHEN R. GODWIN, Director for Studies and InformationServicesSALLY D. LIFF, Manager, Synthesis StudiesDONNA L. VLASAK, Senior Program OfficerLINDA S. MASON, EditorREBECCA B. HEATON, Assistant Editor
ACKNOWLEDGMENTS
Howard P. Benn, Chief Transit Operations/Planning Officer, BartonAschman Associates, Inc., was responsible for collection of the dataand preparation of the report.
Valuable assistance in the preparation of this synthesis wasprovided by the Topic Panel, consisting of Bert Arrillaga, Director,Service Assistance Unit, Federal Transit Administration; Mary KayChristopher, General Manager, Market Research, Chicago TransitAuthority; David R. Fialkoff, Chief, Service Planning andScheduling, Metro-Dade Transit Agency; Stephen T. Parry, Directorof Scheduling and Operations Planning, Los Angeles CountyMetropolitan Transportation Authority; Millard "Butch" L. Seay,Director, Office of Planning, Washington Metropolitan Area TransitAuthority; Peter L. Shaw, Public Transportation Specialist,Transportation Research Board; and
Steven Silkunas, Director, Technical Services and Research,Southeastern Pennsylvania Transportation Authority.
The Principal Investigators responsible for the conduct of thesynthesis were Sally D. Liff, Manager, Synthesis Studies, and DonnaL. Vlasak, Senior Program Officer. This synthesis was edited byLinda S. Mason, assisted by Rebecca B. Heaton.
Valuable assistance to the Topic Panel and the synthesis staffwas provided by Christopher W. Jenks and Gwen Chisholm Smith,Senior Program Officers, Transit Cooperative Research Program,Transportation Research Board.
Information on current practice was provided by many transitagencies. Their cooperation and assistance were most helpful.
BUS ROUTE EVALUATIONSTANDARDS
SUMMARY Bus route evaluation standards are composed of criteria that measure the quality and quantity of serviceoffered by a public transit system's bus routes, either individually or grouped together. This synthesiscompiles current activity and assesses the state of the art of evaluating individual bus routes.
In 1984, the U.S. Department of Transportation (USDOT) published Bus Service Evaluation Methods: AReview (1). This synthesis revists the topic and provides supplemental material for use by the transit industryin the area of route level service delivery.
The need for bus route evaluation standards is universal. Even in the most organized and well-run busoperations, services and routes exist that are seriously out of conformance with the rest of the system. Whilethere are sound public policy reasons to maintain selected services in such environments, they often prove tobe a drain on system assets. Having standards for bus route evaluation provides an objective basis for therequisite decisions for sustained operation.
A survey of transit agencies in North America indicates that as many as 44 different evaluation criteriaare currently used in the transit industry. These criteria cover activities related to bus route design andoperation, ranging from location of bus stops to the hours of service. Based on results from the synthesissurvey, more transit agencies are formally using standards in the evaluation of bus routes, particularly largersystems with over 500 buses. However, many agencies use standards or guidelines of some type that are notformally adopted to guide service delivery.
While the general direction of bus route evaluation standards has not changed since the 1984 study, thedevelopment of standards has evolved gradually, and will probably continue to evolve, especially as routelevel data become more readily available. It is also expected that with new technology and more sophisticatedreporting capabilities, these data will be collected more cost effectively and will be employed more often.Although the development of bus route evaluation standards has evolved through modest changes since 1984,there have been new trends emerging in how transit systems validate the use of particular standards and theircriteria within their agencies. Historically, transit systems confined their reviews to peer analysis, i.e.,comparisons with other transit systems of similar size. A growing number of transit agencies now reportcomparisons with other

2
transit operations of various sizes in their region, as well as other customer service industries in whichminimizing waiting time is a goal. The Americans with Disabilities Act (ADA) and the Clean Air ActAmendments of 1990 (CAAA) have also had an impact on the application of route level standards, but in adifferent manner.
3
CHAPTER ONE
INTRODUCTION
To varying degrees, transit agency service standards have beenin place since the first horse-car line was operated. Decisions had tobe made as to where the line would go, how frequently it would run,and what hours it would run. But such decisions were not madewithout some basis, and considerable private capital was involved.As transit services developed into ongoing businesses, the need tomaximize profitability required a system of standards that permittedthe assessment of an operator's individual lines.
Even today, with virtually every transit system under publicownership, the need continues for a system of standards. In the mostorganized and well-run agencies, services and routes exist that areseriously out of conformance with the rest of the system. While thereare sound public policy reasons to maintain selected services in suchenvironments, they often prove to be a drain on system assetsrequiring inordinate amounts of attention, finances, and scarceresources. Establishing standards for bus route evaluation providesan objective basis for making the requisite decisions for sustainedoperation.
Bus route evaluation standards comprise several criteria thatmeasure the quality and quantity of service offered by a public transitsystem's bus routes. The standards include a number of items thatdetermine, as well as reflect, the manner in which transit systemsoffer service to the public, and are often directly related to the costsof service provision.
For this synthesis, industry practice in late 1993 to early 1994was examined largely by means of a multiple choice questionnairesent to transit operators throughout North America. A previous study,Bus Service Evaluation Methods: A Review (1), was prepared by theMetropolitan Transit Authority of Harris County (Houston METRO)and published in 1984 by the U.S. Department of Transportation(USDOT), based on data obtained in 1981. While this synthesisprovides updated information to the 1984 report, the results are notdirectly comparable as the agencies that responded were not thesame, the questions differed in presentation and content, and theanalytical procedures differed. The resources available for thissynthesis were less than were available for the previous researchstudy; thus this synthesis has a more narrow scope and extensivefollow-up interviews to the questionnaire were not conducted. It isnot the purpose of this effort to evaluate various transit systems, butto report what agencies do in the area of bus route, not system,evaluation standards and how they undertake these efforts.
Because certain standards that were considered applicable in1984 no longer apply, or are at least not as broad in today's changedenvironment, revised and completely new standards have come toplay in recent years, particularly in the areas of service delivery andperformance monitoring. It is the intent of this synthesis to present acompilation of current activity and current data from transitproperties in North America both as an update of the 1984 study andin light of recent developments.
STUDY BACKGROUND
Except for the mid 1970s, most of the U.S. transit industry hasexperienced intense fiscal pressure for decades. Service equity issuesbetween adjoining communities (e.g., urban versus suburban,developed versus undeveloped, minority versus non-minority) havecaused tensions to rise. In response to these strains, many agenciesbegan to structure their examinations of bus service so that theresources allocated to individual routes were evaluated withmeasures, often formal, that attempted to rationally gauge the route'sefficiency and effectiveness.
The previous effort was part of an implementation program aswell as a study and review of then current bus service evaluationpractices within the U.S. and Canadian transit industries. The efforttherefore included other key project steps--developing a program ofservice standards and planning guidelines, and implementation of aline ridership data collection and analysis system. In the 1994questionnaire, a large number of questions dealt with these areas, thatis, not only how service is evaluated, but how data are collected andwhat the status of service standards is (e.g, formal versus informal,board adopted versus staff adopted). Thus, despite the fact that thecontext of this synthesis differs from the 1984 study, the results andproject conclusions of both are largely similar because of the surveytools used.
Consistent with the similarity in study results is the fact that thegeneral direction of bus route evaluation standards has not materiallychanged in the intervening 10 years. Standards have evolvedgradually, typically becoming more discrete, and are expected toevolve in a similar manner in the foreseeable future. Especially asroute level data become more readily available, particularly servicereliability information, this trend is expected to continue. It is alsoexpected that with new technology and more sophisticated reportingcapabilities, these data will be collected more regularly and costeffectively, thereby being employed more frequently by the industry.However, although the development of bus route evaluationstandards has only gone through evolutionary changes since 1984,there have been new trends emerging in how transit systems validatethe use of particular standards within their agencies. Historically,transit systems confined their reviews and comparisons to peeranalysis, i.e., other transit systems of similar size. A growing numberof systems, however, now report comparisons done with other transitoperations of various sizes in their region, as well as benchmarkingthemselves against other businesses. The Americans with DisabilitiesAct (ADA) and the Clean Air Act Amendments of 1990 (CAAA)have also had an impact on the application of route level standards,but in a manner somewhat different from traditional route evaluation.
Some systems have begun looking at themselves much the waytheir passengers do, comparing the service of another transportationbusiness (typically an airline, taxi or commuter
4
railroad), or service business (bank), or, in an increasing number ofcities, other transit operators that can provide service to them also. Insuch circumstances, the passenger will then make comparisonsbetween the public bus operators, effectively conducting their owncomparative bus route evaluation. In these circumstances, whenassessing bus route evaluation standards used by other operators,rather than the traditional peer review based on size, these operatorsfind themselves also assessing the bus route evaluation standardsused by other operators in their region.
Similarly, some operators now measure themselves againstevaluation standards used in other industries, typically thoseresponsible for transporting customers. Other than noting that thisphenomenon was mentioned during the course of conducting thissynthesis, further research in this area is not included in thissynthesis.
In light of the ADA complementary paratransit requirement, anumber of transit systems are evaluating fixed-route performance toascertain each route's suitability to remain a fixed-route service.Given this ADA requirement, there are circumstances foreseen underwhich, based on the route's performance as measured by theevaluation standards selected by the transit system, it may be moreeffective to provide service in the corridor as a paratransit serviceavailable to the general public. It is anticipated that the generalevaluation standards seen in 1984 and 1994 will evolve to includemeasures in this regard (paratransit suitability/substitution) as well.
It is not anticipated that the 1990 CAAA and the IntermodalSurface Transportation and Efficiency Act of 1991 (ISTEA) willhave any direct impact on route level evaluation and analysesbecause both of these acts are geared to system, rather than routelevel, matters. However, because route level evaluation standards areoften used for routes that operate together in a common corridor (andthe route level evaluation standards are then used as corridor levelevaluation standards), it is both logical and likely that measures willbe developed by transit systems to ascertain at the route/corridorlevel the interrelationship between the route and the 1990 CAAA.This will be especially true for those systems with routes that operatein areas with air quality problems.
This synthesis consists of five chapters, starting with this briefintroduction. Chapter 2 describes the basic objectives of the industryreview, the methodology employed in the review, and the variousclassification schemes that were employed. Chapter 3 describes theperformance criteria that are most often used to monitor and evaluatebus service performance by the agencies that responded to thequestionnaire. Chapter 4 contains several discussions that relate tothe general organization of service evaluation activities, the way dataare collected, and the status of formal service standards andguidelines. Conclusions and recommendations for future research areprovided in Chapter 5.
5
CHAPTER TWO
SYNTHESIS OVERVIEW
The approach used for this synthesis is described in thischapter. The methodology employed to contact transit systems ispresented first, followed by a discussion of the objectives of theindustry review; the chapter concludes with a description of theclassification scheme used to categorize the review responses.
METHODOLOGY
An extensive multiple choice questionnaire was prepared toobtain information for this synthesis on transit agencies' currentactivity and data with regard to bus route evaluation standards. Thissurvey was developed based on a review of the 1984 study, whichrequested demographic and statistical information, narrativestatements about the evaluation process and performance criteria,transit agencies' perceptions of the impact of an evaluation processon service delivery, equity, ridership, and operating costs; follow-uptelephone interviews were conducted by Houston METRO staff toobtain more detail. The 1994 study, in contrast, did not involvefollow-up interviews, except for matters of clarification. Copies ofthe 1984 and 1994 surveys are provided in Appendices A and B,respectively. It is important to again note that although the contextsof the two studies were different, the survey instruments were similarin the types of information they attempted to extract, and their resultsand conclusions are largely similar. Questionnaires were mailed to alist of 297 transit agencies provided by the American Public TransitAssociation (APTA). This distribution was somewhat smaller thanthe prior study's (345) because 1) not all transit systems belong toAPTA, and 2) the prior study also included some non-conventionalfixedroute operators, e.g., the University of Massachusetts campussystem. A total of 111 "usable" replies were received, representingabout 37 percent of the 297 agencies originally contacted. (The term"usable" refers to the fact that respondents were required to fill outoptical scan sheets by darkening circles,
and there were several returned answer sheets that could not beproperly scanned.) In 1984, 31 percent (109 of 345) of the transitagencies surveyed responded.
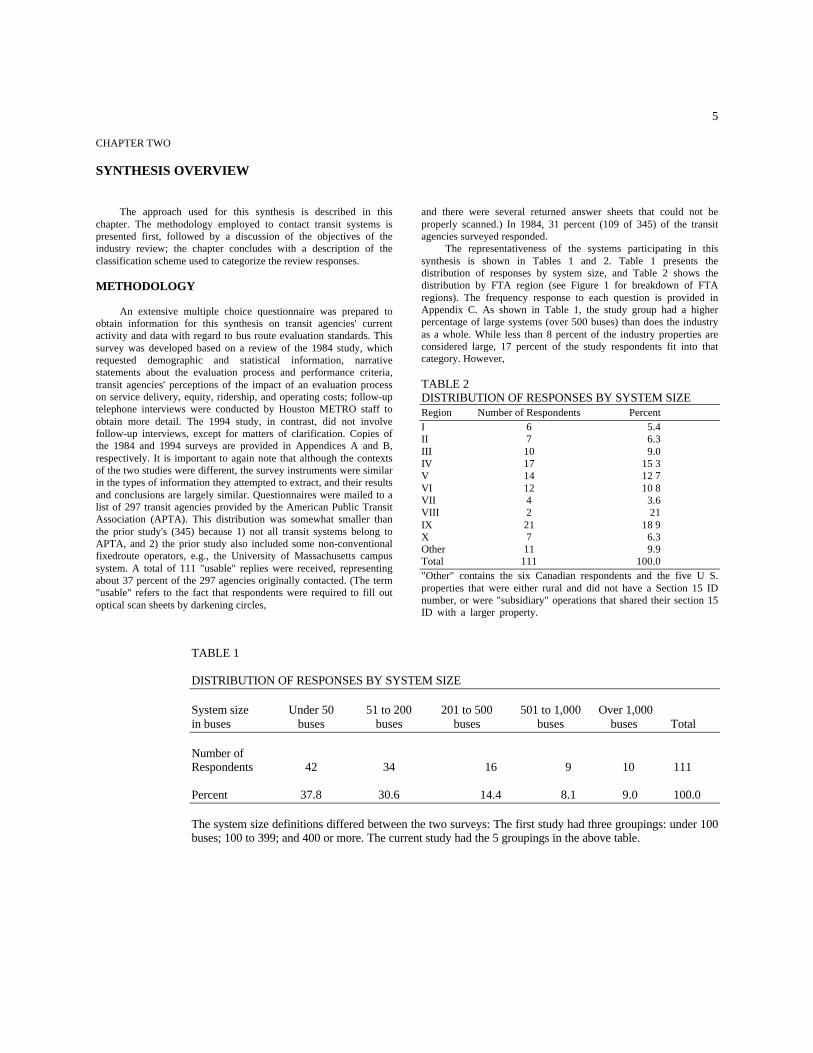
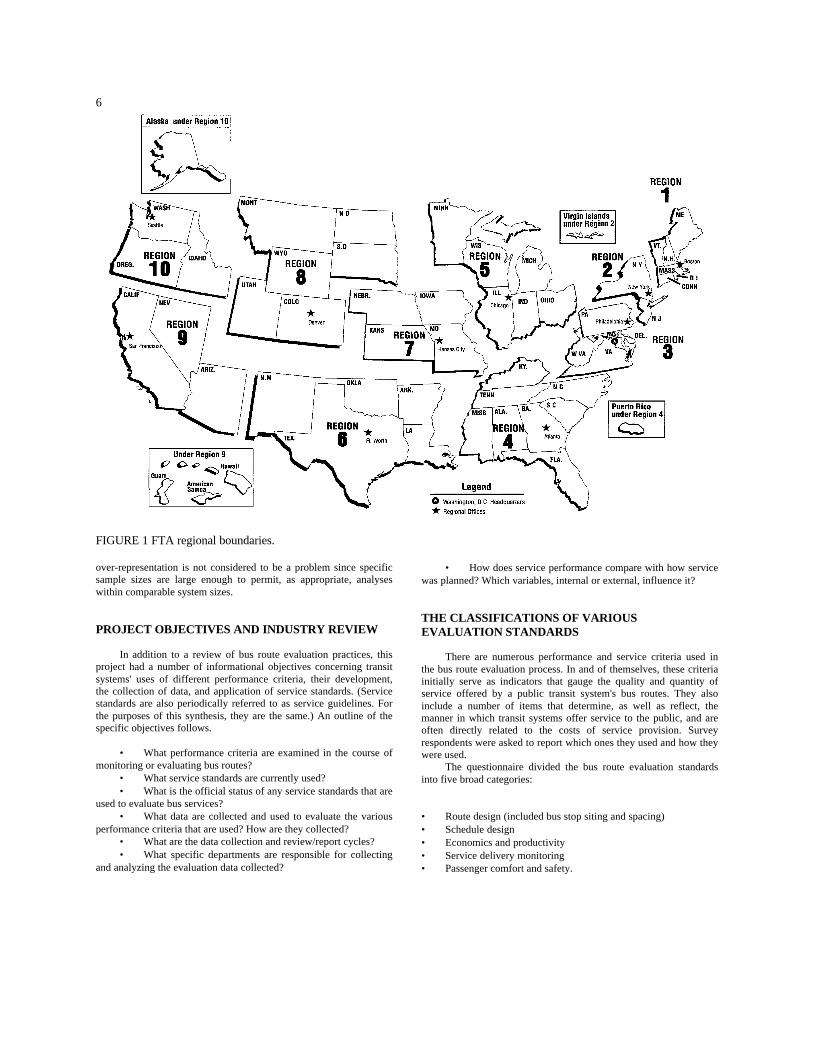
The representativeness of the systems participating in thissynthesis is shown in Tables 1 and 2. Table 1 presents thedistribution of responses by system size, and Table 2 shows thedistribution by FTA region (see Figure 1 for breakdown of FTAregions). The frequency response to each question is provided inAppendix C. As shown in Table 1, the study group had a higherpercentage of large systems (over 500 buses) than does the industryas a whole. While less than 8 percent of the industry properties areconsidered large, 17 percent of the study respondents fit into thatcategory. However,
TABLE 2DISTRIBUTION OF RESPONSES BY SYSTEM SIZERegion Number of Respondents PercentI 6 5.4II 7 6.3III 10 9.0IV 17 15 3V 14 12 7VI 12 10 8VII 4 3.6VIII 2 21IX 21 18 9X 7 6.3Other 11 9.9Total 111 100.0"Other" contains the six Canadian respondents and the five U S.properties that were either rural and did not have a Section 15 IDnumber, or were "subsidiary" operations that shared their section 15ID with a larger property.
TABLE 1
DISTRIBUTION OF RESPONSES BY SYSTEM SIZE
System size Under 50 51 to 200 201 to 500 501 to 1,000 Over 1,000in buses buses buses buses buses buses Total
Number ofRespondents 42 34 16 9 10 111
Percent 37.8 30.6 14.4 8.1 9.0 100.0
The system size definitions differed between the two surveys: The first study had three groupings: under 100buses; 100 to 399; and 400 or more. The current study had the 5 groupings in the above table.
6
FIGURE 1 FTA regional boundaries.
over-representation is not considered to be a problem since specificsample sizes are large enough to permit, as appropriate, analyseswithin comparable system sizes.
PROJECT OBJECTIVES AND INDUSTRY REVIEW
In addition to a review of bus route evaluation practices, thisproject had a number of informational objectives concerning transitsystems' uses of different performance criteria, their development,the collection of data, and application of service standards. (Servicestandards are also periodically referred to as service guidelines. Forthe purposes of this synthesis, they are the same.) An outline of thespecific objectives follows.
• What performance criteria are examined in the course ofmonitoring or evaluating bus routes?
• What service standards are currently used?• What is the official status of any service standards that are
used to evaluate bus services?• What data are collected and used to evaluate the various
performance criteria that are used? How are they collected?• What are the data collection and review/report cycles?• What specific departments are responsible for collecting
and analyzing the evaluation data collected?
• How does service performance compare with how servicewas planned? Which variables, internal or external, influence it?
THE CLASSIFICATIONS OF VARIOUSEVALUATION STANDARDS
There are numerous performance and service criteria used inthe bus route evaluation process. In and of themselves, these criteriainitially serve as indicators that gauge the quality and quantity ofservice offered by a public transit system's bus routes. They alsoinclude a number of items that determine, as well as reflect, themanner in which transit systems offer service to the public, and areoften directly related to the costs of service provision. Surveyrespondents were asked to report which ones they used and how theywere used.
The questionnaire divided the bus route evaluation standardsinto five broad categories:
• Route design (included bus stop siting and spacing)• Schedule design• Economics and productivity• Service delivery monitoring• Passenger comfort and safety.
7
Service standards taken collectively, which encompass the wholemilieu of various criteria, were examined in the context of theirformality, i.e., were they formally adopted or not, and if so, how. Inthis synthesis, the performance criteria reported by surveyrespondents are listed under one of the above categories, and arereported similarly in the tabular summaries.
Route Design Standards
Under the route design category, 15 criteria are used indesigning or redesigning a routing. These criteria, which helpdetermine and establish the buses' pathway, are as follows:
• Population density• Employment density• Spacing between other bus routes and corridors• Limitations on the number of deviations or branches• Equal (geographic) coverage throughout the local tax base• System design considerations such as enhancement of
timed transfers• Streamlining/reduction of routing duplications• Network connectivity• Service equity• Route directness• Proximity to residences• Proximity to non-residential generators• Limitation on the number of transfers required of riders• Bus stop siting requirements• Bus stop spacing requirements.
Each of these relates to the basic structure and design of a transitsystem's route network Factors such as the location of transitservices, the structure and configuration of transit routes, and patronaccessibility to transit services are measured by these criteria.
Schedule Design Standards
The criteria under schedule design are used in designing orredesigning a route's frequency, and help determine and establish thescheduled interval between buses as well as the starting and endingtime of service on a given day (span of service). These criteriainclude the following:
• Differing levels of service, i.e., local service versusexpress service
• Differing character of service, e g., crosstown versusfeeder
• Maximum number of standees• Maximum intervals• Peak periods versus off-peak periods• Minimum intervals• Standees versus no standees• Duration of standee time• Timed meets, or time to be spent waiting at a transfer
point• Use of clock-face schedules• Span of service.
These criteria relate to the basic frequency and the hours and days inwhich a route will run. To many riders, they are the items that largelydetermine and reflect service quality. In the 1984 study, the schedulefactors discussed were grouped along with others under the heading"Service Quality Criteria."
Economic and Productivity Standards
The first two categories of standards, route design and scheduledesign, dealt with criteria that lead to the design or redesign of aservice. Economic and productivity standards include criteria thatmeasure the performance of an already existing service. The criteriaare as follows:
• Passengers per hour• Cost per passenger• Passengers per mile• Passengers per trip• Passenger miles• Revenue per passenger per route (either in absolute
dollars or as a percentage of variable cost)• Subsidy per passenger• Route level minimum variable cost recovery ratio• Route level minimum costs that also include semi-
variable and/or fully allocated/fixed costs• Route level performance relative to other routes in the
system.
While each performance criterion is used to monitor or evaluate thefinancial and ridership performance of individual bus routes, the firstnine can be viewed in two ways: 1) as absolute measures againstsome predetermined number(s)/standard(s), or 2) as relativemeasures where the subject route's performance is measured againstthe performance of other routes. The last criterion, "route levelperformance relative to other routes in the system," by definition canonly be viewed as a relative measure. It will be noted that there is nocriterion regarding performance per route. As routes are whollyvariable--some 0.5 mi (.805 km) long (e.g., a parking lot shuttle) andothers as long as 20 mi (32.2 km), there is no way to meaningfullyevaluate a route simply as a "route." A unit of standard measurementagainst which to apply the criteria is required: hence the use ofpassengers, miles, and hours.
Service Delivery Standards
The criteria for this category of standards measure servicereliability. Service delivery criteria include the following: ontimeperformance and headway adherence (evenness of interval). Thesecriteria measure a route's service as actually delivered to a passenger.As will be reported later in this synthesis, some transit systems usethese criteria at a system, not bus route, level.
Passenger Comfort and Safety Standards
The following criteria measure the ambiance that greets a riderusing the bus system:
8
• Passenger complaints• Missed trips• Unscheduled extra buses or trips• Accidents• Passenger environment conditions (e.g., vehicle
cleanliness, vehicle condition, missing stanchions, blank destinationsigns)
• Special information (or special intervals) in areas whereriders do not feel secure waiting for buses.
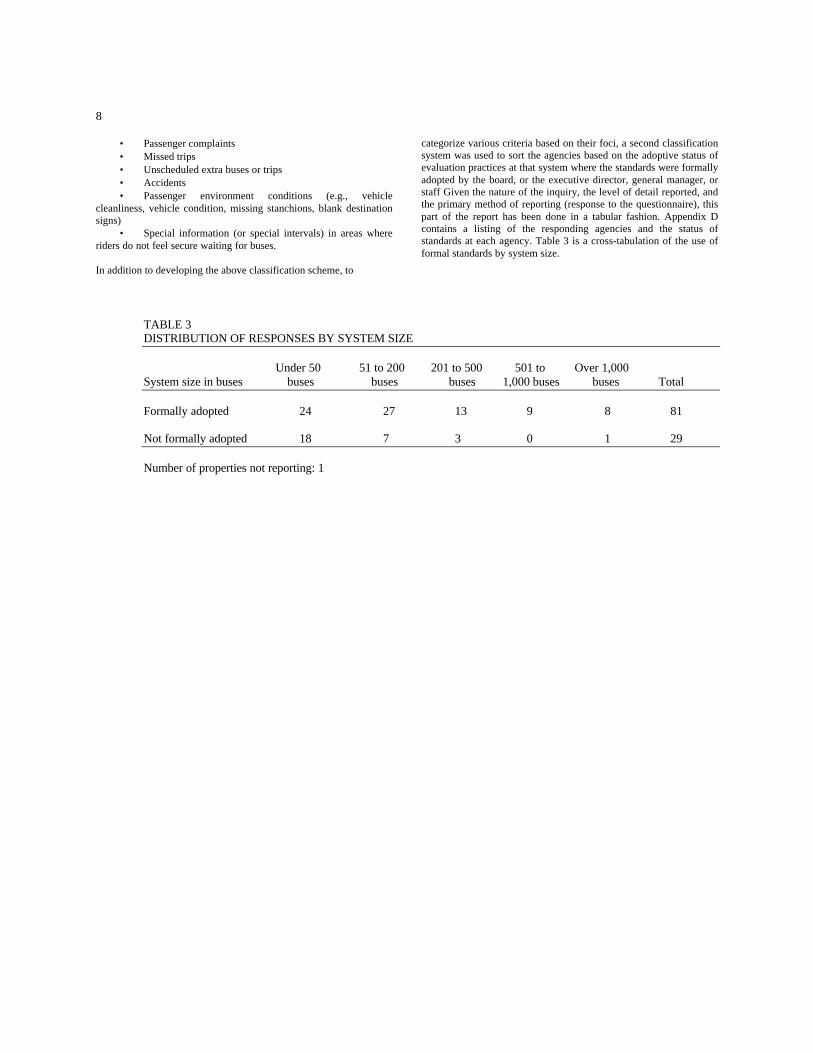
In addition to developing the above classification scheme, to
categorize various criteria based on their foci, a second classificationsystem was used to sort the agencies based on the adoptive status ofevaluation practices at that system where the standards were formallyadopted by the board, or the executive director, general manager, orstaff Given the nature of the inquiry, the level of detail reported, andthe primary method of reporting (response to the questionnaire), thispart of the report has been done in a tabular fashion. Appendix Dcontains a listing of the responding agencies and the status ofstandards at each agency. Table 3 is a cross-tabulation of the use offormal standards by system size.
TABLE 3DISTRIBUTION OF RESPONSES BY SYSTEM SIZE
Under 50 51 to 200 201 to 500 501 to Over 1,000System size in buses buses buses buses 1,000 buses buses Total
Formally adopted 24 27 13 9 8 81
Not formally adopted 18 7 3 0 1 29
Number of properties not reporting: 1
9
CHAPTER THREE
RESPONDENTS' USE OF SERVICE STANDARDS AND PERFORMANCE CRITERIA
This chapter examines the respondents' use of performancecriteria in the evaluation of local bus services. Responses arerepresentative of the U.S. and Canadian transit industries. Thediscussion for each category describes the type of criteria that areemployed by the industry.
ROUTE DESIGN STANDARDS
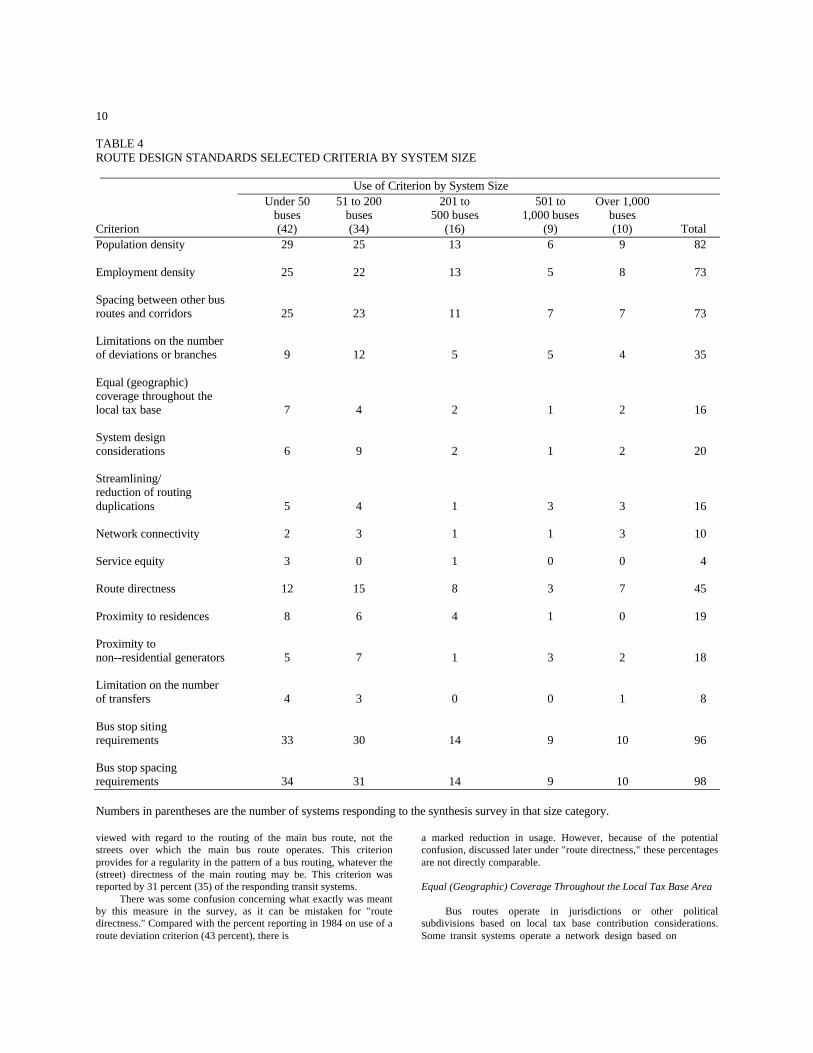
The criteria for route design standards are used in designing orredesigning a routing, and help in determining and establishing thepathway for the bus. More than 86 percent of the respondents useroute design standards. As discussed in Chapter 2, there are 15criteria for route design; respondents were asked to select all thatapplied. Table 4 shows by size grouping which of these criteria areused by the respondents. Sixteen transit agencies, all with fewer than500 buses, did not claim the use of route design standards.
Basic Criteria
Of the criteria related to network design considerations, thefollowing five are generally considered the basics of route designstandards: population density, employment density, spacing betweenother routes/corridors, limits on the number of deviations orbranches, and equal (geographic) coverage through the local taxbase. The use of each of these criteria, as well as a brief discussion ofeach, is provided next.
Population Density
Population density represents the number of people residing persquare mile. It is the best representation of the potential, in terms ofdaily trips, at the point of origin. Data are available from therespective national censuses in the United States and Canada, as wellas from local planning agencies. Population density is the mostelemental of factors. Given that the fundamental purpose of bus masstransit is to carry passengers, in volume, this indicator reveals howmany people live where. Almost 74 percent (82) of the respondentsuse population density as a criterion in route design.
Clearly, as the old expression goes, "run the bus where thepeople are." Data for this criterion are found in the census and maybe augmented by local data. Other demographic factors such as autoownership may also be used in this analysis.
Employment Density
Employment density represents the number of jobs per squaremile. Typically, work trips account for well over one-half
of a transit system's ridership (2). Almost 66 percent (73) of therespondents use employment density as a criterion in route design.
The main source of information for this criterion is the trafficanalysis zone (TAZ) version of the census transportation planningpackage (CTPP). However, because it reduces down to the TAZlevel, which is usually not fine enough for detailed route planning,planners usually use the metropolitan planning organization (MPO)or the regional databases.
Route Coverage (Spacing Between Other BusRoutes and Corridors)
This refers to the spacing distance between adjoining routings.The route coverage criterion guides spacing between bus services,geographically distributing them within the service area. This is doneto maximize patron accessibility to transit service within theresources available to the agency. Use of this design criterion wasreported by 66 percent (73) of the respondents. Of these 73 systems,81 percent (59) had formal service standards. In comparison with the1984 study, 65 percent (60 of 109 systems) used this criterion, and 43percent (28) of these had formal service standards at that time.
This is one of the few criteria that are directly comparablebetween the two studies. The fact that the percentage of systems withformal standards who used this criterion doubled during the timebetween the two studies reflects both the importance of the criterionand the increase in the adoption of formal standards.
In 1984, some agencies required the spacing between busroutes to be maintained at between 0.5 and 2 mi (.805 and 3.22 km).Spacing further depends on such factors as the population density ofan area, the proximity of an area to the central business district(CBD), and the type of bus services or routes in operation within anarea (e.g., grid versus feeder) One-half-mile (.805 km) spacings areusually required in areas with high density and close proximity to theCBD: wider spacings of 1 mi (1.61 km) or more are generallyreserved for commuter or express-type routes that serve less denselypopulated rural or suburban areas. By establishing ideal distancesbetween bus routes, transit agencies attempt to ensure that routes donot overlap covered areas and that transit services are well distributedthroughout the jurisdiction.
Limitations On the Number of Deviationsor Branches
In this criterion, deviation, or branching, involves selected tripsleaving the main-line of the route; the deviation is
10
TABLE 4ROUTE DESIGN STANDARDS SELECTED CRITERIA BY SYSTEM SIZE
Use of Criterion by System SizeUnder 50 51 to 200 201 to 501 to Over 1,000
buses buses 500 buses 1,000 buses busesCriterion (42) (34) (16) (9) (10) TotalPopulation density 29 25 13 6 9 82
Employment density 25 22 13 5 8 73
Spacing between other busroutes and corridors 25 23 11 7 7 73
Limitations on the numberof deviations or branches 9 12 5 5 4 35
Equal (geographic)coverage throughout thelocal tax base 7 4 2 1 2 16
System designconsiderations 6 9 2 1 2 20
Streamlining/reduction of routingduplications 5 4 1 3 3 16
Network connectivity 2 3 1 1 3 10
Service equity 3 0 1 0 0 4
Route directness 12 15 8 3 7 45
Proximity to residences 8 6 4 1 0 19
Proximity tonon--residential generators 5 7 1 3 2 18
Limitation on the numberof transfers 4 3 0 0 1 8
Bus stop sitingrequirements 33 30 14 9 10 96
Bus stop spacingrequirements 34 31 14 9 10 98
Numbers in parentheses are the number of systems responding to the synthesis survey in that size category.
viewed with regard to the routing of the main bus route, not thestreets over which the main bus route operates. This criterionprovides for a regularity in the pattern of a bus routing, whatever the(street) directness of the main routing may be. This criterion wasreported by 31 percent (35) of the responding transit systems.
There was some confusion concerning what exactly was meantby this measure in the survey, as it can be mistaken for "routedirectness." Compared with the percent reporting in 1984 on use of aroute deviation criterion (43 percent), there is
a marked reduction in usage. However, because of the potentialconfusion, discussed later under "route directness," these percentagesare not directly comparable.
Equal (Geographic) Coverage Throughout the Local Tax Base Area
Bus routes operate in jurisdictions or other politicalsubdivisions based on local tax base contribution considerations.Some transit systems operate a network design based on
11
geographic considerations of local tax contributions. This criterionwas reported by 14 percent (16) of the respondents.
This is the least used criterion of the five basic ones and reflectspolicy decision more than planning practice. Because routes operateat different levels of intensity, use of this criterion by no meansreflects service levels. A route that operates to provide geographiccoverage may not provide meaningful service at all. Indeed, it maybe reflective of the old franchise trip, i.e., a token trip that operates toestablish presence on the route, if not service. This was quitecommon in the era of private operation where such operations wererequired of a carrier if it wanted to preserve its franchises onprofitable routes. No public carriers reported any such operations intheir comments.
Secondary Criteria
The remaining ten criteria for route design standards, which canbe considered a secondary level, are as follows:
• System design considerations such as enhancement oftimed transfers
• Streamlining/reduction of routing duplications• Network connectivity• Service equity• Route directness• Proximity to residences• Proximity to non-residential trip generators• Limitation on the number of transfers required of riders• Bus stop siting requirements• Bus stop spacing requirements.
Although important, these criteria constitute a level of refinement inthe area of route design standards. The first four were treated asdesign elements in the questionnaire, along with "service to unservedareas" (which is an objective, but does not constitute a criterion).Respondents were asked to select their primary design element fromamong the five choices. The criterion most often selected was"service to unserved areas" (49 percent). After that, favored routedesign criteria were selected in the following order: system designconsiderations, streamlining/reduction of duplication, networkconnectivity, and service equity. Most systems use at least two ormore of these criteria.
System Design Considerations
This criterion refers to the relationship between a new routingand existing routes in the system. Such aspects as whether there willbe a timed transfer where a new route intersects with an existing one,or whether routes share common terminals and bus loops, areconsiderations under this criterion. Preference for this designcriterion, from among the five mentioned above, was reported by 18percent (20) of the systems responding to this question. This criterionis similar to "network connectivity," but focuses on the route's designin relation to other routes in the system and how a rider would usethe route itself in relation to other routes. Network connectivity,which is discussed later, focuses on the system as a whole. Typically,the system design criterion includes such aspects such as theenhancement of timed transfers, or the use
of adjoining loading bays in a passenger terminal for routes with thesame destination so that riders can board the first departing bus.
Streamlining/Reduction of Duplication
This criterion refers to a situation where two or more distinctroutings, that serve the same passenger market(s), appear withinclose or overlapping proximity. Streamlining/reduction is designed tocontrol the duplication of bus routings to ensure that transit servicesare adequately distributed geographically within a service area. Byensuring that overlapping covered areas for different bus routes areminimized, services can be more widely dispersed within an agency'sjurisdiction. Just over 14 percent (16) of the respondents consideredthis to be their primary criterion. However, for the larger transitsystems, this was a more significant concern, with more than 30percent noting this as their primary design element. In the 1984review, 30 percent of the respondents reported use of this criterion tocontrol the amount of route duplication within their route networks(along with any other design element measures used).
The data collected to evaluate this criterion are obtainedthrough analyses of route or system maps and various mileagecalculations and comparisons. The caveat in focusing on routeduplication, especially with the use of maps, is that two close,parallel lines on a map may be serving two totally different markets,and one route cannot do the job of two. One route may be a limited,or street express, operating at a relatively high rate of speed over anarterial, while the other may be serving a more localizedneighborhood function. Combining the two routes may not save anyresources because of a reduction in operating speeds and anoverlaying of proximate maximum load points, which may serve toincur the displeasure of regular riders who see either their trip slowedor their bus stop dislocated.
Network Connectivity
This criterion refers to the physical relationship of a newrouting to the existing route system already in place at the agency.When a new routing is being introduced into a system, itsrelationship to the system as a whole must be considered (e.g., is aradial route being introduced into a grid system). This criterion wasselected as a primary design element by 9 percent(10) of the respondents (evenly distributed by system size).
Network connectivity, although similar to "system designconsiderations," focuses on the route's relation to the system as awhole and not specifically to any other individual route or group ofroutings. This criterion represents those opportunities where 2 + 2 =5, i.e., the sum of the whole can be greater than the parts. Forexample, this may mean designing a route that connects two others,thereby creating a through route, thus providing a one-seat ride forcustomers on what would otherwise be three routes. Even directlycombining two poorly performing routes into one stronger route,with improved efficiency, is an example of how this measurestrengthens the system as a whole.
12
Service Equity
Service equity can mean many things. To some, it iscompliance with Title VI of the Civil Rights Act, which provides forequitable distribution of transit resources. To others it is simply thedistribution of service or the use of populationbased criteria. Serviceequity was not defined in the questionnaire. Rather it wasdeliberately left undefined so that agencies could comment on thesubject if they wished. Fewer than five systems reported this criterionas their primary design element, and no one commented.
The next four secondary criteria for route design standards,considered design tactics, are route directness, service proximate toas many residences as possible, service to as many non-residentialtrip generators as possible, and limitation on the number of transfersrequired of riders. Again, respondents were requested to select fromamong the four as preferred. Many, of course, use more than one.
Route Directness
For transit systems that use this criterion, a mathematicassessment is used to measure a route's deviation from a linear pathin one or more of the following ways:
• Additional travel time for a one-way bus trip• Additional travel time required over an automobile
making the same trip• Mileage limitations that permit a maximum deviation per
route• Time limit increase in average travel times per passenger• An absolute limit to the total number of pathway
deviations• The pathway deviation(s) must not lower the average
productivity of the route or the deviation should have a higherproductivity rating than that for the line as a whole.
This criterion was selected by 41 percent (45) of the respondents astheir primary design tactic. In the 1984 study, 43 percent of thesystems reported use of this criterion.
To some, this criterion is substantially similar to "limitations onthe number of deviations or branches." However, it is a matter ofhow deviation is viewed. If one views deviation as the main-lineveering from the most direct path/streets possible, then the 1984 and1994 questions could be interpreted the same. But if route deviationis viewed as selected trips leaving the main-line of the route--thedeviation relationship is with the main bus route (the deviatingsegment rejoins the mainline in due course, unlike a branch whichstays away from the mainline after diverging), not the streets overwhich the deviation operates--then these criteria are different. Theview was that in this criterion, direct, noncircuitous routing dealtwith the streets themselves, not branches or deviations from the busroute. Given the response rate to this question, and the close parallelin response to 1984, it is likely that most respondents also viewedthis question in relation to the street-network, not the main-line, ofthe bus route.
This criterion was discussed at length in the 1984 study. Thestandards that were reported placed various limits or conditions onbus routing to control the extent to which buses
in regular service leave major arterial streets to serve residentialpockets or activity centers. Several types of controls or limitationsare employed in standards designed to evaluate this criterion. Theseare
• Some standards limit route deviations to a maximumnumber of minutes (5 to 8 min) of additional travel time for a one-way bus trip.
• Other standards limit such deviations by requiring thattransit travel distances not exceed automobile travel distances for thesame trip by more than 20 to 40 percent.
• Mileage limits are used by other agencies, which permit amaximum of 1 mi (1.61 km) of deviation per route.
• Other standards limit increases in average travel times perpassenger to a maximum of 10 to 25 percent as a result of anydeviations along a route.
• Route deviation is also controlled by limiting transit traveltimes to a maximum of twice the automobile travel time for the sametrip regardless of the number of such route deviations that exist.
• Some standards limit to two the number of routedeviations that will be allowed per route
• Some agency standards require that route deviations mustnot lower the average productivity of a line or that the deviatedsegment(s) of route should have a higher productivity rating than thatfor the line as a whole.
It is important to note that several smaller systems have standardsthat either encourage considerable route deviation or permit it toserve activity centers or to correct route coverage deficiencies thatexist in the transit network.
Service Proximate to as Many Residences as Possible
There is no mathematic definition for this criterion."Proximate" is how the respondents would define it themselves. Theobjective is to get as close as possible to a rider's residence withoutunnecessarily delaying or detouring other riders. (In some respects,this criterion can be viewed as a cross between route directness andbus stop spacing.) In designing the segment of a service's residentialrouting, use of this criterion represents trade-offs that include factorssuch as population density, market identification (e.g., income andauto availability of potential riders, their destinations), and the abilityfor the vehicle to navigate streets (often, residential streets, even inhigh density neighborhoods, have geometries that do not permit useby 40-ft, or even 35-ft, buses). The question posed to surveyrespondents asked if this criterion was their primary design tactic.Seventeen percent (19) reported affirmatively.
Service to as Many Non-Residential Trip Generators asPossible
There is no mathematic definition for this criterion either. Aswith the previous criterion, "proximate" is how the respondentswould define it themselves. The objective here is to get as close aspossible to a rider's non-home destination without unnecessarilydelaying or detouring other riders The
13
principle factor in this particular trade-off is employment density,although market identification and vehicle operation are also issues.Vehicle navigation is also an issue in nonresidential areas becausemany suburban office park roadways have geometries that do notpermit use by large vehicles. The question posed to surveyrespondents asked if this criterion was their primary design tactic.Sixteen percent (18) reported that it was.
Limitation on the Number of Transfers Required of Riders
This criterion considers whether the design of the route calls fora significant number of its users to transfer, an importantconsideration in designing or redesigning a bus route. An area couldbe served with a feeder route where virtually all riders will berequired to transfer to complete their trip, or the route itself could bedesigned to operate a full distance, for example to the CBD, and theneed for transfers would be obviated for many. Only 7 percent (8) ofthe respondents stated that limiting the number of transfers was theirprimary design tactic.
Seven of the eight respondents were smaller systems. Giventhat transfers are a tool that planners need to use, but judiciously, it isnot surprising that the prevention of transferring was the least likelyprimary design tactic. While it is an important design tactic, clearly itis secondary for the majority of systems.
The last two secondary criteria under route design standardsconcern a matter as fundamental as the bus itself--the stop. Twodesign issues for bus stops are the siting, or placement of a stop, andthe spacing between stops.
Bus Stop Siting
The site of a bus stop can be near-side (just before the crossstreet at the intersection), far-side (just after the intersection), or mid-block (on the block face between two intersections). Far-side sitinghad a plurality response (43 percent of 111 properties surveyed; 48percent of those that responded to the question) but near-side wasmore than 30 percent. No preference was reported by almost 25percent, and 24 percent gave no answer at all.
Bus stop siting has always been one of the more controversialissues within the transit industry--should the stop be near-side or far-side? The results of the survey are consistent with the controversy;there was no majority answer. The key practice that underlies soundsiting is support from the responsible party (typically a municipality)to properly designate the length, mark, and sign, and to enforceagainst encroachments. Short stops and cars parked in zones limitadequate curbing.
The need for adequate length translates into a preference bymunicipalities, where parking space is at a premium, for nearsidestops. At 80-ft (24.4-m) lengths, less parking is lost from the streetfor near-side stops than that required for 105-ft (32m) far-side stops.The near-side stop takes advantage of the intersecting street width forpull-out and lane merge requirements. Where parking is not at apremium, a case can be stated for preferring far-side. Municipaltraffic engineers prefer far-side stops because they facilitatefollowing right
turn on red movements. They are deemed safer for both alightingpassengers (rear doors will likely be closer to the curb, with lesschance of passengers missing the curb, especially at night) andcrossing pedestrians, who will not be darting in front of a bus.
Given the likelihood that at signalized intersections one street isfavored over the other, if the bus route is with the favored direction,the stop should logically be far-side to take advantage of the greatergreen time it is likely to encounter. Preemptive signalling also createsthis condition, i.e., the street/route with preemptive signalling will befavored over cross streets and thus far-side stops are preferred.Conversely, the stop should be near-side if the route is on the streetnot favored with greater green time.
Bus Stop Spacing
Bus stop spacing is the distance between adjoining servicestops of a route. Transit operators have developed standardsregarding bus stop spacing as part of their effort to balance the trade-off between rider convenience (stops with easy walking distances)and speed. Use of this design criterion was reported by over 85percent (95) of the responding systems. In 1984, 62 percent (68) ofthe respondents reported using this criterion.
There are almost as many practices as there are operators. Thecombination of this criterion with "bus stop siting" reveals that thereis no predominant practice in either siting or spacing. The highestquantity reported was 48 percent of operators with non-CBD spacingof 6 to 8 stops per mi (1.61 km) and 48 percent of those preferred far-side stops. Further, of those who preferred far-side stops, one-halfalso preferred non-CBD spacing of 6 to 8 stops per mi (1.61 km).
Spacing has always been controversial precisely because of theseeming opposing arguments of convenience versus speed. Theconvenience argument is not as strong as it might appear, however,unless the base condition was a bi-directional bus route network withservice on every street and a stop on every comer. In virtually allother circumstances the majority of riders will walk from their originto the closest comer. And it follows that the fewer the stops, thegreater the number of people who will walk. A 1992 study conductedby MTA New York City Transit determined that in local bus stoprelocation, where the change went from approximately 10 per mi(1.61 km) (530 ft/161.5 m between stops) to 7 per mi (1.61 km) (750ft/228.6 m), a 42 percent increase in distance between stops, thenumber of walkers increased by only about 12 percent(memorandum, J. Gaul, from MTA New York City Transit, February1992). Further, it does not follow, with an existing route undergoingchange, that fewer stops means that each and every specificindividual will have to walk farther. Often, it only means reorientingto the new stop, with the walking distance unchanged for mostpatrons.
SCHEDULE DESIGN STANDARDS
The criteria for schedule design standards, which relate to thebasic frequency, hours and days, and times of departure in which aroute will run, were used as reported by almost 75 percent (83) of therespondents. The eleven criteria under this category of standards areas follows:
14
• Differing levels of service, e.g., local service versusexpress service
• Differing character of service, e.g., crosstown versusfeeder
• Maximum number of standees• Maximum intervals• Peak periods versus off-peak periods• Minimum intervals• Standees versus no standees• Duration of standee time• Timed meets, or time to be spent waiting at a transfer
point• Use of clock-face schedules• Span of service (the hours at which service runs).
By definition, as all fixed-route buses must have schedules, the25 percent of respondents not reporting use of these standardsreflects systems that operate strictly on a policy basis, which istypical of smaller systems. (It should be noted that 24 of therespondents, 23 of which had fewer than 200 buses, had, as formalschedule standards, policy headways.)
Schedule design standards are based on 1) waiting timebetween buses (policy schedule); 2) per vehicle occupancy standards(standees versus no standees, different levels/percents of seatoccupancy ranging from 25 to 150 percent, i.e., 50 percent of thenumber of seated riders will stand); or 3) both. Of the 83respondents, 58 percent (48) reported using both policies; almost 29percent (24) reported a waiting time standard only, andapproximately 13 percent (11) stated that schedules were based onloading levels. It should be noted that in some states, such asCalifornia and Pennsylvania, the choice of which standard will beselected is influenced, if not regulated, by a state public utilitiescommission or highway patrol.
Differing Levels of Service
This criterion refers to the fact that there are different standardsfor different levels of service. Some systems have guidelines thatdiffer for each level of service. For example, express buses or busesthat operate over limited access roadways might not be scheduled tocarry standees, whereas those operating as local buses over regularstreets would carry standees. Almost 58 percent of the respondentsstated that they had different guidelines for different levels ofservice.
The questionnaire also asked if there were surcharges for non-local bus service. The affirmative response to the questionconcerning different standards for differing levels of service wasmore pronounced if there was a premium surcharge on the expressbus. Of the systems that reported having different standards fordifferent levels of service and responded to the question concerningpremium surcharges, 61 percent had both different guidelines forlocal and express (or limited) services and different fares, i.e.,surcharges for the non-local bus services.
Differing Character of Service
Some systems have standards that differ for different charactersof service. Examples of this are crosstown, feeder, radial,
and shuttle services. Forty-three percent (48) of the respondents haddiffering guidelines for differing characters of service.
Larger systems (over 500 buses) were predominant with regardto having different standards for different characters of service; 55percent of the larger systems (11 of 20) had differing standards. Fortypercent of the smaller systems also reported using different standardsfor various types of services
With regard to the next five criteria--maximum number ofstandees, maximum intervals, peak periods versus off-peak periods,minimum intervals, and standees versus no standees--transit systemswere asked to identify all that applied to them. They are discussed inthe order of use Many systems used more than one criterion;however, 24 stated that they used none. Table 5 shows the use ofthese schedule design criteria by system size All five were used byonly three properties--two between 51 and 200 buses (one in FTARegion I and one in Region IX) and one over 1,000 buses (in RegionI)
It is worth noting that in the 1984 study, the area of schedulingstandards, which included only two criteria at the time, vehicle loadsand vehicle headways, was considered a subset of "Quality Criteria."Schedules underlie the area of customer satisfaction (as does servicereliability, discussed later) and it is the whole area of standards incustomer satisfaction that is emerging as the major trend in busservice evaluation.
Although there weren't any explicit customer satisfactionquestions, some systems reported comparing themselves with otherservices, transit and otherwise, that they found their customers usingrather than the traditional peer comparisons with systems of similarsize. This is because while a passenger rides a bus one route at atime, the passenger is riding part of a system. In the case of transit,these non-peer comparisons were most pronounced in metropolitanareas with more than one public operator (i e., more than oneoperator in the municipality (New York and Los Angeles) or oneoperator in the central city, and other operators in the suburbs (LosAngeles and Washington)). In these environments, passengers rideboth systems and make the customer satisfaction comparisonsbetween the systems that they ride. In turn, operators find themselvescomparing their services not just with peers of comparable size, butwith other operators in their region that may be substantially differentin size. Additionally, one operator mentioned conducting customermarket research that focused on comparisons not just with urbantransit (bus and rail) but with other industries, including airlines. Itmust be noted, however, that these are system level issues, and notthose of individual route evaluations where comparisons are typicallymade between one route and the rest of the routes in that particularsystem. Nevertheless, in the area of customer satisfaction, these arematters that often transcend whether an analysis is at the system orroute level.
Maximum Standees
There is a maximum number of standees scheduled per trip.This means that the transit system will schedule additional service(trips) to keep the average number of standees per bus on the routebelow whatever benchmark, e.g., 20 standees, or 50 percent of thenumber of seats, has been selected. Seventy-two percent (60) of therespondents reported
15
TABLE 5SCHEDULE DESIGN STANDARDS SELECTED CRITERIA BY SYSTEM SIZE
Use of Criterion by System Size
Under 50 51 to 200 201 to 500 501 to 1,000 Over 1,000Criterion buses (42) buses (34) buses (16) buses (9) buses (10) Total
Maximum numberof standees 11 20 12 7 10 60
Maximumintervals 13 21 9 6 10 59
Peak versusoff-peak periods 8 17 5 6 9 45
Minimum intervals 6 8 1 1 3 19
Standees versus nostandees 3 7 3 0 4 17
Numbers in parentheses are the number of systems responding to the synthesis survey in that size category.
use of this criterion, including all 10 responding properties over1,000 buses. Although not explicitly requested, the 1984 study askedabout vehicle loads. Seventy-six percent of those respondentsreported standards for vehicle loading.
Respondents were asked if they permitted standees and if so,whether there was an upper (maximum) limit on the number ofstandees. They were not asked for the number of standees (as anabsolute number) or the square footage allotted per standee. Thiscriterion, as applied by systems, is heavily influenced by the interiorconfiguration of the bus. Systems that do not schedule for standeeswill order buses with wider seats and more narrow aisles.
Maximum Intervals
Maximum intervals is the working definition of the maximumamount of time an agency will permit to lapse between scheduledbuses, e.g., there will be a bus at least every 30 min or every 2 hr.The transit operator (or oversight board) will frequently stipulate apolicy directive on service frequency. Specifically, buses will run noless frequently (or no more frequently) than every so many minutes.Fifty-three percent (59) of the respondents reported use of thismeasure. Although not explicitly requested, the 1984 study askedabout vehicle headways. Sixty-eight percent of those respondentssaid that they had vehicle headways standards.
This was the most commonly reported schedule designcriterion. All systems with 1,000 or more buses reported using it.
Peak Periods Versus Off-peak Periods (Rush Hours thatare Different from Non-rush Hours)
Some systems with loading guidelines have different guidelinesfor rush hours than non-rush periods. Schedule
guidelines that are different in the rush hours than in the nonrushhours were reported by 41 percent (45) of the respondents.
Nine of the 10 systems with 1,000 or more buses engage in thispractice.
Minimum Intervals
Minimum intervals is the working definition of the minimumamount of time an agency will require between scheduled buses, e.g.,buses will operate at least 2 min apart. The transit operator (oroversight board) will frequently stipulate a policy directive onservice frequency. In the case of minimum intervals, it is a matter ofbuses not running more frequently than "x" minutes apart. Only 17percent (19) of the respondents reported having minimum intervals.
Seventy-four percent of the respondents were from propertiesunder 200 buses.
Standees Versus No Standees
This criterion refers to service being scheduled in such amanner that seats will be provided to all riders and there will be noscheduled standing. There are systems, that by policy, attempt toguarantee a seat to every rider, which translates into a policy of nostandees. Only 15 percent (17) of the responding systems reporteduse of this criterion.
Four of the 17 respondents were systems with 1,000 or morebuses, i.e., 40 percent of the largest systems, and each of the fourreported having surcharges for non-local bus services. Thus in alllikelihood for these properties, a no standee policy is probablyreflective of no standing on express bus/premium services.
The next four criteria exhibit a transit operator's schedulingpractices that may be viewed as actual guidelines themselves.
16
TABLE 6USE OF TIMED TRANSFERS BY SYSTEM SIZE
Under 50 51 to 200 201 to 500 501 to 1,000 Over 1,000buses buses buses buses buses Total
Use 20 16 5 4 3 48
Don't Use 15 15 9 5 7 51
Total 35 31 14 9 10 99
Number of properties not reporting: 12
Duration of Standee Time
This criterion is defined as the maximum amount of time themajority of standees will stand. Some transit systems schedule forstandees, but do so in a manner that limits the amount of time a riderwill stand. Twelve percent(13) of the respondents reported using standee time.
It is possible to determine standee time through traffic checks.On feeder and express routes, this is a relatively simple task--inbound, the elapsed period of standing begins at the point of the firststandee, and outbound it is the location at which there are no morestandees. Crosstown buses are more problematic. It is possible forthere to be standees from terminal to terminal, but because of riderturnover, and under the presumption that once a seat is freed up astandee will take it, no one rider will stand for very long.Determining the duration of standee time under such circumstancesis much more difficult. Riding checks that are graphed can pictoriallyreveal the character of standee riding, at least with the assumptionthat the standee of longest duration is the rider that takes the first seatwhen it becomes available. (Checks are taken on board buses by staffriding the bus, typically from terminal-to-terminal. Boarding andalighting volumes are recorded by time at each bus stop used. Thechecker sits in the seats behind the operator or in seats directly acrossfrom the operator in the front of the bus. Some agency staff sit inseats behind the rear set of doors where vision is not obscured.) Fourof the 13 systems reporting use of this criterion were systems with1,000 or more buses, which is reflective of the longer routes in thelarger metropolitan areas in which they operate. On shorter routes, inany size metro area, this is not a meaningful measure.
Timed Meets, or Time Spent Waiting at Transfer Points
This refers to the scheduled meeting of two (or more) trips ondifferent routings for the purpose of serving riders who aretransferring between trips. Because transferring is prevalent, somesystems are attempting to have trips on intersecting bus routesconverge at the transfer point at the same time and meet. Where thisoccurs at one location, but with a large volume of services, it is alsoknown as a pulse meet or timed transfer. Of the 99 respondents tothis question 49 percent (48) said they schedule for timed transfers.
There was a 50/50 split by respondents to this question (51-no/48-yes) on use of the criterion, which can be quite
complicated to implement; the responses reflect this. Table 6 showsthe cross-tabulation of timed transfer versus size of property. There isbasically a steady progression of "don't use" as property sizeincreases. Forty-three percent of the small properties (fewer than 50buses) responding to this question reported that they don't use thiscriterion; 70 percent of the large properties don't use it.
Use of Clock-Face Schedules
Clock-face schedules are intervals that divide evenly into 60.Some systems specifically write their schedule intervals (whengreater than 10 min) so that they divide evenly into 60 min. Forexample, 12 or 15 min schedules are used, but 13 and 17 minschedules are not. Some systems call these memory schedules.Ninety-four systems responded to this question, with 47 saying theyuse it, and 47 saying they did not.
The use of clock-face schedules, when buses operate onintervals greater than every 10 to 12 min, is somewhat controversialin the transit industry. Marketing/sales staff believe that it is apowerful tool in terms of promoting the product; buses show up atthe same time (in minutes) past each and every hour. From the costaccounting viewpoint, schedules written around this criterion may beexpensive (depending on the route-specific circumstances), however.Clock-face schedules in grid systems with lengthy routes andnumerous route intersections are difficult to write because ofvagaries in running time, and it has not been proven whether theseschedules attract more ridership. Of the systems responding to thisquestion, the smaller ones were more likely to use these schedules,while the larger properties (200 or more buses) were not; eight of the10 systems with 1,000 or more buses said that they did not use theschedules.
Span of Service (the Hours at which Service Runs)
Span of service is the hours and days when service operates,i.e., the start of the service day until the end of the service day (or 24-hr service) as well as weekdays and/or Saturday and/or Sunday.Systems have different policies concerning the temporal coveragethat they will provide. Eighty-five percent of the systems respondedto the span of service question. Twenty percent(19) of the respondents stated that they had no
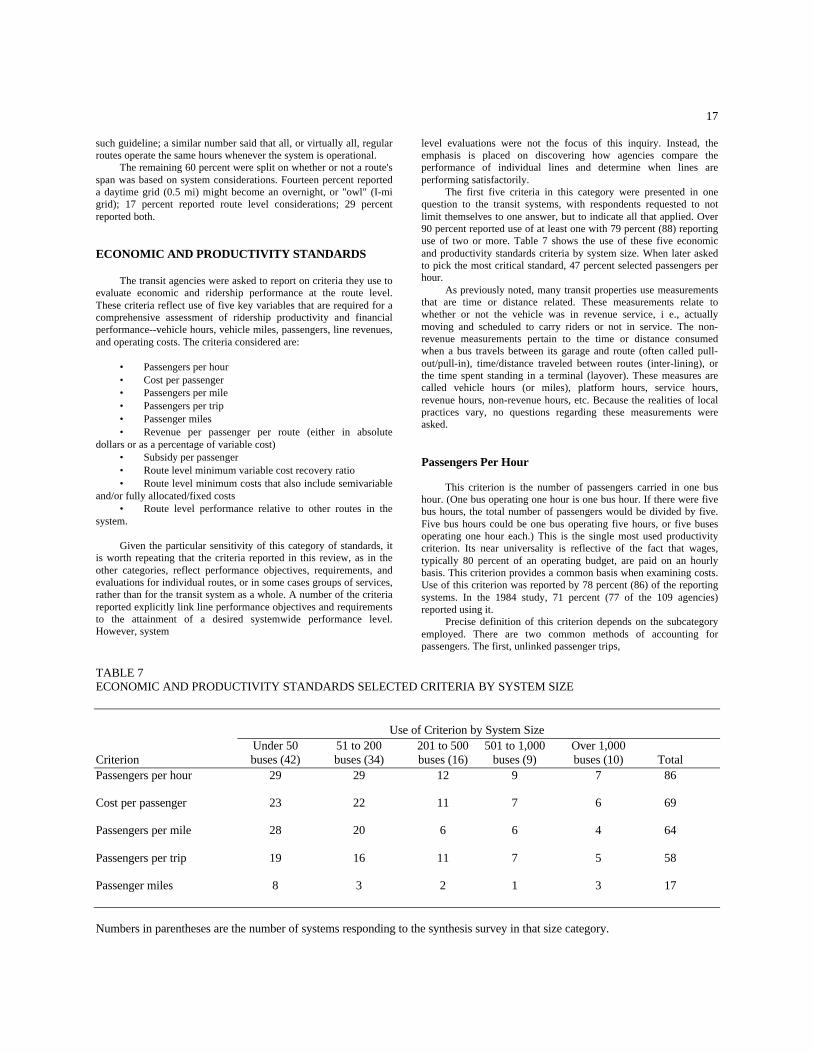
17
such guideline; a similar number said that all, or virtually all, regularroutes operate the same hours whenever the system is operational.
The remaining 60 percent were split on whether or not a route'sspan was based on system considerations. Fourteen percent reporteda daytime grid (0.5 mi) might become an overnight, or "owl" (I-migrid); 17 percent reported route level considerations; 29 percentreported both.
ECONOMIC AND PRODUCTIVITY STANDARDS
The transit agencies were asked to report on criteria they use toevaluate economic and ridership performance at the route level.These criteria reflect use of five key variables that are required for acomprehensive assessment of ridership productivity and financialperformance--vehicle hours, vehicle miles, passengers, line revenues,and operating costs. The criteria considered are:
• Passengers per hour• Cost per passenger• Passengers per mile• Passengers per trip• Passenger miles• Revenue per passenger per route (either in absolute
dollars or as a percentage of variable cost)• Subsidy per passenger• Route level minimum variable cost recovery ratio• Route level minimum costs that also include semivariable
and/or fully allocated/fixed costs• Route level performance relative to other routes in the
system.
Given the particular sensitivity of this category of standards, itis worth repeating that the criteria reported in this review, as in theother categories, reflect performance objectives, requirements, andevaluations for individual routes, or in some cases groups of services,rather than for the transit system as a whole. A number of the criteriareported explicitly link line performance objectives and requirementsto the attainment of a desired systemwide performance level.However, system
level evaluations were not the focus of this inquiry. Instead, theemphasis is placed on discovering how agencies compare theperformance of individual lines and determine when lines areperforming satisfactorily.
The first five criteria in this category were presented in onequestion to the transit systems, with respondents requested to notlimit themselves to one answer, but to indicate all that applied. Over90 percent reported use of at least one with 79 percent (88) reportinguse of two or more. Table 7 shows the use of these five economicand productivity standards criteria by system size. When later askedto pick the most critical standard, 47 percent selected passengers perhour.
As previously noted, many transit properties use measurementsthat are time or distance related. These measurements relate towhether or not the vehicle was in revenue service, i e., actuallymoving and scheduled to carry riders or not in service. The non-revenue measurements pertain to the time or distance consumedwhen a bus travels between its garage and route (often called pull-out/pull-in), time/distance traveled between routes (inter-lining), orthe time spent standing in a terminal (layover). These measures arecalled vehicle hours (or miles), platform hours, service hours,revenue hours, non-revenue hours, etc. Because the realities of localpractices vary, no questions regarding these measurements wereasked.
Passengers Per Hour
This criterion is the number of passengers carried in one bushour. (One bus operating one hour is one bus hour. If there were fivebus hours, the total number of passengers would be divided by five.Five bus hours could be one bus operating five hours, or five busesoperating one hour each.) This is the single most used productivitycriterion. Its near universality is reflective of the fact that wages,typically 80 percent of an operating budget, are paid on an hourlybasis. This criterion provides a common basis when examining costs.Use of this criterion was reported by 78 percent (86) of the reportingsystems. In the 1984 study, 71 percent (77 of the 109 agencies)reported using it.
Precise definition of this criterion depends on the subcategoryemployed. There are two common methods of accounting forpassengers. The first, unlinked passenger trips,
TABLE 7ECONOMIC AND PRODUCTIVITY STANDARDS SELECTED CRITERIA BY SYSTEM SIZE
Use of Criterion by System SizeUnder 50 51 to 200 201 to 500 501 to 1,000 Over 1,000
Criterion buses (42) buses (34) buses (16) buses (9) buses (10) TotalPassengers per hour 29 29 12 9 7 86
Cost per passenger 23 22 11 7 6 69
Passengers per mile 28 20 6 6 4 64
Passengers per trip 19 16 11 7 5 58
Passenger miles 8 3 2 1 3 17
Numbers in parentheses are the number of systems responding to the synthesis survey in that size category.
18
counts each time a person boards a bus as a trip or passenger carried.The second, linked passenger trips, does not count transfers andreflects only the number of completed trips made by riders regardlessof the number of times they must transfer buses to reach their finaldestination. As discussed previously, there are also two commonways of reporting the vehicle hours for a route. The first is to countonly the hours that buses actually spend in-service, excluding non-revenue hours that are not capable of generating ridership. Fashionedthis way, this variable is often referred to as service or revenue hours.When called total vehicle hours, it includes non-revenue hours forvehicles assigned to each line. In the 1984 interviews, most of thesystems reported using the unlinked (total) passenger trips andrevenue hours as variables to establish performance requirements andobjectives.
Cost Per Passenger
Broadly defined, this criterion is the route's costs divided by itsridership. In trying to ascertain the productivity of a route, a keymeasure for a system is determining the cost per passenger on theroute in question. Sixty-two percent (69) of the responding transitsystems use this criterion. In 1984, it was reported by 39 percent (43)of the systems.
Because of the wide variances in systems costs, and especiallybecause some systems focus on variable (also known as marginal orout-of-pocket) costs while others use fully allocated, or fixed plusvariable costs, respondents, when later asked what was their minimalacceptable standard for cost per passenger, were asked to reply interms of the route's relationship to their system's average.
Passengers Per Mile
This criterion is defined as the number of passengers carried inone bus mile. (One bus operating one mile is one bus mile. If therewere five bus miles, the total number of passengers would be dividedby five. Five bus miles could be one bus operating five miles, or fivebuses operating one mile each.) For bus routes that make relativelyfrequent stops, and have the potential of turnover, i.e., as one ridergets off another gets on, passengers per mile is one of theproductivity measures used by transit operators. This performancecriterion was reported by 58 percent (64) of the responding agencies.In the 1984 review, 63 percent (69) of the respondents reportedusing this measure.
The practices reported for this criterion are very similar to thepractices employed to evaluate the passengers per hour criterion,with most of the standards used based on the unlinked (total)passenger trips and revenue (service) miles variables.
Passengers Per Trip
Passengers per trip is the total number of riders on a onewaytrip. Some systems analyze and publish the resulting data on apassengers per trip basis. This criterion was reported by 52 percent(58) of the agencies. About 38 percent (42) of the respondentsreported its usage in 1984.
There were no detailed follow-up questions asked in the surveyconcerning this criterion, and there is no clear explanation for theincrease in use. Seventy-two percent of the systems with between200 and 500 buses used this measure, the others were split 50/50.Because there is no denominator to this computation, other than thetrip (no miles, hours, or cost) the significance of this criterion isconfined to the transit system. It is useful for routes/trips where thereis no on-off traffic, such as an express route. However counter-intuitive as it may seem, this criterion may indeed be the easiest oneto explain to the public, i.e., "there were 21 people on that trip." Thatalone may bespeak its use.
Passenger Miles
Passenger miles are the sum total of passengers carried timesthe total miles operated in a one-way trip. For bus routes that haverelatively little turnover, or that operate at relatively great distanceswith significant loadings, passenger miles are a good measure of aroute's productivity. Fifteen percent of the systems reported use ofthis criterion.
This criterion is best applied to bus routes that are relativelylong and are not expected to have much turnover. This ischaracteristic of express routes and long-distance feeder routes and isan excellent example of a criterion that is best measured internally toa system; it is best not to use it to compare two routes in disparateconditions or systems.
The next four productivity measures are financial criteria andcan be considered refinements of the previous five.
Revenue Per Passenger (Per Route)
Revenues collected on a route divided by total boardings equalrevenue per passenger. Although productivity can be measuredsimply by counting passengers (and then divided by a unit, such ashour or mile), this is not always an accurate reflection, in aqualitative sense, of a route's activity because different fares are paid.Some routes can have disproportionate transfer traffic, such as heavyschool riding (with corollary reduced fares). In turn, many systemsuse this as a measure either as actual revenue or relative to a systemaverage. Of the 69 systems that reported this standard, 87 percent(60) indicated that they used this criterion, and their minimumacceptable revenue per passenger per route was either 25 or 33percent of the system average.
This criterion can be evaluated either as actual revenue orrelative to other routes in the system. For the purpose of thissynthesis, actual revenue dollars have little value outside the transitproperty itself. Respondents were therefore afforded the opportunityto answer as a percentage of variable cost.
Subsidy Per Passenger
The subsidy per passenger criterion is the public fundingrequirement to make up the difference between cost per passengerand revenue per passenger. Just over 50 percent (56) of the systemsresponded to this question.
In most cases, this criterion is simply the reverse of cost perpassenger and is redundant. The measure has two values,
19
however. In systems with variable fares, e.g., express bus premiums,the cost per passenger can be constant across services but thepremium collected makes the subsidy less for the route in question. Itis also easier to explain to the public than cost per passenger whendiscussing subsidy requirements. Of the systems that answered thisquestion, almost 86 percent indicated that 2 to 3 times their systemaverage was the acceptable subsidy per passenger.
Route Level Minimum Variable Cost Recovery Ratio
This ratio is the percentage of direct operating costs for a routethat are recovered through the fares paid by its ridership. Mostsystems have a minimum standard for the percentage of directoperating costs that they expect to be recovered on the route. Thisfinancial performance criterion was reported by about 75 percent(83) of the responding agencies, which was the same percentage inthe 1984 study.
Of the route level minimum variable cost recovery ratio valuesreported, below 25 percent was the most common, with 25 to 40percent next. Only 9 percent (10) of the systems use a minimum atthe route level greater than 40 percent.
Direct operating costs in transit normally include such expensesas operator wages and benefits and variable maintenance costs suchas fuel and consumables (oil, tires) that are required to put buses intoservice. Capital costs and general administrative expenses for suchsupport functions as accounting and marketing are generallyexcluded from the calculation of direct operating costs and areconsidered fully allocated/fixed costs. There is also a middle areacalled semi-variable costs, which is discussed in the next section.
The 1984 report, based on the interviews then conducted,discussed that minimum acceptable cost recovery rates for differenttypes of lines and the answers ranged from 10 to 100 percent. The100 percent requirement was applied by certain agencies tocommuter and suburban express-type services or to lines that operateoutside of the agency's geographical jurisdiction.
Route Level Minimum Costs that also Include Semi-variable and/or Fully Allocated/Fixed Costs
This criterion is the percentage of assigned costs for a route thatare recovered through the fares paid by its ridership. The assignedcosts will, in addition to variable or marginal costs, include semi-variable and/or fully allocated/fixed costs. In addition to theminimum standards for the percentage of direct operating costs thatsystems expect to be recovered on the route, there are times whensystem level costs are included in the allocation as well. Sixty-eightpercent (76) of the systems indicated that on occasion they will usesemi-variable and/or fully allocated costs in their calculations.
There are times when, although an individual route is beingexamined, the examination is taking place in an environment wheremore than one route is under study. A typical scenario is an economyprogram where, because of budget requirements, numerous routes areunder scrutiny. In such cases there is a synergy of savings.Maintenance is an example where
such synergy takes place. Discontinuation of a one bus shuttle route,in and of itself, will not reduce a system's requirements formechanics. But five such savings will (if all the buses were housed,or could have been housed, at the same maintenance facility). Suchsavings that accrue in a step-like fashion are known as semi-variablecosts. Conversely, a small system undergoing a major expansion, forexample from 75 buses to 150, may incur new fixed overhead costssuch as an assistant in the purchasing department.
Route Level Performance Relative to Other Routes in theSystem
A route's percentile rank in an overall ranking of a transitsystem's routes is its route level performance relative to other routesin the particular system. Seventy-five percent of the systems said thatthey use this measure.
There are two ways to view the first nine economic andproductivity criteria: as absolute measures against somepredetermined number(s)/standard(s) or as relative measures, wherethe subject route's performance is measured against the performanceof other routes. At some point in a transit system's history, thiscriterion will be used. Of the responses, 37 percent said that theylooked at the bottom 10 percent of their routes, and 36 percentlooked at the bottom 20 percent. This is not necessarily an economydriven measure. Some systems as part of their evaluation standardswill routinely, on an annualized business basis, look at theirrelatively weak performers and undertake a route level analysis thatwill result in recommendations to strengthen the weaker routes.
SERVICE DELIVERY STANDARDS
The transit agencies participating in the survey were asked toreport on the criteria they use in measuring a route's service asactually delivered to a passenger. Two criteria were reported: 1) on-time performance and 2) headway adherence (evenness of interval).In 1984, of these two measures, only on-time performance (calledschedule adherence) was discussed. It is acknowledged that becauseof sampling requirements to have statistically valid data, somesystems, especially in the area of headway adherence, may sample atthe system, but not the route, level. In other words, they may havecollected enough data to get a good picture of system level activityand performance, but in and of itself, the quantity of data is too smallto be meaningful at the route level. This is reflective of the fact thatoften a system is measuring itself as part of good business practice.
On-Time Performance
The definition of on-time performance varies by operator, butusually deals with deviation of actual operation from the schedule(see Tables 8 and 9, which define parameters used by systems). Thetraditional method for determining service reliability in thetransportation industries has been on-time performance; transit is nodifferent in its historic use of this measure. This criterion wasreported by 77 percent (85) of the systems. In 1984, 84 percent (92)of reporting systems indicated its use.
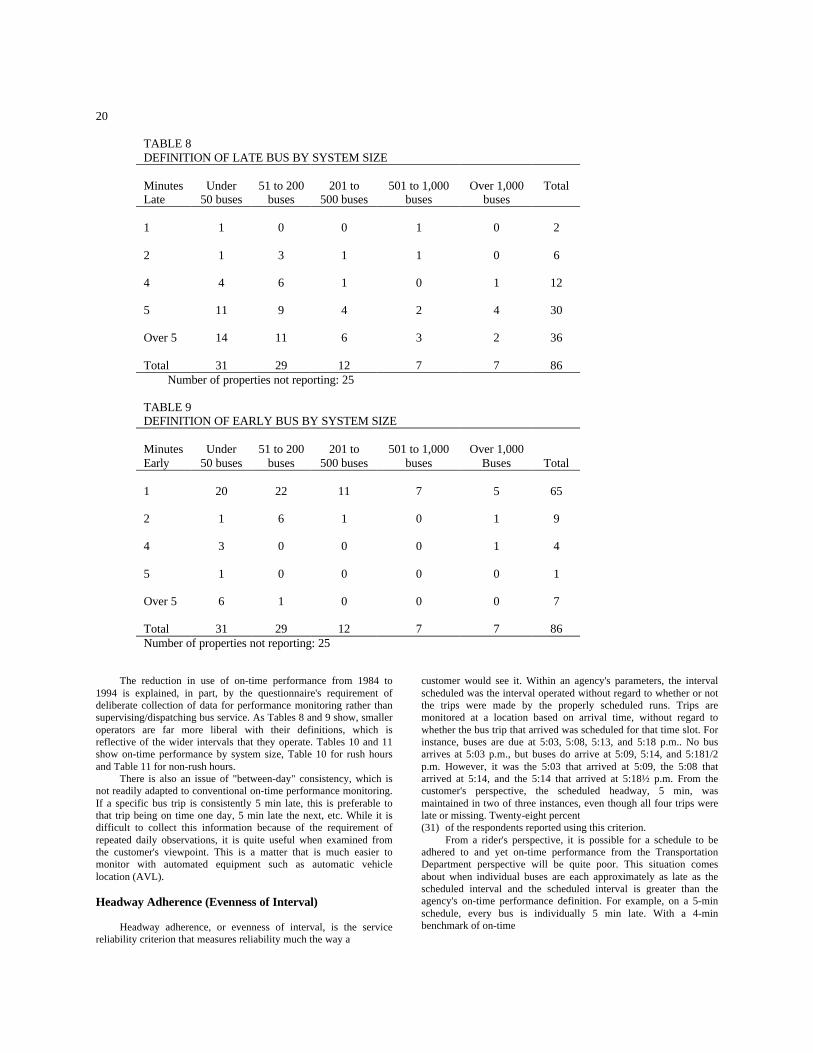
20
TABLE 8DEFINITION OF LATE BUS BY SYSTEM SIZE
MinutesLate
Under50 buses
51 to 200buses
201 to500 buses
501 to 1,000buses
Over 1,000buses
Total
1
2
4
5
Over 5
Total
1
1
4
11
14
31
0
3
6
9
11
29
0
1
1
4
6
12
1
1
0
2
3
7
0
0
1
4
2
7
2
6
12
30
36
86Number of properties not reporting: 25
TABLE 9DEFINITION OF EARLY BUS BY SYSTEM SIZE
MinutesEarly
Under50 buses
51 to 200buses
201 to500 buses
501 to 1,000buses
Over 1,000Buses Total
1
2
4
5
Over 5
Total
20
1
3
1
6
31
22
6
0
0
1
29
11
1
0
0
0
12
7
0
0
0
0
7
5
1
1
0
0
7
65
9
4
1
7
86Number of properties not reporting: 25
The reduction in use of on-time performance from 1984 to1994 is explained, in part, by the questionnaire's requirement ofdeliberate collection of data for performance monitoring rather thansupervising/dispatching bus service. As Tables 8 and 9 show, smalleroperators are far more liberal with their definitions, which isreflective of the wider intervals that they operate. Tables 10 and 11show on-time performance by system size, Table 10 for rush hoursand Table 11 for non-rush hours.
There is also an issue of "between-day" consistency, which isnot readily adapted to conventional on-time performance monitoring.If a specific bus trip is consistently 5 min late, this is preferable tothat trip being on time one day, 5 min late the next, etc. While it isdifficult to collect this information because of the requirement ofrepeated daily observations, it is quite useful when examined fromthe customer's viewpoint. This is a matter that is much easier tomonitor with automated equipment such as automatic vehiclelocation (AVL).
Headway Adherence (Evenness of Interval)
Headway adherence, or evenness of interval, is the servicereliability criterion that measures reliability much the way a
customer would see it. Within an agency's parameters, the intervalscheduled was the interval operated without regard to whether or notthe trips were made by the properly scheduled runs. Trips aremonitored at a location based on arrival time, without regard towhether the bus trip that arrived was scheduled for that time slot. Forinstance, buses are due at 5:03, 5:08, 5:13, and 5:18 p.m.. No busarrives at 5:03 p.m., but buses do arrive at 5:09, 5:14, and 5:181/2p.m. However, it was the 5:03 that arrived at 5:09, the 5:08 thatarrived at 5:14, and the 5:14 that arrived at 5:18½ p.m. From thecustomer's perspective, the scheduled headway, 5 min, wasmaintained in two of three instances, even though all four trips werelate or missing. Twenty-eight percent(31) of the respondents reported using this criterion.
From a rider's perspective, it is possible for a schedule to beadhered to and yet on-time performance from the TransportationDepartment perspective will be quite poor. This situation comesabout when individual buses are each approximately as late as thescheduled interval and the scheduled interval is greater than theagency's on-time performance definition. For example, on a 5-minschedule, every bus is individually 5 min late. With a 4-minbenchmark of on-time
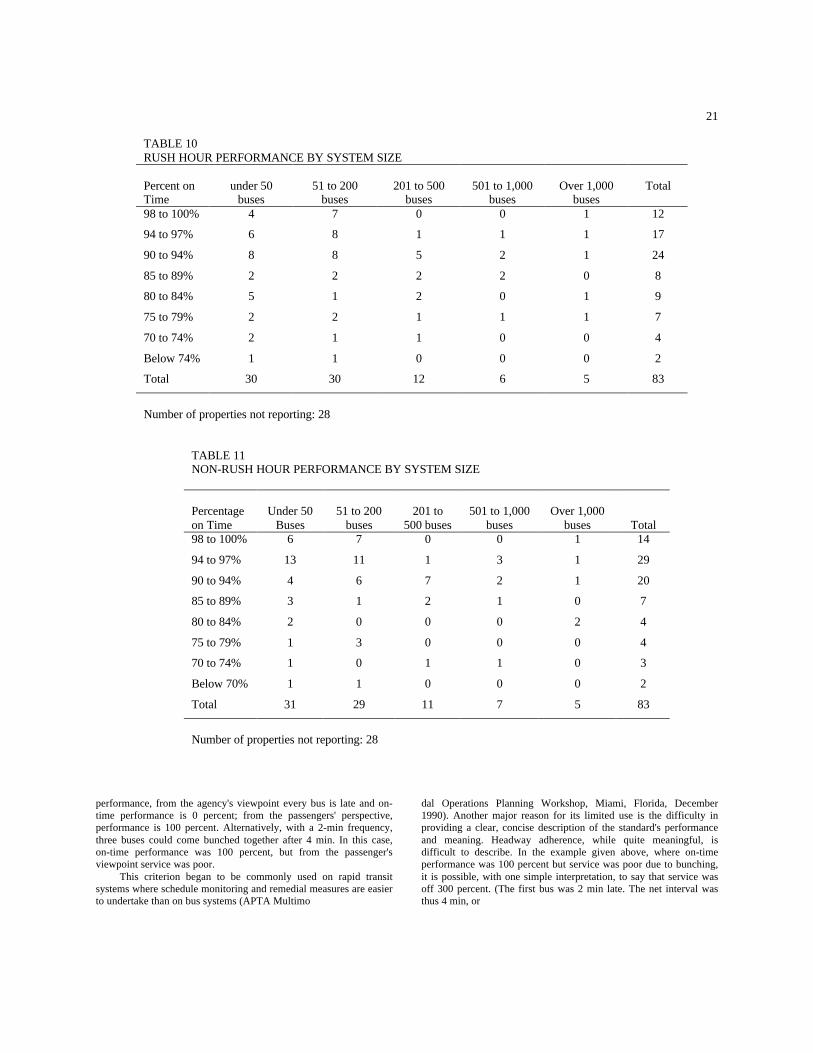
21
TABLE 10RUSH HOUR PERFORMANCE BY SYSTEM SIZE
Percent onTime
under 50buses
51 to 200buses
201 to 500buses
501 to 1,000buses
Over 1,000buses
Total
98 to 100%
94 to 97%
90 to 94%
85 to 89%
80 to 84%
75 to 79%
70 to 74%
Below 74%
Total
4
6
8
2
5
2
2
1
30
7
8
8
2
1
2
1
1
30
0
1
5
2
2
1
1
0
12
0
1
2
2
0
1
0
0
6
1
1
1
0
1
1
0
0
5
12
17
24
8
9
7
4
2
83
Number of properties not reporting: 28
TABLE 11NON-RUSH HOUR PERFORMANCE BY SYSTEM SIZE
Percentageon Time
Under 50Buses
51 to 200buses
201 to500 buses
501 to 1,000buses
Over 1,000buses Total
98 to 100%
94 to 97%
90 to 94%
85 to 89%
80 to 84%
75 to 79%
70 to 74%
Below 70%
Total
6
13
4
3
2
1
1
1
31
7
11
6
1
0
3
0
1
29
0
1
7
2
0
0
1
0
11
0
3
2
1
0
0
1
0
7
1
1
1
0
2
0
0
0
5
14
29
20
7
4
4
3
2
83
Number of properties not reporting: 28
performance, from the agency's viewpoint every bus is late and on-time performance is 0 percent; from the passengers' perspective,performance is 100 percent. Alternatively, with a 2-min frequency,three buses could come bunched together after 4 min. In this case,on-time performance was 100 percent, but from the passenger'sviewpoint service was poor.
This criterion began to be commonly used on rapid transitsystems where schedule monitoring and remedial measures are easierto undertake than on bus systems (APTA Multimo
dal Operations Planning Workshop, Miami, Florida, December1990). Another major reason for its limited use is the difficulty inproviding a clear, concise description of the standard's performanceand meaning. Headway adherence, while quite meaningful, isdifficult to describe. In the example given above, where on-timeperformance was 100 percent but service was poor due to bunching,it is possible, with one simple interpretation, to say that service wasoff 300 percent. (The first bus was 2 min late. The net interval wasthus 4 min, or
22
200 percent of 2 min. The second bus was on time. The third bus was2 min early so it is 100 percent off (200 + 0 + 100 = 300).) Thosethat use headway adherence use it largely for internal purposes, i.e.,not necessarily publicly reported as other measures. Over 80 percentof those who do use it have been using it for more than 3 years. Theinroads made in the last several years in the area of AVL will makethe data more accessible. This, in turn, will bring more attention tothe criterion.
PASSENGER COMFORT AND SAFETY STANDARDS
There are potentially six criteria in this category. In 1984, thiscategory was called "Service Quality" and covered factors in theother categories as well, including schedule adherence, vehicle loads,and vehicle headways. For this synthesis, the six criteria in thiscategory are:
• Passenger complaints• Missed trips• Unscheduled extras• Accidents• Passenger environment conditions (e.g., vehicle
cleanliness, vehicle condition, missing stanchions, blank destinationsigns)
• Special information (or special intervals) in areas whereriders do not feel secure waiting for buses.
Passenger Complaints
Passenger complaints are records kept on route levelcomplaints over some unit of measure, such as complaints per 1,000boardings. A measure of a route's performance is the volume ofcomplaints drawn from customers. In 1984, this criterion wasreported by 55 percent (60) of the agencies participating in the study
In the current survey, the question was phrased: "Do you keeproute level information on complaints in a manner other than just alisting, i.e., complaints per mile, or per 1000 boardings?" Sixty-fivepercent (72) of the reporting systems said they did not.
Missed Trips and UnscheduledExtras
This criterion is defined as trips that are either added to, orremoved from, the daily schedule, other than routine schedulechanges (e.g., picks, sign-ups, line-ups). Daily operations aredynamic, and although there is an established predeterminedschedule, often scheduled trips are either missed (e.g., due tomechanical failure or inordinate driver absences), or trips are added(e.g., special events at arenas, early school discharges--these arecommonly called extras). More than 60 percent (67) of the systemsresponded affirmatively to the question regarding data collection onmissed trips and unscheduled extras. In
1984, 47 percent (51) of the responding agencies said that theymonitored this service quality criterion, they were not asked aboutunscheduled extras in 1984.
Accidents
An accident involves either personal injury or property damage.Evaluation of accidents on the route level, whether by mile orpassenger, can reveal relative anomalies in a routing For example,high accident rates on a clockwise turn-around operation might bereflective of difficult right turn movements; counter-clockwise turnmovements might reduce the hazard Sixty-five percent (72) of thetransit systems stated that they collect route level accident data. In1984. 58 percent (63) of the agencies used this criterion.
Safety is a universal concern in the transit industry, pervasivethrough every department, and is certainly monitored by all agenciesin some way. Thus, it has a role in the bus route evaluation process.
Passenger Environment Conditions
This bus route evaluation criterion for passenger comfort andsafety measures the overall physical environment a passenger willencounter on board the bus, including vehicle cleanliness, vehiclecondition, missing stanchions, and blank destination signs. Use ofthis criterion was reported by almost 50 percent(55) of the agencies.
Approximately one-half of the agencies seek to collect data onthis standard with either field surveys conducted byadministrative/management staff, structured surveys conducted bytraffic checkers with formal training in the survey instrument, ormarket research, either general or conducted by focus groups.
Special Information (or Special Intervals) in Areas WhereRiders Do Not Feel Secure Waiting for Buses
This criterion is defined as bus operations on given routes thatare different than they would be otherwise because of security needs.With increases in street crime (not on board vehicles), some systemsoperate their buses differently at certain time periods or in certainareas to either minimize passenger waiting at regular bus stops or toavoid regular bus stops altogether. About 7 percent (8) of therespondents reported engaging in this practice.
This measure, which could be viewed as a routing/bus stop orschedule criterion rather than a passenger safety measure, has comeinto practice in the last 6 or 8 years Some systems call it "request-a-stop" where alighting riders can request to be let off closer to theirhome or job. Three of the eight respondents to this criterion wereCanadian (one-half of the Canadian respondents). This practice canalso be used for safety, rather than security related matters, such asdifferent stops in inclement weather, so as to avoid boarding andalighting on ice patches.
23
CHAPTER FOUR
THE ADMINISTRATION OF BUS SERVICE EVALUATION ACTIVITIES
This chapter examines transit industry bus service evaluationpractices from an organizational perspective. The chapter begins witha discussion of the status of service standards and the change in thisstatus since 1984. This is followed by a section on the basicorganization of service evaluation activities in terms ofdepartmental/institutional responsibilities. A discussion of thebenefits and results obtained by agencies examined in the industryreview concludes the chapter.
THE STATUS OF SERVICE STANDARDS ANDCHANGES IN STATUS SINCE 1984
The service standards criteria reported by agencies participatingin the industry review have either formal or informal status. Asshown in Table 4 (see Chapter 3), the larger the system the morelikely its formal adoption of service standards; adoption was alsomore likely on the West Coast than in most other regions (exceptFederal region V, Ohio to Minnesota).
Because there was only a 28 percent repeat response ratebetween the two studies, i.e., agencies that participated in both the1984 and 1994 surveys, it is not possible to reliably track formalstandards adoption other than at the general system size level. Eventhen, comparison is difficult because the size groupings aresomewhat different. Nevertheless, there is a pattern.
Since 1984, the adoption of standards by small and medium-sized system standards is virtually unchanged (59 and 79 percent,respectively, in 1984; and 57 and 80 percent, respectively, in 1994).Large systems, however, changed from 70 to 95 percent. Again,however, the comparison cannot be precise; for example in 1984,when adoption of discrete criteria was reported, the large systemsreported some criteria at 100 percent level. Still, with a 25 percentincrease in overall adoption, the trend in large, over 500 bus systemsis clear.
Reasons for this are numerous and anecdotal, but they basicallydeal with the necessity of a publicly open process--something thatbegan after the prior report's data collection efforts. Large systems, inintense media markets, felt the need for formal adoption of standardsto withstand the scrutiny of public interest (3).
THE ORGANIZATION OF BUS SERVICEEVALUATION ACTIVITIES
An important objective of this synthesis was to examine theorganization and administration of bus service data collection,evaluation, and monitoring activities. Responsibility for the varioustasks and activities that are required to conduct evaluations of busservice performance criteria historically have been spread overseveral work units (directorates,
departments, divisions, branches, or offices) with no single unithaving total responsibility for all criteria. This is not surprising giventhat the agency's mission is to operate service. Evaluation, oroversight, will be spread throughout the agency as well, although notexpansively. In some instances, separate departments haveconsiderable responsibility for certain criteria and rely little on otherdepartments for assistance or coordination. In other cases,departments within an agency cooperate and share the responsibilityfor the monitoring and evaluation of performance criteria. Onedepartment may be required to collect performance data that isforwarded to another department for processing. The processed datamay then be sent to another department where it is assessed andevaluated. An exception to this pattern occurs within a number ofsmall systems where staff sizes do not lend themselves readily to agreat deal of decentralization. These agencies tend to centralizeactivities within one or two departments such as operations, finance,or the office of the director or general manager. A number oforganizational structures were reported by transit systems to describethe administration of their bus service evaluation activities. It ispossible, however, to identify several general patterns.
Route Design Criteria
It is common for planning departments to assume the majorresponsibility for evaluation activities relating to route designcriteria. Planning departments are responsible for obtaining thepopulation and land use data that are required to evaluate thesecriteria. These departments frequently lead in the administration ofother data collection efforts, such as passenger surveys and cordoncounts, which are required on a special or infrequent basis. Planningdepartments work closely with other areas such as scheduling,transportation, and marketing because they frequently providesupportive data to conduct evaluations of route design criteria andtheir functions are likely to be impacted by route design decisions.Where separate planning departments do not exist at some smalleragencies, the evaluation of these criteria is normally theresponsibility of the agency's schedulers and/or transportationdepartment. In large agencies, planning (or at least service planning)and scheduling are often in one department, typically calledoperations planning. In some agencies these responsibilities areassumed by an administrative staff or by the system's executiveoffice staff.
Schedule Criteria
Depending on the specific criteria under consideration,different departments are charged with responsibility forperformance evaluations. Vehicle loads, vehicle headways, and
24
span of service criteria are usually the responsibility of an agency'sschedulers and/or planners. Where planners are responsible forconducting evaluations, they rely to a large extent on data obtainedby the scheduling department. Passenger transfer criteria are oftenthe evaluation responsibility of an agency's planning area, which mayrely on data collected by transportation and scheduling departments.The service reliability criteria of on-time performance are often theresponsibility of transportation or scheduling departments withoccasional support from maintenance records to evaluate the missedtrips criteria.
Economic and Productivity Criteria
The two functional areas most often assigned majorresponsibilities for evaluating bus services' financial and ridershipperformance are planning and finance/accounting. The majorresponsibility for data collection, however, often falls totransportation and, sometimes, scheduling departments. Even thosesystems that rely on revenue-based ridership estimation methodsusually involve bus operators or other transportation personnel in thecollection of these data. A common example of this is the use of busoperators to record the meter readings from revenue-registeringfareboxes. Vehicle mileage and operating hours data are normallycompiled by scheduling departments for each pick or service change,with the mileage and hours lost due to such things as breakdowns andmissed trips usually reported by an agency's transportation ormaintenance area.
Service Delivery Criteria
Data collection, not for supervision or dispatch purposes, isdone by regular street dispatchers/supervisors (starters) conducting aspecial assignment, dedicated transportation department personnel, ortraffic checkers. This process can be automated via automaticpassenger counters (APC) or AVL. The data are analyzed in eithertransportation, scheduling, or planning departments.
Passenger Comfort and Safety Criteria
Evaluation of passenger comfort and safety criteria isconducted by the groups listed for the four previous criteria (exceptfor finance). Safety and marketing staff are also involved in thisprocess.
In trying to ascertain which work units were involved in theevaluation process, the questionnaire also asked numerous questionsabout the process of collecting and analyzing data. Historically, fromthe industry's earliest days, staff called traffic checkers collecteddata, and these staff were often from the schedule department. Atmany systems, the schedules work unit used to be called theSchedules and Traffic Department or Traffic.
In the medium and large systems as policy intervals wereplaced on numerous routes, the traffic checking force was reduced.With tight budgets, departments were reduced in size
before service itself was cut back, and this contributed to furtherreductions in the checking force. Beginning in the 1970s, somesystems became automated. Initially, this impacted the clerkingforce, i.e., the individuals who summarized the raw data collected byindividuals. In some locations, checkers began filling out optical scansheets that could be machine read, hand-held devices that could bedown-loaded into computers (pre-PC) also came into use. Thechecking function itself was automated at some systems with APCs.More than automating existing staff functions however, theseactivities permitted a re-expansion of the amount of data collected.Weekend surveying, which is infrequent at best, became morepractical. Appendix E consists of cross-tabulations, by system size,of various aspects of the traffic checking and clerking functions. Notsurprisingly, except for the largest systems, there are very fewsizeable (6 or more) full-time checking forces. Of the 111respondents to the 1994 survey, only 15 percent (17) had 6 or morefull-time checkers. Appendix F consists of a cross-tabulation ofselected operating data collection practices by system size.
THE EFFECTIVENESS OF BUS SERVICEEVALUATION ACTIVITIES
An objective of this synthesis was to survey the effectiveness ofbus service evaluation efforts being undertaken by U.S. andCanadian transit systems. To report this finding, the questionnairehad a stated preference scale, identical to the one used in 1984, butwith five rather than 10 gradations. These questions were employedto measure an agency's perceived effectiveness of these programs inimproving four service related factors for its system: 1) servicedelivery, 2) service equity, 3) ridership, and 4) operating costs.Systems were asked to provide a rating or score for each of thesefactors, ranging from one through five, with one reflecting thegreatest degree of perceived effectiveness for a particular factor.
In 1994, 84 percent (93) of the surveyed agencies respondedto the scaling question on these four factors. Of these 93 systemsthere were 30 small, 45 medium, and 18 large systems. (In 1984, ofthe 109 respondents, 60 percent (65) responded to these questions--38 small, 15 medium, and 12 large agencies.)
Analysis of these four factors reveals an average ratings rangeof between 1.8 and 3.3, or mid-range responses. In both studies, thehighest ratings for effective standards were received in the areas ofservice delivery and operating costs factors. Of the various systems,the medium-sized group (between 201 and 500 buses) reported thehighest average rating score for all of the factors. It is interesting tonote that in 1984, the ridership factor experienced the lowest scoresfor the groupings; in 1994, it was service equity. While the scales arenot precisely comparable, trends are discernible. Excepting serviceequity, all of the factors rated relatively higher in 1994 than their1984 counterparts. Service equity not only scored lower than theridership factor in 1994, it scored lower than it did in 1984.
25
CHAPTER FIVE
CONCLUSIONS AND RECOMMENDATIONS FOR FUTURE RESEARCH
Evaluation standards have progressed considerably from thedays of horse-car or omni-bus lines when the main criteriaconsidered were how much money a trip brought in, was the trip wasprofitable, and was the vehicle able to accommodate passengers.
In 1984, 15 criteria for bus route evaluation standards werestudied; in 1994, the number increased to 44. A growing number oftransit operators, particularly at the larger systems, have formallyadopted evaluation standards. Agencies are using evaluation tools toprovide to both themselves and the public a better understanding ofwhere resources are being applied, how well services are beingdelivered, and how well these services are used. Along with assistingin service deployment decisions, including providing justification forservice changes, standards are also providing the requisite analyticaltools that agencies need to upgrade the quality of existing service.
Bus route evaluation standards are evolutionary. The more theindustry deals in their use, the better the industry understands theirindividual application; the increase in the number of evaluationcriteria, as presented in this synthesis, largely reflects the change inuse An “old” (1984) criterion might now be used as two or threediscrete criteria, e.g., minimum intervals and duration of standeetime, two separate criteria in 1994, were grouped together under“Service Quality” in 1984. These changes in use, as well aslegislation, such as the Clean Air Act Amendments of 1990 (CAAA)and the Americans with Disabilities Act (ADA), have caused trendsin route level evaluation to emerge in the past 10 years.
EMERGING TRENDS
It is apparent from the expansion in individual criteria forschedule design standards, service delivery standards, and passengercomfort and safety standards that there has been an increase incustomer orientation and satisfaction. While these are generallysystem level concerns, they are only meaningful to riders whilecarefully applied at the route level. This in turn requires route levelassessment and evaluation to ensure proper application. It is useful toreemphasize that there are system level standards, and while notapplicable or seemingly meaningful at the route level, (e.g., therelationship of route level evaluation standards to the IntermodalSurface Transportation and Efficiency Act of 1991 (ISTEA)), theservice performance of individual routes taken together produce thisstandard. An example of such a measure would be transit’s marketshare. But market share can only increase if customer satisfactionderived at the route (actually trip) level increases.
Understanding the need to focus from the customers’perspective, measuring customer satisfaction against non-similartransit systems has developed. More systems in multi-operatorregions are comparing their performance with operators of
other sizes and even other customer service industries. Becausepassengers judge their satisfaction by what they see on other carriers,cross-size systems evaluations have begun to emerge, with theadoption of route level standards that previously seemed appropriatefor other size systems. Because such standards are being employed atthe route level where the customers are, such comparisons andevaluation techniques can be applied. It is thus anticipated that theindustry will adapt its waiting time standard to be more akin to thosein industries where customers are won by minimizing waiting time.
Given the ADA's complementary paratransit requirement,circumstances can be foreseen under which, based on the route'sperformance as measured by the evaluation standards selected by thetransit system, it may be more effective to provide service in thecorridor as a paratransit service available to the general public. It isanticipated that, as an emerging trend, the general evaluationstandards seen in 1984 and 1994 may evolve to include measures forparatransit suitability/substitution as well.
Because route level evaluation standards are often used forroutes that operate together in a common corridor (and the route levelevaluation standards are then used as corridor level evaluationstandards), it is both logical and likely that measures will bedeveloped by transit systems to ascertain at the route/corridor levelthe interrelationship between the route and the 1990 CAAA. Thiswill be especially true for those systems with routes that operate indesignated areas with air quality problems.
Lastly, it can be expected that evaluations will take place moreoften. Especially as route level data become more readily available,particularly with regard to service reliability information, the trend ofincreasing data collection is expected to continue. It is anticipatedthat with new technology and more sophisticated reportingcapabilities, this information will be collected more often and morecost effectively, thereby being employed more frequently by theindustry. An example of the application of new, smart technology toimprove service performance monitoring will be its use to addresssuch issues as "same-day" consistency.
Much like a census, it is important to monitor progress in thisfield by conducting periodic updates such as this synthesis. Inaddition to a general update of the state of the art and a close watchof emerging trends, a particular area to monitor is that of "waitingtime versus route level real time information." Because drivers getinto their cars spontaneously, they expect much the same of transit.Although when viewed from a policy standpoint it appears to be asystem level issue, transit's increased use of AVL systems will createanother route evaluation issue and new opportunities.
AVL will be bringing real time information down to the busstop level. Bus route evaluation issues will likely include how toselect between routes when initially installing the system, what routelevel standards will determine this, and

26
further, does a wait become more tolerable to an intending passengerwhen real time information is provided? Particularly in light of theimpending proliferation of real time information, new research onpassenger waiting attitudes may be appropriate. As congestion inmany systems shows no sign of decreasing, which may lead toincreased use of
transit in some form, systemwide increases reflected on a route basismay be explored in detail in the future based on this technology.
Simply because changes, foreseen and unforeseen, routinelyhappen, it is suggested that bus route evaluation standard reviews beundertaken more routinely in the future.
27
REFERENCES
1. Metropolitan Transit Authority of Harris County(METRO), Bus Service Evaluation Methods: AReview, Office of Planning Assistance, Urban MassTrasit Administration, U.S. Department ofTransportation, Washington, D.C., 1984.
2. Koski, R.W., "Bus Transit," in Public Transportation(G.E. Gray and L.A. Hoel, eds.), Prentice Hall, NewJersey, 1992.
3. Barton-Aschman Associates, Inc., ComprehensiveOperations Analysis of the Bus System, HonoluluPublic Transit Authority, Hawaii, 1993.
BIBLIOGRAPHY
Canadian Transit Handbook, 2nd ed., Canadian UrbanTransit Association and the Roads and TransportAssociate of Canada, 1985.
Levinson, H.S., NCTRP Synthesis of Transit Practice 15:Supersvision Strategies for Improved Reliability ofBus Routes, Transportation Research Board, NationalResearch Council, Washington, D.C., 1991.
NCHRP Synthesis of Highway Practice 69: Bus Route andSchedule Planning Guidelines, TransportationResearch Board, National Research Council,Washington, D.C., 1980.
28
APPENDIX A
1984 Survey Instrument
THE 1984 QUESTIONNAIRE
AUTHORITY
DESCRIPTION
SIZE OF SERVICE AREA [sq. miles]
POPULATION OF SERVICE AREA
TOTAL NUMBER OF BUSES
NUMBER OF UNLINKED PASSENGER TRIPS [FY80]
NUMBER OF REVENUE BUS MILES [FY80]
NUMBER OF BUS ROUTES
SIZE OF TRAFFIC CHECKER FORCE
REVIEW OF EVALUATION PROCEDURES
Property's perceived effectiveness of evaluation efforts in improving service delivery,promoting equity in service distribution, increasing ridership, and reducing operating costs.
SERVICE DELIVERY ..... 1 2 3 4 5 6 7 8 9 10
EQUITY .......................... 1 2 3 4 5 6 7 8 9 10
RIDERSHIP...................... 1 2 3 4 5 6 7 8 9 10
OPERATING COSTS ..... 1 2 3 4 5 6 7 8 9 10
COMMENTS
PROBLEMS ENCOUNTERED
PERFORMANCE CRITERIA UTILIZED
FORMAL STANDARD INFORMAL STANDARD PROPOSED STANDARD MONITORCRITERIA ONLY
29APPENDIX B
1994 Survey Instrument
TRANSIT COOPERATIVE RESEARCH PROGRAM
SYNTHESIS PROJECT SA-1
BUS ROUTE EVALUATION STANDARDS
QUESTIONNAIRE
Bus Route Evaluation Standards are indicators that measure the quality and quantity of serviceoffered by a public transit system's bus routes. They include a number of items that determine,as well as reflect, the manner In which transit systems offer service to the public, and are oftendirectly related to the costs of service provision.
This project will compile current industry practice in the form of a synthesis. It will be anupdate of Bus Service Evaluation Methods: A Review -- published in 1984 by the U. S.Department of Transportation based largely on data obtained In 1981. That study analyzed thencurrent practices in the industry. The 1984 study itself was an update of a 1979 report BusService Evaluation Procedures: A Review.
Certain of the 1984 standards are no longer applicable in today's changed environment, andrevised and completely new standards have come to play in recent years, particularly in theareas of service delivery and performance monitoring. It is the intent of this Synthesis tocollect data from transit properties from around the country, to present these data in light ofrecent developments, and to produce a report that will serve the Industry with 'tools' until thenext update. It is not the purpose of this effort to critique a transit propertv. Rather, we wish todetermine, in part from this questionnaire, what it is that you/your propertv does in the area ofbus route (not system) evaluation standards and how you undertake these efforts. Additionally,by comparing the results of this effort with those of the prior study, we will try to determinetrends in bus route evaluation methods and procedures.
In order to reduce questionnaire processing costs, we are using general purpose bubble/opticalscan sheets that are normally geared to an individual's response, not that of an organization's.Please ignore the lower left-hand corner where demographic information is requestedexcept for the identification number. In the identification number boxes, A - J, In a right-justified fashion, please enter your section 15 ID number. Where last name/first name isrequested In the upper left-hand corner, please place, left-justified, your organization's name.Please use a number 2 'lead' pencil or equivalent. In addition, we are requesting certainadditional materials and your comments (requests for comments or materials are interspersedthroughout the questionnaire). Comments should be typewritten/word-processed on youragency's stationery. An extra optical scan answer sheet Is provided if a mistake is made on thefirst one.
2
A. NAME OF AGENCY1 ______________________________________________________Contact person _______________________________________________________________Address _____________________________________________________________________ _____________________________________________________________________ _____________________________________________________________________ _____________________________________________________________________Telephone no.______________________ Fax no ____________________________________Section 15 ID number ___________________________________
The number of each item or question Is keyed for the answer sheet. As appropriate, pleasedraw your answers from your Section 15 FY 92 submittal. Where more than one circle shouldbe darkened in an answer, it is indicated; there are times when it will either be appropriate foryou to leave a question blank or you may not wish to answer a question.
We are genuinely interested in hearing about your system and your use of standards, or assome call them, guidelines (in this questionnaire the terms are used interchangeably). Westrongly invite your comments. Please tell us if in development of your standards if they werekeyed to your best performers or your median performers or something else. Tell us aboutmeasures that you use that we didn't ask about. Tell us what you would like to see asked nexttime; where transit research In this area should head. Tell us what's useful and what is not. Arestandards effective in improving transit systems? Do they effectively measure your routes' (andsystem's) performance?
This page (number 2), your comments, materials you wish to transmit and completed scansheets should be sent to:
Howard BennChief Transit Operations/Planning Officer
Barton-Aschman Associates, Inc.The Parsons Transportation Group
1133 15th St., NWWashington, DC 20005-2701
phone (202) 775-6066 fax (202) 775-6080___________________________
1 Where service is provided by a contractor, public or pnvate, the name, address andphone numbers of the contracting public agency should be provided if it is they who establish,by either board or agency staff action, the service standards or guidelines. Otherwise, theoperator/contractor is requested to complete it.
30
APPENDIX B (Continued)
3
B. SERVICE AREA/PROPERTY DESCRIPTION
1] Size of service area (square miles)a]under 50 sq. mi. b]50-100 sq. mi. c]100-200 sq. mi. d]200-500 sq. mi.e]over 500 sq. mi.
2] Population of service area (1990 census)a]under 50,000 b]50,000-100,000 c]100,000-250,000 d]250,000-750,000e]over 750,000
3] Total number of annual unlinked passenger trips (boardings) [Section 15 FY 92]a]under 500,000 b]500,000-5,000,000 c]5,000,000-25,000,000d]25,000,000-75,000,000 e]over 75,000,000
4] Total number of annual linked passenger trips (boardings)2 [Section 15 FY 92]a]under 500,000 b]500,000-5,000,000 c]5,000,000-25,000,000d]25,000,000-75,000,000 e]over 75,000,000
5] Annual number of revenue bus miles [Section 15 FY 92]a]under 125,000 b]125,000-1,250,000 c]1,250,000-6,250,000d]6,250,000-18,750,000 e]over 18,750,000
6] Annual number of "passengerxaverage passenger trip length In miles"(i.e., passengerxmiles. Not passengers per mile)
a]under 3,000,000 b]3,000,000-30,000,000 c]30,000,000-150,000,000d]150,000,000-500,000,000 e]over 500,000,000
7] Total number of required peak period busesa]under 50 b]51-200 c]201-500 d] 501-1000 e]over 1000
8] Spare ratio (as a percentage of total number of required peak period buses)a]under 10%b]10-12% c]13-17% d] 17-20% e]over 20%
9] Number of individual bus routes3
a] 10 b]10-25 c]26-50 d] 51-75 e]over 75
10] Number of bus operators/mechanics/first level supervision4
a] under 50 b]50-199 c]200-499 d]500-1499 e]over 1500
_______________________2 Please use multi-modal linked boardings if known.
3 As a nder would count them. If, for example, schedules for two routes that are through-routed arecounted by the schedules department as one product but a rider on the street would count it as two, pleasereport it as two routes.
4 Maintenance supervisors, street supervisors/dispatchers, control center/command centersupervisors, etc.
4
11] Are you a multimodal property (bus and rail)?a] yes b] no
C. DATA COLLECTION
Staffing/Automation
12] Please darken the appropriate circle:a] data is collected by In-house staff b]data Is collected by contract
servicesc] data not collected
13] Please darken the appropriate circle:a] all traffic checking is manualb] manual traffic checking is assisted by hand held devicesc]automated passenger counters (apc) are used entirelyd]apc's are supplemented by traffic checkers and/or hand held devices collectione]fare boxes
14] Size of full time traffic checker forcea] 0 b] 1-5 c] 6-11 d] 12-20 e]over 20
15] Size of part time traffic checker forcea] 0 b] 1-5 c] 6-11 d] 12-20 e]over 20
16] Do you have a dedicated traffic clerking force5
a]yes - under 4 b]yes - over 4 c]no
If you answered yes, a or b, please go to question #18
17] Is your traffic clerking function combined with the duties ofa]service analysts/planners b]schedulemakers c]traffic checkers
-or-d]totally automated, with a completed product going to planners, analysts and schedulemakers
________________________________5 Traffic clerking is the function of summarizing and analyzing traffic checks when the
checks come into the office.
31
APPENDIX B (Continued)
5
Operating Data Collection Practices
18] Frequency of typical route level weekday point6 checksa]1 set7 per pick per year b]2 sets per pick per year c]1 set per alternate
pick d] once per year e] every other year or less frequently
19] Your property's definition of a seta]1 b]2 c]3 d]4
20] Frequency of route level Saturday point checksa]1 per year b]2 per year c]every other year d]every third year e] hardly ever
21] Frequency of route level Sunday point checksa] 1 per year b]2 per year c]every other year d]every third year e] hardly ever
22] Frequency of typical route level weekday ride8 checksa] 1 set per pick per year b]2 sets per pick per year c]1 set per alternate pickd] once per year e] every other year or less frequently
23] Frequency of route level Saturday ride checksa] 1 per year b]2 per year c]every other year d]every third year e] hardly ever
24] Frequency of route level Sunday ride checksa] 1 per year b]2 per year c]every other year d]every third year e] hardly ever
25] Frequency of statistically valid9 'ride' checks on what your property considers to bea major route
a] 2 per year b] once per year c] every other year d] every third year or less
26] Frequency of route level weekday running time checksa]l set per pick per year b] 2 sets per pick per year c]1 set per alternatepick d] once per year e] every other year or less frequently
27] Frequency of route level weekend running time checksa] 1 per year b]2 per year c]every other year d]every third year e] hardly ever
________________________________
6 At individual locations
7 Some properties will check a schedule only once per pick. Some will check twice per pick andaverage them if they are reasonably close to each other. In this case 'two' individual checks constitute oneset. Other properties use 3 or 4 individual checks to constitute a set. In question 20 you are asked whatconstitutes a set at your property.
8 A check where either a person or device rides a bus trip in its entirety, from terminal to terminal (ordesignated location to designated location).
9 On extremely frequent routes, i.e., 2 to 4 minute frequencies, a 25% to 30% sample size would beconsidered statistically valid.
6
28] Treatment of holiday schedulesa] as a Saturday schedule b] as a Sunday schedule c]both Saturday and Sundayas appropriate d]special schedules written e] c and d
29] Data (ridership and/or running time) for holiday schedules, specially written orotherwise, is collected
a] yearly b]every other year c]every third year d] hardly ever
30] In collecting route level information/data, does your property regularly use any of thefollowing techniques with riders (darken all that apply)
a] focus groups b] general market research (telephone, post card) c]on-boardsurveys d]media based surveys e]meetings with organized riders' groups orcommunity councils/boards
31] In collecting route level information/data, does your property regularly use any of thefollowing techniques with bus operators (darken all that apply)
a]operator quality 'circles' b] TQM (Total Quality Management) c]special union-management meetings d]route or garage based teams or task forces e]employeesuggestion plans or comment process
In the comments section please tell us if you handle peak hours differently than non-peak hours andhow you handle your requirements for section 15.
D. ADOPTION PROCESS FOR STANDARDS (GUIDELINES)
32] Does your property have formal guidelines in any of the following areas: route design, schedule design,productivity or service delivery?
a] yes b]no
If you answered yes, go to question 33; if you answered no go to #35
33] Were they adopted by your governing board?a] yes b]no
34] If you answered no to #33, who were they adopted bya]Executive Director/General Manager b]head of transportation/operationsc)head of schedules/service planning d]other
35] If you answered no to #32 do you havea]documented informal standards 'adopted' by either schedules/service planningor transportation/operations b] policy from the Executive Director/GeneralManager c]proposed standards/guidelines d]none of the preceding
STANDARDS (GUIDELINES)(Answer these sections only if, formally or informally, your property uses guidelines/
standards. If not skip to section H.)
32
APPENDIX B (Continued)
7
E. ROUTE DESIGN STANDARDS
36] Which of the following factors does your property use in its route design (geographiccoverage) guidelines (answer all that apply)
a]population density b]employment density c]spacing between routes/corridorsd]limitation on the number of deviations e]equal coverage through local tax base
37] In initially approaching the design of individual routes, routes are:a] first designed on their own, and then integrated into the systemb] existing system solutions are sought first, from which a new routing may evolvec] either a] or b]
38] Which one answer best describes the primary design element of new and/or revisedroutings in your system:
a] service to unserved areas b] network connectivity c] system designconsiderations (enhancement of pulse meets, etc.)d] streamlining/reduction ofrouting duplications e] service equity10
39] Which one answer best describes the primary design tactic of new and/or revisedroutings in your system:
a]direct, non-circuitous routings b] service proximate to as many residences aspossible c] service to as many non-residential generators as possibled] service that intersects as many other routes as possible e] keep as manylinked trips as possible on one vehicle
40] For long11 routes, do you have a criterion for maximum local operation, and thenexpress operation:
a] yes, 20 minutes b] yes, 30 minutes c] yes, 45 minutes d] yes, 60 minutese] no
If your interval is not specified, please pick the closest answer and detail yourreply in the comments
41] What is the typical non-CBD bus stop spacing in your system:a]less than 4 per mile b]4 per mile c]6-8 per mile d] 10-12 per milee]more than 12 per mile
42] What is the typical CBD bus stop spacing in your system:a]4 per mile b]6-8 per mile c] 10-12 per mile d]13-16 per milee]more than 16 per mile
________________________________
10 Service equity is deliberately not defined here. Should you wish, in the comments section, pleaseprovide us with your definition.
11 Time or distance or both
8
43] Which bus stop siting does your property/municipality12 prefer:a] near side b]far side c]mid-block d]no preferences
In your comments, please tell us how passenger traffic demand influencesroute design in your service area and how you would rank in terms of usefulnessthe various criteria. Please send us copies of your guidelines as well.
F SCHEDULE DESIGN STANDARDS
44] Does your property have differing guidelines for local, limited and express buses?a] yes b] no
If no, go to #44
45] Do these various services have different basic fares, i.e., are there surcharges for thenon-local bus services?
a] yes b] no
46] Does your property have schedule guidelines for (darken all circles that apply):a]maximum intervals b]minimum intervals c]rush hours that are differentthan non-rush hours d]maximum number of standees e]no standees
47] Do different character local routes (crosstown, feeder, grid, shuttle, etc.) havedifferent guidelines?
a] yes b] no
48] Are your guidelines based on:a] waiting time between buses b] loading standards c] both
49] When schedule intervals are greater than 10-12 minutes, do you schedule only clock-face (memory) schedules13?
a] yes b] no
50] Does your property have a duration limit for the amount of time a rider is expectedto stand on board a bus?
a] yes b] no
51] Does your property have guidelines for transfers/meets?a] yes b] no
If you answered yes, and if they vary by time of day or service frequency, pleasediscuss them in your comments.________________________________
12 The answer should be that of the organization responsible for placement of the stop.
13 That is, intervals that are evenly divisible into 60 -- 12, 15, 20, 30 and 60 minutes.For this questionnaire, 45, 90 and 120 are also considered memory schedules.
33
APPENDIX B (Continued)
9
52] Do you have guidelines/standards for 'span of service'?14
a] yes, they're based on system considerations b]yes, they're based on routelevel considerations c] a] and b] d] all/virtually all regular (local)
routes operate the same hours whenever the system is up and running without apolicy basis e] no
You are requested to send in your scheduling/ loading standards (guidelines).G. PRODUCTIVITY STANDARDS/MEASURES
53] Which of the following productivity measures does your property regularly utilize inyour (local) bus route analysis (please darken all that apply):
a]passengers per mile b]passenger miles c]passengers per hourd]passengers per trip e]cost per passenger
54] Generally, what is the minimally acceptable standard for passengers per mile?a]l b]2-3 c]3-5 d]5-8 e]over 8
55]Generally, what is the minimally acceptable standard for passenger per hour?a]4 b]5-10 c]11-20 d]21-35 e]36 or over
56]Generally, what is the minimally acceptable standard for revenue per passenger perroute15?
a]25% of variable cost? b]33% c]50% d]67% e]75%
57] Generally, what is the minimally acceptable standard for subsidy per passenger?a] 2 times the system average b] 3 times the system average c] 4 times thesystem average d] 5 times the system average e] greater than 5 times
58] Generally, what is the minimally acceptable standard for cost per passenger?a] 2 times the system average b] 3 times the system average c] 4 times thesystem average d] 5 times the system average e] greater than 5 times
59] Generally, on a route level, minimum acceptable (variable) recovery ratios are:a] below 25% b] 26-40% c]41-60% d] 61-75% e] over 75%
60] Overall, taking the above criteria together, in doing systemic route levelassessments, where do you start:
a] bottom 10% b] bottom 20% c] bottom 25% d] bottom 33 1/3%
61] Of the following criteria, which is the most critical in your assessment of routeperformance:
a]passengers per mile b]passengers per hour c]cost per passengerd]subsidy per passengere]political feasibility
________________________
14 The span of service is defined as the hours when service runs, i.e., the start of theservice day until the end of the service day (or 24 hour service).
15 If the selection is not exactly what you use, round down to the closest selection.
10
62]In doing a route level cost analysis, do you use16.a]variable costs b]semi-variable costs c]fully allocated/fixed costsd]a mix of a, b or c e]at differing times, all of a,b and c
63] At your property, variable costs are what percent of fully allocated costs in yoursystem:
a]below 20% b]20-35% c] 36-50% d] 50-65% e]over 65%
64] Who is ultimately responsible for the selection of which cost numbers to use:a] Budget Department (or some other financial department)b]Operations/transportation department c]service planning/schedulesdepartmentd]other departmente]combination of departments
You are requested to send in your productivity standards how you would rank them in terms ofusefulness the various critena.
H. SERVICE DELIVERY MONITORING/PERFORMANCE AUDITS
65] Are there formal procedures for engaging in service monitoring/performance audits17?a] yes b]no
If you answered no, please skip to question 82
66] Which department/division undertakes these efforts?a]Transportation/Operations b]Schedules/Service Planning c]lnternal Auditd] a and b e]other
67]What is monitored/audited on the bus route18 level:a]On-time performance b]Headway adherence (evenness of interval) c]bothd]neither
Please answer questions #68-73 only if you answered a, b or c to #67
On-Time Performance68]A bus is officially late when it is more than _____ minute(s) behind schedule
a] 1 b]2 c]4 d]5 e]over 5
__________________________
16 In your comments, please tell us which cost components you include in each of a], b]and c]. For example, some properties in 'a] variable costs' include operator wages, fuel andwear & tear items. Others include prorated mechanic wages.
17 For the purpose of collecting data rather than supervising/dispatching bus service.
18 If your property monitors either of these measures on a system level but not on aroute level, please tell us in your comments. If different standards are used on a route levelbasis versus the system level, e.g., 1 minute route level versus 5 minute system level, please tell us that also.
34
APPENDIX B (Continued)
11
69]A bus is officially early when it is more than _____ minute(s) ahead of schedulea] 1 b]2 c]4 d]5 e]over 5
70] Route level data is collected at (darken all that apply):a] departing terminals b] mid-line time points c] various mid-line locations
(other than time points) d] arriving terminals
Please darken the circle for the answer that best fits your property in 1992. Systemwiderush hour performance was:
71a]98-100% b]94-97% c]90-94% d]85-89% e]80-84%72a]75-79% b]70-74% c]60-69% d]below 60%
73]Does the answer to #71-72 reflect an average of wide variations, i.e., wide range ofindividual route performance's or are the routes in the system fairly consistent?
a] wide range b]the routes in the system are fairly consistent with each other
Please darken the circle for the answer that best fits your property in 1992. Systemwidenon-rush hour performance was:
74a]98-100% b]94-97% c]90-94% d]85-89% e]80-84%75a]75-79% b]70-74% c]60-69% d]below 60%
76]Does the answer to 74-75 reflect an average of wide variations, i.e., wide range ofindividual route performance's or are the routes in the system fairly consistent?
a] wide range b]the routes in the system are fairly consistent with each other
Headway Adherence (Evenness of Interval)77] How does your property measure headway adherence
a] as a percent of interval b]as an absolute measure, in seconds/minutes c]in another manner (please describe in comments) d] not measured (go to #79)
78] How long has your property used this measurea]less than 1 year b] 1 to 3 years c]more than 3 years
Please darken the circle that best fits from either #79 or #80.If you had to pick one primary cause of poor on-time performance or poor headwayadherence, it would be
a]obsolete, outdated schedules b]erratic day-to-day operations, due toinconsistent passenger loadings, for which it is impossible to write reliableschedules c]erratic day-to-day street traffic for which it is impossible to writereliable schedules d]inadequate supervisory resources
a]other forces beyond the control of the operating property b]poor operatorperformance c]lack of up to date data
81] If you are a multi-modal property, are there some measures used on one mode butnot the other? Darken all circles that apply
a] no b]yes; headway adherence for rail but not for bus c]late on-timeperformance (and/or headway adherence) more stringent for rail than bus d] earlyarrivals not permitted on rail; bus permitted up to limits in answer #69.
12
Please discuss other measures you use in your comments.
Passenger Comfort and Safety
82] Do you have a formal mechanism whereby passenger comfort is evaluated?a] yes, field surveys by planning/marketing/management personnelb]yes,"Passenger Environment Surveys"19 c]yes, focus groups/general marketresearch d] yes, parts of a and/or b and/or c e] no
83] Do you keep route level information on complaints in a manner other than just alisting, i.e., complaints per mile, or per 1000 boardings?
a] yes b] no
84] Do you keep route level information on missed trips or unscheduled extras?a] yes b] no
85] Do you keep route level information on accidents?a] yes b] no
86] Do you provide special20 intervals, or special information about schedules in areaswhere your riders do not feel secure waiting for buses?
a] yes b] no
The evaluation efforts identified above are used to improve SERVICE DELIVERY,promote EQUITY in service distribution and availability, increase RIDERSHIP, andreduce OPERATING COSTS. As a summary, please indicate the effectiveness of theevaluation efforts upon each. Please rank the evaluation efforts' impacts with a] asgreatest and e] as least influencial.
87] SERVICE DELIVERY..... a b c d e
88] EQUITY ............... a b c d e
89] RIDERSHIP ............ a b c d e
90] OPERATING COSTS...... a b c d e
___________________________
19 Structured surveys done by traffic checkers with formal training in the particularsurvey instrument.
20 Out of the ordinary for your system.
35
APPENDIX C
Frequency Response to Each Question
36
APPENDIX C (Continued)
37
APPENDIX C (Continued)
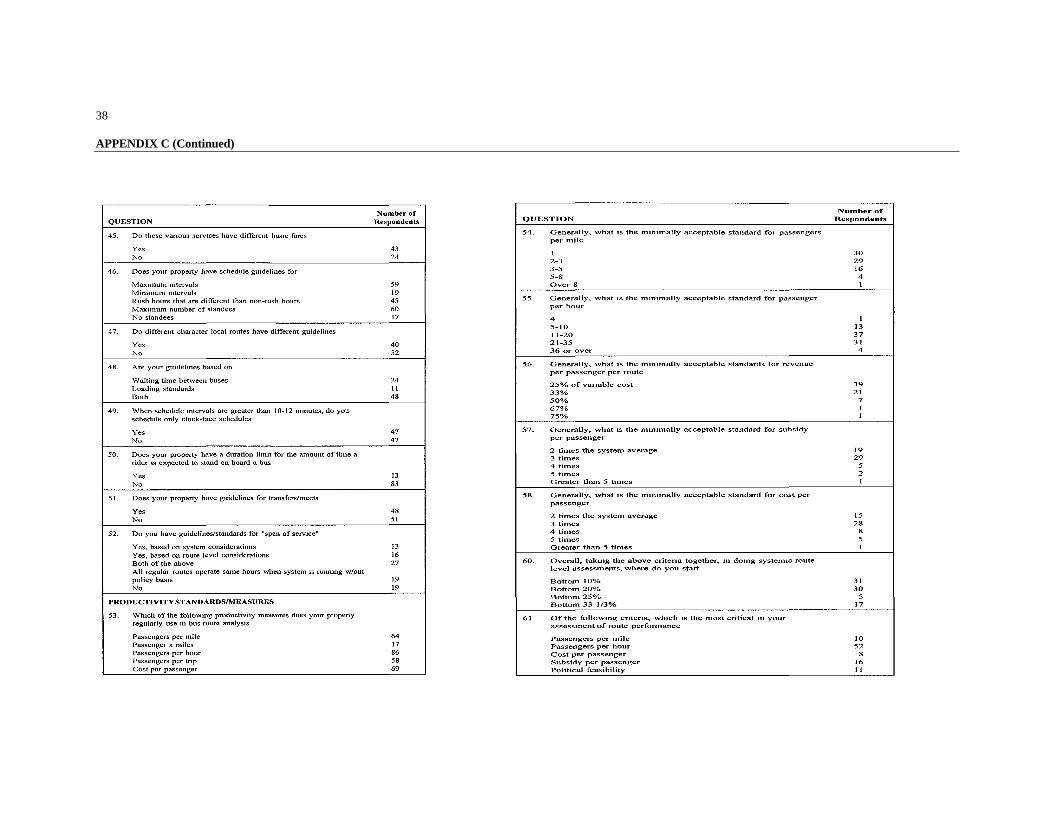
38
APPENDIX C (Continued)
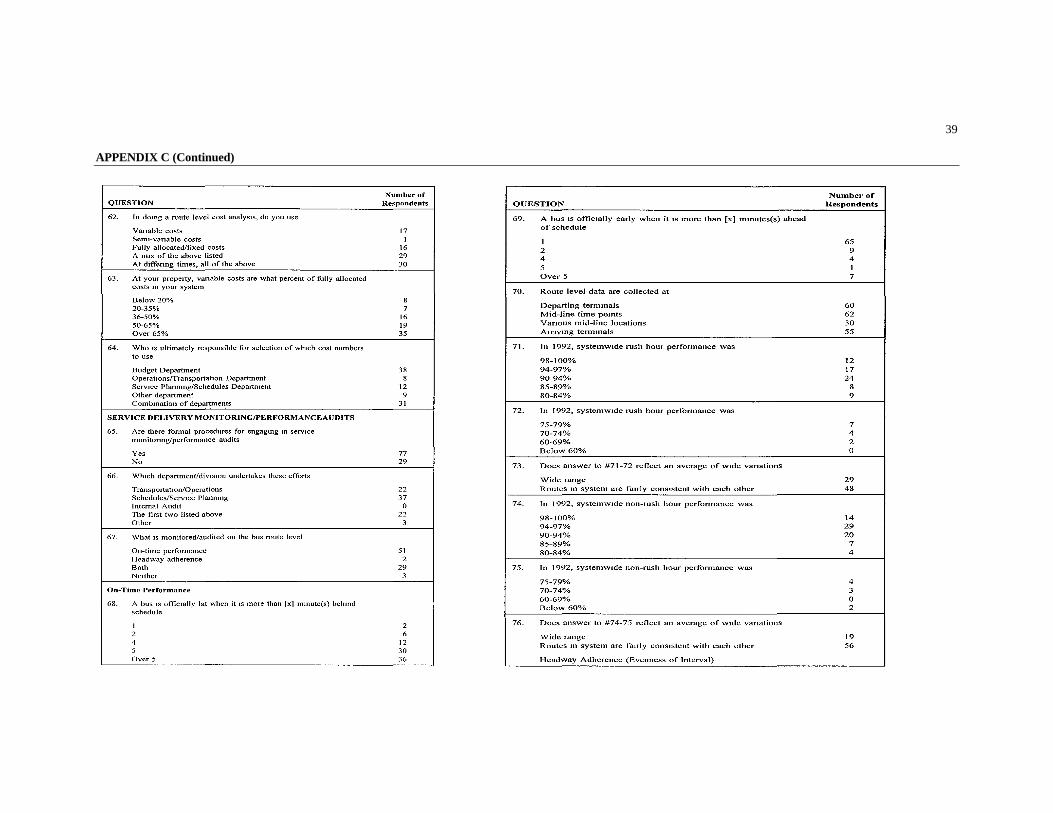
39
APPENDIX C (Continued)
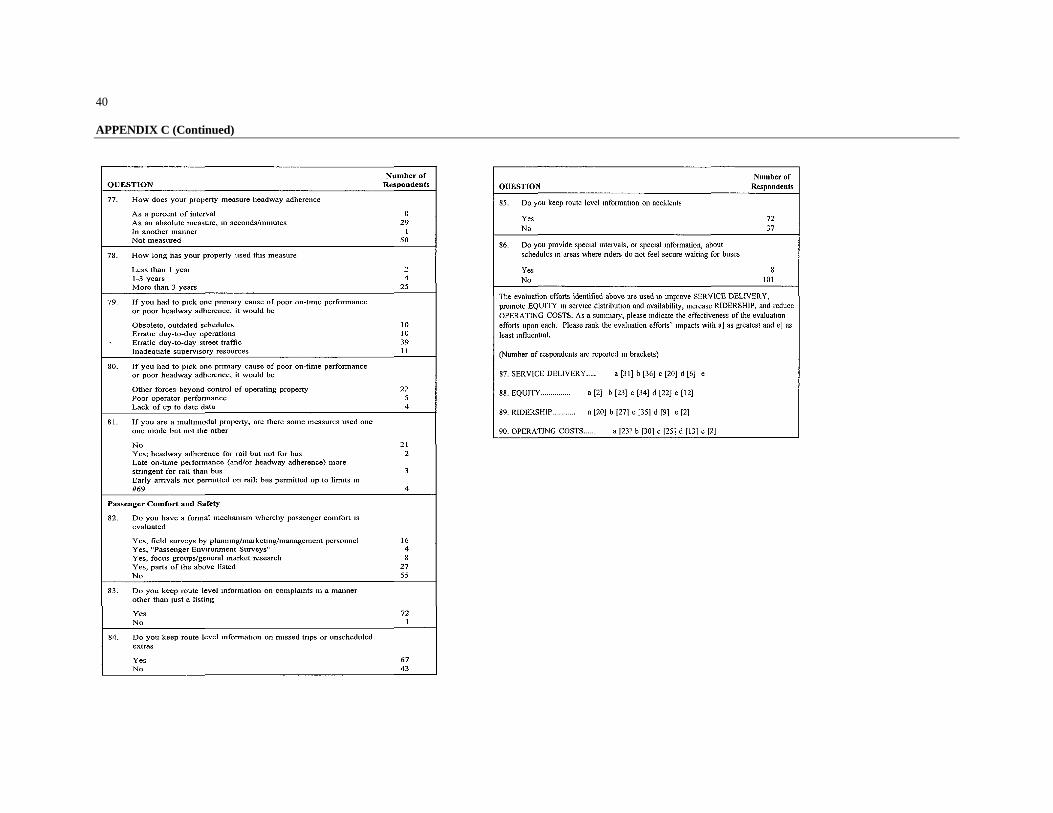
40
APPENDIX C (Continued)
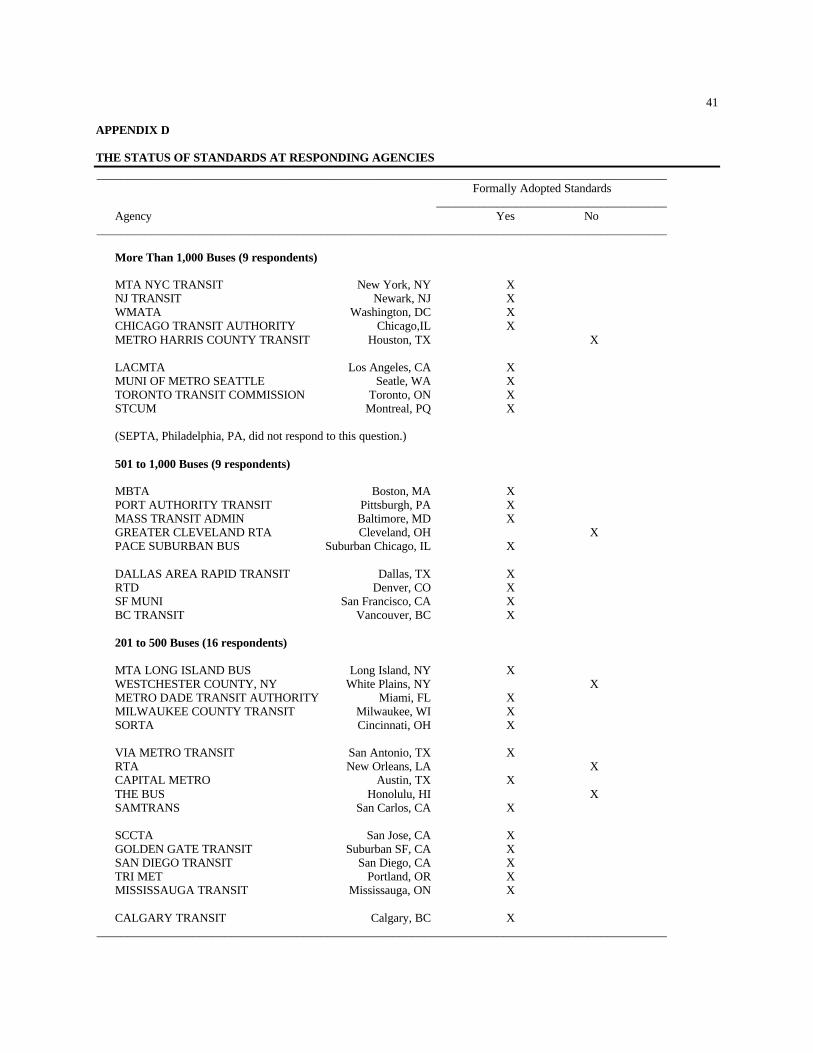
41
APPENDIX D
THE STATUS OF STANDARDS AT RESPONDING AGENCIES______________________________________________________________________________________________
Formally Adopted Standards______________________________________
Agency Yes No______________________________________________________________________________________________
More Than 1,000 Buses (9 respondents)
MTA NYC TRANSIT New York, NY XNJ TRANSIT Newark, NJ XWMATA Washington, DC XCHICAGO TRANSIT AUTHORITY Chicago,IL XMETRO HARRIS COUNTY TRANSIT Houston, TX X
LACMTA Los Angeles, CA XMUNI OF METRO SEATTLE Seatle, WA XTORONTO TRANSIT COMMISSION Toronto, ON XSTCUM Montreal, PQ X
(SEPTA, Philadelphia, PA, did not respond to this question.)
501 to 1,000 Buses (9 respondents)
MBTA Boston, MA XPORT AUTHORITY TRANSIT Pittsburgh, PA XMASS TRANSIT ADMIN Baltimore, MD XGREATER CLEVELAND RTA Cleveland, OH XPACE SUBURBAN BUS Suburban Chicago, IL X
DALLAS AREA RAPID TRANSIT Dallas, TX XRTD Denver, CO XSF MUNI San Francisco, CA XBC TRANSIT Vancouver, BC X
201 to 500 Buses (16 respondents)
MTA LONG ISLAND BUS Long Island, NY XWESTCHESTER COUNTY, NY White Plains, NY XMETRO DADE TRANSIT AUTHORITY Miami, FL XMILWAUKEE COUNTY TRANSIT Milwaukee, WI XSORTA Cincinnati, OH X
VIA METRO TRANSIT San Antonio, TX XRTA New Orleans, LA XCAPITAL METRO Austin, TX XTHE BUS Honolulu, HI XSAMTRANS San Carlos, CA X
SCCTA San Jose, CA XGOLDEN GATE TRANSIT Suburban SF, CA XSAN DIEGO TRANSIT San Diego, CA XTRI MET Portland, OR XMISSISSAUGA TRANSIT Mississauga, ON X
CALGARY TRANSIT Calgary, BC X______________________________________________________________________________________________
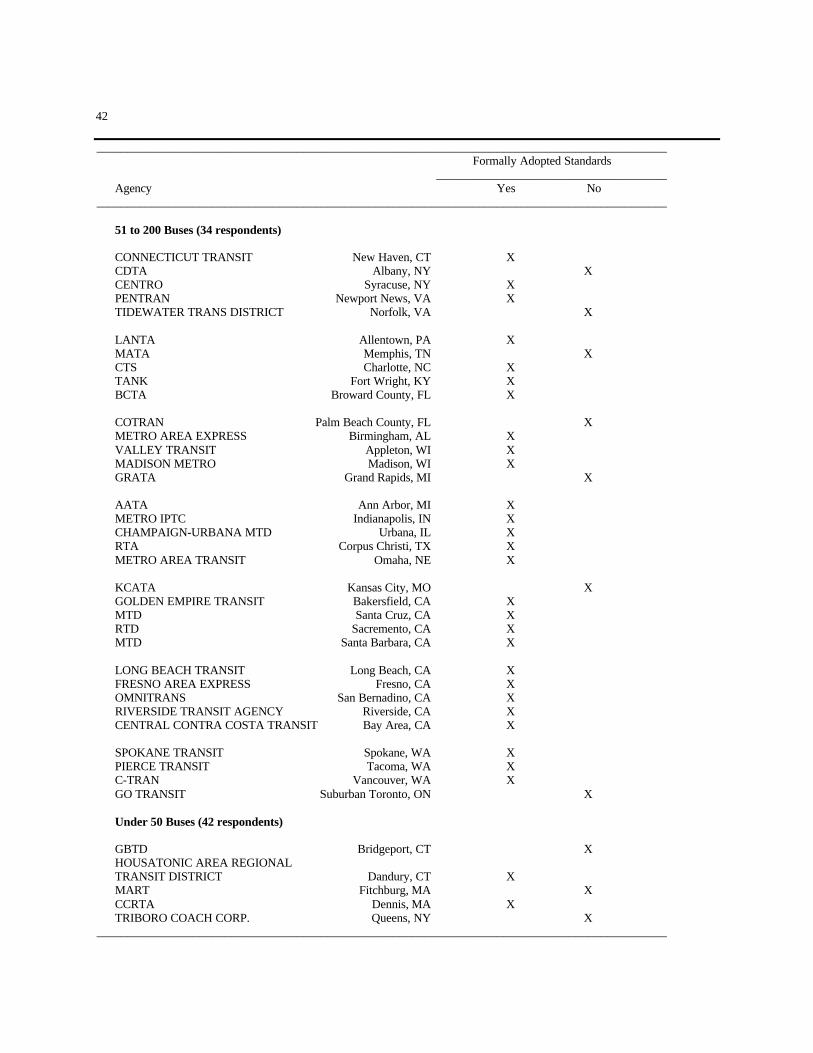
42
______________________________________________________________________________________________Formally Adopted Standards
______________________________________Agency Yes No
______________________________________________________________________________________________
51 to 200 Buses (34 respondents)
CONNECTICUT TRANSIT New Haven, CT XCDTA Albany, NY XCENTRO Syracuse, NY XPENTRAN Newport News, VA XTIDEWATER TRANS DISTRICT Norfolk, VA X
LANTA Allentown, PA XMATA Memphis, TN XCTS Charlotte, NC XTANK Fort Wright, KY XBCTA Broward County, FL X
COTRAN Palm Beach County, FL XMETRO AREA EXPRESS Birmingham, AL XVALLEY TRANSIT Appleton, WI XMADISON METRO Madison, WI XGRATA Grand Rapids, MI X
AATA Ann Arbor, MI XMETRO IPTC Indianapolis, IN XCHAMPAIGN-URBANA MTD Urbana, IL XRTA Corpus Christi, TX XMETRO AREA TRANSIT Omaha, NE X
KCATA Kansas City, MO XGOLDEN EMPIRE TRANSIT Bakersfield, CA XMTD Santa Cruz, CA XRTD Sacremento, CA XMTD Santa Barbara, CA X
LONG BEACH TRANSIT Long Beach, CA XFRESNO AREA EXPRESS Fresno, CA XOMNITRANS San Bernadino, CA XRIVERSIDE TRANSIT AGENCY Riverside, CA XCENTRAL CONTRA COSTA TRANSIT Bay Area, CA X
SPOKANE TRANSIT Spokane, WA XPIERCE TRANSIT Tacoma, WA XC-TRAN Vancouver, WA XGO TRANSIT Suburban Toronto, ON X
Under 50 Buses (42 respondents)
GBTD Bridgeport, CT XHOUSATONIC AREA REGIONALTRANSIT DISTRICT Dandury, CT XMART Fitchburg, MA XCCRTA Dennis, MA XTRIBORO COACH CORP. Queens, NY X
______________________________________________________________________________________________
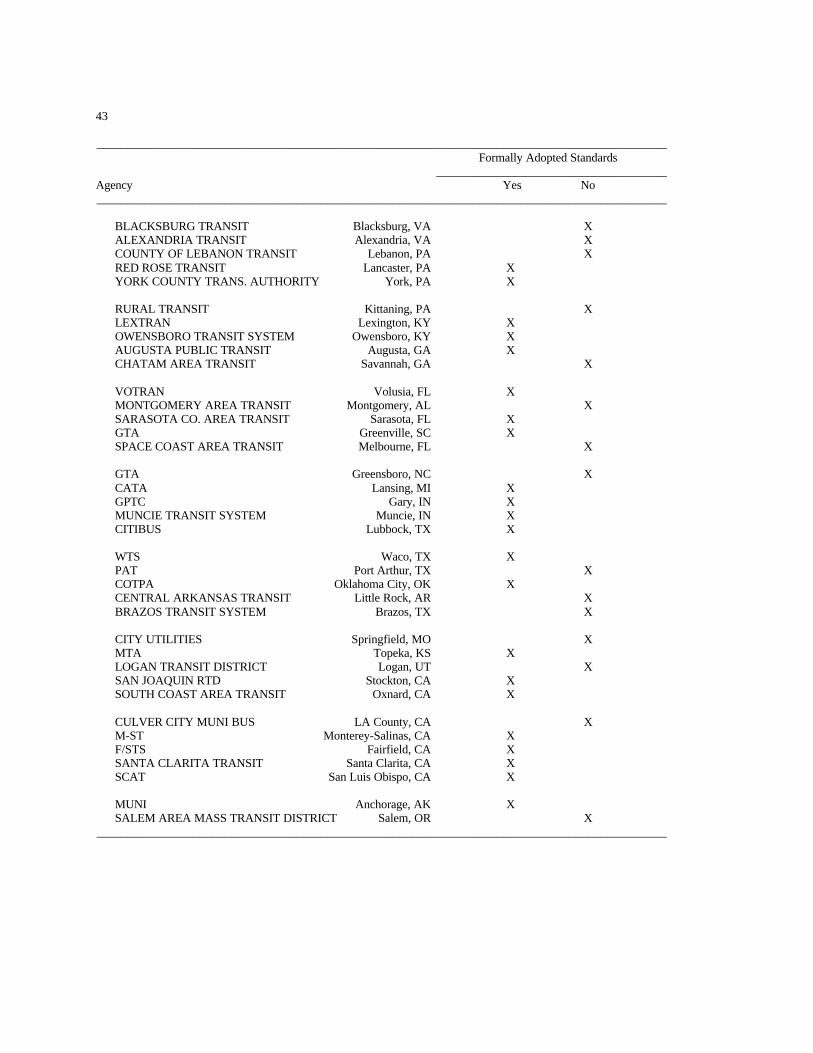
43
______________________________________________________________________________________________Formally Adopted Standards
______________________________________Agency Yes No______________________________________________________________________________________________
BLACKSBURG TRANSIT Blacksburg, VA XALEXANDRIA TRANSIT Alexandria, VA XCOUNTY OF LEBANON TRANSIT Lebanon, PA XRED ROSE TRANSIT Lancaster, PA XYORK COUNTY TRANS. AUTHORITY York, PA X
RURAL TRANSIT Kittaning, PA XLEXTRAN Lexington, KY XOWENSBORO TRANSIT SYSTEM Owensboro, KY XAUGUSTA PUBLIC TRANSIT Augusta, GA XCHATAM AREA TRANSIT Savannah, GA X
VOTRAN Volusia, FL XMONTGOMERY AREA TRANSIT Montgomery, AL XSARASOTA CO. AREA TRANSIT Sarasota, FL XGTA Greenville, SC XSPACE COAST AREA TRANSIT Melbourne, FL X
GTA Greensboro, NC XCATA Lansing, MI XGPTC Gary, IN XMUNCIE TRANSIT SYSTEM Muncie, IN XCITIBUS Lubbock, TX X
WTS Waco, TX XPAT Port Arthur, TX XCOTPA Oklahoma City, OK XCENTRAL ARKANSAS TRANSIT Little Rock, AR XBRAZOS TRANSIT SYSTEM Brazos, TX X
CITY UTILITIES Springfield, MO XMTA Topeka, KS XLOGAN TRANSIT DISTRICT Logan, UT XSAN JOAQUIN RTD Stockton, CA XSOUTH COAST AREA TRANSIT Oxnard, CA X
CULVER CITY MUNI BUS LA County, CA XM-ST Monterey-Salinas, CA XF/STS Fairfield, CA XSANTA CLARITA TRANSIT Santa Clarita, CA XSCAT San Luis Obispo, CA X
MUNI Anchorage, AK XSALEM AREA MASS TRANSIT DISTRICT Salem, OR X
______________________________________________________________________________________________
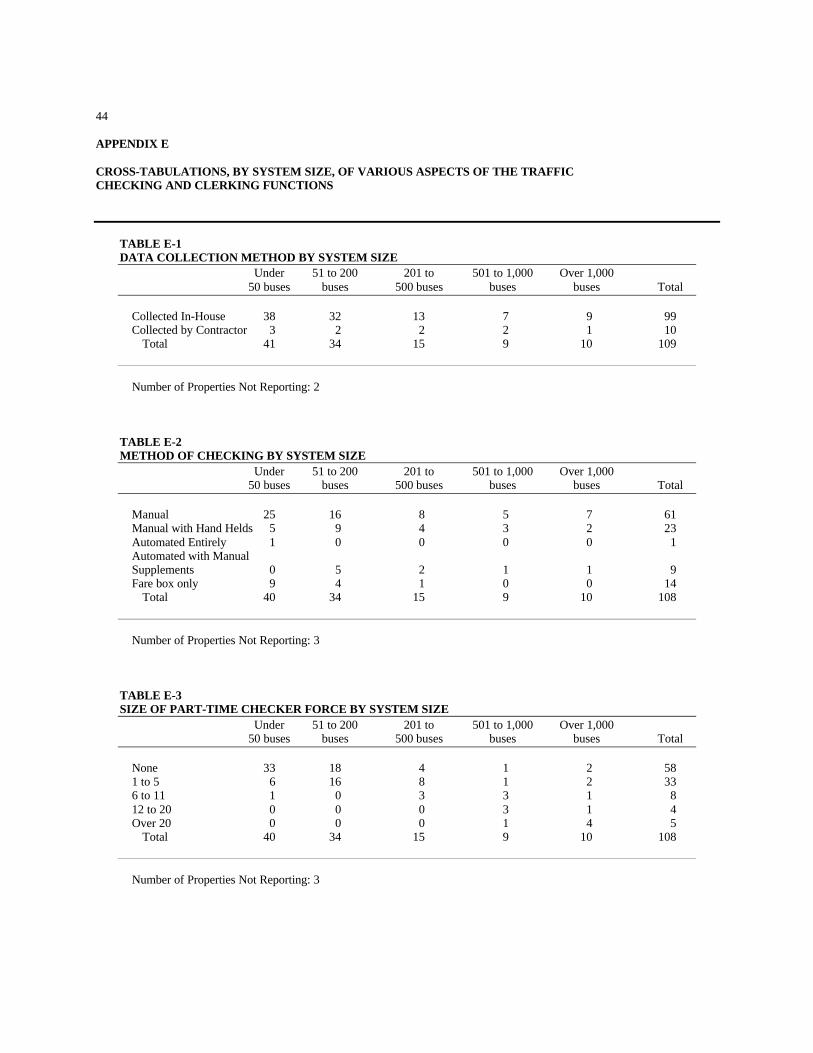
44
APPENDIX E
CROSS-TABULATIONS, BY SYSTEM SIZE, OF VARIOUS ASPECTS OF THE TRAFFICCHECKING AND CLERKING FUNCTIONS
TABLE E-1DATA COLLECTION METHOD BY SYSTEM SIZE
Under 51 to 200 201 to 501 to 1,000 Over 1,00050 buses buses 500 buses buses buses Total
Collected In-House 38 32 13 7 9 99Collected by Contractor 3 2 2 2 1 10
Total 41 34 15 9 10 109
Number of Properties Not Reporting: 2
TABLE E-2METHOD OF CHECKING BY SYSTEM SIZE
Under 51 to 200 201 to 501 to 1,000 Over 1,00050 buses buses 500 buses buses buses Total
Manual 25 16 8 5 7 61Manual with Hand Helds 5 9 4 3 2 23Automated Entirely 1 0 0 0 0 1Automated with ManualSupplements 0 5 2 1 1 9Fare box only 9 4 1 0 0 14
Total 40 34 15 9 10 108
Number of Properties Not Reporting: 3
TABLE E-3SIZE OF PART-TIME CHECKER FORCE BY SYSTEM SIZE
Under 51 to 200 201 to 501 to 1,000 Over 1,00050 buses buses 500 buses buses buses Total
None 33 18 4 1 2 581 to 5 6 16 8 1 2 336 to 11 1 0 3 3 1 812 to 20 0 0 0 3 1 4Over 20 0 0 0 1 4 5
Total 40 34 15 9 10 108
Number of Properties Not Reporting: 3
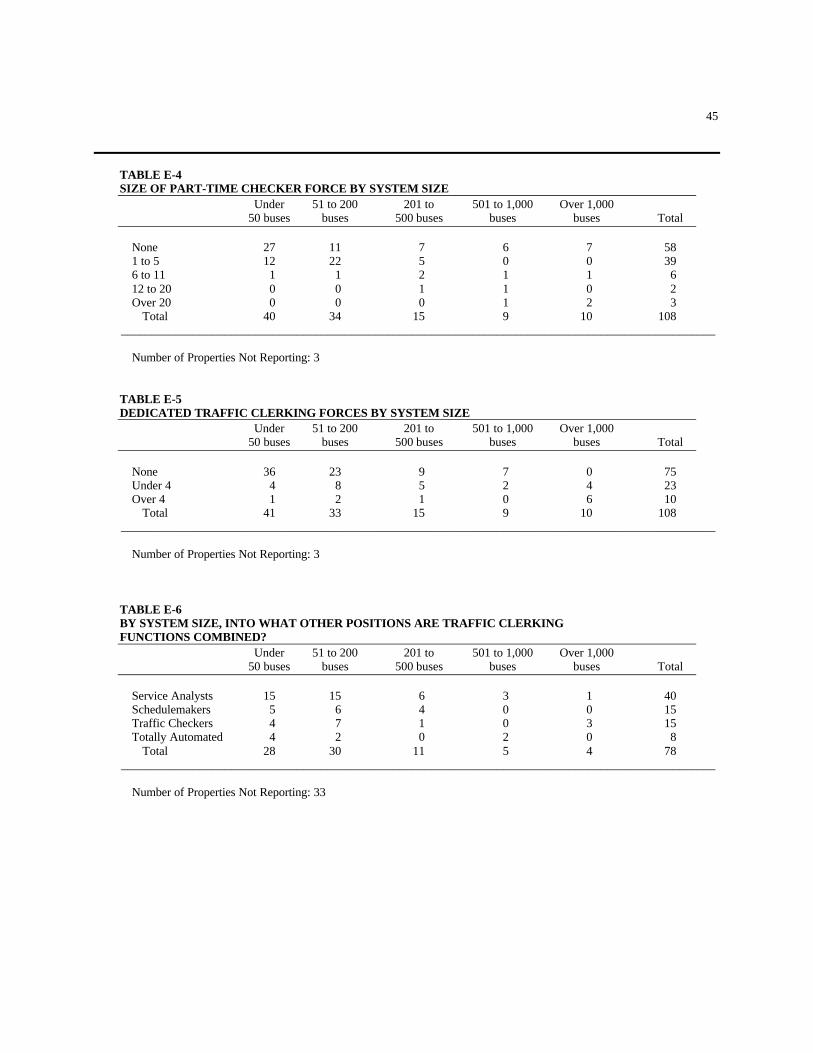
45
TABLE E-4SIZE OF PART-TIME CHECKER FORCE BY SYSTEM SIZE
Under 51 to 200 201 to 501 to 1,000 Over 1,00050 buses buses 500 buses buses buses Total
None 27 11 7 6 7 581 to 5 12 22 5 0 0 396 to 11 1 1 2 1 1 612 to 20 0 0 1 1 0 2Over 20 0 0 0 1 2 3
Total 40 34 15 9 10 108__________________________________________________________________________________________________
Number of Properties Not Reporting: 3
TABLE E-5DEDICATED TRAFFIC CLERKING FORCES BY SYSTEM SIZE
Under 51 to 200 201 to 501 to 1,000 Over 1,00050 buses buses 500 buses buses buses Total
None 36 23 9 7 0 75Under 4 4 8 5 2 4 23Over 4 1 2 1 0 6 10
Total 41 33 15 9 10 108__________________________________________________________________________________________________
Number of Properties Not Reporting: 3
TABLE E-6BY SYSTEM SIZE, INTO WHAT OTHER POSITIONS ARE TRAFFIC CLERKINGFUNCTIONS COMBINED?
Under 51 to 200 201 to 501 to 1,000 Over 1,00050 buses buses 500 buses buses buses Total
Service Analysts 15 15 6 3 1 40Schedulemakers 5 6 4 0 0 15Traffic Checkers 4 7 1 0 3 15Totally Automated 4 2 0 2 0 8
Total 28 30 11 5 4 78__________________________________________________________________________________________________
Number of Properties Not Reporting: 33
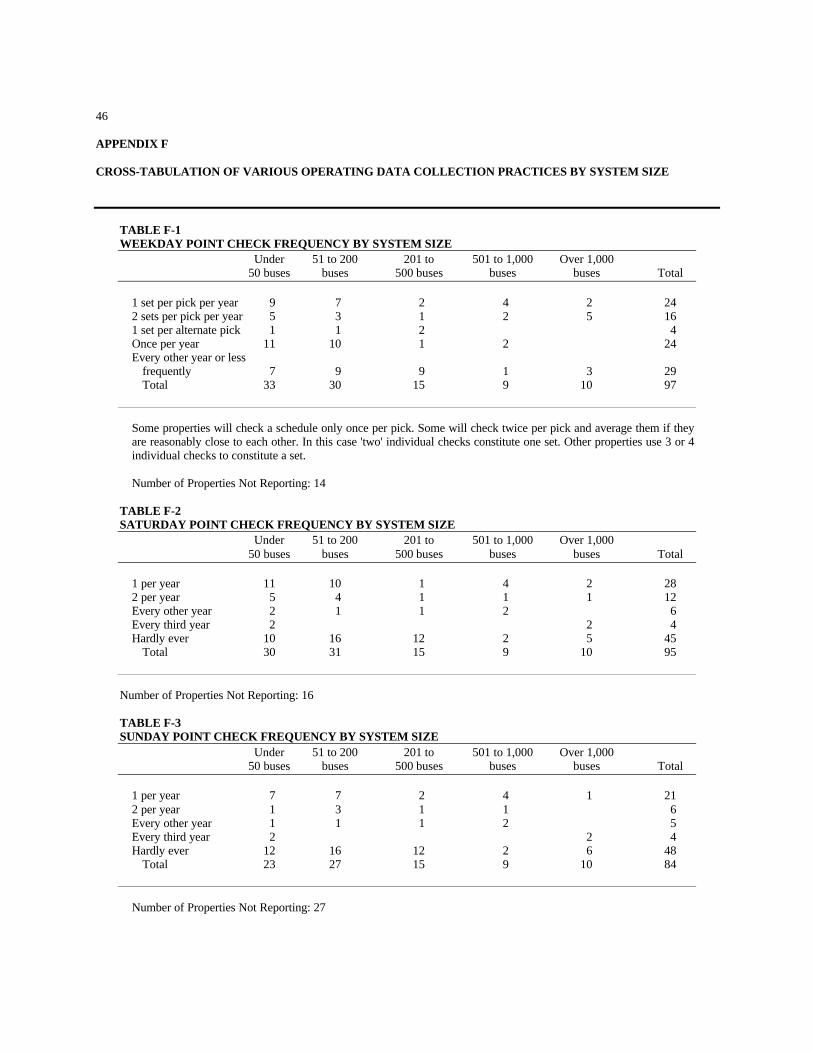
46
APPENDIX F
CROSS-TABULATION OF VARIOUS OPERATING DATA COLLECTION PRACTICES BY SYSTEM SIZE
TABLE F-1WEEKDAY POINT CHECK FREQUENCY BY SYSTEM SIZE
Under 51 to 200 201 to 501 to 1,000 Over 1,00050 buses buses 500 buses buses buses Total
1 set per pick per year 9 7 2 4 2 242 sets per pick per year 5 3 1 2 5 161 set per alternate pick 1 1 2 4Once per year 11 10 1 2 24Every other year or less
frequently 7 9 9 1 3 29Total 33 30 15 9 10 97
Some properties will check a schedule only once per pick. Some will check twice per pick and average them if theyare reasonably close to each other. In this case 'two' individual checks constitute one set. Other properties use 3 or 4individual checks to constitute a set.
Number of Properties Not Reporting: 14
TABLE F-2SATURDAY POINT CHECK FREQUENCY BY SYSTEM SIZE
Under 51 to 200 201 to 501 to 1,000 Over 1,00050 buses buses 500 buses buses buses Total
1 per year 11 10 1 4 2 282 per year 5 4 1 1 1 12Every other year 2 1 1 2 6Every third year 2 2 4Hardly ever 10 16 12 2 5 45
Total 30 31 15 9 10 95
Number of Properties Not Reporting: 16
TABLE F-3SUNDAY POINT CHECK FREQUENCY BY SYSTEM SIZE
Under 51 to 200 201 to 501 to 1,000 Over 1,00050 buses buses 500 buses buses buses Total
1 per year 7 7 2 4 1 212 per year 1 3 1 1 6Every other year 1 1 1 2 5Every third year 2 2 4Hardly ever 12 16 12 2 6 48
Total 23 27 15 9 10 84
Number of Properties Not Reporting: 27
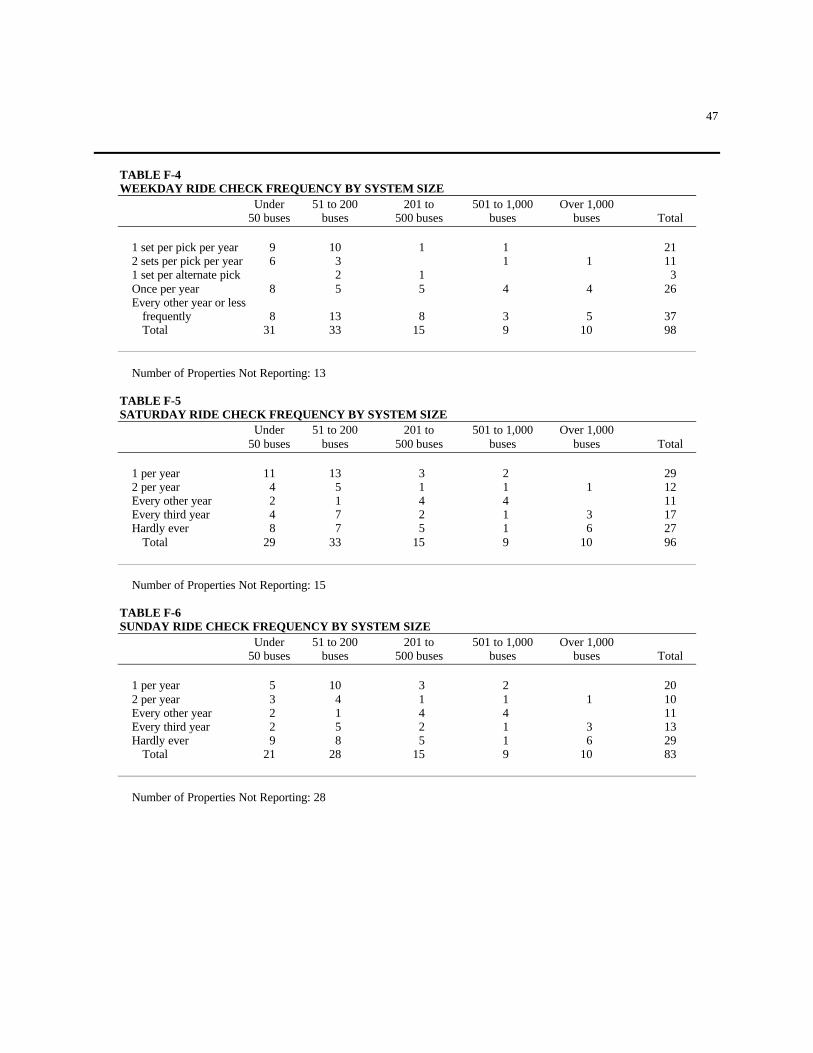
47
TABLE F-4WEEKDAY RIDE CHECK FREQUENCY BY SYSTEM SIZE
Under 51 to 200 201 to 501 to 1,000 Over 1,00050 buses buses 500 buses buses buses Total
1 set per pick per year 9 10 1 1 212 sets per pick per year 6 3 1 1 111 set per alternate pick 2 1 3Once per year 8 5 5 4 4 26Every other year or less
frequently 8 13 8 3 5 37Total 31 33 15 9 10 98
Number of Properties Not Reporting: 13
TABLE F-5SATURDAY RIDE CHECK FREQUENCY BY SYSTEM SIZE
Under 51 to 200 201 to 501 to 1,000 Over 1,00050 buses buses 500 buses buses buses Total
1 per year 11 13 3 2 292 per year 4 5 1 1 1 12Every other year 2 1 4 4 11Every third year 4 7 2 1 3 17Hardly ever 8 7 5 1 6 27
Total 29 33 15 9 10 96
Number of Properties Not Reporting: 15
TABLE F-6SUNDAY RIDE CHECK FREQUENCY BY SYSTEM SIZE
Under 51 to 200 201 to 501 to 1,000 Over 1,00050 buses buses 500 buses buses buses Total
1 per year 5 10 3 2 202 per year 3 4 1 1 1 10Every other year 2 1 4 4 11Every third year 2 5 2 1 3 13Hardly ever 9 8 5 1 6 29
Total 21 28 15 9 10 83
Number of Properties Not Reporting: 28
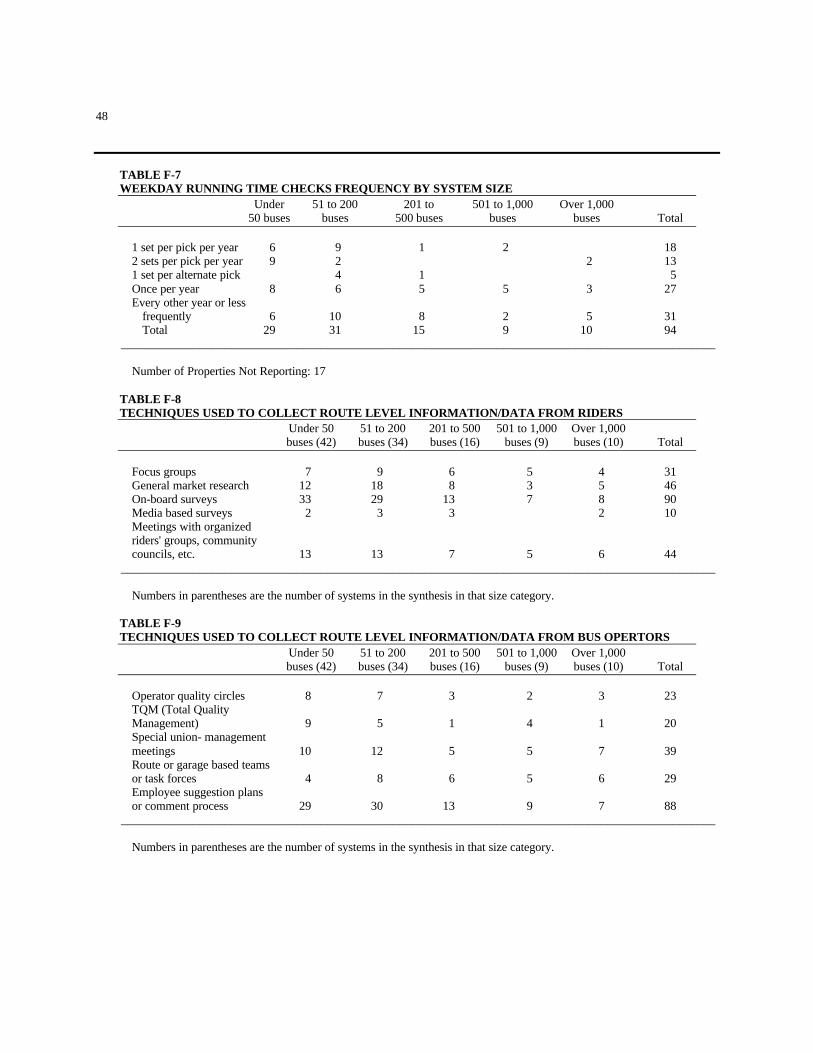
48
TABLE F-7WEEKDAY RUNNING TIME CHECKS FREQUENCY BY SYSTEM SIZE
Under 51 to 200 201 to 501 to 1,000 Over 1,00050 buses buses 500 buses buses buses Total
1 set per pick per year 6 9 1 2 182 sets per pick per year 9 2 2 131 set per alternate pick 4 1 5Once per year 8 6 5 5 3 27Every other year or less
frequently 6 10 8 2 5 31Total 29 31 15 9 10 94
__________________________________________________________________________________________________
Number of Properties Not Reporting: 17
TABLE F-8TECHNIQUES USED TO COLLECT ROUTE LEVEL INFORMATION/DATA FROM RIDERS
Under 50 51 to 200 201 to 500 501 to 1,000 Over 1,000buses (42) buses (34) buses (16) buses (9) buses (10) Total
Focus groups 7 9 6 5 4 31General market research 12 18 8 3 5 46On-board surveys 33 29 13 7 8 90Media based surveys 2 3 3 2 10Meetings with organizedriders' groups, communitycouncils, etc. 13 13 7 5 6 44
__________________________________________________________________________________________________
Numbers in parentheses are the number of systems in the synthesis in that size category.
TABLE F-9TECHNIQUES USED TO COLLECT ROUTE LEVEL INFORMATION/DATA FROM BUS OPERTORS
Under 50 51 to 200 201 to 500 501 to 1,000 Over 1,000buses (42) buses (34) buses (16) buses (9) buses (10) Total
Operator quality circles 8 7 3 2 3 23TQM (Total QualityManagement) 9 5 1 4 1 20Special union- managementmeetings 10 12 5 5 7 39Route or garage based teamsor task forces 4 8 6 5 6 29Employee suggestion plansor comment process 29 30 13 9 7 88
__________________________________________________________________________________________________
Numbers in parentheses are the number of systems in the synthesis in that size category.
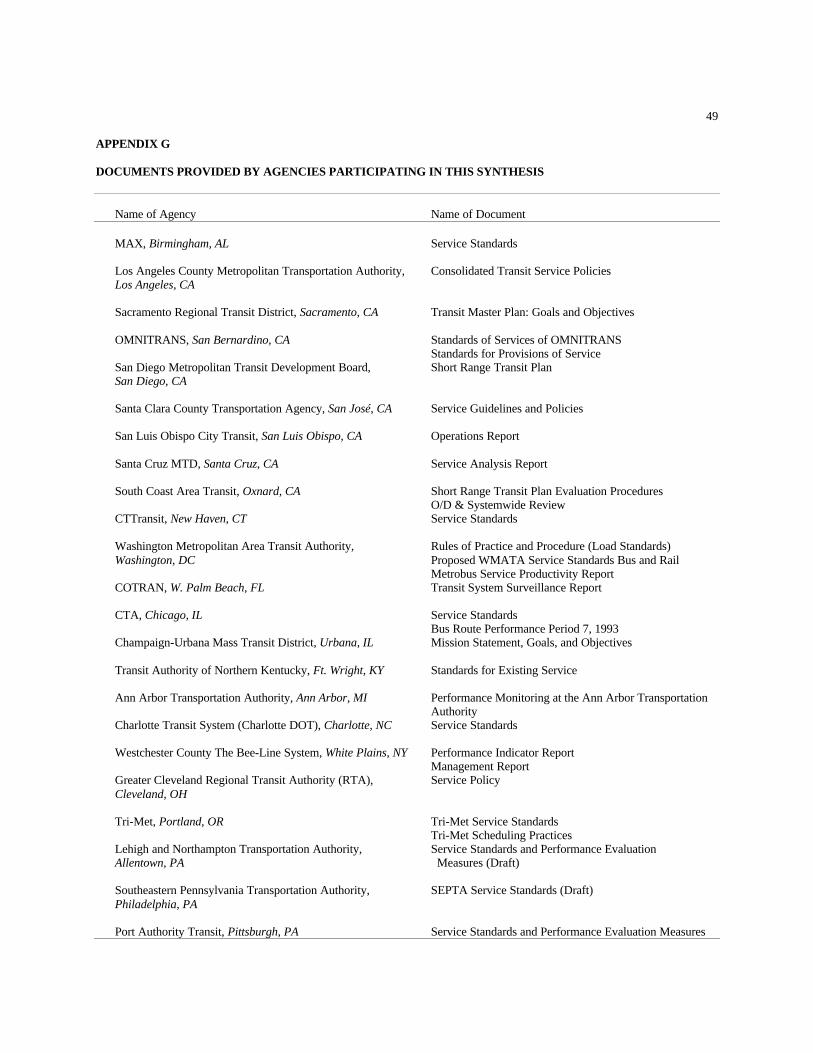
49
APPENDIX G
DOCUMENTS PROVIDED BY AGENCIES PARTICIPATING IN THIS SYNTHESIS
Name of Agency Name of Document
MAX, Birmingham, AL Service Standards
Los Angeles County Metropolitan Transportation Authority, Consolidated Transit Service PoliciesLos Angeles, CA
Sacramento Regional Transit District, Sacramento, CA Transit Master Plan: Goals and Objectives
OMNITRANS, San Bernardino, CA Standards of Services of OMNITRANSStandards for Provisions of Service
San Diego Metropolitan Transit Development Board, Short Range Transit PlanSan Diego, CA
Santa Clara County Transportation Agency, San José, CA Service Guidelines and Policies
San Luis Obispo City Transit, San Luis Obispo, CA Operations Report
Santa Cruz MTD, Santa Cruz, CA Service Analysis Report
South Coast Area Transit, Oxnard, CA Short Range Transit Plan Evaluation ProceduresO/D & Systemwide Review
CTTransit, New Haven, CT Service Standards
Washington Metropolitan Area Transit Authority, Rules of Practice and Procedure (Load Standards)Washington, DC Proposed WMATA Service Standards Bus and Rail
Metrobus Service Productivity ReportCOTRAN, W. Palm Beach, FL Transit System Surveillance Report
CTA, Chicago, IL Service StandardsBus Route Performance Period 7, 1993
Champaign-Urbana Mass Transit District, Urbana, IL Mission Statement, Goals, and Objectives
Transit Authority of Northern Kentucky, Ft. Wright, KY Standards for Existing Service
Ann Arbor Transportation Authority, Ann Arbor, MI Performance Monitoring at the Ann Arbor TransportationAuthority
Charlotte Transit System (Charlotte DOT), Charlotte, NC Service Standards
Westchester County The Bee-Line System, White Plains, NY Performance Indicator ReportManagement Report
Greater Cleveland Regional Transit Authority (RTA), Service PolicyCleveland, OH
Tri-Met, Portland, OR Tri-Met Service StandardsTri-Met Scheduling Practices
Lehigh and Northampton Transportation Authority, Service Standards and Performance EvaluationAllentown, PA Measures (Draft)
Southeastern Pennsylvania Transportation Authority, SEPTA Service Standards (Draft)Philadelphia, PA
Port Authority Transit, Pittsburgh, PA Service Standards and Performance Evaluation Measures
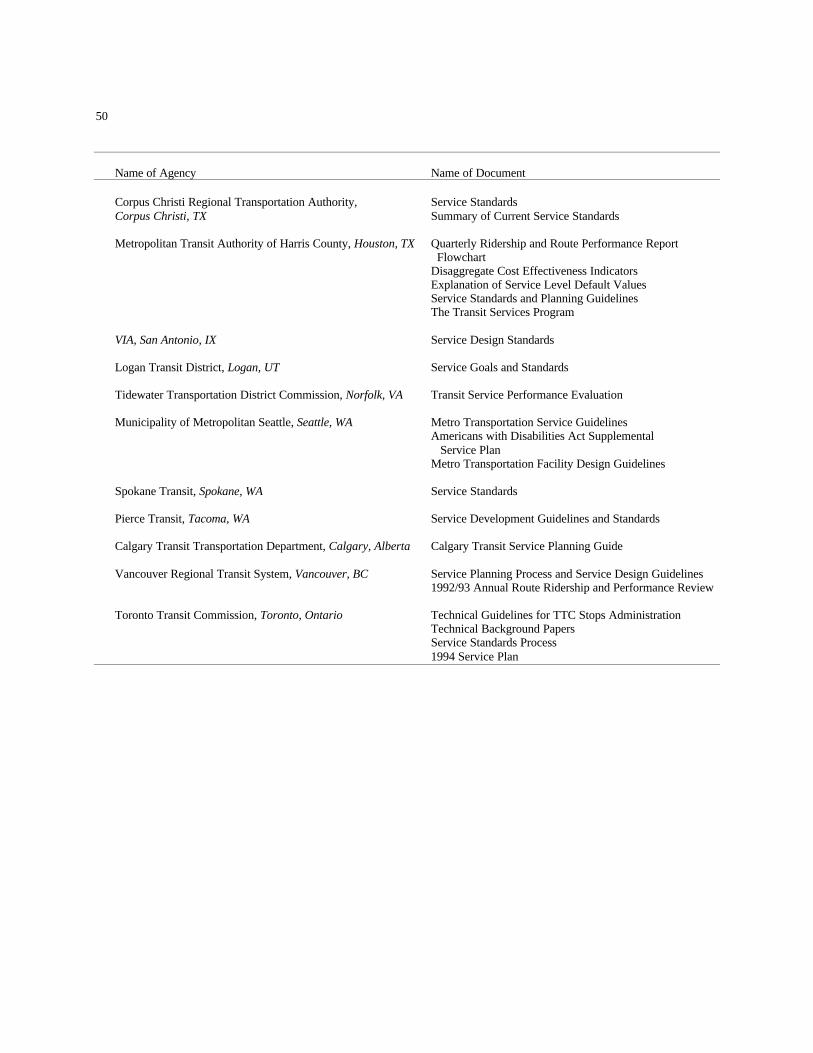
50
Name of Agency Name of Document
Corpus Christi Regional Transportation Authority, Service StandardsCorpus Christi, TX Summary of Current Service Standards
Metropolitan Transit Authority of Harris County, Houston, TX Quarterly Ridership and Route Performance ReportFlowchart
Disaggregate Cost Effectiveness IndicatorsExplanation of Service Level Default ValuesService Standards and Planning GuidelinesThe Transit Services Program
VIA, San Antonio, IX Service Design Standards
Logan Transit District, Logan, UT Service Goals and Standards
Tidewater Transportation District Commission, Norfolk, VA Transit Service Performance Evaluation
Municipality of Metropolitan Seattle, Seattle, WA Metro Transportation Service GuidelinesAmericans with Disabilities Act Supplemental Service PlanMetro Transportation Facility Design Guidelines
Spokane Transit, Spokane, WA Service Standards
Pierce Transit, Tacoma, WA Service Development Guidelines and Standards
Calgary Transit Transportation Department, Calgary, Alberta Calgary Transit Service Planning Guide
Vancouver Regional Transit System, Vancouver, BC Service Planning Process and Service Design Guidelines1992/93 Annual Route Ridership and Performance Review
Toronto Transit Commission, Toronto, Ontario Technical Guidelines for TTC Stops AdministrationTechnical Background PapersService Standards Process1994 Service Plan
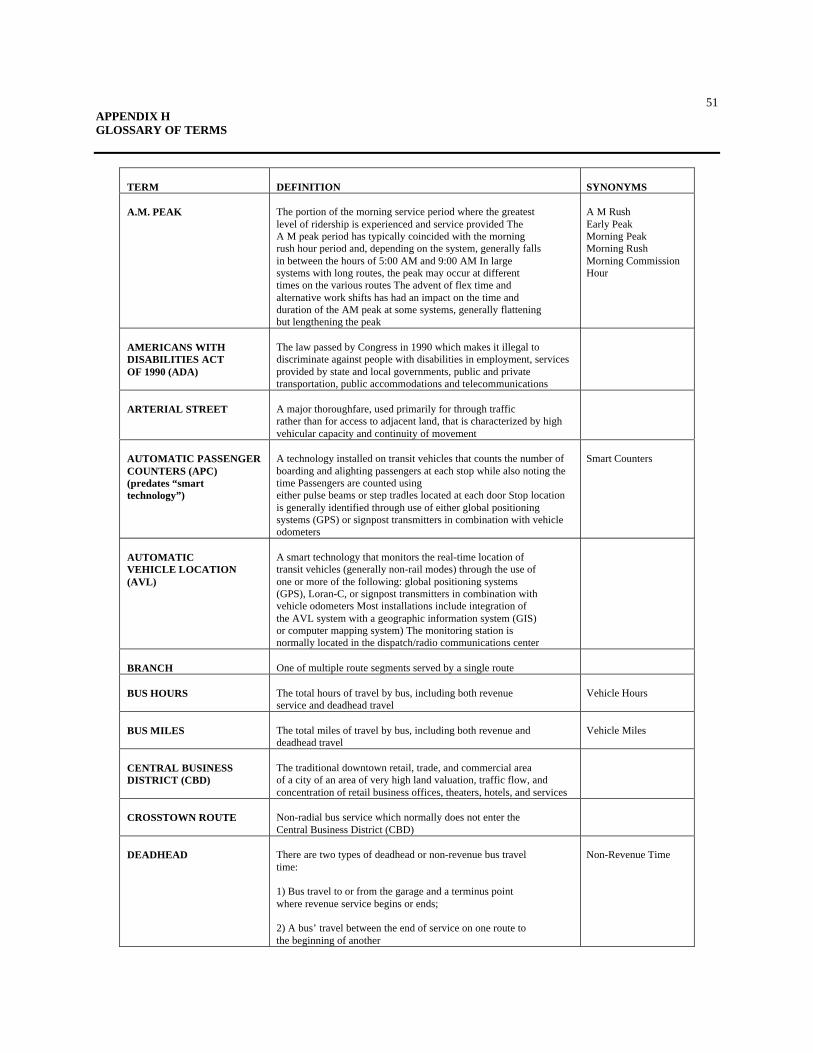
51APPENDIX HGLOSSARY OF TERMS
TERM DEFINITION SYNONYMS
A.M. PEAK The portion of the morning service period where the greatestlevel of ridership is experienced and service provided TheA M peak period has typically coincided with the morningrush hour period and, depending on the system, generally fallsin between the hours of 5:00 AM and 9:00 AM In largesystems with long routes, the peak may occur at differenttimes on the various routes The advent of flex time andalternative work shifts has had an impact on the time andduration of the AM peak at some systems, generally flatteningbut lengthening the peak
A M RushEarly PeakMorning PeakMorning RushMorning CommissionHour
AMERICANS WITHDISABILITIES ACTOF 1990 (ADA)
The law passed by Congress in 1990 which makes it illegal todiscriminate against people with disabilities in employment, servicesprovided by state and local governments, public and privatetransportation, public accommodations and telecommunications
ARTERIAL STREET A major thoroughfare, used primarily for through trafficrather than for access to adjacent land, that is characterized by highvehicular capacity and continuity of movement
AUTOMATIC PASSENGERCOUNTERS (APC)(predates “smarttechnology”)
A technology installed on transit vehicles that counts the number ofboarding and alighting passengers at each stop while also noting thetime Passengers are counted usingeither pulse beams or step tradles located at each door Stop locationis generally identified through use of either global positioningsystems (GPS) or signpost transmitters in combination with vehicleodometers
Smart Counters
AUTOMATICVEHICLE LOCATION(AVL)
A smart technology that monitors the real-time location oftransit vehicles (generally non-rail modes) through the use ofone or more of the following: global positioning systems(GPS), Loran-C, or signpost transmitters in combination withvehicle odometers Most installations include integration ofthe AVL system with a geographic information system (GIS)or computer mapping system) The monitoring station isnormally located in the dispatch/radio communications center
BRANCH One of multiple route segments served by a single route
BUS HOURS The total hours of travel by bus, including both revenueservice and deadhead travel
Vehicle Hours
BUS MILES The total miles of travel by bus, including both revenue anddeadhead travel
Vehicle Miles
CENTRAL BUSINESSDISTRICT (CBD)
The traditional downtown retail, trade, and commercial areaof a city of an area of very high land valuation, traffic flow, andconcentration of retail business offices, theaters, hotels, and services
CROSSTOWN ROUTE Non-radial bus service which normally does not enter theCentral Business District (CBD)
DEADHEAD There are two types of deadhead or non-revenue bus traveltime:
1) Bus travel to or from the garage and a terminus pointwhere revenue service begins or ends;
2) A bus’ travel between the end of service on one route tothe beginning of another
Non-Revenue Time
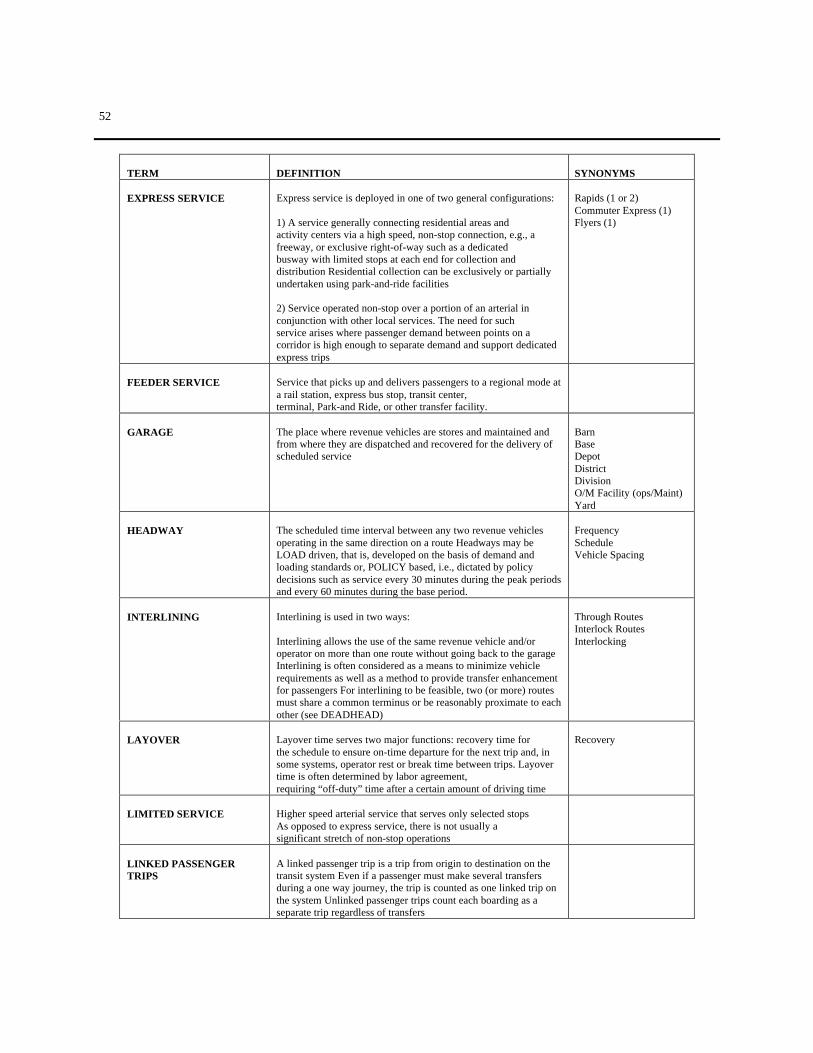
52
TERM DEFINITION SYNONYMS
EXPRESS SERVICE Express service is deployed in one of two general configurations:
1) A service generally connecting residential areas andactivity centers via a high speed, non-stop connection, e.g., afreeway, or exclusive right-of-way such as a dedicatedbusway with limited stops at each end for collection anddistribution Residential collection can be exclusively or partiallyundertaken using park-and-ride facilities
2) Service operated non-stop over a portion of an arterial inconjunction with other local services. The need for suchservice arises where passenger demand between points on acorridor is high enough to separate demand and support dedicatedexpress trips
Rapids (1 or 2)Commuter Express (1)Flyers (1)
FEEDER SERVICE Service that picks up and delivers passengers to a regional mode ata rail station, express bus stop, transit center,terminal, Park-and Ride, or other transfer facility.
GARAGE The place where revenue vehicles are stores and maintained andfrom where they are dispatched and recovered for the delivery ofscheduled service
BarnBaseDepotDistrictDivisionO/M Facility (ops/Maint)Yard
HEADWAY The scheduled time interval between any two revenue vehiclesoperating in the same direction on a route Headways may beLOAD driven, that is, developed on the basis of demand andloading standards or, POLICY based, i.e., dictated by policydecisions such as service every 30 minutes during the peak periodsand every 60 minutes during the base period.
FrequencyScheduleVehicle Spacing
INTERLINING Interlining is used in two ways:
Interlining allows the use of the same revenue vehicle and/oroperator on more than one route without going back to the garageInterlining is often considered as a means to minimize vehiclerequirements as well as a method to provide transfer enhancementfor passengers For interlining to be feasible, two (or more) routesmust share a common terminus or be reasonably proximate to eachother (see DEADHEAD)
Through RoutesInterlock RoutesInterlocking
LAYOVER Layover time serves two major functions: recovery time forthe schedule to ensure on-time departure for the next trip and, insome systems, operator rest or break time between trips. Layovertime is often determined by labor agreement,requiring “off-duty” time after a certain amount of driving time
Recovery
LIMITED SERVICE Higher speed arterial service that serves only selected stopsAs opposed to express service, there is not usually asignificant stretch of non-stop operations
LINKED PASSENGERTRIPS
A linked passenger trip is a trip from origin to destination on thetransit system Even if a passenger must make several transfersduring a one way journey, the trip is counted as one linked trip onthe system Unlinked passenger trips count each boarding as aseparate trip regardless of transfers
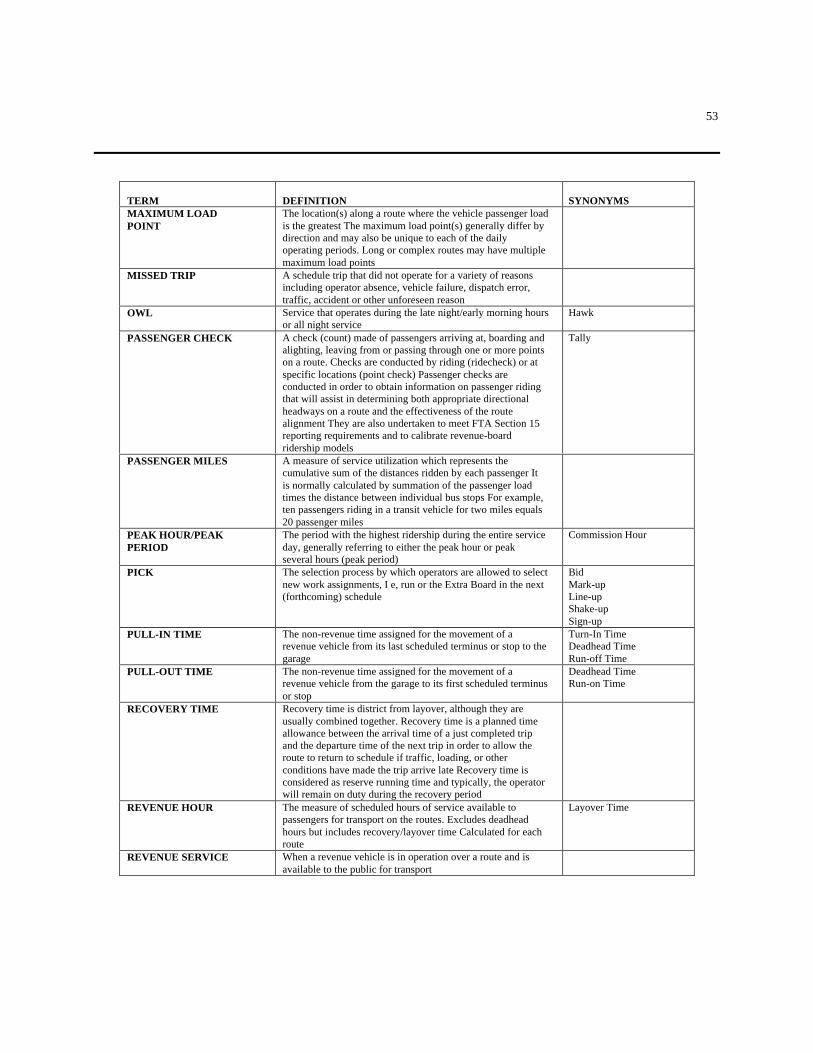
53
TERM DEFINITION SYNONYMSMAXIMUM LOADPOINT
The location(s) along a route where the vehicle passenger loadis the greatest The maximum load point(s) generally differ bydirection and may also be unique to each of the dailyoperating periods. Long or complex routes may have multiplemaximum load points
MISSED TRIP A schedule trip that did not operate for a variety of reasonsincluding operator absence, vehicle failure, dispatch error,traffic, accident or other unforeseen reason
OWL Service that operates during the late night/early morning hoursor all night service
Hawk
PASSENGER CHECK A check (count) made of passengers arriving at, boarding andalighting, leaving from or passing through one or more pointson a route. Checks are conducted by riding (ridecheck) or atspecific locations (point check) Passenger checks areconducted in order to obtain information on passenger ridingthat will assist in determining both appropriate directionalheadways on a route and the effectiveness of the routealignment They are also undertaken to meet FTA Section 15reporting requirements and to calibrate revenue-boardridership models
Tally
PASSENGER MILES A measure of service utilization which represents thecumulative sum of the distances ridden by each passenger Itis normally calculated by summation of the passenger loadtimes the distance between individual bus stops For example,ten passengers riding in a transit vehicle for two miles equals20 passenger miles
PEAK HOUR/PEAKPERIOD
The period with the highest ridership during the entire serviceday, generally referring to either the peak hour or peakseveral hours (peak period)
Commission Hour
PICK The selection process by which operators are allowed to selectnew work assignments, I e, run or the Extra Board in the next(forthcoming) schedule
BidMark-upLine-upShake-upSign-up
PULL-IN TIME The non-revenue time assigned for the movement of arevenue vehicle from its last scheduled terminus or stop to thegarage
Turn-In TimeDeadhead TimeRun-off Time
PULL-OUT TIME The non-revenue time assigned for the movement of arevenue vehicle from the garage to its first scheduled terminusor stop
Deadhead TimeRun-on Time
RECOVERY TIME Recovery time is district from layover, although they areusually combined together. Recovery time is a planned timeallowance between the arrival time of a just completed tripand the departure time of the next trip in order to allow theroute to return to schedule if traffic, loading, or otherconditions have made the trip arrive late Recovery time isconsidered as reserve running time and typically, the operatorwill remain on duty during the recovery period
REVENUE HOUR The measure of scheduled hours of service available topassengers for transport on the routes. Excludes deadheadhours but includes recovery/layover time Calculated for eachroute
Layover Time
REVENUE SERVICE When a revenue vehicle is in operation over a route and isavailable to the public for transport
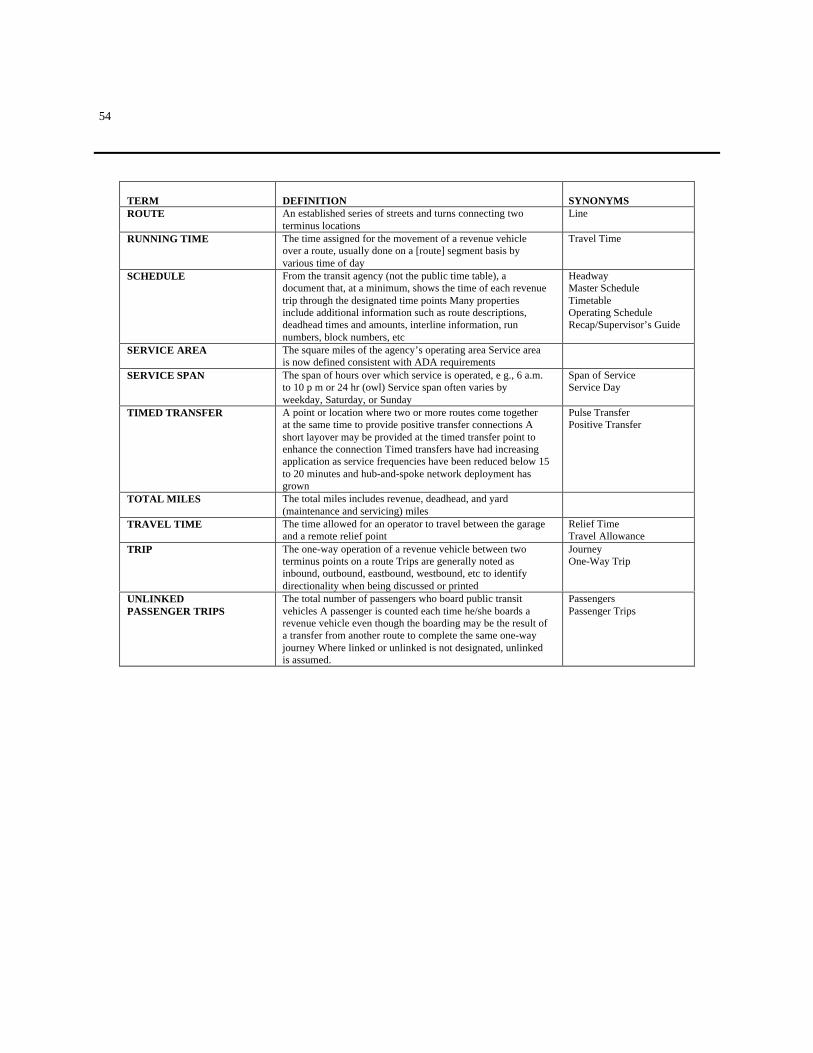
54
TERM DEFINITION SYNONYMSROUTE An established series of streets and turns connecting two
terminus locationsLine
RUNNING TIME The time assigned for the movement of a revenue vehicleover a route, usually done on a [route] segment basis byvarious time of day
Travel Time
SCHEDULE From the transit agency (not the public time table), adocument that, at a minimum, shows the time of each revenuetrip through the designated time points Many propertiesinclude additional information such as route descriptions,deadhead times and amounts, interline information, runnumbers, block numbers, etc
HeadwayMaster ScheduleTimetableOperating ScheduleRecap/Supervisor’s Guide
SERVICE AREA The square miles of the agency’s operating area Service areais now defined consistent with ADA requirements
SERVICE SPAN The span of hours over which service is operated, e g., 6 a.m.to 10 p m or 24 hr (owl) Service span often varies byweekday, Saturday, or Sunday
Span of ServiceService Day
TIMED TRANSFER A point or location where two or more routes come togetherat the same time to provide positive transfer connections Ashort layover may be provided at the timed transfer point toenhance the connection Timed transfers have had increasingapplication as service frequencies have been reduced below 15to 20 minutes and hub-and-spoke network deployment hasgrown
Pulse TransferPositive Transfer
TOTAL MILES The total miles includes revenue, deadhead, and yard(maintenance and servicing) miles
TRAVEL TIME The time allowed for an operator to travel between the garageand a remote relief point
Relief TimeTravel Allowance
TRIP The one-way operation of a revenue vehicle between twoterminus points on a route Trips are generally noted asinbound, outbound, eastbound, westbound, etc to identifydirectionality when being discussed or printed
JourneyOne-Way Trip
UNLINKEDPASSENGER TRIPS
The total number of passengers who board public transitvehicles A passenger is counted each time he/she boards arevenue vehicle even though the boarding may be the result ofa transfer from another route to complete the same one-wayjourney Where linked or unlinked is not designated, unlinkedis assumed.
PassengersPassenger Trips
THE TRANSPORTATION RESEARCH BOARD is a unit of the National Research Council, which serves the NationalAcademy of Sciences and the National Academy of Engineering It evolved in 1974 from the Highway Research Board, whichwas established in 1920. The TRB incorporates all former HRB activities and also performs additional functions under a broaderscope involving all modes of transportation and the interactions of transportation with society. The Board's purpose is tostimulate research concerning the nature and performance of transportation systems, to disseminate information that the researchproduces, and to encourage the application of appropriate research findings. The Board's program is carried out by more than 270committees, task forces, and panels composed of more than 3,300 administrators, engineers, social scientists, attorneys,educators, and others concerned with transportation; they serve without compensation. The program is supported by statetransportation and highway departments, the modal administrations of the U.S. Department of Transportation, the Association ofAmerican Railroads, the National Highway Traffic Safety Administration, and other organizations and individuals interested inthe development of transportation.
The National Academy of Sciences is a private, nonprofit, self-perpetuating society of distinguished scholars engaged inscientific and engineering research, dedicated to the furtherance of science and technology and to their use for the generalwelfare. Upon the authority of the charter granted to it by the Congress in 1863, the Academy has a mandate that requires it toadvise the federal government on scientific and technical matters. Dr Bruce Alberts is president of the National Academy ofSciences.
The National Academy of Engineering was established in 1964, under the charter of the National Academy of Sciences, as aparallel organization of outstanding engineers It is autonomous in its administration and in the selection of its members, sharingwith the National Academy of Sciences the responsibility for advising the federal government. The National Academy ofEngineering also sponsors engineering programs aimed at meeting national needs, encourages education and research, andrecognizes the superior achievements of engineers. Dr. Robert M.White is president of the National Academy of Engineering.
The Institute of Medicine was established in 1970 by the National Academy of Sciences to secure the services of eminentmembers of appropriate professions in the examination of policy matters pertaining to the health of the public. The Institute actsunder the responsibility given to the National Academy of Sciences by its congressional charter to be an adviser to the federalgovernment and, upon its own initiative, to identify issues of medical care, research, and education. Dr. KennethI. Shine is president of the Institute of Medicine.
The National Research Council was organized by the National Academy of Sciences in 1916 to associate the broadcommunity of science and technology with the Academy's purposes of furthering knowledge and advising the federalgovernment. Functioning in accordance with general policies determined by the Academy, the Council has become the principaloperating agency of both the National Academy of Sciences and the National Academy of Engineering in providing services tothe government, the public, and the scientific and engineering communities The Council is administered jointly by bothAcademies and the Institute of Medicine. Dr. Bruce Alberts and Dr. Robert M. White are chairman and vice chairman,respectively, of the National Research Council.