TCRP Report 19 - Department of Transportation
221
T RANSIT C OOPERATIVE R ESEARCH P ROGRAM SPONSORED BY The Federal Transit Administration TCRP Report 19 Guidelines for the Location and Design of Bus Stops Transportation Research Board National Research Council
Transcript of TCRP Report 19 - Department of Transportation

T R A N S I T C O O P E R A T I V E R E S E A R C H P R O G R A M
SPONSORED BY
The Federal Transit Administration
TCRP Report 19
Guidelines for the Location andDesign of Bus Stops
Transportation Research BoardNational Research Council

TCRP OVERSIGHT AND PROJECTSELECTION COMMITTEE
CHAIRMICHAEL S. TOWNESPeninsula Transportation Dist. Comm.
MEMBERSSHARON D. BANKSAC TransitLEE BARNESBarwood, Inc.GERALD L. BLAIRIndiana County Transit AuthoritySHIRLEY A. DeLIBERONew Jersey Transit CorporationROD J. DIRIDONInt'l Institute for Surface Transportation
Policy StudySANDRA DRAGGOOCATALOUIS J. GAMBACCINISEPTADELON HAMPTONDelon Hampton & AssociatesEDWARD N. KRAVITZThe Flxible CorporationJAMES L. LAMMIEParsons Brinckerhoff, Inc.PAUL LARROUSSEMadison Metro Transit SystemROBERT G. LINGWOODBC TransitGORDON J. LINTONFTAWILLIAM W. MILLARPort Authority of Allegheny CountyDON S. MONROEPierce TransitPATRICIA S. NETTLESHIPThe Nettleship Group, Inc.ROBERT E. PAASWELLThe City College of New YorkJAMES P. REICHERTReichert Management ServicesLAWRENCE G. REUTERMTA New York City TransitPAUL TOLLIVERKing County DOT/MetroFRANK J. WILSONNew Jersey DOTEDWARD WYTKINDAFL-CIO
EX OFFICIO MEMBERSJACK R. GILSTRAPAPTARODNEY E. SLATERFHWAFRANCIS B. FRANCOISAASHTOROBERT E. SKINNER, JR.TRB
TDC EXECUTIVE DIRECTORFRANK J. CIHAKAPTA
SECRETARYROBERT J. REILLYTRB
TRANSPORTATION RESEARCH BOARD EXECUTIVE COMMITTEE 1996
OFFICERS
Chair: James W. VAN Loben Sels, Director, California Department of TransportationVice Chair: David N. Wormley, Dean of Engineering, Pennsylvania State UniversityExecutive Director: Robert E. Skinner, Jr., Transportation Research Board
MEMBERS
EDWARD H. ARNOLD, Chair and CEO, Arnold Industries, Lebanon, PASHARON D. BANKS, General Manger, AC Transit, Oakland, CABRIAN J. L. BERRY, Lloyd Viel Berkner Regental Professor, Bruton Center for Development Studies,
University of Texas at DallasLILLIAN C. BORRONE, Director, Port Commerce, The Port Authority of New York and New Jersey
(Past Chair, 1995)DWIGHT M. BOWER, Director, Idaho Department of TransportationJOHN E. BREEN, The Nasser I. Al-Rashid Chair in Civil Engineering, The University of Texas at AustinWILLIAM F. BUNDY, Director, Rhode Island Department of TransportationDAVID BURWELL, President, Rails-to-Trails Conservancy, Washington, DCE. DEAN CARLSON, Secretary, Kansas Department of TransportationRAY W. CLOUGH, Nishkian Professor of Structural Engineering, Emeritus, University of California,
BerkeleyJAMES C. DELONG, Manager of Aviation, Denver International Airport, Denver, ColoradoJAMES N. DENN, Commissioner, Minnesota Department of TransportationDENNIS J. FITZGERALD, Executive Director, Capital District Transportation Authority, Albany, NYDAVID R. GOODE, Chair, President and CEO, Norfolk Southern CorporationDELON HAMPTON, Chair and CEO, Delon Hampton & AssociatesLESTER A. HOEL, Hamilton Professor, Civil Engineering, University of VirginiaJAMES L. LAMMIE, Director, Parsons Brinckerhoff, Inc., New York, NYROBERT E. MARTINEZ, Secretary of Transportation, Commonwealth of VirginiaCHARLES P. O'LEARY, JR., Commissioner, New Hampshire Department of TransportationCRAIG E. PHILIP, President, Ingram Barge Co., Nashville, TNWAYNE SHACKELFORD, Commissioner, Georgia Department of TransportationLESLIE STERMAN, Executive Director, East-West Gateway Coordinating Council, St. Louis, MOJOSEPH M. SUSSMAN, JR East Professor, Civil and Environmental Engineering, MITMARTIN WACHS, Director, University of California Transportation Center, Berkeley
EX OFFICIO MEMBERS
MIKE ACOTT, President, National Asphalt Pavement AssociationROY A. ALLEN, Vice President, Research and Test Department, Association of American RailroadsJOE N. BALLARD, Chief of Engineers and Commander, U.S. Army Corps of EngineersANDREW H. CARD, JR., President and CEO, American Automobile Manufacturers AssociationTHOMAS J. DONOHUE, President and CEO, American Trucking AssociationsFRANCIS B. FRANCOIS, Executive Director, American Association of State Highway and
Transportation OfficialsDAVID GARDINER, Administrator, U.S. Environmental Protection AgencyJACK R. GILSTRAP, Executive Vice President, American Public Transit AssociationALBERT J. HERBERGER, Maritime Administrator, U.S. Department of TransportationDAVID R. HINSON, Federal Aviation Administrator, U.S. Department of TransportationT. R. LAKSHMANAN, Director, Bureau of Transportation Statistics, U.S. Department of
TransportationGORDON J. LINTON, Federal Transit Administrator, U.S. Department of TransportationRICARDO MARTINEZ, National Highway Traffic Safety Administrator, U.S. Department of
TransportationJOLENE M. MOLITORIS, Federal Railroad Administrator, U.S. Department of TransportationDHARMENDRA K. (DAVE) SHARMA, Research and Special Programs Administrator, U.S.
Department of TransportationRODNEY E. SLATER, Federal Highway Administrator, U.S. Department of Transportation
TRANSIT COOPERATIVE RESEARCH PROGRAM
Transportation Research Board Executive Committee Subcommittee for TCRPJAMES W. VAN LOBEN SELS, California Department of Transportation (Chair)DENNIS J. FITZGERALD, Capital District Transportation Authority, Albany, NYLILLIAN C. BORRONE, The Port Authority of New York and New Jersey (Chair)LESTER A. HOEL, University of VirginiaGORDON J. LINTON, U.S. Department of TransportationROBERT E. SKINNER, JR., Transportation Research BoardDAVID N. WORMLEY, Pennsylvania State University

T R A N S I T C O O P E R A T I V E R E S E A R C H P R O G R A M
Report 19
Guidelines for the Location andDesign of Bus Stops
TEXAS TRANSPORTATION INSTITUTETEXAS A&M RESEARCH FOUNDATION
TEXAS A&M UNIVERSITYCollege Station, TX
Subject Area
Public TransitPlanning and Administration
Research Sponsored by the Federal Transit Administration inCooperation with the Transit Development Corporation
TRANSPORTATI ON RESEARCH BO ARDNATIONAL RESEARCH COUNCIL
NATIONAL ACADEMY PRESSWashington, D.C. 1996

TRANSIT COOPERATIVE RESEARCH PROGRAM
The nation's growth and the need to meet mobility,environmental, and energy objectives place demands on publictransit systems. Current systems, some of which are old and in needof upgrading, must expand service area, increase service frequency,and improve efficiency to serve these demands. Research isnecessary to solve operating problems, to adapt appropriate newtechnologies from other industries, and to introduce innovationsinto the transit industry. The Transit Cooperative Research Program(TCRP) serves as one of the principal means by which the transitindustry can develop innovative near-term solutions to meetdemands placed on it.
The need for TCRP was originally identified in TRB SpecialReport 213—Research for Public Transit: New Directions,published in 1987 and based on a study sponsored by the UrbanMass Transportation Administration—now the Federal TransitAdministration (FTA). A report by the American Public TransitAssociation (APTA), Transportation 2000, also recognized theneed for local, problem-solving research. TCRP, modeled after thelongstanding and successful National Cooperative HighwayResearch Program, undertakes research and other technicalactivities in response to the needs of transit service providers. Thescope of TCRP includes a variety of transit research fields includingplanning, service configuration, equipment, facilities, operations,human resources, maintenance, policy, and administrative practices.
TCRP was established under FTA sponsorship in July 1992.Proposed by the U.S. Department of Transportation, TCRP wasauthorized as part of the Intermodal Surface TransportationEfficiency Act of 1991 (ISTEA). On May 13, 1992, a memorandumagreement outlining TCRP operating procedures was executed bythe three cooperating organizations: FTA; the National Academy ofSciences, acting through the Transportation Research Board(TRB); and the Transit Development Corporation, Inc. (TDC), anonprofit educational and research organization established byAPTA. TDC is responsible for forming the independent governingboard, designated as the TCRP Oversight and Project Selection(TOPS) Committee.
Research problem statements for TCRP are solicited periodicallybut may be submitted to TRB by anyone at any time It is theresponsibility of the TOPS Committee to formulate the researchprogram by identifying the highest priority projects. As part of theevaluation, the TOPS Committee defines funding levels andexpected products.
Once selected, each project is assigned to an expert panel,appointed by the Transportation Research Board. The panelsprepare project statements (requests for proposals), selectcontractors, and provide technical guidance and counsel throughoutthe life of the project. The process for developing research problemstatements and selecting research agencies has been used by TRB inmanaging cooperative research programs since 1962. As in otherTRB activities, TCRP project panels serve voluntarily withoutcompensation.
Because research cannot have the desired impact if products failto reach the intended audience, special emphasis is placed ondisseminating TCRP results to the intended end users of theresearch: transit agencies, service providers, and suppliers. TRBprovides a series of research reports, syntheses of transit practice,and other supporting material developed by TCRP research. APTAwill arrange for workshops, training aids, field visits, and otheractivities to ensure that results are implemented by urban and ruraltransit industry practitioners.
The TCRP provides a forum where transit agencies cancooperatively address common operational problems. The TCRPresults support and complement other ongoing transit research andtraining programs.
TCRP REPORT 19
Project A-10 FY'94ISSN 1073-4872ISBN 0-309-06050-8Library of Congress Catalog Card No. 96-61605
Price $47.00
NOTICE
The project that is the subject of this report was a part of the Transit CooperativeResearch Program conducted by the Transportation Research Board with theapproval of the Governing Board of the National Research Council. Suchapproval reflects the Governing Board's judgment that the project concerned isappropriate with respect to both the purposes and resources of the NationalResearch Council.
The members of the technical advisory panel selected to monitor this project andto review this report were chosen for recognized scholarly competence and withdue consideration for the balance of disciplines appropriate to the project. Theopinions and conclusions expressed or implied are those of the research agencythat performed the research, and while they have been accepted as appropriate bythe technical panel, they are not necessarily those of the Transportation ResearchBoard, the National Research Council, the Transit Development Corporation, orthe Federal Transit Administration of the U.S. Department of Transportation.
Each report is reviewed and accepted for publication by the technical panelaccording to procedures established and monitored by the TransportationResearch Board Executive Committee and the Governing Board of the NationalResearch Council.
Special Notice
The Transportation Research Board, the National Research Council, the TransitDevelopment Corporation, and the Federal Transit Administration (sponsor of theTransit Cooperative Research Program) do not endorse products ormanufacturers. Trade or manufacturers' names appear herein solely because theyare considered essential to the clarity and completeness of the project reporting.
Published reports of the
TRANSIT COOPERATIVE RESEARCH PROGRAM
are available from:
Transportation Research BoardNational Research Council2101 Constitution Avenue, N.W.Washington, D.C. 20418
Printed in the United States of America

FOREWORDBy Staff
Transportation Research Board
TCRP Report 19, Guidelines for the Location and Design of Bus Stops, will be ofinterest to individuals and groups with a stake in the location and design of bus stops.This includes those associated with public transportation organizations, public worksdepartments, local departments of transportation, developers, and public and privateorganizations along or near bus routes.
The primary objective of this research was to develop guidelines for locating anddesigning bus stops in various operating environments. These guidelines will assisttransit agencies, local governments, and other public bodies in locating and designingbus stops that consider bus patrons' convenience, safety, and access to sites as well assafe transit operations and traffic flow. The guidelines include information aboutlocating and designing bus stops and checklists of factors that should be considered.
The research began with a literature review and the identification of stakeholders'concerns through mail and telephone surveys and face-to-face interviews. A review of28 transit agency manuals on bus stop design and location provided the basis for anappraisal of current practice. Observations made at more than 270 bus stops duringregional visits to Arizona, Michigan, and California were supplemented with trafficfield studies conducted at 14 bus stops and pedestrian field studies conducted at 10 busstops. Computer simulation of bus stops on suburban highways was also used todevelop the findings.
The guidelines include three sections: the "big picture," street-side design, andcurb-side design.
• The big picture section of the guidelines addresses the need for cooperationand coordination among stakeholders during the design and location of busstops. Such efforts result in mutually satisfying outcomes for diverse interestsand can preclude many problems that often arise.
• The street-side section discusses matters such as curb radii and when toconsider installing the various bus stop configurations (curb-side, nub, busbay, open bus bay, and queue jumper bus bay) and different bus stoplocations (near-side, far-side, and midblock). This section of the guidelinesaddresses possible effects of bus stop location and design on bus operationsand traffic flow.
• The curb-side section addresses community integration; pedestrian access tobus stops; placement of bus stops in the right of way; environmentaltreatments; bus shelter designs; shelter construction materials; and amenities,such as lighting, benches, vending machines, trash receptacles, telephones,bus route and schedule information, and bicycle storage facilities.
The guidelines also include two appendixes that present the results of the street-sideand curb-side studies.

A secondary objective of this research project was to develop or assemble the mostcomprehensive and technically current information on bus stop design. The researchteam prepared a final report that presents the research approach and findings, includingthe results of the literature review, review of transit agency manuals, and surveyfindings. This report, which is not published, is available, on loan, from TCRP.

TABLE OF CONTENTS
CHAPTER 1 INTRODUCTIONNEED FOR THIS RESEARCH ............................................................................. 1SOURCES OF MATERIAL................................................................................... 2ORGANIZATION OF GUIDELINES................................................................... 3
CHAPTER 2 THE BIG PICTUREUNIVERSAL CONCERNS ................................................................................... 5LIVABLE COMMUNITIES .................................................................................. 6THE PLAYERS...................................................................................................... 7IDENTIFICATION OF NEED............................................................................... 8LOCATION AND DESIGN FLOWCHART......................................................... 9COORDINATION AND COOPERATION......................................................... 10
Hypothetical Medical Center Example........................................................... 10
CHAPTER 3 STREET-SIDE FACTORSORGANIZATION................................................................................................ 17PLACEMENT CONSIDERATIONS................................................................... 18
Stop Spacing ................................................................................................... 18General Considerations................................................................................... 19
PLACEMENT OF BUS STOP............................................................................. 20Far-side, Near-Side, and Midblock Stops....................................................... 20
BUS STOP ZONE DESIGN TYPES ................................................................... 22Types of Bus Stops ......................................................................................... 23Curb-side Bus Stop Zone Dimensions............................................................ 24Bus Bay........................................................................................................... 26Use of Bus Bays ............................................................................................. 27Bus Bay Dimensions ...................................................................................... 28Open Bus Bay................................................................................................. 30Partial Open Bus Bay...................................................................................... 31Queue Jumper Bus Bay .................................................................................. 32Nub ................................................................................................................. 34
VEHICLE CHARACTERISTICS........................................................................ 36Vehicle Types and Dimensions ...................................................................... 36Turning Radium Template.............................................................................. 38Wheelchair Lift............................................................................................... 40Bikes on Buses................................................................................................ 41
ROADWAY AND INTERSECTION DESIGN .................................................. 42Roadway Design............................................................................................. 42Pavement ........................................................................................................ 43Intersections.................................................................................................... 44Driveways....................................................................................................... 46

TABLE OF CONTENTS
CHAPTER 3 STREET-SIDE FACTORSROADWAY AND INTERSECTION DESIGN (continued)
Traffic Signals ................................................................................................ 47Sign Locations ................................................................................................ 48Traffic Control and Regulation of Bus Stops ................................................. 49
SAFETY ............................................................................................................... 50STREET-SIDE PLACEMENT CHECKLIST ..................................................... 52
CHAPTER 4 CURB-SIDE FACTORSORGANIZATION................................................................................................ 55PEDESTRIAN ACCESS...................................................................................... 56
Patron Access ................................................................................................. 56Bus Stop to Sidewalk Connections................................................................. 57Coordinating Access with Commercial or Business Development................ 58Coordinating Access with Residential Development ..................................... 59
ADA...................................................................................................................... 60Accessibility Guidelines ................................................................................. 60
WAITING OR ACCESSORY PADS .................................................................. 64Sizing and Positioning.................................................................................... 64Nubs................................................................................................................ 65
SHELTERS........................................................................................................... 66Inclusion and Sizing ....................................................................................... 66Determining the Final Location...................................................................... 67Configurations and Orientations..................................................................... 68Advertising ..................................................................................................... 70Developer Provided ........................................................................................ 72Artistic and Thematic Designs ....................................................................... 73
AMENITIES......................................................................................................... 74Benches........................................................................................................... 74Route or Patron Information........................................................................... 76Vending Machines .......................................................................................... 78Bicycle Storage Facilities ............................................................................... 79Trash Receptacles ........................................................................................... 80Phones............................................................................................................. 82Shopping Cart Storage Area ........................................................................... 83Lighting .......................................................................................................... 84Security........................................................................................................... 85Advantages and Disadvantages ...................................................................... 86Materials ......................................................................................................... 88Materials Advantages and Disadvantages ...................................................... 89
CURB-SIDE PLACEMENT CHECKLIST ......................................................... 90

TABLE OF CONTENTS
CHAPTER 5 GLOSSARYTERMS AND DEFINITIONS ............................................................................. 95
APPENDIX A LITERATURE SEARCH .................................................................................. 99
APPENDIX B REVIEW OF TRANSIT AGENCY'S MANUALS ......................................... 99
APPENDIX C SURVEY FINDINGS ......................................................................................... 99
APPENDIX D STREET-SIDE STUDIES................................................................................ D-1
APPENDIX E CURB-SIDE STUDIES .....................................................................................E-1

ACKNOWLEDGMENTS
This work, sponsored by the Federal Transit Administration, was conducted in the Transit Cooperative ResearchProgram, which is administered by the Transportation Research Board of the National Research Council.
The research reported herein was performed under TCRP Project A-10 by the Texas Transportation Institute. TexasA&M Research Foundation was the contractor for this study. Kay Fitzpatrick, Associate Research Engineer, TexasTransportation Institute, was the principal investigator. The other authors of this report are Kevin Hall, AssistantResearch Scientist; Dennis Perkinson, Assistant Research Scientist; Lewis Nowlin, Assistant Research Scientist; andRodger Koppa, Associate Research Engineer, all of the Texas Transportation Institute. Other TTI staff who assisted withthis project include Pat Beck, Alan Black, Melinda Butts, Jon Collins, Steve Farnsworth, Shirley Kalinec, Stacy King,Joseph Koothrappally, Molly Marshall, Maria Medrano, Angelia Parham, Kelly Quy, Jason Vaughn, and Jennifer White.The work was performed under the general supervision of Dr. Fitzpatrick.
The authors wish to acknowledge the many individuals who contributed to this research by participating in the mail-outsurveys, the phone survey, the regional visits, the field data-collection efforts, and the review of the developedguidelines.
The research team is especially grateful for the contributions of William Capps, Alan Danaher, Ed Demming, CharlesFelix, Mark Fedorowic, Joe Garcia, E. J. Hynick, Chuck Italino, Michele Korf, Suzanne LaPlant, Chris Leighty, SteveMiraglio, Matilde Miranda, Dennis O'Malley, Larry Shobe, Wayne Tanda, Mayuko Tzanavaras, James Unites, KiyoUshino, Bill Volk, Duncan Watry, Christopher White, and Ronald K. Wong.

COOPERATIVE RESEARCH PROGRAMS STAFF
ROBERT J. REILLY, Director, Cooperative Research ProgramsSTEPHEN J. ANDRLE, Manager, Transit Cooperative Research ProgramDIANNE S. SCHWAGER, Senior Program OfficerEILEEN P. DELANEY, EditorKAMI CABRAL, Assistant EditorHILARY FREER, Assistant Editor
PROJECT PANEL A-10
DENNIS FITZGERALD, Capital District Transportation Authority, Albany, NY (Chair)ROBERT GARSIDE, Houston Metro Transit Authority, Houston, TXDENNIS P. HINEBAUGH, University of South Florida, Tampa, FLART LAWSON, Office of Mass Transit, D.C. Government, Washington, D.C.CLEMENTINE W. MORRIS, Transit Authority of River City, Louisville, KYZUBAIDA MOSHARRAF, Metropolitan Atlanta RTA, Alanta, GAJOHN D. WILKINS, New Jersey Transit, Newark, NJMICHAEL YORK, Greater Cleveland Regional Transit Authority, Cleveland, OHEDWARD L. THOMAS, FTA Liaison RepresentativeRICHARD CUNARD, TRB Liaison Representative

This page left intentionally blank.

INTRODUCTIONNEED FOR THIS RESEARCH
Chapter
1
1
The bus stop is the first point of contact between the passenger and the bus service. The spacing,location, design, and operation of bus stops significantly influence transit system performance andcustomer satisfaction.
In recognition of the importance of bus stop location and design, the Transit Cooperative ResearchProgram (TCRP) sponsored research to develop guidelines for use in designing and locating busstops. The objective of this research was to develop guidelines for locating and designing bus stops invarious operating environments. These guidelines can assist transit agencies, local governments, andother public bodies in locating and designing bus stops that consider bus patrons' convenience, safety,and access to sites, as well as safe transit operations and traffic flow. The guidelines include acompilation of information necessary for locating and designing bus stops, as well as checklists offactors that must be taken into consideration. The guidelines list the advantages and disadvantages ofvarious bus stop treatments and discuss the trade-offs among different alternatives.
These guidelines also provide an approach to integrating transit and development. By assembling theinformation into a single document, public agencies and developers can more easily incorporatetransit needs into the design and operations of streets and highways, as well as in land development.Finally, these guidelines should help transit, state, and local agencies in selecting bus stop amenities.

INTRODUCTIONChapter
1 SOURCES OF MATERIAL
2
This research includes evaluations of current policies regarding bus stop design and location, reviewsof the relevant literature, and extensive interviews and site visits. Appreciation goes to those whoassisted in this study, including those who responded to our surveys, met with us during the regionalvisits, helped with the data collection efforts, and provided reviews of these guidelines.Documentation of the research performed during the development of these guidelines is contained inLocation and Design of Bus Stops, TCRP Project A-10 Final Report, and Appendixes D and E of thisdocument. The Final Report is available for loan on request from TCRP. It includes the following:
• Summary• Introduction• Findings• Interpretation, Appraisal, Application• Conclusions and Suggested Research• Appendix A - Literature Search• Appendix B - Review of Transit Agency's Manuals• Appendix C - Survey Findings
Several excellent manuals are currently being used by various cities and transit agencies. Thesemanuals, along with the literature, were reviewed during the development of these guidelines. Somefigures and text used in these guidelines are reproductions or expansions of material containedelsewhere. The contributions of the following documents in the development of these guidelines arerecognized:
• Bus Stop Handbook: Street Improvements for Transit, Valley Metro, Regional PublicTransportation Authority, Phoenix, Arizona, December 1993.
• Tri-Met Bus Stops and Passenger Amenities Guidelines, Tri-Met Transit Development andPlanning and Scheduling Departments, Portland, Oregon area, November 1994.
• Bus Passenger Facilities - Street Improvement Guidelines, Regional Public TransportationAuthority, Draft, Phoenix, Arizona, March 1989.
• Planning for Transit, A Guide for Community and Site Planning, Regional TransportationCommission of Washoe County, Nevada, June 1992.
INTRODUCTIONORGANIZATION OF GUIDELINES
Chapter
1
3
These guidelines provide a useful and practical tool for the location and design of bus stops. Chapter1 introduces the materials included within this document. Chapter 2 provides a general overview ofthe broad issues associated with the location and design of bus stops. Special emphasis is placed onthe need for coordination and cooperation between public officials and private interests to enhancecommunity acceptance of transit operations and to improve patron access, comfort, and convenience.
The guidelines are organized to reflect the two major issues associated with bus stop design andplacement: street-side factors and curb-side factors. Street-side factors are those factors associatedwith the roadway that influence bus operations. Curb-side factors are those factors located off theroadway that affect patron comfort, convenience, and safety.
To enhance vehicle and system performance, street-side factors are discussed in Chapter 3. Busvehicle characteristics, including vehicle size and turning radii, are provided. In addition, discussionsare included on various bus stop designs and when to consider each design. Chapter 4 addresses thecurb-side factors. General discussions of amenities and various curb-side design strategies areincluded. For quick and easy reference to the factors that influence the final design and placement ofa bus stop, checklists are included at the end of Chapters 3 and 4 for street-side and curb-side issues.The final chapter of the guidelines (Chapter 5) is the Glossary of terms used in the guidelines.
In addition to the guidelines, this report includes the findings from the street-side and curb-sidestudies in Appendix D (Street-Side Studies) and Appendix E (Curb-Side Studies), respectively.
This page left intentionally blank.

THE BIG PICTUREUNIVERSAL CONCERNS
Chapter
2
5
As the first point of contact between the passenger and the transit service, the bus stop is a criticalelement in a transit system's overall goal of providing timely, safe, and convenient transportation.
Several universal concerns of both users and providers of transit services include the following:
Transit system performance: Travel time for a bus trip has four components: the time ittakes to walk to the bus stop, the wait time for the bus, the actual in-vehicle travel time, andthe time to walk to the destination. Each is affected by the bus stop location and the frequencyof the bus stops.
Traffic flow: Bus stop location and design affect the flow and movement of other vehicles. Awell-designed bus stop can allow passengers to board and alight without the bus significantlyimpeding or delaying adjacent traffic.
Safety: Safety is the freedom from danger and risk. In the transit environment it includes anindividual's relationship to buses and general traffic, and the bus' relationship to othervehicles. Pedestrian safety issues include the nearness of a bench to the flow of traffic on abusy street or safely crossing the street to reach the bus stop. Bus reentry into the flow oftraffic safely is an example of an operational safety concern. Thus, pedestrians, buspassengers, buses, and private vehicles can all be involved in concerns for safety at or near abus stop.
Security: Security refers to an individual's feeling of well being. Security is affected bylighting at bus stops, bus stop visibility from the street and from nearby land uses, and busstop locations with hiding places. Security involves neighborhood residents, bus patrons, andbus drivers.
These are the functional and performance-related concerns in public transportation. Each must beaddressed to achieve the goal of timely, safe, and convenient public transportation and to satisfy theneeds of the service area. More importantly, to those who plan bus stops, each area of concern isinfluenced by the bus stop location and design decisions.

THE BIG PICTUREChapter
2 LIVABLE COMMUNITIES
6
The transit system must be integrated into the everyday life of a community to realize its fullpotential. Consideration should be given to long-term design and system performance, which canenhance the interaction of transit with communities. Only in this way can transit become an acceptedpart of the infrastructure and contribute to the creation of a "livable community."
The goal of the Livable Communities Initiative is to strengthen the link between transitand communities by improving personal mobility, transportation system performance,and the quality of life in communities by
• strengthening the link between transit planning and community planning, including landuse policies and urban design supporting the use of transit, and ultimately providingphysical assets that better meet the community needs;
• stimulating increased participation in the decision-making process by communityorganizations, minority and low-income residents, small and minority businesses, personswith disabilities, and the elderly;
• increasing access to employment, education facilities, and other community destinationsthrough high-quality, community-oriented, and technologically innovative transit servicesand facilities; and
• leveraging resources available through other federal, state, and local programs.
Transit is an integral part of livable communities. Specifically, the efficient placement of bus stopsnear major destinations and within easy access provides a viable transportation alternative to theautomobile by making the entire transit trip shorter and more pleasant.
Thus, the key to successful and productive integration of transit into the fabric of everydaycommunity life includes the location and design of bus stops.

THE BIG PICTURETHE PLAYERS
Chapter
2
7
The key players in bus stop location and design are as follows:
Transit agency - The transit agency is usually the primary provider of transit service.
City government - The authority with jurisdiction over the streets and sidewalks in the transitservice area is usually a city, but county or state agencies are sometimes involved.
Developers - Developers provide new construction and growth in the transit service area.Development may be either residential or commercial. Though both are concerned withaccess, the specific nature of those concerns may vary between residential and commercialdevelopment.
Employers - Employees and retail customers are potential transit riders. Employers benefitwhen their employees and customers can travel to work easily and efficiently.
Neighborhood groups - Neighborhood residents are potential consumers of transit service,and potential supporters of transit, whether they use this service or not.
Key destinations - These are the trip generators (central business districts, schools, shoppingareas, public buildings, medical facilities, etc.) for those who work at these locations, and forthose who use the services provided at these locations.
While the individual priorities of these players may vary, the players have the same interest in thepotential benefit of timely, safe, and convenient transit service. They are the stakeholders in bus stoplocation and design. Although specific methods must vary to suit each particular situation, thechallenge is to use their common interest to productively involve relevant players so that efficienttransit service can result.

THE BIG PICTUREChapter
2 IDENTIFICATION OF NEED
8
Issues transit agencies consider when determining whether a bus stop is needed include the following:
Transit Agency Policy- Route types (definitions and criteria)- Guidelines for stop installation (boardings and alightings, headways, land use)- Special cases/Exceptions (neighborhood requests, hospitals, procedures)
Equity- Title 6 - Civil Rights Act of 1964 (equity in level of service among different segments of the
community)- Public Relations (perceptions, media attention, community leaders)- Transit dependent areas (demographics, socioeconomics, unique needs)
Accessibility/ADA- Access to the stop (sidewalks, curb cuts, pedestrian crossings)- Access to amenities (shelter dimensions, width of walkways)- Access at the stop (level loading area, lift deployment space)
Various factors relating to transit operations are also important in determining the need for a bus stop.Some of the more important factors are
Trip Generation/Land Use - How many potential bus passengers?
Walking Distance - How far do passengers have to walk?
Boardings and Alightings - How many passengers are getting on and off?
Dwell Time - How long does the bus dwell at the stop?
Travel Time - How long is the trip from the origin to the rider's destination?
Transfer Potential - How many routes serve this stop?

THE BIG PICTURELOCATION AND DESIGN FLOWCHART
Chapter
2
9
Bus stop design and location decisions begin with the request or the recognition that a new ormodified bus stop is needed. The process concludes with the implementation of numerous interrelateddecisions. A flow chart of the decision process is shown below.

THE BIG PICTUREChapter
2 COORDINATION AND COOPERATION—Hypothetical Medical Center
10
Both transit and city officials agree that advantages exist when coordination occurs amonggovernmental entities and with neighborhood organizations, developers and others. Most majorsuccesses (i.e., design and access, proper placement) involved a good, close working relationshipbetween the transit agency and the city.
Hypothetical Medical Center Example
Locating bus stops at land uses surrounded by large parking lots is a common occurrence. Thissituation is especially evident along suburban arterials developed with current zoning regulations thatencourage the building of extensive parking lots in front of the land use. The large parking lots serveas barriers between the bus stop and the land use. Bus patrons must walk through an uninvitingenvironment (i.e., long stretches of asphalt, between parked cars) to reach the building or bus stop.The size of the parking lot also discourages the transit vehicle from boarding and alighting passengersdirectly adjacent to the building due to the potential for increased points of conflict with generalvehicular traffic and pedestrians in the parking lot. The bus travel time and distance would alsoincrease considerably if route deviations into parking lots occurred at every stop.
An example of the need to coordinate the location of the bus stop with the land use is illustrated bythe hypothetical medical development on the following pages. Because elderly or medically disabledindividuals may use this bus stop more than other bus stops along the route, it is critical that buspatrons are provided with a safe and direct route from the bus stop to the hospital.
The examples show the potential problems and solutions associated with coordinating a bus stop withthis type of development. Both existing and new development scenarios are presented and advantagesand disadvantages of each potential solution are listed below. The large number of solutions for thesame problem highlights the fact that each site can have multiple solutions. Coordination among thedifferent players involved (i.e., transit agency, city, medical center, developer) can enhance thecomfort and safety of bus patrons getting to this stop and can improve transit service to this site.

THE BIG PICTURECOORDINATION & COOPERATION—Hypothetical Medical Center
Chapter
2
11
Hypothetical Medical Center: Providing access without coordination and cooperation.
Positives:! (+) Bus remains on a main thoroughfare, minimizing total travel time along the bus
route.
! (+) Bus stop is more visible to passing vehicles and helps advertise the availability andlocation of public transit.
Negatives:! (-) Patrons must walk through a vast parking lot to reach the medical center.
! (-) Potential exists for vehicular and pedestrian conflicts as patrons walk throughparking lot.
! (-) Parking lot is uninviting and offers little in the way of environmental comfort.
! (-) Security of patrons may be compromised as they walk through parking lot.

THE BIG PICTUREChapter
2 COORDINATION & COOPERATION—Hypothetical Medical Center
12
Hypothetical Medical Center: Deviating the route.
Positives:! (+) Permits bus route to access land uses more directly.
! (+) Potential for shared use of overhang for bus patrons during inclement weather.
! (+) Reduces walking time and distance from the land use to the bus stop.
! (+) Reduces the potential for vehicular/pedestrian conflicts in the parking lot.
! (+) Patron security may be enhanced through proximity to land use. Indirectsurveillance from the land use may be increased and the number of potential hidingplaces is removed by placing the stop adjacent to the building.
Negatives:! (-) Bus/general vehicle conflicts may increase by having the route deviate into the
parking areas.
! (-) Route travel time and distance are increased.

THE BIG PICTURECOORDINATION & COOPERATION—Hypothetical Medical Center
Chapter
2
13
Hypothetical Medical Center: Installing a pedestrian promenade throughthe parking lot.
Positives:! (+) Bus vehicle remains on a main thoroughfare, minimizing trip time and distance.
! (+) Reduces opportunity for pedestrian/vehicular conflicts in parking lot byconstructing a well-defined pedestrian corridor.
! (+) Patron comfort is enhanced by providing shade trees along a promenade.
! (+) Security of patrons may be enhanced if the promenade is well-lit.
Negatives:! (-) Does not reduce walking distance or time between the land use and the bus stop.
! (-) Patron security may still be compromised if the promenade is not well used, well-lit, or sight-lines are restricted by vegetation.
THE BIG PICTUREChapter
2 COORDINATION & COOPERATION—Hypothetical Medical Center
14
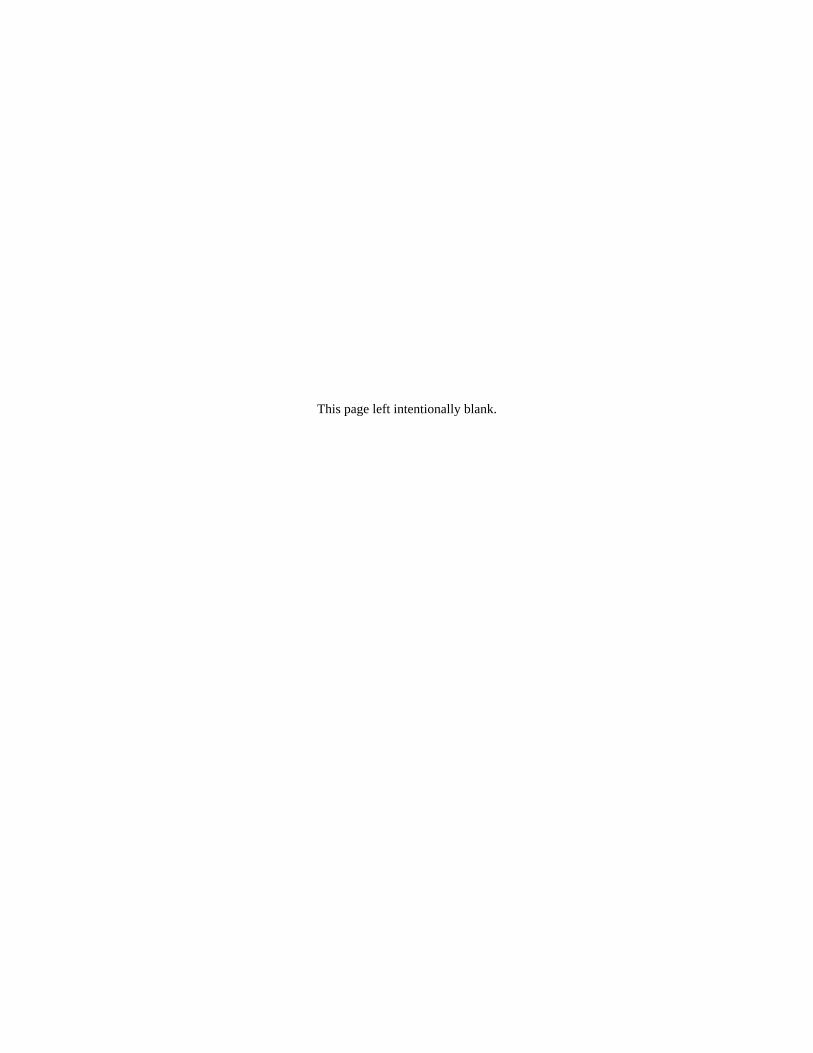
Hypothetical Medical Center: Orienting building closer to the street and havingparking to the rear and sides of the facility.
Positives:! (+) Transit passenger walking time and distance is reduced since the building is near
the road.
! (+) Patron security is enhanced by having indirect surveillance from the building andpassing vehicular traffic.
! (+) Potential for pedestrian/vehicular conflicts are reduced between the land use andthe bus stop.
! (+) Potential for shared use of the building facilities, such as overhangs and atriums, bybus patrons during inclement weather.
! (+) Bus remains on main route by eliminating the need to deviate into a parking lot.
Negatives:! (-) Challenges traditional land use practices, which may make communities more
reluctant to implement such a strategy.
! (-) Confusion may develop concerning responsibilities for the maintenance and up-keep of a bus stop that is near a major generator of activity.

THE BIG PICTURECOORDINATION & COOPERATION—Hypothetical Medical Center
Chapter
2
15
Hypothetical Medical Center: Expanding facility.
Positives:! (+) Bus vehicle remains on a main thoroughfare.
! (+) Pedestrian access to bus stop is enhanced by juxtaposing building with bus stopand having pedestrian promenades.
! (+) Bus patron comfort is enhanced by the addition of shade trees along the promenadeand the installation of a covered walkway between buildings.
! (+) Reduces bus patron exposure to poor weather.
Negatives:! (-) Pedestrian improvements are costly to construct.
! (-) Requires coordination among many different "players."
! (-) Orientation of new building and parking may challenge traditional land usepractices.

STREET-SIDE FACTORSORGANIZATION
Chapter
3
17
Street-side factors include those factors associated with the roadway that influence bus operations.This chapter begins with discussion of bus stop placement. Next is information on bus stop zonedesign types. Following the detailed presentation of the different types of bus stops (e.g., bus bays,nubs, etc.) is discussion of vehicle characteristics. This is followed by information on how roadwayand intersection design can accommodate the unique qualities of buses. The chapter ends withinformation on safety and a checklist for evaluating street-side factors.

STREET-SIDE FACTORSChapter
3 PLACEMENT CONSIDERATIONS—Stop Spacing
18
Bus stop spacing has a major impact on transit vehicle and system performance. Stop spacing alsoaffects overall travel time, and therefore, demand for transit. In general, the trade-off is between:
Close stops (every block or1/8 to 1/4 mile), short walkdistances, but more frequentstops and a longer bus trip.
Versus
Stops farther apart, longerwalk distances, but moreinfrequent stops, higherspeeds, and therefore, shorterbus trips.
The determination of bus stop spacing is primarily based on goals that are frequently subdivided bydevelopment type, such as residential area, commercial, and/or a central business district (CBD).Another generally accepted procedure is placing stops at major trip generators. The following aretypical bus stop spacings used. The values represent a composite of prevailing practices.

STREET-SIDE FACTORSPLACEMENT CONSIDERATIONS—General Considerations
Chapter
3
19
After ridership potential has been established, the most critical factors in bus stop placements aresafety and avoidance of conflicts that would otherwise impede bus, car, or pedestrian flows.
In selecting a site for placement of a bus stop, the need for future passenger amenities is an importantconsideration (see Chapter 4). If possible, the bus stop should be located in an area where typicalimprovements, such as a bench or a passenger shelter, can be accommodated in the public right-of-way. The final decision on bus stop location is dependent on several safety and operating elementsthat require on-site evaluation. Elements to consider in bus stop placement include the following:
Safety:• Passenger protection from passing traffic• Access for people with disabilities• All-weather surface to step from/to the bus• Proximity to passenger crosswalks and curb ramps• Proximity to major trip generators• Convenient passenger transfers to routes with nearby stops• Proximity of stop for the same route in the opposite direction• Street lighting
Operating:• Adequate curb space for the number of buses expected at the stop at one time• Impact of the bus stop on adjacent properties• On-street automobile parking and truck delivery zones• Bus routing patterns (i.e., individual bus movements at an intersection)• Directions (i.e., one-way) and widths of intersection streets• Types of traffic signal controls (signal, stop, or yield)• Volumes and turning movements of other traffic• Width of sidewalks• Pedestrian activity through intersections• Proximity and traffic volumes of nearby driveways

STREET-SIDE FACTORSChapter
3 PLACEMENT OF BUS STOP—Far-Side, Near-Side, and Midblock Stops
20
Determining the proper location of bus stops involves choosing among far-side, near-side, andmidblock stops (see Figure 1). Table 1 presents a comparison of the advantages and disadvantages ofeach bus stop type. The following factors should be considered when selecting the type of bus stop:
• Adjacent land use and activities• Bus route (for example, is bus turning at
the intersection)• Bus signal priority (e.g., extended green
suggests far side placement• Impact on intersection operations• Intersecting transit routes• Intersection geometry• Parking restrictions and requirements
• Passenger origins and destinations• Pedestrian access, including accessibility
for handicap/wheelchair patrons• Physical roadside constraints (trees, poles,
driveways, etc.)• Potential patronage• Presence of bus bypass lane• Traffic control devices
Figure 1. Example of Far-Side, Near-Side, and Midblock Stops.

STREET-SIDE FACTORSPLACEMENT OF BUS STOP—Far-Side, Near-Side, and Midblock Stops
Chapter
3
21
Table 1. Comparative Analysis of Bus Stop Locations.

STREET-SIDE FACTORSChapter
3 BUS STOP ZONE DESIGN TYPES—Types of Stops
22
Various configurations of a roadway are available to accommodate bus service at a stop. Figure 2illustrates different street-side bus stop design while Table 2 presents their advantages anddisadvantages.
Figure 2. Street-Side Bus Stop Design.
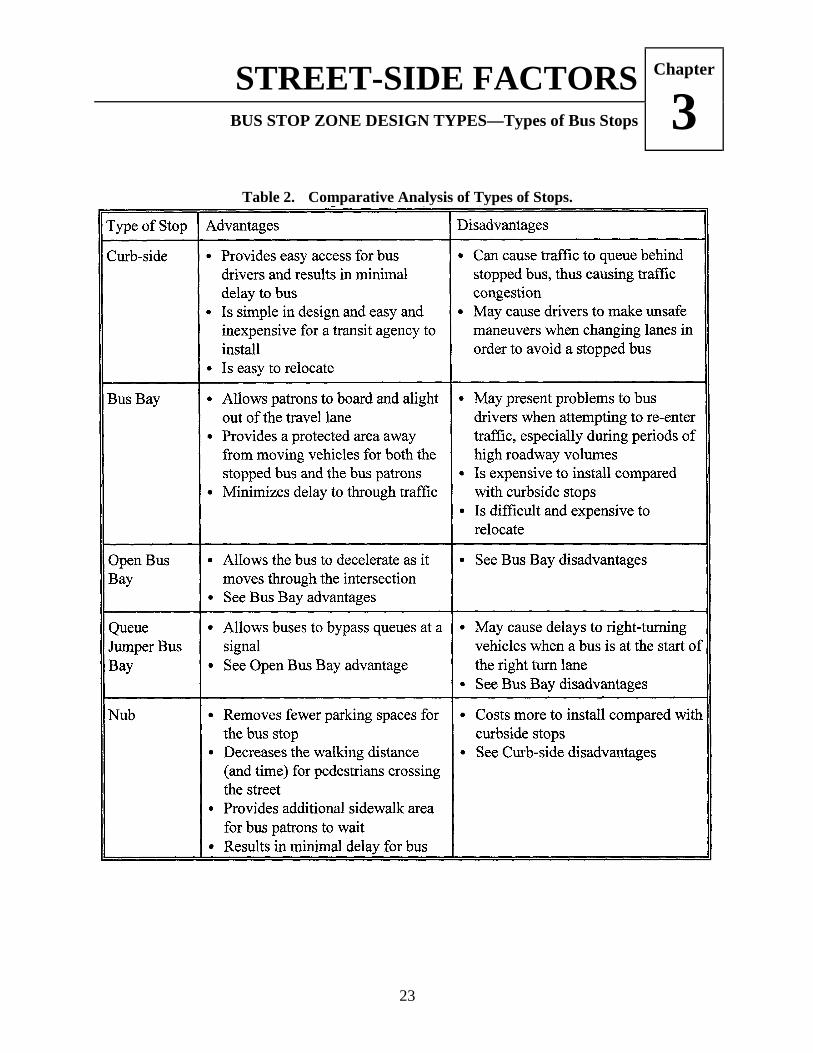
STREET-SIDE FACTORSBUS STOP ZONE DESIGN TYPES—Types of Bus Stops
Chapter
3
23
Table 2. Comparative Analysis of Types of Stops.

STREET-SIDE FACTORSChapter
3 BUS STOP ZONE DESIGN TYPES—Curb-Side Bus Stop Zone Dimensions
24
A bus stop zone is the portion of a roadway marked or signed for use by buses when loading orunloading passengers. The lengths of bus stop zones vary among different transit agencies. In general,bus stop zones for far-side and near-side stops are a minimum of 90 and 100 feet, respectively, andmidblock stops are a minimum of 150 feet. Far-side stops after a turn typically have a minimum 90-foot zone, however, a longer zone will result in greater ease for a bus driver to position the bus. Busstop zones are increased by 20 feet for articulated buses. Representative dimensions for bus stopzones are illustrated in Figure 3.
More than one bus may be at a stop at a given time. The number of bus-loading positions required ata given location depends on 1) the rate of bus arrivals and 2) passenger service time at the stop. Table3 presents suggested bus stop capacity requirements based on a range of bus flow rates and passengerservice times. For example, if the service time at a stop is 30 seconds and there are 60 buses expectedin the peak hour, two bus loading positions are needed. The arrival rate is based on a Poisson(random) arrival rate and a 5 percent chance the bus zone capacity will be exceeded.
Table 3. Recommended Bus Stop Bay Requirements.

STREET-SIDE FACTORSBUS STOP ZONE DESIGN TYPES—Curb-Side Bus Stop Zone Dimensions
Chapter
3
25
Figure 3. Typical Dimensions for On-Street Bus Stops.

STREET-SIDE FACTORSChapter
3 BUS STOP ZONE DESIGN TYPES—Bus Bay
26
A bus bay (or turnout) is a specially constructed area separated from the travel lanes and off thenormal section of a roadway that provides for the pick up and discharge of passengers (see Figure 4).This design allows through traffic to flow freely without the obstruction of stopped buses. Bus baysare provided primarily on high-volume or high-speed roadways, such as suburban arterial roads.Additionally, bus bays are frequently constructed in heavily congested downtown and shopping areaswhere large numbers of passengers may board and alight.
Figure 4. Example of a Bus Bay.

STREET-SIDE FACTORSBUS STOP ZONE DESIGN TYPES—Use of Bus Bays
Chapter
3
27
Bus bays should be considered at a location when the following factors are present:
• Traffic in the curb lane exceeds 250 vehicles during the peak hour,
• Traffic speed is greater than 40 mph,
• Bus volumes are 10 or more per peak hour on the roadway,
• Passenger volumes exceed 20 to 40 boardings an hour,
• Average peak-period dwell time exceeds 30 seconds per bus,
• Buses are expected to layover at the end of a trip,
• Potential for auto/bus conflicts warrants separation of transit and passenger vehicles,
• History of repeated traffic and/or pedestrian accidents at stop location,
• Right-of-way width is adequate to construct the bay without adversely affecting sidewalkpedestrian movement,
• Sight distances (i.e., hills, curves) prevent traffic from stopping safely behind a stopped bus,
• A right-turn lane is used by buses as a queue jumper lane,
• Appropriate bus signal priority treatment exists at an intersection,
• Bus parking in the curb lane is prohibited, and
• Improvements, such as widening, are planned for a major roadway. (This provides the opportunityto include the bus bay as part of the reconstruction, resulting in a better-designed and less-costlybus bay.)
Evidence shows that bus drivers will not use a bus bay when traffic volumes exceed 1000 vehiclesper hour per lane. Drivers explain that the heavy volumes make it extremely difficult to maneuver abus out of a midblock or near-side bay, and that the bus must wait an unacceptable period of time tore-enter the travel lane. Consideration should be given to these concerns when contemplating thedesign of a bay on a high-volume road. Using acceleration lanes, signal priority, or far-side (versusnear-side or midblock) placements are potential solutions.

STREET-SIDE FACTORSChapter
3 BUS STOP ZONE DESIGN TYPES—Bus Bay Dimensions
28
The total length of the bus bay should allow room for an entrance taper, a deceleration lane, astopping area, an acceleration lane, and an exit taper (see Figure 5). However, the common practice isto accept deceleration and acceleration in the through lanes and only build the tapers and the stoppingarea. Providing separate deceleration and acceleration lanes is desirable on suburban arterial roadsand should be incorporated in the design wherever feasible.
An acceleration lane in a bay design allows a bus to obtain a speed that is within an acceptable rangeof the through traffic speed and more comfortably merge with the through traffic. The presence of adeceleration lane enables buses to decelerate without inhibiting through traffic. Typical bus baydimensions (minimum and recommended) are shown in Figure 5. Where bike lanes are provided, abus bay should include a marked through lane to guide bicyclists along the outside of the bus bay.
Following are some guidelines on where to locate bus bays (e.g., far side or near side):
• Far-side intersection placement is desirable (may vary with site conditions). Bus bays should beplaced at signal-controlled intersections so that the signal can create gaps in traffic.
• Near-side bays should be avoided because of conflicts with right-turning vehicles, delays to transitservice as buses attempt to re-enter the travel lane, and obstruction of traffic control devices andpedestrian activity.
• Midblock bus bay locations are not desirable unless associated with key pedestrian access to majortransit-oriented activity centers.

STREET-SIDE FACTORSBUS STOP ZONE DESIGN TYPES—Bus Bay Dimensions
Chapter
3
29
Figure 5. Typical Bus Bay Dimensions.

STREET-SIDE FACTORSChapter
3 BUS STOP ZONE DESIGN TYPES—Open Bus Bay
30
The open bus bay design is a variation of the bus bay design. In an open bus bay design, the bay isopen to the upstream intersection (see Figure 6 for an example). The bus driver has the pavementwidth of the upstream cross street available to decelerate and to move the bus from the travel lane intothe bay. Advantages of this design include allowing the bus to move efficiently into the bay as well asallowing the bus to stop out of the flow of traffic. Re-entry difficulties are not eliminated; however,they are no more difficult than with the typical bus bay design. A disadvantage for pedestrians is thatthe pedestrian crossing distance at an intersection increases with an open bus bay design because theintersection width has been increased by the width of the bay.
Figure 6. Bus Approaching an Open Bus Bay.

STREET-SIDE FACTORSBUS STOP ZONE DESIGN TYPES—Partial Open Bus Bay
Chapter
3
31
Another alternative to the bus bay design is a partial open bus bay (or a partial sidewalk extension).This alternative allows buses to use the intersection approach in entering the bay and provides apartial sidewalk extension to reduce pedestrian street-crossing distance. It also prevents right-turningvehicles from using the bus bay for acceleration movements. Figure 7 illustrates the design for apartial open bus bay.
Figure 7. Partial Open Bus Bay.

STREET-SIDE FACTORSChapter
3 BUS STOP ZONE DESIGN TYPES—Queue Jumper Bus Bay
32
Queue jumper bus bays provide priority treatment for buses along arterial streets by allowing buses tobypass traffic queued at congested intersections. These bus stops consist of a near-side, right-turn laneand a far-side open bus bay. Buses are allowed to use the right-turn lane to bypass traffic congestionand proceed through the intersection. The right-turn lane could be signed "Right Turns Only—BusesExcepted." Queue jumpers provide the double benefit of removing stopped buses from the trafficstream (to benefit general traffic operations) and guiding moving buses through congestedintersections (to benefit bus operations). Figure 8 is a photograph of a queue jumper bus bay whileFigure 9 illustrates the layout for a queue jumper bus bay.
Figure 8. Example of a Queue Jumper Bus Bay.

STREET-SIDE FACTORSBUS STOP ZONE DESIGN TYPES—Queue Jumper Bus Bay
Chapter
3
33
According to the transit agencies that use queue jumper bus bays, these bays should be considered atarterial street intersections when the following factors are present:
• High-frequency bus routes have an average headway of 15 minutes or less;• Traffic volumes exceed 250 vehicles per hour in the curb lane during the peak hour;• The intersection operates at a level of service "D" or worse (see the Transportation Research
Board's Highway Capacity Manual for techniques on evaluating the operations at an intersection);and
• Land acquisitions are feasible and costs are affordable.
An exclusive bus lane, in addition to the right-turn lane, should be considered when right-turnvolumes exceed 400 vehicles per hour during the peak hour.
Notes for Comments 1, 2, 3, and 4 are on page 29.
Figure 9. Queue Jumper Bus Bay Layout.

STREET-SIDE FACTORSChapter
3 BUS STOP ZONE DESIGN TYPES—Nub
34
Nubs are a section of sidewalk that extend from the curb of a parking lane to the edge of the throughlane (see Figure 10). Nubs have been used as traffic-calming techniques and as bus stops. When usedas a bus stop, the buses stop in the traffic lane instead of weaving into the bus stop that is located inthe parking lane—therefore, they operate similarly to curb-side bus stops. Nubs offer additional areafor patrons to walk and wait for a bus and provide space for bus patron amenities, such as shelters andbenches. Other names used for nubs include "curb extensions" and "bus bulbs."
Nubs reduce pedestrian crossing distances, create additional parking (compared with typical buszones), and mitigate traffic conflicts between autos and buses merging back into the traffic stream.Nubs should be designed to allow for an adequate turning radius for right-turn vehicles. Figure 11 is aschematic of a typical bus stop nub design.
Nubs should be considered at sites with the following characteristics:
• High pedestrian activity,• Crowded sidewalks,• Reduced pedestrian crossing distances, and• Bus stops in travel lanes.
Figure 10. Example of a Nub.

STREET-SIDE FACTORSBUS STOP ZONE DESIGN TYPES—Nub
Chapter
3
35
Nubs have particular application along streets with lower traffic speeds and/or low traffic volumeswhere it would be acceptable to stop buses in the travel lane. Collector streets in neighborhoods anddesignated pedestrian districts are good candidates for this type of bus stop. Nubs should be designedto accommodate vehicle turning movements to and from side streets.
Figure 11. Typical Dimensions for a Nub.

STREET-SIDE FACTORSChapter
3 VEHICLE CHARACTERISTICS—Vehicle Types and Dimensions
36
In the design of facilities for buses, it is important to define a design vehicle that represents acompilation of critical dimensions from those vehicles currently in operation. These dimensions areused when designing roadway features. For example, the weight of the expected vehicle is importantto pavement design. The following two basic bus types are commonly used by transit serviceproviders: 1) 40-foot "standard" bus; and 2) 60-foot articulated bus.
Figure 12. Typical Dimensions for 40-Foot Bus.

STREET-SIDE FACTORSVEHICLE CHARACTERISTICS—Vehicle Types and Dimensions
Chapter
3
37
The standard 40-foot bus and the 60-foot articulated bus are generally the largest buses in a transitfleet and represent the most common designs. (Currently, manufacturers are also producing 30- and35-foot buses.) Key roadway design features, such as lane and shoulder widths, lateral and verticalclearances, vehicle storage dimensions, and minimum turning radii are typically based on thestandard 40-foot bus. The articulated bus, while longer, has a "hinge" near the center of the vehiclethat allows maneuverability comparable to the 40-foot bus. Figures 12 and 13 show the dimensionsfor a 40-foot and 60-foot bus, respectively.
Figure 13. Typical Dimensions for 60-Foot Articulated Bus.

STREET-SIDE FACTORSChapter
3 VEHICLE CHARACTERISTICS—Turning Radium Template
38
Design templates for minimum turning paths for single-unit (40-foot) and articulated (60-foot) busesare shown in Figures 14 and 15, respectively. The templates are usable for either left turn or right turndesigns depending on how the template is oriented (i.e., either face-up for right turn design or face-down for left turn design).
Figure 14. Design Template for Single-Unit (40 foot) Bus.

STREET-SIDE FACTORSVEHICLE CHARACTERISTICS—Turning Radium Template
Chapter
3
39
Figure 15. Design Template for Articulated (60-foot) Bus.

STREET-SIDE FACTORSChapter
3 VEHICLE CHARACTERISTICS—Wheelchair Lift
40
Presently, the most common lifts used onbuses are conventional wheelchair lifts. Figure16 illustrates the use of a wheelchair lift. Sincethe wheelchair lift may be at the front or reardoor, bus stop designs need to allow for eitherpossibility. Figure 17 shows the criticaldimensions for a wheelchair lift.
Low floor buses can be adjusted so the floorheight is approximately 10 inches above thestreet level. Bus passengers in wheelchairs arethen able to reach the sidewalk by using aramp deployed from the floor of the bus. Thelength of the ramp typically extends 2 to 3 feetfrom the edge of the bus for a standard heightcurb.
Figure 16. Wheelchair Lift in Operation.
Figure 17. Wheelchair Lift Dimensions.

STREET-SIDE FACTORSVEHICLE CHARACTERISTICS—Bikes on Buses
Chapter
3
41
Several transit agencies now have on-vehicle bus storage programs. In some cases, passengers areallowed to bring their bicycles into the interior of the bus. In others, a bicycle rack is attached to thefront of the bus (see Figure 18). These racks generally hold two bicycles. Busturning radius designneeds to allow for the additional length of a bus with a bicycle rack attached (generally 3 feet).
Figure 18. Front-Mounted Bike Rack in Use.

STREET-SIDE FACTORSChapter
3 ROADWAY AND INTERSECTION DESIGN—Roadway Design
42
Roadways and intersections with bus traffic and bus stops should be designed to accommodate thesize, weight, and turning requirements of buses. The safety and operation of a roadway improve whenthese elements are incorporated into the design.
Because of their need to make frequent stops, buses generally travel in the traffic lane closest to thecurb. Therefore, consideration of the following bus clearance requirements in roadway design isimportant.
• Overhead obstructions should be a minimum of 12 feet above the street surface;• Obstructions should not be located within 2 feet of the edge of the street to avoid
being struck by a bus mirror;• A traffic lane used by buses should be no narrower than 12 feet in width because the
maximum bus width (including mirrors) is about 10.5 feet; and.• Desirable curb lane width (including the gutter) is 14 feet.
Selection of the roadway grade is related to topography and cut and fill material considerations.Typically, the maximum grade for 40-foot buses is between 6 and 8 percent. The recommended gradechange between a street and a driveway is less than 6 percent.
An appropriate curb height for efficient passenger-service operation is between 6 and 9 inches. Ifcurbs are too high, the bus will be prevented from moving close to it and the operations of awheelchair lift could be negatively affected. If curbs are too low or not present, elderly persons andpassengers with mobility impairments may have difficulty boarding and alighting. The effective useof low floor buses is also influenced by the height of the curb.
STREET-SIDE FACTORSROADWAY AND INTERSECTION DESIGN—Pavement
Chapter
3
43
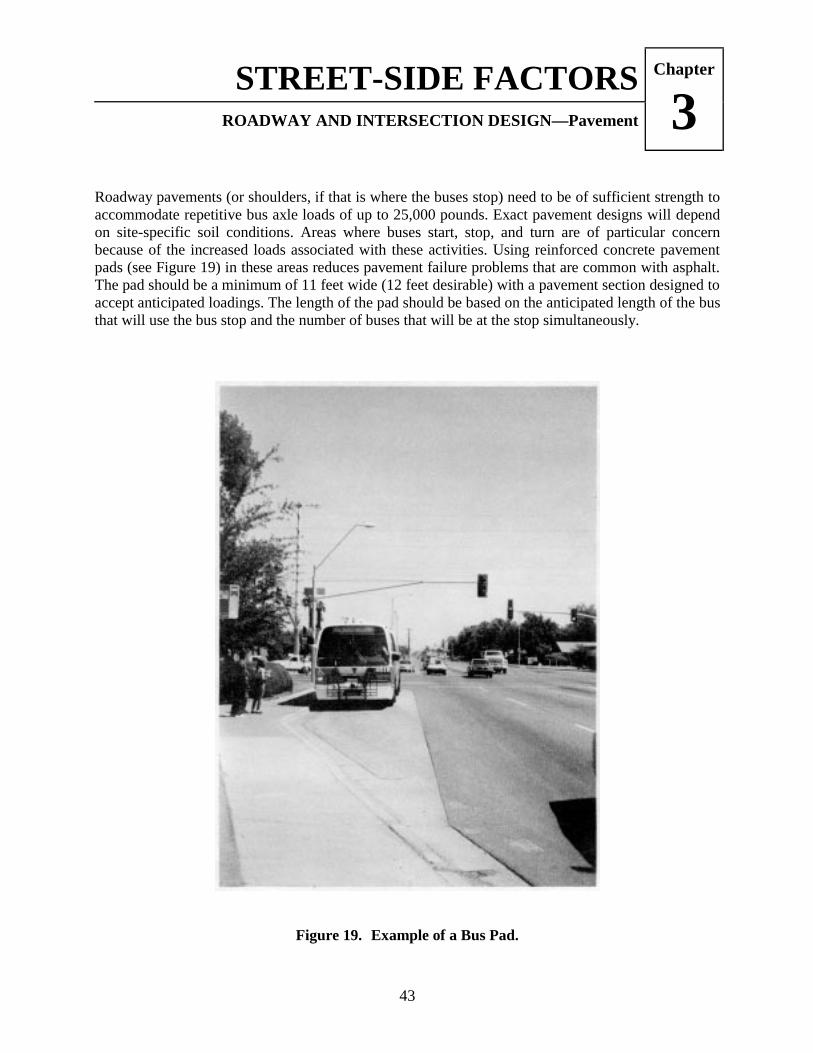
Roadway pavements (or shoulders, if that is where the buses stop) need to be of sufficient strength toaccommodate repetitive bus axle loads of up to 25,000 pounds. Exact pavement designs will dependon site-specific soil conditions. Areas where buses start, stop, and turn are of particular concernbecause of the increased loads associated with these activities. Using reinforced concrete pavementpads (see Figure 19) in these areas reduces pavement failure problems that are common with asphalt.The pad should be a minimum of 11 feet wide (12 feet desirable) with a pavement section designed toaccept anticipated loadings. The length of the pad should be based on the anticipated length of the busthat will use the bus stop and the number of buses that will be at the stop simultaneously.
Figure 19. Example of a Bus Pad.

STREET-SIDE FACTORSChapter
3 ROADWAY AND INTERSECTION DESIGN—Intersections
44
The corner curb radii used at intersections (see C in Figure 20) can affect bus operations when the busmakes a right turn. Some advantages of a properly designed curb radius are as follows:
• Less bus/auto conflict at heavily used intersections(buses can make turns at higher speeds and with less encroachment);
• Higher bus operating speeds and reduced travel time; and• Improved bus patron comfort.
A trade-off in providing a large curb radius is that the crossing distance for pedestrians is increased.This greater crossing distance increases the pedestrians' exposure to on-street vehicles and caninfluence how pedestrians cross an intersection, both of which are safety concerns. The additionaltime that a pedestrian is in the street because of larger curb radii should be considered in signal timingand median treatment decisions.
The design of corner curb radii should be based on the following elements:
• Design vehicle characteristics, including bus turning radius;• Width and number of lanes on the intersecting street;• Allowable bus encroachment into other traffic lanes;• On-street parking;• Angle of intersection;• Operating speed and speed reductions; and• Pedestrians.
Figure 20 shows appropriate corner radii for transit vehicles and various combinations of lane widths.This figure can be used as a starting point; the radii values should be checked with an appropriateturning radius template before being incorporated into a final design.

STREET-SIDE FACTORSROADWAY AND INTERSECTION DESIGN—Intersections
Chapter
3
45
Figure 20. Recommended Corner Radii.

STREET-SIDE FACTORSChapter
3 ROADWAY AND INTERSECTION DESIGN—Driveways
46
Bus stops are commonly located near intersections. Driveways leading to gasoline stations and otherdevelopments are also common at intersections. Ideally, bus stops should not be located close to adriveway; however, if the situation cannot be avoided:
• Attempt to keep at least one exit and entrance driveway open for vehiclesaccessing the development while a bus is loading or unloading passengers.
• Locate the stop to allow good visibility for vehicles leaving thedevelopment and to minimize vehicle/bus conflicts. This is bestaccomplished by placing the stop on the far side of the driveway.
• Locate the stop so that passengers are not be forced to wait for a bus in themiddle of a driveway.
• Locate the stop so that patrons board or alight directly from the curb ratherthan from the driveway.
Transit agencies should work closely with local and state jurisdictions to preserve a safe loading zonefor passengers from either a driveway being moved or the construction of new driveways.Cooperation in finding an alternative stop is recommended when driveways moves are unavoidableand may severely affect the bus stop. Driveways within bus bays are of special concern. Relocating abus bay is expensive and may shift a sometimes unwanted burden to the adjacent property owner.
Figure 21 shows undesirable driveway situations where either visibility is restricted or the only driveinto a parking area is blocked. The figure also shows acceptable driveway situations where visibilityis enhanced and access is allowed.
Figure 21. Bus Stop Locations Relative to Driveways.
STREET-SIDE FACTORSROADWAY AND INTERSECTION DESIGN—Traffic Signals
Chapter
3
47
Bus stops are frequently located at signalized intersections. Traffic signal design shouldaccommodate buses and bus passengers. The following should be considered in designing trafficsignal systems in new developments or upgrading/redesigning signals at existing intersections:
• Location of bus stops should be coordinated with traffic signal pole and signal head location. Busstops should be located so that buses do not totally restrict visibility of traffic signals from othervehicles. (These problems can be effectively addressed by using far-side bus stops.)
• The use of a far-side, curbside stop at a signalized intersection can cause vehicles stopping behindthe bus to queue into the intersection. A far-side bus bay is preferred at a signalized intersection.
• Since all bus passengers become pedestrians upon leaving the bus, it is important to have"WALK" and "DON'T WALK" indicators at signalized intersections at bus stops.
• When traffic-actuated signals are installed, pedestrian push buttons should also be installed to (1)activate the "WALK" and "DON'T WALK" indicators or (2) extend the signal's green indicator sothat additional time needed by the pedestrian to cross the street is provided.
• Near-side stop areas are often located between the advance detectors for a traffic signal and thecrosswalk. Detectors should be located at the bus stop to enable the bus to actuate the detector andthe signal controller to obtain or extend the green light. Without a detector, a bus is forced to waituntil other traffic approaching from the same direction actuates the signal controller.
• Timing of traffic signals should also reflect the specific needs of buses. Longer clearance intervalsmay be required on higher speed roadways with significant bus traffic. Vehicle passage times mustprovide adequate time for a bus to accelerate from the bus stop into the intersection. Intersectionsadjacent to railroad tracks should incorporate the need for buses to stop at railroad crossings intotheir timing and detection.

STREET-SIDE FACTORSChapter
3 ROADWAY AND INTERSECTION DESIGN—Sign Locations
48
Proper signs at bus stops are an important element of good transit service. Signs serve as a source ofinformation to patrons and operators regarding the location of the bus stop and are excellentmarketing tools to promote transit use. For example, letter styles, sign appearance, and color choiceshould be unique to the transit system so that passengers can readily identify bus stops. Doublesidedsigns which provide for visibility from both directions and reflectorized signs for night time visibilityare preferred.
Bus stop signs should be placed at the location where people board the front door of the bus. The busstop sign shows the area where passengers should stand while waiting for the bus. It also serves as aguide for the bus operator in positioning the vehicle at the stop. The bottom of the sign should be atleast 7 feet above ground level and should not be located closer than 2 feet from the curb face. Figure22 shows typical bus stop sign placement standards.
Transit agencies and local and/or state jurisdictions should coordinate efforts when deciding locationsfor bus stops and sign posts. In some cases, a shared sign post can be used to reduce the number ofobstructions in high pedestrian volume locations. Bus stop signs are also commonly located on ashelter or existing pole (such as a street light). The signs should not be obstructed by trees, buildings,or other signs. Bus stop sign posts that are not protected by a guardrail or other feature should be abreak-away type to minimize injuries and vehicular damage, and to facilitate replacement of the post.
Pavement markings associated with bus stops are generally installed and maintained by localauthorities. The most common marking is a yellow or red painted curb at the bus stops. Stop linesand/or crosswalk markings are also desirable when the bus stop location is at an intersection.
Figure 22. Guidelines for Bus Stop Sign Placement.

STREET-SIDE FACTORSROADWAY AND INTERSECTION DESIGN—Traffic Control and
Regulation of Bus Stops
Chapter
3
49
Traffic regulations prohibit parking, standing, or stopping at bus stops. These regulations can beestablished only when authorized by appropriate laws or ordinances. In general, an ordinance isneeded to authorize and require a transit agency to establish bus stop locations and to designate busstops with the appropriate signs. Another ordinance prohibits other vehicles from stopping, standing,or parking in officially designated and appropriately signed bus stops. An allowance for passengervehicles to stop to load or unload passengers in the bus stops may be included.
The Manual on Uniform Traffic Control Devices (MUTCD) (maintained by the Federal HighwayAdministration) includes general specifications for no parking signs at bus stops and curb markings toindicate parking restrictions, as well as guidelines for the placement of the signs. Suggested signs inthe MUTCD are shown in Figure 23. The R7-107a sign is a permissible alternative design for the R7-107 sign shown in the MUTCD. Other alternative designs discussed in the Manual may include atransit logo, an approved bus symbol, a parking prohibition, the words BUS STOP, and right-, left-,and double-headed arrows. The preferred bus symbol color is black, but other dark colors may beused. Additionally, the transit logo may be shown on the bus face in the appropriate colors instead ofplacing the logo separately. The reverse side of the sign may contain bus routing information.
The MUTCD also discusses the use of curb markings to indicate parking restrictions. At the option oflocal authorities, special colors (none are specified in the MUTCD) may be used for curb markings.When signs are not used, restrictions should be stenciled on the curb.
Figure 23. MUTCD Bus Stop Signs.

STREET-SIDE FACTORSChapter
3 SAFETY
50
As with all aspects of roadway design and bus operations, an important element in the design of busstops is safety. General safety considerations for bus stops include the following:
• The bus stop must be located so that passengers may alight and board with reasonable safety.
• The stopped bus will affect sight distance for pedestrians using the parallel and transversecrosswalks at the intersection.
• The stopped bus will also affect sight distance for parallel traffic and cross traffic. For instance, ata near-side stop, vehicular right turns are facilitated and sight distance is improved when the busstop is set back from the crosswalk.
• The bus affects the traffic stream as it enters or leaves a stop.
A recently completed study on pedestrian accidents found that approximately 2 percent of pedestrianaccidents in urban areas and 3 percent in rural areas are related to bus stops. These accidentsgenerally involved pedestrians who stepped into the street in front of a stopped bus and were struckby vehicles moving in the adjacent lane. This situation develops when the line of sight between thepedestrian and an oncoming vehicle is blocked, or when the pedestrian simply does not look for anoncoming vehicle. This type of accident can be reduced by relocating the bus stop from the near sideof an intersection to the far side, thus encouraging pedestrians to cross the street from behind the businstead of in front of it. This makes pedestrians more visible to motorists approaching from behindthe bus. Not only can far-side bus stops reduce the potential for bus stop accidents involvingpedestrians, they are also less likely to obscure traffic signals, signs, and pedestrian movements atintersections, as opposed to near-side bus stops. Also, conflicts between buses and right-turningvehicles can be reduced by using far-side bus stops. Problems may occur, however, when carsillegally park in far-side bus stops preventing buses from completely clearing the cross street.

STREET-SIDE FACTORSSAFETY
Chapter
3
51
Along with the minimum desirable curb length, the condition of the curb lane and the curb height caninfluence the safety and efficiency of bus-passenger operation. When poor pavement conditions existin the curb lane, bus drivers often avoid it and stop the buses away from the curb. Boardings andalighting operations away from the curb are more hazardous for riders than curb operations,especially for elderly persons and passengers with disabilities during inclement weather. Theadditional hazard appears to result from the increased height between the ground and the first step ofthe bus and from moving vehicles (such as bicycles) between the curb and the bus.
Lighting is important for safety. A brightly lit bus stop makes it easier for the transit operator toobserve waiting passengers and allows motorists to see boarding and alighting pedestrians. Becausethe step well is the most hazardous area on a transit vehicle for accidents, a brightly lit well will assistboarding and alighting passengers as they judge distances and locations of steps and curbs. Auxiliarylighting in the step well is required on new buses, but it will be years before this feature is universal.
The bus stop should be located either before the turn lane (for through routes) or at the far side of theintersection in areas that have a dedicated right-hand turn lane. Transit agencies should work closelywith local and state jurisdictions wherever traffic improvements affect the safety of a bus stop. Theaddition of turn lanes will often require advance planning for incorporating transit accommodationsas part of the highway project and/or for relocating the bus stop to an acceptable location.
STREET-SIDE FACTORSChapter
3 STREET-SIDE PLACEMENT CHECKLIST
52
Several items should be considered when designing and locating a bus stop on a roadway. Thefollowing checklist of street-side items should be reviewed with each design because it bringstogether related issues that can have a significant impact on the safe operations of the bus stop.
" Standardization: One of the most critical factors in the street-side design and placement of a busstop involves standardization or consistency. Standardization is desirable because it results in lessconfusion for bus operators, passengers, and motorists. Consistency in design, however, can bedifficult to achieve since traffic, parking loss, turning volume, community preference, andpolitical concerns can influence the decisions.
" Periodic Review: A periodic review of bus stop conditions (both street side and curb side) isrecommended to ensure the safety of bus passengers. This will encourage the timely reporting ofitems such as missing bus stop signs and poor pavement.
" Near-Side/Far-Side/Midblock Placement: Each type of placement has advantages anddisadvantages. In general, each bus stop location should be evaluated individually to decide thebest placement for the stop.
" Visibility: Bus stops should be easy to see. If the bus stop is obscured by nearby trees, poles, orbuildings, the bus operator may have difficulty locating the stop. More importantly, however,motorists and bicyclists may not know of its existence and will be unable to take necessaryprecaution when approaching and passing the stop. In addition, visibility to pedestrians crossing astreet is also an important consideration in areas that permit "right turns on red."
" Bicycle Lanes and Thoroughfares: When a bike lane and a bus stop are both present, theoperators need to be able see cyclists in both directions while approaching the stop. Sufficientsight distance for cyclists to stop safely upon encountering a stopped bus is also needed.
" Traffic Signal and Signs: Bus stops should be located so that buses do not restrict visibility oftraffic signals and signs from other vehicles. Because all bus passengers become pedestrians uponleaving the bus, pedestrian signal indicators should be considered at nearby signalizedintersections.

STREET-SIDE FACTORSSTREET-SIDE PLACEMENT CHECKLIST
Chapter
3
53
" Roadway Alignment: Horizontal and vertical roadway curvature reduces sight distance for busoperations, motorists, bicyclists, and pedestrians. Additionally, bus stops located on curves makeit difficult for the bus operator to stop the bus parallel to the curb and safely return to the drivinglane. Where possible, bus stops should be located on sections of relatively straight and flatroadway. Trees and poles should not obstruct the visibility of the bus operator for cross traffic andpassenger and pedestrian movement.
" Driveways: Avoid locating bus stops close to a driveway. If placing a bus stop close to adriveway is unavoidable (for example, to lessen the loss of parking in a commercial area), keep atleast one driveway open to vehicles accessing the adjacent development while a bus is loading orunloading passengers. Also, locate bus stops to allow full visibility for vehicles leaving anadjacent development and to minimize vehicle/bus conflicts. Placing bus stops on the far side ofdriveways will minimize conflicts; however, sight distance for left-turning vehicles from thedriveway will still be a concern.
" Location of Pedestrian Crosswalks: A minimum clearance distance of 5 feet between apedestrian crosswalk and the front or rear of a bus at a bus stop is desirable.
" Location of the Curb: Where possible, locate stops where a standard curb height of 6 inchesexists. Bus steps are designed with the assumption that the curb is the first step. It is more difficultfor elderly persons and passengers with mobility impairments to board and alight from the bus ifthe curb is absent or damaged.
" Street Grades: Where possible, bus stops should not be located on an upgrade in a residentialarea, since the bus engine noise created when the vehicle accelerates from a stop will bother arearesidents. Placing bus stops on steep grades should be avoided if slippery winter conditionsprevail.
" Road Surface Conditions: Since alighting passengers generally move from their seats when thebus decelerates on approach to a bus stop, do not locate a bus stop where the roadway is in poorcondition such as areas with broken pavement, potholes, or ruts or where a storm drain is located.The resultant motion of the bus in such a situation may cause bus passengers to fall and injurethemselves. Boarding and standing passengers are also susceptible to falls or injuries where poorpavement conditions or low drainage basins exist.

CURB-SIDE FACTORSORGANIZATION
Chapter
4
55
Curb-side factors include those factors and issues that can affect the comfort, safety, and convenienceof bus patrons. The information in this chapter can be used by transit professionals to provide safe,clean facilities at the bus stop. The chapter also provides information on how to choose bus stoplocations that improve access and convenience in pedestrian-friendly communities. Areas ofdiscussion include shelter design and placement, amenities, and enhancing bus patron comfort at busstops. Also of value to transit professionals are tables that compare the advantages and disadvantagesof the various amenities that can be included at the bus stop. A checklist provided at the end of thechapter refers to the various curb-side elements associated with bus stop design and location.

CURB-SIDE FACTORSChapter
4 PEDESTRIAN ACCESS—Patron Access
56
Providing defined access to and from the bus stop is important. Sidewalks should be constructed ofimpervious non-slip material and should be well drained. Access to the bus stop from the intersectionor land use should be as direct as possible. When possible, sidewalks and bus stops should becoordinated with existing street lights to provide a minimum level of lighting and security. Toaccommodate wheelchairs, sidewalks should be a minimum of 3 feet wide (preferably 4 to 5 feetwide) and equipped with wheelchair ramps at all intersections. Other improvements include definedpedestrian crosswalks and signals at intersections. Pedestrian enhancements, such as sidewalks,should be coordinated with roadway improvements to help improve bus patron comfort andconvenience.
Installation of a discontinuous sidewalk from the intersection to the bus stop is one way to achievegreater patron access to the bus stop in areas with limited or no sidewalk coverage. Although, thesidewalk may not continue toward the next land use or along the roadway, this strategy is the firststep toward providing complete access to the bus stop. This ensures that access to the bus stop is notthrough uneven grass or exposed soil, which can be further impaired by poor drainage and surfacechanges during inclement weather. People who are elderly or have disabilities may find access to thebus stop difficult as well. See Figure 24 for an example.
Figure 24. Example of Providing Access In Developing Regions.

CURB-SIDE FACTORSPEDESTRIAN ACCESS—Bus Stop to Sidewalk Connections
Chapter
4
57
Bus patrons should encounter defined pathways from the sidewalk to the back-face of the curb. Toprevent poor access from the sidewalk to the curb, a waiting pad and an accessway from the waitingpad to the curb should be installed. When the sidewalk is parallel and directly adjacent to the curb, thewaiting pad should be installed directly behind the sidewalk. However, when the sidewalk is far fromthe curb, paved access from the waiting pad to the curb is necessary. The waiting pad and accesswayshould be constructed of impervious non-slip material, preferably concrete or asphalt, and haveproper drainage. Figure 25 presents two different waiting pad location scenarios for providing pavedconnections between the bus waiting pad and the curb.
Patrons should not have to walk through grass or exposed soil to reach the bus. In such cases, theareas between the sidewalk, bus stop, and curb can become worn and decline to muddy areas duringinclement weather. Snow accumulation from road clearings during the winter months can also createadditional access problems in the space between the sidewalk and curb.
Figure 25. Examples of Providing Access from the Waiting Pad to the Curb.
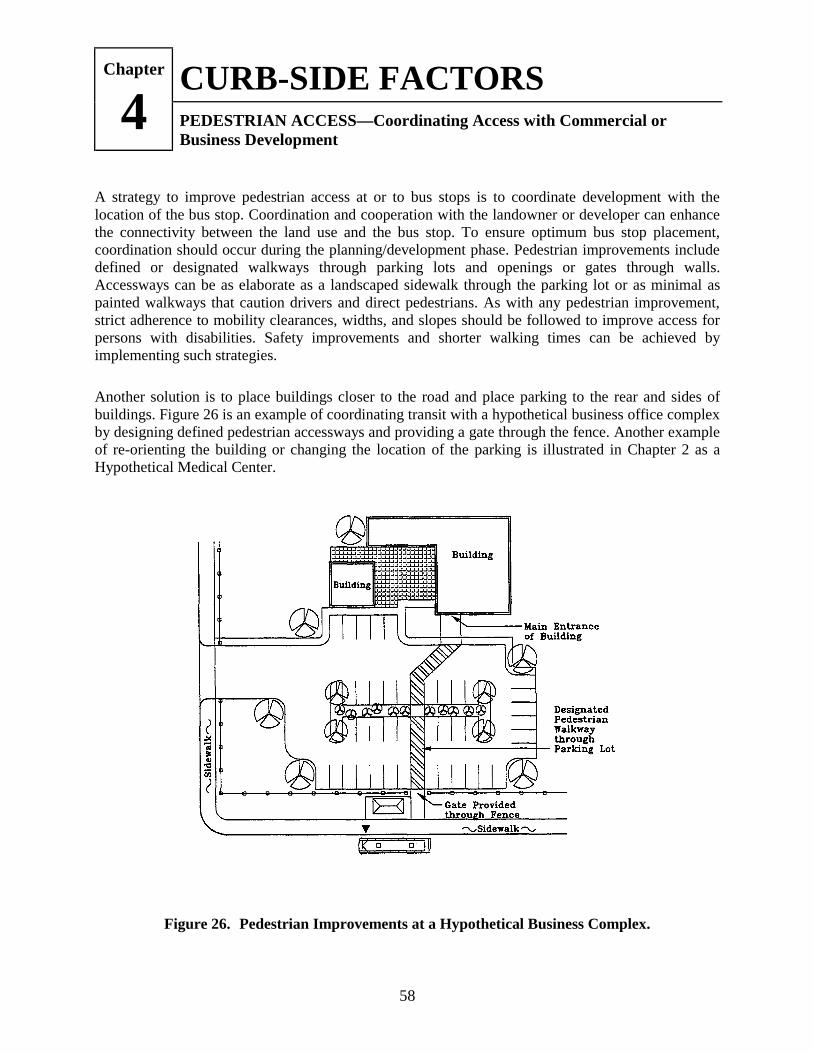
CURB-SIDE FACTORSChapter
4 PEDESTRIAN ACCESS—Coordinating Access with Commercial orBusiness Development
58
A strategy to improve pedestrian access at or to bus stops is to coordinate development with thelocation of the bus stop. Coordination and cooperation with the landowner or developer can enhancethe connectivity between the land use and the bus stop. To ensure optimum bus stop placement,coordination should occur during the planning/development phase. Pedestrian improvements includedefined or designated walkways through parking lots and openings or gates through walls.Accessways can be as elaborate as a landscaped sidewalk through the parking lot or as minimal aspainted walkways that caution drivers and direct pedestrians. As with any pedestrian improvement,strict adherence to mobility clearances, widths, and slopes should be followed to improve access forpersons with disabilities. Safety improvements and shorter walking times can be achieved byimplementing such strategies.
Another solution is to place buildings closer to the road and place parking to the rear and sides ofbuildings. Figure 26 is an example of coordinating transit with a hypothetical business office complexby designing defined pedestrian accessways and providing a gate through the fence. Another exampleof re-orienting the building or changing the location of the parking is illustrated in Chapter 2 as aHypothetical Medical Center.
Figure 26. Pedestrian Improvements at a Hypothetical Business Complex.

CURB-SIDE FACTORSPEDESTRIAN ACCESS—Coordinating Access With Residential
Development
Chapter
4
59
Bus passengers need efficient ways to reach the bus stop from their residences. Transit agencies needto be involved early in the development approval process to reduce walking times and improve directaccess to and from the bus stop. Sidewalk placement that is coordinated with land use and bus stoplocations is critical to encouraging the use of transit.
Concerns over residential security have led to a proliferation of walled residential communities thatrestrict access to a limited number of entry and exit points. By doing so, walking times to bus stopsmay be increased because direct access may not be available. Circuitous or curvilinear sidewalks canalso increase walking times and create coordination problems for the transit agency when choosingthe final bus stop location. Curvilinear sidewalks along a street may not align with the final stopdestination and may result in access problems through grass, berms, or other landscaping features.
Coordinating sidewalk design and placement is needed between developers and transit agencies toensure direct access to a paved bus stop. Designing gates, openings through walls, and installingdirect sidewalks in residential communities can be coordinated with developers to reduce walkingtimes from the land use to the bus stop. Figure 27 is an example of coordinating access points andsidewalk design with the location of the bus stop.
Figure 27. Example of Coordinating Transit with Residential Development Patterns.

CURB-SIDE FACTORSChapter
4 ADA—Accessibility Guidelines
60
The Americans with Disabilities Act of 1990 (ADA) is broad legislation intended to make Americansociety more accessible to people with disabilities. It consists of five sections or titles (employment,public services, public accommodations, telecommunications, and miscellaneous). Titles II and III(public services and public accommodations) affect bus stop planning, design, and construction.Although the definition of disability under the ADA is broad, bus stop placement and design mostdirectly affect persons with mobility and visual impairments. These impairments, which relate to themore physical aspects of bus stop accessibility, have received the most attention.
Making new stops conform to ADA physical dimension requirements is relatively easy. Modifyingexisting stops to comply with ADA, though desirable from an accessibility perspective, is notrequired under ADA. Modification of existing stops is more difficult, especially if the stops are atsites with limited easement or not subject to the transit agency's control, such as shopping malls, onstate rights-of-way, or suburban subdivisions.
The ADA, however, is concerned with more than physical dimensions. It also involves accessibilityfrom the point of origin to the final destination. For example, to get to the bus stop, individuals withlimited mobility or vision need a path that is free of obstacles, as well as a final destination that isaccessible. A barrier-free bus stop or shelter is of little value if the final destination is not accessible.Though the ADA does not require retrofitting transit vehicles with lifts, an accessible vehicle isclearly a critical link in the barrier-free trip. Full accessibility is more difficult to achieve whendifferent organizations are responsible for different portions of the path (which is usually the case).Either way, the "equal access" provisions of the ADA require that the route for persons with limitedmobility or vision be as accessible as the route used by those without disabilities. A person withdisabilities should not have to travel further, or use a roundabout route, to get to a designated area.
Basic Principles for Bus Stop Design and Location to Conform to ADA
Basic aspects of design exist that encourage accessibility and are applicable to most situations.Specific dimensions are available from several references, some of which are listed below. Somegeneral design considerations involve obstacles, surfaces, signs, and telephones.

CURB-SIDE FACTORSADA—Accessibility Guidelines
Chapter
4
61
Obstacles
Examine all the paths planned from the alighting point at the bus stop to destinations off the bus stoppremises. Determine whether any protrusions exist that might restrict wheelchair movements. Ifprotrusions exist and they are higher than 27 inches or lower than 80 inches, a person with a visionimpairment may not be able to detect an obstacle (such as a phone kiosk) with a cane. A guide dogmay not lead the person with the impairment out of the path. Although it may not be the transitagency's responsibility to address accessibility problems along the entire path, an obstacle anywherealong the path may make it inaccessible for some transit users with disabilities.
Surfaces
Surfaces must be stable, firm, and slip-resistant. Such provisions are beneficial for all transit users,but especially for those who have disabilities. Avoid abrupt changes in grade, and bevel those thatcannot be eliminated. Any drop greater than 1/2 inch or surface grade steeper than 1:20 requires aramp.
Signs
Signs providing route designations, bus numbers, destinations, and access information must bedesigned for use by transit riders with vision impairments. Specific guidelines are given for thesesigns in Section 4.30 of Accessibility Guidelines for Buildings and Facilities, TransportationFacilities and Transportation Vehicles. In some cases, two sets of signs may be needed to ensurevisibility for most users and to assist users with sight limitations. Route maps or timetables are notrequired at the stop, though such information would be valuable to all passengers.
Telephones
Telephones at bus stops are not required under ADA, but if telephones are in place, they must notobstruct access to the facility and must be suitable for users with hearing impairments. At least onephone must be accessible for wheelchair users. Telephone directories must also be accessible.
Figure 28 illustrates a design approach to a bus stop with a shelter that would meet ADArequirements.

CURB-SIDE FACTORSChapter
4 ADA—Accessibility Guidelines
62
Accessible Bus Stop Pad & ShelterMinimum Dimensions
Figure 28. Shelter Design Example to Meet ADA Requirements.

CURB-SIDE FACTORSADA—Accessibility Guidelines
Chapter
4
63
Resources and References
An excellent guide to the design of bus stops (as well as other facilities) for ADA compliance is
Americans with Disabilities Act: Accessibility Guidelines for Buildings andFacilities, Transportation Facilities, and Transportation Vehicles. U. S.Architectural and Transportation Barriers Compliance Board, Washington, DC, 1994.It is commonly known as the ADA Guide.
Another useful publication, which translates the ADA Guide accessibility guidelines into specificdesign parameters, is
Accessibility Handbook for Transit Facilities. Federal Transit Administration, ReportNo. FTA-MA-06-0200-92-1, July 1992. Prepared by the Ketron Division ofBionetics Corp. This document is available through the National TechnicalInformation Service (NTIS), Springfield, VA 22161.
As civil rights legislation, the ADA goes beyond physical dimensions to include policy and practice.Many of these issues will be resolved through experience and in the courts. Various sources areavailable for monitoring the current status of the ADA and its specific provisions. These include legaljournals, ADA-specific newsletters, and World Wide Web "home pages." Examples of each are asfollows:
Temple Law Review and Transportation Law Journal—both frequently publish analyses ofthe original ADA legislation and recent developments, as do other legal journals.
TD Access & Safety Report—provides information on access, safety, and liability relating tothe transportation of people with disabilities and the transportation-disadvantaged. Publishedby Serif Press, Inc., 1331 H Street, NW, Washington, DC, 20005.
Americans with Disabilities Act Document Center (http://janweb.icdi.wvu.edu/kinder/)—Thiswebsite, sponsored by the National Institute on Disability and Rehabilitation Research,contains copies of ADA regulations and technical manuals prepared or reviewed by EEOC orthe Department of Justice. Links to other Internet sources are also provided.

CURB-SIDE FACTORSChapter
4 WAITING OR ACCESSORY PADS—Sizing and Positioning
64
A waiting or accessory pad is a paved area at a bus stop provided for bus patrons and can containeither a bench or a bus shelter. Amenities, such as trash receptacles or bike racks, can also be locatedon the waiting pad. The size of the waiting pad depends on several factors. The length and width ofshelters and benches, clearance requirements for street furniture, location of wheelchair lift extension(front or back door of bus), and the length of the bus are common size-determining factors. Transitagencies, typically, have one or two accessory-pad variations to accomodate different configurationsand components that may be installed. Figure 29 illustrates elements that may influence the size andshape of the waiting pad.
Waiting pads are usually separated from the sidewalk to preserve general pedestrian flow. It isgenerally recommended that 5 feet of clearance be preserved on sidewalks to reduce potentialpedestrian conflicts and limit congestion during boardings and alightings. The pad can be located oneither side of the sidewalk, depending on available right-of-way space, utility poles, or buildings. Ineither case, a paved surface should be provided from the waiting pad to the back-face of the curb toenhance access and comfort. ADA mobility guidelines should be followed when street furniture is tobe included on a waiting pad. A waiting pad should accommodate a 5-foot (measured parallel to thestreet) by 8-foot (measured from the back face of the curb) wheelchair landing pad that is free of allstreet furniture and overhangs.
Figure 29. Example of Influential Factors on Waiting Pad Size.

CURB-SIDE FACTORSWAITING OR ACCESSORY PADS—Nubs
Chapter
4
65
Nubs, also known as bus bulbs or curb extensions, solve the problem of locating bus patron amenitiesin dense urban environments with considerable pedestrian traffic. A nub is essentially a sidewalkextension through the parking lane that becomes directly adjacent to the travel lane. When spacelimitations prevent the inclusion of amenities, nubs create additional space at a bus stop for shelters,benches, and other transit patron improvements along sidewalks. Nubs provide enough space for buspatrons to comfortably board and alight from the bus away from nearby general pedestrian traffic.Nubs also shorten the pedestrian walking distance across a street, which reduces pedestrian exposureto on-street vehicles.
Transit agencies should consider the use of nubs at sites along crowded city sidewalks with highpatron volumes, where parking along the curb is permitted. Figure 30 is a plan view example of atypical nub configuration.
Figure 30. Separating Bus Activities and General Pedestrian Traffic with Nubs.

CURB-SIDE FACTORSChapter
4 SHELTERS—Inclusion and Sizing
66
A bus shelter provides protection from the elements and seating while waiting for a bus. Standardizedshelters exist that accommodate various site demands and different passenger volumes. Typically, ashelter is constructed of clear side-panels for clear visibility. Depending on demand and frequency ofservice, a bus shelter may also have a bench.
The decision to install a shelter is a result of systemwide policy among transit agencies. Many criteriaexist to determine shelter installation at a bus stop. In most instances, the estimated number ofpassenger boardings has the greatest influence. Suggested boarding levels by area type used to decidewhen to install a shelter are as follows (these values represent a composite of prevailing practices):
Location BoardingRural 10 boardings per daySuburban 25 boardings per dayUrban 50 to 100 boardings per day
Other criteria used to evaluate the potential for inclusion of a shelter include
• number of transfers at a stop• availability of space to construct shelters and waiting areas• number of elderly or physically challenged individuals in the area• proximity to major activity centers• frequency of service• adjacent land use compatibility
Priority may or may not be given to each of these items depending on policy. System equity orfunding availability can cause the installation decision to be made on a case-by-case basis. Localpriorities and neighborhood requests can also influence the decision to include a shelter at a bus stop.
Other factors that can influence the size of the shelter include availability of right-of-way width,existing street furniture, utility pole locations, landscaping, existing structures, and maintainingproper circulation distances around existing site features.

CURB-SIDE FACTORSSHELTERS—Determining the Final Location
Chapter
4
67
Ideally, the final location of a bus stop shelter should enhance the circulation patterns of patrons,reduce the amount of pedestrian congestion at a bus stop, and reduce conflict with nearby pedestrianactivities. The location of the curb and sidewalk and the amount of available right-of-way can bedetermining factors for locating a bus stop shelter. The following placement guidelines should beused when placing a bus stop shelter on a site (see also Figure 31):
• Bus stop shelters should not be placed in the 5-foot-by-8-foot wheelchair landing pad.• General ADA mobility clearance guidelines should be followed around the shelter and
between the shelter and other street furniture.• Locating shelters directly on the sidewalk or overhanging a nearby sidewalk should be
avoided because this may block or restrict general pedestrian traffic. A clearance of 3 feetshould be maintained around the shelter and an adjacent sidewalk (more is preferred).
• To permit clear passage of the bus and its side mirror, a minimum distance of 2 feet shouldbe maintained between the back-face of the curb and the roof or panels of the shelter.Greater distances are preferred to separate waiting passengers from nearby vehiculartraffic.
• The shelter should be located as close as possible to the end of the bus stop zone so it ishighly visible to approaching buses and passing traffic. The walking distance from theshelter to the bus is also reduced.
• Locating bus stop shelters in front of store windows should be avoided when possible so asnot to interfere with advertisements and displays.
• When shelters are directly adjacent to a building, a 12-inch clear space should be preservedto permit trash removal or cleaning of the shelter.
Figure 31. Shelter Clearance Guidelines.

CURB-SIDE FACTORSChapter
4 SHELTERS—Configurations and Orientations
68
In orienting and configuring bus shelters, personnel should consider the environmental characteristicsof each site, because placement and design can positively or negatively influence passenger comfort.For example, in very hot climates, particularly in areas with few tall trees, bus shelters may beuncomfortable if they face directly east or west. However, this orientation may be appropriate incooler climates during the winter months. When shelter interiors are uncomfortable, patrons will seekrelief from the elements outside the shelter, appropriating walls or window ledges of nearby privateproperty for their use. Transit agencies should be sensitive to this issue when locating a bus stopshelter.
Different bus shelter configurations can be used to reflect site or regional characteristics (see Figure32). Shelters can be completely open to permit unlimited movement of air, or panels can be erected tokeep the interior of the bus shelter warm. For southern climates, perforated panels can be used toreduce the glare while permitting ventilation. Alternatively, shelters can be fully enclosed by solidpanels and the back of the shelter may be rotated to face the street to protect waiting passengers fromsplashing water or snow build-up. To enhance ventilation and to reduce the clutter that canaccumulate inside a shelter, a 6-inch clearance between the ground and the bottom of the panels isstandard in fully enclosed shelters. In any case, shelters should be coordinated with landscaping toprovide maximum protection from the elements and to enhance the visual quality of the bus stop (seeFigure 33). Shade trees reduce heat at a site and provide additional shade for patrons waiting outsidethe shelter. Technology, such as misters or evapo-cooling towers, can also be used to enhance theinterior environment, however, such technology is expensive and maintenance-intensive.
Figure 32. Examples of Orientation and Panel Placement to Improve Interior Comfort.

CURB-SIDE FACTORSSHELTERS—Configurations and Orientations
Chapter
4
69
Figure 33. Placement and Orientation Options.

CURB-SIDE FACTORSChapter
4 SHELTERS—Advertising
70
Many transit agencies have paid advertising in bus shelters to supplement funding and to provideother benefits. An advertising-in-shelters program provides the opportunity to install bus shelters atbus stops that otherwise would not receive one. As part of the contract, the advertising companyinstalls the shelter or kiosk. Other benefits of this program include regular maintenance of the busstop shelters and facilities, including trash removal and installation of interior lighting at selectedsites, by the advertising agency.
The advertisements are placed on panels attached to the bus shelter to take advantage of the visibilitythat the bus stop receives from passing traffic. Backlighting is sometimes used to display the imagesat night. Advertisements do not necessarily have to be attached to the shelter. In some areas, kiosksare used to display advertisements. Depending on design, the kiosk may provide additional protectionfrom the elements at a bus stop.
Issues associated with advertisements placed on shelters and kiosks include compatibility with localland uses, ordinances, and safety. The signs can conflict with color schemes or limit views of adjacentstore fronts. Advertising at bus stops must also comply with local sign ordinances, which may hinderinstallation in some communities.
Passenger and pedestrian safety and security are of greater concern at shelters with advertising. Theadvertising panels may limit views in and around a bus stop, making it difficult for bus drivers to seepatrons. The panels can also reduce incidental surveillance from passing traffic. To prevent restrictedsight lines, advertising panels and kiosks should be placed downstream of the traffic flow. Anapproaching bus driver should be able to view the interior of the shelter easily. Indirect surveillancefrom passing traffic should be preserved through proper placement of the panels (see Figure 34).

CURB-SIDE FACTORSSHELTERS—Advertising
Chapter
4
71
Figure 34. Placement Recommendations for Advertising Panels and Kiosks.

CURB-SIDE FACTORSChapter
4 SHELTERS—Developer Provided
72
Private developers can also provide bus stop shelters. Typically, these shelters are constructed toserve a specific development, neighborhood, complex, or shopping mall. Facilities range in scopefrom a single stop to a series of coordinated stops serving an entire residential development or officepark. The designs are often striking and closely linked visually with the major design features of thecentral structure, building, or neighborhood.
Bus shelters installed by developers should meet transit agency requirements. These requirementsinclude an acceptable location, safe pedestrian access (i.e., direct sidewalk to the shelter), visibilityfor vehicles and waiting passengers, access for those with mobility impairments, and signage. Shelterownership and long-term maintenance responsibilities should be determined before installation. Busstop location decisions should be made collaboratively by the transit agency and the developer.
When private development and transit servicecollaborate on shelter installation, the benefits toboth are numerous. Transit considerations arefactored into the development from thebeginning. The development itself may becomemore transit-friendly through combined transitagency/developer design of routes to provideservice to the new development's residents. Fromthe developer's standpoint, designing for transitimproves the overall accessibility of thedevelopment, may increase the feasible densityof the development, may reduce parkingrequirements, and may increase pedestriantraffic. These factors may have a positive effecton lease (especially retail) value. Improvedaccessibility can also make recruiting employeeseasier. Figure 35 is an example of a developer-installed shelter.
Figure 35. Developer-Installed Shelter.

CURB-SIDE FACTORSSHELTERS—Artistic and Thematic Designs
Chapter
4
73
Transit agencies can use artist-designed stops and shelters or other methods to ensure that stops andshelter designs have a theme. One approach is to commission local artists to design or decorate ashelter or waiting area. This requires considerable coordination, the support of the neighborhood, apublic relations effort sufficient to generate the interest of local artists, and, ideally, sponsorship bysome civic organization. Figure 36 shows an example of a shelter designed by a local artist.
Customized or artistically designed bus stops can make waiting for a bus more pleasant. Innovativedesigns may also help provide a covered shelter or seating (e.g., flip-seats or awnings) for passengersat locations that do not have sufficient space. However, custom-designed passenger waiting areasshould not obscure identification of the bus stop. Transit agency bus stop signs and schedule displaysshould be available at these types of bus stops. The functionality of the stop should not becompromised in the name of art—the stop should provide as much patron comfort, safety, andsecurity as possible.
Neighborhood or business interests may also want the shelters and bus stop signs to reflect thecharacter of the district. One method is to develop a distinct color or logo for each neighborhood orroute group. This can be implemented by the transit agency with appropriate coordination andparticipation from the neighborhoods.
Figure 36. Artistic Shelter.

CURB-SIDE FACTORSChapter
4 AMENITIES—Benches
74
A bench, even without a bus shelter, provides comfort and convenience at bus stops. As with shelters,benches are usually installed on the basis of existing or projected ridership figures. Ridership figuresbelow those justifying a bus shelter are commonly used. Other factors used in determining bench-only locations include the following:
• The width of the bus stop location.
• Bus stops with long headways and little protection from the weather.
• Locations where the landowner has denied permission to construct a shelter.
• Sites that are frequently used by elderly people or people with disabilities.
• Evidence that transit patrons are sitting or standing on nearby land or structures.
Two factors that greatly influence the use of benches are crowding at a site and the environment at asite. Crowding limits patrons choices about sitting and waiting and forces patrons to wait around,rather than in, the bus stop. Uncomfortable bus stop environmental conditions, such as heat and sun,can also discourage use of the bench.
Preserving minimum circulation guidelines, coordinating with existing landscaping, and providingadditional waiting areas can improve bench and site utilization. The following bench placementguidelines are recommended:
• Avoid locating benches in completely exposed locations. Coordinate bench locations withexisting shade trees if possible. Otherwise, install landscaping to provide protection fromthe wind and other elements.
• Coordinate bench locations with existing street lights to increase visibility and enhancesecurity at a stop.
• Locate benches on a non-slip, properly drained, concrete pad. Avoid locating benches inundeveloped areas of the right-of-way.
• Locate benches away from driveways to enhance patron safety and comfort.
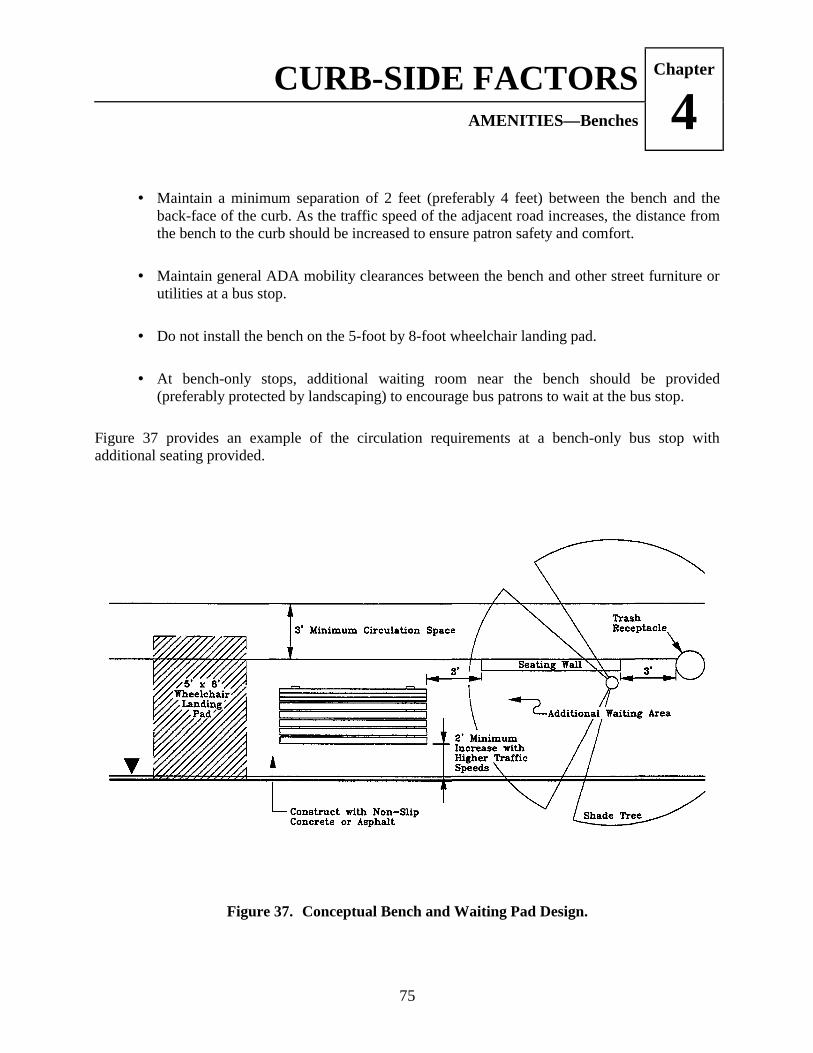
CURB-SIDE FACTORSAMENITIES—Benches
Chapter
4
75
• Maintain a minimum separation of 2 feet (preferably 4 feet) between the bench and theback-face of the curb. As the traffic speed of the adjacent road increases, the distance fromthe bench to the curb should be increased to ensure patron safety and comfort.
• Maintain general ADA mobility clearances between the bench and other street furniture orutilities at a bus stop.
• Do not install the bench on the 5-foot by 8-foot wheelchair landing pad.
• At bench-only stops, additional waiting room near the bench should be provided(preferably protected by landscaping) to encourage bus patrons to wait at the bus stop.
Figure 37 provides an example of the circulation requirements at a bench-only bus stop withadditional seating provided.
Figure 37. Conceptual Bench and Waiting Pad Design.

CURB-SIDE FACTORSChapter
4 AMENITIES—Route or Patron Information
76
Route and passenger information can be displayed in various ways. A flag sign is the most commonmethod used by transit agencies to display information. Placement and design guidelines for flagsigns are discussed in Chapter 3. Installation of schedule holders or schedule and route information onthe shelters are also commonly used.
The actual displays mounted on the sign can include the transit agency logo, route numbers availableat the stop, type of route (local or express), and destination for a limited number of routes. Detailedguidelines for the design of bus stop signs can be found in TCRP Report 12, "Guidelines for TransitFacility Signing and Graphics," and should be referenced for greater detail.
Schedule holders are included at sites with large passenger volumes. The schedule holders can bemounted on the flag sign or inside a shelter. According to "Guidelines for Transit Facility Signing andGraphics," information in Braille can be provided when a four-sided information holder is used. Aroute plaque and an information holder mounted to a sign post are shown in Figure 38.
Interior panels of shelters also can be used for posting route and schedule information. Side panelsmay be large enough to display the entire system map and can include backlighting for display atnight. Shelters that lack side panels can display route and schedule information on the interior roof ofthe shelter. Some recommendations for route or patron information display are as follows:
• Provide updated information when changes are made to routes and schedules.
• Consider the quality and appearance of information displays. A visually poor route mapconveys a negative impression of the system.
• Make information displays permanent. Temporary methods for displaying information(such as tape-mounting) create a cluttered, unsophisticated appearance at the bus stop.
• Follow ADA clearance, mobility, and visual guidelines for access of information byindividuals with impairments.

CURB-SIDE FACTORSAMENITIES—Route or Patron Information
Chapter
4
77
Figure 38. Examples of Passenger Information Holders.

CURB-SIDE FACTORSChapter
4 AMENITIES—Vending Machines
78
Vending machines can provide passengers with reading material while they wait for the bus.However, for local, non-commuter routes, vending machines can be undesirable for many reasons.The machines are often poorly maintained and reduce the amount of room for mobility and waiting(see Figure 39). Perhaps the greatest effect, though, is that trash accumulates at bus stops withvending machines. Trash removal is time-consuming and costly.
The existence of vending machines at or near bus stops does not appear to be the result of transitagency policy. Rather, it is a result of newsprint companies aggressively pursuing a high-profile site.Transit agencies have limited regulatory authority concerning the placement of vending machines.
Transit agencies, if given the opportunity, should review the need for the installation of vendingmachines at bus stops. The benefits to patrons of having the machines near the stop versus having tomaintain trash receptacles and keep the area free of improperly disposed material should be reviewed.Vending machines at a bus stop should be anchored to the ground to reduce vandalism. ADAmobility guidelines should be followed for improved site circulation (e.g., the location of the vendingmachines should not obstruct the wheelchair landing pad area).
Figure 39. Image of Vending Machines at a Bus Stop.
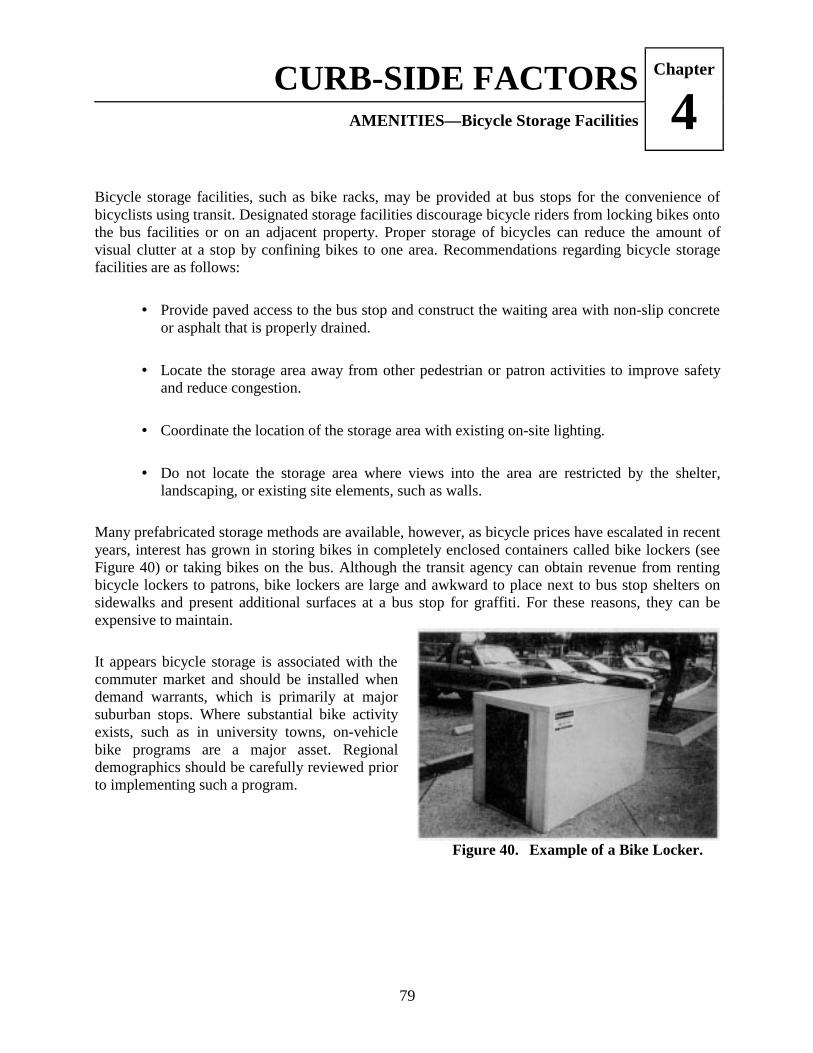
CURB-SIDE FACTORSAMENITIES—Bicycle Storage Facilities
Chapter
4
79
Bicycle storage facilities, such as bike racks, may be provided at bus stops for the convenience ofbicyclists using transit. Designated storage facilities discourage bicycle riders from locking bikes ontothe bus facilities or on an adjacent property. Proper storage of bicycles can reduce the amount ofvisual clutter at a stop by confining bikes to one area. Recommendations regarding bicycle storagefacilities are as follows:
• Provide paved access to the bus stop and construct the waiting area with non-slip concreteor asphalt that is properly drained.
• Locate the storage area away from other pedestrian or patron activities to improve safetyand reduce congestion.
• Coordinate the location of the storage area with existing on-site lighting.
• Do not locate the storage area where views into the area are restricted by the shelter,landscaping, or existing site elements, such as walls.
Many prefabricated storage methods are available, however, as bicycle prices have escalated in recentyears, interest has grown in storing bikes in completely enclosed containers called bike lockers (seeFigure 40) or taking bikes on the bus. Although the transit agency can obtain revenue from rentingbicycle lockers to patrons, bike lockers are large and awkward to place next to bus stop shelters onsidewalks and present additional surfaces at a bus stop for graffiti. For these reasons, they can beexpensive to maintain.
It appears bicycle storage is associated with thecommuter market and should be installed whendemand warrants, which is primarily at majorsuburban stops. Where substantial bike activityexists, such as in university towns, on-vehiclebike programs are a major asset. Regionaldemographics should be carefully reviewed priorto implementing such a program.
Figure 40. Example of a Bike Locker.

CURB-SIDE FACTORSChapter
4 AMENITIES—Trash Receptacles
80
Trash receptacles can improve the appearance of a bus stop by providing a place to dispose of trash.The installation of trash receptacles is typically a systemwide decision and the size, shape, and colorreflect transit agency policy. Not all bus stops have trash receptacles. Low patron volumes may notjustify the inclusion of this amenity at a bus stop; however, litter at a site may warrant the inclusion ofa trash receptacle at an otherwise low-volume location.
Problems can arise when the receptacles are not regularly maintained or when the bus stop is next to aland use that generates considerable trash such as convenience stores and fast food restaurants. Insuch cases, transit agencies should work with these establishments to define maintenanceresponsibilities for the bus stop and the area around the businesses. Businesses and communitygroups typically are reluctant to agree to maintaining trash receptacles at public sites.
Recommendations regarding installing a trash receptacle at a bus stop are as follows:
• Anchor the receptacle securely to the ground to reduce unauthorized movement.• Locate the receptacle away from wheelchair landing pad areas and allow for at least a 3-
foot separation from other street furniture.• Locate the receptacle at least 2 feet from the back of the curb.• Ensure that the receptacle, when adjacent to the roadway, does not visually obstruct
nearby driveways or land uses.• Avoid installing receptacles that have ledges or other design features that permit liquids
to pool or remain near the receptacle—this may attract insects.• Avoid locating the receptacle in direct sunlight. The heat may encourage foul odors to
develop.
Figure 41 shows the minimum circulation and separation requirements for trash receptacles at busstops.

CURB-SIDE FACTORSAMENITIES—Trash Receptacles
Chapter
4
81
Figure 41. Trash Receptacle Placement Guidelines.
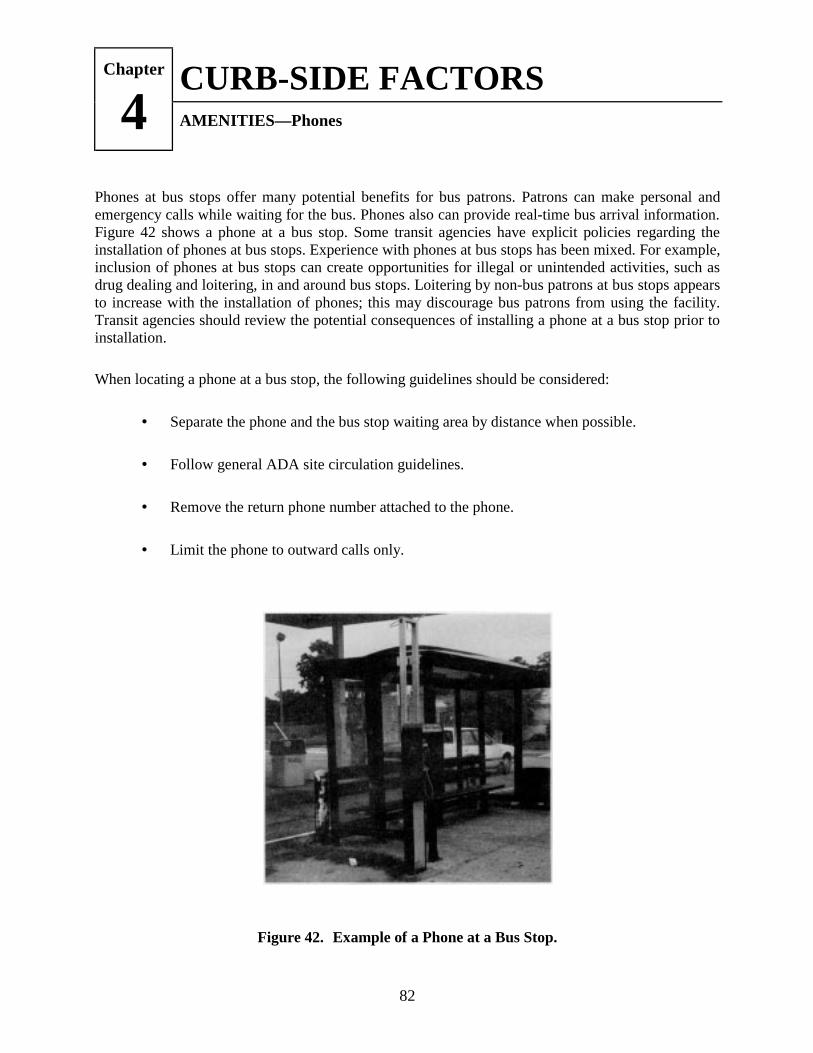
CURB-SIDE FACTORSChapter
4 AMENITIES—Phones
82
Phones at bus stops offer many potential benefits for bus patrons. Patrons can make personal andemergency calls while waiting for the bus. Phones also can provide real-time bus arrival information.Figure 42 shows a phone at a bus stop. Some transit agencies have explicit policies regarding theinstallation of phones at bus stops. Experience with phones at bus stops has been mixed. For example,inclusion of phones at bus stops can create opportunities for illegal or unintended activities, such asdrug dealing and loitering, in and around bus stops. Loitering by non-bus patrons at bus stops appearsto increase with the installation of phones; this may discourage bus patrons from using the facility.Transit agencies should review the potential consequences of installing a phone at a bus stop prior toinstallation.
When locating a phone at a bus stop, the following guidelines should be considered:
• Separate the phone and the bus stop waiting area by distance when possible.
• Follow general ADA site circulation guidelines.
• Remove the return phone number attached to the phone.
• Limit the phone to outward calls only.
Figure 42. Example of a Phone at a Bus Stop.

CURB-SIDE FACTORSAMENITIES—Shopping Cart Storage Area
Chapter
4
83
Proper storage for shopping carts at bus stops adjacent to commercial shopping centers is needed.Because such bus stops normally do not have storage facilities for shopping carts, carts often litter thearea around the stop and along the sidewalk accessing the stop. The sight of haphazardly placedshopping carts around a bus stop is visually unappealing and can block sidewalk access. Figure 43shows shopping carts abandoned at a bus stop.
Because the shopping carts are generated by the shopping center, agreements should be madebetween the land owner and the transit agency to remove the carts regularly. Frequently, however, thetime between removals is too long and shopping carts accumulate at a bus stop. One solution is toinstall a storage facility near the bus stop to prevent random storage in and around the stop. Factorsaffecting installation of a storage facility include the location of the sidewalk, available right-of-way,utilities, landscaping, terrain, and cost. Any cart storage facility should follow the general sitecirculation guidelines and remain clear of the sidewalk and wheelchair landing pad area.
Figure 43. Shopping Carts Abandoned at a Bus Stop.

CURB-SIDE FACTORSChapter
4 AMENITIES—Lighting
84
Lighting affects bus patrons' perception of safety and security at a bus stop, as well as the use of thesite by non-bus patrons. Good lighting can enhance a waiting passenger's sense of comfort andsecurity; poor lighting may encourage unintended use of the facility by non-bus patrons, especiallyafter hours. Lighting is particularly important in northern climates where patrons may arrive andreturn to the stop in darkness during the winter season. Illumination requirements are often a policy ofindividual transit agencies; however, installing lighting that provides between 2 to 5 footcandles is thegeneral recommendation.
Cost and availability of power influence the decision to install direct lighting at a bus stop. Directlighting is expensive and difficult to achieve at remote locations. When installing direct lighting at abus stop, the fixtures should be vandalproof but easily maintained. For example, avoid using exposedbulbs or elements that can be easily tampered with or destroyed.
A cost-effective approach to providing indirect lighting at a site is to locate bus stops near existingstreet lights. When coordinating bus shelter or bench locations with existing street lights, theminimum clearance guidelines for the wheelchairs should be followed. Figure 44 is an example ofcoordinating a shelter with an existing street light.
Figure 44. Example of Coordinating Shelter Locations with an Existing Street Light.

CURB-SIDE FACTORSAMENITIES—Security
Chapter
4
85
Passenger security is a major issue in bus stop design and location, because the design and location ofthe bus stop can positively or negatively influence a bus patron's perception of that bus stop. From theperspective of security, landscaping, walls, advertising panels, and solid structures can restrict sightlines and provide spaces to hide. Each of these items can be an integral part of the bus stop, either bydesign or by proximity of existing land uses. Therefore, the transit agency should carefully reviewwhich amenities are to be included at a bus stop and consider any factors that may influence security.Other sections of this document have discussed some of these concepts and should be referenced.Some guidelines regarding security at bus stops are as follows:
• Bus stop shelters should be constructed of materials that allow clear, unobstructedvisibility of and to patrons waiting inside.
• Bus stops should be at highly visible sites that permit approaching bus drivers andpassing vehicular traffic to see the bus stop clearly.
• Landscaping elements that grow to heights that would reduce visibility into and out ofthe bus stop should be avoided. Low-growing shrubbery and ground cover anddeciduous shade trees are preferred at bus stops. Evergreen trees provide a visual barrierand should be avoided.
• Bus stops, whenever possible, should be coordinated with existing street lighting toimprove visibility.
• Bus stops should be next to existing land uses, such as stores and businesses, to enhancesurveillance of the site.

CURB-SIDE FACTORSChapter
4 AMENITIES—Advantages and Disadvantages
86

CURB-SIDE FACTORSAMENITIES—Advantages and Disadvantages
Chapter
4
87

CURB-SIDE FACTORSChapter
4 AMENITIES—Materials
88
Various materials can be used to construct a bus stop. The best materials are those that are weather-resistant, can withstand continual use, and can be easily maintained. The ease with which a particularmaterial can be vandalized can reduce its desirability; easy-to-clean materials are desirable. Primarily,wood, metal, concrete, glass, and plastics are used at bus stops.
Wood, sometimes used for benches, is rarely used to construct other elements because it is easilyvandalized and weathers badly.
Metal is frequently used to construct shelters, benches, bike racks, and trash receptacles. Aluminum,although fairly inexpensive and easy to work with, is soft and easily scratched. Its high recyclabilitymakes it a target for theft by unscrupulous recyclers. As with any item or material, objects should beproperly affixed to prevent/discourage unauthorized removal. Metal, in combination with a plasticcoating, is a good material for benches, especially when a wire mesh design is used. The designresists everyday wear and tear and graffiti.
The best use of concrete at bus stops is in the paving. Concrete, an excellent non-slip surface, can beeasily poured on site to construct sidewalks, waiting pads, and connections between the stop and thecurb. Concrete is too heavy and cumbersome to use in other elements at a bus stop.
Plastic is used for paneling and roofing on shelters. The material is lightweight and can be installedwith minimal effort. Clear plastic permits the interior of the shelter to be visible from a distance,which enhances security. Depending on the desired effect, plastic can be frosted to reduce the amountof sun entering the shelter or left clear to permit sun exposure. A major disadvantage of plastic is thatit is easily damaged or destroyed by vandalism—the material can be scratched or kicked out from itsholdings. Plastic declines over time by becoming translucent and scratched, and harsh chemicalcleaners can expedite the decline.
Tempered glass is primarily used for side panels on shelters. Visually, the material is more pleasingthan plastic and withstands environmental demands better than plastic. Unlike plastic, the material isnot damaged by repeated cleaning; broken glass, however, can create a hazard for waiting passengers.Improperly anchored objects, such as vending machines and trash receptacles, should be avoided atbus stops with glass because they can be used to destroy glass panels or roofs.

CURB-SIDE FACTORSAMENITIES—Materials Advantages and Disadvantages
Chapter
4
89

CURB-SIDE FACTORSChapter
4 CURB-SIDE PLACEMENT CHECKLIST
90
This section of the guidelines lists topics that should be reviewed to enhance patron comfort,convenience, and security. The topics range from the general (such as locating a bus stop in thecommunity) to the specific (such as preserving sight lines).
" Location Within the Community: The location of the bus stop should be coordinated with thebusiness community and neighborhood. Businesses want to preserve clear views of storefronts andmaintain open circulation spaces in and around the storefronts. Although improperly locatedshelters can obstruct business activities, bus stops can enhance both transit and business activitieswhen sited properly.
Homeowners are another influential voice in the community. Typically, they do not want stops infront of their properties. Efforts to maintain bus stops in residential neighborhoods may reduce the"not-in-my-backyard" attitudes.
Coordination between governmental agencies can enhance or impede this process. Liability can bea major issue for governmental agencies and businesses. This is especially true whenimprovements are made to sidewalks at or near bus stops. Transit agencies can create their ownregulatory hurdles to avoid liability. However, this action comes at the expense of the transitpatron, the ultimate customer. Coordination and cooperation can improve this process.
" Compatibility: Bus stops should be located so as to limit conflicts with pedestrians and otheractivities. Bus stops that create conflict points with pedestrians and bicyclists or reduce thecapacity of existing sidewalks should be avoided. Benches, shelters, and other bus-related facilitiesshould be separated from pedestrian or bicycle facilities when space permits. Because bus stopsare commonly placed near parking lots, bollards and/or a raised curb would prevent cars fromdamaging bus facilities (e.g., bus shelters) or interfering with bus activities and patrons.
Bus stops should be located so as to provide safe separation of passengers and vehicles fromnearby land uses. They should not be directly next to the curb, which puts patrons close to passingvehicles. This is especially true for stops on roads with high traffic speeds. The zone of comfort orseparation for patrons from high speed traffic may be violated when the shelter or bench is tooclose to the edge of the roadway. The minimum acceptable offset for benches and shelters fromthe back face of the curb is 2 feet. This distance should increase with higher speed limits.

CURB-SIDE FACTORSCURB-SIDE PLACEMENT CHECKLIST
Chapter
4
91
" Direct Access to Bus Stop: Landscaping, berms, security walls, large parking lots, andcircuitous sidewalks can decrease the convenience of using transit by increasing the walking timebetween the origin or destination and the bus stop. Direct access to and from the bus stop iscritical to the convenience of using transit. The transit agency can work with local jurisdictionsor developers to ensure that direct sidewalks are installed near bus stops from the intersection oradjacent land uses. Defined paths or walkways can be installed through parking lots orlandscaping to reduce walking times and improve safety.
" Impervious Ground Surfaces: Avoid locating bus stops on exposed soil, grass, or unevenground. For passenger comfort and convenience, a waiting pad constructed of impervious non-slip material should be provided at the bus stop. This should be graded for proper runoff controland meet ADA requirements for cross slopes. The bus stop should be coordinated with existingsidewalks to provide defined and controlled access to the stop. In developing areas, the transitagency can coordinate bus stop location with sidewalk locations and installation through localjurisdictions or developers.
" Proper Pedestrian Circulation: Utility poles, fire hydrants, and street furniture can reduce theavailable space for bus patrons to maneuver. Avoid locating stops near items that may restrictproper movement in and around a bus stop.
Appropriate spacing of items at a bus stop should also be maintained to allow proper access forwheelchairs and pass-by pedestrian traffic. Shelters, benches, utility poles, and other streetfurniture should not intrude on the ADA landing pad, which should be at least 5 feet (measuredparallel to the curb) by 8 feet (measured perpendicular from the back face of the curb). At least 3feet of clearance should be maintained to enable wheelchair access to and from the stop andaround any transit amenities, posts, poles, fire hydrants, vending machines, or other fixtures thatmight be present. Ideally, high-volume stops should have clear pedestrian access from both busdoors.
CURB-SIDE FACTORSChapter
4 CURB-SIDE PLACEMENT CHECKLIST
92
" Existing Street Furniture: Selecting sites with existing street furniture can save the transitsystem money while providing patrons with amenities, such as benches, vending machines, andphones. The transit agency should review the condition of the amenities to make sure the itemsare properly maintained and free of graffiti or other signs of wear. The transit agency should alsonote the placement of any existing street furniture. When additional improvements are made tothe site because of the installation of a bus stop, the location of existing street furniture mayreduce circulation space and accessibility.
" Environmental Treatments: Existing site conditions can be used to enhance the environmentalcomfort of a bus stop. Sun/shade patterns provided by existing vegetation or structures cancontribute to the comfort of waiting bus patrons. The final design of the bus stop shelter shouldalso respond to the environmental demands of a site (e.g., sun/shade patterns, winds, andprecipitation). Panel placement, orientation, and materials should be selected to providemaximum comfort to patrons. The site should also be well drained.
" Security: Perception of security at a bus stop can have a significant influence on the comfortlevel of patrons using that bus stop. To enhance the security of bus stops, regularly removegraffiti and trash (to discourage repeat occurrences), ensure indirect surveillance from nearbyland uses and passing traffic, and avoid locating stops where there is opportunity forconcealment. When landscaping is involved, use low-growing shrubs that preserve sight lines.
" Lighting: Bus stops may include lighting or be located near existing street lights that provideindirect lighting to enhance the security of a stop. Interior shelter lighting can be a criticalamenity when patrons arrive and return in the dark. The interior lighting elements should beresistant to vandalism and be maintained regularly. Bus shelters without interior lights should,whenever possible, have translucent roofs.
Pedestrian-oriented lighting should be encouraged in new developments or when majorinfrastructure work is being planned. Indirect lighting from nearby businesses can also enhancesurveillance of the site from these land uses.

CURB-SIDE FACTORSCURB-SIDE PLACEMENT CHECKLIST
Chapter
4
93
" Sight Line: The bus stop should be clearly visible for both safety and security reasons. Stopsobscured by existing structures or vegetation are difficult for bus drivers to see. Passing vehiclesmay be unaware of the presence of pedestrians near or on the roadways; this increases the chancethat accidents will occur. Right turns on red can increase the likelihood of pedestrian-vehicleconflicts. The bus stop site should be inspected carefully to detect any potential sight-relatedproblems.
For security reasons, sight lines should be preserved to maintain direct and indirect surveillanceof the bus stop. Landscaping, walls, advertising panels, and structures can restrict sight lines andprovide spaces to hide. Bus stops should be easily viewed from nearby land uses and passingtraffic to enhance the security of the stop. Bus shelters should be constructed of materials thatallow clear, unobstructed visibility of patrons waiting inside. Bus patrons also need to be able toobserve their surroundings when inside the shelter.
" Maintenance: Proper maintenance of bus facilities is crucial to preserving a positive image of atransit system. Trash and graffiti should be removed as soon as possible to prevent furtherdegradation of the facilities. A database containing maintenance schedules can be created to trackthe condition of the facilities, including pavement surface conditions; age of the facilities; historyof damage; and condition of shelter, benches, or other transit amenities.
Bus stop maintenance can be costly and time-consuming. Working agreements with localbusinesses or commercial centers can reduce the financial responsibilities of the transit agency.For stops next to convenience stores, the transit agency should try to obtain a working agreementwith the local store or businesses to provide trash removal and general maintenance at the busstop. This should include snow removal.
Agreements with commercial-strip centers should also be obtained to remove used shoppingcarts from a bus stop regularly. Shopping carts abandoned around bus stops are visuallyunappealing and restrict movement through a site.

This page left intentionally blank.

GLOSSARYTERMS AND DEFINITIONS
Chapter
5
95
accessway - a paved connection, preferably non-slip concrete or asphalt, that connects the bus stopwaiting pad with the back face of the curb.
adaptive use - an individual's spontaneous, creative use of a facility or structure in ways that differfrom or go beyond the intended use or the formal design.
advertising shelter - a bus shelter that is installed by an advertising agency for the purpose ofobtaining a high-visibility location for advertisements. By agreement, the bus shelter conforms to thetransit agency specifications but is maintained by the advertising company.
ADA - American's with Disabilities Act of 1990. The Act supplants a patchwork of previousaccessibility and barrier-free legislation with a comprehensive set of requirements and guidelines forproviding reasonable access to and use of building, facilities, and transportation.
amenities - things that provide or increase comfort or convenience.
bollards - a concrete or metal post placed into the ground behind a bus shelter to protect the busshelter from vehicular damage.
bus bay - a specially constructed area off the normal roadway section for bus loading and unloading.
bus stop spacing - the distance between consecutive stops.
bus stop zone length - the length of a roadway marked or signed as available for use by a bus loadingor unloading passengers.
curb-side factors - factors that are located off the roadway that affect patron comfort, convenience,and safety.
curb-side stop - a bus stop in the travel lane immediately adjacent to the curb.
detector - a device that measures the presence of vehicles on a roadway.
discontinuous sidewalk - a sidewalk that is constructed to connect the bus stop with the nearestintersection. The sidewalk does not extend beyond the bus stop.

GLOSSARYChapter
5 TERMS AND DEFINITIONS
96
downstream - in the direction of traffic.
dwell time - the time a bus spends at a stop, measured as the interval between its stopping andstarting.
far-side stop - a bus stop located immediately after an intersection.
headway - the interval between the passing of the front ends of successive buses moving along thesame lane in the same direction, usually expressed in minutes.
layover - time built into a schedule between arrivals and departures, used for the recovery of delaysand preparation for the return trip.
midblock stop - a bus stop within the block.
near-side stop - a bus stop located immediately before an intersection.
nub - a stop where the sidewalk is extended into the parking lane, which allows the bus to pick uppassengers without leaving the travel lane, also known as bus bulbs or curb extensions.
open bus bay - a bus bay designed with bay "open" to the upstream intersection.
queue jumper bus bay - a bus bay designed to provide priority treatment for buses, allowing them touse right-turn lanes to bypass queued traffic at congested intersections and access a far-side open busbay.
queue jumper lane - right-turn lane upstream of an intersection that a bus can use to bypass queuetraffic at a signal.
roadway geometry - the proportioning of the physical elements of a roadway, such as vertical andhorizontal curves, lane widths, cross sections, and bus bays.
shelter - a curb-side amenity designed to provide protection and relief from the elements and a placeto sit while patrons wait for the bus.
sight distance - the portion of the highway environment visible to the driver.
street-side factors - factors associated with the roadway that influence bus operations.

GLOSSARYTERMS AND DEFINITIONS
Chapter
5
97
TCRP - Transit Cooperative Research Program of the Transportation Research Board.
upstream - toward the source of traffic.
waiting or accessory pad - a paved area that is provided for bus patrons and may contain a bench orshelter.

This page left intentionally blank.
99
APPENDIXES A-C
Appendixes A through C as submitted by the research agency are not published herein, but areavailable for loan on request to the TCRP.
Appendix A - Literature SearchAppendix B - Review of Transit Agencies' ManualsAppendix C - Survey Findings

D-1
APPENDIX D
STREET-SIDE STUDIES
A number of alternatives are available when choosing the location, type of facility, and designfor a bus stop. These alternatives include near-side, far-side or midblock locations, and curb-side orbus bay designs. None is ideal in all respects, but one design may offer a better balance of benefits tobus patrons and through vehicles given certain conditions. Therefore, the factors influencing thelocation and type of facility provided need to be analyzed, and a method for selecting the optimumalternative developed.
Appendix D presents the findings from studies that analyzed traffic and bus operations aroundvarious bus stop locations and designs. The studies included regional visits to agencies involved intransit operations, field studies of existing bus stops, and computer simulation. How different busstop designs operate was explored during the regional visits. The objective of the field studies was tolearn how different bus stop locations and designs influence traffic operations and driver behavioraround a bus stop. The effects of bus stop design on suburban arterial traffic operations were furtheranalyzed with the use of computer simulation.
Appendix D devotes a section to each study approach and concludes with a summary offindings.
REGIONAL VISITS
Both mail and telephone surveys were conducted during this project. (The findings from thosesurveys are documented in the Location and Design of Bus Stops, Final Report, Project A-10,available from TCRP.) While phone surveys provided an understanding of different concerns atvarious agencies, site visits were critical to provide a full appreciation of how different bus stopdesigns operate. On-site visits also provided the opportunity to photograph examples of bus stopdesigns for use in the final reports.
Researchers conducted three regional visits that included several transit agencies in each region.The three regions included the southwest, central, and the west coast. Information obtained from themail surveys was used to identify potential agencies. A broad range of agency types and operationalenvironments were visited. Agency sites were specifically selected based on their responses to themail survey, the nature of their bus stop design, their bus stop policy, and the extent to which theyrepresent a distinct category of bus stop practice, service area type, or regional category. Selectionwas also influenced by geographic grouping for efficient travel plans.

GUIDELINES FOR THE LOCATION AND DESIGN OF BUS STOPS
D-2
Data Collection Methodology
The three key personnel for the project (Fitzpatrick, Perkinson, and Hall) participated on eachtrip. Each individual was responsible for his or her particular area of expertise. For example,Fitzpatrick made observations on the influence of the street design on bus stop operation, while Hallnoted bus patron and pedestrian interaction with the bus stop. Perkinson observed various need-related aspects of each bus stop, such as spacing, placement in relation to adjacent land uses, and soon. All three researchers participated in the interviews with transit agency staff.
The team approach was critical for the site visits. Stop location and design involve manydisciplines, as reflected in the expertise of the personnel assembled for this project. However,unification of these perspectives into a single coherent vision of bus stop location and design iscritical for the practical application of this research. Consequently, the site visit team integrated theirrespective observations and insights on a real-time basis during the site visit, as well as immediatelyfollowing the conclusion of each regional trip.
The mechanics of the site inspection process involved extensive pre-visit planning to identifybus stop locations with certain specified features and to set up interviews with key agency staff.Interviewed agency staff typically had planning and/or operational responsibility. Site-specific surveyissues were identified from earlier screening and survey data.
Before interviewing the staff, a typical site survey routine was done with the physicalinspection of previously identified key design or location features of the sites. Completion of theinspection before the interview enabled the researcher to prepare for discussion of details during thescheduled interviews. The pre-interview aspect of the field work, however, involved more thaninterview preparation. This relatively unstructured field work by the team allowed for the applicationof various unobtrusive research methods. Unobtrusive research in this context means passiveobservation of the actual use of physical facilities, including the individuals using those facilities andthe artifacts of their use. This tactic is appropriate for bus stop location and design because the leveland nature of the use of a facility is a critical indicator of the success of the design and placement ofthat facility.
The relatively unstructured field work was followed by scheduled interviews with appropriatetransit agency staff, and others where appropriate. The interviews were guided by a set of interviewnotes prepared upon completion of the initial site investigations to ensure coverage of predeterminedcritical issues and questions. The interview was not, however, limited to these questions, allowing forprobing and follow up on unanticipated elements in the discussion.
In addition to the largely spontaneous real-time comparisons of observations and impressionsbetween project team members, a more formal "de-briefing" was performed at the end of eachregional visit. These sessions consolidated and documented the findings from the site visit,minimizing the loss of data due to the inherently coarse nature of field notes, as well as avoidingconfusing the sites and regions.

APPENDIX D: STREET-SIDE STUDIES
D-3
Overview of Regional Visit Data
Bus stop data were collected for almost 300 bus stops in more than 15 cities, representingmore than one dozen transit systems (public and private), during the three regional visits. Table D-1shows the number of stops examined by region, city, and transit agency. These observations weredocumented in some 2,000 photographs.
Findings
Several findings emerged from the field observations and the interviews of key agency staff.This appendix presents the findings from the site visits regarding street-side design and location ofbus stops. A summary of the findings associated with curb-side issues (such as shelter placement,need for amenities, etc.) is presented in Appendix E.
Table D-1. Summary of Regional Visits by Agency, City, and Number of Stops.

GUIDELINES FOR THE LOCATION AND DESIGN OF BUS STOPS
D-4
Safety
Pedestrian safety involves both the defined bus stop area and areas used while getting to andfrom the bus stop. Examples of traffic considerations include traffic control devices with adequatepedestrian cycles, clearly marked crosswalks, adequate setback from the street, good visibility fordrivers and pedestrians, positioning of stops and waiting areas away from intersections anddriveways, and avoiding mixing stops and vehicle turning movements. While these elements areacknowledged and well known, in practice, compromises such as placing a bus stop near driveways,are often made as shown in Figure D-1.
Figure D-1. Bus Stop Between Driveways.

APPENDIX D: STREET-SIDE STUDIES
D-5
Vehicle safety relates to the provision of sufficient visibility to other vehicles and topedestrians. Consideration is needed of the effect that the stopped bus will have on sight distance forparallel traffic and cross traffic. The potential for conflicts in the traffic stream as a bus enters orleaves a stop also needs to be considered. Figure D-2 shows a vehicle passing a stopped bus on a two-lane street. In this situation, adequate sight distance is needed so that the passing vehicle can safelyuse the opposing traffic's lane to pass the bus. Adequate sight distance for pedestrians in thecrosswalk is also needed.
Figure D-2. Example of a Vehicle Passing a Stopped Bus on a Two-Lane Street.

GUIDELINES FOR THE LOCATION AND DESIGN OF BUS STOPS
D-6
Bus stops are sometimes located between the driveways of gasoline service stations andconvenience stores. While this location has several advantages, some disadvantages exist as well. Forexample, because these facilities are usually on corners, vehicle turning movements abound, andpedestrian access is seldom clearly marked. Since parking is important, sufficient right-of-way to setback the waiting area from the street is rare. Finally, traffic entering and departing the store passesnearby and conflicts with pedestrian access (as illustrated in Figure D-3).
Figure D-3. Vehicle Conflicts with Pedestrian Access.

APPENDIX D: STREET-SIDE STUDIES
D-7
Roadway Geometry
Two aspects of roadway geometry are critical for good bus operations: 1) turning radius and2) the contour of the acceleration and deceleration portions of bus bays. While turning radius is notproperly a part of the bus stop, the project team observed many buses swinging wide and blockingtraffic in the adjacent lane as shown in Figure D-4. In many cases, the adjacent land uses or otherfactors clearly prevented the use of an adequate turning radius. In others, however, a better designwas possible. Good roadway design is well understood and documented in the traffic engineeringliterature. Interviews and subsequent discussion confirmed that institutional (jurisdictional andcoordination) and budget constraints prevented better geometry.
Figure D-4. Bus Using More Than One Lane to Complete a Turn.

GUIDELINES FOR THE LOCATION AND DESIGN OF BUS STOPS
D-8
Institutional and budget constraints were also identified as preventing the implementation ofdesirable acceleration and deceleration portions of bus bays. While the performance requirements ofbuses, in terms of acceleration and deceleration, may be less widely known, they are obtainable. Onthe other hand, bus operators demonstrated a clear mastery of operating under less than optimalconditions, such as taking advantage of upstream traffic signals that create gaps which allow the busto re-enter the traffic stream (see Figure D-5).
Figure D-5. Bus Taking Advantage of Upstream Traffic Signal.

APPENDIX D: STREET-SIDE STUDIES
D-9
Pavement
The project team observed a wide range of pavement conditions at bus stops. Unreinforcedpavement at a bus stop will deform and deteriorate in a short time, even with only moderate busactivity. The nature and magnitude of pavement deterioration at bus stops were well documentedduring the regional visits as shown in Figure D-6.
There are two primary concerns regarding pavements at bus stops: 1) initial design of thepavement and 2) maintenance and repair of existing pavement. Pavement design and management aretypically a city or state responsibility; however, the transit agency may provide supplemental fundingfor the repair of pavements at bus stops. Debate is ongoing concerning how much of the pavementdamage near a bus stop is caused by transit buses because other heavy vehicles, such as large trucksand garbage trucks, also contribute to the pavement problems near an intersection. Theseinstitutional/organizational conflicts, combined with the difficulties of maintaining a quality roadwaypavement (especially at bus stops), point to the value of installing bus pads.
Figure D-6. Poor Pavement Condition at Bus Stop.

GUIDELINES FOR THE LOCATION AND DESIGN OF BUS STOPS
D-10
Bus Pads
A bus pad is an area of reinforced pavement at a stop. It is designed to handle the additionalstresses of the frequent stopping of heavy buses, as illustrated in Figure D-7. (The bus at the stop inthis figure would probably make a right turn because of the adjacent right-turn lane.) Bus pads maybe installed during street construction or rehabilitation or may be installed as a separate project. Eitherway, the benefits in reduced maintenance and pavement damage appear to be recognized by bothtransit and city staff. Unfortunately, the use of bus pads is not as widespread as the recognition oftheir merit. The primary reasons appear to be the expense involved and the limited constituency theyare perceived to benefit. An in-depth analysis of bus pads is beyond the scope of this project;however, it appears that a clear cost/benefit analysis might help clarify this issue.
Bus Stop Location (Far-Side, Near-Side, Midblock)
The team's observations and subsequent interviews confirmed that the advantages anddisadvantages of each type of stop placement (far-side, near-side, and midblock) are well understood,although the conclusions drawn and agency preference or policy varies among transit agencies. Inpractice, bus stop placement is affected by a combination of site-specific considerations, precedent,and transit agency and city policy.
Figure D-7. Reinforced Pavement (Bus Pad) at a Stop.

APPENDIX D: STREET-SIDE STUDIES
D-11
FIELD STUDIES
To study the operations around existing bus stops, the research team collected data at severalfield sites. Results from the phone surveys and regional visits were used to select field sites thatwould be studied. The goal was to include a variety of bus stop designs, including curb-side stops,bus bays, queue jumpers, and nubs. The two major field data collection trips took place in Arizonaand California; an additional site in College Station, Texas, was also visited.
Results from the data collection trips were used to study how different bus stop locations anddesigns influence the traffic operations and driver behaviors around the bus stop. Once the field datawere collected, the observed bus stops were divided into two categories: urban stops and suburbanstops. Urban stops included stops on low-speed arterials (less than 35 mph) in areas with heavydevelopment and high driveway densities. In contrast, suburban stops were in areas with relativelyhigher speeds (greater than 35 mph), lighter development, and lower driveway densities.
Objective
The objective of the street-side field studies was to observe the operations at existing fieldsites to learn how the location and design of bus stops influence traffic and bus operations. Toaccomplish the objective of these studies, the following tasks were performed:
• Collect field data at bus stops with varying locations and designs in both urban andsuburban areas.
• Observe and record traffic operations at each of the field sites for use in the fieldstudies and the computer simulation studies.
• Summarize the information concerning the characteristics and operations at each fieldsite.
• Compare the observations at both urban and suburban bus stop locations.
To learn how different bus stop locations and designs affected the traffic operations aroundthe bus stop area, the bus and traffic operations and erratic maneuvers observed at the sites wereanalyzed and compared. The findings from the field sites were grouped by bus stop design. Bystudying the operations and erratic maneuvers occurring at different bus stop designs, certainmaneuvers could be associated with a particular design.
Suburban Sites
Data were collected at eight suburban field sites in Tucson, Arizona; Tempe, Arizona; SanJose, California; and College Station, Texas. The sites ranged in location and design. Table D-2describes each of the suburban sites studied. The following sections describe the study design, discusseach field site, and summarize the findings.

D-12
Table D-2. Description of Suburban Study Sites.
a TWLTL = two-way left-turn lane
GU
IDE
LINE
S F
OR
TH
E LO
CA
TIO
N A
ND
DE
SIG
N O
F B
US
ST
OP
S
APPENDIX D: STREET-SIDE STUDIES
D-13
Study Design
Data Collection. The research team collected data at five sites in Arizona. Data from three ofthe sites were used for the traffic study in suburban areas. These three sites consisted of two inTucson and one in Tempe. Portable 8-mm video cameras were used to study the traffic operationsaround these sites. Typically, from four to five cameras were placed around the bus stop to recordtraffic volumes, queues behind buses, and bus arrival/departure times. The cameras also recordederratic or unique behaviors by the bus operators or drivers of other vehicles.
Some of these sites were also used to aid in the traffic simulation study (see followingsection); therefore, turning movements and travel times were also collected. Travel times weremeasured from several hundred feet upstream of the bus stop to several hundred feet downstream ofthe bus stop.
Typically, video cameras taped the following locations: the bus stop; a specific point severalhundred feet upstream of the bus stop; a specific point several hundred feet downstream of the busstop; and the intersection upstream of the bus stop. In some cases, the entire bus stop area could notbe captured using only one camera; therefore, an additional camera was used.
The research team collected data at 13 sites in California, four of which were used for thesuburban traffic study. The four sites were located in the city of San Jose. While in San Jose, the teamcollected data with the help of the City of San Jose's Traffic Management Center, which has severalhigh-powered video cameras stationed throughout the downtown area to monitor traffic duringspecial events at the downtown sports arena. Consequently, the data collection team collected data atseveral different sites using these cameras. Typically, a camera was focused on an area severalhundred feet upstream and downstream of the bus stop to record volumes, turning movements, queuesbehind buses, travel times, bus arrival/departure times, and erratic behaviors.
After the data collection trips to Arizona and California, an additional field site was selectedin College Station, Texas to further study the effects that a curb-side stop has on traffic operations.This site was selected because it is known to have high traffic volumes during the a.m. peak period.Traffic operations around this site were recorded using a surveillance camera operated by the TexasTransportation Institute.
Data Reduction and Analysis. The data from the video tapes were reduced by technicians.The technicians recorded information concerning each bus, including the arrival time, departure time,queue behind bus, and delay to bus re-entering traffic. During each bus arrival, any erratic maneuversobserved were also recorded. An erratic maneuver was defined as an unusual action by the busoperator or driver of another vehicle caused by the presence and location of the bus. The erraticmaneuvers observed are listed in Table D-3.

GUIDELINES FOR THE LOCATION AND DESIGN OF BUS STOPS
D-14
Table D-3. Erratic Maneuvers Observed in the Field.
1. Traffic queue occurs due to bus blocking lane while stopped (curb-side stop).2. Traffic queue occurs due to vehicle stopping in through lane to allow bus to re-enter traffic
stream (bus bay).3. Driver of vehicle changes lanes due to bus (curb-side stop).4. Bus operator pulls out in front of car causing driver to slow down, change lanes, or stop (bus
bay).5. Conflict occurs between bus and car while bus is re-entering traffic stream causing delay to
bus.6. At a bus bay, bus driver stops in main lanes to board passengers.7. Conflict occurs between bus and car due to driveway location.
Travel time and traffic volume data from selected sites (sites S1, S2, and S4) were also usedto calibrate a computer simulation model for the traffic simulation study. Because these sites wereused for calibration, more detailed information was obtained (i.e., intersection turning movements,average speeds, and traffic signal timings). Traffic volume and travel time data were reduced in five-minute intervals around each bus arrival (for example, two minutes before a bus arrived to threeminutes after the arrival).
To measure travel times during a five-minute increment, the technicians would record thetime a vehicle entered the system, track the vehicle through the system, and record the time that thevehicle left the system. The system was typically defined as either a set distance upstream anddownstream of the bus stop or the intersection upstream and the intersection downstream of the busstop. Once the data were reduced from the video tapes, they were put into a spreadsheet for datamanipulation.
After the field data were collected and reduced, the results were summarized for each site.Included in the summary are descriptions of each of the study sites and descriptions of the bus andvehicular operations observed. After analyzing each site separately, the operations at all suburbansites were compared.
Study Sites
This section describes the eight suburban sites studied. Included are discussions of thefindings at each site.

APPENDIX D: STREET-SIDE STUDIES
D-15
Site S1: Tucson, Arizona; Speedway at Campbell. Site S1 is a queue jumper bus baylocated in the central part of Tucson, Arizona. Figure D-8 presents the plan view of the site. For the12 hours that site S1 was video taped, 68 bus arrivals were observed. During the study time, very fewerratic maneuvers occurred. Conflicts between the bus and other vehicles occurred only twice whendrivers of vehicles changed lanes to avoid a bus. Also, the delay to traffic caused by the bus wasminimal because the bus stop was located off the main lanes. The delay to the bus re-entering trafficwas also minimal. The 200-foot acceleration lane permitted the bus to merge with traffic smoothly.
Figure D-8. Site S1: Speedway at Campbell.

GUIDELINES FOR THE LOCATION AND DESIGN OF BUS STOPS
D-16
Site S2: Tucson, Arizona; Speedway between Mountain and Cherry. Site S2 is amidblock stop with a bus bay located in Tucson, Arizona. Figure D-9 presents the plan view for SiteS2. Most of the conflicts observed at Site S2 occurred between buses leaving the stop and throughtraffic. However, out of 35 bus arrivals, conflicts only occurred seven times. The conflicts occurredwhen a bus using the acceleration lane trying to re-enter the traffic stream had to slow and wait for anadequate gap in the through traffic before merging. For the seven conflicts observed, the delay rangedfrom two seconds to five seconds with an average delay of three seconds.
Figure D-9. Site S2: Speedway between Mountain and Cherry

APPENDIX D: STREET-SIDE STUDIES
D-17
Site S3: Tempe, Arizona; Mill at University. Site S3 is a far-side curbside bus stop locatedin the central area of Tempe, Arizona. The stop is positioned between two driveways leading into agas station. Two southbound lanes are on Mill until approximately 220 feet north of University. Atthis point, an additional through lane is added (see Figure D-10).
For the time that Site S3 was studied, very few erratic maneuvers occurred. Conflictsbetween the bus and other through vehicles were minimal. Also, queues and delay to the trafficcaused by the bus were minimal. This was due in part to the lane configuration at this site. As statedabove, an additional outside lane is added to Mill approximately 220 feet upstream of the bus stop.Buses traveling along Mill, approaching the bus stop, were observed moving into the additional lanebefore reaching the stop; however, the majority of through vehicles did not move into this lane if abus was present. Therefore, stopped buses typically did not interfere with the through vehicles; thus,delay to through vehicles was minimized.
Conflicts were observed between stopped buses and vehicles entering and exiting thedriveways because the bus stop was located between two driveways, leading to a gas station. Driverswanting to enter or exit the driveways experienced conflicts when a bus blocked one of thedriveways. In these situations, the drivers of the vehicles either waited for the bus to move or went tothe next driveway. Conflicts for exiting vehicles also occurred when the view of oncoming trafficalong Mill was blocked by the bus.
Figure D-10. Site S3: Mill at University.

GUIDELINES FOR THE LOCATION AND DESIGN OF BUS STOPS
D-18
Site S4: San Jose, California; Bird at San Carlos. Site S4 is a far-side curbside bus stoplocated in the southern part of San Jose. Figure D-11 presents the plan view of the site. At Site S4, 30bus arrivals were observed. Eighteen conflicts occurred between stopped buses and through traffic inwhich the drivers of through vehicles changed lanes to avoid the bus. However, because of therelatively low volumes observed, vehicles never queued behind the stopped buses and, therefore, thedelay to through traffic was minimal.
Figure D-11. Site S4: Bird at San Carlos.
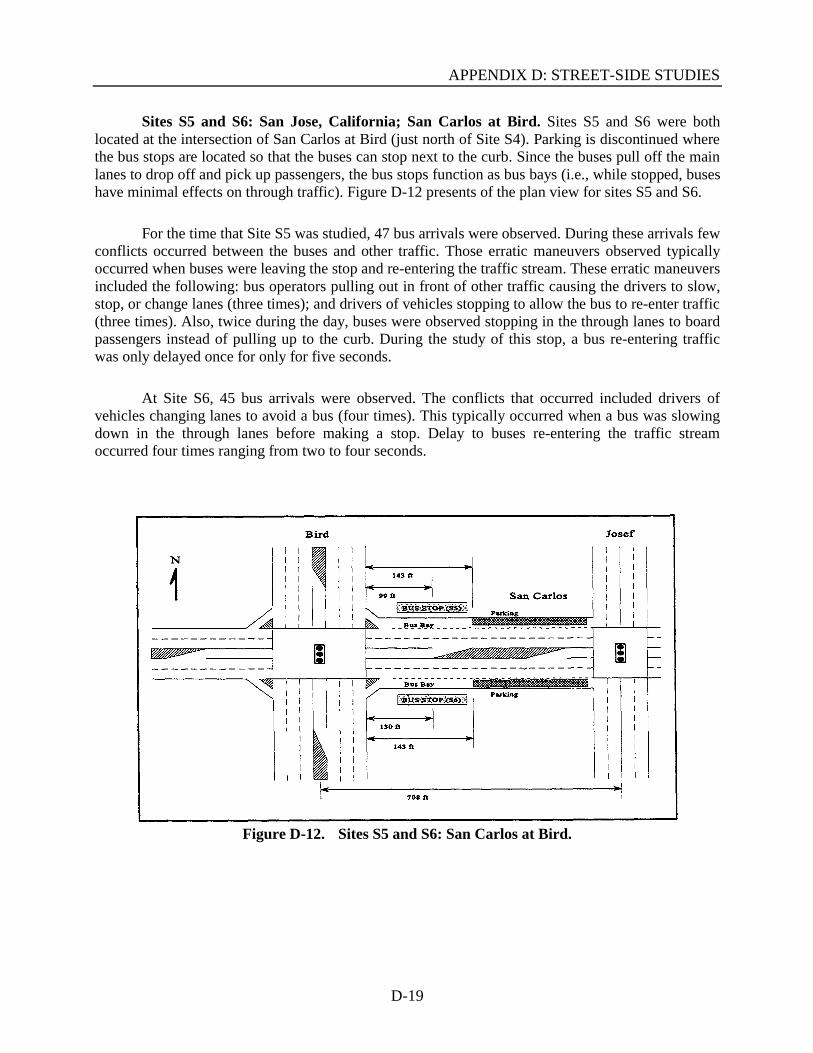
APPENDIX D: STREET-SIDE STUDIES
D-19
Sites S5 and S6: San Jose, California; San Carlos at Bird. Sites S5 and S6 were bothlocated at the intersection of San Carlos at Bird (just north of Site S4). Parking is discontinued wherethe bus stops are located so that the buses can stop next to the curb. Since the buses pull off the mainlanes to drop off and pick up passengers, the bus stops function as bus bays (i.e., while stopped, buseshave minimal effects on through traffic). Figure D-12 presents of the plan view for sites S5 and S6.
For the time that Site S5 was studied, 47 bus arrivals were observed. During these arrivals fewconflicts occurred between the buses and other traffic. Those erratic maneuvers observed typicallyoccurred when buses were leaving the stop and re-entering the traffic stream. These erratic maneuversincluded the following: bus operators pulling out in front of other traffic causing the drivers to slow,stop, or change lanes (three times); and drivers of vehicles stopping to allow the bus to re-enter traffic(three times). Also, twice during the day, buses were observed stopping in the through lanes to boardpassengers instead of pulling up to the curb. During the study of this stop, a bus re-entering trafficwas only delayed once for only for five seconds.
At Site S6, 45 bus arrivals were observed. The conflicts that occurred included drivers ofvehicles changing lanes to avoid a bus (four times). This typically occurred when a bus was slowingdown in the through lanes before making a stop. Delay to buses re-entering the traffic streamoccurred four times ranging from two to four seconds.
Figure D-12. Sites S5 and S6: San Carlos at Bird.

GUIDELINES FOR THE LOCATION AND DESIGN OF BUS STOPS
D-20
Site S7: San Jose, California; Santa Clara at Market. Site S7 is a far-side bus stop locatedin the central part of San Jose (see Figure D-13). Parking is discontinued where the bus stop is locatedso that the buses can stop next to the curb; therefore, the bus stop functions as an open bus bay. Forthe time that this site was studied, no erratic maneuvers were observed.
Figure D-13. Site S7: Santa Clara at Market.

APPENDIX D: STREET-SIDE STUDIES
D-21
Site S8: College Station, Texas; University at Texas. To further study the effects that acurbside stop has on traffic operations, an additional field site was selected in College Station, Texas.Site S8 is a far-side curbside bus stop located in the central part of College Station near Texas A&MUniversity and the Texas Transportation Institute. The buses accessing this stop are university shuttlebuses serving university students. This site was selected because it is known to have high trafficvolumes during the a.m. peak periods. Figure D-14 presents the plan view for site S8.
The erratic maneuvers observed at Site S8 included vehicles changing lanes to avoid stoppedbuses and vehicles queuing behind stopped buses. At this site, vehicles were observed changing lanesto avoid a bus 46 times and queuing behind stopped buses 14 times. The maximum queue lengthranged from one vehicle to seven vehicles.
Observing the operations at this site, for lower traffic volumes drivers would change lanes toavoid a stopped bus. As traffic volumes increased, the opportunity for through vehicles to changelanes decreased and more queues were observed. Figure D-15 illustrates the relationship betweenmaximum queue and volume for Site S8. Observing this figure, queues began forming at volumesabove 300 vphpl. Queues greater than three vehicles in length formed at volumes above 900 vphpl.
Figure D-14. Site S8: University at Texas.

GUIDELINES FOR THE LOCATION AND DESIGN OF BUS STOPS
D-22
Figure D-15. Relationship between Maximum Queue and Volume for Site S8.
Findings
Tables D-4 and D-5 summarize the research findings for the suburban sites. Table D-4includes the operational characteristics measured from the field and Table D-5 summarizes the erraticmaneuvers observed. The operational characteristics include the following: speed (either measured orposted speed limit); maximum through volume observed; minimum, maximum, and average dwelltime for the buses; minimum and maximum number of vehicles in queue behind a stopped bus; andminimum and maximum delay to buses re-entering the traffic stream. In Table D-5, the erraticmaneuvers observed in the field (see Table D-3) were combined into three categories: those thatinvolved traffic queuing near a bus stop because of the presence of bus, those that involved a vehiclechanging lanes because of the presence of a bus, and those that involved delay to a bus reentering thetraffic stream. The erratic maneuvers are summarized by number (total number observed) and rate(number of erratic maneuvers / number of bus arrivals).

D-23
Table D-4. Observational Characteristics for Suburban Sites.
a FS=Far-Side, NS=Near-Side, MB=Midblockb BB=Bus Bay, OBB=Open Bus Bay, QJ=Queue Jumper, CS=Curbsidec m=85th percentile speed measured in field; p=posted speed limitd — signifies that no queues or delays were observed
AP
PE
ND
IX D
: ST
RE
ET
-SID
E S
TU
DIE
S

GUIDELINES FOR THE LOCATION AND DESIGN OF BUS STOPS
D-24
Table D-5. Erratic Maneuvers for Suburban Sites.
a FS=Far-Side, NS=Near-Side, MB=Midblock, BB=Bus Bay, OBB=Open Bus Bay, QJ=Queue Jumper,CS=Curbsideb Traffic queue occurs near bus stop because of the presence of a bus.c Driver of vehicle changes lanes because of the presence of a bus.d Bus experiences delay while re-entering traffic stream.e Total number of erratic maneuvers for the number of bus arrivals observed.f Number of erratic maneuvers / number of bus arrivals.
Bus Stop Design. After data from each of the suburban field sites were analyzed and theresults summarized, the next step was to investigate the effects that different bus stop locations anddesigns had on the traffic operations near a bus stop. This was accomplished by grouping the studyfindings by bus stop design. The bus stop designs analyzed in this study included curbside, bus bay,open bus bay, and queue jumper. Following is a discussion on the findings for each suburban bus stopdesign and a comparison of the results.
Curbside. A curbside bus stop is located on the outside main lane along the curb. Because thestop is located in the travel lane, conflicts may occur between through traffic and stopped buses.While the delay to through vehicles may increase with a curbside design, the delay to buses isdecreased because bus operators do not have to re-enter the traffic stream (as with bus bay designs).An example of a curbside bus stop is illustrated in Figure D-16.
From the suburban field sites studied, three sites (Sites S3, S4, and S8) included curbsidedesigns. Observations at the suburban sites included recording the number of queued vehicles behinda stopped bus and erratic maneuvers of through traffic drivers due to the presence of a bus.

APPENDIX D: STREET-SIDE STUDIES
D-25
Figure D-16. Example of a Curb-side Bus Stop.
For the three suburban sites studied with curb-side designs, queues behind stopped buses were onlyobserved for one site, Site S8.
The probable reason that queues were not observed at Site S3 was due to the laneconfiguration at this site. This road has a lane added approximately 220 feet upstream of the far-sidebus stop. Bus operators traveling in the through lane approaching the bus stop were observed movinginto the additional lane before reaching the intersection preceding the stop; however, the drivers ofthrough vehicles typically did not move into this lane if a bus was present. For this reason, andbecause of the relatively low through volumes observed (approximately 330 vphpl maximum),queues were basically nonexistent.
Queues were minimal at Site S4 because drivers of through vehicles were able to change lanesbefore reaching the stopped bus. Drivers easily changed lanes to avoid the stopped bus because of thenumber of through lanes (three) and the relatively low traffic volumes (approximately 500 vphplmaximum).
As traffic volumes increase, drivers have less opportunities to change lanes before reachingthe stopped bus. This was the primary reason for the number of queues observed at Site S8. At thissite, vehicles were observed queuing behind a stopped bus for eight different bus arrivals. Themaximum queue length ranged from one vehicle to seven vehicles. Observation of the operations atthis site indicate that, for lower traffic volumes, drivers would change lanes to avoid a stopped bus.Queues began forming at volumes above 300 vphpl. Queues greater than three vehicles in lengthformed at volumes above 900 vphpl.

GUIDELINES FOR THE LOCATION AND DESIGN OF BUS STOPS
D-26
Site S3 included a bus stop located between two driveways leading to a gas station. Thisallowed the research team to study conflicts between buses and vehicles entering and exiting thedriveways. As anticipated, for drivers wanting to enter or exit the driveways, conflicts occurred whena bus was blocking one of the driveways. Conflicts for exiting vehicles also occurred when the viewof oncoming traffic on the main lanes was blocked by the bus.
Bus Bay/Open Bus Bay. A bus bay or an open bus bay is a specially constructed section offthe normal roadway to provide for bus loading and unloading in an area separated from the mainlanes. This separation allows through traffic to flow freely without being impeded by stopped buses.Bus bays are provided primarily on high-volume or high-speed roadways. Additionally, bus bays arefrequently constructed in heavily congested downtown and shopping areas where large numbers ofpassengers may board or disembark. Although the delay to through traffic is minimized with the useof a bus bay, the delay to the bus may increase due to the difficulty in re-entering the traffic stream.The delay to the bus re-entering traffic is dependent upon the traffic volume and whether anacceleration lane is provided on the bus bay. While bus bays may be positioned at far-side, near-sideor midblock locations, open bus bays are typically located at far-side locations. Figures D-17 and D-18 illustrate examples of a bus bay and an open bus bay, respectively.
Note in Figure D-18 that the bus is changing lanes while in the intersection to access the openbus bay. This illustrates one of the benefits associated with an open bus bay. The bus operator has thewidth of the intersection available for decelerating and accessing the bay. Because the open bus baydesign does not need to include a deceleration lane or an entrance taper, less right-of-way is needed.
For the eight suburban sites studied, sites S2 and S6 contained bus bays and sites S1, S5, andS7 contained open bus bays. The majority of bus delays observed occurred at Site S2 (midblock stop)and Site S6 (near-side stop). Seven buses were delayed in 10 hours of observations at S2, while fourbuses were delayed in 10.5 hours of observations at S6. For sites S1, S5, and S7 (far-side stops), thedelays to buses re-entering the traffic stream were minimal. These findings reveal that for the sitesstudied, far-side, bus bay stops resulted in less delay than near-side or midblock bus bay stops.
One reason for the minimal delays at the far-side stops was due to the breaks in traffic causedby the upstream signalized intersection. Another reason was the acceleration lanes provided. Forthose sites with acceleration lanes, bus operators were observed merging smoothly with the throughtraffic with minimal conflicts. Site S1 had an acceleration lane, and Site S7 had a continuous shoulderto be used for acceleration.

APPENDIX D: STREET-SIDE STUDIES
D-27
Figure D-17. Example of a Bus Bay.
Figure D-18. Example of an Open Bus Bay.

GUIDELINES FOR THE LOCATION AND DESIGN OF BUS STOPS
D-28
Queue Jumper. When buses can use a right-turn lane to by-pass traffic queued at congestedintersections to access a far-side open bus bay, a substantial amount of time savings may result for thebus passengers. When this situation is allowed, the right-turn lane may be defined as a "queuejumper". The effects on average delay to right-turning traffic would be based upon several factorssuch as the number of buses expected; however, the average delay to right-turning traffic is generallyassumed to be minimal. The right-turn lane is typically signed as "Right Turns Only—BusesExcepted" or with the sign shown in Figure D-19.
Figure D-19. Example of Sign Used at Queue Jumper.
Figure D-20 illustrates the travel time savings to a bus using a queue jumper. In part (a) ofFigure D-20, the bus is approaching the queue jumper and the vehicles queued at the intersection. Inpart (b) the bus is entering the queue jumper to bypass the queue. The bus then proceeds through theintersection in (c) and arrives at the stop in (d).
At Site S1, the travel time savings to buses using the queue jumper was estimated for a selectnumber of buses. To estimate travel time savings, the travel time of each selected bus using the queuejumper was measured and compared to that of a through vehicle entering the system at the same timeas the bus. Travel times were measured from 600 feet upstream of the intersection preceding the busstop to the stop bar at the intersection. Travel time savings for each selected bus was estimated bysubtracting the travel time of the bus from the travel time of the through vehicle entering the systemat the same time as the bus.

APPENDIX D: STREET-SIDE STUDIES
D-29
Figure D-20. Example of a Queue Jumper.

GUIDELINES FOR THE LOCATION AND DESIGN OF BUS STOPS
D-30
Travel time savings were estimated for six buses during high volume periods. Table D-6contains the results from this study. The travel time savings to buses ranged from 0 to 14 secondswith an average of 6.5 seconds. The travel time savings was dependent upon the queue length at theintersection and the number of right turning vehicles.
Table D-6. Travel Time Savings of Bus Using Queue Jumper.
Comparison of Design Types. Comparing the results from each of the bus stop designsstudied revealed that the majority of conflicts between through vehicles and buses occur at bus stopswith curbside designs. The predominate conflicts observed included drivers changing lanes to avoid astopped bus or queuing behind a stopped bus. The queue length behind a bus is dependent upontraffic volume. For lower traffic volumes, vehicles are able to change lanes to avoid the bus; however,as traffic volumes increase the opportunity for drivers to change lanes decreases. Therefore, as trafficvolumes increase, the delay to through traffic due to the presence of a bus increases.
The research also reveals that buses may experience more delay at stops with bus bays;however, for the sites studied the delay was only on the order of five seconds. With the bus baydesign, bus operators desiring to safely re-enter the traffic stream are required to wait for an adequategap in the through traffic. When volumes are low, adequate gaps are frequent. When volumes arehigh, the presence of adequate gaps decrease and also are influenced by the platooning effects ofsignals. For the sites studied, far-side stops resulted in less delay to buses when compared to near-sideor midblock stops. One of the reasons for the minimal delays at the far-side stops is due to the breaksin traffic caused by the upstream signalized intersection.
In addition, for the bus bay sites studied, delay was minimized for those sites withacceleration lanes. Acceleration lanes typically provide bus operators with an area to merge smoothlywith the through traffic resulting in minimal conflicts. The use of an acceleration lane is demonstratedin Figure D-21.

APPENDIX D: STREET-SIDE STUDIES
D-31
Figure D-21. Example of a Bus Bay with an Acceleration Lane.
The findings from this study also revealed that travel time savings may result for buspassengers when buses can use a queue jumper to access a far-side open bus bay. The travel timesavings to buses are dependent upon the queue length at the intersection and the number of rightturning vehicles.
Urban Sites
Data were collected at six sites in San Francisco and San Jose, California to study theoperations around bus stops in urban areas. The sites varied in locations and designs. Table D-7describes each of the urban sites studied. Following is a description of the study design, discussionsfor each of the field sites studied, and a summary of the findings.
Study Design
Data Collection. During the field data collection trip to San Francisco, California, data werecollected at three urban sites. Because San Francisco is a dense urban center, data could not becollected using portable video cameras. Traffic data were collected manually because the use of videoequipment in this environment would draw the immediate attention of both general pedestrian trafficand bus patrons.

D-32
Table D-7. Description of Urban Study Sites.
aTWLTL = two way left-turn lane
GU
IDE
LINE
S F
OR
TH
E LO
CA
TIO
N A
ND
DE
SIG
N O
F B
US
ST
OP
S
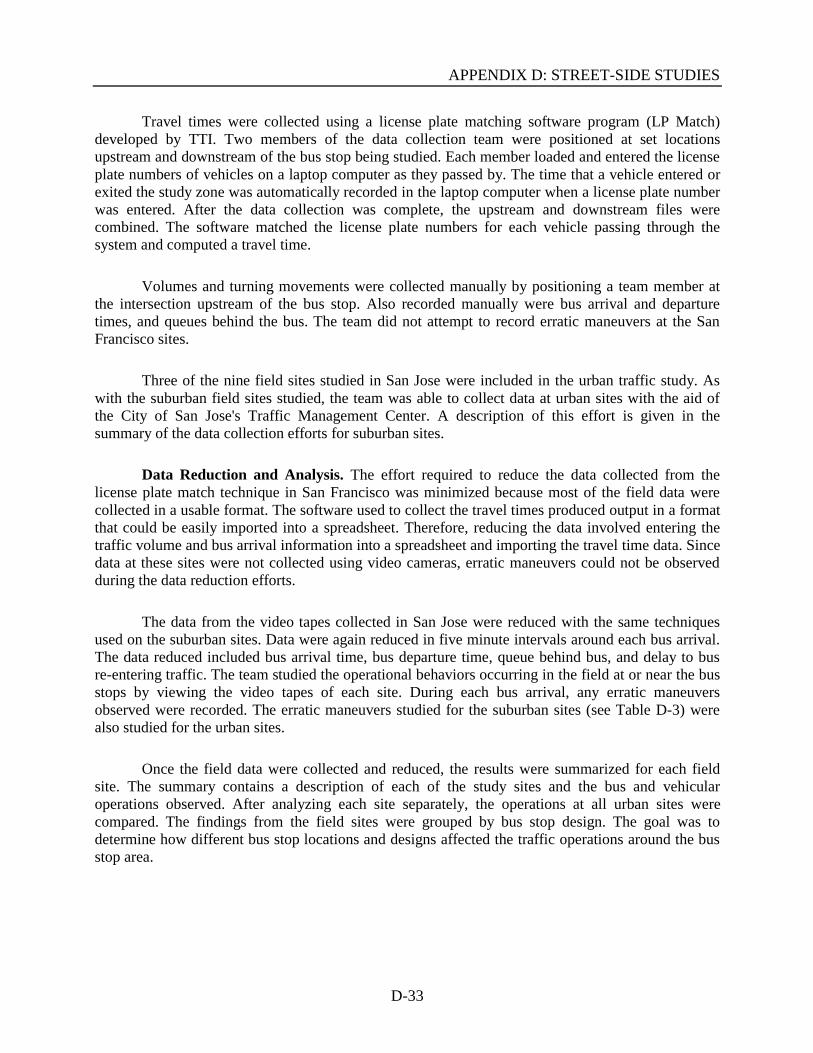
APPENDIX D: STREET-SIDE STUDIES
D-33
Travel times were collected using a license plate matching software program (LP Match)developed by TTI. Two members of the data collection team were positioned at set locationsupstream and downstream of the bus stop being studied. Each member loaded and entered the licenseplate numbers of vehicles on a laptop computer as they passed by. The time that a vehicle entered orexited the study zone was automatically recorded in the laptop computer when a license plate numberwas entered. After the data collection was complete, the upstream and downstream files werecombined. The software matched the license plate numbers for each vehicle passing through thesystem and computed a travel time.
Volumes and turning movements were collected manually by positioning a team member atthe intersection upstream of the bus stop. Also recorded manually were bus arrival and departuretimes, and queues behind the bus. The team did not attempt to record erratic maneuvers at the SanFrancisco sites.
Three of the nine field sites studied in San Jose were included in the urban traffic study. Aswith the suburban field sites studied, the team was able to collect data at urban sites with the aid ofthe City of San Jose's Traffic Management Center. A description of this effort is given in thesummary of the data collection efforts for suburban sites.
Data Reduction and Analysis. The effort required to reduce the data collected from thelicense plate match technique in San Francisco was minimized because most of the field data werecollected in a usable format. The software used to collect the travel times produced output in a formatthat could be easily imported into a spreadsheet. Therefore, reducing the data involved entering thetraffic volume and bus arrival information into a spreadsheet and importing the travel time data. Sincedata at these sites were not collected using video cameras, erratic maneuvers could not be observedduring the data reduction efforts.
The data from the video tapes collected in San Jose were reduced with the same techniquesused on the suburban sites. Data were again reduced in five minute intervals around each bus arrival.The data reduced included bus arrival time, bus departure time, queue behind bus, and delay to busre-entering traffic. The team studied the operational behaviors occurring in the field at or near the busstops by viewing the video tapes of each site. During each bus arrival, any erratic maneuversobserved were recorded. The erratic maneuvers studied for the suburban sites (see Table D-3) werealso studied for the urban sites.
Once the field data were collected and reduced, the results were summarized for each fieldsite. The summary contains a description of each of the study sites and the bus and vehicularoperations observed. After analyzing each site separately, the operations at all urban sites werecompared. The findings from the field sites were grouped by bus stop design. The goal was todetermine how different bus stop locations and designs affected the traffic operations around the busstop area.
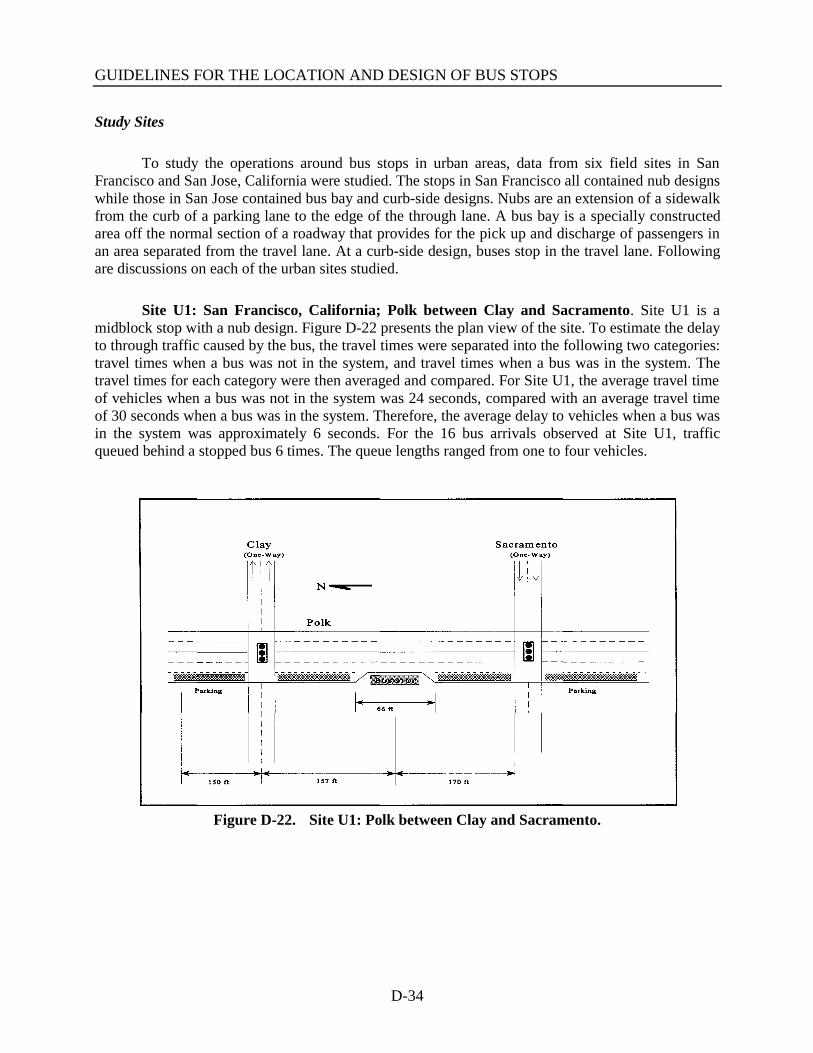
GUIDELINES FOR THE LOCATION AND DESIGN OF BUS STOPS
D-34
Study Sites
To study the operations around bus stops in urban areas, data from six field sites in SanFrancisco and San Jose, California were studied. The stops in San Francisco all contained nub designswhile those in San Jose contained bus bay and curb-side designs. Nubs are an extension of a sidewalkfrom the curb of a parking lane to the edge of the through lane. A bus bay is a specially constructedarea off the normal section of a roadway that provides for the pick up and discharge of passengers inan area separated from the travel lane. At a curb-side design, buses stop in the travel lane. Followingare discussions on each of the urban sites studied.
Site U1: San Francisco, California; Polk between Clay and Sacramento. Site U1 is amidblock stop with a nub design. Figure D-22 presents the plan view of the site. To estimate the delayto through traffic caused by the bus, the travel times were separated into the following two categories:travel times when a bus was not in the system, and travel times when a bus was in the system. Thetravel times for each category were then averaged and compared. For Site U1, the average travel timeof vehicles when a bus was not in the system was 24 seconds, compared with an average travel timeof 30 seconds when a bus was in the system. Therefore, the average delay to vehicles when a bus wasin the system was approximately 6 seconds. For the 16 bus arrivals observed at Site U1, trafficqueued behind a stopped bus 6 times. The queue lengths ranged from one to four vehicles.
Figure D-22. Site U1: Polk between Clay and Sacramento.

APPENDIX D: STREET-SIDE STUDIES
D-35
Site U2: San Francisco, California; Polk at Sutter. Site U2 is a near-side stop with a nubdesign (see Figure D-23). To estimate the delay to through traffic caused by the bus, the travel timeswere again separated into travel times when a bus was not in the system, and travel times when a buswas in the system. For site U2, the average travel time of vehicles when a bus was not in the systemwas 60 seconds, compared to an average travel time of 67 seconds when a bus was in the system.Therefore, the average delay to vehicles when a bus was in the system was approximately 7 seconds.For the time period observed (12 bus arrivals), queues did not form behind the stopped buses.
Figure D-23. Site U2: Polk at Sutter.

GUIDELINES FOR THE LOCATION AND DESIGN OF BUS STOPS
D-36
Site U3: San Francisco, California; Polk at Pine. Site U3 is a far-side stop with a nubdesign (see Figure D-24). The average travel time of vehicles when a bus was not in the system was65 seconds, compared to an average travel time of 85 seconds when a bus was in the system.Therefore, the average delay to vehicles when a bus was in the system was approximately 20 seconds.For the time period observed (11 bus arrivals), queues behind the stopped buses formed twice withmaximum queues of one and three vehicles.
Figure D-24. Site U3: Polk at Pine.

APPENDIX D: STREET-SIDE STUDIES
D-37
Site U4: San Jose, California; Alameda at Montgomery. Site U4 is a midblock bus stoplocated in the central part of San Jose at Alameda and Montgomery. Since the buses pull onto theshoulder to drop off and pick up passengers, the bus stop functions as a bus bay. Figure D-25 presentsthe plan view for site U4.
Few conflicts occurred between the buses and other traffic at Site U4. Those erraticmaneuvers that were observed occurred when buses were leaving the stop and re-entering the trafficstream. For the 26 bus arrivals studied at Site U4, drivers of vehicles were observed stopping to allowthe bus to re-enter the traffic stream three times. While this minimized the delay to the bus, itincreased the delay to the through traffic. Buses re-entering the traffic stream were only delayed twicefor four and six seconds, respectively.
Figure D-25. Site U4: Alameda at Montgomery.

GUIDELINES FOR THE LOCATION AND DESIGN OF BUS STOPS
D-38
Site U5: San Jose, California; San Carlos at Market. Site U5 is a near-side, curb-side busstop located in the central part of San Jose (see Figure D-26). For the time that Site U5 was studied,very few erratic maneuvers were observed. Out of the 30 bus arrivals, only five drivers changed lanesto avoid a bus. Queues behind the stopped buses were observed 6 times with a maximum queue ofone vehicle each time.
Figure D-26. Site U5: San Carlos at Market.
Travel time and volume data were collected for a total of nine 5-minute periods. For site U5,the average travel time of vehicles when a bus was not in the system was 30 seconds, compared to anaverage travel time of 28 seconds when a bus was in the system. Therefore, the average travel time ofvehicles when a bus was in the system was very close to the average travel times when a bus was notin the system. In other words, the overall delay to through vehicles caused by the presence of a buswas minimal. For the time period observed, queues behind the stopped buses formed 6 times;however, the maximum queue each time was one vehicle.
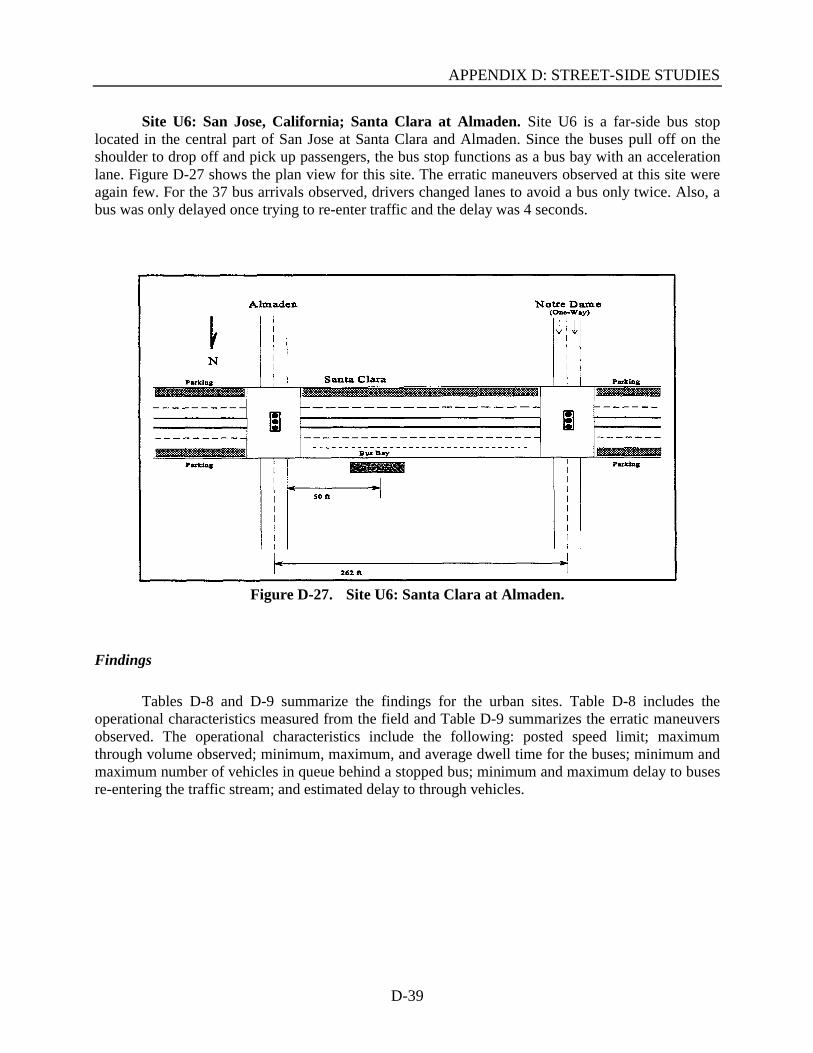
APPENDIX D: STREET-SIDE STUDIES
D-39
Site U6: San Jose, California; Santa Clara at Almaden. Site U6 is a far-side bus stoplocated in the central part of San Jose at Santa Clara and Almaden. Since the buses pull off on theshoulder to drop off and pick up passengers, the bus stop functions as a bus bay with an accelerationlane. Figure D-27 shows the plan view for this site. The erratic maneuvers observed at this site wereagain few. For the 37 bus arrivals observed, drivers changed lanes to avoid a bus only twice. Also, abus was only delayed once trying to re-enter traffic and the delay was 4 seconds.
Figure D-27. Site U6: Santa Clara at Almaden.
Findings
Tables D-8 and D-9 summarize the findings for the urban sites. Table D-8 includes theoperational characteristics measured from the field and Table D-9 summarizes the erratic maneuversobserved. The operational characteristics include the following: posted speed limit; maximumthrough volume observed; minimum, maximum, and average dwell time for the buses; minimum andmaximum number of vehicles in queue behind a stopped bus; minimum and maximum delay to busesre-entering the traffic stream; and estimated delay to through vehicles.

D-40
Table D-8. Observational Characteristics for Urban Sites.
a FS=Far-Side, NS=Near-Side, MB=Midblockb NB =Nub, BB=Bus Bay, CS=Curbsidec — signifies that no queues or delays were observedd x signifies that delays were not measured
GU
IDE
LINE
S F
OR
TH
E LO
CA
TIO
N A
ND
DE
SIG
N O
F B
US
ST
OP
S
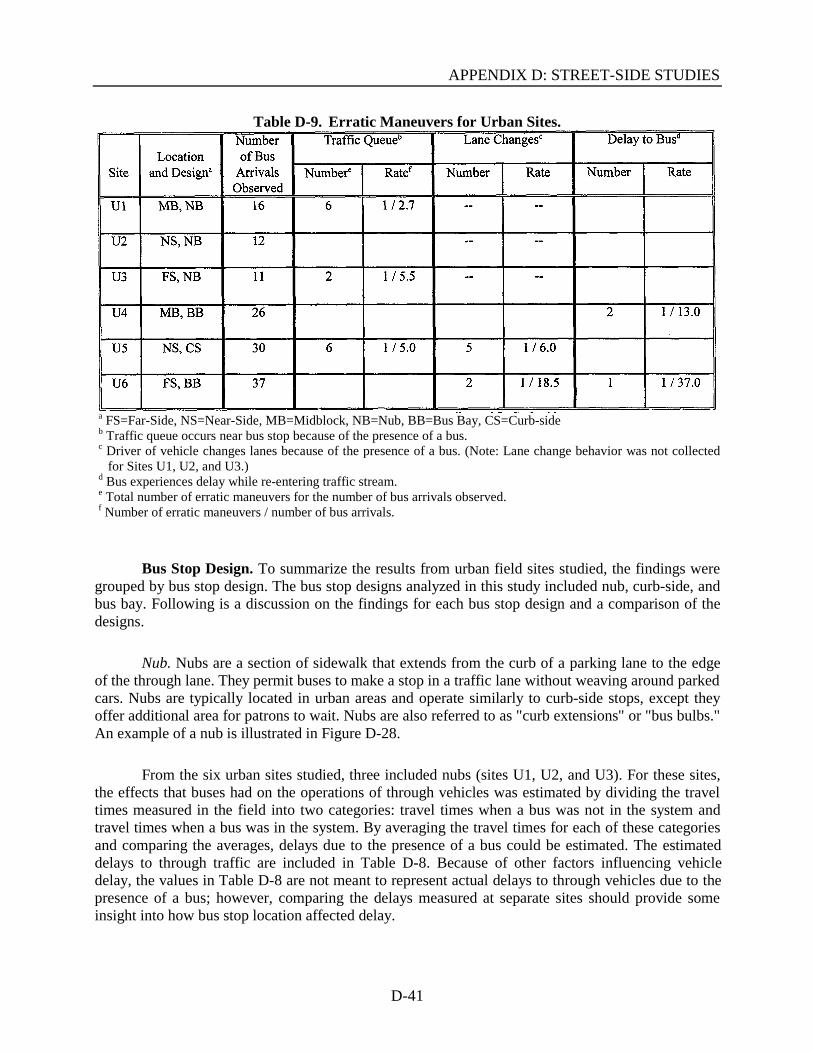
APPENDIX D: STREET-SIDE STUDIES
D-41
Table D-9. Erratic Maneuvers for Urban Sites.
a FS=Far-Side, NS=Near-Side, MB=Midblock, NB=Nub, BB=Bus Bay, CS=Curb-sideb Traffic queue occurs near bus stop because of the presence of a bus.c Driver of vehicle changes lanes because of the presence of a bus. (Note: Lane change behavior was not collected
for Sites U1, U2, and U3.)d Bus experiences delay while re-entering traffic stream.e Total number of erratic maneuvers for the number of bus arrivals observed.f Number of erratic maneuvers / number of bus arrivals.
Bus Stop Design. To summarize the results from urban field sites studied, the findings weregrouped by bus stop design. The bus stop designs analyzed in this study included nub, curb-side, andbus bay. Following is a discussion on the findings for each bus stop design and a comparison of thedesigns.
Nub. Nubs are a section of sidewalk that extends from the curb of a parking lane to the edgeof the through lane. They permit buses to make a stop in a traffic lane without weaving around parkedcars. Nubs are typically located in urban areas and operate similarly to curb-side stops, except theyoffer additional area for patrons to wait. Nubs are also referred to as "curb extensions" or "bus bulbs."An example of a nub is illustrated in Figure D-28.
From the six urban sites studied, three included nubs (sites U1, U2, and U3). For these sites,the effects that buses had on the operations of through vehicles was estimated by dividing the traveltimes measured in the field into two categories: travel times when a bus was not in the system andtravel times when a bus was in the system. By averaging the travel times for each of these categoriesand comparing the averages, delays due to the presence of a bus could be estimated. The estimateddelays to through traffic are included in Table D-8. Because of other factors influencing vehicledelay, the values in Table D-8 are not meant to represent actual delays to through vehicles due to thepresence of a bus; however, comparing the delays measured at separate sites should provide someinsight into how bus stop location affected delay.
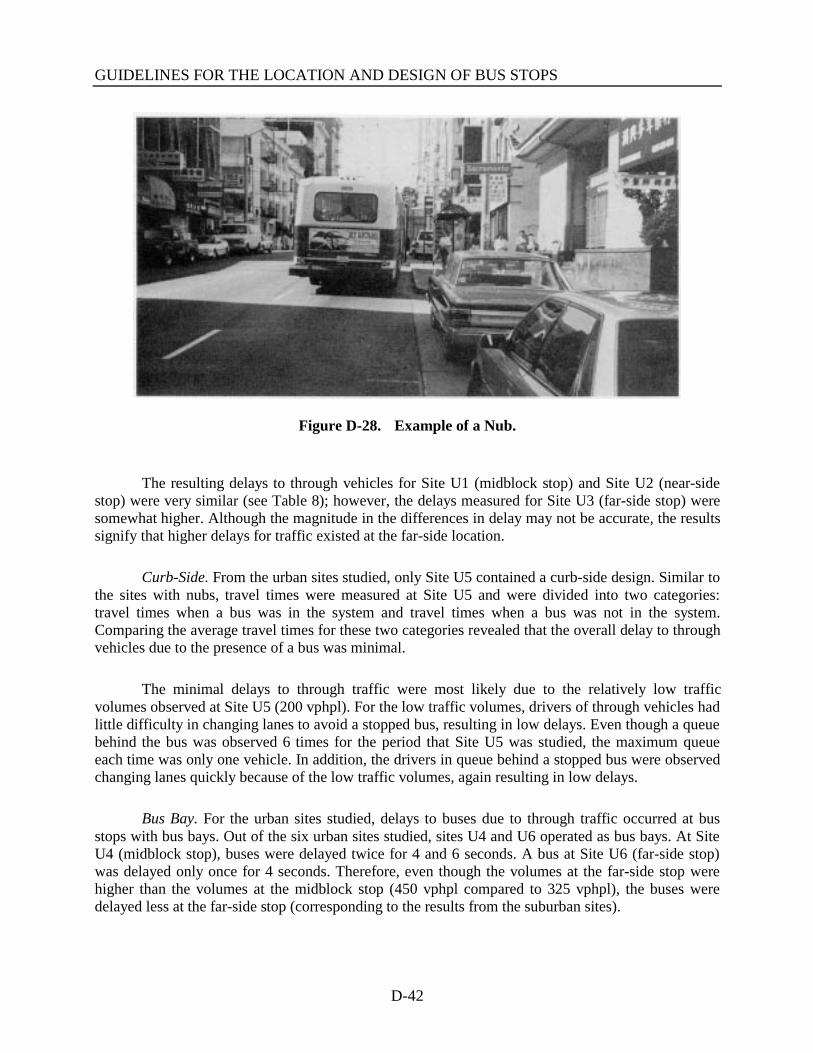
GUIDELINES FOR THE LOCATION AND DESIGN OF BUS STOPS
D-42
Figure D-28. Example of a Nub.
The resulting delays to through vehicles for Site U1 (midblock stop) and Site U2 (near-sidestop) were very similar (see Table 8); however, the delays measured for Site U3 (far-side stop) weresomewhat higher. Although the magnitude in the differences in delay may not be accurate, the resultssignify that higher delays for traffic existed at the far-side location.
Curb-Side. From the urban sites studied, only Site U5 contained a curb-side design. Similar tothe sites with nubs, travel times were measured at Site U5 and were divided into two categories:travel times when a bus was in the system and travel times when a bus was not in the system.Comparing the average travel times for these two categories revealed that the overall delay to throughvehicles due to the presence of a bus was minimal.
The minimal delays to through traffic were most likely due to the relatively low trafficvolumes observed at Site U5 (200 vphpl). For the low traffic volumes, drivers of through vehicles hadlittle difficulty in changing lanes to avoid a stopped bus, resulting in low delays. Even though a queuebehind the bus was observed 6 times for the period that Site U5 was studied, the maximum queueeach time was only one vehicle. In addition, the drivers in queue behind a stopped bus were observedchanging lanes quickly because of the low traffic volumes, again resulting in low delays.
Bus Bay. For the urban sites studied, delays to buses due to through traffic occurred at busstops with bus bays. Out of the six urban sites studied, sites U4 and U6 operated as bus bays. At SiteU4 (midblock stop), buses were delayed twice for 4 and 6 seconds. A bus at Site U6 (far-side stop)was delayed only once for 4 seconds. Therefore, even though the volumes at the far-side stop werehigher than the volumes at the midblock stop (450 vphpl compared to 325 vphpl), the buses weredelayed less at the far-side stop (corresponding to the results from the suburban sites).
APPENDIX D: STREET-SIDE STUDIES
D-43
Because of the limited number of sites, the relatively low traffic volumes, and the limitednumber of delays observed, additional data are needed to develop a definable relationship betweenvolume, delay, and stop location for urban bus bay designs. The traffic volume level that hassignificant influence on urban bus bay operations cannot be determined from the data collected in thisstudy. Based on the data, that point appears to be above 450 vphpl. Additional field data at highvolume locations or computer simulation would provide more insight into the relationship.
Comparison of Design Types. Similar to the results from the suburban sites, the results fromthe urban bus stop designs studied revealed that conflicts between through vehicles and buses weremore likely to occur at bus stops with curb-side (or nub) designs. For the sites studied, the nub designlocated at the far-side of an intersection resulted in more delay to through vehicles when compared tonubs at near-side or midblock locations. At near-side stops, delay to through traffic due to a busloading/unloading passengers and delay due to a signalized intersection overlap, resulting in lessdelay.
Also corresponding to the results from the suburban sites, results from the urban sites studiedrevealed that buses experience slightly more delay at stops with bus bays when compared to curb-side(or nub) stops; however, whether the amount of delay is significant is debatable. Also, the far-sidestop resulted in less delay to buses when compared to the near-side or midblock stops. Again, thereason for the minimal delays at the far-side stops is due to the breaks in traffic caused by theupstream signalized intersection.
COMPUTER SIMULATION
This study involved using computer simulation to study the effects of bus stop design ontraffic operations. Traffic simulation programs have been used for years to analyze traffic operationsunder various conditions. The benefit of using computer simulation is that operations can be analyzedover a wide range of variables in a relatively short period of time (compared to collecting data in thefield).
Objective
Other studies have been conducted to determine the optimum location of a bus stop (i.e., near-side, far-side, or midblock) for given situations; however, few have investigated the effects of busstop design. The objective of this study was to use computer simulation to determine how specificfactors influence traffic operations near a bus stop. Bus stop designs analyzed in this study includedcurb-side, bus bay/open bus bay, and queue jumper. Far-side and midblock locations were used in thesimulation. The results can be used to aid in the selection of a preferred bus stop design for a givenlocation and traffic volume. To accomplish the objective of this study, the following tasks wereperformed:
• Select a traffic simulation program to be used.• Use field data to aid in calibrating the traffic simulation program.

GUIDELINES FOR THE LOCATION AND DESIGN OF BUS STOPS
D-44
• Perform the simulation for various traffic volumes and bus dwell times.• Analyze the data from the simulation runs.• Develop conclusions from the study that can aid in the selection of a preferred bus stop design
for given bus stop locations and traffic characteristics.
Study Design
To investigate how various bus stop designs and locations influence traffic operations, fielddata and computer simulation were used. The intent was to use the field data to calibrate the trafficsimulation program and to use the simulation program to study traffic and bus operations undervarious conditions. The results from computer simulation could then be used to identify the preferredbus stop design for a given situation.
Field Data
Field data from three of the suburban sites studied during the field studies were used tocalibrate the traffic simulation program. Two of the sites were located in Tucson, Arizona, and one ofthe sites was located in San Jose, California. The three bus stop designs studied were a queue jumper,a bus bay, and a curb-side stop. Table D-10 provides a description of the calibration sites.
Table D-10. Description of Field Sites Selected for Calibration.
a TWLTL = Two-Way Left-Turn Lane
Data at each site were collected in the form of video tapes. For calibration purposes,technicians reduced the following data from the video tapes: traffic volumes, turning movements,travel times, speeds, bus arrival time, bus dwell time, and maximum queue behind bus. In some cases,because of the camera locations, the turning volumes could not be obtained; therefore, in thesesituations, the turning percentages were estimated. Signal timing information for the intersections wasobtained from the respective cities. A summary of the data collection and data reduction efforts ispresented in the second section of this appendix entitled Field Studies.
Traffic volume and travel time data were reduced in 5-minute intervals around each busarrival. Travel times were measured from a set location upstream of the bus stop to a set location
APPENDIX D: STREET-SIDE STUDIES
D-45
downstream of the bus stop. Since it would be difficult to measure the travel times of all vehicles,technicians only measured the travel times of selected vehicles which were believed to be traveling atspeeds representative of other traffic. Travel times of selected vehicles were calculated by recordingthe time that a vehicle entered the system and the time that the vehicle left the system.
For each site, the free-flow speeds of approximately 100 vehicles were measured. Speedswere measured by recording the time that it took a vehicle to travel a known distance. The speed wasthen calculated by dividing the distance traveled by the travel time.
Computer Simulation Programs
Traffic simulation programs have been used effectively for many operations-related trafficstudies and research projects. These programs can be used to analyze the effects that a wide range ofroadway, traffic and bus characteristics have on the operations of a system. This wide range of data isvery difficult to collect in the field; however, it can be easily studied using computer simulation. Thetwo traffic simulation programs investigated for use in this study were TRAF NETSIM and TexSIM.
TRAF-NETSIM. TRAF is a software system which consists of several macroscopic andmicroscopic simulation programs which can be used to analyze traffic operations in large urban areascontaining surface street networks and freeways. NETSIM is one of the modules in the TRAFpackage and is a microscopic model of urban street traffic. For NETSIM, each vehicle is a distinctobject which is moved every second, and every event is updated every second. Vehicles are movedaccording to car-following logic, response to traffic control, and response to other demands. Outcomein NETSIM is stochastic (i.e., a similar set of input data can generate different output data fordifferent runs).
NETSIM has the capabilities of simulating bus operations including routing, stops, number ofbuses at each stop at any one time, dwell times, and bus headways (flow rates). Each bus is identifiedby bus path, route, and bus flow rate. The bus path is the geometric path which the bus follows as ittravels through the network. The bus route is the sequence of bus stops which the bus services. Thebus flow rate is the mean headway for buses which service a particular route. Bus stops can be placedanywhere on a link, and "protected" or "unprotected" stops can be coded. This would be synonymousto bus bays and curbside stops, respectively.
TexSIM. The microscopic traffic network simulation program TexSIM is currently beingdeveloped by the Texas Transportation Institute. TexSIM runs under the Microsoft Windowsenvironment and is being developed using C++ language. The system is built on a completely object-oriented architecture. The initial purpose for developing TexSIM was to evaluate the response ofsignal systems to new types of control strategies. TexSIM is an extremely flexible program. The usersare allowed to dynamically interact and examine the network system during and after the simulation.Options are also provided to directly interact with real-time traffic controllers. TexSIM also simulatesvehicles using a car following model. Vehicle movement and response occur in increments of onetenth of a second. Outcome in TexSIM is also stochastic.

GUIDELINES FOR THE LOCATION AND DESIGN OF BUS STOPS
D-46
TexSIM uses a system involving routes and links to determine the movement of a bus duringsimulation. Coding for buses and bus routes is split into three sections: routes, buses, and bus stops.The number of routes that are to be simulated are identified initially. A route system is determined bythe links that the bus is to follow. A link is defined by the intersection number and the approach tothat intersection. The route logic within TexSIM was developed so that bus routes must haveadjoining links. Links within the route that have bus stops on them are assigned to a number specificto that bus stop. This allows for several stops within the system.
The buses are coded next. The route that the bus is to follow is coded along with the start timeat which the bus enters the system. This allows for multiple buses to follow one route at different starttimes.
The bus stop information is the final coding requirement for bus operations within TexSIM.The bus stop number is coded and it corresponds with the route information given above. Next thelocation of a bus stop is defined by the intersection ID, link ID, and the lane ID along with the lengthof the bus stop. The set back length from the start of the link is coded to allow for the movement ofthe bus stop to different locations on the link. The set back length is the length from the start of thelink to the upstream end of the bus stop. The bus dwell time is the final coding requirement for thebus stop. This is the time in seconds that a bus would typically spend at a bus stop loadingpassengers. This time is coded as an average and a variance around that average.
Selection of Program. TexSIM was selected as the traffic simulation program to be used forthis study because of its flexibility and its capability to simulate unique bus stop designs such asqueue jumpers. Most importantly, output from TexSIM can be given for each individual vehiclepassing through the system. This feature allowed the researchers to monitor the traffic operations onlywhen a bus was in the system (opposed to average travel times over a set period of time which mightinclude times in which a bus was in the system and times that no bus was in the system). In addition,TexSIM can generate output which separates queues associated with the bus from queues caused byother factors such as an intersection. Because members of the research team were in close contactwith the developers of TexSIM, there was a greater opportunity to customize TexSIM for researchteam use and to receive any needed assistance during the simulation process.
Development and Calibration of Models. Once TexSIM was selected as the program to beused for simulation, the first step was to develop models for each bus stop design to be studied (i.e.,curb-side, bus bay/open bus bay, and queue jumper). Three TexSIM models were developed basedupon the three field sites. After the models were developed, the next step was to calibrate TexSIM.This was accomplished by comparing output from TexSIM (i.e., average travel times and maximumnumber of vehicles in queue behind bus) to the operations observed in the field. TexSIM coding wasthen modified so that the models produced results similar to that expected in the field. This procedurehelped the researchers determine how closely the computer simulation models represented what wasactually happening in the field.

APPENDIX D: STREET-SIDE STUDIES
D-47
Figure D-29 presents schematics of the three field sites studied. For calibration purposes, dataat each field site were collected for approximately 3 hours. Site information and operational datacollected at the field sites are provided in Table D-11.
Table D-11. Operational Data Collected at Field Sites.
For each of the three sites, a TexSIM run was made for each bus arrival observed. Therefore,for Sites 1, 2, and 3, the number of TexSIM runs made was 9, 9, and 7, respectively, for a total of 25runs. For each run, the 5-minute traffic volumes and turning movements, as well as the traffic speeds(85th percentile), bus arrival time, and bus dwell time observed in the field were coded.
Because outcome from TexSIM is stochastic, the output may not be the same for given input.For this reason, each run was simulated for 1 hour with a bus arriving every 10 minutes. Therefore,for each run a total of six bus arrivals were included. Travel times and maximum queues behind buswere then averaged for each run and compared to the observations made in the field. If the outputfrom TexSIM was drastically different from the field observations, then the necessary coding inTexSIM was modified until the researchers believed that the output from TexSIM was representativeof the field observations.
Table D-12 shows a comparison between field observations and output from the TexSIMmodels developed for each field site. The travel times and maximum queue lengths shown wereaveraged for the number of bus arrivals studied. Although there was some variance between the traveltimes measured in the field and the travel times predicted by TexSIM, the majority of the differenceswere caused by the traffic signals. As mentioned earlier, some of the turning movements at eachintersection could not be obtained and had to be estimated. Because the signals were semiactuated, itwas difficult to replicate the actual signal operations observed in the field, therefore affecting theoverall travel times.

GUIDELINES FOR THE LOCATION AND DESIGN OF BUS STOPS
D-48
Figure D-29. Field Sites Used for Calibration of TexSIM.

APPENDIX D: STREET-SIDE STUDIES
D-49
Table D-12. Comparison of TexSIM Output to Field Data.
a N.A. - Bus bay present resulting in no queue.
To further calibrate TexSIM, the on-line graphical interface was used to compare theoperations of buses and other traffic around the bus stop area to field observations. Maneuversobserved from TexSIM that were compared to field observations included vehicles changing lanes toavoid a stopped bus, vehicles queuing behind a stopped bus, and buses re-entering the traffic streamafter completing a stop. The researchers agreed that the final TexSIM models provided a goodrepresentation of the actual field operations.
Performing the Simulation. The first two bus stop designs studied were curb-side and busbay/open bus bay. The goal was to develop recommendations as to when a curb-side stop should beconverted into a bus bay/open bus bay. TexSIM was used to compare different bus stop designs atboth far-side (curb-side versus open bus bay) and midblock (curb-side versus bus bay) locations.
Schematics of the models used to study curb-side and bus bay designs for both far-side andmidblock locations are shown in Figures D-30 and D-31, respectively. The models consisted of asingle signalized intersection with four approaches. The main street approach consisted of twothrough lanes with left turn bays at the intersection. The bus stop under investigation was locatedeither at the far-side of the intersection or at a midblock location downstream of the intersection onthe main street. To remove the effects of the downstream intersection on vehicle travel time, adownstream intersection was not included in the model. This allowed the researchers to investigateonly the effects that the bus stop design had on traffic operations for various traffic volumes.
The queue jumper design was also studied to determine the effects of a queue jumper on busoperations. The goal was to determine the situations in which a queue jumper would provide thegreatest benefit. The models studied included a far-side open bus bay with a queue jumper and a far-side open bus bay without a queue jumper (see Figure D-32).

GUIDELINES FOR THE LOCATION AND DESIGN OF BUS STOPS
D-50
Figure D-30. Far-Side Bus Stop Designs.

APPENDIX D: STREET-SIDE STUDIES
D-51
Figure D-31. Midblock Bus Stop Designs.

GUIDELINES FOR THE LOCATION AND DESIGN OF BUS STOPS
D-52
Figure D-32. Queue Jumper Bus Stop Designs.

APPENDIX D: STREET-SIDE STUDIES
D-53
To perform the simulations, variables to be adjusted and their increment size were selected.Specific inputs required by TexSIM included traffic volumes, turning percentages, speed, busheadways, bus dwell times, and signal timings. The values used for each of the above variables areshown in Table D-13. Optimum signal timings were computed using the signal optimization package,PASSER II. The variables adjusted included main street through traffic volume (100 to 3000 vph) andbus dwell time (20 to 60 seconds). For the queue jumper study, right turn percentages of 10% and25% were used, and only a dwell time of 20 seconds was studied. Again, because outcome fromTexSIM is stochastic, each run was simulated for 1 hour with a bus arriving every 10 minutes.Therefore, a total of six bus arrivals was included for each run.
Table D-13. TexSIM Model Variables.
a Right turn percentages of 10% and 25% were used for queue jumper study.b A dwell time of 20 seconds was used for queue jumper study.
Data Reduction. After each simulation run, the necessary data were retrieved from theTexSIM output. The data reduced included vehicle travel times and the number of vehicles queuedbehind a stopped bus (for curb-side design). Output from TexSIM was given for each vehicle whichtraveled through the system; therefore, the researchers were allowed to record the travel time ofvehicles only when a bus was in the system.
Travel times were measured from a set point upstream of the bus stop to a set pointdownstream of the bus stop. The output generated from TexSIM included the time that each vehicle
GUIDELINES FOR THE LOCATION AND DESIGN OF BUS STOPS
D-54
entered the link containing the bus stop and the time that the vehicle left the link. From the entry andexit times, the actual travel time was computed.
Table D-14 contains an example of the output generated by TexSIM for a midblock curb-sidebus stop with a dwell time of 60 seconds. The first column contains the vehicle ID which is assignedto each vehicle as it enters the system. The vehicle type, shown in the second column, specifieswhether the vehicle is a passenger car (C) or a bus (B). The third and fourth columns include the time(in milliseconds) that each vehicle entered and exited the bus stop link. The travel time was computedby subtracting the entry time from the exit time. By noting the times that the bus entered and exitedthe link, the vehicle travel times when a bus was on the link could be identified (shown as the shadedarea in Table D-14. In this example, the vehicles traveling through the system when the bus waspresent took, on average, 20.1 seconds to travel the link. In comparison, the bus took 78.4 seconds(18.4 seconds travel time and 60 seconds dwell time).
For the curb-side bus stops, TexSIM recorded the number of vehicles queued behind astopped bus. The number of vehicles in queue was recorded for each second that the bus was stopped.Table D-15 shows an example of the output from TexSIM for a midblock curb-side stop with a dwelltime of 20 seconds. As shown in this table, the amount of dwell time remaining is recorded eachsecond along with the number of vehicles in queue. Observing the output, a queue only exists for thelast 5 seconds that the bus is stopped, and the maximum number of vehicles in queue is two.
Data Analysis. After the TexSIM data were reduced, they were analyzed. Output fromTexSIM recorded for the curb-side versus bus bay/open bus bay study included vehicle travel timeswhen a bus was in the system and number of vehicles queued behind the stopped bus. For the far-sidestops, travel times were measured from the intersection to a point 1000 ft downstream of theintersection. For the midblock stops, travel times were measured from 100 ft upstream of the bus stopto a point 900 ft downstream of the bus stop. The travel times were used to compute average speeds.Then, the speeds for the curb-side designs were compared to the speeds for the bus bay designs forvarious volumes.
Output recorded for the queue jumper study included travel times for the bus both upstream ofthe queue jumper and through the queue jumper. Travel times were measured from a point 3300 ftupstream of the intersection to the intersection. This information helped to determine the travel timesavings to a bus when a queue jumper was present. Again, average speeds were computed from thetravel times, and the travel times and speeds for the queue jumper designs were compared to those forbus stops without a queue jumper.
Results
The calibrated TexSIM models for curb-side, bus bay, open bus bay, and queue jumperdesigns were run for various combinations of traffic volumes and bus dwell times. Following is adiscussion of the results from the curb-side versus bus bay/open bus bay study and the queue jumperstudy.

APPENDIX D: STREET-SIDE STUDIES
D-55
Table D-14. Example of TexSIM Output — Travel Time Data.a
a Shaded area represents vehicles which traveled through the system when a bus was present.
Curb-Side Versus Bus Bay/Open Bus Bay
An objective of the computer simulation was to develop criteria as to when a curb-side stopshould be converted to a bus bay/open bus bay for midblock and far-side locations. Factorsinvestigated included vehicle speeds and maximum queue length behind stopped buses. To study thetrends between these factors and varying traffic volume and bus dwell times, several figures weregenerated.
Using the travel time data collected from TexSIM, the average speeds of vehicles werecomputed for the curb-side and bus bay/open bus bay designs. Figure D-33 illustrates therelationship between the speed of vehicles (when a bus was in the system) and through trafficvolume (vehicles per hour per lane) for curb-side and bus bay designs at a midblock location. Thisfigure shows that the speeds for the bus bay design are consistently higher than the speeds for the

GUIDELINES FOR THE LOCATION AND DESIGN OF BUS STOPS
D-56
curb-side design, as was expected. Also, for the bus bay design, dwell time did not have an influenceon speed because the bus bay minimized the effects of the bus on traffic operations.
Table D-15. Example of TexSIM Output — Queue Data.
For the curb-side design, however, dwell time did have an effect on speed. The speeds for the20-second dwell time were relatively higher than the speeds for the 40- and 60-second dwell times.The speeds for the 40- and 60-second dwell times were very similar. This similarity is most likely dueto the timing of the upstream traffic signal, which controls the release of the main street through-traffic volume.
Figure D-33 also shows that for traffic volumes below approximately 350 vphpl, the speedsfor the curb-side design decrease at a relatively higher rate for increasing traffic volume than do thespeeds for the bus bay design. Above 350 vphpl, the rate of decrease in speed becomes less for thecurb-side design.
Figure D-34 was plotted to illustrate the benefits of a bus bay over a curb-side design. Thisfigure shows the difference in vehicle speeds for the bus bay and curb-side designs (i.e., speeds forbus bay design minus speeds for curb-side design). For volumes below 350 vphpl, the difference inspeeds increases at a relatively high rate for increasing traffic volume. Above 350 vphpl, thedifference in speeds becomes relatively constant.
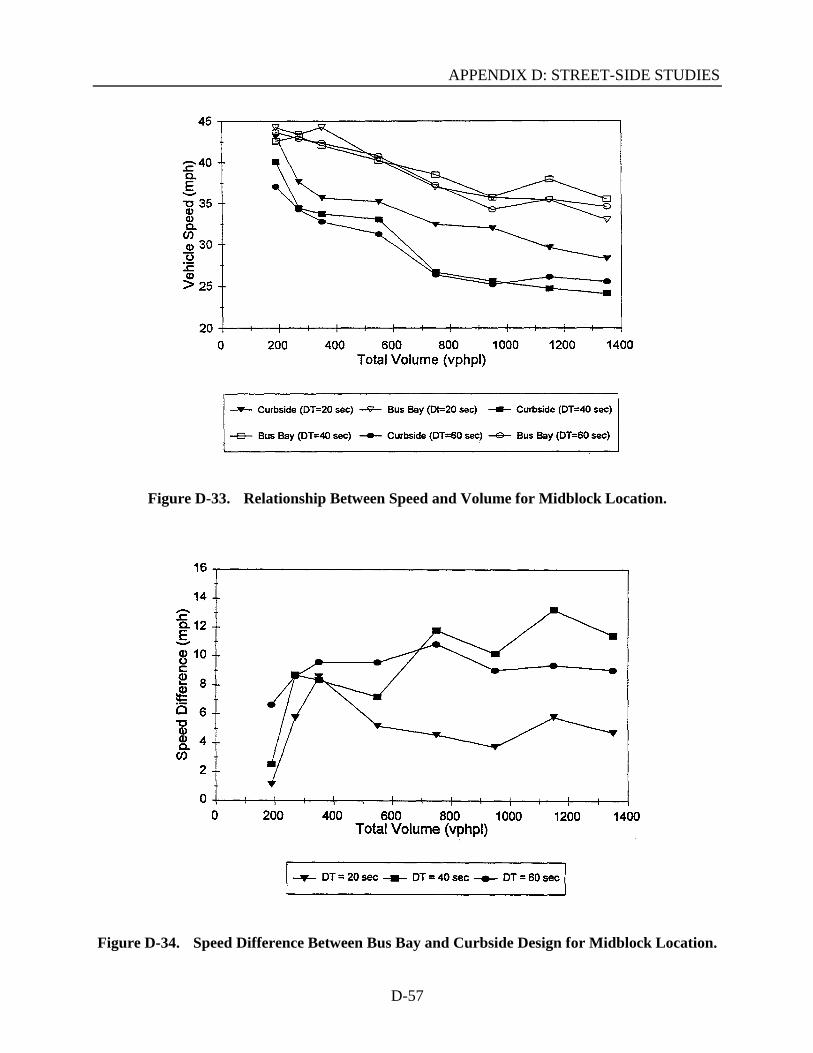
APPENDIX D: STREET-SIDE STUDIES
D-57
Figure D-33. Relationship Between Speed and Volume for Midblock Location.
Figure D-34. Speed Difference Between Bus Bay and Curbside Design for Midblock Location.

GUIDELINES FOR THE LOCATION AND DESIGN OF BUS STOPS
D-58
Figure D-35 illustrates the relationship between vehicle speed and through volume for the far-side location, and Figure D-36 shows the benefits in speed due to a far-side bus bay design ascompared to a far-side curb-side design. Similar to the results for the midblock location, Figure D-35reveals that the rate of decrease in vehicle speed for the curb-side design was greatest for trafficvolumes below 350 vphpl. Also, Figure D-36 shows that the difference in speeds between bus bayand curb-side designs reaches a maximum at approximately 350 vphpl. Therefore, these results revealthat the bus bay design provides the greatest benefits to traffic operations at volumes above 350vphpl.
To further study the effects of the curb-side design on traffic operations, the maximumnumber of vehicles in queue behind a stopped bus were obtained from the TexSIM output. Figures D-37 and D-38 illustrate the relationship between maximum queue and traffic volume for midblock andfar-side locations, respectively. As mentioned earlier, for each combination of traffic volume and busdwell time, TexSIM was run for 1 hour with a bus headway of 10 minutes (for a total of six busarrivals). Therefore, the maximum queues illustrated in Figures D-37 and D-38 are the averagemaximum queues for the six bus arrivals.
Observing Figures D-37 and D-38, for both midblock and far-side locations, the averagemaximum queue increases at a linear rate for increasing traffic volume for volumes belowapproximately 950 vphpl. Above 950 vphpl, the rate of increase becomes smaller for the far-sidelocation and is relatively constant for the midblock location. The maximum queues for the observedtraffic volumes were approximately four and five vehicles for the midblock and far-side locations,respectively.
From the field studies, the highest number of vehicles in queue was observed at Site S8,which contained a far-side curb-side bus stop (see Table D-2). In the bus stop area at Site S8, therewere three through lanes, and the maximum volume observed was approximately 910 vphpl. FigureD-39 shows the maximum queues observed at Site S8 along with the maximum queues predicted byTexSIM for the far-side curb-side design over a range of traffic volumes. Although the field datacontain a much higher variation in the maximum queues observed relative to the TexSIM data, thereare some similarities between the two data sets. Both the TexSIM output and the field data queues ofat least one vehicle occur at approximately 300 vphpl. In addition, queue lengths of three vehicles ormore form at traffic volumes of approximately 600 vphpl and above for both the TexSIM data and thefield data.
Queue Jumper
The intent of the simulation of the queue jumper bus bay design was to developrecommendations for when to consider a queue jumper bus bay design at a far-side bus stop. Benefitsof a queue jumper bus bay were measured in terms of travel time savings and speed increases to thebus when a queue jumper bus bay was present. Factors adjusted during the computer simulation runsincluded traffic volume (100 to 3000 vph) and right turn percentage (10% and 25%).

APPENDIX D: STREET-SIDE STUDIES
D-59
Figure D-35. Relationship Between Speed and Volume for Far-Side Location.
Figure D-36. Speed Difference Between Bus Bay and Curbside Design for Far-Side Location.

GUIDELINES FOR THE LOCATION AND DESIGN OF BUS STOPS
D-60
Figure D-37. Relationship Between Maximum Queue and Volume for Midblock Location.
Figure D-38. Relationship Between Maximum Queue and Volume for Far-Side Location

APPENDIX D: STREET-SIDE STUDIES
D-61
Figure D-39. Relationship Between Maximum Queue and Volume forTexSIM Data and Field Data.
The bus travel times predicted by TexSIM were measured from a point 3300 feet upstream ofthe intersection to the intersection. This distance included the right turn/queue jumper lane (300 feetin length) and 3000 feet upstream of the queue jumper. Figure D-40 illustrates the relationshipbetween bus travel time and through traffic volume for a far-side open bus bay with and without aqueue jumper. As shown in this figure, as the traffic volume increases the bus travel time increases.At traffic volumes above 1000 vphpl, the bus travel time increases significantly for all situationsexcept for a queue jumper with 25% right turns. Above 1000 vphpl, the capacity of the arterialcontrols the traffic operations and the addition of a right turn bay increases the capacity of the arterial(especially when a heavily-used right turn bay is present, which is the case when right turns = 25%).Increasing the right turn percentage increased the throughput of the arterial because right-turn-on-redwas allowed.
Figure D-41 was generated to examine the travel time savings to a bus using a queue jumperbus bay. This figure shows the relationship between travel time savings and through volume fortraffic volumes below 1000 vphpl (so that a better view of the operations at lower traffic volumes isavailable). Observing this figure, the travel time savings were relatively independent of right turnpercentage for traffic volumes below 1000 vphpl. For this volume range, the travel time savingsvaried from approximately 5 seconds to approximately 33 seconds. The travel time savings arerelatively constant to approximately 250 vphpl. After 250 vphpl, the travel time savings increasenotably.

GUIDELINES FOR THE LOCATION AND DESIGN OF BUS STOPS
D-62
Figure D-40. Relationship Between Bus Travel Time and Volume for Queue Jumper Design.
Figure D-41. Relationship Between Travel Time Savings and Volume forQueue Jumper Design.

APPENDIX D: STREET-SIDE STUDIES
D-63
To further illustrate the benefits of a queue jumper bus bay, the travel time savings wereconverted to speed. Figure D-42 shows the relationship between traffic volume and the difference inbus speed for bus stops with and without a queue jumper (i.e., bus speeds with queue jumper minusbus speeds without queue jumper). For traffic volumes below 1000 vphpl, the advantages in averagespeed when a queue jumper was present ranged from approximately 3 mph to 8 mph.
Conclusions
The objective of the computer simulation study was to determine how specific factors, such asvolume and bus stop location, influence traffic operations around a bus stop. The conclusions thatwere made are presented below.
Curb-Side Versus Bus Bay/Open Bus Bay
• For the midblock curb-side and bus bay designs studied, the advantages in average vehiclespeed of a bus bay design compared to a curb-side design ranged from approximately 2 mph toapproximately 10 mph over the 1000-foot study area (based on traffic volume).
• For the far-side designs studied, the advantages in average vehicle speed of an open bus baydesign compared to a curb-side design ranged from approximately 1 mph to 7 mph over the1000-foot study area.
Figure D-42. Speed Difference Between Queue Jumper and No Queue Jumper.

GUIDELINES FOR THE LOCATION AND DESIGN OF BUS STOPS
D-64
• For the midblock curb-side design, the dwell time of the stopped bus affected trafficoperations. The predicted speeds for a 20-second dwell time were from 2 mph to 7 mph higherthan the predicted speeds for the 40-second and 60-second dwell times. Speeds for the 40-second and 60-second dwell times were relatively similar.
• For the far-side curb-side design, dwell time had minimal effect on the traffic operations. Therelationship between vehicle speed and volume was similar for the 20-, 40-, and 60-seconddwell times.
• For both the midblock and far-side bus stop locations, 350 vphpl was the volume at which theadvantages in average vehicle speeds due to a bus bay either increased significantly or werenear maximum. Notable travel time savings were also observed at 250 vphpl.
Queue Jumper
• For the queue jumper study, the results revealed that traffic operations began to diminishsignificantly at volumes above 1000 vphpl because of the limited capacity of the arterial(which is to be expected).
• For traffic volumes below 1000 vphpl, the travel time savings to a bus using a queue jumperbus stop ranged from approximately 5 seconds to 33 seconds over the 3300-ft study area(based on traffic volume). The advantages in average bus speed when a queue jumper bus stopwas present ranged from 3 mph to 8 mph.
• The queue jumper bus stop design provided notable travel time savings and speed advantagesabove approximately 250 vphpl.
SUMMARY OF FINDINGS
This appendix documents research that focused on street-side factors affecting the locationand design of bus stops. The research included regional visits, field studies, and computer simulation.The findings from each of these studies are summarized below.
Regional Visits
The objective of the regional visits was to explore how different bus stop designs operate. Thestates visited during the trips included Arizona, Michigan, and California. The efforts during theregional trips included interviewing transit agency staff, visiting several bus stops with differentdesigns and locations, and observing how the stops operated. The findings from the regional visitswere as follows:
APPENDIX D: STREET-SIDE STUDIES
D-65
• Successful design and placement of a bus stop requires coordination between transit agenciesand other government agencies (primarily cities but also including neighborhoodorganizations, etc.).
• Safety considerations include providing adequate sight distances for pedestrians, vehicledrivers, and bus operators and minimizing the number of bus stops near driveways.
• Reinforced bus pads result in reduced pavement deterioration and minimal maintenance costs.Further research is needed to analyze the benefits of bus pads by comparing stops usingreinforced bus pads with stops that do not have bus pads.
Field Studies
The objective of the field studies was to observe the operations at existing sites to determinehow the location and design of bus stops influence traffic and bus operations. The study sites weredivided into suburban sites (traffic speeds greater than 35 mph), and urban sites (traffic speeds lessthan 35 mph). The locations investigated included near-side, far-side, and midblock. The suburbanbus stop designs included curb-side, bus bay, and queue jumper. The urban bus stop designs includedcurb-side, bus bay, and nub. Following are the findings from these studies:
• For bus bay stops, far-side locations may result in less delay to buses when compared to near-side or midblock locations. One reason for the minimal delays to buses at the far-side stops isdue to the breaks in traffic created by the upstream signalized intersection.
• For bus bay stops, delay to buses is minimized for those sites with acceleration lanes.Acceleration lanes provide bus operators with an area to merge smoothly with the throughtraffic resulting in minimal conflicts.
• For far-side open bus bay stops, a queue jumper can provide significant travel time savings tobus passengers. The travel time savings to buses are dependent upon the queue length at theintersection and the number of right-turning vehicles. The effects on average delay to right-turning traffic due to a bus using a queue jumper is generally assumed to be minimal.
• For nub or curb-side designs, near-side locations may result in less delay to through vehicleswhen compared to far-side locations. At near-side stops, delay to through traffic due to a busloading/unloading passengers and delay to a signalized intersection overlap, resulting in lessoverall delay.
Computer Simulation
The objective of this study was to use computer simulation to determine how different busstop designs affect traffic and bus operations. Bus stop designs analyzed included curb-side, bus bay,open bus bay, and queue jumper. Both midblock and far-side locations were used in the simulation.Factors varied during the computer simulation included traffic volume and bus dwell
GUIDELINES FOR THE LOCATION AND DESIGN OF BUS STOPS
D-66
time. For the queue jumper design, the percent of right-turning vehicles was also varied. Followingare the findings from the computer simulation study:
• For the curb-side design, the dwell time of the stopped bus at the midblock location had aneffect on traffic operations; however, dwell time did not affect traffic operations for thefarside location.
• For both midblock and far-side locations, 350 vphpl was the volume at which the advantagesin average vehicle speeds due to a bus bay either increased significantly or were nearmaximum. Notable travel time savings were also observed at 250 vphpl.
• The queue jumper bus bay design provided notable travel time savings and speed advantagesabove approximately 250 vphpl.

E-1
APPENDIX E
CURB-SIDE STUDIES
This appendix presents a review of the curb-side studies findings and observations. Theinformation has been integrated and organized to reflect the experiences and amenities that might beencountered at a bus stop by patrons.
The objective of the curb-side studies was to determine how placement and design of curb-side amenities impact patron and pedestrian utilization of bus stops. To accomplish this objective, thefollowing tasks were completed:
• Collect information on a wide variety of bus stop designs, configurations, andplacements.
• Collect field data on pedestrian and patron behavior at bus stops at a number of differentlocations with high bus patron volumes.
• Observe actual utilization of bus stop sites for extended periods to determine siteutilization patterns and external influences on site utilization.
• Analyze the environmental characteristics of an individual site and how they may impactsite utilization and adaptive use of the nearby land use.
• Analyze the placement of the bus stop and how it influences pedestrian- and bus-patron-related activities (conflicts with boardings/alightings and waiting areas and changes ingeneral pedestrian traffic).
• Summarize and integrate the observations from both the regional and field studylocations.

GUIDELINES FOR THE LOCATION AND DESIGN OF BUS STOPS
E-2
STUDY DESIGN
The data collected for the curb-side field studies were categorized into two general areas: (1)site-specific information and (2) behavior of bus patrons and general pedestrian traffic. Table E-1shows the type of information gathered within these two broad categories.
Table E-1. Field Study Data Collected.
Pedestrian information was collected using video cameras, field notes, sketches, checklists,and still photography. The video camera was useful for recording congregation areas, pedestrianmovement information, sun/shade patterns, and seating patterns. Still photography was utilized torecord individual characteristics of a site, adaptive behavior, and pedestrian movement patterns.While using still and video photography at these sites, researchers were very careful not to influencethe behavior of individuals sensitive to having their pictures taken.
Site-specific information was recorded on checklists and by measuring each site. Field notesand sketches were useful for recording behavioral observations and physical elements found at thesite. Table E-2 describes each bus stop site studied in greater detail and which data collectionmethods were utilized. Following are discussions on the findings from the field studies.

APPENDIX E: CURB-SIDE STUDIES
E-3
Table E-2. Description of Field Study Sites.

GUIDELINES FOR THE LOCATION AND DESIGN OF BUS STOPS
E-4
APPROACH TO BUS STOP
The walk to the bus stop affects the comfort, convenience, and safety of the bus patron. Thissection documents common treatments used to enhance patron access.
Integration of Bus Stop with Streetscape and Adjacent Land Use
The best pedestrian access to bus stops are locations with sidewalks that are direct andcomprehensive in approach (see Figure E-1). The waiting area is a concrete pad and access from thecurb to the sidewalk or waiting area is concrete or another impervious material. In Phoenix, the transitagency (RPTA) coordinates bus stop installation or improvements with street reconstructionactivities. Waiting pads are defined with brick pavers, and additional space is provided at the waitingpad to install a bench or shelter depending on need. Landscaping is also installed during constructionto provide shade trees for waiting pedestrians. The Phoenix example illustrates the need to coordinatebus stop locations and improvements with other street projects. By coordinating with other streetprojects, RPTA has the opportunity to update and improve an existing bus stop or install a new busstop at developing locations. The bus stop is considered an important element of the overall"streetscape."
Figure E-1.Example of Good Pedestrian Access.

APPENDIX E: CURB-SIDE STUDIES
E-5
Sidewalk Location
In rural or developing suburban areas, sidewalks may or may not be installed along majorroadways due to continuing development in the area or lack of justification for them. Sidewalks alongthe roadways may or may not exist. Typically, the only passenger amenity at the bus stops is a transitagency sign. The bus stop sign is located on the soft shoulder or placed in the dirt, which makesreaching the stop inconvenient during inclement weather (see Figure E-2). Patrons either stand on theundeveloped right-of-way (ROW) or seek relief from the elements by standing beneath nearby trees.Depending upon familiarity with the schedule, the patron may or may not have a long wait at theseunsophisticated bus stops.
As areas become more developed, sidewalks become more commonplace. ADA compliancecan be an impetus for installing sidewalks. At some locations, a discontinuous sidewalk has beeninstalled to give bus patrons greater access to the bus stop from the intersection. The sidewalk beginsat the intersection and ends at the bus stop (see Figure E-3). Although the sidewalk may not continuetoward the next land use or along the roadway, this is the first step toward providing complete accessto the stop.
Figure E-2. Bus Stop on Soft Shoulder. Figure E-3. Discontinous Sidewalkto Bus Stop
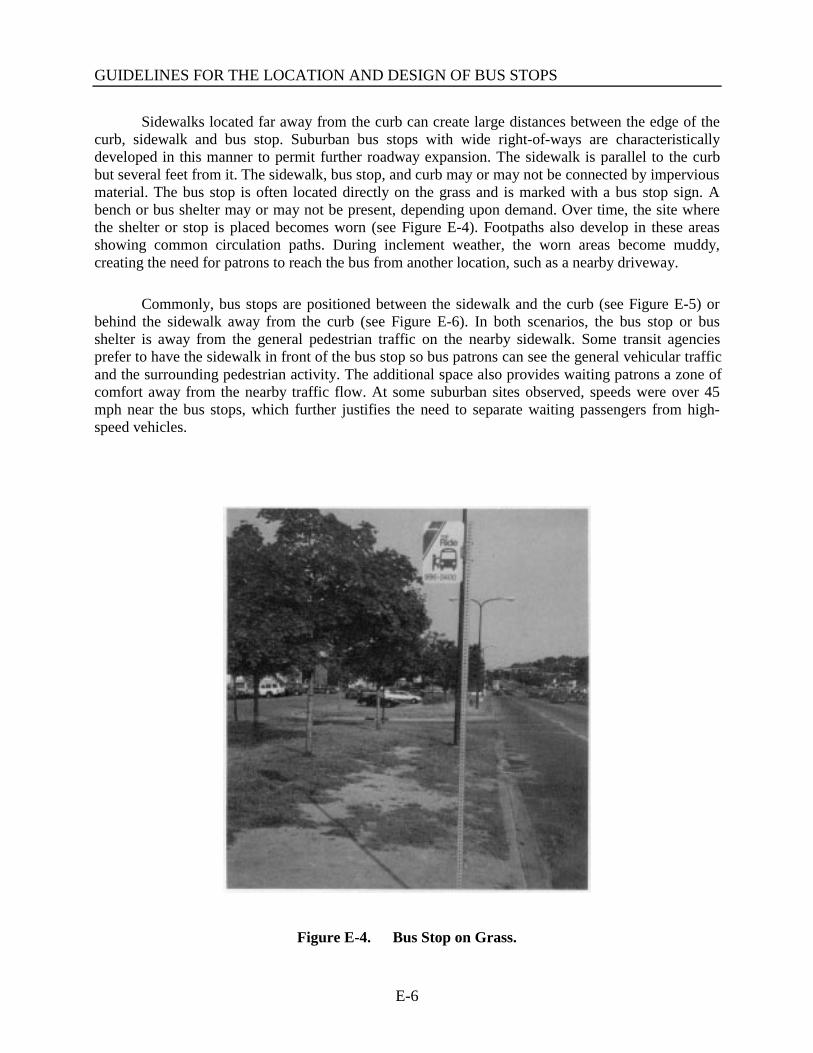
GUIDELINES FOR THE LOCATION AND DESIGN OF BUS STOPS
E-6
Sidewalks located far away from the curb can create large distances between the edge of thecurb, sidewalk and bus stop. Suburban bus stops with wide right-of-ways are characteristicallydeveloped in this manner to permit further roadway expansion. The sidewalk is parallel to the curbbut several feet from it. The sidewalk, bus stop, and curb may or may not be connected by imperviousmaterial. The bus stop is often located directly on the grass and is marked with a bus stop sign. Abench or bus shelter may or may not be present, depending upon demand. Over time, the site wherethe shelter or stop is placed becomes worn (see Figure E-4). Footpaths also develop in these areasshowing common circulation paths. During inclement weather, the worn areas become muddy,creating the need for patrons to reach the bus from another location, such as a nearby driveway.
Commonly, bus stops are positioned between the sidewalk and the curb (see Figure E-5) orbehind the sidewalk away from the curb (see Figure E-6). In both scenarios, the bus stop or busshelter is away from the general pedestrian traffic on the nearby sidewalk. Some transit agenciesprefer to have the sidewalk in front of the bus stop so bus patrons can see the general vehicular trafficand the surrounding pedestrian activity. The additional space also provides waiting patrons a zone ofcomfort away from the nearby traffic flow. At some suburban sites observed, speeds were over 45mph near the bus stops, which further justifies the need to separate waiting passengers from high-speed vehicles.
Figure E-4. Bus Stop on Grass.

APPENDIX E: CURB-SIDE STUDIES
E-7
Figure E-5. Bus Stop Positioned Between Sidewalk and Curb.
Figure E-6. Bus Stop Positioned BehindSidewalk.

GUIDELINES FOR THE LOCATION AND DESIGN OF BUS STOPS
E-8
Different bus stop configurations can also impact the relationship of the sidewalk to the busstop. For example, in Phoenix, the shelters are located at the taper of either the acceleration ordeceleration lanes of the bus bay. The shelters are parallel to the sidewalk and the taper. By anglingthe shelters in a linear area, additional room is created for the amenity. Depending upon where thebus ultimately stops, patrons may or may not have a long walk from the shelter to the vehicle whenthe shelter is sited in this manner (see Figure E-7).
Figure E-7. Examples of Angled Shelters at a Bus Bay.

APPENDIX E: CURB-SIDE STUDIES
E-9
Access Between the Curb, Bus Stop, Sidewalk, and Land Use
Indirect or inconvenient access between the land use and the bus stop can detract from theexperience of using transit by increasing walking time. Items such as walls, landscaping berms,fences, and circuitous sidewalks can limit direct access from the land use to the stop. Walls andfences are common along the perimeter of housing and apartment complexes. Smaller walls also existalong commercial developments in suburban settings. The walls are used to define and separate theedge of the parking lot from the nearby roadway and sidewalk (see Figure E-8).
Pedestrians can have direct access to and from the land use and the bus stop by providing anopening through the wall. An additional pedestrian improvement is defined or designated walkwaysthrough parking lots. Walkways can be as elaborate as a landscaped sidewalk through the parking lotor as subtle as painted walkways that warn vehicles and direct pedestrians (see Figure E-9).
Figure E-8. Wall Separating Parking Lotfrom Sidewalk.
Figure E-9. Painted Walkway.

GUIDELINES FOR THE LOCATION AND DESIGN OF BUS STOPS
E-10
Another land use interaction issue is circuitous sidewalks and landscaping berms. Theseelements are commonly associated with business parks and along suburban roadway systems. Thecircuitous sidewalks can create difficulties for transit agencies when determining the final stoplocation. The curvilinear sidewalks may not align with the final stop destination and can create accessproblems through grass and landscaping (see Figure E-10). Transit agencies will often request thatsidewalks run parallel with the curb until the sidewalk meets the stop. By doing so, patrons will havedirect access from the bus onto impervious cover when boarding and alighting the vehicle. Earlyinvolvement in the development approval process can help insure coordination between bus stopplacement and sidewalk location. As evident in these examples, the location of the sidewalk andaccess to the curb can significantly influence the comfort and convenience of patrons.
Figure E-10. Curvilinear Sidewalk at Stop.

APPENDIX E: CURB-SIDE STUDIES
E-11
ADA ACCESS
The influence of ADA access mandates was clearly visible in the field. A direct andimpervious path should be installed between the curb, sidewalk, and stop for both general bus patronsand for the physically impaired. Mobility impediments include cluttered sites that have an abundanceof vending machines, bike stalls, trash receptacles and undeveloped ROW that lack sidewalks. FigureE-11 is an example of ADA improvements observed at many sites.
Figure E-11. Sidewalks for ADA Mandates.

GUIDELINES FOR THE LOCATION AND DESIGN OF BUS STOPS
E-12
PLACEMENT WITHIN RIGHT-OF-WAY (ROW)
Available ROW can significantly influence the location and number of pedestrian amenitiesthat can be constructed at a site. Items commonly found in the ROW, such as the edge of the curb,sidewalk, landscaping, and utility poles can influence the size and positioning of a bus stop and thenumber of amenities that can be placed at the site for patrons. Different street-side stop designs, suchas bus bays, can also place additional constraints on space availability. Many of the sites observed arecompromises between needed amenities and the space available in the right-of-way.
Bus Stops Located Directly on Sidewalk
Where right-of-way is limited, bus stop shelters are sometimes placed directly on the sidewalkor overhang the sidewalk. Several examples of shelters located directly on the sidewalk or impingingon the sidewalk were observed on the regional visits (see Figure E-12). One benefit of having theshelter or stop located directly on the sidewalk is that it ensures that patrons will have a paved surfaceto await the next bus. However, locating the stop or shelter on or close to the sidewalk can affect theflow of general pedestrian traffic.
To gain a better understanding of the influence of shelter placement on pedestrian movement,video and still photography were used at the field study site in Tucson on Speedway at Campbell. Thesite has two shelters that slightly overhang the sidewalk (see Figure E-13). Pedestrians and buspatrons must share this space between the curb and the overhanging shelters.
Figure E-12. Shelter Located on theSidewalk.
Figure E-13. Shelters OverhangingSidewalk.

APPENDIX E: CURB-SIDE STUDIES
E-13
From the video and observations made at the site, a majority of pedestrians chose to walkaround the shelter into the nearby parking lot rather than share the sidewalk in front of the busshelters. Of the 189 pedestrians observed in a 12-hour period, 143 pedestrians walked around theshelters (see Figures E-14 and E-15). This behavior could be due to a number of different elementsassociated with the site:
• People may have previous experiences of walking through the site when a bus wasboarding or alighting and the area became too crowded.
• The width of the sidewalk with respect to the shelter overhang may "infringe" on thepersonal comfort zone of people causing them to choose another route.
• Ample space to walk around the shelters is available in the hotel parking lot.
A potentially hazardous situation exists when pedestrians walk behind a structure rather thanon the sidewalk in front of the shelter. The bus shelter blocks the view of pedestrians walking behindthe shelter from the traffic turning into the hotel. The proximity of the driveway to the shelter couldcreate conflicts between pedestrians and turning vehicles. Although this situation was not directlyobserved, the opportunity exists because of the large numbers of bus patrons and general pedestriantraffic using the sidewalk.
Site observations made at other locations during the regional visits reinforce this observation.Worn paths in grass and dirt suggest that general pedestrian traffic prefers to walk behind the sheltersinstead of through the shelter. Based on these observations, shelters located directly on the sidewalkshould be avoided because of their impact on general pedestrian traffic.
Figure E-14. Pedestrian Walking around Shelter.
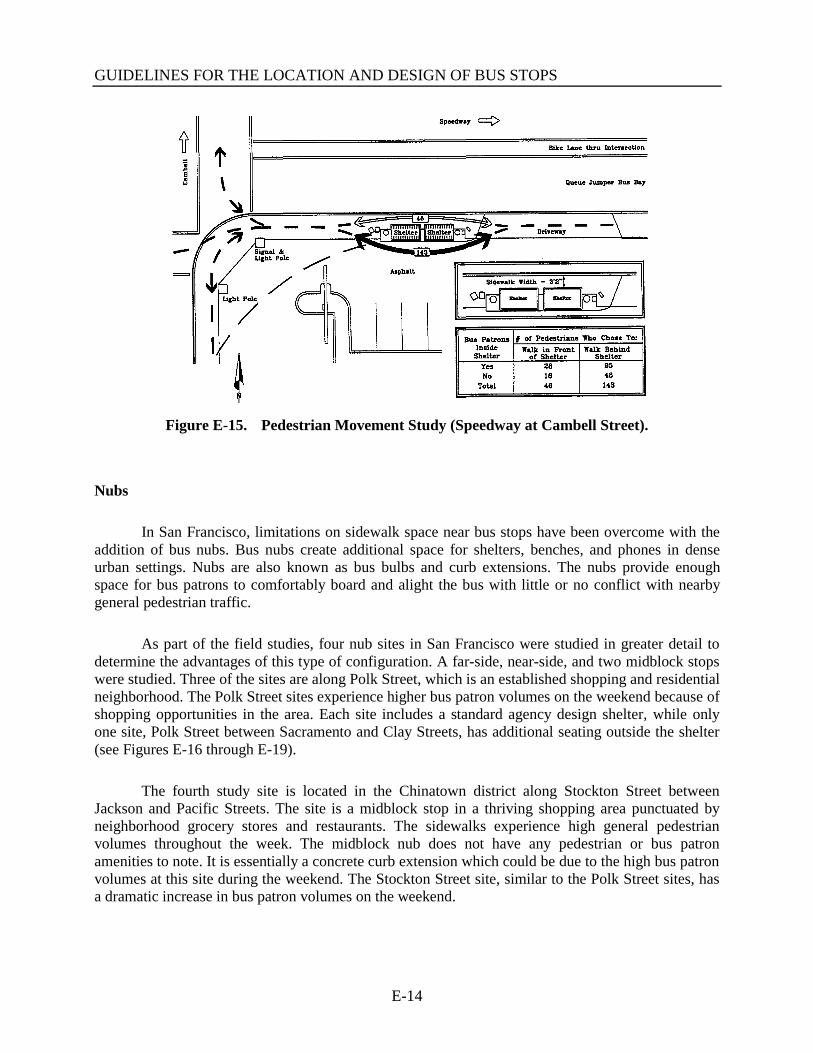
GUIDELINES FOR THE LOCATION AND DESIGN OF BUS STOPS
E-14
Figure E-15. Pedestrian Movement Study (Speedway at Cambell Street).
Nubs
In San Francisco, limitations on sidewalk space near bus stops have been overcome with theaddition of bus nubs. Bus nubs create additional space for shelters, benches, and phones in denseurban settings. Nubs are also known as bus bulbs and curb extensions. The nubs provide enoughspace for bus patrons to comfortably board and alight the bus with little or no conflict with nearbygeneral pedestrian traffic.
As part of the field studies, four nub sites in San Francisco were studied in greater detail todetermine the advantages of this type of configuration. A far-side, near-side, and two midblock stopswere studied. Three of the sites are along Polk Street, which is an established shopping and residentialneighborhood. The Polk Street sites experience higher bus patron volumes on the weekend because ofshopping opportunities in the area. Each site includes a standard agency design shelter, while onlyone site, Polk Street between Sacramento and Clay Streets, has additional seating outside the shelter(see Figures E-16 through E-19).
The fourth study site is located in the Chinatown district along Stockton Street betweenJackson and Pacific Streets. The site is a midblock stop in a thriving shopping area punctuated byneighborhood grocery stores and restaurants. The sidewalks experience high general pedestrianvolumes throughout the week. The midblock nub does not have any pedestrian or bus patronamenities to note. It is essentially a concrete curb extension which could be due to the high bus patronvolumes at this site during the weekend. The Stockton Street site, similar to the Polk Street sites, hasa dramatic increase in bus patron volumes on the weekend.
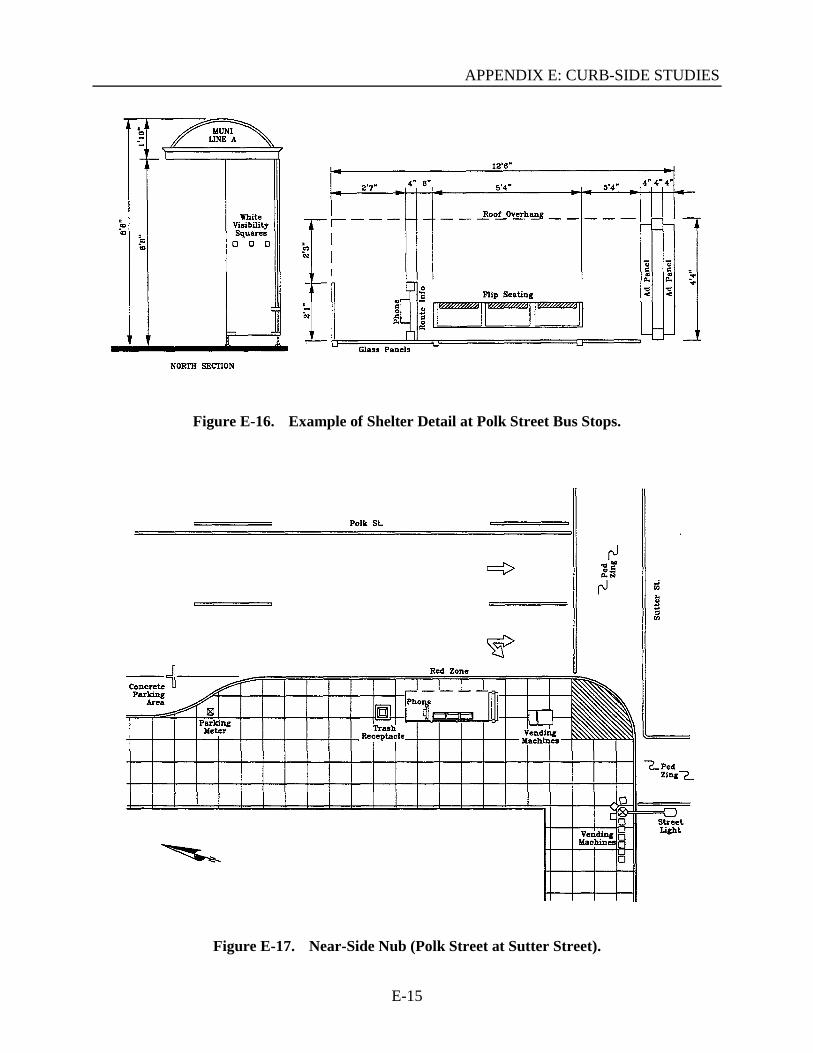
APPENDIX E: CURB-SIDE STUDIES
E-15
Figure E-16. Example of Shelter Detail at Polk Street Bus Stops.
Figure E-17. Near-Side Nub (Polk Street at Sutter Street).

GUIDELINES FOR THE LOCATION AND DESIGN OF BUS STOPS
E-16
Figure E-18. Midblock Nub (Between Sacramento and Clay Street).
Figure E-19. Far-Side Nub (Polk Street at Pine Street).

APPENDIX E: CURB-SIDE STUDIES
E-17
The following general observations were made about nubs:
• The general pedestrian and bus patron conflicts are reduced when nubs are used.• The number of amenities that can be included at a dense downtown setting can be
increased.• The amount of adaptive use of store ledges or awnings because of the separation between
the bus stop and the store fronts and the increased waiting area is reduced. Bus patrons,with the exception of the Chinatown site, were observed to be using only those amenitieslocated at the site.
• Without the additional space provided by the nub, the site and adjacent sidewalk wouldprobably reach an uncomfortable level of saturation. Figure E-20 is an example of buspatrons standing on the nub at the Stockton Street field study site away from thepedestrians using the nearby sidewalk.
• The amount of jaywalking may increase. Although no bus patrons were seen illegallycrossing the street, several pedestrians were seen taking advantage of the reduced widthbetween opposing curbs. Midblock nubs appear to have the greatest impact onencouraging jaywalking. The near-side and far-side nubs do not appear to encourage anytype of jaywalking because of the proximity to the intersection. With near-side and far-side nubs, pedestrians "shortcut" the walk through the intersection when approaching thecurb (see Figure E-21).
• The telephone provided inside the shelter was never used by people waiting for the bus.The additional pedestrian traffic caused by the telephone created minor conflicts betweenbus patrons and pedestrians, especially during bus boardings and alightings.
• From a pedestrian and bus patron point of view, nub configurations enhance the comfortand convenience of transit in dense urban settings.
Figure E-20. Bus Patrons Standing on Nub Design.
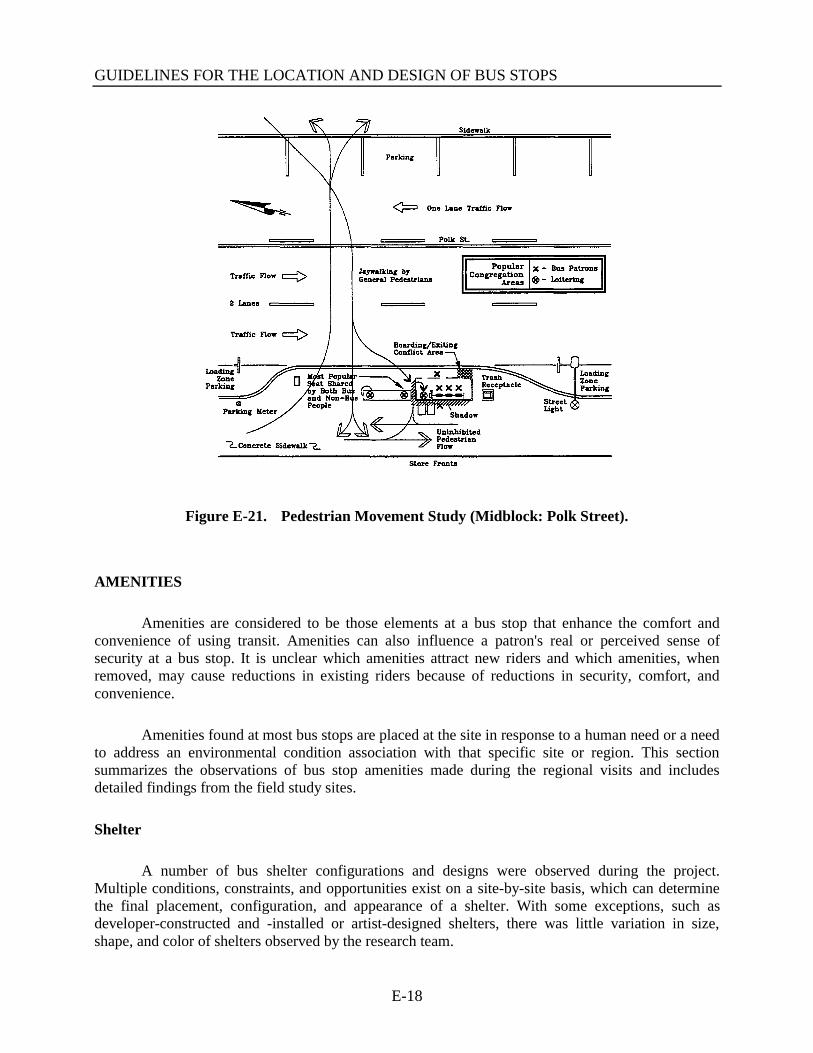
GUIDELINES FOR THE LOCATION AND DESIGN OF BUS STOPS
E-18
Figure E-21. Pedestrian Movement Study (Midblock: Polk Street).
AMENITIES
Amenities are considered to be those elements at a bus stop that enhance the comfort andconvenience of using transit. Amenities can also influence a patron's real or perceived sense ofsecurity at a bus stop. It is unclear which amenities attract new riders and which amenities, whenremoved, may cause reductions in existing riders because of reductions in security, comfort, andconvenience.
Amenities found at most bus stops are placed at the site in response to a human need or a needto address an environmental condition association with that specific site or region. This sectionsummarizes the observations of bus stop amenities made during the regional visits and includesdetailed findings from the field study sites.
Shelter
A number of bus shelter configurations and designs were observed during the project.Multiple conditions, constraints, and opportunities exist on a site-by-site basis, which can determinethe final placement, configuration, and appearance of a shelter. With some exceptions, such asdeveloper-constructed and -installed or artist-designed shelters, there was little variation in size,shape, and color of shelters observed by the research team.

APPENDIX E: CURB-SIDE STUDIES
E-19
The primary site-specific factor affecting shelter placement is available right-of-way. Invirtually every case where there was adequate right-of-way, shelters were set away from vehicletraffic and out of the flow of pedestrian traffic. Many of the shelter installations observed were visiblecompromises in response to unique site-specific conditions.
An important issue for transit agencies regarding bus shelters is maintenance and safety.Several transit agencies visited during the regional visits noted the importance of proper bus sheltermaintenance and providing safe, secure bus shelters.
Shelter Configurations
Panel placement and type is the most common treatment used to make the bus shelter ascomfortable as possible. In southern climates with mild winter temperatures and extreme summertemperatures, shelters can be designed to be completely open to air circulation from all four sides. Atsites with wind, rain, or glare problems, standardized shelters can be retrofitted with panels to provideprotection and shade. The panels can be solid pieces of glass, metal, or plastic. The panels observedin southern climates typically have openings to permit air movement through the shelter. On someoccasions, panels are properly placed to diffuse direct sunlight and glare. Figure E-22 is an exampleof a shelter in Tucson, Arizona, that uses a perforated panel to protect waiting patrons from the heatand glare of the setting sun.
Figure E-22. Bus Stop Treatment in a Southern Climate.
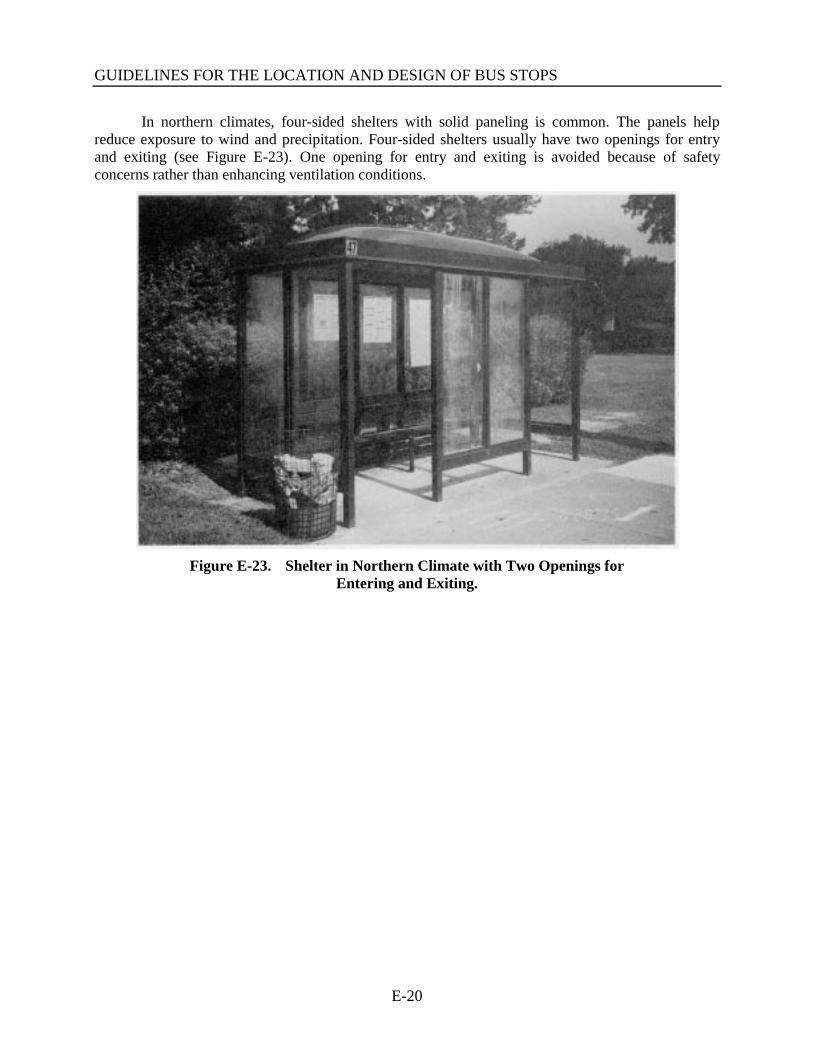
GUIDELINES FOR THE LOCATION AND DESIGN OF BUS STOPS
E-20
In northern climates, four-sided shelters with solid paneling is common. The panels helpreduce exposure to wind and precipitation. Four-sided shelters usually have two openings for entryand exiting (see Figure E-23). One opening for entry and exiting is avoided because of safetyconcerns rather than enhancing ventilation conditions.
Figure E-23. Shelter in Northern Climate with Two Openings forEntering and Exiting.

APPENDIX E: CURB-SIDE STUDIES
E-21
Orientation of Bus Shelter
An important consideration when determining the final location of a stop or shelter is theorientation of the stop or shelter with respect to the environmental conditions of a site. Properorientation of the stop or shelter can offer patrons protection from the elements. Bus stops that areimproperly placed can accentuate the negative environmental factors at a site and make transit anuncomfortable and inconvenient experience. Improper bus shelter orientation may also encouragewaiting bus patrons to seek relief at locations other than inside the bus shelter (see Figure 24).
In southern climates, shelters should be oriented to take advantage of cross ventilation or toreduce the amount of afternoon sun entering the shelter. In northern climates, shelters are typicallyoriented to block cold winter winds and to protect patrons from snow and rain. A unique featureassociated with northern climates is that some shelters are oriented with the rear of the shelter facingthe street instead of the entrance and exit facing the street. By having the rear of the shelter adjacentto the street, it protects patrons from snow that can be moved or blown by snow removal machines onthe street (see Figure E-25).
In urban areas, shade and glare can be created by adjacent buildings and materials. Attentionto the climate created by adjacent structures should be made when determining the location andorientation of a bus stop.
Figure E-24. Patrons Using Shadows Cast by Shelter as Shade.

GUIDELINES FOR THE LOCATION AND DESIGN OF BUS STOPS
E-22
Figure E-25. Example of Rotated Shelter in Northern Climate.
The climatic conditions of a bus stop site can influence the utilization of the shelter. Theshelter in Figure 26 is an example of a poorly oriented bus stop. During the morning hours, the site isin complete shade because of an adjacent building. In the afternoon hours, the site is in full sun.Patrons are generally comfortable in the morning hours because of the mild climate and shade.However, in the afternoon, the site would become quite warm and the shelter will be unused. Becausethe front of the shelter is completely exposed to the setting sun, patrons will stand behind the shelterfor shade or linger in adjacent store fronts. Re-orienting the shelter with the back toward the streetcould overcome this situation. As the example currently exists, the waiting passengers standingbehind the shelter would block the sidewalk during the afternoon hours.
Figure E-26. Morning Shade Patterns and Afternoon Sun Angles.

APPENDIX E: CURB-SIDE STUDIES
E-23
Unique Shelter Designs to Compensate for Environmental Extremes
To overcome extremes in local weather conditions, a few select sites throughout the UnitedStates have been outfitted with features to give waiting patrons climatic comfort within the shelter. Inthe Southwestern region of the United States, air temperatures can reach above 110 degreesFahrenheit on a regular basis during the summer. Asphalt and concrete increase the air temperature byseveral degrees because of the heat the materials retain and reflect. Because of the proximity of theshelter to roadways, temperatures at a bus stop can exceed the air temperature by several degrees. Theareas where bus stops are typically located can be an extremely uncomfortable microclimate. Uniquedesigns observed included a cool air mister and evaporation cooling towers.
In Tempe, Arizona, a misting system has been installed along the edges of the roof at one busstop along a major arterial (see Figure E-27). Patrons activate the system by pushing a red buttoninside the shelter. Small particles of water are then sprayed around the edges of the roof of the shelterand the interior environment is cooled. While in Tempe, the mister worked as designed.
In Phoenix and Tucson, Arizona, cooling tower technology is being tested at a few designatedtransit malls (see Figure E-28). At the top of the tower, approximately 25 feet high, water isevaporated by wind. As the air cools, it sinks to the lower portions of the shelter and exits the shelteras a cool breeze.
No special cold weather treatment were observed during the regional visits. Any type oftechnological treatment applied to bus shelters to improve environmental comfort appears to bemaintenance-intensive and costly.
Figure E-27. Bus Stop Misting System. Figure E-28. Bus Stop with CoolingTower.

GUIDELINES FOR THE LOCATION AND DESIGN OF BUS STOPS
E-24
Developer-Built Shelters
Developers will often differentiate their development from surrounding developments byusing themes, color schemes, and repetition of forms and materials. By doing so, the developer canestablish an identity that can be easily marketed. A number of outstanding examples of developer-designed shelters were observed during the regional visits. Three examples (an apartment complex inConcord, California; a residential community [Orindawoods] near Concord, California; and acommercial shopping center in Phoenix, Arizona) each coordinated the bus stop design with elementsfrom the development.
In all three examples, the developer repeated common forms, colors, and materials from thedevelopment into the design of the shelter to create unity and similarity between the shelters andelements in the development. The shelter at the apartment complex in Concord, California, is thesame form, shape, material, and color of the entry awning (see Figure E-29). In Orindawoods, theneighborhood association constructed shelters throughout the community that are similar to thedesign form of the entry sign (see Figure E-30). The landscaping in and around the shelters is alsosimilar to the plant material used around the entry sign. At the commercial shopping site in Phoenix,Arizona, the developer-constructed shelter repeats the forms of the adjacent entry sign and buildingsin the development (see Figures E-31 and E-32). The shelter is essentially a smaller scalerepresentation of the buildings in the commercial center. Aesthetically, the shelters are significantchanges from the standard prefabricated shelter.
Developer-designed shelters should be recognized for their merits in achieving aestheticcoordination with nearby land uses. This highlights the need and potential for coordinating transitwith future development. Developer-designed and -constructed shelters can be a cost-effective way ofproviding an aesthetically unique shelter at a development.
Figure E-29. Shelter in Concord. Figure E-30. Shelter in Orindawoods.

APPENDIX E: CURB-SIDE STUDIES
E-25
Figure E-31. Entry Sign at CommercialCenter.
Figure E-32. Shelter at CommercialCenter.
Artist-Designed Bus Stop Shelters
Under flexible funding provisions available from the Federal Transit Administration, fundscan be allocated for designing and installing non-traditional shelters and related amenities. Artist-designed bus stops add festivity, color, and beauty. Four bus stops in Tempe, Arizona, have beendesigned by local artists (see Figure E-33). The sites are close to the Arizona State University campusand downtown Tempe. The sites experience high volumes of bus patrons and are located at highlyvisible intersections. Each design is uniquely identifiable. In addition to creating new shelters, thelocal artists have created new benches, trash receptacles, and bike racks at each site (see Figure E-34).
The functionality of the bus stop should not be sacrificed for aesthetics. An artist-designedbus stop should adequately provide protection from the elements. In one such case, it was obviousthat the artist-designed bus shelter did not protect waiting patrons from the sun. Consequently, thepatrons looked uncomfortable at this stop.

GUIDELINES FOR THE LOCATION AND DESIGN OF BUS STOPS
E-26
Figure E-33. Artistic Bus Stops in Tempe, Arizona.
Figure E-34. Bench and Bike Rack Created by Local Artists in Tempe, Arizona.

APPENDIX E: CURB-SIDE STUDIES
E-27
Advertising Bus Shelters.
Advertising bus shelters are bus shelters installed by advertising companies in exchange forthe right to place advertising panels on the bus shelter. For more information regarding advertisingbus shelter design and placement, please refer to Chapter 4 of the Guidelines.
Advertising Kiosks. An alternative to advertising panels placed directly on bus shelters isadvertising kiosks in close proximity to the shelter. Advertising kiosks were observed in Phoenix,Arizona, at some stops in downtown. The form, color, and material are similar to the adjacent shelter(see Figure E-35). An advantage of kiosks is that the advertising is located elsewhere, which permitsgreater surveillance of the shelter interior. The kiosks also create additional shade during the morningand evening hours (see Figure E-36). In Phoenix, the advertising kiosks are located downstream ofthe traffic flow to permit full view of the bus stop from passing traffic and bus drivers (see Figure E-37).
Figure 35. Advertising Kiosks. Figure 36. Using Shade Created byKiosks.

GUIDELINES FOR THE LOCATION AND DESIGN OF BUS STOPS
E-28
Figure E-37. Example of Locating Advertising Kiosk Downstream of Bus Stop.
Seating/Benches
As part of the field studies, benches were studied to determine what items (e.g. placement,crowding, and comfort) might impact their utilization. Benches at bus stops can be a stand-aloneamenity inside a bus shelter or additional seating outside a bus shelter. The following paragraphs area review of the observations and findings from the field studies of benches.
Interior Seating. Interior seating is standard among many manufactured shelter designs. Theseats or benches are typically linear and are parallel and adjacent with the rear of the shelter. In someinstances, the bench did not extend along the entire length of the shelter. The additional space mayaccommodate standing patrons inside the bus shelter or passengers in wheelchairs (see Figure E-38).
In some instances, multiple benches are used inside a bus shelter to accommodate largenumbers of waiting bus patrons. Based on observations, when benches are staggered, patrons movedeasily through the shelter (see Figure E-39). The bus stopped directly in front of the shelter and the"walk through" space helped relieve any potential congestion in front of the shelter. Other sheltershave variations of the two-bench configuration. Depending on placement of the benches, movementthrough the shelter was either simple or challenging.

APPENDIX E: CURB-SIDE STUDIES
E-29
Figure E-38. Bus Shelter Section With Bench That Does Not ExtendAlong the Entire Length.
Figure E-39. Offset Linear Seating in Phoenix.

GUIDELINES FOR THE LOCATION AND DESIGN OF BUS STOPS
E-30
Other unique seating configurations exist in San Francisco where the bus shelters areequipped with three chairs that pivot on a common rod. The chairs are somewhat uncomfortable andawkward to use. According to local transit agencies, the chairs are designed to discourage unintendeduse of the bus shelters after operating hours. A benefit of the pivoting chairs is that additionalstanding space is created inside the bus shelter when the chairs are unused (see Figure E-40).
One factor that can greatly influence utilization of interior benches is crowding at the site.Crowding can limit the amount of available choices to sit or wait and creates situations where patronsmust wait elsewhere than in intended areas in and around the shelter. Discouraging all amenities thatmay encourage non-bus riders to loiter in and around a bus stop can assist in preventing overcrowdingat a bus stop.
Figure E-40. Pivoting Chairs in San Francisco.

APPENDIX E: CURB-SIDE STUDIES
E-31
As noted in the sections on bus shelter configurations and orientation, interior bus sheltercomfort can influence how the shelters are used by bus patrons. Despite the availability of seatingwithin the shelter, patrons will seek relief elsewhere if the climate of the bus shelter is harsh (seeFigure E-41). A detailed evaluation of seating patterns with respect to sun/shade patterns wasconducted at the Speedway at Campbell site in Tucson, Arizona. Figure E-42 details theses findings.As previously believed, the preferred seats are those in the shade and those seats in the sun were leftlargely unused throughout the day.
Figure E-41. Seating Patterns at Speedway at Campbell.

GUIDELINES FOR THE LOCATION AND DESIGN OF BUS STOPS
E-32
Figure E-42. Seating Pattern Study (Speedway at Campbell).

APPENDIX E: CURB-SIDE STUDIES
E-33
Exterior Seating with Shelter. Additional seating outside a shelter is necessary at sites withlarge passenger volumes or to accommodate increased demand during peak periods. Typically, theadditional seating is placed to either side of the shelter and may vary in length, depending upon spaceavailability, demand, or system policy. Crowding, environmental conditions, and claims to personalspace affect utilization of benches and surrounding features.
Three study sites (San Francisco, San Jose, and Phoenix) yielded interesting informationconcerning exterior bench utilization. In San Francisco, the exterior bench is only 9 inches from theshelter, but is a comfortable 4.5 feet from the curb. The distance between the shelter and the bench istoo small for most patrons to move through. However, the placement of the bench with respect to thecurb allows for unobstructed movement between the bench and the curb (this is especially importantwhen a bus is boarding and alighting) and the space provides patrons with an acceptable zone ofcomfort from the nearby traffic.
The bus stop in San Jose, California, has two shelters and four additional benches. The closestbench is only 4 feet away from a shelter. The other three benches are more than 30 feet away from theshelter (see Figure E-43). Each bench is 4 feet away from the curb and approximately 9.5 feet awayfrom the edge of the building, providing a large area for general pedestrian traffic between the stopand the building. The additional sidewalk space is useful during peak periods of the day to limitpedestrian congestion in and around the bus stop. Similar to the San Francisco bus stop, the 4 feet ofspace between the benches and the curb provides a much-needed circulation space when the buses areboarding and alighting at this bus stop. Observations at this site are illustrated on Figure E-43.
The downtown Phoenix, Arizona, field study site reinforced previous observations about theinfluence of crowding and environment on bench utilization (see Figure E-44). The site has a largeshelter with two interior benches. An advertising kiosk is downstream of the shelter and two exteriorbenches are upstream of the shelter. The sidewalk is landscaped with several shade trees. Thelandscaping is utilized well at this bus stop. The additional shade provided by the trees served asinformal waiting areas for bus patrons when the shelter or exterior benches were exposed to the sun.
From the field study sites, observations include:
• The distance between the shelter and the exterior bench needs to be large enough topermit unobstructed movement.
• Minimal conflict between general pedestrian traffic and bus patrons waiting on the benchoccurs at nub sites because the bench and the bus shelter are separated from the sidewalk.
• Crowding and environmental extremes encourage patrons to seek cover other than thebus stop.
• Rarely will people sit next to each other during non-congested periods. People wouldrather lean against the wall of a nearby building or sit on a ledge.
• The exterior benches are more popular than the seating inside a shelter (see Figure E-45).People may feel safer waiting on an exterior bench than on benches in a semienclosedspace (bus shelter), when weather permits.

GUIDELINES FOR THE LOCATION AND DESIGN OF BUS STOPS
E-34
Figure E-43. Pedestrian Observations (San Jose).
Figure E-44. Pedestrian Observations (Phoenix).

APPENDIX E: CURB-SIDE STUDIES
E-35
Figure E-45. Exterior Bench Close to Shelter.
Each of these factors can be addressed with proper site evaluation by the transit agency. Onefactor that the transit agency has little control over, though, is the patron's zone of public domain orpersonal space. When patrons place objects to separate or claim space on the bench, other patronsmay be forced to stand or look elsewhere for seating. The need to produce or protect individual spacemay be a result of perceptions of security.
Bench-Only Sites. Benches are a means of providing a convenient and comfortable amenityat bus stops that do not warrant a bus shelter. A bench and a sign post can be the sole amenitiesprovided at a stop that has few riders or infrequent service. During the regional visits, a number ofbenches were observed in various conditions and locations.
The location of a bus stop bench can influence a bus patron's comfort and convenience.Figures E-46 and E-47 show two different examples of bench placement. In northern climates, snowcan create significant access problems for bus stops with benches. Snow plowed from the adjacentstreet can be pushed onto the bench or onto the space between the sidewalk and the bench, creatinghazardous conditions for patrons. Because of liability problems, transit agencies sometimes do notclear foot paths for patrons at bench-only sites. Bus drivers, out of courtesy, will typically board andalight the vehicle at cleared driveways to avoid having patrons walk through slush or snow.

GUIDELINES FOR THE LOCATION AND DESIGN OF BUS STOPS
E-36
Figure E-46. Benches Close to Sidewalk. Figure E-47. Bench Near Street.
In Phoenix, Arizona, benches for bus patrons are coordinated with streetscaping projects thatare currently taking place on many arterial streets. Benches are automatically installed at sites thathave less than 10 feet of right-of-way on a 40-foot-by-10-foot brick-paver waiting pad. At aminimum, a 4-foot-wide sidewalk is installed to either side of the waiting pad, which is contiguouswith the street. Furthermore, the benches are placed on the backside of the waiting pad and arecoordinated with landscaping to provide shade for waiting passengers (see Figures E-48 and E-49).
Figure E-48. Bus Stop Coordinated with Streetscaping Project.

APPENDIX E: CURB-SIDE STUDIES
E-37
Figure E-49. Example of Integrating Bus Stop with Sidewalk and Landscaping.
Advertising Benches. Another element of benches is the prevalence of privately providedbenches with advertising (see Figure E-50). This has allowed more benches to be provided than mightotherwise be the case. Advertisers are primarily concerned with drive-by visibility, rather than transitridership. In situations where good coordination exists between the private bench providers and thetransit agency, this does not appear to be a problem. While in other situations, transit agencies noted aloss of control and influence. Finally, some agencies have decided not to allow advertising benches atall.
Figure E-50. Example of Advertising.

GUIDELINES FOR THE LOCATION AND DESIGN OF BUS STOPS
E-38
Lighting
Lighting is an important amenity at bus stops, in particular during the winter when daylight islimited. Lighting significantly influences the passenger's perception of safety and security at a busstop. Lighting at a bus stop can provide a waiting passenger comfort because of the increasedsurveillance afforded by the light. It can also discourage loitering or unintended uses of transitfacilities by non-bus riders.
Only a few of the transit agencies visited maintained lighting within a shelter or at a bus stop.For some transit agencies, service ceases at dusk or shortly afterwards. Therefore, interior lighting isconsidered an unnecessary expenditure. The transit agencies, though, did acknowledge the need forinterior lighting when daylight-savings time is in effect since passengers may arrive and return in thedark. Cost, availability of power, and vandalism usually influence the decision to install lighting at asite.
Direct lighting is expensive and can be difficult to achieve with limited access to a powersource. In San Francisco, interior bus shelter lighting is provided at most urban stops. Figure E-51details the design and location of the lighting elements in the San Francisco bus shelters. In Tucson,Arizona, SunTran has installed lighting at some sheltered stops using solar power (see Figure E-52).The energy collected from the sun during the day is stored in power cells and is used after sunset. Allnew shelters in Phoenix, Arizona, will be equipped with lighting powered by solar panel electricity.
Figure E-51. Location of Interior Lighting.

APPENDIX E: CURB-SIDE STUDIES
E-39
Figure E-52. Lighted Shelter Using Solar Power.
An option that is being implemented by some transit agencies is to include installation oflighting as a part of the agreement with advertising shelter companies. This is viewed as acosteffective approach to providing lighting at sites that would otherwise be uneconomical for thetransit agency to install. The advertising company maintains the lighting as well.
A cost-effective approach to providing indirect lighting is coordinating stops with existingstreet lights. Among the transit agencies visited, coordinating the bus stop locations with a street lightis a system policy when interior lighting cannot be provided. It is an inexpensive method of achievinglighting at a bus stop. A majority of shelters and stops observed during the regional visits werelocated within 30 feet of an existing street light.
Vending Machines
Some transit agencies encourage the installation of vending machines (primarily newspaper)at or near their stops, typically on the grounds that they are convenient for the passengers. Othersactively discourage such installations on the grounds that they clutter the area and contribute to thetrash problem (see Figure E-53).

GUIDELINES FOR THE LOCATION AND DESIGN OF BUS STOPS
E-40
Figure E-53. Vending Machines at Stop.
Trash Receptacles
Trash receptacles are common at bus stops, especially at stops with benches or shelters. Thedecision whether to install trash receptacles or not seems to be a general policy matter, though not avery high-profile one. Experience with trash receptacles is varied. Some find wide public acceptanceand appreciation with limited vandalism or abuse. Others find maintenance difficult and expensive,abuse and clutter high, and public acceptance correspondingly poor. This is especially evident at sitesnear convenience stores, fast food restaurants, or gas stations. General pedestrian traffic generated bythe convenience stores also uses receptacles that are conveniently located along sidewalks near busstops. Companies installing advertising shelters or benches, though, offer a solution to this problem.As part of the agreement to install shelters or benches at a site, the company must maintain and cleanthe sites regularly, thereby relieving the transit agency of this duty.
Trash receptacle designs may be artistic (see Figure E-54) but should be functional. Buspatrons are concerned with the appearance, placement, and smell of the receptacle. Trash receptaclesthat are overflowing and in full sun are unpleasant in a number of ways. The negative impacts ofuncontained trash can be unintentionally enhanced with some receptacle designs. For example, trashreceptacles with ledges create spaces for liquids to remain, rather than be contained inside the trashreceptacle or drain away. Designs that allow the contents of the container to be exposed also attractinsects, which can be hazardous to some bus patrons. In Arizona, some of the trash receptacles arepartially installed below grade; whether it is to reduce exposure to sun or permanently affix thereceptacle to the site is unclear.

APPENDIX E: CURB-SIDE STUDIES
E-41
Figure E-54. Trash Receptacle Designs.
Phones
Phones at bus stops, like trash receptacles, are a result of a systemwide policy, rather thanrandom placement. Some transit agencies have explicit policies regarding the installation of phones—such as that phones offer patrons the potential convenience of receiving real-time bus arrivalinformation (if available) and quick access to emergency services and allow patrons to make personalcalls (see Figure E-55). Conversely, some agencies strongly feel phones at bus stops createopportunities for illegal or unintended activities.
Figure E-55. Exterior Phone at Bus Stop.

GUIDELINES FOR THE LOCATION AND DESIGN OF BUS STOPS
E-42
In San Francisco, phones are included at several bus stops because of a city ordinancerestricting the amount of phones on a per block basis. At the Polk Street study sites in San Francisco,phones are installed in each shelter (see Figure E-56). The phones added to the number of people atthe bus stops, which increased congestion levels during boardings and alightings.
Figure E-56. Interior Phone at Bus Stop.