The Community Foundation Atlas Jenny Hodgson and Barry Knight.
1
Tawonga Community Atlas 2013
ABS 2011 Census Data: State Suburbs
2
The Alpine Community Atlas series is a project of the Alpine Shire Council. These documents have been produced as a reference for Alpine Shire Council councillors, staff, residents, businesses and organisations operating in Alpine Shire. The Atlas series provides sound, verified information for use in making evidence-based decisions. Disclaimer Alpine Shire Council, its employees, agents, consultants and representatives do not accept any responsibility whatsoever, including responsibility for negligence, physical damage, personal injury, economic loss, costs or expenses of any kind, or any other loss or damage suffered or incurred by anyone as a direct or indirect consequence of errors in or omissions from this document, or related action or inaction taken in reliance upon the contents of the document. Copyright The information contained herein is subject to copyright and is the property of the Alpine Shire Council, and/or the identified contributors engaged by the Alpine Shire Council. Apart from fair dealing for the purposes of private study, research, criticism or review as permitted under copyright legislation, no part of this document may be reproduced, published or adapted in whole or in part for any commercial purpose whatsoever.
3
`
Tawonga Community Atlas
Index
1 Index…………………………………………………………………………………...3
Index ................................................................................................................. 3 1 Glossary of Terms ........................................................................................... 5
2 Executive Summary ....................................................................................... 6
2.1 What is the Community Atlas? .................................................................... 6 2.2 Purpose of the Community Atlas ................................................................. 7
2.3 The 2013 Tawonga Community Atlas ......................................................... 7 3 Tawonga Profile ............................................................................................... 8
3.1 Overview ..................................................................................................... 8 3.2 Tawonga: A snapshot 2006 and 2011 ........................................................ 9
3.3 What unique points does the 2011 ABS Census data identify?................. 10 Census data for Tawonga, Alpine Shire and Victoria………………………11
3.4 People: demographics ............................................................................... 12 3.5 People: age groups ................................................................................... 13
3.6 People: education ...................................................................................... 14 3.7 People: main occupations ......................................................................... 16
3.8 Families: family composition ...................................................................... 18 3.9 Families: weekly income............................................................................ 18
3.10 Families: employment status of couple families ...................................... 18 3.11 People: cultural and language diversity ................................................... 20
3.12 People: employment ................................................................................ 20 3.13 People: weekly income ............................................................................ 20
3.14 People: travel to work, top responses ..................................................... 21 3.15 People: unpaid work ................................................................................ 21
3.16 People: Aboriginal and Torres Strait Islander people .............................. 21 3.17 Dwellings: tenure ..................................................................................... 22
3.18 Dwellings: structure ................................................................................. 24 3.19 Dwellings: household composition & income ........................................... 24 3.20 Dwellings: mortgage and rent .................................................................. 24
3.21 Dwellings: number of motor vehicles ....................................................... 25 4 Primary Health Data ....................................................................................... 26
5 Community Indicators: What are Community Indicators and why are they important? ......................................................................................................... 27
6 What are the findings from the latest available data? ................................ 28 7 Healthy Safe and Inclusive Communities – Personal Health and Well-being .................................................................................................................. 30
Self-Reported Health ....................................................................................... 30
Subjective Well-being ...................................................................................... 30 8 Healthy Safe and Inclusive Communities – Community Connectedness . 31
Feeling Part of the Community ........................................................................ 31 Social Support ................................................................................................. 31
Volunteering .................................................................................................... 31
4
9 Healthy Safe and Inclusive Communities – Early Childhood ..................... 32
Child Health Assessments............................................................................... 32 10 Healthy Safe and Inclusive Communities – Personal and Community Safety ................................................................................................................. 33
Perceptions of Safety ...................................................................................... 33 Crime ............................................................................................................... 33
11 Healthy Safe and Inclusive Communities – Lifelong Learning ................ 34
School leavers ................................................................................................. 34 12 Dynamic Resilient Local Economies .......................................................... 35
Highly Skilled workforce .................................................................................. 35
Employment Rate ............................................................................................ 35 Income ............................................................................................................ 35
Food Security .................................................................................................. 35 Educational Qualifications ............................................................................... 36
Adequate Work-Life Balance ........................................................................... 36 13 Sustainable Built and Natural Environments ............................................ 37
Housing Affordability ....................................................................................... 37 Transport Limitations ....................................................................................... 37
Waste Water Recycling ................................................................................... 37 Household Waste Recycling............................................................................ 37
14 Culturally Rich and Vibrant Communities ................................................. 39
Participation in Arts and Cultural Activities ...................................................... 39 15 Environment and Climate ............................................................................ 40 16 Measures of Advantage and Disadvantage – SEIFA ................................. 42
SEIFA: Alpine Shire……………………………………………………………44 SEIFA: Alpine Shire Suburbs Decile Scores………………………………..45 SEIFA: IER and IRSD…………………………………………………………46 SEIFA: IRSAD and IEO…………………………………………………….…47
5
1 Glossary of Terms
ABS Australian Bureau of Statistics ASC Alpine Shire Council ASGS Australian Statistical Geography Standard AUWBI Australian Unity Well-being Index CBI Community Building Initiative CFA Country Fire Authority CHPCP Central Hume Primary Care Partnership CIV Community Indicators Victoria DEECD Department of Education & Early Childhood Development DHS Department of Human Services DPCD Department of Planning and Community Development DSE Department of Sustainability & Environment NECMA North East Catchment Management Authority NETCP North East Transport Connections Project NEVDGP North East Victoria Division of General Practice RDV Regional Development Victoria SEIFA Social and Economic Indices for Areas SSC State Suburb (ABS) SRV Sport and Recreation Victoria TAC Transport Accident Commission TAFE Technical & Further Education
6
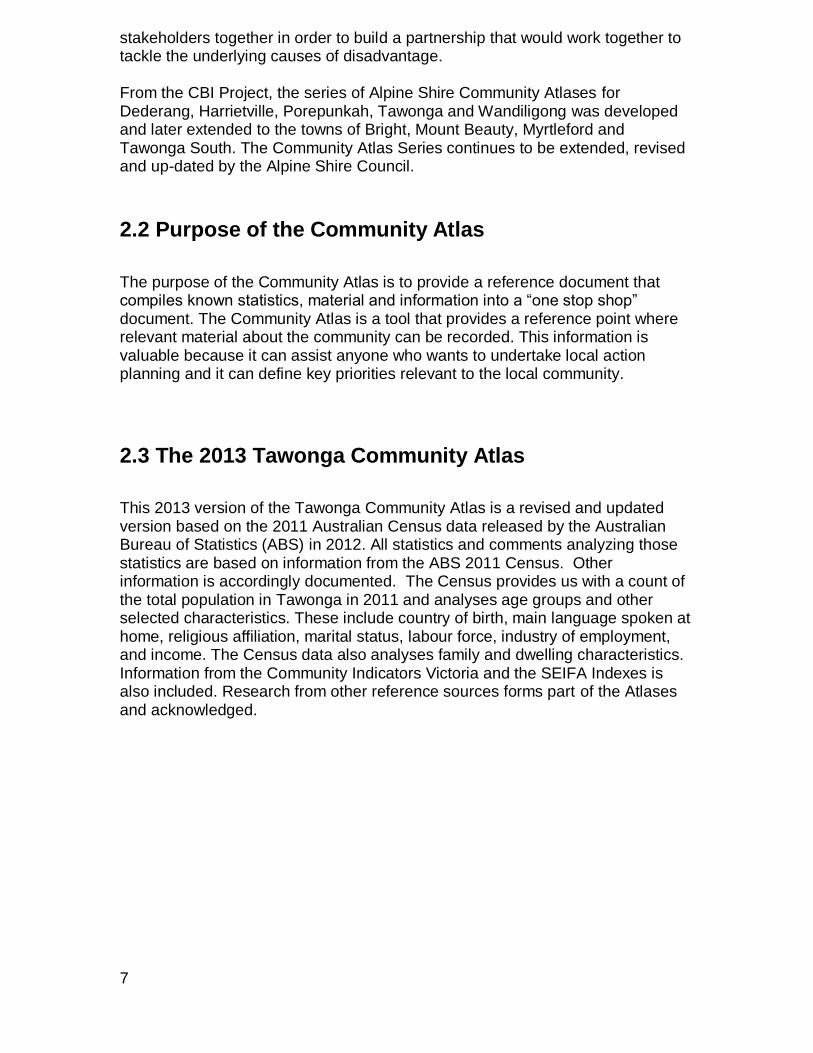
2 Executive Summary
2.1 What is the Community Atlas?
Background Information: In March 2006, the Department for Victorian Communities (DVC) announced the approval of a two year grant to the Alpine Shire for the establishment of a Community Building Initiative (CBI) Project. Community Building was a commitment announced in the State Government‟s policy A Fairer Victoria. The CBI aimed to bring residents, businesses, government and local organizations together to help transform their community into a place of opportunity and activity. Shareholders were invited to contribute to decisions about how best to achieve the aims of:
Ongoing community participation in locally relevant decision making
New job and learning opportunities
Increased neighbourhood volunteering and other support
Upgraded community facilities and open spaces
Greater participation in cultural, recreational and sporting activities
Improved feelings of safety and well-being. The CBI Project was established as a partnership to assist local communities and the Alpine Shire Council (ASC) respond to the strategic drivers nominated in A Fairer Victoria. The townships that participated in the project were Dederang, Harrietville, Porepunkah, Tawonga, and Wandiligong.1 The goal of the CBI project was “to strengthen small Victorian communities and help them take charge of their future. It is a chance to explore new ways to address disadvantage, encourage participation and create opportunities for everyone in the community.”2 The key objectives of the CBI were to:
Build skills and knowledge
Involve diverse groups and individuals
Build relationships in and across the community and organisations
Plan for the future
Build on local strengths and assets
Grow local economies and enhance employment opportunities
Identify opportunities for new and improved community infrastructure. The Community Building Initiative was a “place-based” approach to the alleviation of concerns, disadvantage or gaps in capacity. The CBI program developed local governance structures and other processes to bring different
1 Bogong Alpine Village had been nominated as pending participation in the CBI project until such time as the town‟s
future governance administration model was determined by stakeholders. 2 CBI Governance Model. Alpine Shire Council.
7
stakeholders together in order to build a partnership that would work together to tackle the underlying causes of disadvantage. From the CBI Project, the series of Alpine Shire Community Atlases for Dederang, Harrietville, Porepunkah, Tawonga and Wandiligong was developed and later extended to the towns of Bright, Mount Beauty, Myrtleford and Tawonga South. The Community Atlas Series continues to be extended, revised and up-dated by the Alpine Shire Council.
2.2 Purpose of the Community Atlas
The purpose of the Community Atlas is to provide a reference document that compiles known statistics, material and information into a “one stop shop” document. The Community Atlas is a tool that provides a reference point where relevant material about the community can be recorded. This information is valuable because it can assist anyone who wants to undertake local action planning and it can define key priorities relevant to the local community.
2.3 The 2013 Tawonga Community Atlas
This 2013 version of the Tawonga Community Atlas is a revised and updated version based on the 2011 Australian Census data released by the Australian Bureau of Statistics (ABS) in 2012. All statistics and comments analyzing those statistics are based on information from the ABS 2011 Census. Other information is accordingly documented. The Census provides us with a count of the total population in Tawonga in 2011 and analyses age groups and other selected characteristics. These include country of birth, main language spoken at home, religious affiliation, marital status, labour force, industry of employment, and income. The Census data also analyses family and dwelling characteristics. Information from the Community Indicators Victoria and the SEIFA Indexes is also included. Research from other reference sources forms part of the Atlases and acknowledged.
8
3 Tawonga Profile
3.1 Overview
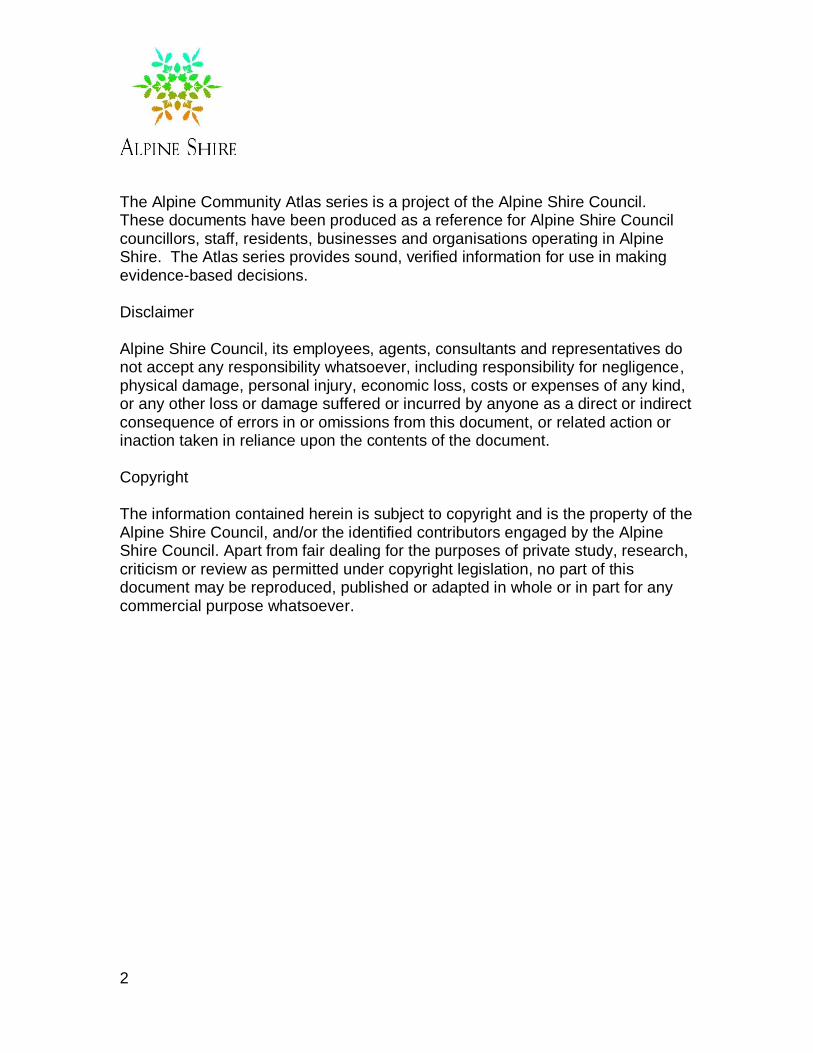
Tawonga is nestled in the Kiewa Valley and is situated 350km north east of the state capital Melbourne. Tawonga is part of the Alpine Shire and is 76km south of Wodonga and 12km north of Mount Beauty. At the ABS 2011 Census the population of Tawonga was 558. Town Services include:
Tawonga Primary School,
General Store/ Post Office
Garage
St Aiden‟s Anglican Church
Caravan Park
Recreational Facilities
CFA Station The town offers spectacular views of the Kiewa Valley with Mount Bogong being a prominent landmark. Local residents understand that the Aboriginal meaning for Tawonga is „flight through the air‟ and that the town is the oldest settlement in the upper end of the valley, dating back to the 1850‟s. Many of the older buildings have either been removed or significantly adapted, with the old Tawonga Store and butcher shop buildings remaining. The Tawonga Store still operates and caters for the many needs of the community with the Post Office, café, lending library and general supplies. The original and historic boarding house has been restored. Overall the town functions as an outlying residential area to Mount Beauty but over time, it has developed a very different town character within the semi-rural setting.3
3 Tawonga Small Town Masterplan Framework, Jan 2007
9
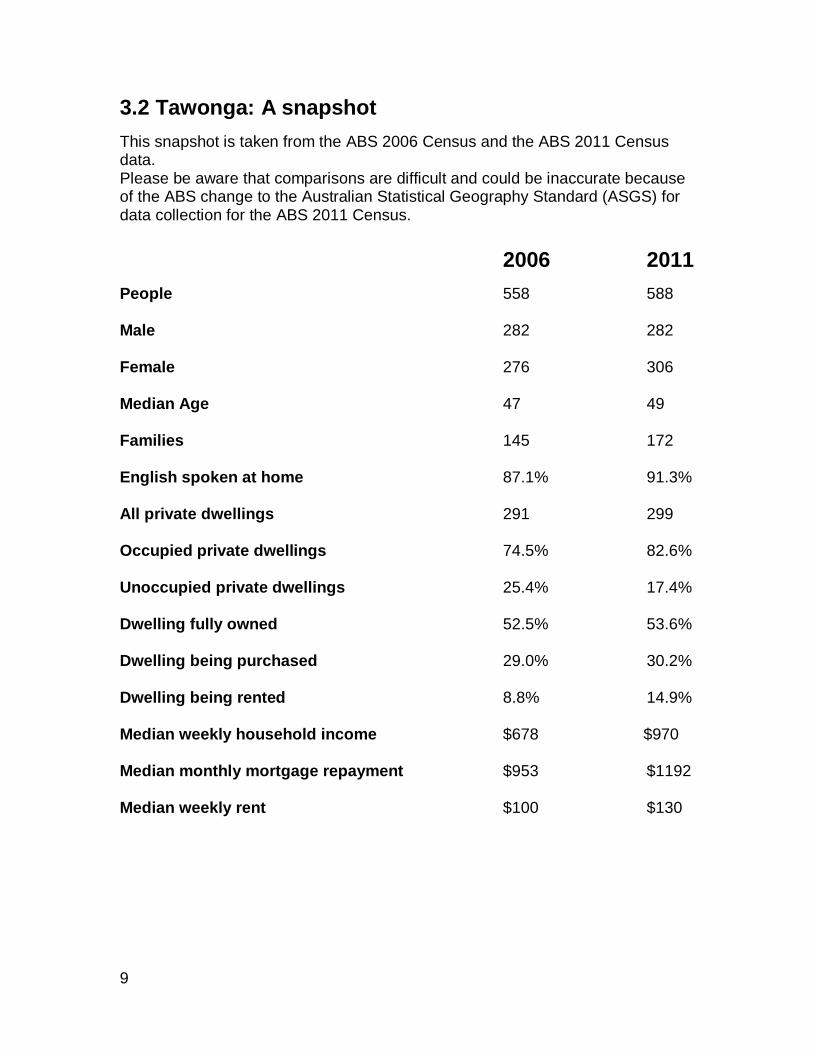
3.2 Tawonga: A snapshot
This snapshot is taken from the ABS 2006 Census and the ABS 2011 Census data. Please be aware that comparisons are difficult and could be inaccurate because of the ABS change to the Australian Statistical Geography Standard (ASGS) for data collection for the ABS 2011 Census.
2006 2011
People 558 588
Male 282 282
Female 276 306
Median Age 47 49
Families 145 172
English spoken at home 87.1% 91.3%
All private dwellings 291 299
Occupied private dwellings 74.5% 82.6%
Unoccupied private dwellings 25.4% 17.4%
Dwelling fully owned 52.5% 53.6%
Dwelling being purchased 29.0% 30.2%
Dwelling being rented 8.8% 14.9%
Median weekly household income $678 $970
Median monthly mortgage repayment $953 $1192
Median weekly rent $100 $130
10
3.3 What unique points does the 2011 ABS Census data
identify?
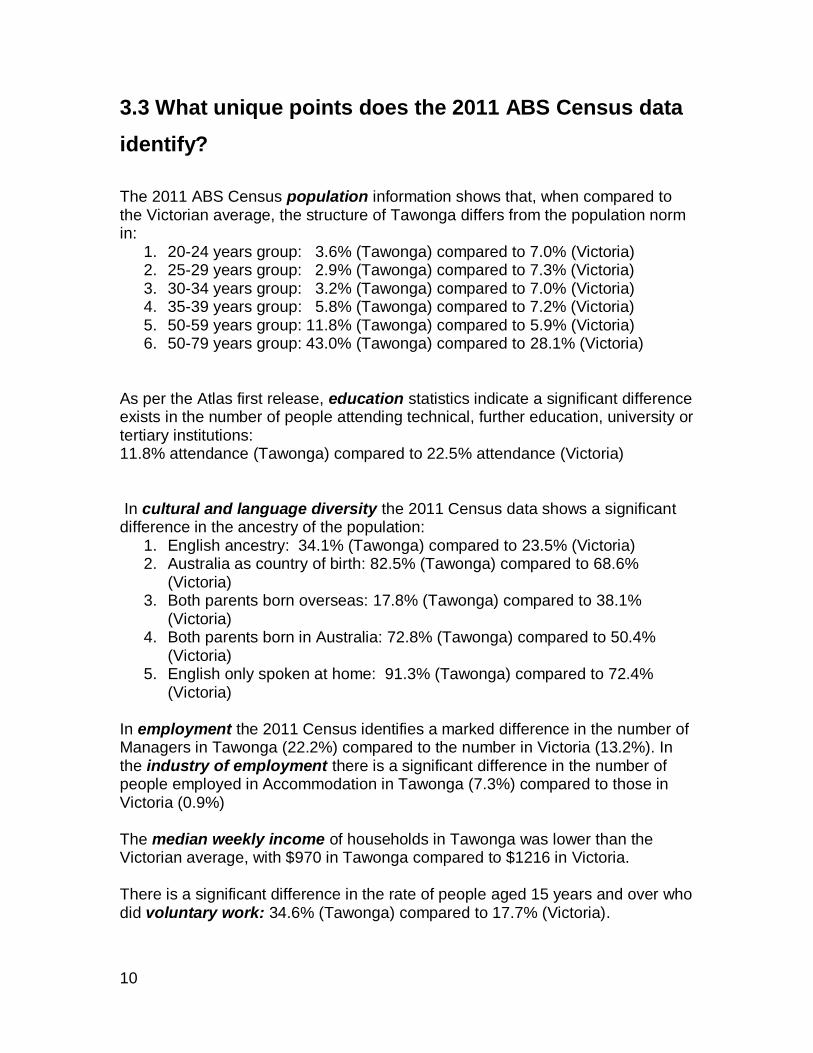
The 2011 ABS Census population information shows that, when compared to the Victorian average, the structure of Tawonga differs from the population norm in:
1. 20-24 years group: 3.6% (Tawonga) compared to 7.0% (Victoria) 2. 25-29 years group: 2.9% (Tawonga) compared to 7.3% (Victoria) 3. 30-34 years group: 3.2% (Tawonga) compared to 7.0% (Victoria) 4. 35-39 years group: 5.8% (Tawonga) compared to 7.2% (Victoria) 5. 50-59 years group: 11.8% (Tawonga) compared to 5.9% (Victoria) 6. 50-79 years group: 43.0% (Tawonga) compared to 28.1% (Victoria)
As per the Atlas first release, education statistics indicate a significant difference exists in the number of people attending technical, further education, university or tertiary institutions: 11.8% attendance (Tawonga) compared to 22.5% attendance (Victoria) In cultural and language diversity the 2011 Census data shows a significant difference in the ancestry of the population:
1. English ancestry: 34.1% (Tawonga) compared to 23.5% (Victoria) 2. Australia as country of birth: 82.5% (Tawonga) compared to 68.6%
(Victoria) 3. Both parents born overseas: 17.8% (Tawonga) compared to 38.1%
(Victoria) 4. Both parents born in Australia: 72.8% (Tawonga) compared to 50.4%
(Victoria) 5. English only spoken at home: 91.3% (Tawonga) compared to 72.4%
(Victoria)
In employment the 2011 Census identifies a marked difference in the number of Managers in Tawonga (22.2%) compared to the number in Victoria (13.2%). In the industry of employment there is a significant difference in the number of people employed in Accommodation in Tawonga (7.3%) compared to those in Victoria (0.9%) The median weekly income of households in Tawonga was lower than the Victorian average, with $970 in Tawonga compared to $1216 in Victoria. There is a significant difference in the rate of people aged 15 years and over who did voluntary work: 34.6% (Tawonga) compared to 17.7% (Victoria).
11
0.0%
10.0%
20.0%
30.0%
40.0%
50.0%
60.0%
70.0%
80.0%
90.0%
100.0%
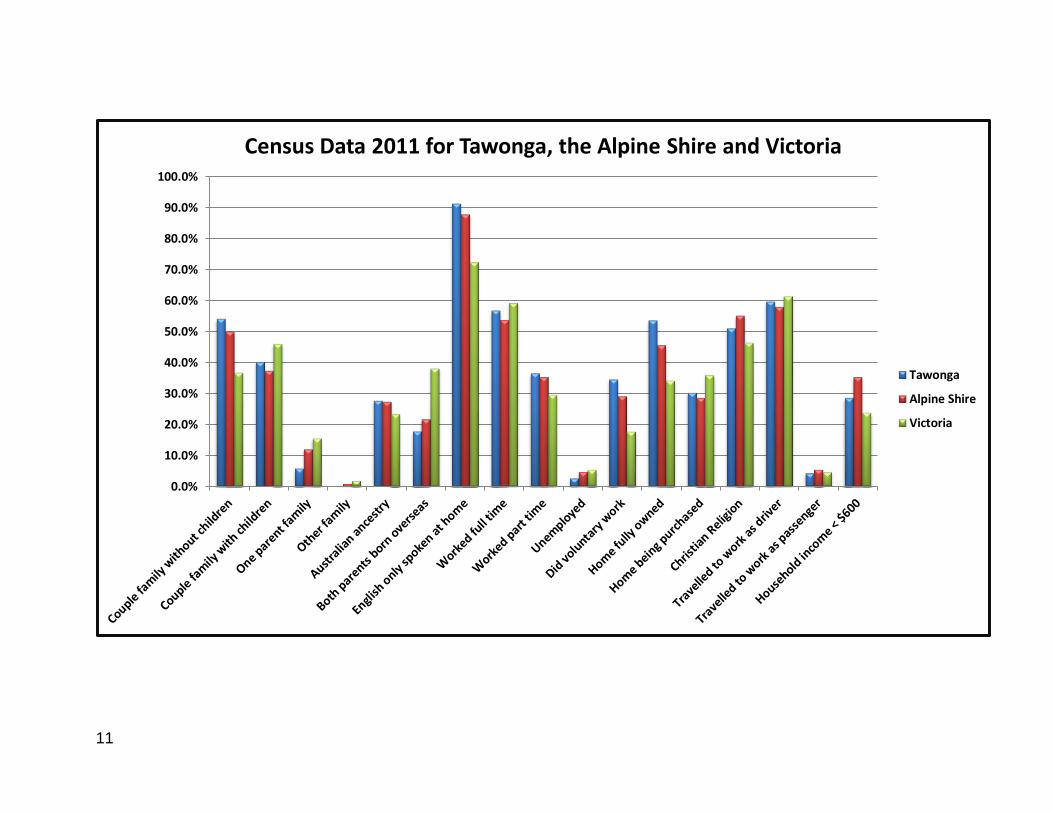
Census Data 2011 for Tawonga, the Alpine Shire and Victoria
Tawonga
Alpine Shire
Victoria
12
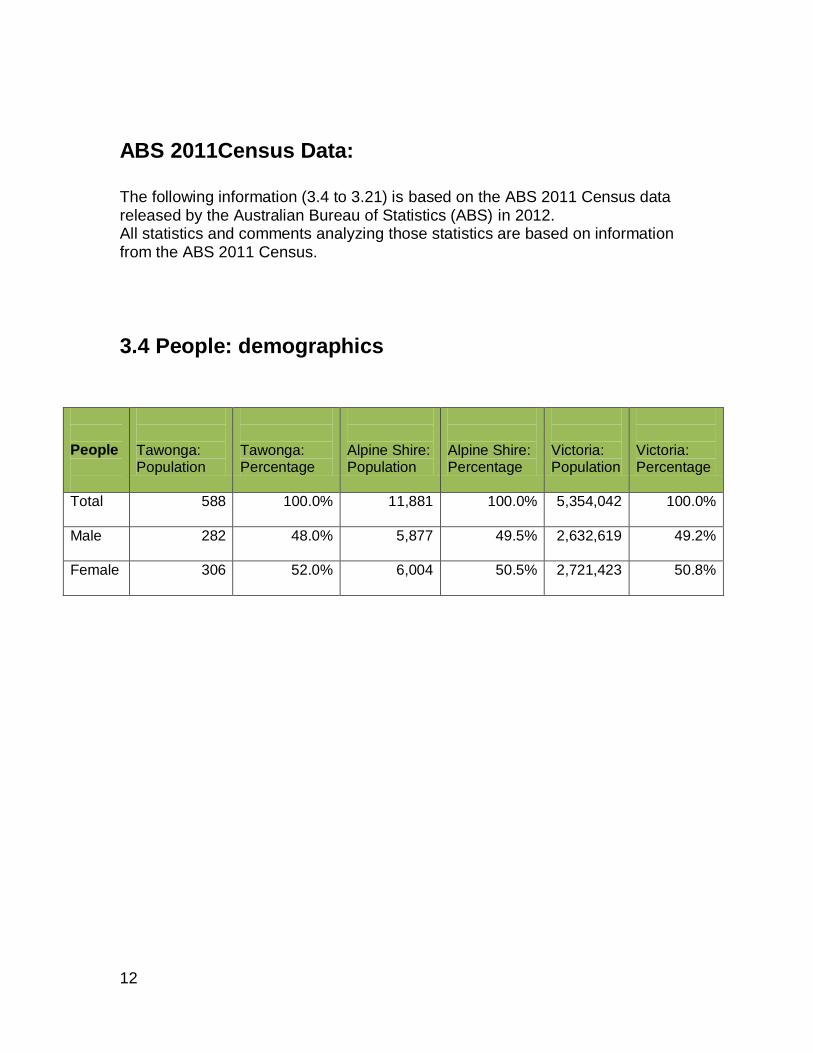
ABS 2011Census Data: The following information (3.4 to 3.21) is based on the ABS 2011 Census data released by the Australian Bureau of Statistics (ABS) in 2012. All statistics and comments analyzing those statistics are based on information from the ABS 2011 Census.
3.4 People: demographics
People
Tawonga: Population
Tawonga: Percentage
Alpine Shire: Population
Alpine Shire: Percentage
Victoria: Population
Victoria: Percentage
Total 588 100.0%
11,881 100.0% 5,354,042 100.0%
Male
282 48.0% 5,877 49.5% 2,632,619 49.2%
Female
306 52.0% 6,004 50.5% 2,721,423 50.8%
13
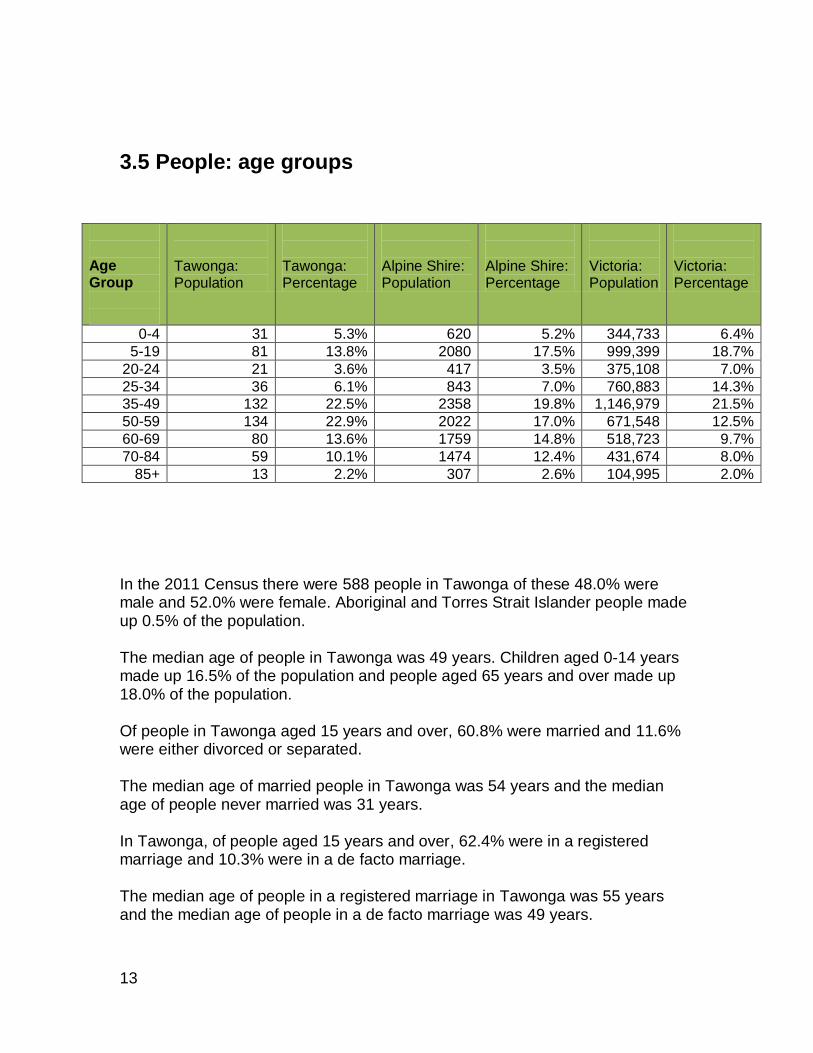
3.5 People: age groups
Age Group
Tawonga: Population
Tawonga: Percentage
Alpine Shire: Population
Alpine Shire: Percentage
Victoria: Population
Victoria: Percentage
0-4 31 5.3% 620 5.2% 344,733 6.4%
5-19 81 13.8% 2080 17.5% 999,399 18.7%
20-24 21 3.6% 417 3.5% 375,108 7.0%
25-34 36 6.1% 843 7.0% 760,883 14.3%
35-49 132 22.5% 2358 19.8% 1,146,979 21.5%
50-59 134 22.9% 2022 17.0% 671,548 12.5%
60-69 80 13.6% 1759 14.8% 518,723 9.7%
70-84 59 10.1% 1474 12.4% 431,674 8.0%
85+ 13 2.2% 307 2.6% 104,995 2.0%
In the 2011 Census there were 588 people in Tawonga of these 48.0% were male and 52.0% were female. Aboriginal and Torres Strait Islander people made up 0.5% of the population. The median age of people in Tawonga was 49 years. Children aged 0-14 years made up 16.5% of the population and people aged 65 years and over made up 18.0% of the population. Of people in Tawonga aged 15 years and over, 60.8% were married and 11.6% were either divorced or separated. The median age of married people in Tawonga was 54 years and the median age of people never married was 31 years. In Tawonga, of people aged 15 years and over, 62.4% were in a registered marriage and 10.3% were in a de facto marriage. The median age of people in a registered marriage in Tawonga was 55 years and the median age of people in a de facto marriage was 49 years.
14
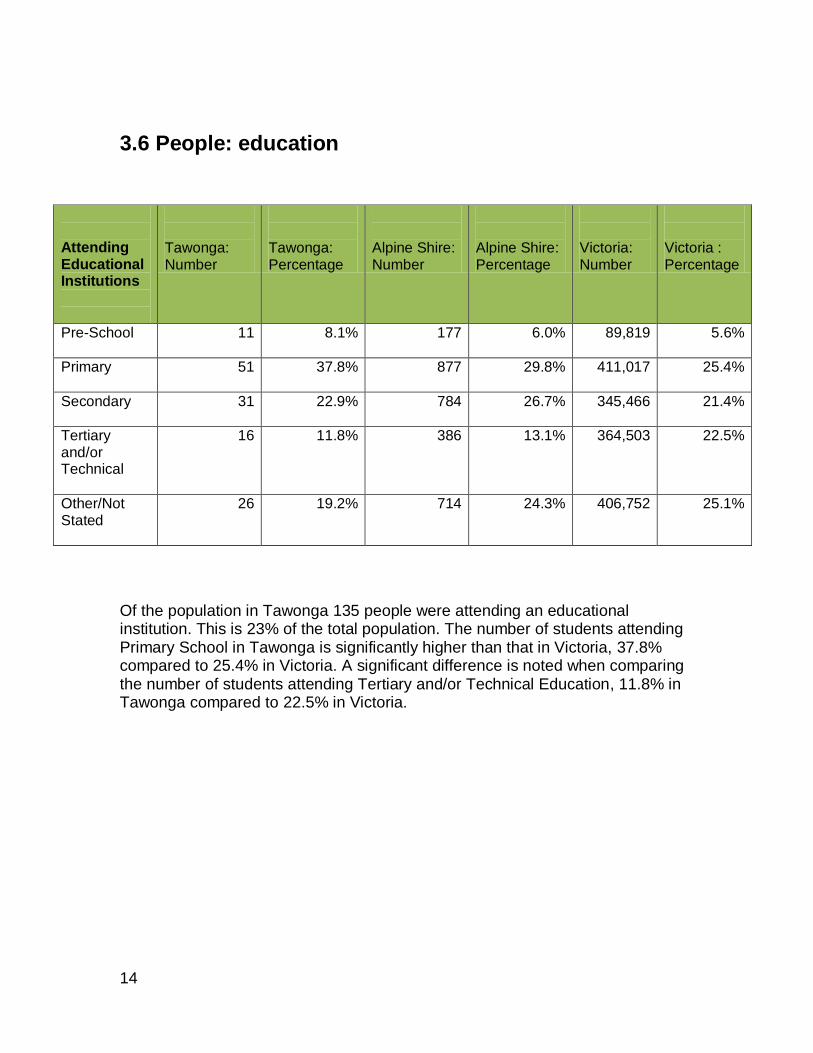
3.6 People: education
Attending Educational Institutions
Tawonga: Number
Tawonga: Percentage
Alpine Shire: Number
Alpine Shire: Percentage
Victoria: Number
Victoria : Percentage
Pre-School
11 8.1% 177 6.0% 89,819 5.6%
Primary
51 37.8% 877 29.8% 411,017 25.4%
Secondary
31 22.9% 784 26.7% 345,466 21.4%
Tertiary and/or Technical
16 11.8% 386 13.1% 364,503 22.5%
Other/Not Stated
26 19.2% 714 24.3% 406,752 25.1%
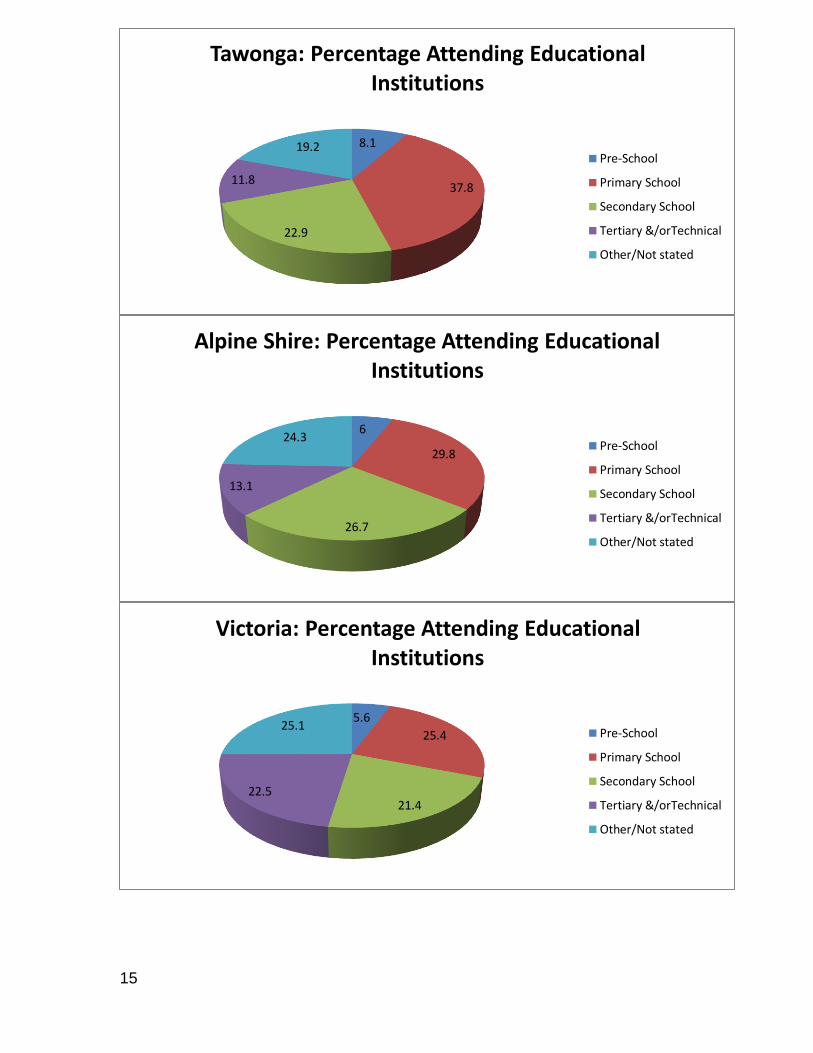
Of the population in Tawonga 135 people were attending an educational institution. This is 23% of the total population. The number of students attending Primary School in Tawonga is significantly higher than that in Victoria, 37.8% compared to 25.4% in Victoria. A significant difference is noted when comparing the number of students attending Tertiary and/or Technical Education, 11.8% in Tawonga compared to 22.5% in Victoria.
15
8.1
37.8
22.9
11.8
19.2
Tawonga: Percentage Attending Educational Institutions
Pre-School
Primary School
Secondary School
Tertiary &/orTechnical
Other/Not stated
6
29.8
26.7
13.1
24.3
Alpine Shire: Percentage Attending Educational Institutions
Pre-School
Primary School
Secondary School
Tertiary &/orTechnical
Other/Not stated
5.6
25.4
21.4 22.5
25.1
Victoria: Percentage Attending Educational Institutions
Pre-School
Primary School
Secondary School
Tertiary &/orTechnical
Other/Not stated

16
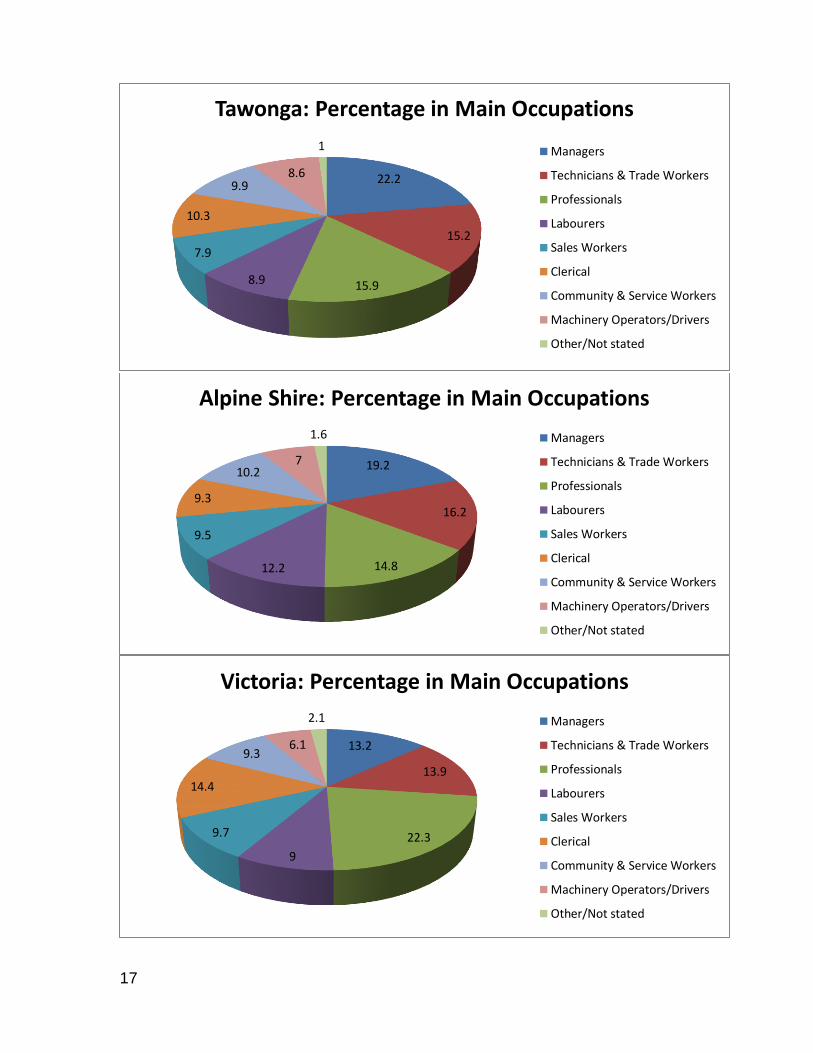
3.7 People: main occupations
Occupation
Tawonga: Number
Tawonga: Percentage
Alpine Shire: Numbers
Alpine Shire: Percentage
Victoria: Number
Victoria Percentage
Managers
67 22.2% 1,026 19.2% 332,929 13.2%
Professionals
48 15.9% 790 14.8% 564,781 22.3%
Technicians and Trade Workers
46 15.2% 865 16.2% 350,758 13.9%
Clerical and Administrative Workers
31 10.3% 499 9.3% 364,498 14.4%
Community and Personal Service Workers
30 9.9% 545 10.2% 234,381 9.3%
Labourers
27 8.9% 652 12.2% 227,185 9.0%
Machinery Operators and Drivers
26 8.6% 374 7.0% 154,543 6.1%
Sales Workers
24 7.9% 507 9.5% 254,334 9.7%
Other/ Not stated
1.0% 1.6% 2.1%
Of the employed people in Tawonga, 7.3% worked in Accommodation. Other major industries of employment included Hospitals 7.3%, School Education 6.6%, Sheep, Beef Cattle and Grain Farming 5.0% and On Selling Electricity and Electricity Market Operation 3.0%.
17
22.2
15.2
15.9 8.9
7.9
10.3
9.9 8.6
1
Tawonga: Percentage in Main Occupations
Managers
Technicians & Trade Workers
Professionals
Labourers
Sales Workers
Clerical
Community & Service Workers
Machinery Operators/Drivers
Other/Not stated
19.2
16.2
14.8 12.2
9.5
9.3
10.2 7
1.6
Alpine Shire: Percentage in Main Occupations
Managers
Technicians & Trade Workers
Professionals
Labourers
Sales Workers
Clerical
Community & Service Workers
Machinery Operators/Drivers
Other/Not stated
13.2
13.9
22.3
9
9.7
14.4
9.3 6.1
2.1
Victoria: Percentage in Main Occupations
Managers
Technicians & Trade Workers
Professionals
Labourers
Sales Workers
Clerical
Community & Service Workers
Machinery Operators/Drivers
Other/Not stated
18
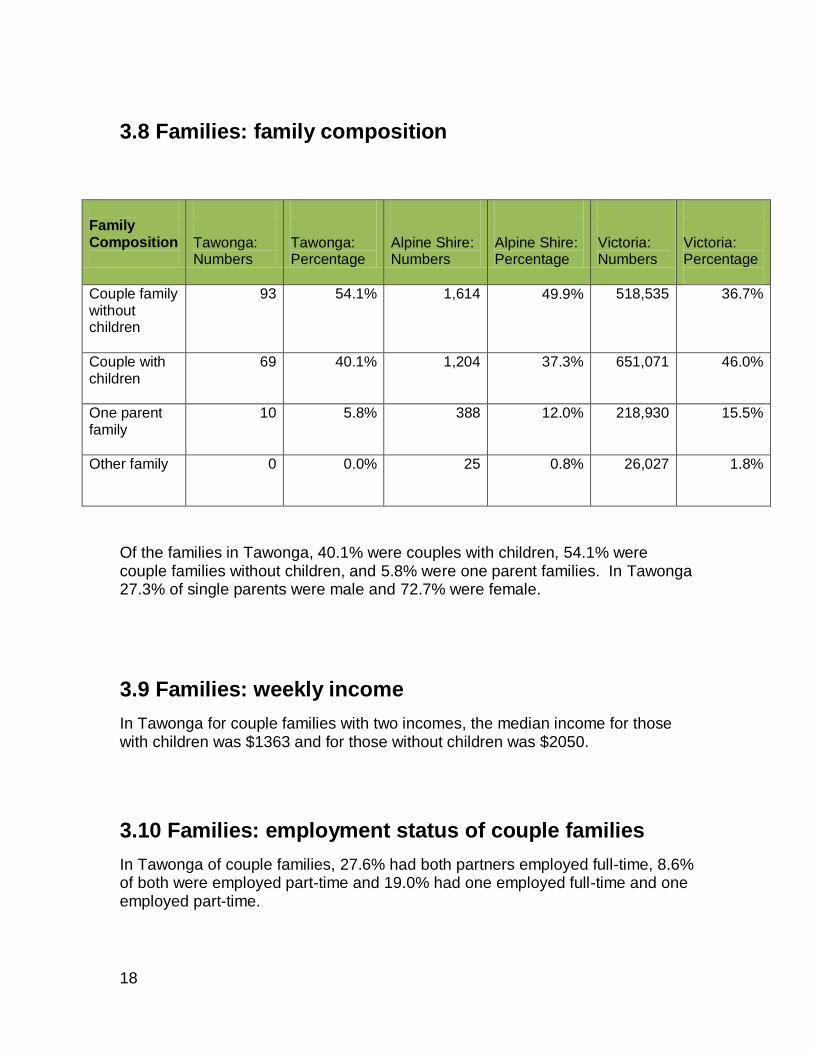
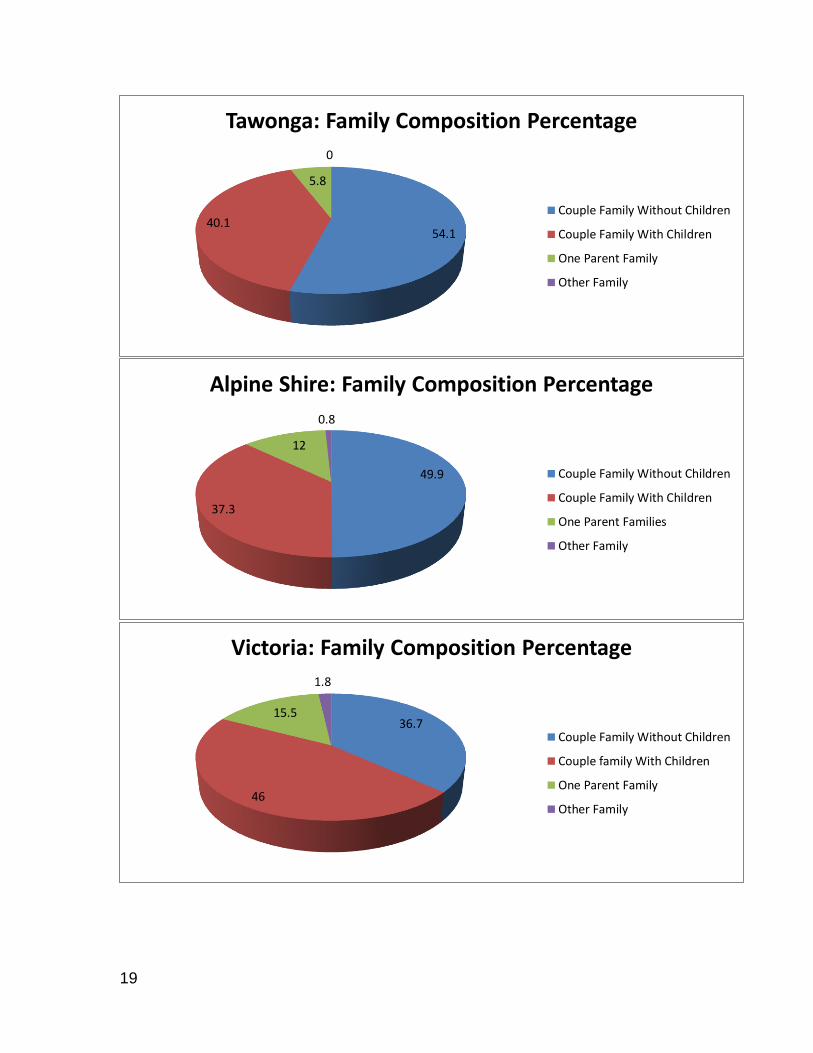
3.8 Families: family composition
Family Composition
Tawonga: Numbers
Tawonga: Percentage
Alpine Shire: Numbers
Alpine Shire: Percentage
Victoria: Numbers
Victoria: Percentage
Couple family without children
93 54.1% 1,614 49.9% 518,535 36.7%
Couple with children
69 40.1% 1,204 37.3% 651,071 46.0%
One parent family
10 5.8% 388 12.0% 218,930 15.5%
Other family
0 0.0% 25 0.8% 26,027 1.8%
Of the families in Tawonga, 40.1% were couples with children, 54.1% were couple families without children, and 5.8% were one parent families. In Tawonga 27.3% of single parents were male and 72.7% were female.
3.9 Families: weekly income
In Tawonga for couple families with two incomes, the median income for those with children was $1363 and for those without children was $2050.
3.10 Families: employment status of couple families
In Tawonga of couple families, 27.6% had both partners employed full-time, 8.6% of both were employed part-time and 19.0% had one employed full-time and one employed part-time.
19
54.1 40.1
5.8
0
Tawonga: Family Composition Percentage
Couple Family Without Children
Couple Family With Children
One Parent Family
Other Family
49.9
37.3
12
0.8
Alpine Shire: Family Composition Percentage
Couple Family Without Children
Couple Family With Children
One Parent Families
Other Family
36.7
46
15.5
1.8
Victoria: Family Composition Percentage
Couple Family Without Children
Couple family With Children
One Parent Family
Other Family
20
3.11 People: cultural and language diversity
The most common ancestries in Tawonga were English 34.1%, Australian 27.7%, Scottish 8.9%, Irish 8.9% and German 3.7%. In Tawonga 82.5% of people were born in Australia; that is, 484 people out of the total population of 588. The other most common countries of birth were England 4.1%, Italy 1.2%, Scotland 1.2%, New Zealand 0.9% and Croatia 0.7%. In Tawonga 72.8% of people had both parents born in Australia and 17.8% of people had both parents born overseas. The most common responses for religion in Tawonga were No Religion 30.1%, Catholic 21.8%, Anglican 17.0%, Uniting Church 8.7% and Pentecostal 3.6% In Tawonga 91.3% of people only spoke English at home. Other languages spoken at home included Italian 1.7%, German 0.7%, Afrikaans 0.5%, Serbian 0.5% and Slovak 0.5%.
3.12 People: employment
There were 310 people employed in the work force, of these 56.8% were employed full time, 36.5% were employed part-time and 2.6% were unemployed. 4.2% worked away from home. Of employed people in Tawonga 15.8% worked 1 to 15 hours, 11.2% worked 16 to 24 hours and 44.1% worked 40 hours or more. The median age of people employed full-time in Tawonga was 52 years and for people who worked part-time was 46 years.
3.13 People: weekly income
The median weekly personal income for people aged 15 years and over in Tawonga was $494. The median family income was $1267 and the median household income was $970.
21
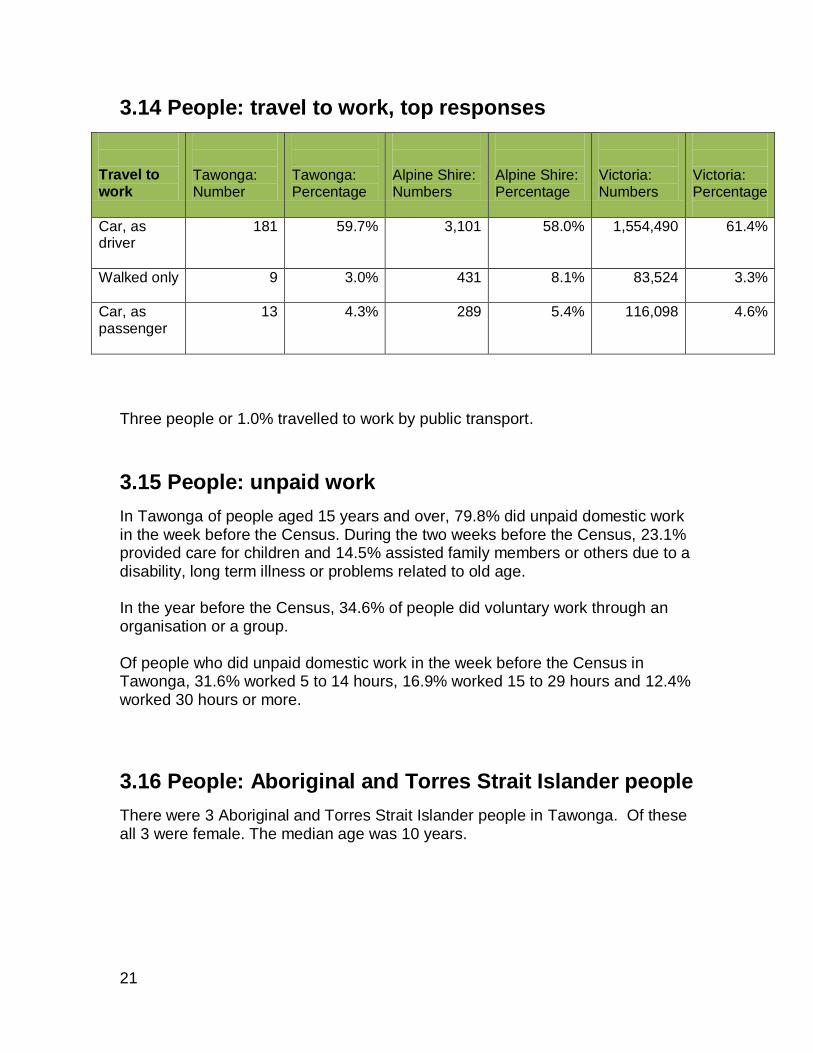
3.14 People: travel to work, top responses
Travel to work
Tawonga: Number
Tawonga: Percentage
Alpine Shire: Numbers
Alpine Shire: Percentage
Victoria: Numbers
Victoria: Percentage
Car, as driver
181 59.7% 3,101 58.0% 1,554,490 61.4%
Walked only
9 3.0% 431 8.1% 83,524 3.3%
Car, as passenger
13 4.3% 289 5.4% 116,098 4.6%
Three people or 1.0% travelled to work by public transport.
3.15 People: unpaid work
In Tawonga of people aged 15 years and over, 79.8% did unpaid domestic work in the week before the Census. During the two weeks before the Census, 23.1% provided care for children and 14.5% assisted family members or others due to a disability, long term illness or problems related to old age. In the year before the Census, 34.6% of people did voluntary work through an organisation or a group. Of people who did unpaid domestic work in the week before the Census in Tawonga, 31.6% worked 5 to 14 hours, 16.9% worked 15 to 29 hours and 12.4% worked 30 hours or more.
3.16 People: Aboriginal and Torres Strait Islander people
There were 3 Aboriginal and Torres Strait Islander people in Tawonga. Of these all 3 were female. The median age was 10 years.
22
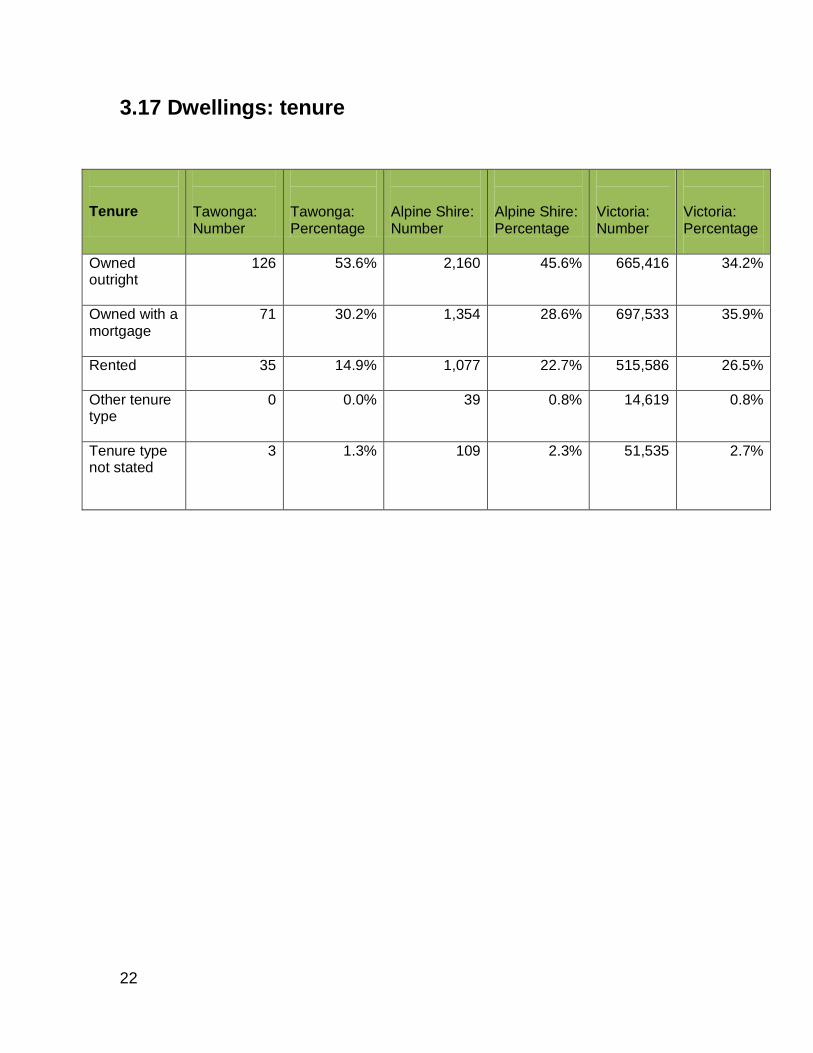
3.17 Dwellings: tenure
Tenure
Tawonga: Number
Tawonga: Percentage
Alpine Shire: Number
Alpine Shire: Percentage
Victoria: Number
Victoria: Percentage
Owned outright
126 53.6% 2,160 45.6% 665,416 34.2%
Owned with a mortgage
71 30.2% 1,354 28.6% 697,533 35.9%
Rented
35 14.9% 1,077 22.7% 515,586 26.5%
Other tenure type
0 0.0% 39 0.8% 14,619 0.8%
Tenure type not stated
3 1.3% 109 2.3% 51,535 2.7%
23
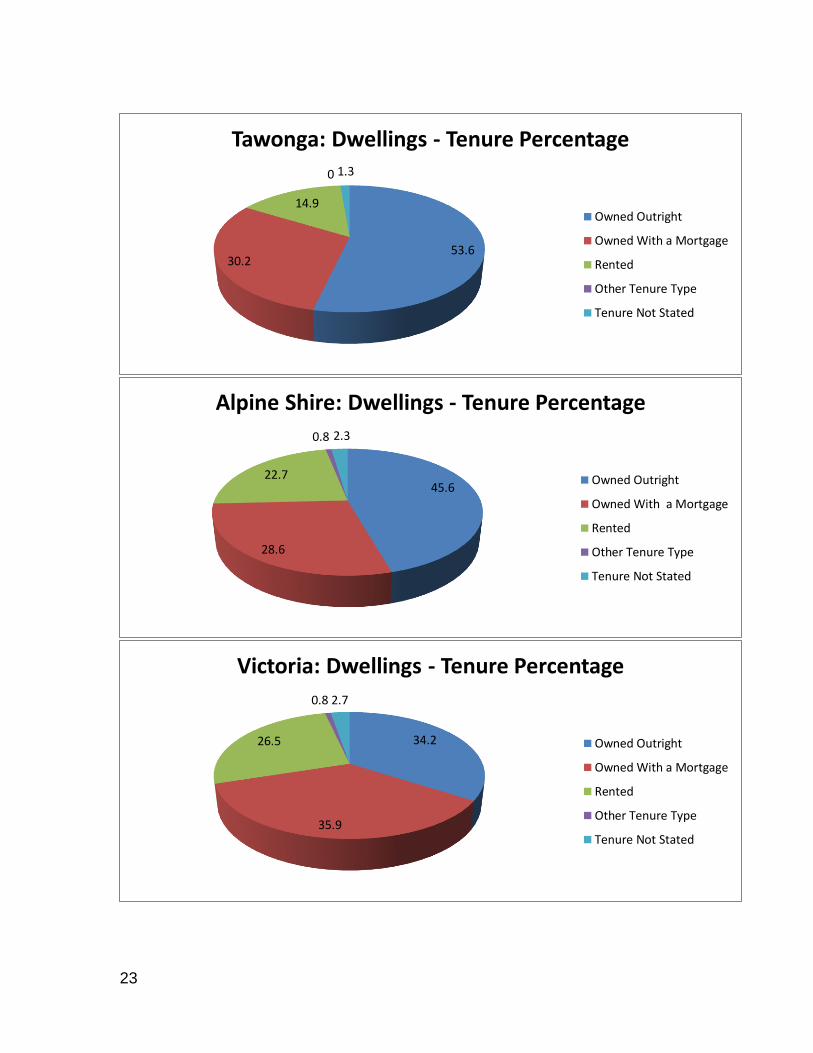
53.6 30.2
14.9
0 1.3
Tawonga: Dwellings - Tenure Percentage
Owned Outright
Owned With a Mortgage
Rented
Other Tenure Type
Tenure Not Stated
45.6
28.6
22.7
0.8 2.3
Alpine Shire: Dwellings - Tenure Percentage
Owned Outright
Owned With a Mortgage
Rented
Other Tenure Type
Tenure Not Stated
34.2
35.9
26.5
0.8 2.7
Victoria: Dwellings - Tenure Percentage
Owned Outright
Owned With a Mortgage
Rented
Other Tenure Type
Tenure Not Stated
24
3.18 Dwellings: structure
In Tawonga, 82.6% of private dwellings were occupied and 17.4% were unoccupied. Of occupied private dwellings in Tawonga 96.6% were separate houses. There were no semi-detached, row or terrace houses, flats or apartments; 3.4% were other dwellings. Of the occupied private dwellings in Tawonga, 53.2% had three bedrooms, whilst 28.3% of dwellings had 4 or more bedrooms. The average number of bedrooms per occupied dwelling was 3.1%. The average number of people per household was 2.4%.
3.19 Dwellings: household composition & income
In Tawonga, of all households, 74.7% or 177 were family households, 23.6% or 56 were single person households and there were 1.7% or 4 group households. In Tawonga, 28.6% of households had a weekly household income of less than $600 and 4.5% of households had a weekly income of more than $3000.
3.20 Dwellings: mortgage and rent
The median rent in Tawonga was $130 and the median mortgage repayments were $1192.
25
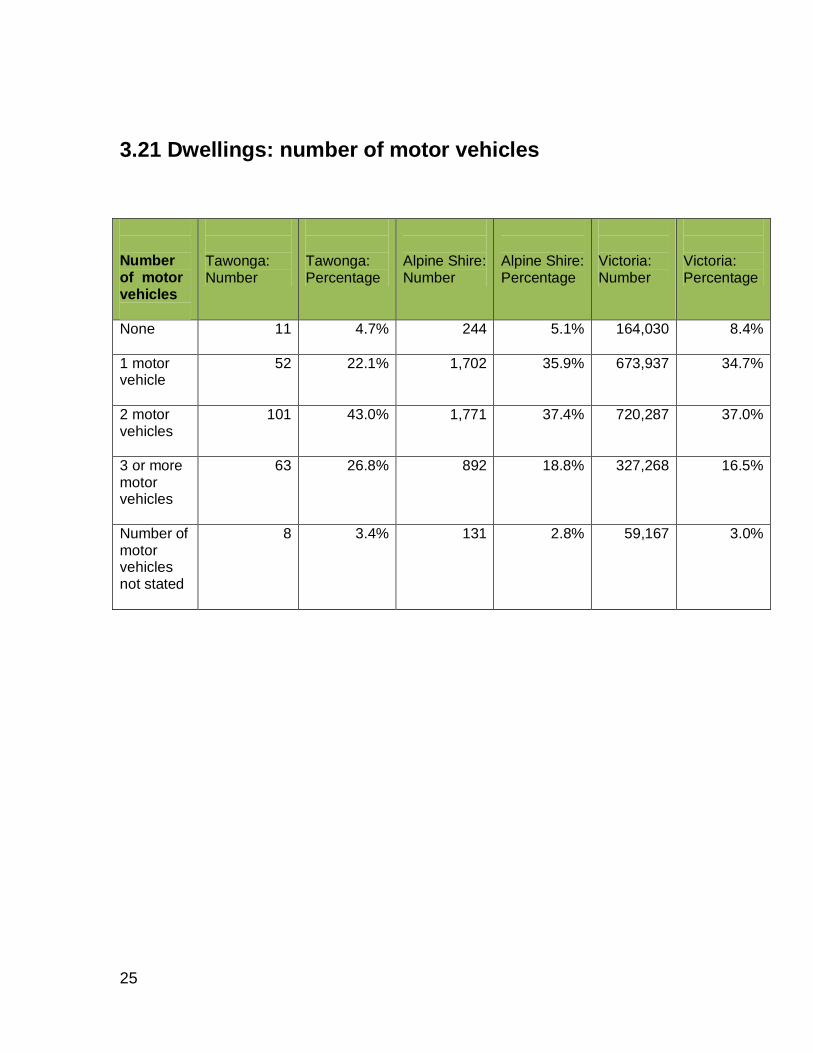
3.21 Dwellings: number of motor vehicles
Number of motor vehicles
Tawonga: Number
Tawonga: Percentage
Alpine Shire: Number
Alpine Shire: Percentage
Victoria: Number
Victoria: Percentage
None
11 4.7% 244 5.1% 164,030 8.4%
1 motor vehicle
52 22.1% 1,702 35.9% 673,937 34.7%
2 motor vehicles
101 43.0% 1,771 37.4% 720,287 37.0%
3 or more motor vehicles
63 26.8% 892 18.8% 327,268 16.5%
Number of motor vehicles not stated
8 3.4% 131 2.8% 59,167 3.0%
26
4 Primary Health Data
A review of the health data commissioned by Alpine Health4 and published in 2008, showed that Tawonga is located in the North East Victorian Division of General Practice (NEVDGP), the Central Hume PCP and is serviced by the Ovens and King Community Health Service and Alpine Health. The data on primary health issues does not drill down to small area level and is quoted at Alpine Shire and Hume Region level. The key primary health issues cited in the data within the Alpine Shire relate to fertility, oral health, diabetes, respiratory diseases, cancer, heart disease, substance misuse and road accidents. The relative impact of issues by gender was different with the main issue for men being lung cancer and for women, depression and breast cancer. Rates of mental health issues for men and women were below Regional and Victorian State averages. The Alpine Health data identifies the key health issues as being smoking, nutrition, alcohol, insufficient physical activity, gambling and crime5. The data on rates of cancer, oral health and heart disease reinforce those priorities.
4 Alpine Shire Victoria: Health and Community Profile, Plexus Consulting, April 2008
5 Ibid p251.
27
5 Community Indicators: What are Community
Indicators and why are they important?
Community Indicators are measurements that provide information about trends – past and present. They highlight issues of importance to communities and are designed to be relevant to policy and planning. Indicators can tell you whether a local area is improving, declining or staying the same. In essence, indicators chart the interaction among a community‟s economic, social, environmental, cultural and democratic well-being.6 Community Indicators Victoria (CIV) is a community indicator system with local level data that measures the wellbeing of Victoria. CIV can assist local governments to govern better. It can improve councils‟ knowledge, responsiveness, effectiveness and accountability. It can provide the basis for:
community engagement
support for local council decision-making
integrated approach to policy and planning
focus on outcomes and practical results for communities
ensure accurate and transparent reporting and accountability CIV data is reported on a Local Government Area, Regional Basis and Victorian State levels. Data is not drilled down to smaller areas.
6CIV. McCaughey VicHealth Centre for Community Wellbeing. University of Melbourne 2012.
28
6 What are the findings from the latest available data?
Self-Reported Health was measured in the CIV 2007 Survey, 57.1% of residents in the Alpine Shire reported that their health was either excellent or very good compared to 54.3% in both the Hume Region and Victorian State. Subjective Wellbeing was measured in the 2011 VicHealth Indicators Survey. The Personal Wellbeing Index for Australia, ranging between 0-100, was approximately 75. In comparison, the average Personal Wellbeing Index for persons living in the Alpine Shire was 81.3, while the Hume Region was 79.6 and the average for the State of Victoria was 77.5. The same VicHealth Survey asked residents to rate their satisfaction with feeling part of the community. The average Community Connection score for Australia was 70. In comparison the score for persons living in the Alpine Shire was 82.5. This was also ten points higher than the Victorian State average of 72.3. In the Victorian Population Survey conducted in 2008, 16.4% of people in the Alpine Shire were classified as obese, which was very similar to the Victorian State average of 16.7%. It was also lower than the 21% rate of obesity in the
Hume Region. In research undertaken in 2008, the Department of Planning and Community Development (DPCD) measured Volunteering. In the Alpine Shire 55.3% of
people reported that they helped out as a volunteer, compared to 48% in the Hume Region and 40.8% in the State of Victoria. Child Health Assessments are routinely undertaken by the Maternal and Child Health Service in Victoria. In 2010-2011 the rate of participation for children eligible for an assessment at 3.5 years was 71.8% in the Alpine Shire. This
compared favourably with the rate of 65.8% in the Hume Region and the Victorian State average of 62.2%. The Transport Accident Commission (TAC) released the Road Traffic Fatalities
per 100,000 population at 2011. Alpine Shire had a rate of 16.8 which was higher than that of the Hume Region, 14.1 and significantly higher than that of the State of Victoria which was 5.4.
29
The number of Road Traffic Major Injuries per 100,000 at 2011 in the Alpine Shire was 260.9. This was quite considerably higher than the rate in the Hume Region 153.1, and the rate of 129.8 in Country Victoria. More significantly the rate in the Alpine Shire was much higher than that of the State of Victoria which was107. The average Distance to the Nearest Medical Clinic with a General Practitioner has been gathered by the Department of Human Services, (DHS) Data Directory 2012. In the Alpine Shire the average distance was 11.39km, compared to 8.18km in the Hume Region and 2.93km in Victoria. The unemployment rate in the Alpine Shire was measured by the Department
of Education Employment and Workplace Relations for the period 2010-2011. In the Alpine Shire the rate of unemployment was 4.7%, compared to 6.0% for the Hume Region, 5.4% for the State of Victoria and 5.3% for Country Victoria. This rate of 4.7% for the Alpine Shire was also lower than the rate of unemployment of 5.2% for the period 2009-2010. Greenhouse Gas Emissions have been measured by the Department of Sustainability and Environment (DSE) for the years: 2004, 2005, 2006 and 2007. Over that period there had been little change in Greenhouse Gas Emissions in the Alpine Shire. The 2007 figures show the Alpine Shire to be larger emitters, 14.1 tonnes per private dwelling compared to 9.9 for the State of Victoria. Household Electricity Use has been measured by the DSE in 2007. Electricity
use has been indicated in megawatts an hour per private occupied dwelling. The statistics show that users in the Alpine Shire used 10.7 megawatts an hour compared to the Average of only 5.7 in the State of Victoria. The situation was reversed when comparing the figures for Household Gas Use. This was also measured by the DSE in 2007. The measurements are in gigajoules per customer, with 46.6 being the average in the Alpine Shire, compared to the average of 52.5 in the State of Victoria. The population of Tawonga differs when comparing the figures of the ABS
Census in 2006 (558 persons) and the Census in 2011 (588 persons). These differences also reflect the ABS move to the Australian Statistical Geography Standard (ASGS).
30
7 Healthy Safe and Inclusive Communities – Personal
Health and Well-being
Self-Reported Health
Self-Reported Health was measured in the 2007 CIV Survey. Respondents were asked to rate their health as excellent, very good, good, fair or poor. 57.1% of persons living within the Alpine Shire reported that their health was either excellent or very good as compared to 54.3% in the Hume Region and the Victorian State average of 54.3%.
Subjective Well-being
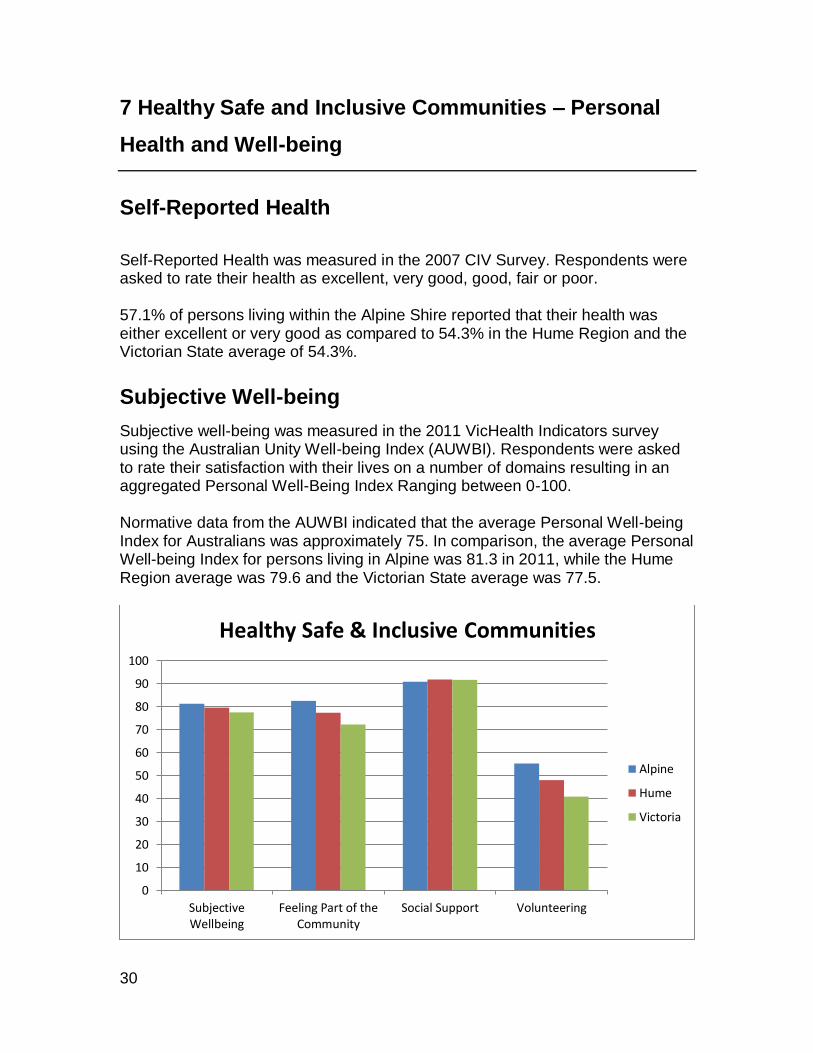
Subjective well-being was measured in the 2011 VicHealth Indicators survey using the Australian Unity Well-being Index (AUWBI). Respondents were asked to rate their satisfaction with their lives on a number of domains resulting in an aggregated Personal Well-Being Index Ranging between 0-100. Normative data from the AUWBI indicated that the average Personal Well-being Index for Australians was approximately 75. In comparison, the average Personal Well-being Index for persons living in Alpine was 81.3 in 2011, while the Hume Region average was 79.6 and the Victorian State average was 77.5.
0
10
20
30
40
50
60
70
80
90
100
SubjectiveWellbeing
Feeling Part of theCommunity
Social Support Volunteering
Healthy Safe & Inclusive Communities
Alpine
Hume
Victoria
31
8 Healthy Safe and Inclusive Communities – Community
Connectedness
Feeling Part of the Community
Community Connection was measured in the 2011 VicHealth Survey. Respondents were asked to rate their satisfaction with feeling part of their community and answers were presented according to a 0-100 range. Normative date from the AUWBI indicated that the average Community Connection score for Australians was approximately 70. In comparison, the average Community Connection score for persons living in the Alpine Shire was 82.5 in 2011, while the Hume Region average was 77.4 and the Victorian State average was 72.3.
Social Support
Social Support was measured in the 2008 Department of Planning & Community Development. (DPCD) Respondents were asked if they could get help from friends, family or neighbours when they needed it, either definitely, sometimes or not at all. 90.9% of persons living within the Alpine Shire reported that they could definitely get help from friends, family or neighbours when they needed it, as compared to 91.8% in the Hume Region and 91.7% in Victoria.
Volunteering
Volunteering was measured in the 2008 DPCD. Respondents were asked whether or not they helped out as a volunteer. 55.3% of persons living within the Alpine Shire reported that they helped out as a volunteer, as compared to 48% in the Hume Region and 40.8% in Victoria.
32
9 Healthy Safe and Inclusive Communities – Early
Childhood
Child Health Assessments
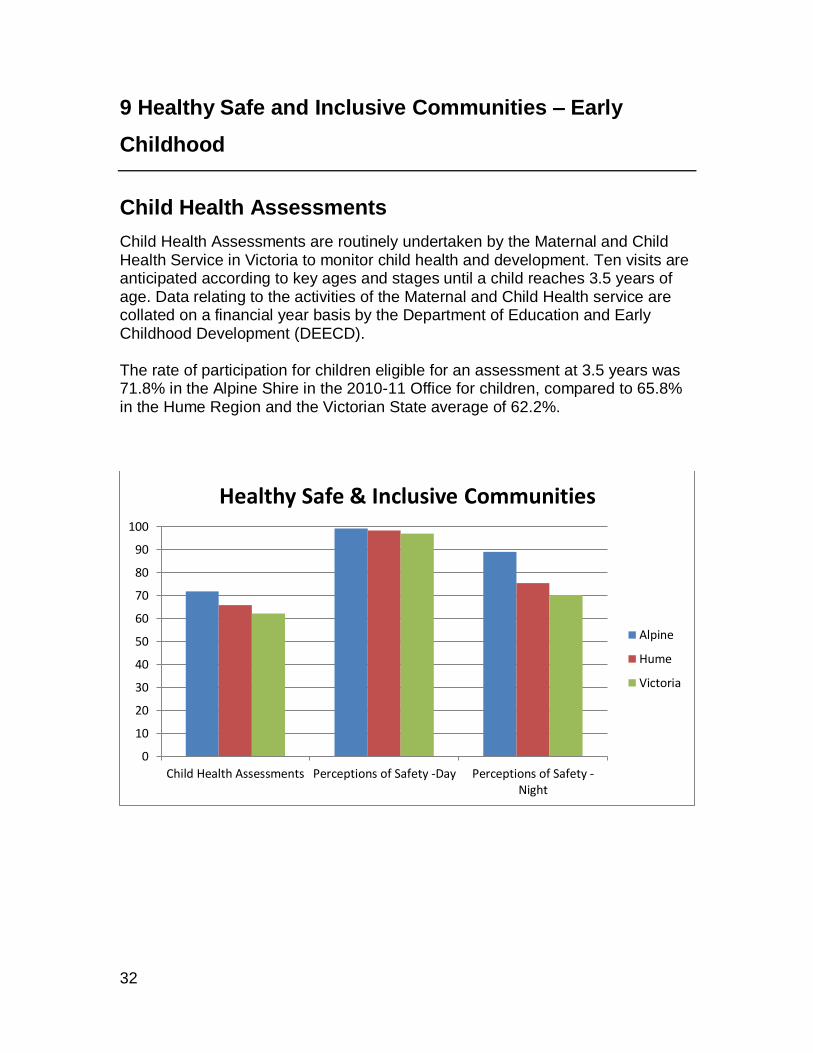
Child Health Assessments are routinely undertaken by the Maternal and Child Health Service in Victoria to monitor child health and development. Ten visits are anticipated according to key ages and stages until a child reaches 3.5 years of age. Data relating to the activities of the Maternal and Child Health service are collated on a financial year basis by the Department of Education and Early Childhood Development (DEECD). The rate of participation for children eligible for an assessment at 3.5 years was 71.8% in the Alpine Shire in the 2010-11 Office for children, compared to 65.8% in the Hume Region and the Victorian State average of 62.2%.
0
10
20
30
40
50
60
70
80
90
100
Child Health Assessments Perceptions of Safety -Day Perceptions of Safety -Night
Healthy Safe & Inclusive Communities
Alpine
Hume
Victoria
33
10 Healthy Safe and Inclusive Communities – Personal
and Community Safety
Perceptions of Safety
Perceptions of Safety were measured in the 2011 VicHealth Indicators Survey. Respondents were asked to rate how safe they felt when walking alone in their local area during the day and night. When walking alone in their local area during the day 99.2% of persons in the Alpine Shire felt safe or very safe, compared to 98.4% in the Hume Region and the Victorian state Average of 97%. When walking alone at night 89% of persons in the Alpine Shire felt safe or very safe compared to 75.4% in the Hume Region and the Victorian state average of 70.3% Respondents who stated that they were never alone in the particular situation were not asked to give their perception of how safe they might feel in the situation, and were excluded from the calculation of the proportions.
Crime
Crime statistics are produced annually by Victoria Police. Summaries of offences are reported per 100,000 population to enable comparisons across different areas. In the Alpine Shire there were 521 recorded crimes against the person per 100,000 population in 2011-12 compared to 1090 in the Hume Region and the Victorian State average of 984. In the Alpine Shire there were 2,049 recorded crimes against property per 100,000 in 2011-12, compared to 4,049 in the Hume Region and the Victorian State average of 4,797.
34
11 Healthy Safe and Inclusive Communities – Lifelong
Learning
School leavers
The activities of young people who have left school have been sourced from the 2012 Department of Education & Early Childhood Development (DEECD). This data described the level of engagement in work and study activities of 15-19 year olds who are not attending school. These young people can be categorized into three major groups:
Group Definition
Fully Engaged School Leavers: Those who are involved in work and/or non-school study (including university, TAFE and vocational training) on a full time basis.
Disengaged school leavers: Those who are not involved in any work or study activities at all.
Remaining school leavers: Those who are partly engaged.
The percentage of fully engaged and disengaged school leavers is presented below. Engaged or Disengaged: In the Alpine Shire 7.34% of 15-19 year old school leavers were fully engaged in work or non-school study, compared to 4.89% in the Hume Region and the Victorian State average of 2.4%. Furthermore 1.49% was disengaged, compared to 0.61% in the Hume Region and the Victorian State average of 0.41%. The ABS 2011 Census cites the rate of young people who are aged 17years and still attending school as 77.9% which is less than the rate across Victoria, of 80.7%; but greater than that of country Victoria (75.5%). In the Alpine Shire 13.1% of young people aged 17 were not attending any educational institution which is higher than the rate in Victoria of 10.5%.
35
12 Dynamic Resilient Local Economies
Highly Skilled workforce
A skilled workforce in a community is an essential component of a strong local economy. For this indicator, highly skilled has been defined as occupations with ANZSCO Skill Levels 1-3. The data has been collated from customized Census tables obtained from the Australian Bureau of Statistics (ABS). 55.3% of employed persons working in the Alpine Shire worked in highly skilled occupations compared to 54.3% in the Hume Region and the Victorian state average of 56.3%
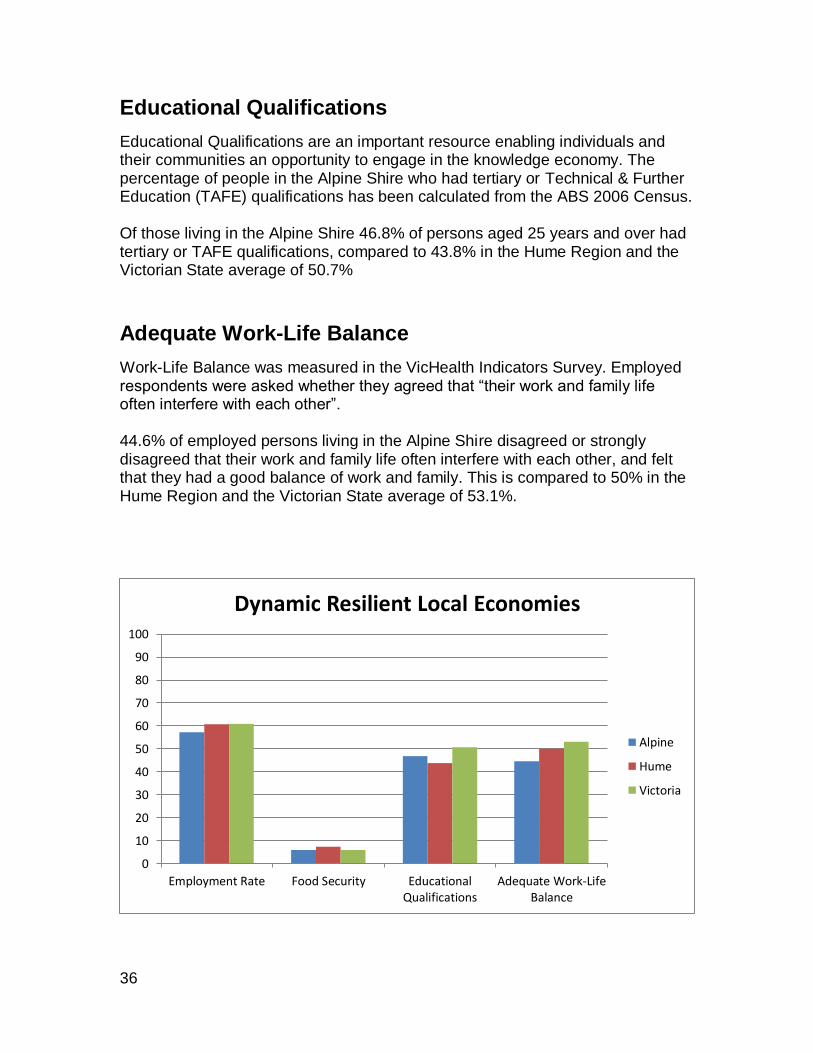
Employment Rate
The employment rate has been calculated from the ABS 2011 Census. This employment to population ratio describes the percentage of persons aged 15 years or older who are employed. There were 5,607 people who reported being in the labour force in the week before the Census night in the Alpine Shire. Of these, 53.7% were employed full-time, 35.3% were employed part-time and 4.7% were unemployed.
Income
Median Equivalised Household Income has been calculated from the 2011 ABS. Equivalising income adjusts the total income of the household according to the number of persons and household type. Median Equivalised Gross Weekly Household Income for the Alpine Shire was $569 compared to $629 in the Hume Region and the Victorian State average of $749.
Food Security
Food Security was measured in the 2007 CIV Survey. Respondents were asked if there had been any times in the previous 12 months when they had run out of food and could not afford to buy more. 6% of persons in the Alpine Shire had experienced food insecurity, compared to 7.3% in the Hume Region and the Victorian State average of 6%.
36
Educational Qualifications
Educational Qualifications are an important resource enabling individuals and their communities an opportunity to engage in the knowledge economy. The percentage of people in the Alpine Shire who had tertiary or Technical & Further Education (TAFE) qualifications has been calculated from the ABS 2006 Census. Of those living in the Alpine Shire 46.8% of persons aged 25 years and over had tertiary or TAFE qualifications, compared to 43.8% in the Hume Region and the Victorian State average of 50.7%
Adequate Work-Life Balance
Work-Life Balance was measured in the VicHealth Indicators Survey. Employed respondents were asked whether they agreed that “their work and family life often interfere with each other”. 44.6% of employed persons living in the Alpine Shire disagreed or strongly disagreed that their work and family life often interfere with each other, and felt that they had a good balance of work and family. This is compared to 50% in the Hume Region and the Victorian State average of 53.1%.
0
10
20
30
40
50
60
70
80
90
100
Employment Rate Food Security EducationalQualifications
Adequate Work-LifeBalance
Dynamic Resilient Local Economies
Alpine
Hume
Victoria
37
13 Sustainable Built and Natural Environments
Housing Affordability
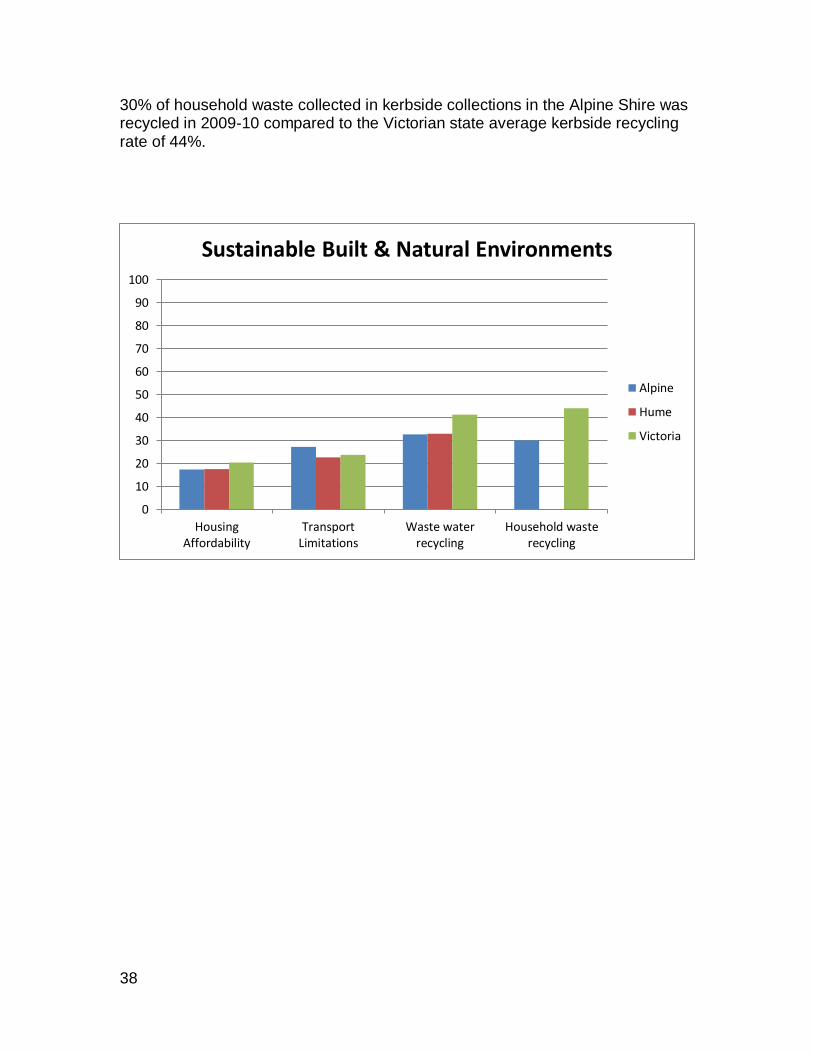
One measure of Housing Affordability has been calculated through the ABS 2011 Census. The data shows the percentage of households spending 30% or more of their gross household income on rent or mortgage payments. 17.4% of households in the Alpine Shire were spending 30% or more of gross household income on rent or mortgage payments, compared to 17.5% in the Hume Region and the Victorian State average of 20.4%.
Transport Limitations
Transport Limitations were measured in the 2011 VicHealth Indicators Survey. Respondents were asked if their day-to-day travel had been limited or restricted in the previous 12 months. 27.2% of persons living in the Alpine Shire had experienced transport limitations in the previous year, compared to 22.6% in the Hume Region and the Victorian State average of 23.7%
Waste Water Recycling
Household Water Conservation was measured in the 2011 VicHealth Indicators Survey. Respondents were asked if their household had engaged in a list of water conservation methods, including the collection of waste water from washing machines, showers or sinks. 32.7% of persons living in the Alpine Shire were in households that collect waste water, compared to 32.9% in the Hume region and the Victorian State average of 41.3%.
Household Waste Recycling
Data on Household waste recycling are obtained from an annual survey conducted by Sustainability Victoria which collects information on the kerbside service activities provided by local government. An average of 475kg of garbage was collected per household from kerbside collections in Victoria in 2009-10.
38
30% of household waste collected in kerbside collections in the Alpine Shire was recycled in 2009-10 compared to the Victorian state average kerbside recycling rate of 44%.
0
10
20
30
40
50
60
70
80
90
100
HousingAffordability
TransportLimitations
Waste waterrecycling
Household wasterecycling
Sustainable Built & Natural Environments
Alpine
Hume
Victoria
39
14 Culturally Rich and Vibrant Communities
Participation in Arts and Cultural Activities
Participation in Arts and Culture was measured in the 2011VicHealth Indicators survey. Respondents were asked if they had participated in a range of activities in the previous month, including painting, drawing, art and craft, playing musical instruments, singing, writing and performing. 57.6% of persons in the Alpine Shire had participated in at least one of the selected artistic and cultural activities in the previous month, compared to 57.4% in the Hume region and the Victorian state average of 63.6%.

40
15 Environment and Climate
The Great Dividing Range is the dominant geographic feature in North East Victoria, producing wide variations in climate. The weather patterns of the Alpine Valleys are strongly influenced by elevation and topography. The following are some of the main aspects of weather patterns in the Alpine Valleys based on data from the Bureau of Meteorology and the Department of Primary Industries (DPI).7
7 Agricultural Resources in North East Victoria: The Alpine Valleys. DPI Agribusiness Group.
Rain is the main form of precipitation in the Alpine
Valleys.
At high altitudes a large proportion of winter
precipitation falls as snow.
In each of the Alpine Valleys winter rainfall is
higher than summer rainfall.
Townships within the Alpine Valleys have an average annual rainfall
(1920-2007) of between 700 and 1400mm.
The annual average rainfall decreases with elevation
and subsequently decreases down the valleys.
At each location in the Alpine Valleys the
distribution of rainfall shows a winter peak.
January and February are the driest months in the
year.
The hottest months in the Alpine Valleys are
December, January and February.
Average summer temperatures range from 26.8° at Harrietville to 30.3° at Myrtleford.
July is normally the coldest month with average
maximum temperatures varying between (1920-
2007) 9° at Kergunyah and 12.4° at Myrtleford.
Average minimum temperatures range from
around 11.6° - 14° in February to 1.5° - 3° in July.
Frosts occur in the period between April and October
in the Alpine Valleys.
41
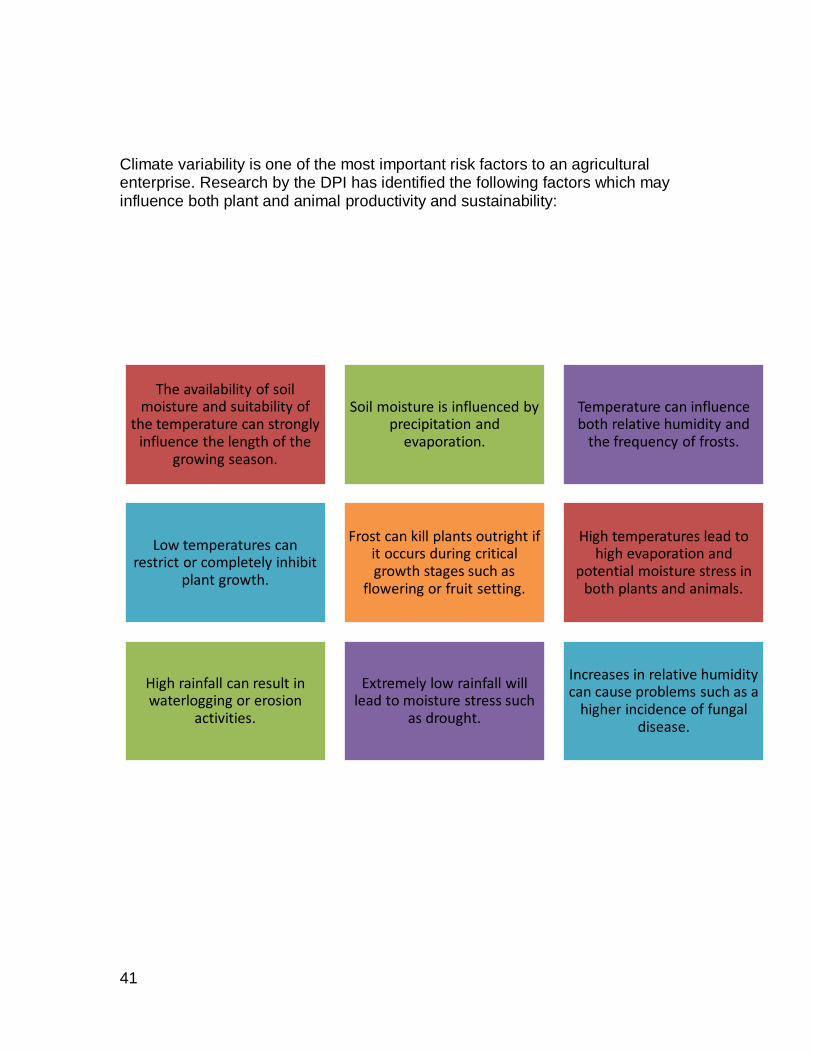
Climate variability is one of the most important risk factors to an agricultural enterprise. Research by the DPI has identified the following factors which may influence both plant and animal productivity and sustainability:
The availability of soil moisture and suitability of
the temperature can strongly influence the length of the
growing season.
Soil moisture is influenced by precipitation and
evaporation.
Temperature can influence both relative humidity and
the frequency of frosts.
Low temperatures can restrict or completely inhibit
plant growth.
Frost can kill plants outright if it occurs during critical growth stages such as
flowering or fruit setting.
High temperatures lead to high evaporation and
potential moisture stress in both plants and animals.
High rainfall can result in waterlogging or erosion
activities.
Extremely low rainfall will lead to moisture stress such
as drought.
Increases in relative humidity can cause problems such as a
higher incidence of fungal disease.
42
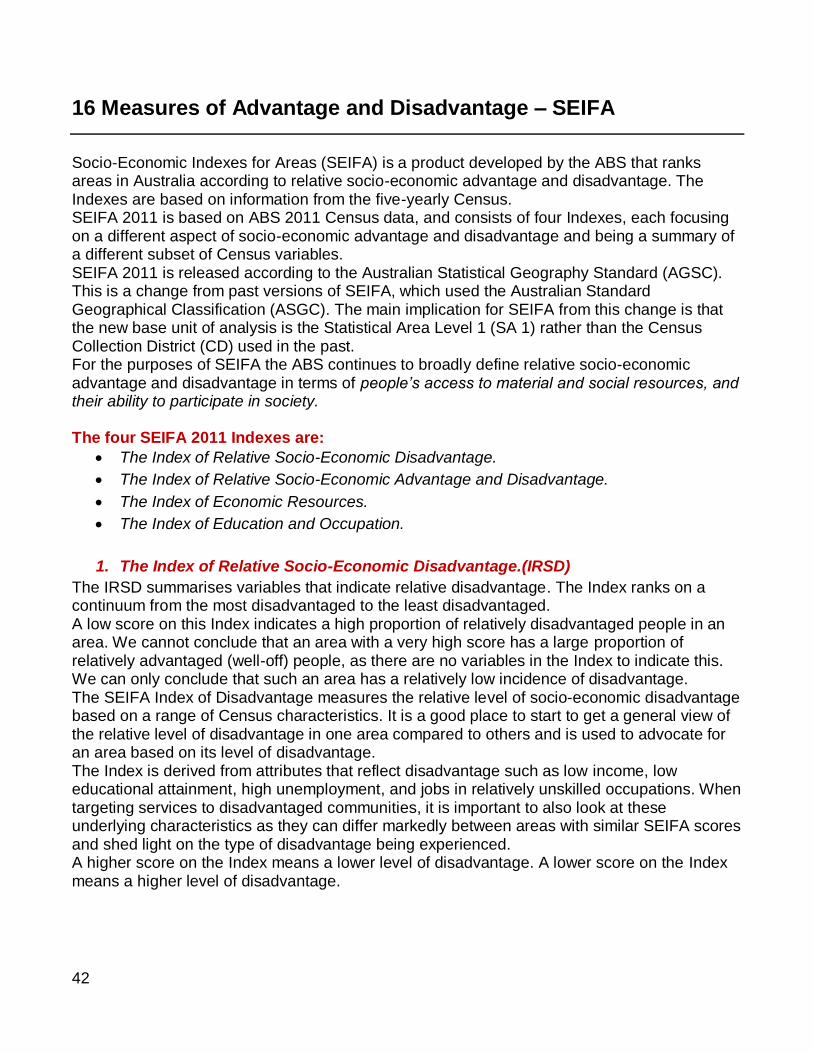
16 Measures of Advantage and Disadvantage – SEIFA
Socio-Economic Indexes for Areas (SEIFA) is a product developed by the ABS that ranks areas in Australia according to relative socio-economic advantage and disadvantage. The Indexes are based on information from the five-yearly Census. SEIFA 2011 is based on ABS 2011 Census data, and consists of four Indexes, each focusing on a different aspect of socio-economic advantage and disadvantage and being a summary of a different subset of Census variables. SEIFA 2011 is released according to the Australian Statistical Geography Standard (AGSC). This is a change from past versions of SEIFA, which used the Australian Standard Geographical Classification (ASGC). The main implication for SEIFA from this change is that the new base unit of analysis is the Statistical Area Level 1 (SA 1) rather than the Census Collection District (CD) used in the past. For the purposes of SEIFA the ABS continues to broadly define relative socio-economic advantage and disadvantage in terms of people’s access to material and social resources, and their ability to participate in society. The four SEIFA 2011 Indexes are:
The Index of Relative Socio-Economic Disadvantage.
The Index of Relative Socio-Economic Advantage and Disadvantage.
The Index of Economic Resources.
The Index of Education and Occupation.
1. The Index of Relative Socio-Economic Disadvantage.(IRSD)
The IRSD summarises variables that indicate relative disadvantage. The Index ranks on a continuum from the most disadvantaged to the least disadvantaged. A low score on this Index indicates a high proportion of relatively disadvantaged people in an area. We cannot conclude that an area with a very high score has a large proportion of relatively advantaged (well-off) people, as there are no variables in the Index to indicate this. We can only conclude that such an area has a relatively low incidence of disadvantage. The SEIFA Index of Disadvantage measures the relative level of socio-economic disadvantage based on a range of Census characteristics. It is a good place to start to get a general view of the relative level of disadvantage in one area compared to others and is used to advocate for an area based on its level of disadvantage. The Index is derived from attributes that reflect disadvantage such as low income, low educational attainment, high unemployment, and jobs in relatively unskilled occupations. When targeting services to disadvantaged communities, it is important to also look at these underlying characteristics as they can differ markedly between areas with similar SEIFA scores and shed light on the type of disadvantage being experienced. A higher score on the Index means a lower level of disadvantage. A lower score on the Index means a higher level of disadvantage.

43
2. The Index of Relative Socio-Economic Advantage and Disadvantage.(IRSAD)
The IRSAD summarises variables that indicate either relative advantage or disadvantage. The Index ranks areas on a continuum from most disadvantaged to most advantaged. An area with a high score on this Index has a relatively high incidence of advantage and a relatively low incidence of disadvantage. Due to the differences in scope between this Index and the IRSD, the scores of some areas can vary substantially between the two Indexes. For example, consider a large area that has parts containing relatively disadvantaged people, and other parts containing relatively advantaged people. This area may have a low IRSD ranking, due to its pockets of disadvantage. However, its IRSAD ranking may be moderate, or even above average, because the pockets of advantage may offset the pockets of disadvantage.
3. The Index of Economic Resources.(IER)
The IER summarises variables relating to the financial aspects of socio-economic advantage and disadvantage. These include indicators of high and low income, as well as variables that correlate with high or low wealth. Areas with higher scores have relatively greater access to economic resources than areas with lower scores.
4. The Index of Education and Occupation.(IEO)
The IEO summarises variables relating to the educational and occupational aspects of relative socio-economic advantage and disadvantage. This Index focuses on the skills of people in an area, both formal qualifications and the skills required to perform different occupations. A low score indicates that an area has a high proportion of people without qualifications, without jobs, and/or with low skilled jobs. A high score indicates many people with high qualifications and/or highly skilled jobs. Some important characteristics of the Indexes:
1. The Indexes are assigned to areas and not to individuals. They indicate the collective socio-economic characteristics of the people living in an area.
2. As measures of socio-economic conditions, the Indexes are best interpreted as ordinal measures that rank (order) areas. The Index scores are based on an arbitrary numerical scale and do not represent a quantity of advantage or disadvantage. For ease of interpretation, it is recommended using the Index deciles that is one of the ten equal groups that a large number of people or things are divided into for comparing things.
3. Each Index is constructed based on a weighted combination of selected variables. The Indexes are dependent on the set of variables chosen for the analysis.
4. The Indexes are primarily designed to compare the relative socio-economic characteristics of areas at a given point in time. It can be very difficult to perform longitudinal or time series analysis, and it should not be attempted flippantly.
Some common uses of SEIFA include:
Determining areas that require funding and services
Identifying new business opportunities
Assisting research into the relationship between socio-economic advantage and various
social outcomes

44
Alpine Shire Council is rated 46 out of 80 on the Index of Relative Socio-economic Disadvantage (IRSD) of Local Government Areas in Victoria.
The highest score for an Local Government Areas in Victoria is Nillumbik and the LGA with the lowest score is Greater Dandenong (C).
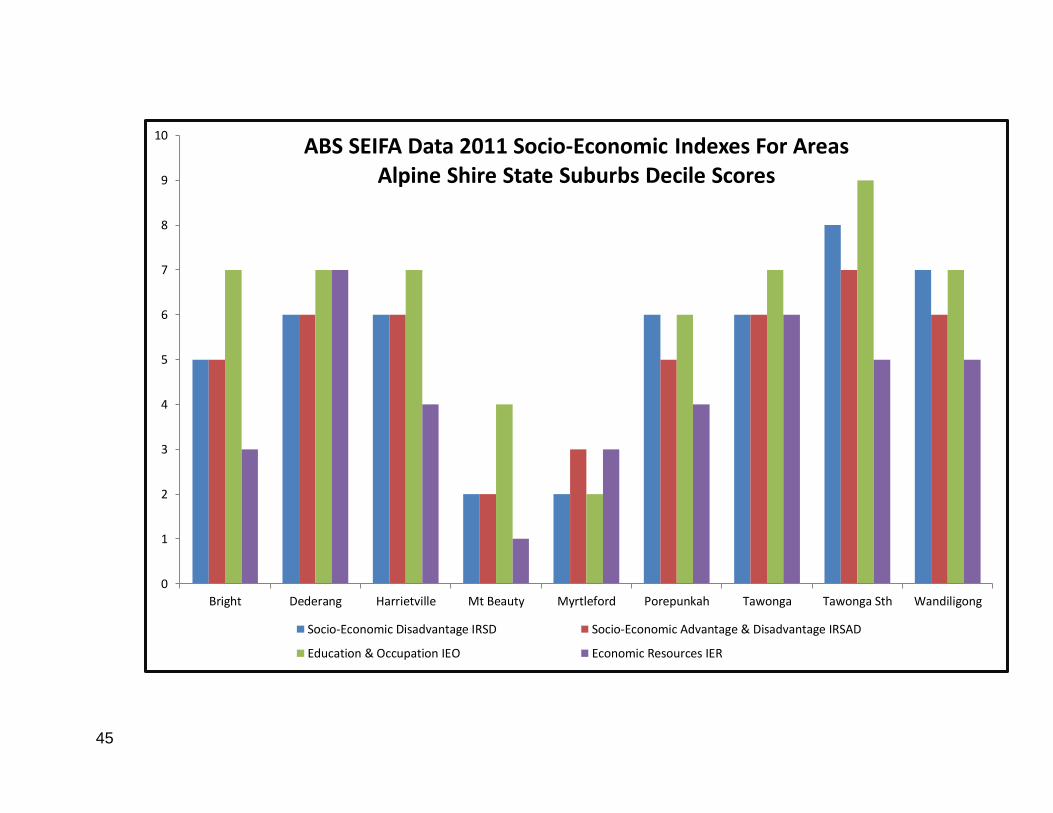
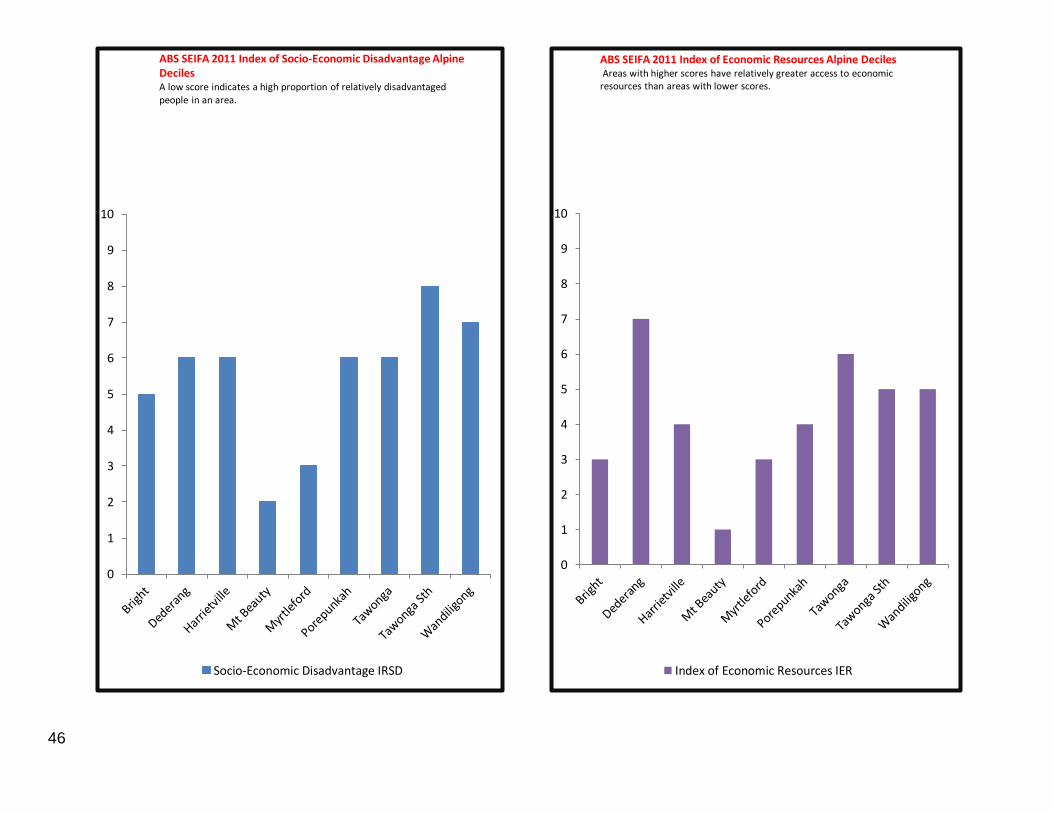
Mt Beauty has a high level of relatively disadvantaged people. It is in the 2nd lowest decile (between 10- 20%) on the IRSD.
Dederang, Tawonga, Porepunkah, and Harrietville are in the sixth decile on the IRSD (between 50-60%) indicating a slightly above average level of relatively disadvantaged people in the area.
Tawonga South is in the eighth decile on the IRSD (between 70-80%) which indicates a low proportion of relatively disadvantaged people in the area.
The people of Mt Beauty have a relatively lower access to economic resources, being on the 1st decile (between 0-10%).
Dederang has a score in the 7th decile (between 60-70%) on the IER, indicating above average access to economic resources.
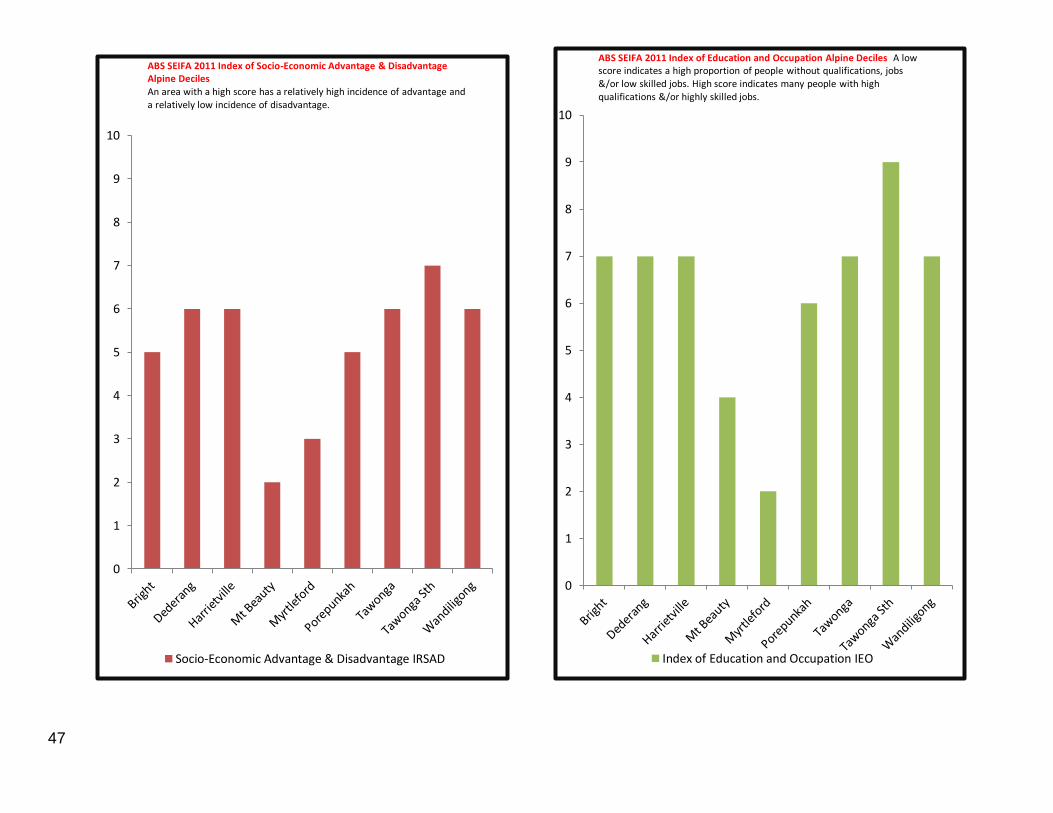
Mt Beauty and Myrtleford have a high proportion of people without qualifications, without jobs, and/or low skilled jobs being in the 2nd decile on the IEO (between 10-20%).
Tawonga South has a high score being in the 9th decile (80-90% ) of the IEO. This indicates an area with many people with high qualifications and/or highly skilled jobs.
Bright has an above average proportion of people with high qualifications or highly skilled jobs, and a below average proportion of people with greater access to economic resources.
Dederang and Tawonga score above average on all four of the SEIFA Indexes. Mt Beauty and Myrtleford score below average on all four of the SEIFA Indexes.
45
0
1
2
3
4
5
6
7
8
9
10
Bright Dederang Harrietville Mt Beauty Myrtleford Porepunkah Tawonga Tawonga Sth Wandiligong
ABS SEIFA Data 2011 Socio-Economic Indexes For Areas Alpine Shire State Suburbs Decile Scores
Socio-Economic Disadvantage IRSD Socio-Economic Advantage & Disadvantage IRSAD
Education & Occupation IEO Economic Resources IER
46
0
1
2
3
4
5
6
7
8
9
10
ABS SEIFA 2011 Index of Socio-Economic Disadvantage Alpine Deciles A low score indicates a high proportion of relatively disadvantaged people in an area.
Socio-Economic Disadvantage IRSD
0
1
2
3
4
5
6
7
8
9
10
ABS SEIFA 2011 Index of Economic Resources Alpine Deciles Areas with higher scores have relatively greater access to economic resources than areas with lower scores.
Index of Economic Resources IER
47
0
1
2
3
4
5
6
7
8
9
10
ABS SEIFA 2011 Index of Socio-Economic Advantage & Disadvantage Alpine Deciles An area with a high score has a relatively high incidence of advantage and a relatively low incidence of disadvantage.
Socio-Economic Advantage & Disadvantage IRSAD
0
1
2
3
4
5
6
7
8
9
10
ABS SEIFA 2011 Index of Education and Occupation Alpine Deciles A low score indicates a high proportion of people without qualifications, jobs &/or low skilled jobs. High score indicates many people with high qualifications &/or highly skilled jobs.
Index of Education and Occupation IEO
Compiled by Pat Easterbrook Alpine Shire Council 2013 www.alpineshire.vic.gov.au
HEAD OFFICE Great Alpine Road PO Box 139 BRIGHT VIC 3741 Telephone: (03) 5755 0555 Facsimile: (03) 5755 1811 Email: [email protected]