
TARGETS AND QUANTITATIVE ANALYSIS IN RETT SYNDROME · targets and quantitative analysis in rett...
112
IN SILICO IDENTIFICATION OF CANDIDATE MECP2 TARGETS AND QUANTITATIVE ANALYSIS IN RETT SYNDROME A THESIS SUBMITTED TO THE DEPARTMENT OF MOLECULAR BIOLOGY AND GENETICS AND THE INSTITUTE OF ENGINEERING AND SCIENCE OF BILKENT UNIVERSITY IN PARTIAL FULFILLMENT OF THE REQUIREMENTS FOR THE DEGREE OF MASTER OF SCIENCE BY ONUR EMRE ONAT JULY, 2006
Transcript of TARGETS AND QUANTITATIVE ANALYSIS IN RETT SYNDROME · targets and quantitative analysis in rett...

IN SILICO IDENTIFICATION OF CANDIDATE MECP2
TARGETS AND QUANTITATIVE ANALYSIS IN RETT
SYNDROME
A THESIS SUBMITTED TO
THE DEPARTMENT OF MOLECULAR BIOLOGY AND GENETICS
AND
THE INSTITUTE OF ENGINEERING AND SCIENCE OF
BILKENT UNIVERSITY
IN PARTIAL FULFILLMENT OF THE REQUIREMENTS FOR
THE DEGREE OF MASTER OF SCIENCE
BY
ONUR EMRE ONAT
JULY, 2006

ii
I certify that I have read this thesis and that in my opinion it is fully adequate, in scope and in quality, as a thesis for the degree of Master of Science. Prof. Dr. Tayfun Özçelik I certify that I have read this thesis and that in my opinion it is fully adequate, in scope and in quality, as a thesis for the degree of Master of Science. Prof. Dr. Meral Topçu I certify that I have read this thesis and that in my opinion it is fully adequate, in scope and in quality, as a thesis for the degree of Master of Science. Assist. Prof. Rengül Çetin-Atalay Approved for the Institute of Engineering and Science Director of Institute of Engineering and Science Prof. Mehmet Baray

iii
ABSTRACT
IN SILICO IDENTIFICATION OF CANDIDATE MECP2 TARGETS AND QUANTTITATIVE ANALYSIS IN RETT SYNDROME
Onur Emre Onat M.S. in Molecular Biology and Genetics
Supervisor: Prof. Dr. Tayfun Özçelik July 2006, 96 Pages
Rett syndrome (RTT) is an X-linked neuro-developmental disorder seen exclusively girls in the childhood. It is one of the most common causes of mental retardation with an incidence rate of 1/10,000-1/15,000. Mutations in MECP2 gene was described as a common cause of RTT. MECP2 is a transcriptional repressor that regulates gene expression. It is not fully understood which MECP2 targets are affected in RTT and therefore contribute to disease pathogenesis. Researchers approached the problem in two directions: a) Global expression profile analysis and b) Candidate gene analysis. Global expression profile analysis revealed which a limited number of genes including those on the X-chromosome are de-regulated. Candidate gene analysis studies showed that loss of imprinting as exemplified by DLX5 could also contribute to disease pathogenesis. We hypothesize that X-chromosome inactivation (XCI) is an important physiological epigenetic mechanism that could be involved in Rett pathogenesis. We predicted a MECP2 binding motif by a distinctive bioinformatic approach. Using this algorithm we searched for the candidate MECP2 target genes on the X-chromosome and whole genome. The genes FHL1 and MPP1, whose interaction with MECP2 were heuristically displayed were predicted by our algorithm. We identified more than 100 genes which are on the X-chromosome. 10 genes from the list were selected according to their MECP2 binding homology score and X-inactivation status. In order to test this hypothesis we analyzed these genes with quantitative RT-PCR .We expect to identify the key genes that potentially contribute to RTT pathogenesis via disturbances in X-chromosome inactivation.

iv
ÖZET
MECP2 HEDEF GENLERİNİN IN SILICO TANIMLANMASI VE
RETT SENDROMU’NDA NİCELİKSEL ANALİZİ
Onur Emre Onat Moleküler Biyoloji ve Genetik Yüksek Lisans
Tez Yöneticisi: Prof. Dr. Tayfun Özçelik Temmuz 2006, 96 Sayfa
Rett sendromu (RTT) çocukluk çağında kız çocuklarında görülen nörogelişimsel bir hastalıktır. Mental retardasyonun başlıca sebeplerinden olup, 1/10000-1/15000 sıklıkla görülür. MECP2 geninin mutasyonuna bağlı olarak gelişir. MECP2 bir gen anlatımı baskılayıcısıdır. RTT’de anlatımı bozulan genlerin belirlenmesi hastalığın patogenezinin anlaşılması açısından çok önemlidir. Bu konuda araştırmacılar iki farklı yoldan ilerlemektedir: a) Global gen anlatım profili incelemeleri b) Aday gen incelemeleri. Mikroarray teknolojisi ile incelenen birinci yolda, kısıtlı sayıda genin anlatımının farklılaştığı gözlenmiştir. Aday gen çalışmaları ise önemli bir epigenetik düzenleme olan genomik imlemeye uğrayan DLX5 geninin RTT hastalarında imlemeden kaçarak hastalık mekanizmasına katkıda bulunduğunu göstermiştir. Önemli bir fizyolojik epigenetik düzenleme X-etkinsizleştirilmesidir. RTT patogenezi ile ilişkisi henüz araştırılmamıştır. X-etkinsizleştirilmesinin RTT patogenezinde önemli bir rol oynadığını düşünüyoruz. Özgün bir biyoinformatik yazılım algoritmi geliştirerek MECP2 bağlayan dizi motiflerinin varlığını özellikle X-kromozomu olmak üzere insan genomunda aradık. Bu inceleme sonunda saptanan genler arasında MECP2 ile etkileşime girdiği deneysel olarak gösterilmiş MPP1 ve FHL1 genleride yer alıyordu. Listemizde bulunan genler arasında X-kromozomuna haritalanan yüzün üzerinde gen bulunmaktadır. Bu genlerin X-etkinsizleştirilmesi profillerine ve MECP2 bağlayan dizi homolojisi değerlerine bağlı olarak on farklı aday gen seçtik. Ters yazılımlı polimeraz zincir reaksiyonu (RT-PCR) ile bu genlerin anlatımını incelemeye aldık. Bu çalışmaların RTT patogenezinde X-etkinsizleştirilmesinin rolü konusunda değerli bilgiler vermesi beklenmektedir.

v
TO MY PARENTS
GÜLSEREN, İSMAİL ONAT
AND
TO MY SISTER
EMEL ONAT (GÖLLÜ)
FOR THEIR LOVE AND SUPPORT

vi
ACKNOWLEDGEMENTS
First of all, I would like to express my deepest gratitude to my advisor Prof.
Tayfun Özçelik for his guidance, encouragement, patience, and continuous support
throughout my thesis work. I not only benefit from his scientific advices but also
improve my point of view on academic and social life during our conversations. It
would be an honor for me to further my academic studies with him.
It is my pleasure to express my thanks to Prof. Meral Topçu for her help in
clinical diagnosis and obtaining patient samples and their clinical data.
Moreover, I would particularly thank to Assist. Prof. Rengül Çetin Atalay and
her student Murat İskar for their effort, guidance, and help in bioinformatic studies.
Very special thanks to my family for their support and understanding through
my whole life. I know that what I am now is your creature. Having a family like you
who just couldn’t be loved more means so much.
I wish to express my thanks to Bilkent MBG family. What makes Bilkent
MBG as attractive is its cordial and sincere environment. Thank all of you, my
friends and instructors, for your warm friendships and suggestions.
I would like to thank my home-friends Emre Albay and Hüseyin Çevik (ex)
for their understanding and sensibility during my thesis study. I believe one day we
will create this country from the begining with our conversations which prolongs
each time to the mornings with the help of tea and cigarettes.
Finally, my very special thanks go to Ezgi Özcan for her love and care. What
really make you my special is simply being mine.

vii
TABLE OF CONTENTS
ABSTRACT................................................................................................................III
ÖZET..........................................................................................................................IV
DEDICATION PAGE..................................................................................................V
ACKNOWLEDGEMENTS........................................................................................VI
TABLE OF CONTENTS..........................................................................................VII
LIST OF TABLES......................................................................................................XI
LIST OF FIGURES...................................................................................................XII
ABBREVIATIONS.................................................................................................XVI
1. INTRODUCTION....................................................................................................1
1.1. Rett syndrome........................................................................................................1
1.1.1. Clinical features......................................................................................1
1.1.2. Stages of Rett syndrome.........................................................................4
1.1.3. Rett variants............................................................................................6
1.2. Molecular mechanisms of the disease....................................................................7
1.2.1. Identification of the Rett syndrome gene: MECP2.................................7
1.2.2. MECP2 organization and expression......................................................9
1.2.3. Structure and function of MECP2.........................................................10
1.2.4. Mutations and polymorphisms of MECP2 and their effects.................12
1.3. Phenotype-genotype correlations in Rett syndrome............................................13
1.4. Epigenetic mechanisms........................................................................................14
1.4.1. X-chromosome inactivation..................................................................14
1.4.2. Genomic imprinting..............................................................................15
1.4.3. Association between epigenetic mechanisms and Rett syndrome........16
1.5. Targets of MECP2 mediated repression..............................................................17

viii
1.6. Bioinformatics and algorithms.............................................................................20
1.7. Aim and strategy..................................................................................................21
2. MATERIALS AND METHODS............................................................................23
2.1. Materials..............................................................................................................23
2.1.1. Patient samples......................................................................................23
2.1.2. Cell lines and cell culture reagents.......................................................23
2.1.3. Oligonucleotides...................................................................................24
2.1.4. Chemicals and reagents.........................................................................26
2.1.5. Restriction enzymes..............................................................................27
2.1.6. Polymerase chain reaction materials.....................................................28
2.1.7. Electrophoresis marker.........................................................................29
2.1.8. Real-Time RT-PCR materials...............................................................30
2.1.9. Solutions and buffers............................................................................30
2.2. Methods................................................................................................................31
2.2.1. Mutation detection of Rett patients.......................................................31
2.2.1.1. DNA isolation from blood samples.......................................31
2.2.1.2. Polymerase chain reaction (PCR) .........................................31
2.2.1.3. Restriction enzyme digestion .................................................33
2.2.1.4. Agarose and polyacrylamide gel electrophoresis..................35
2.2.2. MECP2 target gene research via bioinformatic analysis......................35
2.2.3. Cell culture techniques..........................................................................39
2.2.3.1. Establishment of lymphoblastoid cell lines...........................39
2.2.3.2. Culturing and subculturing of lymphoblastoid cell lines.......39
2.2.3.3. Cell counting..........................................................................39
2.2.3.4. Cryopreservation of cell lines................................................40
2.2.4. Determination of X-chromosome inactivation statuses of cell lines....41
2.2.4.1. DNA isolation from cell lines................................................41
2.2.4.2. Restriction enzyme digestion.................................................41
2.2.4.3. Polymerase chain reaction (PCR)..........................................41
2.2.4.4. Polyacrylamide gel electrophosresis .....................................42

ix
2.2.5. Construction of cDNA library from the cell lines................................43
2.2.5.1. RNA isolation from cell lines................................................43
2.2.5.2. cDNA synthesis from RNAs..................................................43
2.2.5.3. Polymerase chain reaction (PCR) .........................................43
2.2.6. Real-Time RT-PCR..............................................................................44
3. RESULTS...............................................................................................................47
3.1. Mutation spectrum of MECP2 in Rett patients....................................................47
3.2. X-chromosome inactivation profile in cell lines..................................................51
3.3. Candidate MECP2 target gene determination via bioinformatic analysis...........52
3.4. Real Time RT-PCR..............................................................................................53
3.4.1 Relative expressions of AFF2 and FHL1...............................................55
3.4.2 Relative expression of MPP1.................................................................56
3.4.3 Relative expression of RS6KA3.............................................................57
3.4.4 Relative expression of RP11.13E5.1.....................................................58
3.4.5 Relative expression of OTUD5..............................................................59
3.4.6 Relative expression of FAM50A............................................................60
3.4.7 Relative expression of PGK1.................................................................61
3.4.8 Relative expressions of PTCHD1 and SLC6A8.....................................62
3.4.9 Relative expressions of TSPYL2 and HMGB3.......................................63
4. DISCUSSION.........................................................................................................65
4.1. Mutation spectrum of Rett syndrome..................................................................65
4.2. Algorithms and bioinformatics............................................................................66
4.3. De-regulated genes in MECP2 mutant cell lines.................................................67
4.4. Future perspectives..............................................................................................68
5. REFERENCES.......................................................................................................70
6. APPENDIX .............................................................................................................80

x
LIST OF TABLES
Table 1.1 Diagnostic criteria for Rett Syndrome 3
Table 1.2 Classic Rett syndrome: clinical characteristics and differential diagnosis by stage
4
Table 1.3 MECP2 mutation spectrum in Rett syndrome 12
Table 1.4 Known MeCP2 target genes 20
Table 2.1 Lymphoblastoid cell lines 23
Table 2.2 Reagents used in the cell culture experiments 24
Table 2.3 Primers for mutation detection on MECP2 24
Table 2.4 Primers for Real Time RT-PCR 25
Table 2.5 Primers for X-chromosome inactivation status determination 25
Table 2.6 Chemicals, reagents, and kits used in the experiments 26
Table 2.7 Restriction enzymes used in the mutation detection experiments 27
Table 2.8 Restriction enzymes used in the X-chromosome inactivation assay
28
Table 2.9 PCR kit reagents 29
Table 2.10 Standard solutions and buffers used in the experiments 30

xi
Table 2.11 PCR cocktail for mutation detection 32
Table 2.12 PCR cocktail for X-chromosome inactivation detection 42
Table 2.13 PCR cocktail for candidate MeCP2 target gene primers 44
Table 2.14 Real Time RT-PCR cocktail for candidate MeCP2 target gene primers
45
Table 3.1 Selected MECP2 mutations 47
Table 3.2 MECP2 mutation spectrum in Rett patients 50
Table 3.3 X-chromosome inactivation statuses of the cell lines 52
Table 3.4 Candidate MECP2 target genes determined by bioinformatic analysis
52
Table 3.5 Candidate MECP2 target genes on whole chromosomes 54
Table 3.6 Relative expressions of the candidate MECP2 target genes in cell lines
64
Table 4.1 Frequencies comparison of MECP2 mutations between the literature and our study
66

xii
LIST OF FIGURES
Figure 1.1 Girl with typical characteristics of RTT phenotype 6
Figure 1.2 Location and organization of MECP2 9
Figure 1.3 The schematic representation of MECP2 repression activity 11
Figure 1.4 Type of MECP2 mutations 13
Figure 1.5 Schematic representation of H19/IGF2 imprinting 16
Figure 1.6 MeCP2 repression of Dlx5 imprinted gene 19
Figure 2.1 Sizes of the fragments of PUC mix marker, 8 and appearance on both agarose and polyacylamide gel electrophoresis
29
Figure 2.2 PCR conditions for RTT 3F/3R primers 32
Figure 2.3 PCR conditions for RTT 4.1F/4.1R primers 32
Figure 2.4 PCR conditions for RTT 4.3F/4.1R primers 33
Figure 2.5 Schematic representation of MECP2 target gene search on X chromosome via bioinformatic analysis
37
Figure 2.6 Schematic representation of MECP2 target gene search on human genome via bioinformatic analysis
38
Figure 2.7 PCR conditions for AR RS6/7 primers 42
Figure 2.8 PCR conditions for MECP2 target genes primers 44

xiii
Figure 2.9 Real Time RT-PCR conditions for candidate MECP2 target gene primers
45
Figure 3.1 Selected MECP2 mutations 48
Figure 3.2 Mutation detection via enzymatic digestion 49
Figure 3.3 X-chromosome inactivation statuses via androgen receptor (AR) assay
51
Figure 3.4 PCR Amp/Cycle Graph for AFF2 and FHL1 55
Figure 3.5 Melt curve graph for AFF2 and FHL1 55
Figure 3.6 PCR Amp/Cycle Graph for MPP1 56
Figure 3.7 Melt curve graph for MPP1 56
Figure 3.8 PCR Amp/Cycle Graph for RPS6KA3 57
Figure 3.9 Melt curve graph for RPS6KA3 57
Figure 3.10 PCR Amp/Cycle Graph for RP11.13E5.1 58
Figure 3.11 Melt curve graph for RP11.13E5.1 58
Figure 3.12 PCR Amp/Cycle Graph for OTUD5 59
Figure 3.13 Melt curve graph for OTUD5 59
Figure 3.14 PCR Amp/Cycle Graph for FAM50A 60
Figure 3.15 Melt curve graph for FAM50A 60
Figure 3.16 PCR Amp/Cycle Graph for PGK1 61
Figure 3.17 Melt curve graph for PGK1 61
Figure 3.18 PCR Amp/Cycle Graph for PTCHD1 and SLC6A8 62

xiv
Figure 3.19 Melt curve graph for PTCHD1 and SLC6A8 62
Figure 3.20 PCR Amp/Cycle Graph for TSPYL21 and HMGB3 63
Figure 3.21 Melt curve graph for TSPYL2 and HMGB3 63
Figure 3.22 Relative expressions of the candidate MECP2 target genes in cell lines
64

xv
ABBREVIATIONS
bp base pair
BSA bovine serum albumin
Bisacrylamide N, N, methylene bis-acrylamide
C-terminus carboxy Terminus
CHIP chromatin immuno-precipitation
CpG cytosine guanine pair
CTCF CCCTC-binding factor
ddH2O deionized water
del deletion
DMR differentially methylated region
DMSO dimethyl sulphoxide
DNA deoxyribonucleic acid
DNase deoxyribonuclease
dNTP deoxynucleotide triphosphate
EDTA ethylenediaminetetraacetic acid
EtBr ethidium bromide
EtOH ethanol
FBS fetal bovine serum
FCS fetal calf serum
HCl hydrochloric acid
HDAC histone deacetylase
IRSA International Rett Syndrome Association
kb kilobase
KCl potassium chloride
LCL lymphoblastoid cell line
LOI loss of imprinting
MBD methyl binding domain

xvi
MBS MECP2 binding site
MgCl2 magnesium chloride
mM milimolar
µl microliter
mRNA messenger RNA
NaOAc sodium acetate
NaCl sodium chloride
NaOH sodium hydroxide
NLS nuclear localization signal
PAGE polyacrylamide gel electrophoresis
PBS phosphate buffered saline
PCR polymerase chain reaction
PSV preserved speech variant
RCP the red opsin
RE restriction enzyme
RTT Rett syndrome
RNA ribonucleic acid
RT-PCR reverse transcriptase PCR
SDS sodium dodecyl sulphate
TAE tric-acetic acid-EDTA
TBE tric-boric acid-EDTA
TEMED N, N, N, N-tetramethyl-1-2, diaminoethane
TRD trancriptional repression domain
UV Ultraviolet
XCI X-chromosome inactivation
Xic X-inactivation center

1
CHAPTER I. INTRODUCTION
1.1 Rett syndrome
Rett syndrome (RTT; OMIM #312750) is an X-linked neuro-developmental
disorder first defined by Dr. Andreas Rett in 1966 (Rett, 1966; Rett, 1977). It is the
second most common causes of mental retardation in females after Down syndrome
(Ellaway et al., 2001). Population genetics studies estimated the frequency of Rett
syndrome to be about 1 in 10,000 to 1 in 20,000 (Kerr et al, 1985; Hagberg et al., 1985;
Leonard et al., 1997; Miyamoto et al., 1997). It is seen almost exclusively in females
and lethal in males. Unlike females which have two X chromosomes, males have one X
and one Y chromosomes. So, there is no backup copy of X chromosomes in males that
can compensate in the presence of defective copy. Rett patients appear to develop
normally until 6–18 months of age, then gradually lose speech and purposeful hand use,
and develop microcephaly, seizures, autism-like features, ataxia, intermittent
hyperventilation and stereotypic hand movements (Armstrong, 1997).
1.1.1 Clinical features
When Andreas Rett defined Rett syndrome in two girls showing same unusual
behaviors who were seated next to each other in the waiting room in 1966, it was largely
ignored (Rett, 1966).
In 1983, Hagberg described 35 girls with a progressive encephalopathy. He

2
described RTT phenotype as rapid deterioration of high brain functions following
developmental stagnation after normal development up to the age of 7 to 18 months.
Within 1.5 years period autism, severe dementia, loss of purposeful hand use, ataxia, and
microcephaly occurs (Hagberg et al., 1983)
The diagnosis criteria for Rett syndrome is summarized in Table 1.1. At the first
3 months after birth, growth and development are normal. At the age 3 to 6 months
developmental delay and slowed head growth is noted, which is followed by autistic
behavior, regression, and stereotyped hand movements. Between the age 6 to 18 months
hypotonia (diminished muscle tone), deceleration in eye contact occurs. After the age 3
years up until the end of adolescence acquired microcephaly (decreased head
circumference) and decline in body weight is seen, and it results in a short stature
(Fitzgerald et al., 1990)

3
Table 1.1 Diagnostic criteria for Rett syndrome (Ellaway et al., 2001) Necessary Criteria
• Apparently normal prenatal and perinatal period • Apparently normal psychomotor development within the first 6 months • Normal head circumference at birth • Deceleration of head growth between ages 5 months and 4 years • Loss of acquired purposeful hand skills between ages 6 and 30 months,
temporally associated with communication dysfunction and social withdrawal • Development of severely impaired expressive and receptive language, and
presence of apparent severe psychomotor retardation • Stereotypic hand movements such as hand writing/squeezing, clapping/tapping,
mouthing and washing/rubbing automatisms appearing after purposeful hand skills are lost
• Appearance of gait apraxia and truncal apraxia/ataxia between ages 1 and 4 years • Diagnosis tentative until 2 to 5 years of age
Supportive Criteria
• Breathing dysfunction o Periodic apnea during wakefulness o Intermittent hyperventilation o Breath-holding spells o Forced expulsion of air or saliva
• Electroencephalografic abnormalities o Slow waking background and intermittent rhythmical slowing (3-5 Hz) o Epileptiform discharges, with or without clinical seizures
• Seizures • Spasticity, often with associated development of muscle wasting and dystonia • Peripheral vasomotor disturbance • Scoliosis • Growth retardation • Hypotrophic small feet
Exclusion Criteria
• Evidence of intrauterine growth retardation • Organomegaly of other signs of storage disease • Retinopathy or optic atrophy • Microcephaly at birth • Evidence of perinatally acquired brain damage • Existence of identifiable metabolic or other progressive neurological disorder • Acquired neurological disorders resulting from severe infections or head trauma

4
1.1.2 Stages of Rett syndrome
There are four stages of the RTT which are early onset (6-18 months), regressive
stage (1-3 years), relative stabilization stage (3-10 years), and late motor impairment
stage (10+ years) summarized in Table 1.2.
Table 1.2 Classic Rett syndrome: clinical characteristics and differential diagnosis
by stage (Ellaway et al., 2001)
Stage Clinical characteristics Differential diagnosis I. Early onset
stagnation
stage Onset: 6-18 months
Development stagnation/arrest Deceleration of head/brain growth Disinterest in play activity Hypotonia Nonspecific personality changes Diminished play interest Hand waving – nonspecific, episodic
Benign congenital hypotonia Prader-Willi syndrome Cerebral palsy
II. Rapid
destructive
stage Onset: 1-3 years
Rapid developmental regression with irritability Poor hand use Seizures Hand stereotypies: wringing Autistic manifestations Loss of expressive language Insomnia and irritability Self-abusive behaviour (e.g., chewing fingers) Mental deterioration Clumsy mobility/apraxia/ataxia Better preservation of gross motor functions Irregular breathing – hyperventilation
Autism Psychosis Hearing or visual disturbance Encephalitis Infantile spasms (West syndrome) Tuberous sclerosis Ornithine carbamoyl transferase deficiency Phenylketonuria Infantile neuronal ceroid lipofuscinosis

5
III. Pseudo-
stationary
stage Onset: 3-10 years
Severe mental retardation/apparent dementia Amelioration of autistic features Seizures and epileptic signs Typical hand stereotypies Prominent gait ataxia and apraxia Jerky truncal ataxia Spasticity; gross motor dysfunction Hyperventilation, breath-holding, aerophagia Apnea during wakefulness Weight loss with excellent appetite Early scoliosis, Bruxism
Spastic ataxic cerebral palsy Spinnocerebellar degeneration Leukodystrophies or other storage disorders Neuroaxonal dystrophy Lennox-Gastaut syndrome Angelmann syndrome
IV. Late motor
deterioration
stage Onset: 10+ years
Combined upper and lower motor neuron signs Progressive scoliosis, muscle wasting, and rigidity Severe multihandling syndrome Paraparesis or tetraparesis Decreasing mobility; wheelchair-bound Growth retardation, but normal puberty Staring, unfathomable gaze Emotional and eye contact “improving” Reduced seizure frequency Virtual absence of expressive and receptive language Trophic disturbance of feet Cachexia Respiratory abnormalities
Neurodegenerative disorders of unknown genes
In stage I, early onset of stagnation, there is stagnation in development and
growth. Head growth slows and hypotonia is seen. The infant begins to show less eye
contact and obtaining new skills slows down. Quite frequently these symptoms are not
sufficient to be noticed. After several months, stage II, the rapid regression stage
comes. At this stage most of the previously acquired skills such as spoken language and
purposeful hand use (apraxia), and social interaction are lost. The characteristic hand

6
movements begin to emerge and slowing of head growth draw attention. At Stage III,
plateau or pseudo-stationary stage, motor problems, and seizures develop. Autistic-
like features clearly emerge. Many girls remain in this stage for most of their lives. The
last stage, stage IV – late motor deterioration stage – is defined as reduced mobility.
Spasticity, dystonia (increased muscle tone), muscle weakness, rigidity (stiffness),
scoliosis are features of this stage. The majority of the girls with Rett syndrome survive
into adulthood.
Figure 1.1 Girl with typical characteristics of RTT phenotype (Courtesy of Rett
Syndrome Association – Turkey; Prof. Dr. Meral Topçu).
1.1.3 Rett variants
The clinical characteristics of Rett syndrome varies among patients. In general
there are two phenotypes of Rett syndrome: Typical (classic) and atypical phenotypes.
Besides, there are variants of the atypical form of Rett syndrome (Hagberg et al., 1994)

7
Early onset seizure subgroup demonstrates the 5-10% of the cases, which occur
in both classical and atypical forms (Hagberg et al., 1994).
Form fruste subgroup is characterized by dyspraxic hand functioning and milder
mental retardation but no classic Rett stereotypies. This group constitutes 25-30% of the
cases (Hagberg et al., 1994).
Congenital onset subgroup, which consists of severely affected girls, constitutes
a very small percentage. These girls have abnormal development from birth (Hagberg et
al., 1995).
Girls with Late childhood regression subgroup develop more gradually with
respect to classic RTT types (Gillberg, 1989).
Preserved speech variant (PSV) subgroup resembles classic RTT phenotype
but differs in that patients recover some degree of speech and hand use (De Bona et al.,
2000).
The male form subgroup represents the same phenotypic characteristics with
classic Rett syndrome (Christen et al., 1995; Topcu et al., 1991)
1.2 Molecular mechanisms of the disease
1.2.1 Identification of the Rett syndrome gene: MECP2
Since almost 99% percent of the RTT cases are sporadic, it was not easy to
understand the genetic basis of the disease (Schanen et al., 1997). Several hypotheses

8
were put forward including the following:
First of all, Hagberg proposed that X-linked dominant inheritance is the best
explanation of the involvement of the disease in females (Hagberg et al., 1983). This
hypothesis was confounded because most RTT cases are sporadic. However, twin
studies with Rett syndrome (Tariverdian et al., 1987; Tariverdian, 1990; Partington,
1988, Zoghbi et al. 1990) supported the hypothesis that Rett syndrome is a genetic
disorder. Chromosomal rearrangements (Benedetti et al., 1992) and both uniparental
heterodisomy and isodisomy (Webb et al., 1993) were excluded.
At the very beginning of 90s, it was suggested that the gene for Rett syndrome
should be located on the short arm of the X chromosome because of a translocation t(X;
22) (p11.22; p11) (Journel et al., 1990) and t(X;3)(p22.1;q13.31) (Zoghbi et al., 1990).
In the late 90s, following elegant exclusion mapping studies, RTT locus was mapped to
Xq28 (Schanen et al., 1997).
Soon after identification of three de novo missense mutations in 5 of 21 sporadic
Rett probands and an additional missense mutation in a family with two affected half
sisters in the MECP2 gene, revealed the long sought “RTT gene” (Amir et al., 1999).
In a more recent study, it was found that truncating frameshift and missense
mutations in the CDKL5 gene causes RTT-like phenotypes (Weaving et al., 2004; Tao et
al., 2004). Missense mutations in CDKL5 is also associated with infantile spasms and
clinical phenotypes of neurodegenerative disorders, such as Rett syndrome and
Angelman syndrome (Tao et al., 2004)

9
1.2.2 MECP2 organization and expression
MECP2 gene is located on Xq28, and spans a region of 76 kb. It lies between the
genes interleukin I receptor-associated kinase (IRAK) and the red opsin (RCP) (Quaderi
et al., 1994; D’Esposito et al., 1996) (Figure 1A) The MECP2 gene has four exons and a
CpG island which contains several potential binding sites for Sp1 (Marin et al., 1997,
Reichwald et al., 2000).
Figure 1.2 Location and organization of MECP2. A) The MECP2 gene in Xq28 is
flanked by the IRAK and RCP loci in humans. B) The genomic organization of the
MECP2 gene. It is comprised of four exons. The coding sequence for the methyl-binding
domain is indicated in blue (Dragich et al., 2000).
Expression of MECP2 gene is low during embryogenesis in mammals, but it is
widely expressed in adult tissues. The highest expression is seen in adult brain and
10
spinal cord. There are three transcripts of MECP2 gene: 1.8 kb, 7.6 kb and 10 kb. The
shortest and longest transcripts are present in most tissues and have short half-lives
(Dragich et al., 2000)
1.2.3 Structure and function of MECP2
As mentioned above, mutations in the gene encoding methyl CpG binding
protein 2 (MeCP2) is the major cause of Rett syndrome. MeCP2 functions as a
transcriptional repressor like MeCP1. Both MeCP family genes bind methylated CpG
dinucleotides (Meehan et al., 1992). Most of the cytosine residues of the CpG
dinucleotides are methylated in terms of regulation of gene expression (Ng et al., 1999;
Jones et al., 1999).
Transcriptional repression via MeCP2 is probably important in epigenetic
regulation such as imprinting (Pedone et al., 1999), X-inactivation (Jeppesen et al.,
1993), tissue specific expression (Schubeler et al., 2000), and the silencing of
endogenous retroviruses (Li et al., 1992).
MeCP2 contains two domains: MBD (Methyl Binding Domain) (Nan et al.,
1993) and TRD (Transcriptional Repression Domain) (Nan et al., 1998). Besides,
MeCP2 has two NLSs (Nuclear Localisation Signals) (Nan et al., 1996). MeCP2 binds
methylated CpG base pairs on its target genes via MBD domain (Nan et al., 1993), and
represses its target genes by interacting with a co-repressor complex containing Sin3A
and HDACs (histone deacetylases 1 and 2) via its TRD domain (Nan et al., 1998; Jones
et al., 1998).

11
Figure 1.3 The schematic representation of MECP2 repression activity. A) MeCP2
binds on methylated DNA and represses transcription by recruiting chromatin-
remodeling complex including SIN3A (transcriptional co-repressor), BRM (SWI/SNF-
related chromatin remodeling protein), and HDACs (histone deacetylases). Lack of
MeCP2 binding on DNA can be due to inactivation of MeCP2 via phosphorylation by
CDKL5 (Cyclin-dependent kinase-like 5) B) MeCP2 can also represses its target genes
independent of DNA methylation (Bienvenu et al., 2006)

12
1.2.4 Mutations and polymorphisms of MECP2 and their effects
MECP2 mutations are detected in up to 80% of classic RTT patients (Wan et al.,
1999; Bienvenu et al., 2000). More than 2000 MECP2 mutations have been reported in
females (Amir et al., 2000; Miltenberger et al., 2003; Weaving et al., 2005; Philippe et
al., 2006) but 8 C�T transitions given in Table-1.3 account for 65% of all mutations in
RTT patients (Miltenberger et al., 2003).
Table 1.3 MECP2 mutation spectrum in Rett syndrome (Weaving et al., 2003) Base Change AA Change Incidence Type of Mutation
473 C�T T158M 9.64 Missense 502 C�T R168X 9.25 Nonsense 763 C�T R255X 7.93 Nonsense 808 C�T R270X 7.70 Nonsense 880 C�T R294X 6.30 Nonsense 916 C�T R306C 5.13 Missense 397 C�T R133C 4.04 Missense 316 C�T R106W 3.73 Missense
Furthermore, there are several polymorphisms defined for MECP2 in the coding
or non-coding regions (Laccone et al., 2002). The medical significance of these
polymorphisms in hemizygous males need a clear definition.
Most mutations found in MECP2 gene lie in the MBD and TRD functional
domains. The majority of the RTT mutations are nonsense or frameshift mutations that
lie in the last exon of MECP2. In general, there are five types of MECP2 mutations: 1)
Missense mutations, 2) Nonsense mutations, 3) Frameshift mutations, 4) Large
deletions, 5) Splicing mutations, deletions, and insertions (Bienvenu et al., 2002).

13
Figure 1.4 Type of MECP2 mutations. Mutations are classified as nonsense mutations
(%44), missense mutations (%36), large deletions (%14), frameshift mutations (%8),
splicing mutations (%1) (Bienvenu et al., 2002)
1.3 Phenotype - Genotype correlations in Rett syndrome
The phenotypic range of the RTT patients led to the classification of the cases
from milder to the more severe. Form fruste and preserved speech variants are classified
as mildest cases. These patients lack all supportive criteria mentioned before and they
can also retain some communication and hand skills (Zappella, 1992).
The phenotype-genotype correlation studies indicated that the nonsense
mutations cause more severe phenotype than missense mutations (Cheadle et al., 2000).
Another study indicates that early truncating mutations are more severe than late
3641
8
14
1
0
10
20
30
40
50
%
1
Missense Mutations Nonsense Mutations
Frameshift Mutations Large Deletions
Splicing mutations

14
truncating mutations (Weaving et al., 2003). Besides that, the severity of the disorder is
likely to depend on location and type of mutation present. Rett patients with PSV do not
contain early truncating mutations; all the mutations found in these patients are either
missense or late truncating mutations (Zapella et al., 2001).
More specifically, recent studies with RTT patients demonstrated that R133C
mutation was associated with autistic presentation, R306C mutation is associated with
slower disease progression (Smeets et al., 2003), and R270X mutation is associated with
reduced survival (Jian et al., 2005).
1.4 Epigenetic mechanisms
The epigenetic mechanism of transcriptional silencing by methylation of CpG
dinucleotides has a considerable importance for development. As mentioned, MECP2
represses its target genes by binding to the methylated CpG dinucleotides that is why it
is thought that MECP2 repression has roles in epigenetic mechanisms such as X-
inactivation and genomic imprinting (Cross et al., 1995).
1.4.1 X-chromosome inactivation
X-chromosome inactivation occurs in females in order to equalize dosage
compensation between females and males. Since males have only one X-chromosome,
one of the X allele is silenced via X-inactivation mechanism in females (Plath et al.,
2002).
The X-inactivation mechanism is controlled via Xic (X-inactivation control
center). Xic contains two major genes: XIST and TSIX, which are coding non-translated
genes. TSIX gene is anti-sense mRNA transcript of XIST (Shibata et al., 2003; Takagi,

15
2003). In general terms, XIST is expressed from the inactive X and TSIX is expressed
from the active X chromosome (Lee et al., 2001).
In fact, the mechanism of X-chromosome inactivation is more complex. Once the
XIST is expressed from one allele, TSIX is expressed from other allele at the same time.
TSIX is the repressor of XIST (Lee et al., 1999). Mouse-knock out studies reveal that
TSIX disrupted mice express XIST and escape from X-inactivation (Lee et al., 1999).
Therefore repression of TSIX leads an increase in the expression of XIST. Then the XIST
mRNA coats the X allele in cis form (Clemson et al., 1996) and inactivates the allele via
some modifications such as histone modifications, partially methylation of CpG islands,
and action of trans-acting factors (Solari et al., 1974).
1.4.2 Genomic imprinting
Genomic imprinting is another epigenetic mechanism resulting in parent specific
expression such that only one allele of a gene is expressed. Paternal imprinting means
that the allele coming from father is modified to prevent transcription and maternal
imprinting means that the allele coming from mother is transcriptionally repressed. In
both conditions mono-allelic expression occurs (Surani, 1998).
DNA methylation on CpG dinucleotides is a key mechanism in imprinting
(Costello-Plass, 2001). Genomic imprinting is heritable during cell divisions and
reversible in gametogenesis (Gribnau et al., 2003).
Two well known imprinted genes are H19 and IGF2. H19 gene is paternally
imprinted and IGF2 is maternally imprinted. DMR (Differentially Methylated Region)
regulates the imprinting of both genes. DMR is methylated on the paternal chromosome
and not methylated on the maternal chromosome (Croteau et al., 2001).

16
The mechanism of imprinting in the H19/IGF2 is more complex. IGF2
expression depends on the CTCF (CCCTC-binding factor), which is a methylation
sensitive insulator (Filippova et al., 1996). CTCF has binding sites on H19 DMR and
represses the expression of IGF2 from maternal allele via DNA methylation (Schoenherr
et al., 2003).
(Figure 1.5)
Figure 1.5 Schematic representation of H19/IGF2 imprinting. White circles are non-
methylated CpGs and black circles are methylated CpGs (Salozhin et al., 2005)
Errors in imprinting causes some defects such that errors in paternal imprinting
can lead to an increase in cell growth and cell differentiation and errors in maternal
imprinting can cause opposite effects (Leighton et al., 1995)
1.4.3 Association between epigenetic regulations and Rett syndrome
Epigenetic regulations via DNA methylation are associated with gene silencing.
Transcriptional repression occurs in two ways: 1) DNA binding of transcription factors

17
on methyl-CpGs, 2) binding of proteins on methylated CpGs independent of their DNA
sequences. These proteins include MeCP2, MBD1, MBD2, MBD4, and Kaiso (Bell et
al., 2000; Hendrich et al., 1998; Prokhortchouk et al., 2001)
Defects in DNA methylation cause human diseases. Among the five genes,
MeCP2 defects cause Rett syndrome exclusively in girls because MECP2 is X-linked.
Due to the random X-chromosome inactivation, RTT patients are mosaic for the mutant
allele. Therefore, extremely skewed X-chromosome inactivation can lead to lethality or
can prevent the disease (Villard et al., 2000).
Girls with Rett syndrome usually show random X-inactivation patterns.
However, cases with skewed X-inactivation and milder phenotypes such as mild
learning disabilities or incomplete diagnostic features have been reported (Amir et al.,
2000; Wan et al., 1999).
Furthermore, Angelman syndrome, which is an imprinting disorder, shares some
clinical similarities with Rett syndrome including developmental delay, language
impairment, seizures, and stereotypic behaviors (Zoghbi, 2003). Angelman syndrome is
defined by loss of imprinting in the maternal allele of chromosome 15q11-q13 due to the
mutation of UBE3A (Lalande, 1996). Mice studies showed that Mecp2 deficiency results
in reduction of Ube3a and Gabrb3 in mice cerebrum without any change in allele
specific expression (Moretti et al., 2005). The reduction in the expression levels of these
genes in RTT patients confirmed the hypothesis (Samaco et al., 2005).
1.5 Targets of MECP2 mediated repression
Biochemical evidences revealed that MeCP2 represses its target genes by
binding to chromosomes, thus, defects in MeCP2 would result in deregulation of a large
number of genes (Willard et al., 1999).

18
Investigators attempting to identify MECP2 targets approached the subject in
two ways: Global expression profile analysis and candidate gene analysis. To identify
potential target genes regulated by MeCP2, Francke and colleagues looked for increased
transcript levels in MECP2 mutants. The differentially regulated genes identified as 49
with increased and 21 with decreased expression, leading to the conclusion that MECP2
deficiency does not correlate with global deregulation of gene expression (Traynor et al.,
2002). Subsequent experimental studies supported the proposal that MECP2 deficiency
does not lead to global alterations in transcription but instead leads to subtle changes of
gene expression (Chen et al., 2003). Esteller and colleagues unveiled novel target genes
of MECP2-mediated gene expression via cDNA microarray and ChIP analysis. They
showed over-expressed X-linked genes in which the presence of methylation was highly
likely because inactivation of one of the X chromosomes is mediated by methylation
(Ballestar et al., 2004).
On the other hand, candidate gene analysis provided a different view on target
gene search. Loss of imprinting in the maternally expressed DLX5 gene in individuals
with RTT provided a new mechanism underlying gene regulation by MECP2 (Horike et
al., 2005).

19
Figure 1.6 MeCP2 repression of Dlx5 imprinted gene. A) In wild type neurons Dlx5
is paternally imprinted via MeCP2 mediated repression by recruiting histone co-
repressor complex. B) In Mecp2-null neurons Dlx5 is biallelically expressed from both
allele resulting in increased neurotransmitter production. (Cabellero et al., 2005).
Another MeCP2 target gene identified by candidate gene approach is BDNF
(Brain-derived Neurotrophic Factor) (Chen et al., 2003; Martinowich et al., 2003).
MeCP2 deficiency in neuronal cells results in incomplete repression of Bdnf (Chen et
al., 2003).

20
Table 1.4 Known MeCP2 target genes (Bienvenu et al., 2006) Gene Species Function Tissue in which
gene is expressed Change in expression level
BDNF Mouse Survival, neuronal plasticity
Cultured neurons ≈ +2-fold
hairy2 Xenopus Neuronal differentiation
Whole embryo ≈ -2- fold
Fkbp5 Mouse Hormonal signalling Brain (74 days) +2.26-fold IGF2 Human Cell proliferation Lymphoblastoid cells +2.21-fold DLX5 Human Transcription factor Lymphoblastoid cells ≈ +2-fold Dlx5 Mouse Transcription factor Brain ≈ +2-fold Dlx6 Mouse Transcription factor Brain ≈ +2-fold Ube3a Mouse Proteolysis Brain ≈ -2-fold UBE3A Human Proteolysis Brain (2–20 years) ≈ -2-fold Sgk1 Mouse Cellular stress response Brain (74 days) +3.44-fold MPP1 Human Signal transduction Lymphoblastoid cells +3.32-fold BDNF, brain-derived neurotrophic factor; DLX, distal-less homeobox; Fkbp5, FK506-
binding protein 5; IGF2, insulin-like growth factor 2; MeCP2, methyl-CpG-binding
protein 2; MPP1, palmitoylated membrane protein 1; Sgk1, serum/glucocorticoid kinase
1; Ube3a, ubiquitin protein ligase E3A.
1.6 Bioinformatics and algorithms
Bioinformatics can be defined as handling and processing the biological
information via computers (Ouzounis et al., 2003). The birth of bioinformatic studies
can be considered as the early 70s with the first sequence alignment algorithms (Gibbs et
al., 1970). One of the most important aspects of late 70s in terms of bioinformatics was
collection of the biological information in computers for storage (Dayhoff, 1978). The
collected data on computers were made available for the first time in the 80s and
depending on that the first efficient algorithms and the theory of clustering were
developed (Ouzounis et al., 2003; Shepard et al., 1980).
In the early 90s, access to the Internet led to the formation of first databases such

21
as GenBank or MedLine and scientific tools such as BLAST (Ouzounis et al., 2003).
Nowadays, with the advances in information technology such as large capacity
storage, internet, and databases creates a revolution in bioinformatics (Soberon et al.,
2004).
The importance of analyzing sequences generated by molecular biology activities
increased dramatically importance in recent years. In the algorithms of sequence
analysis, the quantification of similarity is achieved by normalization and scoring which
relies on aligning reference homologous sequences and then comparing them with the
candidate alignments (Vinga et al., 2003). Alignment and scoring is the more important
aspects of the algorithms. In order to obtain optimal alignments dynamic programming
or HMM (hidden markov model) which maximize the score, is used. Besides that
BLAST and FASTA provides an experiment-based approach (Altschuletal et al., 1997;
Pearson et al., 1988, Vinga et al., 2003). On the other hand, scoring depends on the pair-
wise alignments. There are several scoring systems such as PAM (amino acids
substitution matrices) and BLOSUM matrices (Henikoff et al., 1992; Dayhoff et al.,
1978; Vinga et al., 2003).
MEME is a tool for discovering motifs among DNA or protein sequences which
are related to each other. The sequence which occurs repeated among these DNA or
protein sequences is called as motif. In the MEME tool motifs are extracted by a
position dependent letter-probability matrix. The DNA or protein sequences, which are
given as input in the MEME program, are called training sets. There are lots of expected
outputs requested and MEME tool automatically aligns these motifs according to best
width, description of each motif, and number of occurrence by statistical calculations.
MEME firstly puts the most statistically significant motif in the first place. The most
significant motif is the one which has the lowest E-value and the E-value is dependent
on the motifs’ log likelihood ratio, width and number of occurrences, the background

22
letter frequencies, and the size of the training set (http://meme.sdsc.edu/meme/meme-
intro.html).
1.7 Aim and strategy
Mutations in MECP2 (Xq28) was described in 1999 as a common cause of RTT.
MeCP2 is a transcriptional repressor that regulates the expression pattern of many genes.
It is not fully understood which MeCP2 targets are affected in RTT and therefore
contribute to disease pathogenesis. Investigators approached the problem in two
directions: a) Global expression profile analysis and b) Candidate gene analysis. Global
expression profile analysis revealed that several genes including those on the X-
chromosome are over-expressed in MECP2 positive Rett patients (Traynor et al., 2002;
Chen et al., 2003; Ballestar et al., 2004). Candidate gene analysis studies showed that
loss of imprinting as exemplified by DLX5 could also contribute to disease pathogenesis.
Here modifications in silent-chromatin looping in MECP2 mutants are strongly
suspected (Horike et al., 2005). We hypothesize that X-chromosome inactivation (XCI)
is an important physiological epigenetic mechanism that could be involved in Rett
pathogenesis. Random XCI patterns in peripheral blood are characteristic for RTT that is
caused by heterozygous MECP2 mutations.
All in all, we expect to observe over-expression of X-linked genes which are
transcribed exclusively from active X-chromosome and whose expression is controlled
by MeCP2. These putative genes have the potential to contribute to RTT pathogenesis
via disturbances in XCI.
We developed an algorithm which predicts potential MeCP2 targets on the X-
chromosome and the entire genome. This algorithm is based on the identification of
shared sequence motifs in known MeCP2 targets.

23
CHAPTER II. MATERIALS AND METHODS
2.1 MATERIALS
2.1.1 Patient samples
Rett syndrome patients were referred to Bilkent University, Faculty of Science,
Department of Molecular Biology and Genetics (Ankara, Turkey) by collaborating
physicians at Hacettepe University, Medical Faculty, Department of Pediatric Neurology
(Ankara, Turkey). Blood samples were collected in EDTA containing tubes, with the
consent forms signed by the parents of the patients.
2.1.2 Cell lines and cell culture reagents
Immortalized lymphoblastoid cell lines (LCLs) derived from three Rett patients
with known MECP2 mutations and one healthy individual were kindly supplied from
Prof. Dr. Alessandra Renieri (University of Siena, Department of Molecular Biology,
Medical Genetics Laboratory, Siena, Italy) (http://www.biobank.unisi.it/Elencorett.asp)
(Table 2.1)
Table 2.1 Lymphoblastoid cell lines LCL Phenotype Mutated
Gene Mutation Type
Nucleotide Change
AA Change
1195 Rett-Like MECP2 missense C316T R106V 1198 Rett-Like MECP2 missense C397T R133C 1211 Classic Rett MECP2 late truncating 1162_1187del26 - 1213 Healthy - - - -

24
Table 2.2 Reagents used in the cell culture experiments Reagents Supplier RPMI 1640 with L-Glutamine Biological industries, Haemek,
Israel Fetal Bovine Serum Sigma, St. Louis, MO, USA Penicillin/streptomycin mixture Biochrom AG, Berlin, Germany L-Glutamine Biochrom AG, Berlin, Germany Tissue Culture Flasks Costar Corp. (Cambridge, Englang) Petri dishes Costar Corp. (Cambridge, Englang) 15 ml polycarbonate centrifuge tubes with lids
Costar Corp. (Cambridge, Englang)
Cryotubes Costar Corp. (Cambridge, Englang) 0.4% Trypan Blue Solution Biochrom AG, Berlin, Germany
2.1.3 Oligonucletides
The oligonucleotides used in PCR and Real time RT-PCR were synthesized by
IONTEK (Bursa, Turkey). The list of used primer sequences are given in tables below.
Table 2.3 Primers for mutation detection on MECP2 gene Primer Sequence (5’�3’) Primer
Length Gene Name
Expected Size (bp)
RTT3F CCTGGTCTCAGTGTTCATTG 20 RTT3R CTGAGTGTATGATGGCCTGG 20
MECP2 597
RTT4.1F TTTGTCAGAGCGTTGTCACC 20 RTT4.1R CTTCCCAGGACTTTTCTCCA 20
MECP2 380
RTT4.3F GGCAGGAAGCGAAAAGCTGAG 21 RTT4.3R TGAGTGGTGGTGATGGTGGTGG 22
MECP2 366

25
Table 2.4 Primers for Real Time RT-PCR Primer Sequence (5’�3’) Primer
Length Gene Name
Expected Size (bp)
AFF2F TCGGTAAATGAGGGAGACAC 20 AFF2R TAGAGGTGATGGTGGAAATGG 21
AFF2 181
PTCHD1F AATTCCACCTTCCTGGGAGT 20 PTCHD1R GGCAGTGGTGAGAAAAGG 20
PTCHD1 165
HMGB3F GTATGAGAAGGATGTTGCTG 20 HMGB3R TCTTCATCTTCCTCTTCCAC 20
HMGB3 102
FAM50AF ATCATCCCTCACCATCACAG 20 FAM50AR GGACTCATCCTTCTCCACAG 20
FAM50A 135
RPS6KA3F AAACTCCCAAAGATTCACCTG 21 RPS6KA3R CTGTTCCTGTGTAACTGCTG 20
RPS6KA3 154
SLC6A8F TGGGAGAACAAAGTCTTGAG 20 SLC6A8R TGAAGTACACGATCTTTCCC 20
SLC6A8 151
RP11F GTTCCCTGCTCTTCTATGAC 20 RP11R CCAAAGTAGTTCACCCAGAC 20
RP11-13E5.1
157
OTUD5F AGGTACAAGCAGTCAGTTCTC 21 OTUD5R AGTCATTCAGACCAAAGGCA 20
OTUD5 128
TSPYL2F GTCAAAGCATTCCTCAACCA 20 TSPYL2R ATGTCTGAGATCCTGTACCTG 21
TSPYL2 105
FHL1F CATCACTGGGTTTGGTAAAGG 21 FHL1R GGACAATACACTTGCTCCTG 20
FHL1 165
MPP1F ACCCTGTCCCATATACAACAC 21 MPP1R CTGCCAAACTCCAAGAACTC 20
MPP1 124
PGK1F GTTCTTGAAGGACTGTGTAGG 21 PGK1R GGCTTTAACCTTGTTCCCAG 20
PGK1 145
Table 2.5 Primers for X-chromosome inactivation status determination Primer Sequence (5’�3’) Primer
Length Gene Name
Expected Size (bp)
RS-6 GTCCAAGACCTACCGAGGAG 20 RS-7 CCAGGACCAGGTAGGCTGTG 20
AR 280

26
2.1.4 Chemicals and reagents Table 2.6 Chemicals, reagents, and kits used in the experiments Reagent Supplier Used for Acrylamide Sigma, St. Louis, MO, USA Polyacrylamide Gel
Electrophoresis Agarose Basica LE, EU Agarose Gel electrophoresis Bisacrylamide Sigma, St. Louis, MO, USA Polyacrylamide Gel
Electrophoresis Bromophenol Blue Sigma, St. Louis, MO, USA Gel Electrophoresis Ethanol Merck, Frankfurt, Germany Ethidium Bromide Sigma, St. Louis, MO, USA Gel Electrophoresis Proteinase K Appligene-Oncor, USA Nucleic Acid Extraction TEMED Carlo Erba, Milano, Italy Polyacrylamide Gel
Electrophoresis RNAse ZAP Ambion, Inc., USA RNA Extraction pUC Mix Marker, 8 MBI Fermentas, Amh, NY,
USA Gel Electrophoresis
RevertAidTM cDNA Synthesis Kit
MBI Fermentas, Amh, NY, USA
cDNA Synthesis
DNeasy Tissue Kit Qiagen, Chatsworth, CA, USA DNA isolation BSA Promega, Madison, USA Enzymatic Digestion Sodium Chloride (NaCl)
Sigma, St. Louis, MO, USA PBS
Sodium Acetate Sigma, St. Louis, MO, USA PBS Tris-HCl Sigma, St. Louis, MO, USA Agarose Gel Ficoll Type 400 Sigma, St. Louis, MO, USA Agarose Gel Loading Buffer Boric Acid Sigma, St. Louis, MO, USA TBE Xylene Cyanol Sigma, St. Louis, MO, USA Agarose Gel Loading Buffer APS Carlo Erba, Milano, Italy Polyacrylamide Gel
Electrophoresis EDTA pH 8.0 Carlo Erba, Milano, Italy TAE, TBE Tris BioRad, CA, USA TBE Nucleospin® Blood kit
Macherey-Nagel Inc., PA, USA
DNA isolation

27
2.1.5 Restriction enzymes Table 2.7 Restriction enzymes used in the mutation detection experiments Enzyme Name
Supplier Recognition Site Buffer (1X)
Hsp92 II (NlaIII)
Promega, Madison, USA
5’-CATG -3’ 3’- GTAC-5’
NE Buffer 4 50 mM Potassium acetate 20 mM Tris acetate 10 mM Magnesium acetate 1 mM DTT
BspLI (NlaIV)
Fermentas, Amh, NY, USA
5’-GGN NCC-3’ 3’-CCN NGG-5’
Buffer Y+/TangoTM
66 mM Potassium acetate 33 mM Tris acetate 10 mM Magnesium acetate 0.1 mg/ml BSA
HphI Fermentas, Amh, NY, USA
5’-GGTGA(N)8 -3’ 3’-CCACT(N)7 -5’
Buffer B+ 10 mM Tris-HCl 10 mM MgCl2 0.1 mg/ml BSA
HinfI Fermentas, Amh, NY, USA
5’-G ANTC-3’ 3’-CTNA A-5’
Buffer Y+/TangoTM
66 mM Potassium acetate 33 mM Tris acetate 10 mM Magnesium acetate 0.1 mg/ml BSA
Hin61 (HhaI)
Fermentas, Amh, NY, USA
5’-G CGC-3’ 3’-CGC G-5’
Buffer Y+/TangoTM
66 mM Potassium acetate 33 mM Tris acetate 10 mM Magnesium acetate 0.1 mg/ml BSA

28
Table 2.8 Restriction enzymes used in the X-inactivation determination Enzyme Name
Supplier Recognition Site Buffer (1X)
HpaII Fermentas, Amh, NY, USA
5’-C CGG-3’ 3’-GGC C-5’
Buffer Y+/TangoTM
66 mM Potassium acetate 33 mM Tris acetate 10 mM Magnesium acetate 0.1 mg/ml BSA
RsaI Fermentas, Amh, NY, USA
5’-GT AC-3’ 3’-CA TG-5’
Buffer Y+/TangoTM 66 mM Potassium acetate 33 mM Tris acetate 10 mM Magnesium acetate 0.1 mg/ml BSA
2.1.6 Polymerase chain reaction materials
Three kinds of thermal cycler were used for PCR reactions: The GeneAmp
System 9600 (Perkin-Elmer, USA), DNA Engine Tetrat, PTC-225 (MJ Research Inc.,
MA, USA), and Mastercycler Eppendorf Scientific, Inc. (NY, USA). PCR reaction kits
were supplied from MBI Fermentas Inc. (Amherst, NY, USA). The kit contains the
following reagents
Table 2.9 PCR kit reagents Reagent Concentrations Thermus Aquaticus DNA Polymerase 5U/µl 10X PCR Buffer 100 mM Tris-HCl (ph 8.8 at 25oC)
500 mM KCl 0.8% Nonidet P40
MgCl2 Solution 25 mM dNTP mix 10 µM dCTP, dGTP, dATP, dTTP

29
2.1.7 Electrophoresis marker
PUC mix, 8 was used as DNA marker in both agarose and polyacrylamide gel
electrophoresis. It is supplied with 2 ml 6X Loading Dye solution. The sizes of the
fragments and their appearance on 1.7% agarose gel and 5% polyacrylamide gel are
given in figure 2.1.
Figure 2.1 Sizes of the fragments of PUC mix marker, 8 and appearance on both
agarose and polyacylamide gel electrophoresis (MBI Fermentas web site)

30
2.1.8 Real Time RT-PCR materials
The iCycler used for Real time RT-PCR was from BioRad (CA, USA). Real time
RT-PCR kit was obtained from Qiagen (Chatsworth, CA, USA). The kit contains
LightCycler-DNA Master SYBR Green I (Roche, Molecular Biochemicals, Germany)
reagent.
2.1.9 Solutions and buffers
Table 2.10 Standard solutions and buffers used in the experiments Reagents Concentrations 1X TBE (Tris-Boric Acid-EDTA) 89 mM Tris-base
89 mM boric acid 2 mM EDTA pH 8.3
Ethidium Bromide 10 mg/ml in water (stock solution) 30 ng/ml (working solution)
Agarose Gel Loading Buffer (6X) 15% ficoll 0.05% bromophenol 0.05% xylene cyanol
Acrylamide:Biacrylamide Stock Solution (%30)
29.5 gr acrylamide 0.44 gr bisacrylamide 100 ml with ddH2O
1X TAE (Tris-Acetic Acid-EDTA) 40 nm Tris-Acetate 2 mM EDTA pH 8.0

31
2.2 METHODS
2.2.1 Mutation detection of Rett patients
2.2.1.1 DNA isolation from blood samples
Blood samples have been reached us in tubes containing EDTA, and they were
divided into 1 ml aliquots in 1.5 ml eppendorf tubes. The DNA isolation was carried out
from 200 µl bloods via Nucleospin® Blood kit (Macherey-Nagel Inc., PA, USA)
according to manufacturer’s instructions. The remaining bloods were stored at -80oC for
later use.
The concentration of the DNA was checked by spectrophotometric reading and
horizontal 1% agarose gel electrophoresis in 1X TBE or TAE buffer. The DNA samples
were loaded on gel after mixed with 6X loading buffer. 1 µg/ml ethidium bromide was
added in agarose gel and the gel was run in electrophoresis buffer (1X TBE or 1X TAE)
at different voltages and time depending on the size of the gels. After the run, the DNA
samples were visualized with UV transilluminator.
2.2.1.2 Polymerase chain reaction (PCR)
PCR reaction carried out to amplify the 3 different fragments on 2 different
exons of MECP2: Exon1 (Primer: RTT3F and RTT3R), exon4.1 (Primers: RTT4.1F and
RTT4.1R), and exon4.3 (Primers: RTT4.3F and RTT4.3R). The cocktail and the
conditions are given in Table 2.11 and Figure 2.2, 2.3, 2.4.

32
Table 2.11 PCR cocktail for mutation detection Reaction Ingredients Volume DNA (100-150 ng) 3 µl Mg Buffer (10X) 2.5 µl MgCl2 solution (1.5 mM) 1.5 µl Forward Primer (20 pmol) 0.5 µl Reverse Primer (20 pmol) 0.5 µl dNTP (10 mM) 0.5 µl Taq Polymerase (1.25 U) 0.25 µl ddH2O 16.25 µl Total 25 µl Figure 2.2 PCR conditions for RTT 3F/3R primers Figure 2.3 PCR conditions for RTT 4.1F/4.1R primers
Denaturation 10 min at 95oC 30 sec. at 95 oC
30 sec. at 57 oC 35 cycles 40 sec. at 72 oC Extension: 10 min. at 72 oC
Denaturation 10 min at 95oC 30 sec. at 95 oC
30 sec. at 61 oC 35 cycles 40 sec. at 72 oC Extension: 10 min. at 72 oC

33
Figure 2.4 PCR conditions for RTT 4.3F/4.1R Primers 2.2.1.3 Restriction enzyme digestions
Restriction enzyme digestion of PCR products were performed in 20 µl reaction
volumes in 500 µl tubes. The amount of PCR products needed for digestion determined
by 2% agarose gel electrophoresis before the reaction. Reactions were carried out using
the conditions and materials (reaction buffer and BSA) given in the manufacturer’s
instructions. One unit of enzyme was used for each reaction.
The digestion reactions were incubated at 37oC in the water bath overnight.
Restriction enzymes, mutations, and expected product sizes after digestion are given
below.
Denaturation 10 min at 95oC 30 sec. at 95 oC
30 sec. at 63 oC 35 cycles 40 sec. at 72 oC Extension: 10 min. at 72 oC
34
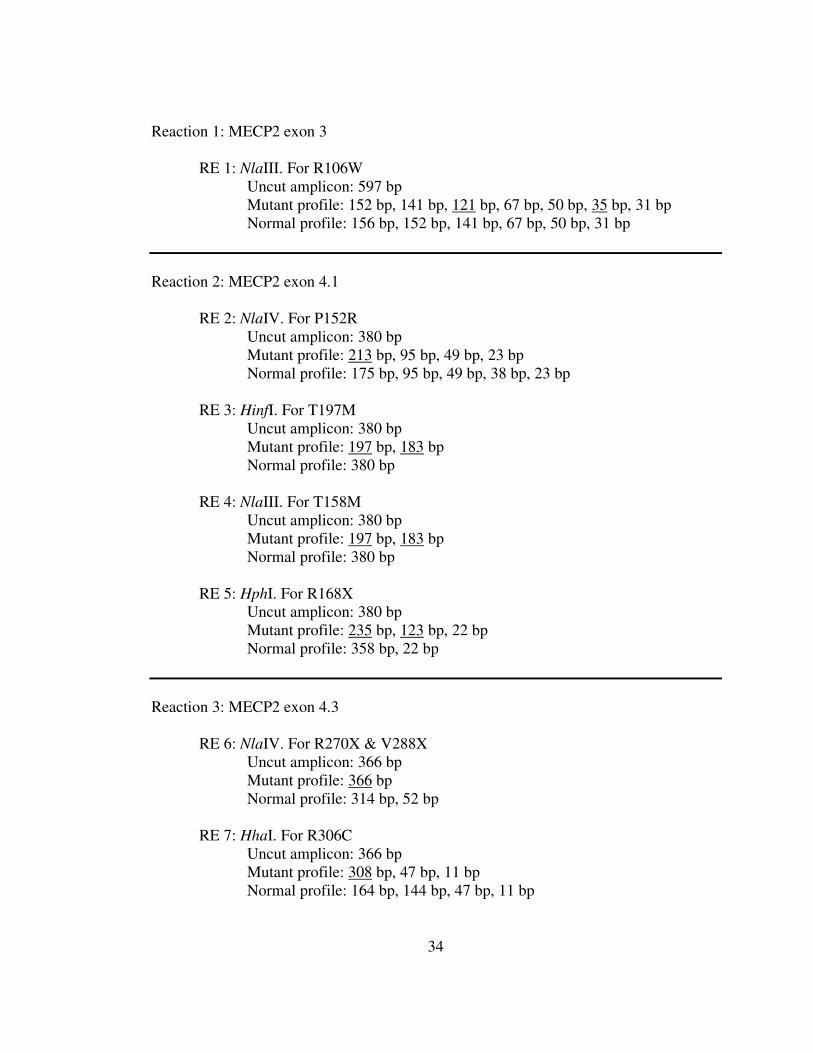
Reaction 1: MECP2 exon 3 RE 1: NlaIII. For R106W Uncut amplicon: 597 bp Mutant profile: 152 bp, 141 bp, 121 bp, 67 bp, 50 bp, 35 bp, 31 bp Normal profile: 156 bp, 152 bp, 141 bp, 67 bp, 50 bp, 31 bp
Reaction 2: MECP2 exon 4.1 RE 2: NlaIV. For P152R Uncut amplicon: 380 bp Mutant profile: 213 bp, 95 bp, 49 bp, 23 bp Normal profile: 175 bp, 95 bp, 49 bp, 38 bp, 23 bp RE 3: HinfI. For T197M Uncut amplicon: 380 bp Mutant profile: 197 bp, 183 bp Normal profile: 380 bp
RE 4: NlaIII. For T158M Uncut amplicon: 380 bp Mutant profile: 197 bp, 183 bp Normal profile: 380 bp
RE 5: HphI. For R168X Uncut amplicon: 380 bp Mutant profile: 235 bp, 123 bp, 22 bp Normal profile: 358 bp, 22 bp
Reaction 3: MECP2 exon 4.3 RE 6: NlaIV. For R270X & V288X Uncut amplicon: 366 bp Mutant profile: 366 bp Normal profile: 314 bp, 52 bp RE 7: HhaI. For R306C Uncut amplicon: 366 bp Mutant profile: 308 bp, 47 bp, 11 bp Normal profile: 164 bp, 144 bp, 47 bp, 11 bp

35
2.2.1.4 Agarose and polyacrylamide gel electrophoresis
Based on the recurrent mutation detection protocol on page 33, the digested
samples RE2 (NlaIV), RE3 (HinfI), RE4 (NlaIII), RE5 (HphI), RE6 (NlaIV), and RE7
(HhaI) were loaded in 3% agarose gel (3 g agarose, 1X TAE, and 3 µl Ethidium
Bromide). The digests were mixed with 5 µl 6X loading buffer and then loaded on the
gel. The gel was run in 1X TAE buffer at different voltages and time depending on the
size of the gels. After the run, the DNA samples were visualized with UV
transilluminator.
The digested sample RE1 (NlaIII) was loaded in 6% polyacrylamide gel (12 ml
acrylamide: bisacrylamide (29:1) solution, 6 ml 10X TBE buffer, 38 ml ddH2O, 40 µl
TEMED, and 500 µl 10X APS) in order to detect the fragments with small differences
in length. The polyacrylamide solution was poured into the vertical apparatus and the
digests was run at constant 20W for 3 hours in 1X TBE buffer. After the run the gel was
put into ethidium bromide staining solution for 10 minutes, and then into ddH2O
washing for 10 minutes. The digests were visualized with UV transilluminator.
2.2.2 MECP2 target gene search via bioinformatics analysis
Shigematsu and colleagues defined in vivo binding sequences of MECP2 by
sequencing 100 Mecp2-binding sites (MBSs). Among these binding sequences, they
mapped 33 genes located within 100 kb region on either side of each unique MBSs. 24
genes out of 33 were known to have a role in neurogenesis, muscle and skeletal
development (Horike et al., 2005).
By using the human homolog promoters (-2000, +400) of these genes (Appendix
B) we defined a motif via MEME program (http://meme.sdsc.edu/meme/intro.html)
(Figure 2.5 and Figure 2.6)

36
MEME gives all the possible motifs; therefore, in order to select the right motif,
several criteria were being taken into account:
1. The sequence of the motif should be C-G rich.
2. The length of the motif should be between 40-70 bases.
3. Motif should not be searched by one per sequence to lower blurriness. Instead,
zero or one per sequence should be selected.
4. Higher number of reference sequences is desired for a good motif.
5. E-value should be smaller.
6. Distribution of these motifs over sequences is also important such that more
compact regions would mean functional roles in transcription (Timothy et al.
1994)
Motif extracted over -2000 +400 promoters:
CCGCCCGCGCGGCCGCGGCCGCCGCCGCCGCCGCCGCCGCCGCCCCCGCCG
CCCC (55 bp, 100% C-G rich sequence)
At first, our motif was aligned over -600 +400 promoters of human X-
chromosome (1107 genes) according to the Jaligner algorithms
(http://jaligner.sourceforge.net/). Jaligner uses an open source Java implementation of
the Smith-Waterman algorithm with Gotoh's improvement for biological local pair-wise
sequence alignment using the affine gap penalty model. According to Jaligner
algorithms gap open penalty was selected as 25, and gap extension penalty was selected
as 2. Then, our motif was aligned over -600 +400 promoters of human genome (32649
reference sequences and 24017 genes) by the same procedure.

37
Figure 2.5 Schematic Representation of MECP2 target gene search on X chromosomes via bioinformatic analysis.
MECP2 target gene promoters (-2000 +400)
MEME
MECP2 target genes
Motifs
C-G rich
High frequency
All promoters (1117 genes) in X-chromosome (-600 +400)
Biological local pairwise sequence
alignment
Candidate MECP2 targeted genes
All promoters in Genome
aatgctagtcgatcgatcgtagctagctagtcgatcgtaac gcatgctagctagctagctagctagtcaggtagctagctaa GCCGCGGCCGCCGCCGCCCCCCGCCCGGCGGCCGCCGCGG
CCCCCCCCGCGGCCGCTGCCGCCGCCGCCG
gctagctagctagctagctagctagtcgatcgatcgatcga
Matrix: Nuc4.4 Gap open penalty: 25
Gap extension penalty: 2

38
Figure 2.6 Schematic representation of MECP2 target gene search on human genome via bioinformatic analysis
MECP2 target gene promoters (-2000 +400)
MEME
MECP2 target genes
Motifs
C-G rich
High frequency
All promoters (32649 refseq, 24017 genes) in
genome (-600 +400)
Biological local pairwise sequence
alignment
Candidate MECP2 targeted Genes
All promoters in Genome
aatgctagtcgatcgatcgtagctagctagtcgatcgtaac gcatgctagctagctagctagctagtcaggtagctagctaa GCCGCGGCCGCCGCCGCCCCCCGCCCGGCGGCCGCCGCGG
CCCCCCCCGCGGCCGCTGCCGCCGCCGCCG
gctagctagctagctagctagctagtcgatcgatcgatcga
Matrix: EDNAFULL Gap open penalty: 25
Gap extension penalty: 2

39
2.2.3 Cell culture techniques
2.2.3.1 Establishment of lymphoblastoid cell lines
Lymphoblastoid cell lines (LCLs) obtained from Siena University laboratories
were established by Epstein-Bar Virus transformation of peripheral blood cells from
patients with known MECP2 mutations and from healthy individuals.
2.2.3.2 Culturing and subculturing of lymphoblastoid cell lines
Human lymphoblastoid cell lines are usually cultured in RPMI-1640 medium
containing 10% fetal calf serum and they grow in suspension. EBV transformed cell
lines grow in clumps (Sigma catalog, commonly used tissue culture techniques, 1988).
Suspension LCLs were cultured into RPMI-1640 medium with L-glutamine.
Medium was supplied with 10% fetal calf serum. Before culturing the cell lines 5 ml
(1%) L-Glutamine, 5 ml (1%) penicillin/streptomycin were added into the medium. The
cells were cultured into T25 tissue culture flask with 15 ml medium. The flasks were
incubated at 37oC under 5% carbon dioxide in upright position. Lymphoblastoid cell
lines were either subcultured or refed with fresh medium in every 5 to 7 days. The
subculturing the cells the clumps should bring into single cell suspension by pipetting or
mixing.
2.2.3.3 Cell counting
The cells were counted before storage because too high or too low cell count
lowers the recovery viability. Cell counting can be used for different kinds of operations
on cell cultures such as transfections, cell fusions, cryopreservation, and subculturing.
Optimum number of cells is necessary for optimum growth and it will help to

40
standardize other techniques. (Cryomed Technical Manual for Model 700
Preprogrammed Freezing Controller, 1985)
In order to count the cells, the cell suspension centrifuged and resuspend with a
fresh medium in a small volume. The clumps were broken up by pipetting or mixing.
200 µl of cell suspension was mixed with the same amount of Trypan Blue. A cover-slip
was attached on the haemocytometer by moistening with the breath. Both sides of the
chamber were filled with the mixture. The bright cells (non-viable cells were stained
blue) were counted under microscope. The concentrations of the cells were counted by
the formula:
Number of viable cells = Mean number of viable cells counted x Dilution factor
x correction factor x Total volume of the suspension
2.2.3.4 Cryopreservation of cell lines
Cryopreservations of the cell cultures are the most reliable and reproducible way
to freeze cells. Freezing media contained 70% RPMI-1640, 20% Fetal Calf Serum, 10%
DMSO. DMSO (dimethyl sulphoxide) is used as a cryoprotectant.
One day before freezing the cells the medim of the cell suspension were
changed. The cells were centrifuged at 5000 rpm for 5 minutes and the cell pellet was
resuspend at a concentration of 4x10⁶ to 9x10⁶ cells per ml in freezing medium. 1 ml of
aliquots were added to each cyroprotective ampules. The ampules were put in +4oC
freezer for one hour, -20oC freezer for 4 hours, and then put into -80oC freezer
overnight, respectively. Lastly they were put into liquid nitrogen storage vessel for long
term preservation.

41
2.2.4 Determination of X-chromosome inactivation statuses of cell lines
2.2.4.1 DNA isolation from cell lines
Cells were counted as previously described before DNA isolation. The DNA
isolation was carried out from up to 5x10⁶ cells via DNeasy® Tissue Kit (Qiagen,
Chatsworth, CA, USA) according to manufacturer’s instructions. The isolated DNAs
were stored at +4oC for later applications.
The concentration of the DNA was checked by horizontal 2% agarose gel
electrophoresis in TAE buffer. The DNA samples were loaded on gel after mixed with
6X loading buffer. 1 µg/ml ethidium bromide was added in agarose gel and the gel was
run in 1X TAE buffer. After the run, the DNA samples were visualized with UV
transilluminator.
2.2.4.2 Restriction enzyme digestions
Restriction enzyme digestion was carried out from 1 µl genomic DNA isolated
from the cells in 20 µl reaction volumes in 500 µl tubes. Methylation specific HpaII and
RsaI enzymes were used for determination of X-inactivation statuses. The uncut control
samples were only digested with RsaI enzyme using the conditions and materials
(reaction buffer and BSA) given in the manufacturer’s instructions. One unit from each
enzyme was used for the reaction. The digestion reactions were incubated at 37oC in the
water bath overnight.
2.2.4.3 Polymerase chain reaction (PCR)
PCR reaction carried out to amplify 280 bp region in the exon1 of Androgen

42
Receptor (AR) gene (Primers: RS6 and RS7). The cocktail and the conditions are given
in Table 2.12 and Figure 2.7.
Table 2.12 PCR cocktail for X-chromosome inactivation detection Reaction Ingredients Volume DNA (100-150 ng) 3 µl Mg Buffer (10X) 2.5 µl MgCl2 solution (1.5 mM) 1 µl Forward Primer (20 pmol) 0.5 µl Reverse Primer (20 pmol) 0.5 µl dNTP (10 mM) 0.5 µl Taq Polymerase (1.25 U) 0.25 µl ddH2O 16.75 µl Total 25 µl Figure 2.7 PCR conditions for AR RS6/7 primers
2.2.4.4 Polyacrylamide gel electrophoresis
The PCR products were loaded in 10% polyacrylamide gel (20 ml acrylamide:
bisacrylamide (29: 1) solution, 6 ml 10X TBE buffer, 34 ml ddH2O, 40 µl TEMED, and
500 µl 10X APS). The polyacrylamide solution was poured into the vertical apparatus
and the digests was run at constant 20W for 5 hours in 1X TBE buffer. After the run the
Denaturation 7 min at 95oC 30 sec. at 95 oC
30 sec. at 56 oC 35 cycles 40 sec. at 72 oC Extension: 10 min. at 72 oC

43
gel was put into ethidium bromide staining solution for 10 minutes, and then into ddH2O
washing for 10 minutes. The digests were visualized by UV transilluminator.
2.2.5 Construction of cDNA library from the cell lines
2.2.5.1 RNA isolation from cell lines
Cells were counted as previously described before RNA isolation. The DNA
isolation was carried out from up to 5x10⁶ cells via NucleoSpin® RNA II Kit (Macherey
Nagel, Inc., PA, USA) according to manufacturer’s instructions. The isolated RNAs
were stored at -80oC for later applications.
The concentrations and purities of the total RNAs were checked by
spectrophotometer (Beckman Instruments Du640, Inc. CA, USA).
2.2.5.2 cDNA synthesis from RNAs
cDNA synthesis was carried out via RevertAidTM First Strand cDNA Synthesis
Kit (MBI Fermentas, Amh, NY, USA) from 2 µg RNA according to manufacturer’s
instructions.
2.2.5.3 Polymerase chain reaction (PCR)
PCR reaction carried out from cDNAs of LCL1195 to amplify AFF2 (181 bp),
PTCHD1 (165 bp), HMGB3 (102 bp), FAM50A (135 bp), RPS6KA3 (154 bp),
SLC6A8F (151 bp), RP11-13E5.1 (157 bp), OTUD5 (128 bp), TSPYL2 (105 bp), FHL1
(165 bp), MPP1 (124 bp), PGK1 (145 bp). After PCR the products were loaded in 2%
agarose gel (2 g agarose, 1X TAE, and 3 µl Ethidium Bromide) to check optimization of
the primers. The cocktail and the conditions are given in table 13 and figure 6.

44
Table 2.13 PCR cocktail for candidate MeCP2 target gene primers Reaction Ingredients Volume cDNA (100 ng) 1 µl Mg Buffer (10X) 2.5 µl MgCl2 solution (1.5 mM) 1,5 µl Forward Primer (20 pmol) 0.5 µl Reverse Primer (20 pmol) 0.5 µl dNTP (10 mM) 0.5 µl Taq Polymerase (1.25 U) 0.25 µl ddH2O 18.25 µl Total 25 µl Figure 2.8 PCR conditions for MeCP2 target gene primers
2.2.6 Real Time RT-PCR
The real time RT-PCR assays were carried out with iCycler instrument (BioRad,
CA, USA) using LightCycler-DNA Master SYBR Green I (Roche, Molecular
Biochemicals, Germany) from cDNAs of the LCLs. The cocktail and the conditions
were given in table 14 and figure 7.
Denaturation 10 min at 95oC 30 sec. at 95 oC
30 sec. at 60 oC 35 cycles 40 sec. at 72 oC Extension: 10 min. at 72 oC

45
Table 2.14 Real Time RT-PCR cocktail for candidate MeCP2 target gene primers Reaction Ingredients Volume cDNA (100 ng) 1 µl SYBR Green I Master Mix 12,5 Forward Primer (20 pmol) 0.25 µl Reverse Primer (20 pmol) 0.25 µl Nuclease free ddH2O 11 µl Mineral Oil 25 µl Total 50 µl Figure 2.9 Real Time RT-PCR conditions for candidate MeCP2 target gene primers
Cycle 1: ( 1X) Step 1: 95.0ºC for 10:00 Cycle 2: ( 50X) Step 1: 95.0ºC for 00:30 Step 2: 60.0ºC for 00:30 Step 3: 72.0ºC for 00:30 Data collection enabled. Cycle 3: ( 1X) Step 1: 72.0ºC for 10:00 Step 2: 95.0ºC for 00:30 Cycle 4: ( 1X) Step 1: 55.0ºC for 00:30 Cycle 5: ( 80X) Step 1: 55.0ºC for 00:15 Increase setpoint temperature after cycle 2 by 0.5ºC Melt curve data collection and analysis enabled. Cycle 6: ( 1X) Step 1: 4.0ºC HOLD

46
The amounts of the cDNAs of the LCLs were equalized against GAPDH. Each
of the primers was normalized by diluting cDNAs form 1 µl to 10-4 µl. Relative
expression levels were calculated according to the formula:
Expression change = n-(∆CT patient – ∆CT control)
Where; n is the normalization number (depends on the efficiency of the primers),
CT is the threshold cycle for each cell line, and ∆CT represents the difference between
the candidate MECP2 target genes and GAPDH threshold cycles.

47
CHAPTER III. RESULTS
3.1 Mutation spectrum of MECP2 in Rett patients
In order to provide a mutation spectrum of Rett patients, eight recurrent
mutations shown in Table 3.1 and Figure 3.1 were screened in 235 patients. The
mutations were selected according to their incidence rates and frequencies given in
Appendix A.
Table 3.1 Selected MECP2 mutations Exon Amino Acid
Change Nucleotide Change
Mutation Type
Domain Restriction Enzyme
3 R106W 316 C�T Missense MBD NlaIII 4.1 P152R 455 C�G Missense MBD NlaIV 4.1 T158M 473 C�T Missense MBD NlaIII 4.1 R168X 502 C�T Nonsense IDR HphI 4.1 F155S 590 C�T Missense IDR HinfI 4.3 V288X 806 delG Nonsense TRD NlaIV 4.3 R270X 808 C�T Nonsense TRD NlaIV 4.3 R306C 916 C�T Missense TRD HhaI

48
Figure 3.1 Selected MECP2 mutations
The genomic DNAs isolated from the peripheral bloods of the patients were
evaluated quantitatively by agarose gel. The PCR reactions with exon 3, exon 4.1, and
exon 4.3 primers from the genomic DNAs were analyzed by agarose gel electrophoresis.
The expected size of the PCR products were: 597 bp (exon 3 primer), 380 bp (exon 4.1
primer), and 366 bp (exon 4.3 primer).
The restriction enzyme digestion was carried out as explained in the methods
part. The digestion enzymes and expected product sizes after digestion is given in the
materials part. The pictures of the enzymatic digestions visualized by transilluminator
are given in Figure 3.2.
Exon II Exon III Exon IV
1 26 235 376 486 625 930 1461
316C→→→→T R106W
502 C→→→→T R168X
590 C→→→→T F155S
455C→→→→G P152R
473C→T T158M
808 delG V288X
916C→→→→T R306C
TRD- Transcriptional Repression Domain (104 aa)
MBD- Methyl-CpG Binding Domain (85 aa)
808 C→→→→T R270X

49
A 1 2 3 4 5 6 7 8 9 10 11 12 13 14 15 16 17 18
B 1 19 20 21 22 23 24 25 26 27 28 29 30 31 32 33 34 35 36
C 1 37 38 39 40 41
501 404 331
242 190
501 404 331
242 190
242 190 147
111

50
Figure 3.2 Mutation detection via enzymatic digestion. MECP2 mutation detections
of the RTT patients at 3% agarose gel electrophoresis (A,B) and 8% polyaccrylamide
agarose gel (C). Lane 1s: pUC mix marker, 8. 20 µl digest + 5 µl 6x loading buffer were
loaded on gels. A) Lanes 2-7: NlaIV restriction, lane 6: Patient 00-133 with P152R
mutation, lane 7: Uncut sample. Lanes 8-13: NlaIII restriction, lane 12: Patient 00-188
with T158M mutation, lane 13: Uncut digest. Lanes 14-18: HinfI restriction, no patients
with F155S mutation detected, lane 18: Uncut digest. B) Lanes 19-24: HphI restriction,
lane 23: Patient 00-381 with R168X mutation, lane 24: Uncut sample. Lanes 25-30:
NlaIV restriction, lane 29: Patient 00-104 with R270X mutation, lane 30: Uncut digest.
Lanes 31-36: Hin61 restriction, lane 35: Patient 02-28 with R306C mutation, lane 36:
Uncut digest. C) Lanes 37-41: NlaIII restriction, lane 41: Patient 99-91 with R106W
mutation.
Analysis of the eight recurrent MECP2 mutations in 235 patients revealed a
mutation n 48 patients. The frequencies of the mutations are given in Table 3.2.
Table 3.2 MECP2 mutation spectrum in Rett patients Exon Amino Acid
Change Nucleotide Change
Number observed
3 R106W 316 C�T 5/235 4.1 P152R 455 C�G 5/235 4.1 T158M 473 C�T 13/235 4.1 R168X 502 C�T 6/235 4.1 F155S 590 C�T 0/235 4.3 V288X 806 delG 4/235 4.3 R270X 808 C�T 8/235 4.3 R306C 916 C�T 7/235

51
3.2 X-chromosome inactivation profile in cell lines
In order to determine the X-chromosome inactivation patterns in the cell lines,
the androgen receptor assay was performed as explained in the methods section.
Androgen receptor assay depends on the methylation of the inactive X-chromosome.
Methylated inactive X-chromosome is resistant to methylation specific HpaII enzyme
but unmethylated X-chromosome can be digested. A highly polymorphic triplet repeat
adjacent to the methylation site in the androgen receptor provides difference in lengths
of the alleles. The concentration difference of more than 80% between the two alleles is
considered as skewed X-chromosome inactivation (Allen et al., 1992; Naumova et al.,
1996). X-inactivation statuses of the cells are given in Figure 3.3 and Table 3.3.
According to these results, whereas LCL 1198 and LCL1213 are not informative, LCL
1195 and LCL1211 display skewed X-chromosome inactivation.
1 2 3 4 5 6 7 8 9
Figure 3.3 X-chromosome inactivation statuses via AR assay. Lane 1: pUC mix
marker, 8, lane 2: HpaII digested PCR product of LCL1213, lane 3: Undigested PCR
product of LCL1213, lane 4: HpaII digested PCR product of LCL1211, lane 5:
Undigested PCR product of LCL1211, lane 6: HpaII digested PCR product of
LCL1198, lane 7: Undigested PCR product of LCL1198, lane 8: HpaII digested PCR
product of LCL1195, lane 9: Undigested PCR product of LCL1195

52
Table 3.3 X-inactivation statuses of the cell lines LCL Phenotype Nucleotide
Change AA Change
X-inactivation status
X-inactivation pattern
1195 Rett-Like C316T R106V %90.1 Skewed 1198 Rett-Like C397T R133C - Not informative 1211 Classic Rett 1162_1187del26 - %84.8 Skewed 1213 Healthy - - - Not informative 3.3 Candidate MECP2 target genes determination via bioinformatic analysis
The candidate gene analysis was carried out by bioinformatic analysis as
explained in the methods part. At first, candidate MECP2 target genes on the X-
chromosome were searched (Table 3.4 and Appendix C). On the second round,
candidate MECP2 target genes on the whole chromosomes were searched (Table 3.5 and
Appendix D).
Table 3.4 Candidate MECP2 target genes identified by bioinformatic analysis No Gene Score Localization X-Inactivation
Status 1 AFF2 242 Xq28 - 2 PTCHD1 223 Xp22.11 - 3 HMGB3 201 Xq28 0/9
4 FAM50A 185 Xq28 - 5 RPS6KA3 179 Xp22.12-p22.1 0/9 6 SLC6A8 173 Xq28 - 7 RP11-13E5.1 161 Xq25 -
8 OTUD5 152 Xp11.23 - 9 TSPYL2 150 Xp11.2 0/5 10 FHL1 150 Xq26 1/9 11 MPP1 - Xq28 0/9
12 PGK1 - Xq26 0/9

53
Table 3.5 Candidate MECP2 target genes on whole chromosomes
Symbol Chr Score Gene Name Location Go Term Kegg Title Phenotype
AFF2 X 242 AF4/FMR2 family, member 2 Xq28 brain development/learning and/or memory --- Mental retardation, X-linked, FRAXE type
BTBD2 19 228 BTB (POZ) domain containing 2 19p13.3 protein binding --- ---
PTCHD1 X 223 patched domain containing 1 Xp22.11 --- --- ---
WIZ 19 214 --- --- --- --- ---
FLJ37478 4 211 --- --- --- --- ---
PRKCA 17 209 protein kinase C, alpha 17q22-q23.2 ATP binding/calcium ion binding/cell surface receptor linked signal transduction
Wnt signaling pathway/MAPK signaling pathway/Focal adhesion
Pituitary tumor, invasive
LOC116349 5 206 --- --- --- --- ---
NOVA2 19 201 neuro-oncological ventral antigen 2 19q13.3 RNA binding/nucleus --- ---
HMGB3 X 201 high-mobility group box 3 Xq28 DNA bending activity --- ---
QKI 6 195 quaking homolog, KH domain RNA binding (mouse)
6q26-q27 nucleic acid binding --- ---
WNT4 1 192 wingless-type MMTV integration site family, member 4
1p36.23-p35.1 cell-cell signaling/development Wnt signaling pathway/Hedgehog signaling pathway
Rokitansky-Kuster-Hauser syndrome
RHOT1 17 192 ras homolog gene family, member T1
17q11.2 GTP binding --- ---
ZNF480 19 192 zinc finger protein 480 19q13.41 metal ion binding --- ---
SLC35F1 6 189 solute carrier family 35, member F1
6q22.1-q22.31 --- --- ---
NDRG3 20 189 NDRG family member 3 20q11.21-q11.23
catalytic activity/cell differentiation --- ---
RBPMS2 15 188 RNA binding protein with multiple splicing 2
15q22.31 --- --- ---
HOXC8 12 187 homeobox C8 12q13.3 development --- ---
CAMK2N2 3 186 calcium/calmodulin-dependent protein kinase II inhibitor 2
3q27.1 --- --- ---
CHD3 17 186 chromodomain helicase DNA binding protein 3
17p13.1 ATP binding/ATP-dependent DNA helicase activity
--- ---
CNOT6L 4 185 CCR4-NOT transcription complex 4q13.3 --- --- ---
FAM50A X 185 family with sequence similarity 50, member A
Xq28 nucleus --- ---

54
3.4 Real Time RT-PCR
Relative expression levels of the 12 candidate MECP2 target genes on the X-
chromosome given in Table 3.4 were determined by Real time RT-PCR as explained in
the methods part. The genes MPP1 and PGK1 were selected from the literature as a
positive control (Ballester et al., 2005).

55
3.4.1 Relative expressions of AFF2 and FHL1
Figure 3.4 PCR Amp/Cycle Graph for AFF2 and FHL1. Calculated threshold using
the maximum curvature approach is 106.4.
Figure 3.5 Melt curve graph for AFF2 and FHL1. Threshold for automatic peak
detection is set at 1.00.

56
3.4.2 Relative expression of MPP1
Figure 3.6 PCR Amp/Cycle Graph for MPP1. Calculated threshold using the
maximum curvature approach is 77.0.
Figure 3.7 Melt curve graph for MPP1. Threshold for automatic peak detection is set
at 1.00.
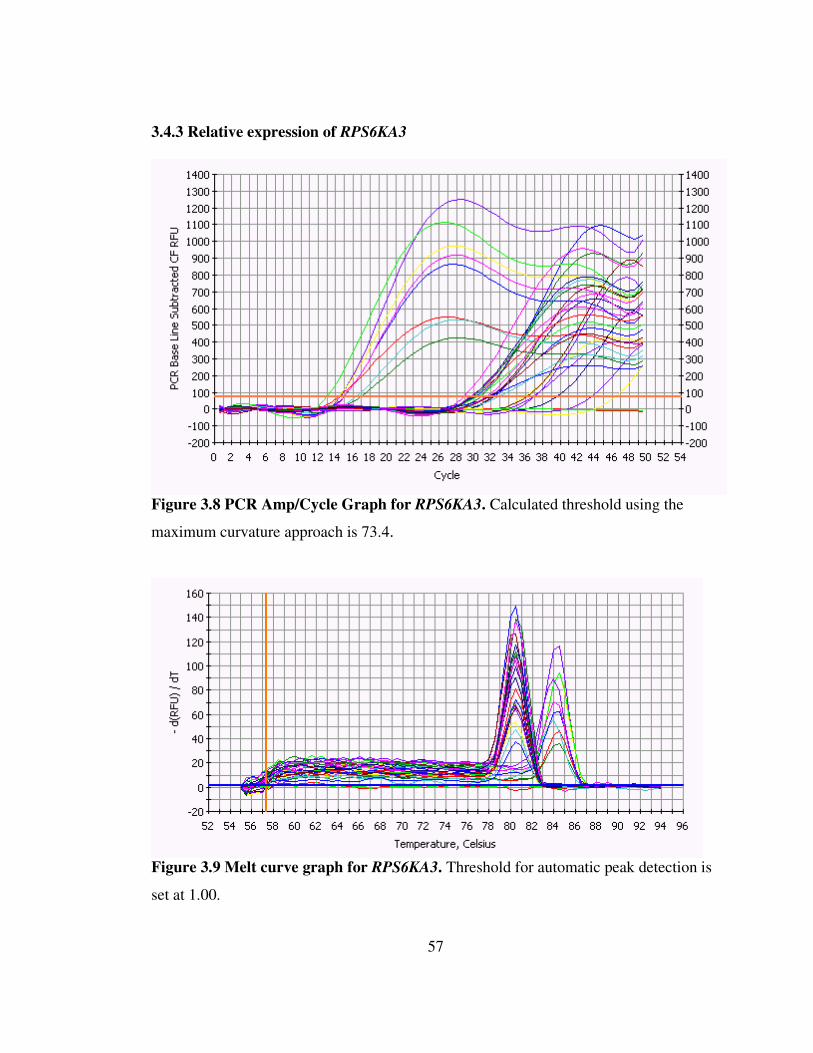
57
3.4.3 Relative expression of RPS6KA3
Figure 3.8 PCR Amp/Cycle Graph for RPS6KA3. Calculated threshold using the
maximum curvature approach is 73.4.
Figure 3.9 Melt curve graph for RPS6KA3. Threshold for automatic peak detection is
set at 1.00.

58
3.4.4 Relative expression of RP11.13E5.1
Figure 3.10 PCR Amp/Cycle Graph for RP11.13E5.1. Calculated threshold using the
maximum curvature approach is 59.2.
Figure 3.11 Melt curve graph for RP11.13E5.1. Threshold for automatic peak
detection is set at 1.00.

59
3.4.5 Relative expression of OTUD5
Figure 3.12 PCR Amp/Cycle Graph for OTUD5. Calculated threshold using the
maximum curvature approach is 71.3.
Figure 3.13 Melt curve graph for OTUD5. Threshold for automatic peak detection is
set at 1.00.

60
3.4.6 Relative expression of FAM50A
Figure 3.14 PCR Amp/Cycle Graph for FAM50A. Calculated threshold using the
maximum curvature approach is 113.3.
Figure 3.15 Melt curve graph for FAM50A. Threshold for automatic peak detection is
set at 1.00.

61
3.4.7 Relative Expression of PGK1
Figure 3.16 PCR Amp/Cycle Graph for PGK1. Calculated threshold using the
maximum curvature approach is 60.0.
Figure 3.17 Melt curve graph for PGK1. Threshold for automatic peak detection is set
at 1.00.

62
3.4.8 Relative expression of PTCHD1 and SLC6A8
Figure 3.18 PCR Amp/Cycle Graph for PTCHD1 and SLC6A8. Calculated threshold
using the maximum curvature approach is 97.8.
Figure 3.19 Melt curve graph for PTCHD1 and SLC6A8. Threshold for automatic
peak detection is set at 1.00.

63
3.4.9 Relative expressions of TSPYL2 and HMGB3
Figure 3.20 PCR Amp/Cycle Graph for TSPYL21 and HMGB3. Calculated threshold
using the maximum curvature approach is 91.8.
Figure 3.21 Melt curve graph for TSPYL2 and HMGB3. Threshold for automatic
peak detection is set at 1.00.

64
Table 3.6 Relative expressions of the candidate MECP2 target genes in cell lines
Gene Name
Normalization Relative Expression of LCL1195
Relative Expression of LCL1198
Relative Expression of LCL1211
Mean Relative Expression
AFF2 2.00 +84.45 +1.52 +13.00 +32.99 PTCHD1 2.00 - +1.32 +1.00 +1.16 HMGB3 2.00 +1.07 -7.46 +1.00 -1.79 FAM50A 2.00 -3.25 -2.00 +5.66 +0.14 RPS6KA3 1.94 -1.30 -2.37 -2.21 -1.96 SLC6A8 2.00 +3.73 +1.32 +1.23 +2.09 RP11-13E5.1
2.24 -21.43 -1.91 -2.81 -8.72
OTUD5 1.68 -1.30 -1.44 -1.11 -1.28 TSPYL2 1.80 +3.24 +2.28 +1.12 +2.21 FHL1 2.00 +21.11 +6.50 +8.57 +12.06 MPP1 1.69 +1.23 +1.88 -2.57 +0.18 PGK1 1.92 -2.48 -2.55 -1.69 -2.24
32.99
1.16
-1.79
0.14
-1.96
2.09
-8.72
-1.28
2.21
12.06
0.18
-2.24
-10
-5
0
5
10
15
20
25
30
35
CANDIDATE GENES
AFF2
PTCHD1
HMGB3
FAM50A
RSP6KA3
SLC6A8
RP11-13E5.1
OTUD5
TSPYL2
FHL1
MPP1
PGK1
Figure 3.22 Relative expressions of the candidate MECP2 target genes in cell lines

65
CHAPTER IV. DISCUSSION
Rett Syndrome is the second most common causes of mental retardation after
Down syndrome (Ellaway et al., 2001). It is seen exclusively in girls with an incidence
rate of 1 in 10,000 to 1 in 20,000 (Kerr et al, 1985; Hagberg et al., 1985; Leonard et al.,
1997; Miyamoto et al., 1997). The discovery of mutations in MECP2 as the cause of the
disease imply that Rett syndrome is the first human disease caused by a gene that is
involved in transcriptional regulation (Amir et al., 1999; Wan et al., 1999).
4.1 Mutation spectrum of Rett syndrome
As mentioned before, there are up to 2000 MECP2 mutations defined in classic
female RTT patients (Amir et al., 2000; Miltenberger et al., 2003; Weaving et al., 2005;
Philippe et al., 2006). We screened our patients for 7 frequent mutations: R106W,
P152R, T158M, R168X, V288X, R270X, R306C and 1 rare mutation: F155S.
In the present mutation detection study which is an extension of a previous thesis
conducted in our laboratory (Ayça Sayı, 2001), a total of 235 patients were analyzed for
MECP2 mutations (Table 3.2) and 48 mutations were detected with a 20% mutation
detection rate.

66
Table 4.1 Frequencies comparison of MECP2 mutations in our study. Amino Acid Change
Nucleotide Change
Number observed
T158M 473 C�T 13/235 R270X 808 C�T 8/235 R306C 916 C�T 7/235 R168X 502 C�T 6/235 R106W 316 C�T 5/235 P152R 455 C�G 5/235 V288X 806 delG 4/235 F155S 590 C�T 0/235
Table 4.1 gives the frequencies of the selected MECP2 mutations in the literature
and in our study group.
4.2 Algorithms and Bioinformatics
MeCP2 functions as a transcriptional repressor by binding directly to the
promoters of its target genes, thus, it is believed that MeCP2 has a great number of
downstream targets (Willard et al., 1999). Recent potential target gene studies provided
a different view on Rett pathogenesis and a limited number of candidate genes were
defined as listed in Table 1.4 (Traynor et al., 2002; Ballestar et al., 2004; Horike et al.,
2005; Bienvenu et al., 2006).
According to general overview, bioinformatics is the application of computer
technology to the management of the biological information. With the recent
developments in biotechnology in terms of high capability of computers to store,
interpret, and analyze large amounts of data, internet, and databases bioinformatics
become more popular in biological research (Soberon et al., 2004).

67
In order to find potential target genes of MeCP2 we derived a candidate MECP2
binding motif using an algorithm. The motif is extracted from the genes taken from the
article described in methods part via MEME program. The next step was biological local
pair-wise sequence alignment of the motif with the 1107 X-linked genes’ promoters
using the affine gap penalty model.
In general terms, sequence alignment can be explained as the definition of a
distance of number of sequences. By extracting the mismatch scores and gap open
penalties from the total match scores alignment score is obtained (Barton et al., 1993;
Gotoh et al., 1982). In our algorithm of target gene search higher scores of a gene means
biological similarity between the motif of the MECP2 and the gene on X chromosome.
We further our experiments with the first ten genes with the higher scores.
4.3 De-regulated genes in MECP2 mutant cell lines
MeCP2 has a function of regulating gene expression via transcriptional
repression by directly binding to promoters of its target genes (Meehan et al., 1992).
Therefore, MeCP2 mutations would be result in deformations in MeCP2 transcriptional
repression activity. Direct targets of MeCP2 would show increased expression in
MECP2 mutant cell lines.
We selected nine candidate genes according to the results of our bioinformatic
study with the score more than 150, and 2 genes from micro-array data that are shown to
be over-expressed in RTT cell lines (Ballester et al., 2005). Besides that, FHL1 gene
was resided both in the microarray data with an increased expression and in our
bioinformatic results with a higher score (150), suggesting that our algorithm gave a
experimental approach.

68
Our RT-PCR results demonstrated that FHL1 and AFF2 showed a 12-fold and
33-fold increase, respectively, in their expression in MECP2 mutant cell lines in
comparison with a control cell line. Besides that, SLC6A (2-fold) and TSPYL2 (2-fold)
were also over-expressed in RTT cell lines. HMGB3 (2-fold), RP11-13E5.1 (9-fold), and
PGK1 (2-fold) genes were down-regulated in RTT cell lines. Moreover, PTCHD1,
FAM50A, OTUD5, and MPP1 genes showed no significant alteration in their expression
patterns (Figures 3.4 - 3.21 and Table 3.7).
4.4 Future Perspectives
RTT phenotype is described as rapid deterioration of high brain functions
following developmental stagnation, autism, severe dementia, loss of purposeful hand
use, ataxia, and microcephaly (Hagberg et al., 1983).
According to Gene Ontology database (http://www.geneontology.org/), AFF2
gene functions in brain development, learning, and memory and FHL1 gene functions in
muscle growth and organ morphogenesis. Besides that, SLC6A8 gene takes role in
mental retardation. Therefore, these genes have a high potential to link with RTT
phenotype. Our results showed increased expression of these genes in MECP2 mutant
cell lines, that is what we expect to find, however, in order to confirm the interactions
between these genes and MECP2, further experimentation is needed.
In order to obtain a more significant data we are planning to collect RNA
samples from peripheral bloods of our Rett patients with known MECP2 mutation and
broaden our sample size. Confirming our hypothesis will provide a new perspective on
candidate gene research via identifying new X-linked target genes and therefore
contribute to disease pathogenesis via disturbances in X-chromosome inactivation.
Moreover, confirming our data will show the importance of collaboration between

69
Bioinformatics and Molecular Genetics and will provide a different view on target gene
research experiments.
As explained before, MECP2 regulation of gene expression takes role in
epigenetic mechanisms such as imprinting and X-chromosome inactivation. DLX5 gene
escapes from imprinting and biallelically expressed from both paternal and maternal
alleles in MECP2 mutant RTT patients (Horike et al., 2005). However, the role of X-
inactivation in RTT pathogenesis is still an unknown issue. We expect to show that the
increase in over-expression in the X-linked MECP2 target genes depends on the biallelic
expression from both active and inactive X-chromosome by escaping from X-
chromosome inactivation via quantitative RT-PCR and clonal analysis of cells (single
heterezygote clones) for intragenic polymorphisms. So we expect to conclude that the
biallelic expression would be one of the causes of Rett syndrome by creating dosage
problem.
Furthermore, we are planning to broaden our target gene research on whole
human chromosomes. We derived the MECP2 potential target genes data via our
bioinformatic algorithm (APPENDIX D) as the next step of our hypothesis. We are
aiming to identify the key genes contributing RTT pathogenesis on Human genome as a
future direction.

70
CHAPTER V. REFERENCES
Allen RC, Zoghbi HY, Moseley AB, Rosenblatt HM, Belmont JW (1992). “Methylation
of HpaII and HhaI sites near the polymorphic CAG repeat in the human androgen-receptor gene correlates with X chromosome inactivation.” Am J Hum
Genet. 51: 1229-39. Altschul SF, Madden TL, Schaffer AA, Zhang J, Zhang Z, Miller W and Lipman DJ
(1997). “Gapped BLAST and PSI-BLAST: a new generation of protein data base search programs.” Nucleic Acids Res. 25: 3389–3402.
Amir RE, Van den Veyver IB, Wan M, Tran CQ, Francke U, Zoghbi HY (1999). “Rett
syndrome is caused by mutations in X-linked MECP2, encoding methyl-CpG-binding protein 2.” Nature Genet. 23: 185-188.
Amir RE, Van den Veyver IB, Schultz R, Malicki DM, Tran CQ, Dahle EJ, Philippi A, Timar L, Percy AK, Motil KJ, Lichtarge O, Smith EO, Glaze DG, Zoghbi HY.(2000). “Influence of mutation type and X chromosome inactivation on Rett syndrome phenotypes.” Ann Neurol. 47: 670-9.
Amir RE, Zoghbi HY (2000). “Rett syndrome: methyl-CpG-binding protein 2 mutations and phenotype-genotype correlations.” Am J Med Genet. 97: 147-52.
Armstrong DD (1997). Review of Rett syndrome. J Neuropathol Exp Neurol. 56: 843-9 Ayça Sayı (August, 2001). “Analysis of MECP2 gene mutations in Rett Syndrome
patients.” Thesis submitted to Bilkent University. Ballestar E, Ropero S, Alaminos M, Armstrong J, Setien F, Agrelo R, Fraga MF,
Herranz M, Avila S, Pineda M, Monros E, Esteller M (2005). “The impact of MECP2 mutations in the expression patterns of Rett syndrome patients.” Hum
Genet. 116: 91-104. Barton GJ (1993). “An efficient algorithm to locate all locally optimal alignments
between two sequences allowing for gaps.” Comput Appl Biosci. 9: 729-34.

71
Bell AC and Felsenfeld G (2000). “Methylation of a CTCF-dependent boundary controls imprinted expression of the Igf2 gene.” Nature 405: 482–485.
Benedetti L, Munnich A, Melki J, Tardieu M, Turleau C (1992). “Parental origin of the
X chromosomes in Rett syndrome.” Am. J. Med. Genet. 44: 121-122.
Bienvenu T, Carrie A, de Roux N, Vinet MC, Jonveaux P, Couvert P, Villard L, Arzimanoglou A, Beldjord C, Fontes M (2000). “MECP2 mutations account for most cases of typical forms of Rett syndrome.” Hum. Mol. Genet. 9: 1377–1384.
Bienvenu T, Villard L, De Roux N, Bourdon V, Fontes M, Beldjord C, Tardieu M, Jonveaux P, Chelly J (2002). “French Consortium for MECP2 Gene Analysis. Spectrum of MECP2 mutations in Rett syndrome.” Genet Test. 6: 1-6.
Bienvenu T, Chelly J (2006). “Molecular genetics of Rett syndrome: when DNA methylation goes unrecognized.” Nat Rev Genet. 7: 415-26.
Caballero IM, Hendrich B (2005). “MeCP2 in neurons: closing in on the causes of Rett
syndrome.” Hum Mol Genet. 14: 2089. Cheadle JP, Gill H, Fleming N, Maynard J, Kerr A, Leonard H, Krawczak M, Cooper
DN, Lynch S, Thomas (2000). “Long-read sequence analysis of the MECP2 gene in Rett syndrome patients: correlation of disease severity with mutation type and location.” Hum. Mol. Genet. 9: 1119–1129
Chen WG, Chang Q, Lin Y, Meissner A, West AE, Griffith EC, Jaenisch R, Greenberg
ME (2003). “Derepression of BDNF transcription involves calcium-dependent phosphorylation of MeCP2.” Science 302: 885-9.
Clemson CM, McNeil JA, Willard HF and Lawrence JB (1996). “XIST RNA paints the
inactive X chromosome at interphase: evidence for a novel RNA involved in nuclear/chromosome structure.” J. Cell Biol. 132: 259–275.
Costello JF & Plass C (2001). “Methylation matters.” Journal of Medical Genetics 38:
285–303.
Cross SH, Bird AP (1995). “CpG islands and genes.” Curr Opin Genet Dev. 5: 309-14.
Croteau, S., Polychronakos, C., and Naumova, A. K. (2001) Genesis, 31, 11-16.
Dayhoff MO (1978). “Atlas of Protein Sequence and Structure.” National Biomedical
Research Foundation Vol. 4, Supp l.3.

72
De Bona C, Zappella M, Hayek G, Meloni I, Vitelli F, Bruttini M, Cusano R, Loffredo
P, Longo I, Renieri A (2000). “Preserved speech variant is allelic of classic Rett syndrome.” Europ. J. Hum. Genet. 8: 325-330.
D’Esposito M, Quaderi NA, Ciccodicola A, Bruni P, Esposito T, D’Urso M and Brown SD (1996). “Isolation, physical mapping and northern analysis of the X-linked human gene encoding methyl CpG-binding protein, MECP2.” Mamm. Genome 7: 533–535.
Dragich J, Houwink-Manville I, Schanen C (2000). “Rett syndrome: a surprising result
of mutation in MECP2.” Hum Mol Genet. 9: 2365-75. Ellaway C, Christodoulou J (2001). “Rett syndrome: clinical characteristics and recent
genetic advances.” Disabil Rehabil. 23: 98-106. Filippova GN, Fagerlie S, Klenova EM, Myers C, Dehner Y, Goodwin G, Neiman PE,
Collins SJ, and Lobanenkov VV (1996). “An exceptionally conserved transcriptional repressor, CTCF, employs different combinations of zinc fingers to bind diverged promoter sequences of avian and mammalian c-myc oncogenes.” Mol. Cell Biol. 16: 2802-2813.
FitzGerald PM, Jankovic J, Percy AK (1990). “Rett syndrome and associated movement
disorders.” Mov Disord. 5: 195-202. Gibbs AJ, McIntyre GA (1970). “The diagram, a method for comparing sequences. Its
use with amino acid and nucleotide sequences.” Eur J Biochem. 16: 1-11. Gillberg C (1989). “The borderland of autism and Rett syndrome: five case histories to
highlight diagnostic difficulties.” J Autism Dev Disord. 19: 545-59. Gribnau J, Hochedlinger K, Hata K, Li E, and Jaenisch R (2003). Genes Dev. 17: 759-
773. Gotoh O (1982). “An Improved Algorithm for Matching Biological Sequences.” J. Mol.
Biol. 162: 705-708. Hagberg B, Aicardi J, Dias K, Ramos O (1983). “A progressive syndrome of autism,
dementia, ataxia, and loss of purposeful hand use in girls: Rett's syndrome: report of 35 cases.” Ann. Neurol. 14: 471-479.
Hagberg B (1985). “Rett syndrome: Swedish approach to analysis of prevalence and cause.” Brain Dev. 7: 277-280.

73
Hagberg BA, Skjeldal OH (1994). “Rett variants: a suggested model for inclusion criteria.” Pediatr Neurol 11: 5-11.
Hagberg B (1995). “Rett syndrome: clinical peculiarities and biological mysteries.” Acta
Paediatr. 84: 971-976.
Christen HJ, Hanefeld F (1998). “Male Rett variant.” Neuropediatrics 26: 81-82.
Hendrich B and Bird A (1998). “Identification and characterization of a family of mammalian methyl-CpG binding proteins.” Mol. Cell. Biol. 18: 6538–6547.
Henikoff S and Henikoff JG (1992). “Amino acid substitution matrices from protein blocks.” Proc. Natl Acad. Sci. 89: 10915–10919.
Horike S, Cai S, Miyano M, Cheng JF, Kohwi-Shigematsu T (2005). “Loss of silent-
chromatin looping and impaired imprinting of DLX5 in Rett syndrome.” Nat
Genet. 37: 31-40.
Jeppesen P and Turner BM (1993). “The inactive X chromosome in female mammals is distinguished by a lack of histone H4 acetylation, a cytogenetic marker for gene expression.” Cell 74: 281–289.
Jian L, Archer HL, Ravine D, Kerr A, de Klerk N, Christodoulou J, Bailey MES, Laurvick C, Leonard H (2005). “p.R270X MECP2 mutation and mortality in Rett syndrome.” Europ. J. Hum. Genet. 13: 1235-1238.
Jones PL, Veenstra GJ, Wade PA, Vermaak D, Kass SU, Landsberger N, Strouboulis J
and Wolffe AP (1998). “Methylated DNA and MeCP2 recruit histone deacetylase to repress transcription.” Nature Genet. 19: 187–191.
Jones PL and Wolffe AP (1999). “Relationships between chromatin organization and DNA methylation in determining gene expression.” Semin. Cancer Biol. 9: 339–347.
Journel H, Melki J, Turleau C, Munnich A, de Grouchy J (1990). “Rett phenotype with X/autosome translocation: possible mapping to the short arm of chromosome X.” Am. J. Med. Genet. 35: 142-147.
Kerr AM, Stephenson JB (1985). “Rett's syndrome in the west of Scotland.” Br Med J.
291: 579-82.

74
Kriaucionis S, Bird A (2003). “DNA methylation and Rett syndrome.” Hum Mol Genet. 12: 221-7.
Laccone F, Zoll B, Huppke P, Hanefeld F, Pepinski W, Trappe R (2002). “MECP2 gene nucleotide changes and their pathogenicity in males: proceed with caution.” J
Med Genet. 39: 586-8. Lalande M (1996). “Parental imprinting and human disease.” Annu. Rev. Genet. 30:
173–195. Lee JT, Davidow LS and Warshawsky D (1999). “Tsix, a gene antisense to Xist at the X-
inactivation centre.” Nat. Genet. 21: 400–404. Lee JT and Lu N (1999). “Targeted mutagenesis of Tsix leads to nonrandom X
inactivation.” Cell 99: 47–57. Lee JT (2000). “Disruption of imprinted X inactivation by parent-of-origin effects at
Tsix.” Cell 103: 17–27.
Leighton PA, Ingram RS, Eggenschwiler J, Efstratiadis A and Tilghman SM (1995). Nature 375: 34-39.
Leonard H, Bower C, English D (1997). “The prevalence and incidence of Rett syndrome in Australia.” Eur Child Adolesc Psychiatry. 6: 8-10.
Li E, Bestor TH and Jaenisch R (1992). “Targeted mutation of the DNA methyl-transferase gene results in embryonic lethality.” Cell 69: 915–926.
Lyon MF (1961). “ Gene action in the X-chromosome of the mouse.” Nature 190: 372–373.
Lyon MF (1968). “Chromosomal and subchromosomal inactivation.” Ann Rev Genet. 2:
31–52. Marin M, Karis A, Visser P, Grosveld F and Philipsen S (1997). “Transcription factor
Sp1 is essential for early embryonic development but dispensable for cell growth and differentiation.” Cell 89: 619–628.
Martinowich K, Hattori D, Wu H, Fouse S, He F, Hu Y, Fan G and Sun YE (2003).
“DNA methylation-related chromatin remodeling in activity-dependent BDNF gene regulation.” Science 302: 890–893.

75
Meehan RR, Lewis JD and Bird AP (1992). “Characterization of MeCP2, a vertebrate DNA binding protein with affinity for methylated DNA.” Nucleic Acids Res. 20: 5085–5092.
Miltenberger-Miltenyi G, Laccone F (2003). “Mutations and polymorphisms in the human methyl CpG-binding protein MECP2.” Hum Mutat. 22: 107-15.
Miyamoto A, Yamamoto M, Takahashi S, Oki J (1997). “Classical Rett syndrome in sisters: variability of clinical expression.” Brain Dev.19: 492-494.
Moretti P, Bouwknecht JA, Teague R, Paylor R and Zoghbi HY (2005). “Abnormalities of social interactions and home cage behavior in a mouse model of Rett syndrome.” Hum. Mol. Genet. 14: 205–220.
Nan X, Meehan RR and Bird A (1993). “Dissection of the methyl-CpG binding domain from the chromosomal protein MeCP2.” Nucleic Acids Res. 21: 4886–4892.
Nan X, Ng HH, Johnson CA, Laherty CD, Turner BM, Eisenman RN and Bird A (1998). “Transcriptional repression by the methyl-CpG-binding protein MeCP2 involves a histone deacetylase complex.” Nature 393: 386–389.
Nan X, Tate P, Li E and Bird A (1996). “DNA methylation specifies chromosomal localization of MeCP2.” Mol. Cell. Biol. 16: 414–421.
Nance WE (1964). “ Genetic tests with a sex-linked marker: glucose-6-phosphate dehydrogenase.” Cold Spring Harbor Symp Quant Biol 29: 415–424.
Naumova AK, Plenge RM, Bird LM, Leppert M, Morgan K, Willard HF, Sapienza C
(1996). “Heritability of X chromosome--inactivation phenotype in a large family.” Am J Hum Genet. 58: 1111-9.
Ng HH and Bird A (1999). “DNA methylation and chromatin modification.” Curr.
Opin. Genet. Dev. 9: 158–163.
Nyhan WL, Bakay B, Connor JD, Marks JF, Keele DK (1970). “Hemizygous expression of glucose-6-phosphate dehydrogenase in erythrocytes of heterozygotes for the Lesch-Nyhan syndrome.” Proc Natl Acad Sci 65: 214–218.
Ouzounis CA, Valencia A (2003). “Early bioinformatics: the birth of a discipline--a
personal view.” Bioinformatics 19: 2176-90. Partington MW (1988). “Rett syndrome in monozygotic twins.” Am. J. Med. Genet. 29:
633-637.

76
Pearson WR and Lipman DJ (1988). “Improved tools for biological sequence comparison.” Proc. Natl Acad. Sci. 85: 2444–2448.
Pedone PV, Pikaart MJ, Cerrato F, Vernucci M, Ungaro P, Bruni CB and Riccio A (1999). “Role of histone acetylation and DNA methylation in the maintenance of the imprinted expression of the H19 and Igf2 genes.” FEBS Lett. 458: 45–50.
Philippe C, Villard L, De Roux N, Raynaud M, Bonnefond JP, Pasquier L, Lesca G, Mancini J, Jonveaux P, Moncla A, Chelly J, Bienvenu T (2006). “Spectrum and distribution of MECP2 mutations in 424 Rett syndrome patients: a molecular update.” Eur J Med Genet. 49: 9-18.
Plath K, Mlynarczyk-Evans S, Nusinow DA and Panning B (2002). Annu. Rev. Genet.
36: 233-278. Prokhortchouk A, Hendrich B, Jorgensen H, Ruzov A, Wilm M, Georgiev G, Bird A
and Prokhortchouk E (2001). “The p120 catenin partner Kaiso is a DNA methylation-dependent transcriptional repressor.” Genes Dev. 15: 1613–1618.
Quaderi NA, Meehan RR, Tate PH, Cross SH, Bird AP, Chatterjee A, Herman GE and Brown SD (1994). “Genetic and physical mapping of a gene encoding a methyl CpG binding protein, Mecp2, to the mouse X chromosome.” Genomics 22:648–651.
Reichwald K, Thiesen J, Wiehe T, Weitzel J, Poustka WA, Rosenthal A, Platzer M, Strätling WH and Kioschis P (2000). “Comparative sequence analysis of the MECP2-locus in human and mouse reveals new transcribed regions.” Mamm.
Genome 11: 182–190. Rett A (1977). “Cerebral atrophy associated with hyperammonaemia.” In: Vinken PJ,
Bruyn GW (1977). “Handbook of Clinical Neurology. Amsterdam: North Holland” 29: 305-329.
Rett A (1966). “Ueber ein eigenartiges hirnatrophisches Syndrom bei
Hyperammoniamie in Kindesalter.” Wien. Med. Wschr. 116: 723-738.
Salozhin SV, Prokhorchuk EB, Georgiev GP (2005). “Methylation of DNA--one of the major epigenetic markers.” Biochemistry 70: 525-32.
Samaco RC, Hogart A, LaSalle JM (2005). “Epigenetic overlap in autism-spectrum neurodevelopmental disorders: MECP2 deficiency causes reduced expression of UBE3A and GABRB3.” Hum Mol Genet. 14: 483-92.

77
Schanen NC, Dahle EJR, Capozzoli F, Holm VA, Zoghbi HY, Francke U (1977). “A new Rett syndrome family consistent with X-linked inheritance expands the X chromosome exclusion map.” Am. J. Hum. Genet. 61: 634-647.
Schanen NC, Kurczynski TW, Brunnelle D, Woodcock MM, Dure LS, Percy AK
(1998). “Neonatal encephalopathy in two boys in families with recurrent Rett syndrome.” J. Child Neurol. 13: 229-231.
Schoenherr CJ, Levorse JM, and Tilghman SM (2003). Nat. Genet. 33: 66-69.
Schubeler D, Francastel C, Cimbora DM, Reik A, Martin DIK and Groudine M (2000). “Nuclear localization and histone acetylation: a pathway for chromatin opening and transcriptional activation of the human beta-globin locus.” Genes Dev. 14: 940–950.
Shepard RN (1980). “Multidimensional scaling, tree-fitting and clustering.” Science 210: 390–398.
Shibata S and Lee JT (2003). “Characterization and quantitation of differential Tsix
transcripts: implications for Tsix function.” Hum. Mol. Genet., 12, 125-136. Sirianni N, Naidu S, Pereira J, Pillotto RF, Hoffman EP (1998). “Rett syndrome:
confirmation of X-linked dominant inheritance, and localization of the gene to Xq28.” Am. J. Hum. Genet. 63: 1552-1558.
Smeets E, Schollen E, Moog, U, Matthijs G, Herbergs J, Smeets H, Curfs L, Schrander-
Stumpel C, Fryns JP (2003). “Rett syndrome in adolescent and adult females: clinical and molecular genetic findings.” Am. J. Med. Genet. 122A: 227-233.
Soberon J, Peterson AT (2004). “Biodiversity informatics: managing and applying
primary biodiversity data.” Philos Trans R Soc Lond B Biol Sci. 359: 689-98. Solari A (1974). “The behaviour of the XY pair in mammals.” Rev. Cytol. 38: 273–317. Surani MA (1998). “Imprinting and the initiation of gene silencing in the germ line.”
Cell 93: 309–312. Takagi N (2003). “Imprinted X-chromosome inactivation: enlightenment from embryos
in vivo” Semin. Cell Dev. Biol. 14: 319-329.
78
Tao J, Van Esch H, Hagedorn-Greiwe M, Hoffmann K, Moser B, Raynaud M, Sperner J, Fryns JP, Schwinger E, Gecz J, Ropers HH, Kalscheuer VM (2004). “Mutations in the X-linked cyclin-dependent kinase-like 5 (CDKL5/STK9) gene are associated with severe neurodevelopmental retardation.” Am. J. Hum. Genet. 75: 1149-1154.
Tariverdian G, Kantner G, Vogel F (1087). “A monozygotic twin pair with Rett
syndrome.” Hum. Genet. 75: 88-90. Tariverdian G (1990). “Follow-up of monozygotic twins concordant for the Rett
syndrome.” Brain Dev. 12: 125-127. Timothy L, Bailey and Charles E (1994). "Fitting a mixture model by expectation
maximization to discover motifs in biopolymers" Proceedings of the Second
International Conference on Intelligent Systems for Molecular Biology pp. 28-36, AAAI Press, Menlo Park, California.
Traynor J, Agarwal P, Lazzeroni L, Francke U (2002). “Gene expression patterns vary in
clonal cell cultures from Rett syndrome females with eight different MECP2 mutations.” BMC Med Genet. 3: 12.
Topçu M, Topaloglu H, Renda Y, Berker M, Turanli G (1991). “The Rett syndrome in males.” Brain Dev. 13: 62.
Villard L, Kpebe A, Cardoso C, Chelly PJ, Tardieu PM and Fontes M (2000). “Two affected boys in a Rett syndrome family: clinical and molecular findings.” Neurology 55: 1188–1193
Vinga S, Almeida J (2003). “Alignment-free sequence comparison-a review.” Bioinformatics 19: 513-23.
Wan M, Lee SS, Zhang X, Houwink-Manville I, Song HR, Amir RE, Budden S, Naidu
S, Pereira JL, Lo IF, Zoghbi HY, Schanen NC, Francke U (1999). “Rett syndrome and beyond: recurrent spontaneous and familial MECP2 mutations at CpG hotspots.” Am J Hum Genet. 65: 1520-9.
Weaving LS, Williamson SL, Bennetts B, Davis M, Ellaway CJ, Leonard H, Thong MK,
Delatycki M, Thompson EM, Laing N, Christodoulou J (2003). “Effects of MECP2 mutation type, location and X-inactivation in modulating Rett syndrome phenotype.” Am J Med Genet A. 118: 103-14.

79
Weaving LS, Christodoulou J, Williamson SL, Friend KL, McKenzie OLD, Archer H, Evans J, Clarke A, Pelka GJ, Tam PPL, Watson C, Lahooti H, Ellaway CJ, Bennetts B, Leonard H, Gecz J (2004). “Mutations of CDKL5 cause a severe neurodevelopmental disorder with infantile spasms and mental retardation.” Am.
J. Hum. Genet. 75: 1079-93. Weaving LS, Ellaway CJ, Gecz J, Christodoulou J (2005). “Rett syndrome: clinical
review and genetic update.” J Med Genet. 42: 1-7. Webb T, Watkiss E, Woods CG (1993). “Neither uniparental disomy nor skewed X-
inactivation explains Rett syndrome.” Clin. Genet. 44: 236-240. Willard HF and Hendrich BD (1999). “Breaking the silence in Rett syndrome.” Nat.
Genet. 23: 127–128. Zappella M (1992). “The Rett girls with preserved speech.” .Brain Dev. 14: 98-101. Zappella M, Meloni I, Longo I, Hayek G, Renieri A (2001). “Preserved speech variants
of the Rett syndrome: molecular and clinical analysis.” Am. J. Med. Genet. 104: 14-22.
Zoghbi HY, Ledbetter DH, Schultz R, Percy AK, Glaze DG (1990). “A de novo X;3
translocation in Rett syndrome.” Am. J. Med. Genet. 35: 148-151. Zoghbi HY, Percy AK, Schultz RJ, Fill C (1990). “Patterns of X chromosome
inactivation in the Rett syndrome.” Brain Dev. 12: 131-135. Zoghbi HY (2003). “Postnatal neurodevelopmental disorders: meeting at the synapse?”
Science 302: 826–830.
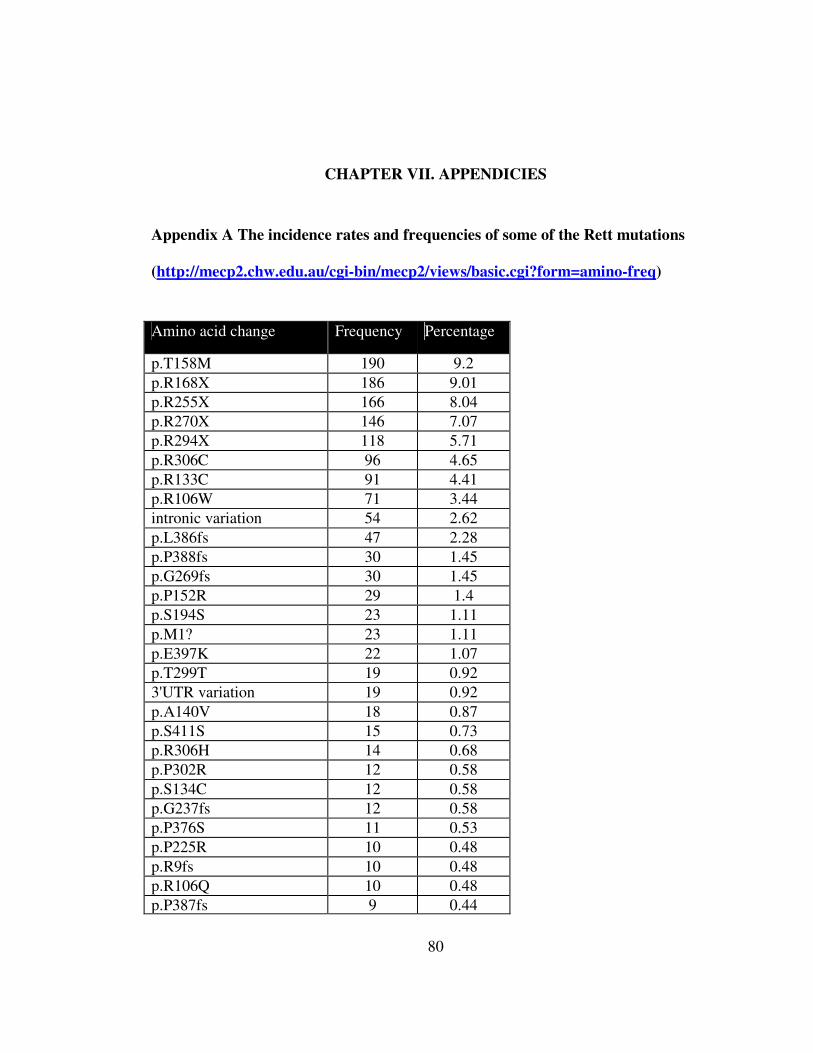
80
CHAPTER VII. APPENDICIES
Appendix A The incidence rates and frequencies of some of the Rett mutations
(http://mecp2.chw.edu.au/cgi-bin/mecp2/views/basic.cgi?form=amino-freq)
Amino acid change Frequency Percentage
p.T158M 190 9.2 p.R168X 186 9.01 p.R255X 166 8.04 p.R270X 146 7.07 p.R294X 118 5.71 p.R306C 96 4.65 p.R133C 91 4.41 p.R106W 71 3.44 intronic variation 54 2.62 p.L386fs 47 2.28 p.P388fs 30 1.45 p.G269fs 30 1.45 p.P152R 29 1.4 p.S194S 23 1.11 p.M1? 23 1.11 p.E397K 22 1.07 p.T299T 19 0.92 3'UTR variation 19 0.92 p.A140V 18 0.87 p.S411S 15 0.73 p.R306H 14 0.68 p.P302R 12 0.58 p.S134C 12 0.58 p.G237fs 12 0.58 p.P376S 11 0.53 p.P225R 10 0.48 p.R9fs 10 0.48 p.R106Q 10 0.48 p.P387fs 9 0.44

81
p.Y141X 9 0.44 p.K345K 8 0.39 p.R270fs 7 0.34 p.G428S 7 0.34 p.T197M 7 0.34 p.T203M 7 0.34 p.A201V 7 0.34 p.S359P 6 0.29 p.P251fs 6 0.29 p.P384fs 6 0.29 p.P385fs 6 0.29 p.A439T 6 0.29 p.A259A 5 0.24 p.F142F 5 0.24 p.P387_M466del80 5 0.24 p.(N126+S486) 5 0.24 p.A444T 5 0.24 p.P402L 5 0.24 p.R250fs 5 0.24 p.G232fs 5 0.24 p.G252fs 4 0.19 p.P361A 4 0.19 p.H366fs 4 0.19 p.P390_P391delPP 4 0.19 p.Q406X 4 0.19 p.P272L 4 0.19 p.D156E 4 0.19 5'UTR variation 4 0.19 p.S204X 4 0.19 p.S70S 4 0.19 p.L386fsX403 4 0.19 p.R133H 4 0.19 p.T240T 4 0.19 p.S401N 4 0.19 p.P302L 4 0.19 ambiguous mutation data 4 0.19 p.K286fs 4 0.19 p.L100V 4 0.19 p.V412I 3 0.15 p.P405P 3 0.15 MECP2_e1:p.G16dupG 3 0.15

82
p.P322L 3 0.15 p.S332fs 3 0.15 p.G273G 3 0.15 p.S49X 3 0.15 p.R106G 3 0.15 p.P101S 3 0.15 p.P399L 3 0.15 p.T158T 3 0.15 p.R250R 3 0.15 p.P399P 3 0.15 p.A278A 3 0.15 p.I125I 3 0.15 [p.R168X] + [p.G232A] 3 0.15 p.Q170X 3 0.15 [p.L328L + p.388delP] 3 0.15 p.K305R 3 0.15 p.P56P 3 0.15 p.Q244X 3 0.15 p.A281A 3 0.15 p.L328L 3 0.15 p.R458C 2 0.1 p.P101R 2 0.1 p.T445T 2 0.1 p.K200X 2 0.1 p.H368fs 2 0.1 p.P322A 2 0.1 p.S357S 2 0.1 p.K22X 2 0.1 p.F155S 2 0.1 p.Q297X 2 0.1 p.P376fs 2 0.1 p.P225L 2 0.1 p.S229L 2 0.1 p.C413C 2 0.1 p.A280A 2 0.1 p.R250H 2 0.1 p.P302A 2 0.1 p.D34fs 2 0.1 p.Q16X 2 0.1 p.K36fs 2 0.1 p.T158A 2 0.1

83
Appendix B Gene list used in motif search
Gene Name Accession Number Chromosome CTSS NM_004079 1 S100A10 NM_002966 1 CLK2 NM_003993 1 IGFBP2 NM_000597 2 MYCN NM_005378 2 LHCGR NM_000233 2 AGTR1 NM_032049 3 PPID NM_005038 4 ITGA2 NM_002203 5 PAM NM_138822 5 SEPT7 NM_001788 7 NET1 NM_005863 10 MARCH8 NM_145021 10 PTPRCAP NM_005608 11 BIRC2 NM_001166 11 IGF2 NM_000612 11 SLC2A3 NM_006931 12 CDH1 NM_004360 16 TOP2A NM_001067 17 ITGA3 NM_005501 17 DNAJB1 NM_006145 19 CSE1L NM_177436 20 GNAS NM_080426 20 PGK1 NM_000291 X RNF113A NM_006978 X RBBP7 NM_002893 X SMARCA1 NM_139035 X AFF2 NM_002025 X FHL1 NM_001449 X MPP1 NM_002436 X

84
Appendix C Whole list of candidate MECP2 target genes on X chromosomes
determined by bioinformatic analysis
No Gene Score Localization X-Inactivation
Status 1 AFF2 242 Xq28 2 PTCHD1 223 Xp22.11 3 HMGB3 201 Xq28 0/9 4 FAM50A 185 Xq28 5 RPS6KA3 179 Xp22.12-p22.1 0/9 6 SLC6A8 173 Xq28 7 RP11-13E5.1 161 Xq25 8 OTUD5 152 Xp11.23 9 TSPYL2 150 Xp11.2 0/5
10 FHL1 150 Xq26 1/9 11 UTX (DUSP21) 149 Xp11.2 9/9 12 SH3KBP1 147 Xp22.1-p21.3 4/9 13 TSPAN7 147 Xp11.4 14 KIAA1280 145 Xp22.32 1/9 15 TBL1X 141 Xp22.3 7/9 16 LOC158572 139 Xp11.23 0/9 17 PRKX 138 Xp22.3 7/9 18 CRSP2 137 Xp11.4-p11.2 6/6 19 USP27X 137 Xp11.23 20 LOC286495 137 Xq13.3 21 AP1S2 135 Xp22.2 9/9 22 LOC402395 135 Xp11.4 23 UBQLN2 134 Xp11.23-p11.1 2/9 24 TMEM28 134 Xq13.1 25 NHS 133 Xq22.13 3/9 26 APXL 132 Xq22.3 27 ARD1A 132 Xq28 28 PPP1R3F 129 Xq11.23 0/9 29 LOC401621 129 Xq28 30 PLXNA3 129 Xq28 0/9 31 LOC139952 128 Xp22.2 32 PRPS2 127 Xp22.3-p22.2 0/5 33 RGAG4 (KIAA2001) 127 Xq13.1 0/9

85
34 CXorf38 126 Xp11.4 35 REPS2 (POB1) 124 Xp22.2 2/9 36 LOC139334 124 Xp11.3 37 BRCC3 124 Xq28 38 RBBP7 (RpAp46) 123 Xp22.2 9/9 39 PDZK4 123 Xq28 0/9 40 SLC9A7 122 X 1/9 41 SYN1 122 Xp11.23 0/9 42 NAP1L3 122 Xq21.3-q22 7/9 43 DOCK11 122 Xq24 3/9 44 IRAK1 122 Xq28 1/9 45 ATP6AP2 121 Xp11.4 1/9 46 MSL3L1 120 Xp22.3 3/9 47 TMEM47 120 Xp11.4 48 CXorf17 120 Xp11.22 49 GPC3 120 Xq26.1 50 SRPX (ETX1) 119 Xp21.1 0/9 51 ZNF6 119 Xq21.1-q21.2 52 FMR1 118 Xq27.3 1/9 53 F8 118 Xq28 0/9 54 MAGEA11 117 Xq28 55 MTMR1 117 Xq28 0/9 56 ZMAT1 116 Xq21 57 TMEM32 116 Xq26.3 58 LOC441488 115 Xp21.1 59 LOC340602 115 Xp11.22 0/9 60 AMMECR1 115 Xq22.3 2/9 61 FLJ25444 114 Xp22.11 62 ELK1 114 Xp11.2 0/6 63 XK 113 Xp21.1 64 SMC1L1 113 Xp11.22-p11.21 7/9 65 MSN 113 Xq11.2-q12 1/9 66 IL13RA1 113 Xq24 0/9 67 PNMA3 113 Xq28 68 CXorf12 113 Xq28 5/9 69 CNKSR2 112 Xp22.12 70 MBTPS2 112 Xp22.1-p22.2 0/9 71 PCDH19 112 Xq13.3 72 LOC392510 112 Xq22.1 73 LOC389895 111 Xq27.1 74 ABCD1 111 Xq28 3/9

86
75 GPR143 110 Xp22.3 7/9 76 CASK 110 Xp11.4 0/6 77 USP51 110 Xp11.22 78 CITED1 110 Xq13.1 1/9 79 LOC401602 110 Xq21.32 80 SLC25A5 109 Xq24-q26 0/6 81 DKFZP564B147 109 Xq26.3 0/9 82 MGC39606 109 Xq26.3 83 GAB3 109 Xq28 8/9 84 SMS 108 Xp22.1 0/6 85 ACOT9 108 Xp22.11 86 SUV39H1 108 Xp11.23 0/9 87 ELF4 108 Xq26 0/9 88 LOC389842 107 Xp21.3 89 LOC347454 107 Xq24 90 WDR40B 107 Xq25 91 SMARCA1 107 Xq25 0/9 92 APLN 107 Xq25-26.3 0/9 93 CXorf50 106 Xq13.1 94 GPC4 106 Xq26.1 2/9 95 SLC9A6 106 Xq26.3 0/9 96 TREX2 106 Xq28 0/9 97 RAB9B 105 Xq22.1-q22.3 1/9 98 SUHW3 105 Xq25 99 PNMA6A 105 Xq28 0/9 100 LOC392423 104 Xp22.33 101 ARL13A 104 Xq22.1 102 ZIC3 104 Xq26.2 103 LDOC1 104 Xq27 1/9 104 PLCXD1 103 Xp22.33; Yp11.32 9/9 105 FAM51A1 103 Xp22.2 9/9 106 ZFX 103 Xp21.3 9/9 107 NROB1 103 Xp21.3-p21.2 108 PJA1 103 Xq13.1 1/9 109 RP11-130N24.1 103 Xq13.3 110 LOC286425 103 Xq21.1 111 GABRE 103 Xq28 0/9 112 DUSP9 103 Xq28 0/9 113 SLC25A6 102 Xp22.32; Yp11.3 9/9 114 PHF16 102 Xp11.3 0/9 115 SYP 102 Xp11.23-p11.22 2/9

87
116 LOC389863 102 Xq12 117 LOC158948 102 Xq22.1 118 NUDT11 101 Xp11.22 0/9 119 AR 101 Xq11.2-q12 0/6 120 LOC402422 101 Xq25 121 FLNA 101 Xq28 0/9 122 IQSEC2 100 Xp11.22 123 DLG3 100 Xq13.1 0/9 124 UBE2A 100 Xq24-q25 0/9

88
APPENDIX D Whole list of candidate MECP2 target genes on whole chromosomes determined by bioinformatic analysis
Symbol Chr Score Gene Name Location Go Term Kegg Title Phenotype
AFF2 X 242 AF4/FMR2 family, member 2 Xq28 brain development/learning and/or memory --- Mental retardation, X-linked, FRAXE type
BTBD2 19 228 BTB (POZ) domain containing 2 19p13.3 protein binding --- --- PTCHD1 X 223 patched domain containing 1 Xp22.11 --- --- ---
WIZ 19 214 --- --- --- --- --- FLJ37478 4 211 --- --- --- --- --- PRKCA 17 209 protein kinase C, alpha 17q22-q23.2 ATP binding/calcium ion binding/cell surface
receptor linked signal transduction Wnt signaling pathway/MAPK signaling pathway/Focal adhesion
Pituitary tumor, invasive
LOC116349 5 206 --- --- --- --- --- NOVA2 19 201 neuro-oncological ventral antigen 2 19q13.3 RNA binding/nucleus --- --- HMGB3 X 201 high-mobility group box 3 Xq28 DNA bending activity --- --- QKI 6 195 quaking homolog, KH domain
RNA binding (mouse) 6q26-q27 nucleic acid binding --- ---
WNT4 1 192 wingless-type MMTV integration site family, member 4
1p36.23-p35.1 cell-cell signaling/development Wnt signaling pathway/Hedgehog signaling pathway
Rokitansky-Kuster-Hauser syndrome
RHOT1 17 192 ras homolog gene family, member T1
17q11.2 GTP binding --- ---
ZNF480 19 192 zinc finger protein 480 19q13.41 metal ion binding --- --- SLC35F1 6 189 solute carrier family 35, member
F1 6q22.1-q22.31 --- --- ---
NDRG3 20 189 NDRG family member 3 20q11.21 catalytic activity/cell differentiation --- --- RBPMS2 15 188 RNA binding protein with multiple
splicing 2 15q22.31 --- --- ---
HOXC8 12 187 homeobox C8 12q13.3 development --- --- CAMK2N2 3 186 calcium/calmodulin-dependent
protein kinase II inhibitor 2 3q27.1 --- --- ---
CHD3 17 186 chromodomain helicase DNA binding protein 3
17p13.1 ATP binding/ATP-dependent DNA helicase activity
--- ---
CNOT6L 4 185 CCR4-NOT transcription complex 4q13.3 --- --- --- FAM50A X 185 family with sequence similarity 50,
member A Xq28 nucleus --- ---

89
RNF170 8 184 ring finger protein 170 8p11.21 metal ion binding/protein binding/zinc ion binding
--- ---
NPAS3 14 184 neuronal PAS domain protein 3 14q12-q13 DNA binding --- --- RKHD2 18 184 ring finger and KH domain
containing 2 18q21.1 --- --- ---
FAM44A 4 183 family with sequence similarity 44, member A
4p16.1 --- --- ---
CPEB2 4 183 cytoplasmic polyadenylation element binding protein 2
4p15.33 nucleic acid binding/nucleotide binding --- ---
HCN2 19 183 hyperpolarization activated cyclic nucleotide-gated potassium channel 2
19p13.3 cAMP binding/cation transport/cell-cell signaling --- ---
CACNG2 22 183 calcium channel, voltage-dependent, gamma subunit 2
22q13.1 calcium ion binding MAPK signaling pathway ---
EIF4E3 3 181 eukaryotic translation initiation factor 4E member 3
3p14 --- --- ---
TMEM99 17 180 transmembrane protein 99 17q21.2 --- --- --- NKRF X 180 NF-kappaB repressing factor Xq24 DNA binding --- --- RPS6KA3 X 179 ribosomal protein S6 kinase,
90kDa, polypeptide 3 Xp22.2-p22.1 ATP binding/central nervous system
development/ skeletal development MAPK signaling pathway/Long-term potentiation
Coffin-Lowry syndrome/Mental retardation, X-linked
KLF11 2 178 Kruppel-like factor 11 2p25 negative regulation of cell proliferation/ --- --- DGKI 7 178 diacylglycerol kinase, iota 7q32.3-q33 cytoplasm/diacylglycerol kinase activity Phosphatidylinositol signaling
system/Glycerolipid metabolism/ ---
ANKRD13D 11 178 ankyrin repeat domain 13 family, member D
11q13.2 --- --- ---
FLJ46347 2 177 --- --- --- --- --- LOC642931 9 176 --- --- --- --- --- LOC644689 9 176 --- --- --- --- --- LOC644722 9 176 --- --- --- --- --- JPH3 16 175 junctophilin 3 16q24.3 biological process unknown --- Huntington disease-like 2 KIAA1713 18 175 KIAA1713 18q11 --- --- --- CUL3 2 174 cullin 3 2q36.3 G1/S transition of mitotic cell cycle Ubiquitin mediated proteolysis --- ELF2 4 174 E74-like factor 2 4q28 regulation of transcription from RNA polymerase
II promoter --- ---
LMX1B 9 174 LIM homeobox transcription factor 1, beta
9q34 development/dorsa ventral pattern formation/embryonic development/ embryonic limb morphogenesis/ neuron differentiation
--- Nail-patella syndrome/Nail-patella syndrome with open-angle glaucoma
RCOR1 14 174 REST corepressor 1 14q32.32 --- --- ---

90
MAZ 16 174 MYC-associated zinc finger protein
16p11.2 transcription termination from RNA polymerase II promoter
--- ---
PP2447 22 174 --- --- --- --- --- TP53BP2 1 173 tumor protein p53 binding protein,
2 1q42.1 NF-kappaB binding/SH3/SH2 adaptor
activity/apoptosis --- ---
C9orf28 9 173 chromosome 9 open reading frame 28
9q33.3 --- --- ---
DAPK2 15 173 death-associated protein kinase 2 15q22.31 ATP binding/apoptosis/ --- --- CDYL2 16 173 chromodomain protein, Y-like 2 16q23.2 chromatin assembly or disassembly --- --- NCAM2 21 173 neural cell adhesion molecule 2 21q21.1 cell adhesion /neuron adhesion Cell adhesion molecules (CAMs) --- ANAPC11 17 172 APC11 anaphase promoting
complex subunit 11 homolog 17q25.3 anaphase-promoting complex /protein
ubiquitination Ubiquitin mediated proteolysis/Cell cycle
---
PCBP1 2 171 poly(rC) binding protein 1 2p13-p12 Ribonucleoprotein complex --- ---
GNB2 7 171 guanine nucleotide binding protein (G protein), beta polypeptide 2
7q21.3-q22.1 signal transducer activity/signal transduction --- ---
FBXO11 2 170 F-box protein 11 2p16.3 protein ubiquitination --- --- LOC644873 5 170 --- --- --- --- --- LOC653483 6 170 --- --- --- --- --- MLL5 7 170 myeloid/lymphoid or mixed-
lineage leukemia 5 7q22.1 regulation of transcription, DNA-dependent --- ---
RNF165 18 170 ring finger protein 165 18q21.1 --- --- --- HDGF2 19 170 --- --- --- --- --- USF2 19 170 upstream transcription factor 2 19q13 RNA polymerase II transcription factor activity --- --- RIMS4 20 170 Regulating synaptic membrane
exocytosis 4 20q13.12 exocytosis/neurotransmitter transport/synapse --- ---
KIF13A 6 169 kinesin family member 13A 6p23 microtubule motor activity --- --- RXRA 9 169 retinoid X receptor, alpha 9q34.3 retinoid-X receptor activity Adipocytokine signaling pathway ---
ARID2 12 169 AT rich interactive domain 2 (ARID, RFX-like)
12q12 chromatin modification --- ---
NOTUM 17 169 Notum pectinacetylesterase homolog
17q25.3 --- --- ---
ACAA2 18 169 acetyl-Coenzyme A acyltransferase 2
18q21.1 acetyl-CoA C-acyltransferase activity Fatty acid metabolism ---
ADNP 20 169 activity-dependent neuroprotector 20q13.13 Sequence-specific DNA binding --- --- DNAJC5 20 169 DnaJ (Hsp40) homolog, subfamily
C, member 5 20q13.33 heat shock protein binding --- ---

91
PRKACB 1 168 protein kinase, cAMP-dependent, catalytic, beta
1p36.1 cAMP-dependent protein kinase activity/ protein amino acid phosphorylation
Calcium signaling pathway/Insulin signaling pathway/ MAPK signaling pathway /Wnt signaling pathway/ Hedgehog signaling
---
MAD2L1BP 6 168 MAD2L1 binding protein 6p21.1 regulation of exit from mitosis --- --- LOC644640 9 168 --- --- --- --- --- CENTG3 7 167 centaurin, gamma 3 7q36.1 small GTPase mediated signal transduction --- --- ZDHHC2 8 167 zinc finger, DHHC-type containing
2 8p21.3-p22 acyltransferase activity --- ---
EIF2C2 8 167 Eukaryotic translation initiation factor 2C, 2
8q24 protein biosynthesis/translation initiation factor activity
--- ---
NKX6-2 10 167 NK6 transcription factor related, locus 2 (Drosophila)
10q26 --- --- ---
GNPTAB 12 167 N-acetylglucosamine-1-phosphate transferase, alpha and beta subunits
12q23.3 --- --- Mucolipidosis IIIA
CRLF1 19 167 cytokine receptor-like factor 1 19p12 antimicrobial humoral response /cytokine binding/
--- Cold-induced sweating syndrome
CABP7 22 167 calcium binding protein 7 22q12.2 calcium ion binding --- --- JAZF1 7 166 --- --- --- --- --- CLN8 8 166 ceroid-lipofuscinosis, neuronal 8 8p23 ER-Golgi intermediate compartment /nervous
system development --- Ceroid lipofuscinosis,
neuronal 8 C9orf75 9 166 chromosome 9 open reading frame
75 9q34.3 --- --- ---
DAZAP1 19 166 DAZ associated protein 1 19p13.3 cell differentiation /spermatogenesis --- --- NOTCH3 19 166 Notch homolog 3 (Drosophila) 19p13.2-p13.1 Notch signaling pathway /regulation of
development Dorso-ventral axis formation/Notch signaling pathway
Cerebral arteriopathy
PBX3 9 165 pre-B-cell leukemia transcription factor 3
9q33-q34 anterior compartment specification/ embryonic development/ hindbrain development/ posterior compartment specification
--- ---
PPM1A 14 165 protein phosphatase 1A magnesium-dependent, alpha
14q23.1 positive regulation of I-kappaB kinase/NF-kappaB cascade
MAPK signaling pathway ---
NCK2 2 164 NCK adaptor protein 2 2q12 T cell activation /cytoskeletal adaptor activity T cell receptor signaling pathway/Axon guidance
---
CHCHD7 8 164 coiled-coil-helix- domain 7 8q12.1 --- --- --- LOC653569 8 164 --- --- --- --- --- MLLT10 10 164 myeloid/lymphoid leukemia
translocated to 10 10p12 transcription factor activity --- Leukemia, acute T-cell
lymphoblastic ENO2 12 164 enolase 2 (gamma, neuronal) 12p13 phosphopyruvate hydratase activity Phenylalanine, tyrosine and tryptophan
biosynthesis ---
FOXA1 14 164 forkhead box A1 14q12-q13 regulation of transcription --- ---

92
DISP2 15 164 dispatched homolog 2 (Drosophila) 15q15.1 --- --- --- CSNK2A2 16 164 casein kinase 2, alpha prime
polypeptide 16p13.3-p13.2 protein kinase CK2 activity/ signal transduction Wnt signaling pathway/Tight
junction/Adherens junction ---
LOC643734 18 164 --- --- --- --- --- PLCG1 20 164 phospholipase C, gamma 1 20q12-q13.1 phosphoinositide phospholipase C activity Cholera Infection/ Phosphatidylinositol
signaling /Natural killer cell mediated cytotoxicity
---
SPEN 1 163 spen homolog, transcriptional regulator
1p36.33-p36.11 Notch signaling pathway --- ---
PCDH1 5 163 protocadherin 1 (cadherin-like 1) 5q32-q33 nervous system development --- --- LOC340260 7 163 --- --- --- --- --- MARVELD1 10 163 MARVEL domain containing 1 10q24.2 --- --- --- CYGB 17 163 cytoglobin 17q25.3 heme binding --- --- RAPH1 2 162 Ras association and pleckstrin
homology domains 1 2q33 cytoskeleton/signal transduction --- ---
FLJ10707 3 162 --- --- --- --- --- FAM44B 5 162 family with sequence similarity 5q35.2 --- --- --- FKBP8 19 162 FK506 binding protein 8, 38kDa 19p12 isomerase activity --- --- LIX1L 1 161 Lix1 homolog (mouse) like 1q21.1 --- --- --- TYRO3 15 161 TYRO3 protein tyrosine kinase 15q15.1-q21.1 transferase activity --- --- MAP1LC3B 16 161 Microtubule associated protein 1
light chain 3 beta 16q24.2 autophagic vacuole/autophagy /ubiquitin cycle --- ---
PRKACA 19 161 protein kinase, cAMP-dependent, catalytic, alpha
19p13.1 cAMP-dependent protein kinase complex Wnt signaling pathway/ Hedgehog signaling pathway/ MAPK signaling
---
GNAS 20 161 GNAS complex locus 20q13.3 G-protein coupled receptor protein signaling pathway
Long-term depression/Gap junction/Cholera
Acromegaly/McCune-Albright syndrome/
LOC340578 X 161 --- --- --- --- --- KIF21B 1 160 kinesin family member 21B 1pter-q31.3 microtubule motor activity --- ---
FLJ39653 4 160 --- --- --- --- --- LY6H 8 160 lymphocyte antigen 6 complex,
locus H 8q24.3 cellular defense response/ nervous system
development --- ---
LOC51145 9 160 --- --- --- --- ---
USP7 16 160 ubiquitin specific peptidase 7 16p13.3 cysteine-type endopeptidase activity --- ---
ASH1L 1 159 absent, small, or homeotic-like 1q22 regulation of transcription Tight junction ---
FLJ90575 4 159 --- --- --- --- --- GTF2E2 8 159 general transcription factor IIE,
polypeptide 2, beta 34kDa 8p21-p12 general RNA polymerase II transcription factor
activity complex Basal transcription factors ---
LOC338799 12 159 --- --- --- --- ---

93
LOC645631 16 159 --- --- --- --- --- PODXL2 3 158 podocalyxin-like 2 --- --- --- --- PFN2 3 158 profilin 2 3q25.1-q25.2 actin binding cytoskeleton organization and
biogenesis Regulation of actin cytoskeleton ---
NRF1 7 158 nuclear respiratory factor 1 7q32 generation of precursor metabolites and energy --- --- LOC643481 11 158 --- --- --- --- --- CKAP4 12 158 cytoskeleton-associated protein 4 12q23.3 membrane fraction --- ---
MAST1 19 158 microtubule associated serine/threonine kinase 1
19p13.2 cytoskeleton organization and biogenesis/magnesium ion binding
--- ---
LOC200312 22 158 --- --- --- --- --- LOC285346 3 157 --- --- --- --- --- ATXN7 3 157 ataxin 7 3p21.1-p12 visual perception --- Spinocerebellar ataxia-7 C6orf148 6 157 chromosome 6 open reading frame
148 6q13 --- --- ---
AIG1 6 157 androgen-induced 1 6q24.2 integral to membrane/membrane --- --- LOC642730 8 157 --- --- --- --- --- SPPL3 12 157 --- --- --- --- --- ZNF219 14 157 zinc finger protein 219 14q11 /transcription factor activity --- ---
ANKRD9 14 157 ankyrin repeat domain 9 14q32.32 --- --- ---
MAP2K3 17 157 mitogen-activated protein kinase kinase 3
17q11.2 MAP kinase activity MAPK signaling pathway/Toll-like receptor signaling pathway
---
NFIC 19 157 nuclear factor I/C (CCAAT-binding transcription factor)
19p13.3 transcription from RNA polymerase II promoter --- ---
ALX3 1 156 aristaless-like homeobox 3 1p21-p13 Development --- ---
ZFAND3 6 156 zinc finger,AN1-type domain 3 6pter-p22.3 zinc ion binding --- ---
PRKACG 9 156 protein kinase, cAMP-dependent, catalytic, gamma
9q13 cAMP-dependent protein kinase activity/male gonad development
Wnt signaling pathway/Hedgehog signaling pathway
---
PPAPDC1A 10 156 phosphatidic acid phosphatase type 2 domain containing 1A
10q26.12 microtubule/microtubule-based movement/structural molecule activity
--- ---
JAG2 14 156 jagged 2 14q32 Notch signaling pathway /auditory receptor cell fate commitment
Notch signaling pathway ---
TLK1 2 155 tousled-like kinase 1 2q31.1 regulation of chromatin assembly or disassembly/response to DNA damage stimulus
--- ---
RREB1 6 155 ras responsive element binding protein 1
6p25 Ras protein signal transduction --- ---
MAP3K4 6 155 mitogen-activated protein kinase kinase kinase 4
6q26 JNK cascade/activation of MAPKK activity MAPK signaling pathway ---

94
KCNB2 8 155 potassium voltage-gated channel, Shab-related subfamily, member 2
8q13.2 cation transport/delayed rectifier potassium channel activity
--- ---
TAOK1 17 155 TAO kinase 1 17q11.2 amino acid phosphorylation/ --- --- ZNF521 18 155 zinc finger protein 521 18q11.2 --- --- --- C20orf11 20 155 chromosome 20 open reading
frame 11 20q13.33 Nucleus --- ---
SLC6A8 X 155 solute carrier family 6 (neurotransmitter transporter, creatine), member 8
Xq28 neurotransmitter uptake/neurotransmitter:sodium symporter activity
--- Creatine deficiency syndrome, X-linked
PPARG 3 154 peroxisome proliferative activated receptor, gamma
3p25 generation of precursor metabolites and energy --- Diabetes mellitus, insulin-resistant, with acanthosis nigrican
KIAA1718 7 154 --- --- --- --- ---
ASTN2 9 154 astrotactin 2 9q33.1 --- --- ---
FLJ45530 16 154 --- --- --- --- ---
CANT1 17 154 calcium activated nucleotidase 1 17q25.3 Golgi stack /NF-kappaB cascade Pyrimidine metabolism/Purine metabolism
---
SALL3 18 154 sal-like 3 (Drosophila) 18q23 regulation of transcription --- --- LOC645874 3 153 --- --- --- --- ---
BMP6 6 153 bone morphogenetic protein 6 6p24-p23 cartilage development/cell differentiation/cytokine activity
Hedgehog signaling pathway/TGF-beta signaling pathway
---
KDELR2 7 153 endoplasmic reticulum protein retention receptor 2
7p22.1 ER to Golgi vesicle-mediated transport --- ---
AGTPBP1 9 153 ATP/GTP binding protein 1 9q21.33 carboxypeptidase A activity/proteolysis --- ---
CPT1A 11 153 carnitine palmitoyltransferase 1A (liver)
11q13.1-q13.2 carnitine O-palmitoyltransferase activity Fatty acid metabolism/Adipocytokine signaling pathway
CPT deficiency, hepatic, type IA
EB-1 12 153 --- --- --- --- --- CCNE1 19 153 cyclin E1 19q12 G1/S transition of mitotic cell cycle/androgen
receptor binding Cell cycle ---
RELB 19 153 v-rel reticuloendotheliosis viral oncogene homolog B,3
19q13.31-q13.32
transcription corepressor activity --- ---
KCTD3 1 152 potassium channel tetramerisation domain containing 3
1q41 --- --- ---
KCMF1 2 152 potassium channel modulatory factor 1
2p11.2 --- --- ---
GNL3 3 152 guanine nucleotide binding protein-like 3 (nucleolar)
3p21.1 GTP binding --- ---

95
PLXND1 3 152 plexin D1 3q21.3 development --- ---
FOXF2 6 152 forkhead box F2 6p25.3 sequence-specific DNA binding --- --- LOC653748 7 152 --- --- --- --- ---
C9orf10 9 152 chromosome 9 open reading frame 10
9q22.31 --- --- ---
SIDT2 11 152 SID1 transmembrane family, member 2
11q23.3 integral to membrane/membrane --- ---
NOG 17 152 noggin 17q21-q22 cartilage development /nervous system development/sensory perception of sound
TGF-beta signaling pathway Stapes ankylosis syndrome
LOC645369 18 152 --- --- --- --- ---
KIF3B 20 152 kinesin family member 3B 20q11.21 anterograde axon cargo transport/determination of left/right symmetry
--- ---
LOC643325 22 152 --- --- --- --- ---
SHANK3 22 152 SH3 and multiple ankyrin repeat domains 3
22q13.3 protein binding --- Chromosome 22q13.3 deletion syndrome
OTUD5 X 152 OTU domain containing 5 Xp11.23 --- --- --- DOCK7 1 151 dedicator of cytokinesis 7 1p31.3 GTPase binding/guanyl-nucleotide exchange
factor activity --- ---
KCNH1 1 151 potassium voltage-gated channel subfamilyH member1
1q32-q41 calmodulin binding/cation transport/delayed rectifier potassium channel activity
--- ---
UNQ6077 1 151 --- --- --- --- --- ODC1 2 151 ornithine decarboxylase 1 2p25 lyase activity/ornithine decarboxylase
activity/polyamine biosynthesis Urea cycle and metabolism of amino groups/Arginine and proline metabolism
Colonic adenoma recurrence
KCNK12 2 151 potassium channel, subfamily K, member 12
2p22-p21 potassium channel activity/ voltage-gated ion channel activity
--- ---
HEG1 3 151 HEG homolog 1 (zebrafish) 3q21.2 --- --- --- CPLX1 4 151 complexin 1 4p16.3 exocytosis/neurotransmitter transport/synaptic
transmission/syntaxin binding --- ---
FLJ20647 4 151 --- --- --- --- --- CSS3 5 151 --- --- --- --- --- FNDC1 6 151 fibronectin type III domain
containing 1 6q25 --- ECM-receptor interaction ---
KIAA1706 7 151 --- --- --- --- --- GRB10 7 151 growth factor receptor-bound
protein 10 7p12-p11.2 SH3/SH2 adaptor activity/cell-cell signaling --- ---
WDR5 9 151 WD repeat domain 5 9q34 protein binding --- --- C10orf9 10 151 chromosome 10 open reading
frame 9 10p11.21 regulation of progression through cell cycle --- ---

96
PHF21A 11 151 PHD finger protein 21A 11p11.2 protein binding/regulation of transcription --- --- DRAP1 11 151 DR1-associated protein 1 (negative
cofactor 2 alpha) 11q13.3 transcription corepressor activity/transcription
factor activity --- ---
GNAO1 16 151 guanine nucleotide binding protein (G protein)
16q13 G-protein coupled receptor protein signaling pathway /nervous system development
Long-term depression ---
FAM57A 17 151 family with sequence similarity 57, member A
17p13.3 integral to membrane/membrane --- ---
LOC645722 17 151 --- --- --- --- --- CACNG4 17 151 calcium channel, voltage-
dependent, gamma subunit 4 17q24 calcium ion binding MAPK signaling pathway ---
TUBB4 19 151 tubulin, beta 4 19p13.3 GTP binding/ microtubule-based movement Gap junction --- C20orf18 20 151 chromosome 20 open reading
frame 18 20p13 ubiquitin cycle --- ---
SLC24A3 20 151 solute carrier family 24, member 3 20p13 antiporter activity /symporter activity --- --- ZNF278 22 151 zinc finger protein 278 22q12.2 DNA-dependent --- ---