
Taking Stock of Developmental Trajectories of Criminal...
56
Taking Stock of Developmental Trajectories of Criminal Activity over the Life Course Alex R. Piquero Abstract Worldwide, criminologists have long been interested in the longitudinal patterning of criminal activity. Recently, methodological and statistical advances have “caught up” with longitudinal data and have provided criminologists with a unique window within which to study, document, and understand developmen- tal trajectories of criminal activity. One such technique, the trajectory procedure, allows researchers to study how criminal activity changes over time in a group-based framework. This methodology is well suited for studying crime over the life course because there may be different groups of offenders, their offending trajectories may exhibit different shapes at different ages, and they may be differentially affected by distinct factors. This paper presents an overview of the trajectory methodology, outlines its strengths and weaknesses, and summarizes key conclusions of the well over 80 studies that have used this technique. It concludes by pointing to several future research directions. Key words: trajectories, crime, life-course, developmental Introduction Charting the course of development over long periods of time occupies a central place in the social and behavioral sciences, and criminology is no exception. In particular, the onset, continuation, and cessation of criminal activity has occupied the imagination of criminologists since the beginning of the discipline (Kobner, 1893; Shaw, 1930; von Mayr, 1917; von Scheel, 1890), through its ascendance in the 20th century (Wolfgang, Figlio, & Sellin, 1972), and continues en force today (Blumstein, Cohen, Roth, & Visher, 1986; Piquero, Farrington, & Blumstein, 2003, 2007). With this interest in the natural history of offending, researchers have relied on longitudinal studies which follow individuals for lengthy periods of time. A key part of all longitudinal studies is the repeated measure of a behavior of interest. With the promise of increased knowledge about criminals and their crimes (McCord, 2000:113), longitudinal studies have allowed criminologists to pay close attention to the longitudinal patterning of criminal activity over the life course. For the study A. M. Liberman, The Long View of Crime: A Synthesis of Longitudinal Research. 23 C Springer 2008
Transcript of Taking Stock of Developmental Trajectories of Criminal...
Taking Stock of Developmental Trajectoriesof Criminal Activity over the Life Course
Alex R. Piquero
Abstract Worldwide, criminologists have long been interested in the longitudinalpatterning of criminal activity. Recently, methodological and statistical advanceshave “caught up” with longitudinal data and have provided criminologists witha unique window within which to study, document, and understand developmen-tal trajectories of criminal activity. One such technique, the trajectory procedure,allows researchers to study how criminal activity changes over time in a group-basedframework. This methodology is well suited for studying crime over the life coursebecause there may be different groups of offenders, their offending trajectories mayexhibit different shapes at different ages, and they may be differentially affectedby distinct factors. This paper presents an overview of the trajectory methodology,outlines its strengths and weaknesses, and summarizes key conclusions of the wellover 80 studies that have used this technique. It concludes by pointing to severalfuture research directions.
Key words: trajectories, crime, life-course, developmental
Introduction
Charting the course of development over long periods of time occupies a centralplace in the social and behavioral sciences, and criminology is no exception. Inparticular, the onset, continuation, and cessation of criminal activity has occupiedthe imagination of criminologists since the beginning of the discipline (Kobner,1893; Shaw, 1930; von Mayr, 1917; von Scheel, 1890), through its ascendance inthe 20th century (Wolfgang, Figlio, & Sellin, 1972), and continues en force today(Blumstein, Cohen, Roth, & Visher, 1986; Piquero, Farrington, & Blumstein, 2003,2007). With this interest in the natural history of offending, researchers have reliedon longitudinal studies which follow individuals for lengthy periods of time. A keypart of all longitudinal studies is the repeated measure of a behavior of interest.With the promise of increased knowledge about criminals and their crimes (McCord,2000:113), longitudinal studies have allowed criminologists to pay close attentionto the longitudinal patterning of criminal activity over the life course. For the study
A. M. Liberman, The Long View of Crime: A Synthesis of Longitudinal Research. 23C© Springer 2008
24 A. R. Piquero
of criminal careers, longitudinal data are necessary as it provides the mechanismby which to study change in offending across the life-course. In fact, longitudi-nal studies are necessary for making proper inferences about individual trajectoriesof stability and change (Sampson & Laub, 1993:251) as well as how life eventsalter trajectories of criminal activity over the life-course (Laub, Nagin, & Sampson,1998).
There have been many longitudinal studies focusing on criminal activity, in dif-ferent eras and parts of the world. For example, longitudinal studies exist in theUnited States, Canada, Puerto Rico, England, Scotland, Denmark, Sweden, Finland,China, Japan, Switzerland, Australia, New Zealand—as well as cities within thosecountries, and employ a varied array of sampling frames (general population, highrisk population, and offenders) (see Weitekamp & Kerner, 1994). This material hasgenerated an impressive and important amount of information about the natural his-tory of criminal offending that would not have been possible through the use ofcross-sectional designs that only provide a snap-shot of individuals at one particularpoint in time.1 Although there exists several efforts that take stock of the key find-ings of longitudinal studies (see Thornberry & Krohn, 2003; Weitekamp & Kerner,1994), it is useful to briefly review several of the findings that are common to themany longitudinal studies.
First, misbehavior starts early in the life-course (Tremblay et al., 1999), andsome of the factors that influence misbehavior can be identified early in life whileothers emerge later in life (Stouthamer-Loeber, Wei, Loeber, & Masten, 2004).Second, these studies have charted the course of persistence (the fraction of thepopulation who continues criminal activity over time), but less so on desistance(the fraction of the population who ceases criminal activity over time). This is sobecause many studies do not follow sample members past their 30s. Moreover, thereis a long recognized difficulty in operationalizing desistance (Bushway, Piquero,Broidy, Cauffman, & Mazerolle, 2001; Laub & Sampson, 2001) and a recognitionthat there is much intermittency, or stops and starts, throughout an individual’scriminal career that may be misconstrued as desistance (Laub & Sampson, 2003;Nagin & Land, 1993; Piquero, 2004). The issue of intermittency is one that iscompletely lost with cross-sectional studies. Third, longitudinal studies appear tosuggest that the correlates of onset, persistence, and desistance may not necessar-ily be the same and that some factors influencing onset may have little to do withthe factors that influence persistence or desistance (Piquero et al., 2003). Fourth,the advent of new methodological/statistical tools has aided researchers’ ability tomore directly examine individual and group-based patterns of criminal activity. Onein particular is the trajectory methodology, which allows researchers to study howcriminal activity changes over time in a group-based framework (Nagin, 1999). Thismethodology seems particularly well-suited to studying criminal activity over thelife course because according to some developmental, group-based theories of crime(e.g., Moffitt, Patterson, Loeber) there may be different groups of offenders (low
1 Debates regarding the merits of longitudinal vs. cross-sectional designs exist elsewhere (seeBlumstein, Cohen, & Farrington, 1988a, 1988b; Gottfredson & Hirschi, 1986, 1988).
Taking Stock of Developmental Trajectories of Criminal Activity 25
rate, medium rate, and high rate), their offending trajectories may exhibit differentshapes at different ages, and they may be differentially affected by distinct crime-exacerbating factors. Findings from this line of research appear to suggest that thereis meaningful variation within offenders and the factors that predict the offendingof one group are not necessarily the same as the factors predicting the offendingof another group. Moreover, applications of this methodology to various data setslead to the conclusion that developmental patterns of criminal activity differ withregard to crime type and whether offender-based samples are used. For example,offender-based samples yield higher and more stable rates of offending over longerperiods of the life course.
Given the amount of research undertaken in recent years with this method-ology and the unique window within which it provides criminologists the abil-ity to peer into offenders’ criminal careers, the rest of this essay will attempt todocument what is known about the natural history of offending with the use ofthe trajectory technique. Consider this, then, a “taking stock” of what we havelearned about developmental trajectories of criminal activity. The essay begins witha description of the trajectory methodology, followed by a review of the studiesthat have used this approach to document the longitudinal patterning of criminalactivity, and closes with a summary statement of key findings and an identificationof several future research directions.2 Because the studies reviewed in this essayemploy a varied array of sampling frames, and cover various periods of the life-course, the essay will describe the results of these studies by the type of sampleused (offender-based/general population), as well as the time period covered (child-hood/adolescence/adulthood). Before these studies are reviewed, a brief descrip-tion of the theoretical debates that the trajectory methodology can help empiricallyassess is presented.
Theoretical Backdrop
A core issue in criminology is the shape of the age/crime curve, not the aggregateage/crime curve per se, but the age/crime curve at the individual level (Blumsteinet al., 1986; Britt, 1992; Gottfredson & Hirschi, 1990; Greenberg, 1991; Le Blanc &Loeber, 1998; Loeber & Le Blanc, 1990; Nagin & Land, 1993; Piquero et al., 2003).Is this relationship the same for everyone such that external life events do not matterafter ages 8/10 once self-control is developed as static/general theorists like Got-tfredson and Hirschi claim? Or is it that variation within individuals over time insources of informal social control (e.g., marriage, military, etc.) leads to changesin criminal trajectories after ages 8/10 as static/dynamic theorists like Sampsonand Laub claim? Or even still, is the aggregate age/crime curve characterized by a
2 Of course, integrating findings across these studies is particular challenging because of differ-ences in sample characteristics, age ranges, length of follow-up measures, and analytic strategiesand coding decisions (i.e., should crime information be dichotomized or left continuous?) (Tuckeret al., 2005:309).

26 A. R. Piquero
mixture of static/dynamic/developmental processes such that individuals may differnot only in their offending rates at any given age but also exhibit distinctive tra-jectories of offending over the life-course as hypothesized by Moffitt, Patterson,Loeber, and others? In short, the theoretical models described above make strong—yet competing—predictions about the development of criminal activity over thelife-course.
These theoretical debates can be considered within the context of developmen-tal criminology, which refers to the study of temporal within-individual changes inoffending over the life-course (Le Blanc & Loeber, 1998:117). Importantly, the theo-retical processes reviewed above make fundamentally different predictions about theexistence of groups. Both Gottfredson and Hirschi (1990:132, Figure 9) and Lauband Sampson (2003:248 and 249, 278 and 279) would likely offer that a group-basedframework is both problematic and uncertain not only because of a tendency to reifygroups that may “not, in fact, exist” (Sampson & Laub, 2003:587), but also becauseboth sets of theorists suggest and find that all offenders, even the most high-rate ofall offenders, desist.3
On the other hand, the developmental theoretical models advanced by Moffitt,Patterson, Loeber, and others are exclusively group-based. For example, Moffitt’s(1993) developmental taxonomy predicts that two types of offenders characterizethe age/crime curve, each of whom have a unique set of predictors and each ofwhom evince distinct offending patterns over the life-course. One of these groups,life-course persistent, comprises a very small subset of offenders, whose antisocialactivity begins in early childhood, persists throughout life, and is unlikely to respondto points of intervention. Members of the life-course persistent group share deficitsin neuropsychological functioning which, when met with family adversity and inef-fective parenting, create very difficult children and adolescents who fail in multiplelife domains and engage in all sorts of criminal activity, including violence. On theother hand, adolescence-limited offenders engage in adult-like antisocial behaviors(except violence) during adolescence largely due to the interaction between recog-nition of the maturity gap4 and the peer social context. Most adolescence-limitedoffenders, because they do not suffer injurious childhoods, desist by the time adult-hood approaches because of their ready stock of prosocial skills and recognition thatthey can now afford all of the previously coveted adult activities. For Moffitt then,the two groups of offenders evince unique causes as well as unique shapes, peaks,and changes in offending rates over the life-course.
Clearly, in order to adjudicate between Moffitt’s predictions of distinct offendertypologies versus the more single-group frameworks advanced by Gottfredsonand Hirschi and Sampson and Laub, researchers need methodological/statistical
3 Although Sampson and Laub (2003) are critical of group-based theoretical models as well asstatistical tools developed to find them (Sampson et al., 2004), they do suggest that there may be“multiple pathways to desistance” (Laub & Sampson, 2003:278); yet desistance is facilitated by arange of turning points in combination with individual actions for all offenders (Laub & Sampson,2003:278).4 Here, the maturity gap refers to the adolescent’s recognition that they physically resemble adults,but society places age restrictions on their partaking of adult activities.
Taking Stock of Developmental Trajectories of Criminal Activity 27
techniques that have the ability to parcel out distinct offending trajectories thatchange in shape and level over time. One such methodology, which is the focusof the current chapter, is the trajectory method. Next, we turn to an overview ofthis methodology, which has become a staple in researchers’ ability to study thetheoretical models articulated above.5
The Trajectory Methodology
The use of finite mixture models has a long history in criminology, and the trajectorymethodology owes a great debt to the rich history in criminal careers research thatattempts to sort out within-offender heterogeneity (see Blumstein, Farrington, &Moitra, 1985; Blumstein & Moitra, 1980). Recognizing that there may be meaning-ful sub-groups within a population that follow distinctive developmental trajecto-ries (Loeber & Hay, 1994; Moffitt, 1993; Patterson, 1993), Nagin and Land (1993)developed a modeling strategy that makes no parametric assumptions about thedistribution of persistent unobserved heterogeneity in the population. Unlike othertechniques, the semi-parametric mixed Poisson model assumes that the distributionof unobserved persistent heterogeneity is discrete rather than continuous, and thusthe mixing distribution is viewed as multinomial (i.e., a categorical variable). Eachcategory within the multinomial mixture can be viewed as a point of support, orgrouping, for the distribution of individual heterogeneity. The model, then, estimatesa separate point of support (or grouping) for as many distinct groups as can identifiedin the data.
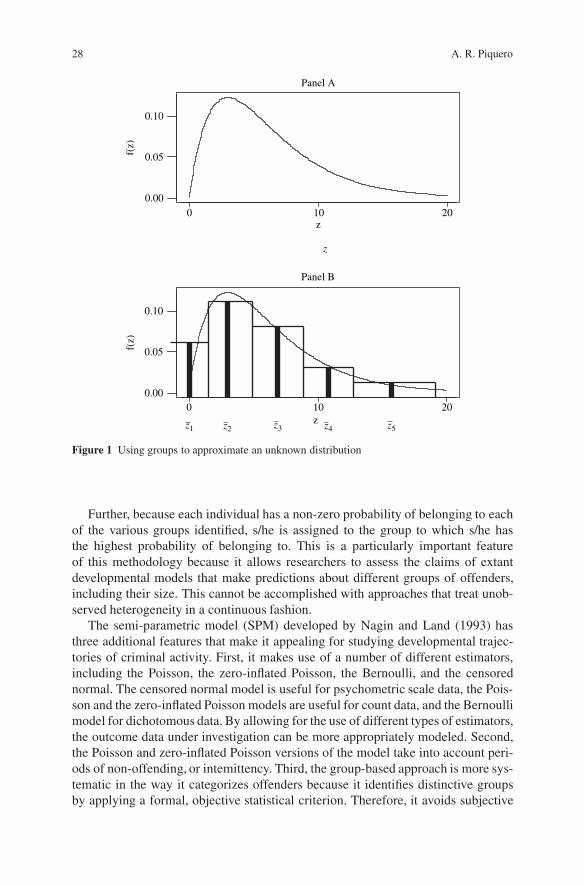
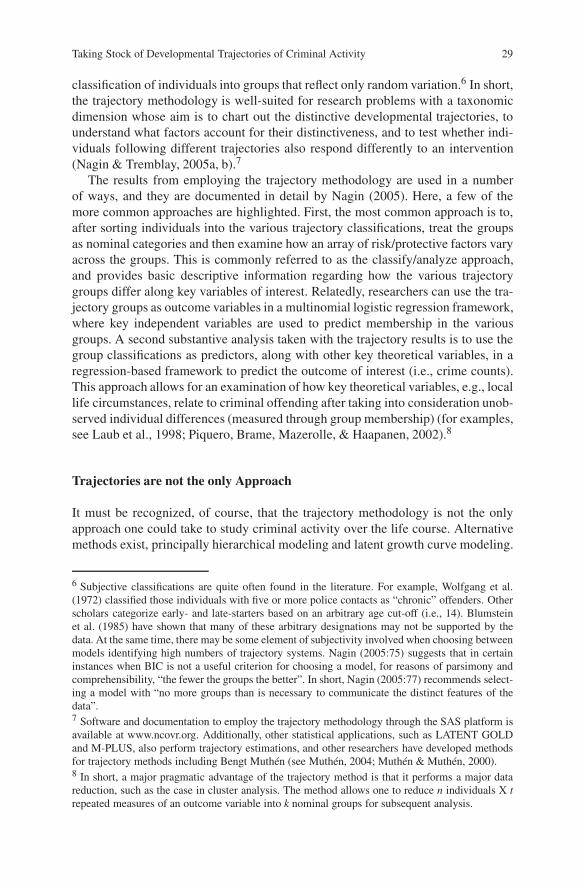
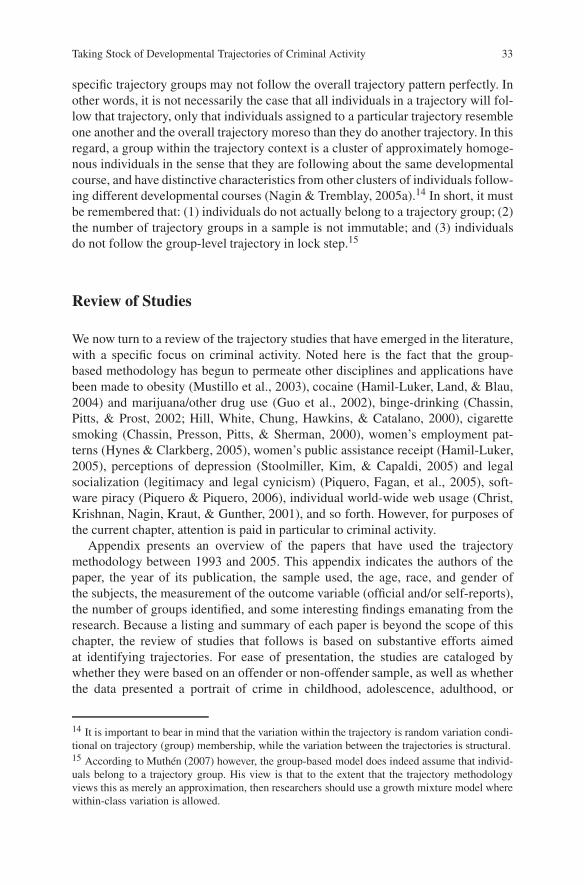
It is important to remember that the trajectory groups approximate populationdifferences in developmental trajectories. A higher number of points of support(groups) yields a discrete distribution that more closely approximates what may be atrue continuous distribution (Nagin & Tremblay, 2005a, b). This is easily illustratedwith an example. Figure 1 displays two panels (e.g., Nagin, 2005:47, Figure 3. 1).The first panel, (A), depicts the population distribution of some behavior, z, whilethe second panel, (B), replicates the same distribution but is overlaid with a his-togram that approximates its shape. Panel (B) illustrates that any continuous dis-tribution with finite end-points can be approximated by a discrete distribution (ahistogram) or alternatively by a finite number of “points of support” (Nagin & Trem-blay, 2005a, b). A higher number of points of support yields a discrete distributionthat more closely approximates what may be a true continuous distribution (Nagin &Tremblay, 2005a, b).
5 The trajectory method, according to Nagin (2005:2), is “based upon a formal statistical modelfor conducting group-based analysis with time- and age-based data [and it] provides the capacityfor testing whether the hypothesized trajectories emerge from the data itself. . . As such, it can bethought of as a methodology for identifying meaningful subgroups in time-based data. It also pro-vides the capacity for statistically identifying the factors that both predict and alter these distinctivetime-based progressions.”
28 A. R. Piquero
20100
0.10
0.05
0.00
z
f(z)
Panel A
z
f(z)
20100
0.10
0.05
0.00
z
Panel B
z1 z2 z3 z4 z5
Figure 1 Using groups to approximate an unknown distribution
Further, because each individual has a non-zero probability of belonging to eachof the various groups identified, s/he is assigned to the group to which s/he hasthe highest probability of belonging to. This is a particularly important featureof this methodology because it allows researchers to assess the claims of extantdevelopmental models that make predictions about different groups of offenders,including their size. This cannot be accomplished with approaches that treat unob-served heterogeneity in a continuous fashion.
The semi-parametric model (SPM) developed by Nagin and Land (1993) hasthree additional features that make it appealing for studying developmental trajec-tories of criminal activity. First, it makes use of a number of different estimators,including the Poisson, the zero-inflated Poisson, the Bernoulli, and the censorednormal. The censored normal model is useful for psychometric scale data, the Pois-son and the zero-inflated Poisson models are useful for count data, and the Bernoullimodel for dichotomous data. By allowing for the use of different types of estimators,the outcome data under investigation can be more appropriately modeled. Second,the Poisson and zero-inflated Poisson versions of the model take into account peri-ods of non-offending, or intemittency. Third, the group-based approach is more sys-tematic in the way it categorizes offenders because it identifies distinctive groupsby applying a formal, objective statistical criterion. Therefore, it avoids subjective
Taking Stock of Developmental Trajectories of Criminal Activity 29
classification of individuals into groups that reflect only random variation.6 In short,the trajectory methodology is well-suited for research problems with a taxonomicdimension whose aim is to chart out the distinctive developmental trajectories, tounderstand what factors account for their distinctiveness, and to test whether indi-viduals following different trajectories also respond differently to an intervention(Nagin & Tremblay, 2005a, b).7
The results from employing the trajectory methodology are used in a numberof ways, and they are documented in detail by Nagin (2005). Here, a few of themore common approaches are highlighted. First, the most common approach is to,after sorting individuals into the various trajectory classifications, treat the groupsas nominal categories and then examine how an array of risk/protective factors varyacross the groups. This is commonly referred to as the classify/analyze approach,and provides basic descriptive information regarding how the various trajectorygroups differ along key variables of interest. Relatedly, researchers can use the tra-jectory groups as outcome variables in a multinomial logistic regression framework,where key independent variables are used to predict membership in the variousgroups. A second substantive analysis taken with the trajectory results is to use thegroup classifications as predictors, along with other key theoretical variables, in aregression-based framework to predict the outcome of interest (i.e., crime counts).This approach allows for an examination of how key theoretical variables, e.g., locallife circumstances, relate to criminal offending after taking into consideration unob-served individual differences (measured through group membership) (for examples,see Laub et al., 1998; Piquero, Brame, Mazerolle, & Haapanen, 2002).8
Trajectories are not the only Approach
It must be recognized, of course, that the trajectory methodology is not the onlyapproach one could take to study criminal activity over the life course. Alternativemethods exist, principally hierarchical modeling and latent growth curve modeling.
6 Subjective classifications are quite often found in the literature. For example, Wolfgang et al.(1972) classified those individuals with five or more police contacts as “chronic” offenders. Otherscholars categorize early- and late-starters based on an arbitrary age cut-off (i.e., 14). Blumsteinet al. (1985) have shown that many of these arbitrary designations may not be supported by thedata. At the same time, there may be some element of subjectivity involved when choosing betweenmodels identifying high numbers of trajectory systems. Nagin (2005:75) suggests that in certaininstances when BIC is not a useful criterion for choosing a model, for reasons of parsimony andcomprehensibility, “the fewer the groups the better”. In short, Nagin (2005:77) recommends select-ing a model with “no more groups than is necessary to communicate the distinct features of thedata”.7 Software and documentation to employ the trajectory methodology through the SAS platform isavailable at www.ncovr.org. Additionally, other statistical applications, such as LATENT GOLDand M-PLUS, also perform trajectory estimations, and other researchers have developed methodsfor trajectory methods including Bengt Muthén (see Muthén, 2004; Muthén & Muthén, 2000).8 In short, a major pragmatic advantage of the trajectory method is that it performs a major datareduction, such as the case in cluster analysis. The method allows one to reduce n individuals X trepeated measures of an outcome variable into k nominal groups for subsequent analysis.
30 A. R. Piquero
One of the key differences between the trajectory approach and these other methodsis that the latter treat the population distribution of criminal activity as continuouswhereas the trajectory model approximates this continuous distribution with pointsof support, or groups. The trajectory method, then, is designed to identify distinc-tive, developmental trajectories within the population, to calibrate the probability ofpopulation members following each such trajectory, and to relate those probabilitiesto covariates of interest (Nagin, 1999:153).
Raudenbush (2001:59) provides a further clarification of the issues surround-ing the various methodologies: “In many studies of growth it is reasonable toassume that all participants are growing according to some common function butthat the growth parameters vary in magnitude.” He offered children’s vocabularygrowth curves as an example of such a growth process. Two distinctive features ofsuch developmental processes are (a) they are generally monotonic—thus, the termgrowth—and (b) they vary regularly within the population. For such processes it isnatural to ask, “What is the typical pattern of growth within the population and howdoes this typical growth pattern vary across population members?” Hierarchical andlatent curve modeling are specifically designed to answer such a question.
Raudenbush also offered an example of a developmental process—namely,depression—that does not generally change monotonically over time and does notvary regularly through the population. He observed (p. 59), “It makes no sense toassume that everyone is increasing (or decreasing) in depression. . . . many personswill never be high in depression, others will always be high; some are recoveringfrom serious depression, while others will become increasingly depressed.” Forproblems such as this, he recommended the use of a multinomial-type methodbecause development, or modeled trajectories, varies regularly across populationmembers. Indeed, some trajectories vary greatly across population subgroups bothin terms of the level of behavior at the outset of the measurement period and inthe rate of growth and decline over time. According to Raudenbush (2001:60), thetrajectory methodology is “especially useful when trajectories of change involvesets of parameters that mark qualitatively different kinds of development.” For suchproblems, a modeling strategy designed to identify averages and explain variabilityabout that average is far less useful than a group-based strategy designed to identifydistinctive clusters of trajectories and to calibrate how characteristics of individualsand their circumstances affect membership in these clusters (Raudenbush, 2001:60).
Limitations of the Trajectory Methodology
As is the case with all methods that seek to understand the longitudinal patterningof criminal activity, the trajectory methodology is limited in some respects.9 First,because the SPM assumes that unobserved heterogeneity is drawn from a discrete(multinomial) probability distribution, there will likely be model misspecification
9 For an excellent review of the various types and implications of latent trajectory models for thestudy of criminal and antisocial activity over the life course, see Curran and Willoughby (2003).
Taking Stock of Developmental Trajectories of Criminal Activity 31
bias if unobserved individual differences are actually drawn from a continuous dis-tribution.10 Second, the identification of parameter estimates is difficult with smallperiods of observations and where the prevalence of observations is small. Third,classification of individuals to distinctive groups will never be perfect (Roeder,Lynch, & Nagin, 1999). Fourth, the number of groups extracted is variable (as shownin D’Unger, Land, McCall, & Nagin, 1998; Sampson, Laub, & Eggleston, 2004)and partly a function of sample size—the more individuals the more groups oneis likely to find (see also Nagin & Tremblay, 2005a:30).11 According to Sampsonet al. (2004), this result is not surprising if indeed the underlying distribution is moreor less continuous in nature. Still, the number of groups appears to plateau at aboutsample size 200, and the conclusions reached about the number of groups above thissample size do not vary much (D’Unger et al., 1998). Fifth, recent research seekingto understand how the model behaves under various conditions indicates that threemore general concerns in longitudinal research, (a) length of follow-up, (b) theinclusion of incarceration time, and (c) data on involuntary desistance throughdeath, influence developmental trajectories (Eggleston, Laub, & Sampson, 2004).Regarding length of follow-up, these authors found that length can influence groupshape, peak ages, and group membership, and that the length of follow-up issueseems most relevant for high-rate offenders who continue offending into adulthood.Regarding incarceration time, they found that excluding such information resultsin underestimating the rate of offending and can affect group shape, peak age, andgroup membership, and that the incarceration information seems most relevant forhigh-rate offenders (see also Piquero et al., 2001). Regarding mortality, the analysesindicated that the population of the high-rate chronic group is greatly affected bythe exclusion of mortality data (Eggleston et al., 2004:21). The issue here is thatthose who are dead are assumed to have desisted. And once again, mortality dataseems most relevant for high-rate offenders. In short, longer-term data on offendingand the inclusion of incarceration and mortality information alter the group number,shape, and group assignment in trajectory research.12 Sixth, there have been somestatistical concerns raised regarding the trajectory-based approach, specifically inan effort to address model fit to the data (Kreuter & Muthén, 2006a,b). Accordingto Muthén (2007), two specific things are needed. First, analysts need to show that
10 Bauer and Curran (2003) recently argued that latent trajectory classes can be estimated evenin the absence of population heterogeneity. In their simulation study, these authors asked if thecomponents from the trajectory mixture model represent true latent subgroups in the population,or whether they were serving only to approximate what is in fact a homogenous but nonnormaldistribution. On this last point they noted that nonnormality was in fact a necessary conditionfor the extraction of multiple latent components or classes (p. 345). Their results indicated thatmultiple trajectory classes were estimated and appeared optimal for nonnormal data even whenonly one group existed in the population. For a slightly different view/interpretation of this, seeNagin and Tremblay (2005a).11 However, if the underlying distribution is indeed discrete and not continuous, then an increasein sample size will not artificially lead to an increase in the number of groups identified.12 To be sure, these specific concerns also influence the other methodological techniques for study-ing criminal careers using longitudinal data (Nagin, 2004a). That is, hierarchical and growth-curvemodeling techniques must also deal with these exact same problems.
32 A. R. Piquero
the group-based model fits the data better than the standard HLM random effectmodel (with a single class) – otherwise, there are no meaningful groups to be found.Second, there needs to be an effort to show that a more flexible model – such as thegrowth mixture model that Muthén has proposed – does not fit significantly betterthan the group-based model. If it does, the group-based approach is insufficient anddoes not fit the data. This is oftentimes ignored in the group-based research traditionand may be regarded as statistically unacceptable especially because it could makea difference in substantive conclusions (see Muthén & Asparouhov, 2006: 17–20 tosee what a difference the choice can make; see also Muthén, 2004, section 19.5.2). Inshort, Muthén (2006) argues that the group-based analysis field is poorly developedstatistically and there exists some alternative modeling viewpoints.
Finally, Sampson et al. (2004) are concerned not with the model itself, but howthe results emerging from it are interpreted. The issue here is that the method isvulnerable to misappropriation by those pre-disposed to believe in the idea of ahigh-rate group of offenders (pp. 38–39).13 As these authors suggest, “The SPM[semi-parametric model] begins with the assumption that groups exist, often lead-ing to the notion that a wide array of group configurations is possible. Is it theneasy for the naïve user to conclude (tautologically?) that groups exist because theyare discovered, even though a model cannot be said to discover what it assumes.SPM will estimate groups from an underlying continuous distribution, a fact thatcan bedevil even the most sophisticated user (p. 41).”
Recently, Nagin and Tremblay (2005a,b) have noted that there has been someconfusion about the interpretation of the model, stemming primarily from the inter-pretation of what it means to say “person x belongs to trajectory group j.” Threemisconceptions in particular have been identified: (1) individuals actually belong toa trajectory group, (2) the number of trajectory groups in a sample is immutable, and(3) the trajectories of group members follow the group-level trajectory in lock-step(Nagin & Tremblay, 2005a).
With regard to the first caution, the methodology and its developers cautionagainst reification of groups. Regarding the second caution, it must be rememberedthat the groups are intended as an approximation of a more complex underlyingreality. Thus, what the model does is simply to display the distinctive features of thepopulation distribution of trajectories. As such, the number of groups and the shapeof each group’s trajectory are not fixed. This is so because longitudinal data arelimited not only by the number of individuals but more importantly by the number ofperiods or sets of observations for which individuals are observed. As more periodsof data are added, trajectories may vary. As Nagin and Tremblay (2005a) surmise,“more data allows for more refined statistical inferences.” Finally, because the tra-jectory methodology creates a summary that describes the behavior and character-istics of individuals following similar developmental courses (i.e., it summarizesthe average behavioral trend of a collection of individuals), individuals assigned to
13 This is an interesting point because while most (if not all) criminologists agree that there is infact a small, high-rate group of offenders, the debate seems to be more about what that observationmeans (i.e., is it a difference in degree or a difference in kind?). This issue has not been resolvedand remains a legitimate subject of debate.
Taking Stock of Developmental Trajectories of Criminal Activity 33
specific trajectory groups may not follow the overall trajectory pattern perfectly. Inother words, it is not necessarily the case that all individuals in a trajectory will fol-low that trajectory, only that individuals assigned to a particular trajectory resembleone another and the overall trajectory moreso than they do another trajectory. In thisregard, a group within the trajectory context is a cluster of approximately homoge-nous individuals in the sense that they are following about the same developmentalcourse, and have distinctive characteristics from other clusters of individuals follow-ing different developmental courses (Nagin & Tremblay, 2005a).14 In short, it mustbe remembered that: (1) individuals do not actually belong to a trajectory group; (2)the number of trajectory groups in a sample is not immutable; and (3) individualsdo not follow the group-level trajectory in lock step.15
Review of Studies
We now turn to a review of the trajectory studies that have emerged in the literature,with a specific focus on criminal activity. Noted here is the fact that the group-based methodology has begun to permeate other disciplines and applications havebeen made to obesity (Mustillo et al., 2003), cocaine (Hamil-Luker, Land, & Blau,2004) and marijuana/other drug use (Guo et al., 2002), binge-drinking (Chassin,Pitts, & Prost, 2002; Hill, White, Chung, Hawkins, & Catalano, 2000), cigarettesmoking (Chassin, Presson, Pitts, & Sherman, 2000), women’s employment pat-terns (Hynes & Clarkberg, 2005), women’s public assistance receipt (Hamil-Luker,2005), perceptions of depression (Stoolmiller, Kim, & Capaldi, 2005) and legalsocialization (legitimacy and legal cynicism) (Piquero, Fagan, et al., 2005), soft-ware piracy (Piquero & Piquero, 2006), individual world-wide web usage (Christ,Krishnan, Nagin, Kraut, & Gunther, 2001), and so forth. However, for purposes ofthe current chapter, attention is paid in particular to criminal activity.
Appendix presents an overview of the papers that have used the trajectorymethodology between 1993 and 2005. This appendix indicates the authors of thepaper, the year of its publication, the sample used, the age, race, and gender ofthe subjects, the measurement of the outcome variable (official and/or self-reports),the number of groups identified, and some interesting findings emanating from theresearch. Because a listing and summary of each paper is beyond the scope of thischapter, the review of studies that follows is based on substantive efforts aimedat identifying trajectories. For ease of presentation, the studies are cataloged bywhether they were based on an offender or non-offender sample, as well as whetherthe data presented a portrait of crime in childhood, adolescence, adulthood, or
14 It is important to bear in mind that the variation within the trajectory is random variation condi-tional on trajectory (group) membership, while the variation between the trajectories is structural.15 According to Muthén (2007) however, the group-based model does indeed assume that individ-uals belong to a trajectory group. His view is that to the extent that the trajectory methodologyviews this as merely an approximation, then researchers should use a growth mixture model wherewithin-class variation is allowed.
34 A. R. Piquero
some combination thereof. It is important to note the impressive array of studiesemploying this methodology. Over 80 studies have used the trajectory analysis inurban, suburban, and rural settings, in the US and abroad, and spanning birth to age70, and integrating findings across these studies is particularly challenging becauseof differences in sample characteristics, age ranges, length of follow-up measures,and analytic strategies and decisions (e.g., Tucker, Ellickson, Orlando, Martino, &Klein, 2005:309). Nevertheless, such a review can begin the process of synthesizingkey conclusions across empirical studies.
Methods Papers
There have been several methodologically-oriented papers written about the trajec-tory methodology, and in general these papers employ longitudinal data, identifydistinct trajectories, and then discuss the strengths and weaknesses of this approach.These papers include: (Brame, Nagin, & Wasserman, 2006; Bushway, Brame, &Paternoster, 1999; Eggleston et al., 2004; Haviland & Nagin, 2005; Jones, Nagin, &Roeder, 2001; Kreuter & Muthén 2006a,b; Land, McCall, & Nagin, 1996; Land& Nagin, 1996; Land, Nagin, & McCall, 2001, Loughran & Nagin, 2006; Nagin,1999, 2005; Nagin & Land, 1993; Nagin & Tremblay, 2005a,b; Roeder et al., 1999;Sampson & Laub, 2005; Wang, Brown, & Bandeen-Roche, 2005). Because theystill employ data to identify trajectories, they are reviewed below but the specificsof the studies are not discussed in this section. Readers interested in a more detailedexposition of the methodology should consult these papers as well as Nagin (2005).Finally, two papers (Griffiths & Chavez, 2004; Weisburd, Bushway, Lum, & Yang,2004) apply the trajectory methodology to the analyses of crime at street segmentsand census tracts. Since these are not concerned with an application of crime at theindividual level, they are not reviewed here.
Substantive Papers
Offender Samples
There have been nine trajectory studies undertaken with offender samples. Fourdifferent data sets have been used, and all subjects were followed through por-tions of adulthood. Thus, no studies considering only childhood and/or child-hood/adolescence are reviewed here. Three studies employ the Boston areadelinquents (i.e., the Glueck sample) (Eggleston et al., 2004; Laub et al., 1998;Sampson & Laub, 2003), three involve cohorts of California Youth Authorityparolees (Ezell & Cohen, 2005; Piquero et al., 2001, 2002), two involve a Dutchconviction cohort (Blokland, Nagin, & Nieuwbeerta, 2005; Blokland & Nieuw-beerta, 2005), and one involves an offenders index from the British Home Office
Taking Stock of Developmental Trajectories of Criminal Activity 35
(Francis, Soothill, & Fligelstone, 2004).16 In general, with the exception of theBritish data, the pattern and similarity of results from the Boston delinquents, theDutch offenders, and the CYA parolees is striking.
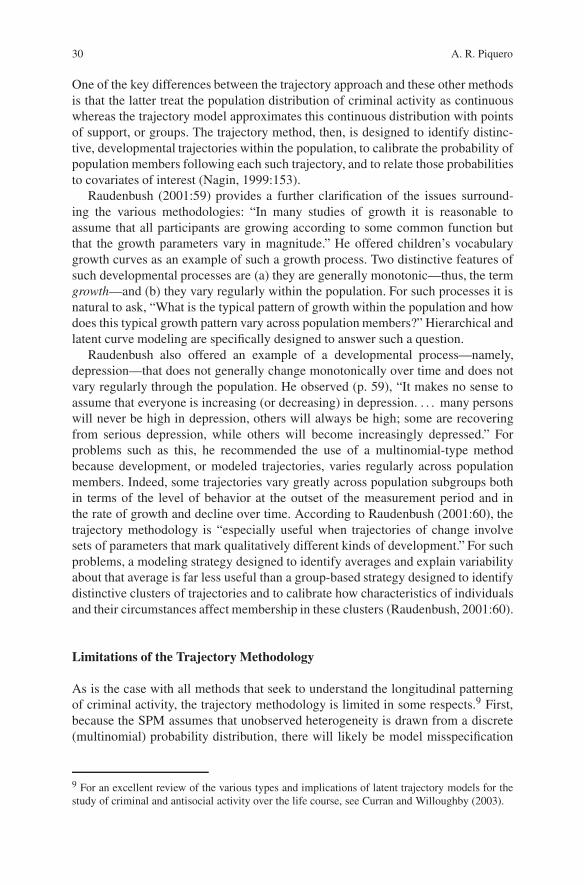
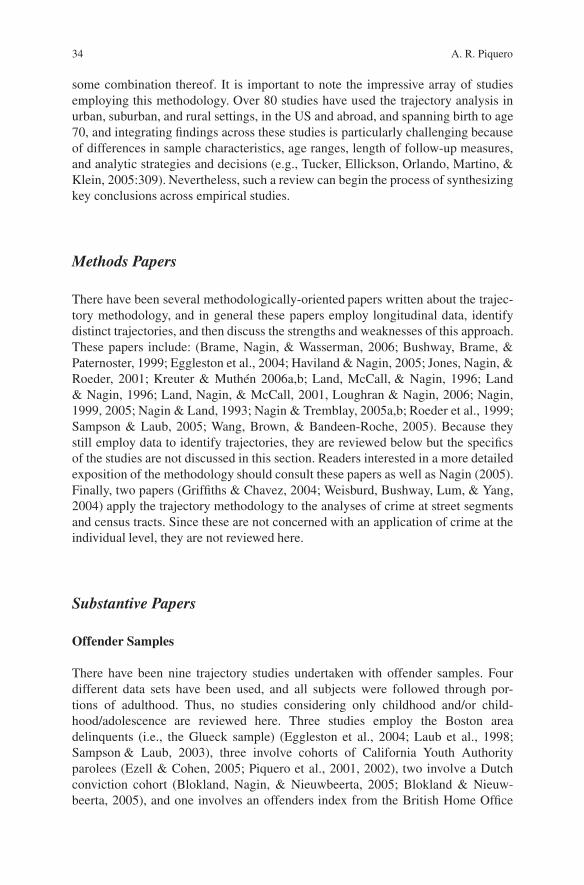
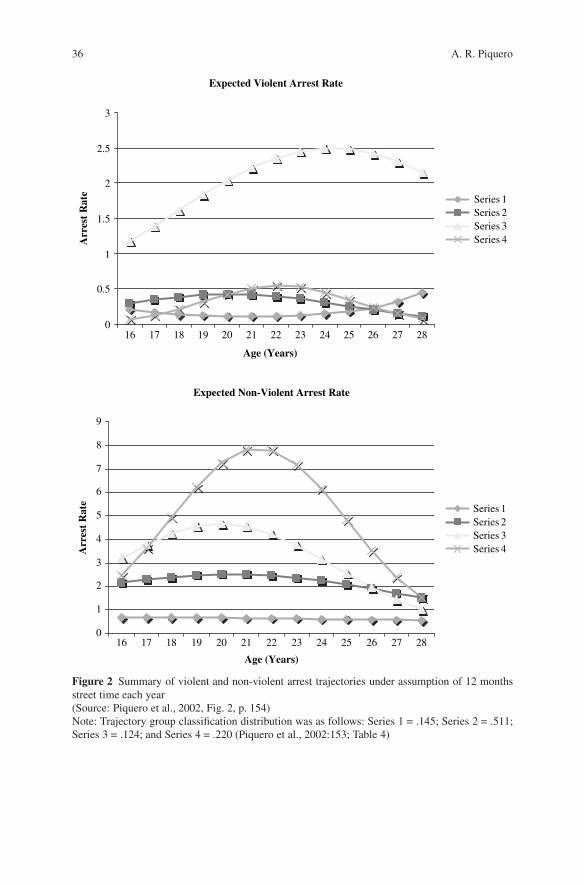
Using data on 500 offenders paroled from California Youth Authority institutionsand followed for seven consecutive years post-parole, Piquero et al. (2002) modeledjoint trajectories17 of violent and non-violent offending throughout the early 20s,as well as their covariates. A number of key findings emerged from their paper.First, four trajectories each were identified for violent and non-violent offending,but non-violent offending rates were always much higher than the violent offend-ing rates. (These joint trajectory graphs are reproduced here in Figure 2). Second,when the trajectory systems were modeled jointly, one of the four systems (shownas Series 1) had a decreasing non-violent arrest rate, but an increasing and stableviolent offending rate. Third, when these authors estimated the effects of variouscovariates on arrest activity after conditioning on group membership, they foundthat some of the covariates exerted different effects across the various groups onboth violent and non-violent criminal activity. For example, their measure of stakesin conformity (which included employment and marriage) was inhibitive of non-violent arrests for their second trajectory system but had no effect whatsoever on theoffending of their third trajectory system. Similarly, heroin and alcohol dependencewas predictive of non-violent arrests for the second trajectory but no effect for vio-lent arrests for the same trajectory. Finally, in an analysis that examined the effectsof covariates on arrest activity and including controls for group membership, theyfound that non-whites were more likely to accumulate violent arrests, that heroindependence was positively related to non-violent arrests, and a measure of stakes inconformity (including marriage and employment) inhibited non-violent arrests.
Analyses of the offending samples have consistently identified four to six tra-jectories. The Piquero et al. (2002) paper just discussed, which contains offendinginformation through age 28 for a sample of CYA parolees, identified four trajectories(for both violent and non-violent arrests, respectively). When total arrests were ana-lyzed, Piquero et al.’s (2001) analysis of a different sample of CYA parolees throughage 33 converged on six trajectories. Ezell and Cohen’s (2005) trajectory analysis forthree different samples of CYA parolees (paroled in 1981–2/1986–7/1991–2) alsoeach favored a six-group model. These trajectories differed both in overall level ofoffending and in the trajectory shape. For example, for the parolee cohort with thelongest follow-up period (1981–2 sample, age 7–37), trajectories differed in average
16 A recent study in South Australia applied the trajectory methodology to the juvenile criminalcareers of a 1984 birth cohort and identified six trajectories (Marshall, 2005), but this study onlyexists, at present, in presentation format.17 Unlike the modeling of a single outcome, joint/dual trajectory analyses model the developmentalcourse of two distinct but related outcomes. According to Nagin (2005:141), the “dual trajectorymodel provides a rich, yet easily comprehended, statistical summary of the developmental linkagesbetween the two outcomes of interest. It can be used to analyze the connections between the devel-opmental trajectories of two outcomes that are evolving contemporaneously (such as depressionand alcohol use) or that evolve over different time periods that may or not overlap (such as prosocialbehavior in childhood and social achievement in adolescence)”.
36 A. R. Piquero
Expected Violent Arrest Rate
0
0.5
1
1.5
2
2.5
3
16 17 18 19 20 21 22 23 24 25 26 27 28
Age (Years)
Arr
est
Rat
eA
rres
t R
ate
Series 1Series 2Series 3Series 4
16 17 18 19 20 21 22 23 24 25 26 27 28
Expected Non-Violent Arrest Rate
0
1
2
3
4
5
6
7
8
9
Age (Years)
Series 1Series 2Series 3Series 4
Figure 2 Summary of violent and non-violent arrest trajectories under assumption of 12 monthsstreet time each year(Source: Piquero et al., 2002, Fig. 2, p. 154)Note: Trajectory group classification distribution was as follows: Series 1 = .145; Series 2 = .511;Series 3 = .124; and Series 4 = .220 (Piquero et al., 2002:153; Table 4)
Taking Stock of Developmental Trajectories of Criminal Activity 37
arrest rates and also in terms of the growth and decline of arrests over time (Ezell &Cohen, 2005:185).
Similarly, when total arrests among the Boston males, first identified as delin-quent at age seven, were analyzed to age 32, Laub et al. (1998) identified fourtrajectories. While all of these trajectories appear to be declining by age 32, onetrajectory had a much higher offending peak than the other three groups. These“high rate chronics” consisted of only eleven individuals. Their offending peakedin the early 20s and then began a slow, gradual decline by the late 20s and early30s. Laub et al. then examined the factors that were related to such trajectories, andfound that after controlling for trajectory group membership, involvement in “goodmarriages” was inhibitive of continued criminal activity in early adulthood.
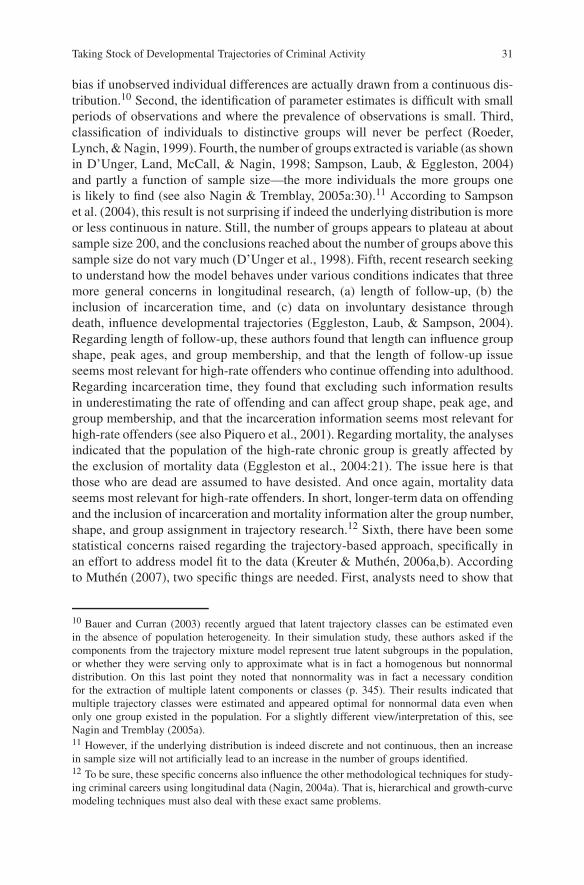
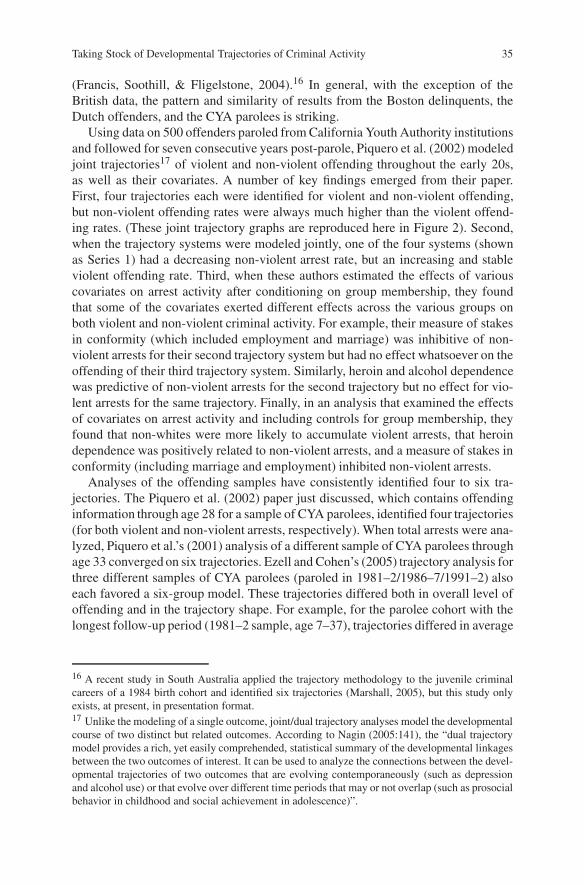
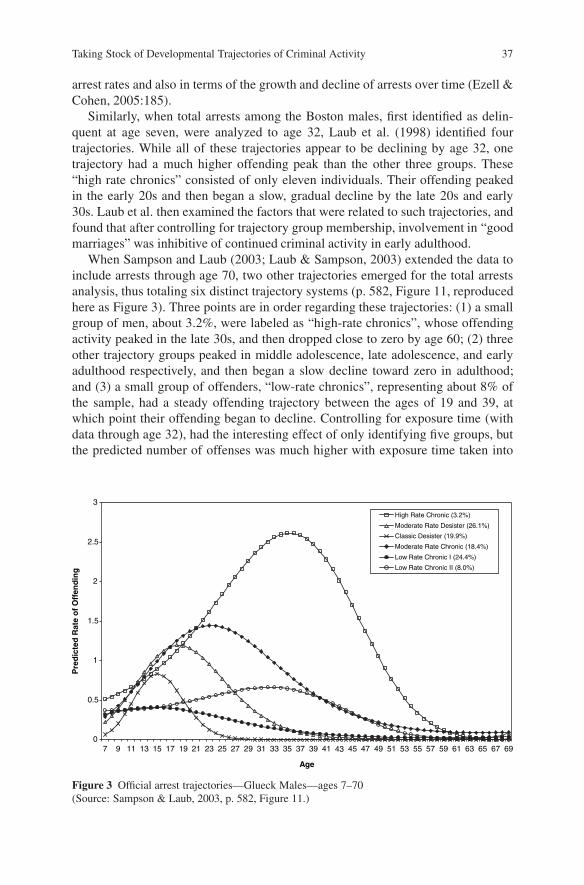
When Sampson and Laub (2003; Laub & Sampson, 2003) extended the data toinclude arrests through age 70, two other trajectories emerged for the total arrestsanalysis, thus totaling six distinct trajectory systems (p. 582, Figure 11, reproducedhere as Figure 3). Three points are in order regarding these trajectories: (1) a smallgroup of men, about 3.2%, were labeled as “high-rate chronics”, whose offendingactivity peaked in the late 30s, and then dropped close to zero by age 60; (2) threeother trajectory groups peaked in middle adolescence, late adolescence, and earlyadulthood respectively, and then began a slow decline toward zero in adulthood;and (3) a small group of offenders, “low-rate chronics”, representing about 8% ofthe sample, had a steady offending trajectory between the ages of 19 and 39, atwhich point their offending began to decline. Controlling for exposure time (withdata through age 32), had the interesting effect of only identifying five groups, butthe predicted number of offenses was much higher with exposure time taken into
0
0.5
1
1.5
2
2.5
3
7 9 11 13 15 17 19 21 23 25 27 29 31 33 35 37 39 41 43 45 47 49 51 53 55 57 59 61 63 65 67 69
Age
Pre
dic
ted
Rat
e o
f O
ffen
din
g
High Rate Chronic (3.2%)
Moderate Rate Desister (26.1%)
Classic Desister (19.9%)
Moderate Rate Chronic (18.4%)
Low Rate Chronic I (24.4%)
Low Rate Chronic II (8.0%)
Figure 3 Official arrest trajectories—Glueck Males—ages 7–70(Source: Sampson & Laub, 2003, p. 582, Figure 11.)
38 A. R. Piquero
consideration. Still, by age 32, the offending patterns in the exposure time analysisappeared to diminish.18
The second main finding from the Sampson and Laub (2003) follow-up studyconcerned the crime-specific trajectories. With regard to violent crime, althoughthere were five distinct trajectory groups, the mean rate of offending was alwayslow for these groups (never above 0.4 arrests per year). Still, the offending trajec-tories for violent offending were quite erratic; that is, all five groups, while havingsomewhat similar shapes, differed in their peaks and their declines. For alcohol/drugoffending, once again five trajectories were observed, with the majority peakingin the mid to late 30s, and then evincing a decline through middle to late adult-hood.
The third key finding concerned the comparison of selected childhood/adolescentrisk factors by trajectory group membership. These results showed inconsistent pat-terns and no statistically significant differences in means across the six groups ofoffending (for total crime only), though the trend was to show that the high-ratechronic group did evince the worst risk factors. It is likely that the differencesdid not emerge as significant because there were only fifteen men in the high-rate chronic group for which to make comparisons. Sampson and Laub concludethat “life-course-persistent” offenders seem to stop offending by middle adulthoodand that they are difficult to identify prospectively using a wide variety of child-hood/adolescent risk factors. It is also worth noting here that the age 7–70 Bostonsample may not only be the longest longitudinal dataset in the world, but also is thefirst to track the offending of serious delinquents throughout the full life course.Analyses from this dataset find no evidence of a flat-trajectory group with age,which has been previously undetected because of middle-adulthood censoring (seeLaub & Sampson, 2003:105).
18 It is interesting to note that in Sampson and Laub (2003), the authors, when considering themean number of days incarcerated per year between ages 7–32, are able to reproduce the classicaggregate age/crime curve and conclude that the trajectories are very similar with street time takeninto consideration. In their companion book, Laub and Sampson (2003:100–103) conclude thatthe age-crime curve and the similarity of offending trajectories is stable (p. 103). Yet in Eggle-ston et al. (2004), the authors reach a somewhat more guarded conclusion. Aside from the factthat the predicted level of offending is much higher when incarceration is taken into consider-ation, offending is predicted to peak at an older age (23 as opposed to 20), and there is a fairamount of instability with the moderate-rate chronic group of offenders: “Thirty-nine percent ofthe moderate-rate chronics in the model without the incarceration parameter are also in this groupwhen incarceration time is included. In other words, over 60% of the men are no longer identifiedas moderate-rate chronics once incarceration time is taken into account” (pp. 17–18). Moreover,the differences with and without exposure time are most dramatic in the high-rate chronic group:“With incarceration time in the model, offending peaks in the early twenties at about six offensesper year and slowly declines thereafter to 1.5 offenses per year by age 32. Without incarceration inthe estimation, offending consistently increases into the early twenties before leveling off at about2 offenses per year” (p. 19). Importantly, “56% of the high-rate chronics in the model withoutincarceration are no longer classified as high-rate chronic offenders when incarceration is takeninto account” (p. 19). They conclude that “the exclusion of incarceration time results in under-estimating the rate of offending and can affect group shape, peak age, and group membership”(p. 21).
Taking Stock of Developmental Trajectories of Criminal Activity 39
The Dutch offender data and trajectory results provide a counter-point to theBoston-area studies. Blokland et al. (2005) used conviction data for a sample of5,164 Dutch offenders over an age span from ages 12–72 and identified four tra-jectory groups: sporadic offenders, low-rate desisters, moderate-rate desisters, andhigh-rate persisters. Importantly, the high-rate persisters engaged in crime, espe-cially property crime, at a very substantial rate even after age 50, and their esti-mated trajectory resembled a fairly flat and stable average conviction rate throughage 72. When comparing their findings to those obtained by Sampson and Laub(2003:588), Blokland et al. (2005:944) indicate that while about 98 percent of theindividuals in their sample follow offending patterns similar to those observed in theBoston-area studies, whom would likely be characterized as “life-course-desisters”,a small group of persistent offenders, making up less than two percent of the sam-pled population, exhibits a relatively flat trajectory of about 2 to 2.5 convictions peryear from age 30 onward, and “does not conform with the Sampson and Laub con-ception of life-course desisters. Their course of offending is in fact best describedby the Moffitt label of life-course persisters.” In a companion piece, Blokland andNieuwbeerta (2005) found that life circumstances (work, becoming a parent, andmarriage) substantially influenced the chances of criminal behavior, and that theeffects of these circumstances on offending differed across offender groups. Forexample, in general, high-rate offenders were less affected by life circumstanceswhen compared to other trajectory groups, while marriage was associated with adrop in conviction rates among those in the low-rate trajectory group (p. 1224).
The British data and analysis are somewhat unique not only because they areof a birth cohort born in 1953 and followed-up with criminal conviction records in1993 at age 40, but because it approaches the trajectory issue in a slightly differ-ent way. Francis et al. (2004) first search for latent types of criminal activity andthen aggregate criminal careers into fixed five-year age periods of each offender’scriminal history. Focusing more on types of crimes within clusters over time (i.e.,they did not assign individuals to clusters), these authors identified nine differentmale clusters and three different female clusters.19 For example, male offendingshowed greater diversity than female offending. Additionally, for males, each typeof offending had a distinct age profile, but this was not evident with the females(Francis et al., 2004).
In sum, the pattern of findings emerging from the offender-based samples, espe-cially the two very different Boston delinquent and CYA parolee samples, whichare not only based on different “types” of delinquents but also in different contextsand time periods, points to two findings. First, offending appears to decline as earlyadulthood approaches for all groups. Second, there appear to be about 4–6 distincttrajectories, on the higher end with more data (i.e., length of observation window),as is expected (Nagin & Tremblay, 2005a). Unfortunately, given the small numberof studies that have used offender-based samples, and the limited capacity that such
19 In the Francis et al. study, each individual can contribute up to six strips (offending age bands),and each strip could theoretically be assigned to a different cluster. The interest underlying theirwork was an examination of how offenders change their offending behavior as they age (i.e., qualityor nature of offending as opposed to quantity of offending).
40 A. R. Piquero
studies have for prediction-based analysis, little information is known about thefactors that relate to trajectory differences within serious offenders followed intoadulthood. Laub et al. (1998) and Laub and Sampson (2003) have shown that goodmarriages lead to low offending trajectories, while Piquero et al. (2002) have foundthat a mixture of stakes-in-conformity and alcohol/heroin dependence relate to crim-inal activity (sometimes violent, sometimes non-violent) differently across differ-ent trajectories: whereas stakes-in-conformity decreased crime, heroin dependenceincreased it. Similarly, Blokland and Nieuwbeerta (2005) found that marriage had aninhibitory effect on crime for some trajectory groups but not others (i.e., high-rateoffenders). Importantly, the substantive results emerging from these studies wereobserved even after controlling for trajectory group membership, which as notedearlier is one vehicle for controlling for unobserved individual differences. Thatthese effects emerged after controlling for such unobserved individual differencesindicates that the effects are quite real.
General Population Samples
There are over a dozen unique US-based longitudinal studies that have employedthe trajectory methodology, most of which have used data from the 1958 Philadel-phia Birth Cohort Study. Some of these studies have been based on strictly gen-eral population and/or birth cohort samples, while others have made use of morehigh-risk, urban samples (such as the OJJDP-funded Pittsburgh Youth Study andthe Rochester Youth Development Study). Other national datasets have contributedto this line of research including the 1945 Philadelphia Birth Cohort Study, the threeRacine, WI cohorts, the National Longitudinal Survey of Youth, the Seattle SocialDevelopment Project, the Oregon Youth Study, and so forth. A number of interna-tional studies have also been undertaken including several using data from the SouthLondon males participating in the Cambridge Study in Delinquent Development(CSDD, used nine different times) as well as the Montreal Longitudinal Studies(used ten different times). Other internationally based longitudinal studies that haveemployed the trajectory methodology include the Christchurch and Dunedin Healthand Human Development Studies, and the Quebec Longitudinal Study. In short, it islikely that the data which have been used the most (the 1958 Philadelphia BirthCohort Study and the Cambridge Study in Delinquent Development) have doneso likely because they are both publicly available and because they contain yearlyobservations of criminal activity for relatively large samples of individuals into themid 20‘s (Philadelphia) and into the 30‘s and beyond (South London). As otherlongitudinal studies age and data become publicly available, there is no doubt thatthey too will be used in great detail.
Here, these studies and their overall findings are grouped by the timeperiod examined: (1) childhood only, (2) adolescence only, and (3) child-hood/adolescence/adulthood. (Note: Adulthood is defined here as post age 20).No studies were located that used the trajectory methodology on an adult-onlygeneral population sample.
Taking Stock of Developmental Trajectories of Criminal Activity 41
Childhood
Only five studies used data in the first ten years of life. Broidy et al. (2003) useddata from six different longitudinal studies, and one of these in particular wasthe Pittsburgh Youth Study, which covered a portion of the first decade of life.Based on teacher- and self-reports between the ages of 7.5 and 10.5, Broidy andher colleagues found that there were four distinct trajectories of physical aggres-sion among the Pittsburgh boys. Interestingly, though not surprising, all four tra-jectories of physical aggression were increasing over the age range studied. Thismay be due to the fact that the males were entering late childhood/early adoles-cence and/or because a subset of the Pittsburgh males was recruited from high-riskareas.
In the second paper, Tremblay et al. (2004) used maternal assessments of phys-ical aggression at 17, 30, and 42 months from 572 Quebec families who had afive-month old infant. Using the trajectory methodology, three distinct clusters ofphysical aggression were identified (little aggression, modest aggression, and highaggression). The best predictors before or at birth of the high physical aggressiontrajectory group, comprising about 14% of the sample, were having young siblings,mothers with high levels of antisocial behavior before the end of high school, moth-ers who started having children early, families with low income, and mothers whosmoked during pregnancy. At five months of age, the best predictors were mothers’coercive parenting behavior and family dysfunction.
In a ten-city, large scale study (Study of Early Child Care and Youth Devel-opment) conducted by the National Institute of Child and Human Development(NICHD, 2004), maternal ratings of offspring aggression were collected betweenages two and nine on 1,195 subjects. Trajectory analyses indicated that a five-groupmodel provided the best fit to the data, comprised of groups corresponding tovery low, low, moderate/declining, moderate, and high trajectories. Specifically,while all five trajectories evinced different starting points, they all tended todecrease in mother-rated aggression from ages two to nine. Additionally, sev-eral variables were able to distinguish membership across the five trajectorysystems.
Finally, in two separate papers, Shaw, Gilliom, Ingoldsby, and Nagin (2003)and Shaw, Lacourse, and Nagin (2005) examined trajectories leading to school-age conduct problems among 284 low-income boys in the Pittsburgh metropoli-tan area. Using the trajectory methodology, four distinct groups of overt conductproblems were identified between ages two and eight. Further analyses indicatedthat while all four groups were evincing declines in parental-reports of conductproblems, the groups differed on various risk factors such as maternal depres-sion, maternal rejecting parenting, and fearlessness. In a subsequent paper, theauthors assessed developmental trajectories of conduct problems and hyperactivityfrom ages two to ten and identified four trajectories for each outcome, and onein particular—the chronic trajectory on hyperactivity/attention problems, remainedhigh and stable throughout the observation period. The authors also reported someoverlap between conduct problems and hyperactivity, but the overlap was far fromcomplete.
42 A. R. Piquero
Childhood and Adolescence
Over twenty studies have applied the trajectory methodology to longitudinal datathrough adolescence, with the Montreal Longitudinal Study and Seattle SocialDevelopment Project accounting for several of these efforts.
Several common themes emerge from these studies. First, the majority of theseefforts use self-reports of a varied nature (teacher, parent, and self) to documentdevelopmental trajectories. Second, many of these studies examine what psychol-ogists call externalizing behaviors which are not always delinquent behaviors,such as conduct problems, physical aggression, oppositional behavior, hyperac-tivity, non-aggression, delinquent peer affiliations, fearfulness, helplessness, andso forth. Third, a few of these studies examine multiple or joint/dual trajectoriessuch as violent/non-violent offending (Brame et al., 2001b), or childhood/adolescentaggression (Brame et al., 2001a; Nagin & Tremblay, 2001a, b).
Two studies in particular are worth highlighting. First, Nagin and his colleagues(2003) examined whether an important life event, grade retention, affected the life-course of physical aggression, and whether its impact varied according to the age atwhich the turning point occurred. Using data from 1,037 males aged 10–15 partic-ipating in the Montreal Longitudinal Study, they found that the influence of graderetention depended on the developmental course of physical aggression, but that theevidence regarding timing was less clear.
In particular, three main conclusions can be drawn from this paper. First, offour distinct trajectory groups identified, grade retention had the largest impact forthe two largest trajectory groups (“moderate declining” and “high declining”), buthad no impact upon the physical aggression of those in the “low” and “chronic”groups. Second, regarding the timing hypothesis, Nagin et al. found that the effect ofgrade retention on physical aggression was unrelated to timing for the “high declin-ing” group, but that it mattered for the “moderate declining” group such that forthese individuals grade retention aggravated classroom physical aggression when itoccurred prior to age 13 but not after age 13. In short, the effects of grade retentionappear to depend upon an individual’s developmental history. Third, given trajec-tory group membership, the results showed that the impact of grade retention onphysical aggression appeared unaffected by the child’s early life characteristics andcircumstances implying that any impact of grade retention on physical aggressionwas independent of pre-existing individual characteristics.
Second, Broidy and her colleagues (2003) used data from six sites (MontrealLongitudinal Study, Quebec Provincial Study, Christchurch Health and Develop-ment Study, Dunedin Multidisciplinary Health and Human Development Study,Pittsburgh Youth Study, and the Child Development Project (a three-site study inKnoxville and Nashville, TN and Bloomington, IN), and three countries (UnitedStates, Canada, New Zealand) to examine the developmental course of physicalaggression in childhood (earliest age was six) through early adolescence (latest agewas 15) and to analyze its linkage to violent/non-violent offending in adolescence.This analysis included whites and non-whites, males and females, and teacher- andself-report ratings in order to understand the development of disruptive behaviors.A number of key findings emerged from their effort.
Taking Stock of Developmental Trajectories of Criminal Activity 43
First, in general, three or four trajectories were routinely observed across the sixstudies (e.g., four among boys in the Montreal Longitudinal Study, four for boys andthree for girls in the Quebec Provincial Study, three for boys and girls, respectively,in the Christchurch Health and Development Study, three for boys and two for girlsin the Dunedin Multidisciplinary Health and Human Development Study, four forboys in the Pittsburgh Youth Study, and three for boys and girls, respectively, in theChild Development Project). Second, while most trajectories of physical aggressionwere decreasing over the follow-up periods, one of the Child Development Projecttrajectories (for both boys and girls) was observed to be increasing and several ofthe Pittsburgh trajectories were observed to increase. The Pittsburgh result shouldnot be too surprising since the last age of follow-up for the Pittsburgh males was10.5 years; still, since half of the Pittsburgh sample was recruited as “high-risk”,it would be interesting to see how long into adolescence the physical aggressiontrajectories continue on their upward path. Third, among boys across the samples,there was continuity in problem behavior from childhood to adolescence. In par-ticular, chronic physical aggression increased the risk for continued physical vio-lence as well as non-violent delinquency during adolescence. This finding however,was not replicated for females as there appeared to be no clear linkage betweenchildhood physical aggression and adolescent offending among females. This is notmeant to indicate that there were no females in the chronic physical aggressiongroup, because there were females in that group; however, while males displayedsimilar patterns of physical aggression, there were mean-level differences (boysscored higher than females) in these trends and there was very little delinquencyin adolescence among females. In sum, the trajectory groups, which were obtainedvia teacher reports, predicted involvement in delinquency in adolescence, obtainedvia self-reports. This suggests that there is continuity in problem behavior acrossinformants from childhood into adolescence.
Aside from these two case studies, two summary statements can be made fromthe trajectory studies that cover the childhood/adolescence period. First, regardlessof the use of self-, teacher-, parent-, or objective antisocial behaviors (includingcriminal and non-criminal outcomes), similar substantive conclusions have beenreached regarding the shape/trend of the various trajectories. That is, by the endof adolescence, most trajectories, regardless of the outcome being assessed, are on adecline. Second and most importantly, it is impressive that across all the variousstudies in different parts of the world using different methodologies to measurecriminal activity over a similar age range, there have been a consistent numberof trajectories identified in these studies. Typically, three to four trajectories areidentified, namely low, medium, and high groups.20 Whether these groups continuein a similar fashion into adulthood is an important question because it deals with
20 This, of course, does not imply that more or fewer trajectories have not been identified in the tra-jectory studies covering the childhood/adolescence time period. For example, Nagin and Tremblay(2001b) identified six distinct trajectories based on self-reports of property offending. Interestingly,one of the groups, “rising chronic”, comprised of 5.9% of the sample, started committing propertyoffending at a high level at age 11 and continued high through age 17. Bongers et al. (2004)also identified six trajectories (of oppositional behavior) using longitudinal data from Holland. As
44 A. R. Piquero
fundamental theoretical (are there two groups of offenders as Moffitt predicts?)and policy-related issues. And this is particularly important because some trajectorystudies have identified a group of relatively late-onset offenders who appear to beincreasing in antisocial activity. Data that follow these subjects into adulthood willbe better able to continue charting the offending course of these late-onset chronicoffenders. The next section reviews those studies that identify trajectories using datafrom childhood, adolescence, and adulthood.
Childhood/Adolescence/Adulthood
Close to thirty studies have applied the trajectory methodology to criminal and anti-social activity in a period covering childhood/adolescence/adulthood. These effortshave used longitudinal data from various locations in the United States, England,Canada, New Zealand, and so forth. Moreover, these efforts have employed random,non-random, and birth cohort samples, males and females, whites and non-whites(including blacks), and in some cases cover offending careers through age 70.
Several common themes cut across these studies. First, many of the studies haveutilized both self-reports and official records (police contacts, arrests, and convic-tions) to study the shape and patterning of criminal activity over the life course.Second, although most efforts have focused on criminal activity, including violentand non-violent crime, others have examined non-criminal trajectories for bingedrinking, heavy drinking, and cigarette smoking. Third, several efforts have paidattention to gender differences in criminal activity trajectories.
Because a review of each of these studies is beyond the scope of this chapter,five studies are highlighted. This section begins with a paper that set out to answera very basic, yet fundamental question regarding offending trajectories: how manylatent classes of delinquent/criminal groups are there?
In a 1998 paper, Amy D’Unger and her colleagues used data from three differentlongitudinal studies, the Cambridge Study in Delinquent Development (CSDD),the 1958 Philadelphia Birth Cohort, and the 1942, 1949, and 1955 Racine, WIbirth cohorts. Using the trajectory methodology, these authors identified four latentclasses in the CSDD, and five in the Philadelphia cohort. In the Racine data, fiveclasses were detected for the 1942 and 1955 cohorts, but only four for the 1949cohort.
Specifically, the four groups indicated in the CSDD data showed a non-offenderclass, a low-rate chronic group whose offending was small but sustained betweenages 10 and 30, an adolescent-limited group whose offending peaked at age 16 andthen declined to about zero at age 22, and a high-rate chronic group whose offendingwas always much higher than the other groups, peaked at about ages 18/20, and wasapproaching zero by age 30.
indicated earlier, a key advantage of the trajectory methodology is its ability to identify distincttrajectories and then to examine how these groups differ on an array of covariates.
Taking Stock of Developmental Trajectories of Criminal Activity 45
The Philadelphia results indicated five groups, two of which stand out: a high-rateadolescence-peaked group, peaking at age 16 and dropping to almost zero by age 21,and a high-rate chronic group who peaked at ages 17/18 and continued at a steadyrate through the early and mid 20s, only to decrease toward the late 20s.
Finally, the three Racine cohorts evidenced pretty different patterns, though thismay be due to the nature of offending in the Racine data (which included trafficcontacts). The 1942 cohort, which yielded five classes, had three groups of interest: alate-onset chronic group, a group not theoretically anticipated in extant developmen-tal criminology models, who evidence late-onset offending and then an increasingand sustained rate of offending through the 20s; a high-rate chronic group whoseoffending peaks earlier and then declines through the 20s, and a low rate chronicgroup who evinces a slow but steady rise in offending through the period betweenages 15 and 25 only to decline slowly by the late 20s. The 1949 Racine cohort,where four classes were identified, had two groups of interest: the first, a high-ratechronic group whose offending peaked in the late teens, remained relatively stablethrough the early 20s, and then began to decline in the mid 20s; and a high-rateadolescence-peaked group whose offending also peaked at age 18 but then steadilydropped through the early to mid 20s. Finally, the 1955 Racine cohort, which alsoyielded evidence of five distinct classes of offenders, indicated three groups of inter-est: an early-onset adolescence-peaked group exhibiting an early onset, adolescentpeak, and a precipitous decline through the early 20s; a high-rate chronic groupwho began a slow and steady increase at age eight, peaking at age 17, and slowlydecreasing offending activity in the early 20s, and a late-onset adolescence-peakedgroup whose offending did not begin in earnest until age 15, peaking at age 18, andthen dropping throughout the 20s.
In short, across all three data sets, the authors observed a consistent set of twoclasses of offenders: an adolescent-peaked group and a chronic group. Althoughidentification of these groups is consistent with the extant developmental theories ofMoffitt and Patterson, the proportion of sample members in these two groups wasnot as expected (i.e., the identified chronic group contained many more persons thanextant theory would predict). Moreover, other findings from these data sets indicatedthat another group, a late-onset chronic group, routinely emerged, again calling intoquestion the simple two offender-group typology.
Using longitudinal data from 808 youths who participated in the Seattle SocialDevelopment Project (SSDP), Chung, Hill, et al. (2002) sought to identify child-hood predictors of different offense trajectories through age 21. Using a self-reportmeasure of offense seriousness, these authors found five distinct classes of offend-ers: non-offenders, chronic offenders, late onsetters, desisters, and escalators. Thelast group in particular was one not anticipated by extant developmental theory.Regression analyses were employed to examine which childhood predictors (atages 10–12) distinguished the offending of these five groups. Their analysis indi-cated that among initial nonoffenders at age 13, late onsetters were distinguishedfrom nonoffenders by individual factors, while among youths already delinquentat age 13, escalators were distinguished from desisters by peer, school, and neigh-borhood factors. In short, it is important to point out that the escalator and desistorgroups, which are not identified in Moffitt’s or Patterson’s theories, represent more
46 A. R. Piquero
than half of the SSDP sample. That other studies have also identified such groupsindicates that modifications are needed to these and other taxonomic theories thatdo not expect such groups, especially the escalating/late-onset chronic group ofoffenders.
D’Unger, Land, and McCall (2002) address the issue of sex differences in offensetrajectories by examining the offending patterns of males and females in the 1958Philadelphia Birth Cohort Study. Utilizing a random sample of 3,000 females and1,000 males from the cohort, their trajectory analysis identified five trajectories formales and three for females.
Regarding the male trajectories, two groups in particular stood out: the high-rate adolescence-peaked group whose offending began in early adolescence, peakedat age 16, and then began a drop toward zero throughout late adolescence andearly adulthood; and a high-rate chronic group whose offending, though not higherthan the afore-mentioned group through age 19, remained stable between mid-adolescence and the mid 20s, only to begin to decline at that point.
Regarding the female trajectories, two of the three groups (the final group beingthe non-offender group) are worth describing. The first of these groups, the low-rateadolescence-peaked group, offended for about a seven-year span, peaking at age 15,and dropping soon thereafter. The second group, the high-rate adolescence-peakedgroup, evinced the highest rate of offending at every age, peaking at age 17 andthen dropping throughout the early 20s. Aside from these differences, perhaps themain overall difference is that while there were similar shapes and trends across thegroups, the male offending rates were always significantly higher than the corre-sponding female rates.
Bushway, Thornberry, and Krohn (2003) used self-report data from the RochesterYouth Development Study to examine issues related to desistance using thetrajectory framework. Following their subjects from age 13.5 to 22, these authorsexamined whether key conclusions regarding desistance would vary according totwo distinct definitions of desistance. The first was a “static” definition of desistancewhich classifies as desistors those individuals who offended at least once beforeage 18, but not afterwards (through age 22). Using this definition, 27.6% of thesample met the desistor definition. The second definition of desistance used a“developmental” definition which is based on the trajectory methodology. Thisdefinition not only indicates which individuals approach a zero rate of offending,but it also provides information regarding how long they have been there.
Their trajectory analysis identified seven distinct clusters of offenders, two ofwhich approximated individuals who looked like they had desisted (p. 144, Figure 1,reproduced here as Figure 4). The authors however, settled on only one of thesegroups as fitting their definition of desistance (i.e., “experienced real change. . . and[provided] no evidence [of] an upswing of offending at the end of the period” (Bush-way et al., 2003:143 and 144). Using this definition, 8.4% of the sample was classi-fied as desistors. Interestingly, of the 291 individuals identified by the two methodsas desistors, there was only agreement by the two methods in 4.8% of the cases.Thus, different proportions of the sample were classified as desistors and differentpeople were classified as desistors. As Bushway et al. (2001) suggest, the trajectorymethodology represents a unique approach to study the process of desistance.
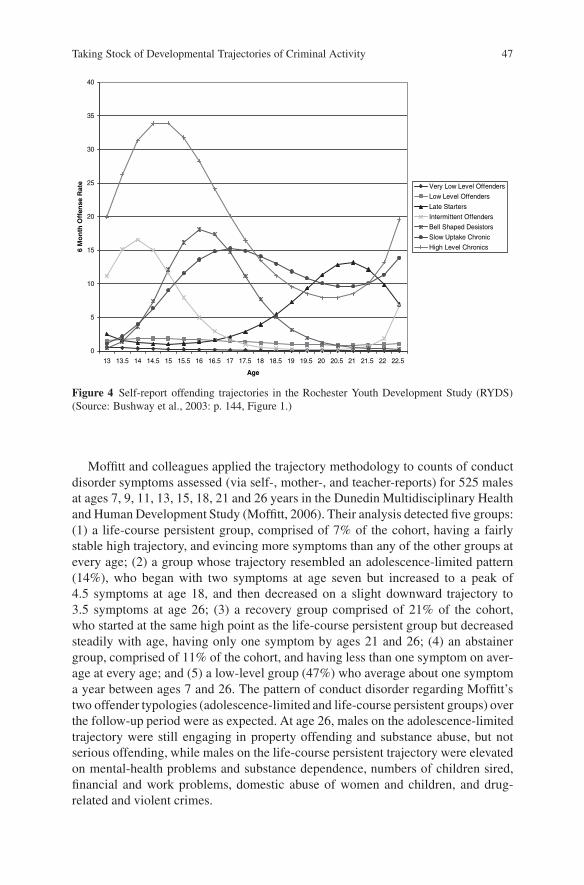
Taking Stock of Developmental Trajectories of Criminal Activity 47
0
5
10
15
20
25
30
35
40
13 13.5 14 14.5 15 15.5 16 16.5 17 17.5 18 18.5 19 19.5 20 20.5 21 21.5 22 22.5
Age
etaR
esneff
Oht
no
M6
Very Low Level Offenders
Low Level Offenders
Late Starters
Intermittent Offenders
Bell Shaped Desistors
Slow Uptake Chronic
High Level Chronics
Figure 4 Self-report offending trajectories in the Rochester Youth Development Study (RYDS)(Source: Bushway et al., 2003: p. 144, Figure 1.)
Moffitt and colleagues applied the trajectory methodology to counts of conductdisorder symptoms assessed (via self-, mother-, and teacher-reports) for 525 malesat ages 7, 9, 11, 13, 15, 18, 21 and 26 years in the Dunedin Multidisciplinary Healthand Human Development Study (Moffitt, 2006). Their analysis detected five groups:(1) a life-course persistent group, comprised of 7% of the cohort, having a fairlystable high trajectory, and evincing more symptoms than any of the other groups atevery age; (2) a group whose trajectory resembled an adolescence-limited pattern(14%), who began with two symptoms at age seven but increased to a peak of4.5 symptoms at age 18, and then decreased on a slight downward trajectory to3.5 symptoms at age 26; (3) a recovery group comprised of 21% of the cohort,who started at the same high point as the life-course persistent group but decreasedsteadily with age, having only one symptom by ages 21 and 26; (4) an abstainergroup, comprised of 11% of the cohort, and having less than one symptom on aver-age at every age; and (5) a low-level group (47%) who average about one symptoma year between ages 7 and 26. The pattern of conduct disorder regarding Moffitt’stwo offender typologies (adolescence-limited and life-course persistent groups) overthe follow-up period were as expected. At age 26, males on the adolescence-limitedtrajectory were still engaging in property offending and substance abuse, but notserious offending, while males on the life-course persistent trajectory were elevatedon mental-health problems and substance dependence, numbers of children sired,financial and work problems, domestic abuse of women and children, and drug-related and violent crimes.
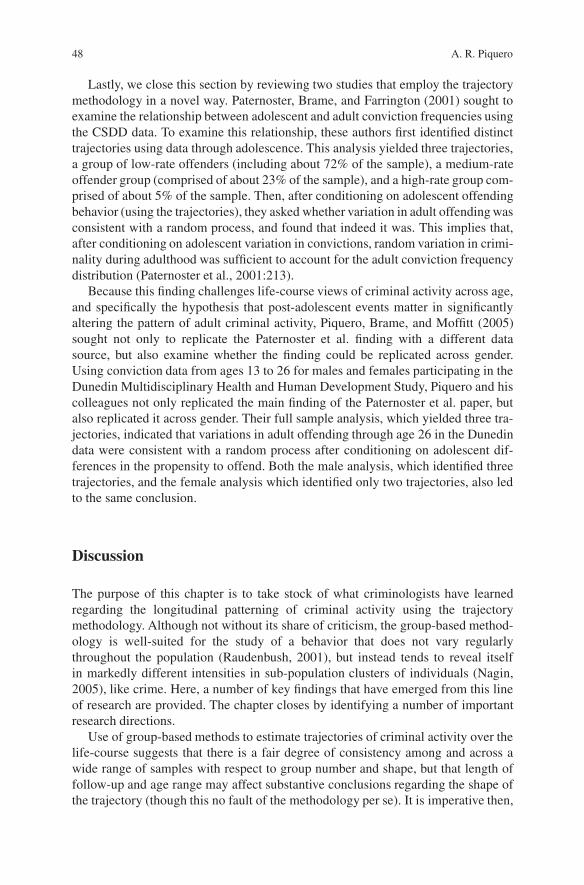
48 A. R. Piquero
Lastly, we close this section by reviewing two studies that employ the trajectorymethodology in a novel way. Paternoster, Brame, and Farrington (2001) sought toexamine the relationship between adolescent and adult conviction frequencies usingthe CSDD data. To examine this relationship, these authors first identified distincttrajectories using data through adolescence. This analysis yielded three trajectories,a group of low-rate offenders (including about 72% of the sample), a medium-rateoffender group (comprised of about 23% of the sample), and a high-rate group com-prised of about 5% of the sample. Then, after conditioning on adolescent offendingbehavior (using the trajectories), they asked whether variation in adult offending wasconsistent with a random process, and found that indeed it was. This implies that,after conditioning on adolescent variation in convictions, random variation in crimi-nality during adulthood was sufficient to account for the adult conviction frequencydistribution (Paternoster et al., 2001:213).
Because this finding challenges life-course views of criminal activity across age,and specifically the hypothesis that post-adolescent events matter in significantlyaltering the pattern of adult criminal activity, Piquero, Brame, and Moffitt (2005)sought not only to replicate the Paternoster et al. finding with a different datasource, but also examine whether the finding could be replicated across gender.Using conviction data from ages 13 to 26 for males and females participating in theDunedin Multidisciplinary Health and Human Development Study, Piquero and hiscolleagues not only replicated the main finding of the Paternoster et al. paper, butalso replicated it across gender. Their full sample analysis, which yielded three tra-jectories, indicated that variations in adult offending through age 26 in the Dunedindata were consistent with a random process after conditioning on adolescent dif-ferences in the propensity to offend. Both the male analysis, which identified threetrajectories, and the female analysis which identified only two trajectories, also ledto the same conclusion.
Discussion
The purpose of this chapter is to take stock of what criminologists have learnedregarding the longitudinal patterning of criminal activity using the trajectorymethodology. Although not without its share of criticism, the group-based method-ology is well-suited for the study of a behavior that does not vary regularlythroughout the population (Raudenbush, 2001), but instead tends to reveal itselfin markedly different intensities in sub-population clusters of individuals (Nagin,2005), like crime. Here, a number of key findings that have emerged from this lineof research are provided. The chapter closes by identifying a number of importantresearch directions.
Use of group-based methods to estimate trajectories of criminal activity over thelife-course suggests that there is a fair degree of consistency among and across awide range of samples with respect to group number and shape, but that length offollow-up and age range may affect substantive conclusions regarding the shape ofthe trajectory (though this no fault of the methodology per se). It is imperative then,
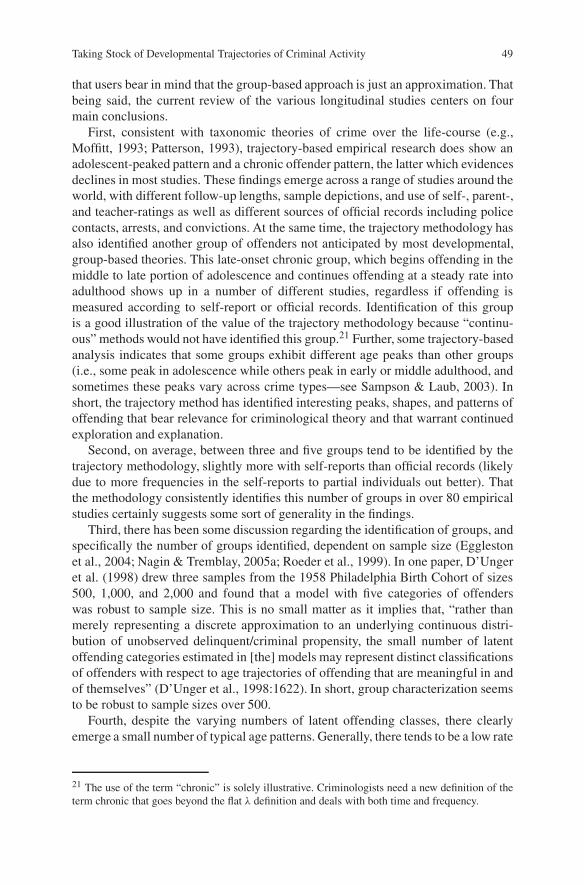
Taking Stock of Developmental Trajectories of Criminal Activity 49
that users bear in mind that the group-based approach is just an approximation. Thatbeing said, the current review of the various longitudinal studies centers on fourmain conclusions.
First, consistent with taxonomic theories of crime over the life-course (e.g.,Moffitt, 1993; Patterson, 1993), trajectory-based empirical research does show anadolescent-peaked pattern and a chronic offender pattern, the latter which evidencesdeclines in most studies. These findings emerge across a range of studies around theworld, with different follow-up lengths, sample depictions, and use of self-, parent-,and teacher-ratings as well as different sources of official records including policecontacts, arrests, and convictions. At the same time, the trajectory methodology hasalso identified another group of offenders not anticipated by most developmental,group-based theories. This late-onset chronic group, which begins offending in themiddle to late portion of adolescence and continues offending at a steady rate intoadulthood shows up in a number of different studies, regardless if offending ismeasured according to self-report or official records. Identification of this groupis a good illustration of the value of the trajectory methodology because “continu-ous” methods would not have identified this group.21 Further, some trajectory-basedanalysis indicates that some groups exhibit different age peaks than other groups(i.e., some peak in adolescence while others peak in early or middle adulthood, andsometimes these peaks vary across crime types—see Sampson & Laub, 2003). Inshort, the trajectory method has identified interesting peaks, shapes, and patterns ofoffending that bear relevance for criminological theory and that warrant continuedexploration and explanation.
Second, on average, between three and five groups tend to be identified by thetrajectory methodology, slightly more with self-reports than official records (likelydue to more frequencies in the self-reports to partial individuals out better). Thatthe methodology consistently identifies this number of groups in over 80 empiricalstudies certainly suggests some sort of generality in the findings.
Third, there has been some discussion regarding the identification of groups, andspecifically the number of groups identified, dependent on sample size (Egglestonet al., 2004; Nagin & Tremblay, 2005a; Roeder et al., 1999). In one paper, D’Ungeret al. (1998) drew three samples from the 1958 Philadelphia Birth Cohort of sizes500, 1,000, and 2,000 and found that a model with five categories of offenderswas robust to sample size. This is no small matter as it implies that, “rather thanmerely representing a discrete approximation to an underlying continuous distri-bution of unobserved delinquent/criminal propensity, the small number of latentoffending categories estimated in [the] models may represent distinct classificationsof offenders with respect to age trajectories of offending that are meaningful in andof themselves” (D’Unger et al., 1998:1622). In short, group characterization seemsto be robust to sample sizes over 500.
Fourth, despite the varying numbers of latent offending classes, there clearlyemerge a small number of typical age patterns. Generally, there tends to be a low rate
21 The use of the term “chronic” is solely illustrative. Criminologists need a new definition of theterm chronic that goes beyond the flat λ definition and deals with both time and frequency.
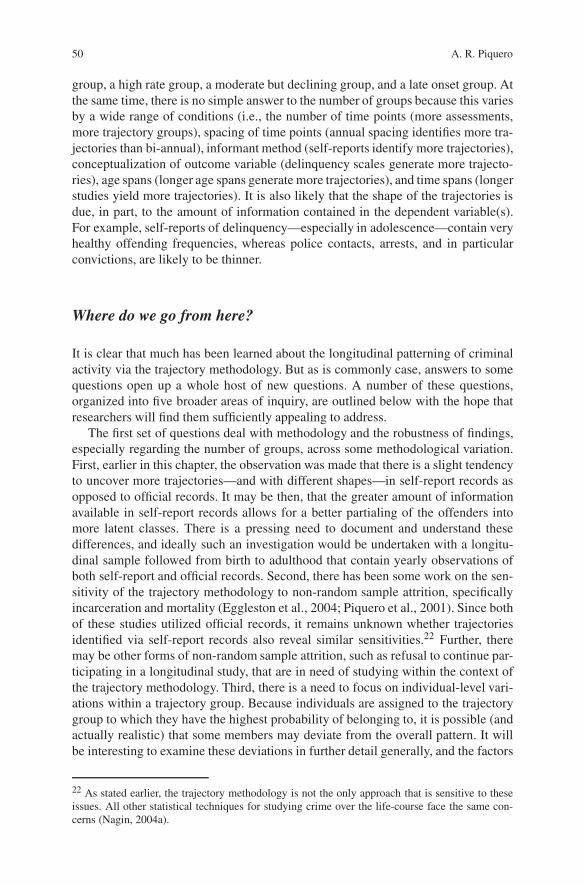
50 A. R. Piquero
group, a high rate group, a moderate but declining group, and a late onset group. Atthe same time, there is no simple answer to the number of groups because this variesby a wide range of conditions (i.e., the number of time points (more assessments,more trajectory groups), spacing of time points (annual spacing identifies more tra-jectories than bi-annual), informant method (self-reports identify more trajectories),conceptualization of outcome variable (delinquency scales generate more trajecto-ries), age spans (longer age spans generate more trajectories), and time spans (longerstudies yield more trajectories). It is also likely that the shape of the trajectories isdue, in part, to the amount of information contained in the dependent variable(s).For example, self-reports of delinquency—especially in adolescence—contain veryhealthy offending frequencies, whereas police contacts, arrests, and in particularconvictions, are likely to be thinner.
Where do we go from here?
It is clear that much has been learned about the longitudinal patterning of criminalactivity via the trajectory methodology. But as is commonly case, answers to somequestions open up a whole host of new questions. A number of these questions,organized into five broader areas of inquiry, are outlined below with the hope thatresearchers will find them sufficiently appealing to address.
The first set of questions deal with methodology and the robustness of findings,especially regarding the number of groups, across some methodological variation.First, earlier in this chapter, the observation was made that there is a slight tendencyto uncover more trajectories—and with different shapes—in self-report records asopposed to official records. It may be then, that the greater amount of informationavailable in self-report records allows for a better partialing of the offenders intomore latent classes. There is a pressing need to document and understand thesedifferences, and ideally such an investigation would be undertaken with a longitu-dinal sample followed from birth to adulthood that contain yearly observations ofboth self-report and official records. Second, there has been some work on the sen-sitivity of the trajectory methodology to non-random sample attrition, specificallyincarceration and mortality (Eggleston et al., 2004; Piquero et al., 2001). Since bothof these studies utilized official records, it remains unknown whether trajectoriesidentified via self-report records also reveal similar sensitivities.22 Further, theremay be other forms of non-random sample attrition, such as refusal to continue par-ticipating in a longitudinal study, that are in need of studying within the context ofthe trajectory methodology. Third, there is a need to focus on individual-level vari-ations within a trajectory group. Because individuals are assigned to the trajectorygroup to which they have the highest probability of belonging to, it is possible (andactually realistic) that some members may deviate from the overall pattern. It willbe interesting to examine these deviations in further detail generally, and the factors
22 As stated earlier, the trajectory methodology is not the only approach that is sensitive to theseissues. All other statistical techniques for studying crime over the life-course face the same con-cerns (Nagin, 2004a).
Taking Stock of Developmental Trajectories of Criminal Activity 51
that are associated with such deviations specifically. Fourth, it is useful that thetrajectory methodology allows and can control for periods of intermittency, or thestops and starts that characterize many offending careers. While theoretical explana-tions of the zig-zagging between offending and non-offending periods throughoutindividual criminal careers are lacking (Nagin & Land, 1993; Piquero, 2004) andare needed in order to develop more complete accounts of criminal activity, furtherexploration of intermittency within the trajectory method is needed especially acrossreporting method (official versus self-report records). Finally, there is a need for thekind of cross-site, cross-sample replication that was undertaken by Broidy et al. andD’Unger et al. where the same question was applied across a number of differentdata sources. While such research is difficult to undertake because of differencesin measurement, operationalization, age/time spans, and so forth, it provides animportant means of replication of substantive results.
A second set of questions deal with the exploration of more substantive issues.First, one of the key findings emerging from studies using the trajectory method-ology to identify longitudinal patterns of offending is the almost routine identifica-tion of a “late onset chronic” group. Because extant developmental theory does notanticipate this group (see Patterson, 1997 for an exception), theoretical modificationis in order. Moreover, extant criminological theory must also come to grips withthis group and further examine if the traditional processes assumed for all offend-ers (in terms of persistence and desistance) similarly hold for this group. Second,the study of desistance is central to matters of theory and policy and longitudinalstudies are ideal for helping researchers better understand the process of desis-tance and its time-varying correlates. The trajectory methodology stands in a goodposition to study this question (Bushway et al., 2001; Laub et al., 1998), and thefindings reviewed earlier by Bushway and colleagues (2003) using the trajectorymethodology to study desistance in the Rochester Youth Development Study areillustrative. Future efforts should shy away from arbitrary desistance definitions andconsider employing the trajectory methodology to study the desistance question.Third, Sampson and colleagues (2004) have called into question the existence ofa stable group of high-rate offenders, or what Moffitt has termed the “life-coursepersistent” offender. One wonders whether Moffitt meant that life-course persistentoffenders offend at similarly high, stable rates throughout their entire lives rightup until their death (see Moffitt, 2006 for a counterpoint). Thus, while Sampsonet al.‘s findings are important in documenting that very few 70 year olds offendat stable rates, we do not think that Moffitt (and others) had this in mind whenconstructing their taxonomic theories (Piquero & Moffitt, 2005). Still, it would beinteresting to examine whether Sampson and Laub’s findings hold in other datasets,especially since prior research shows continued self-report criminal activity even inthe absence of officially recorded criminal activity well into adulthood (see Nagin,Farrington, & Moffitt, 1995). Fourth, while researchers have begun to examine therole of gender with regard to offending trajectories (Broidy et al., 2003; D’Ungeret al., 2002; Piquero, Brame, & Moffitt, 2005), there has yet to be an analysis thathas examined race differences in offense trajectories over the life-course. Importantquestions emerge here: do Blacks have different trajectories than whites and/or His-panics? Do these patterns differ across violent and non-violent crimes? Given thatBlacks persist in crime longer than Whites (Elliott, 1994), and that this is due largely
52 A. R. Piquero
to prevalence differences in violence over time, it seems important to document notonly race differences in longitudinal patterns of crime and the factors associatedwith such trajectories, but also to do so across reporting method. As Moffitt (1994)anticipates more African-Americans in the life-course persistent group, this is animportant theoretical hypothesis deserving of attention.
The third set of questions deals with changing contexts and changing life eventsand how they relate to trajectories. First, the Moving to Opportunity studies havedemonstrated the importance of assessing the role of changing contexts on individ-ual outcomes. However, to date, such an examination has not been considered withthe trajectory methodology. For example, what happens to offending trajectorieswhen individuals move from one context (say high poverty/high crime) to anothercontext (say low poverty/low crime)? Or what happens when an individual changesschool districts? What happens to their offending trajectory? What happens to theirgrades trajectory? These questions, as well as several not listed above, should proveto be very interesting applications of joint trajectory models. Second, and more gen-erally, the use of the trajectory methodology stands in a unique position to examinehow life events alter either upward or downward trajectories of offending holdingindividual differences constant (Nagin, Pagani, Tremblay, & Vitaro, 2003). Unfor-tunately, very few studies have been completed in this regard. One in particular thatis worthy of exploration stands out: the joining of a gang and how that influences acriminal trajectory thereafter. Relatedly, the effect of life events on crime trajectorymay vary according to the phase in the life-course in which the life event occurs;for example having a child at age 17 may exert a different kind of effect on crimewhen compared to having a child at age 27. In short, extensions of the trajectorymethodology can be used to make causal inferences about the impact of turningpoints and interventions on developmental trajectories (Haviland & Nagin, 2005;Wang et al., 2005).
A fourth question concerns the relevance of the results emerging from trajectoryapplications for addressing policy-related questions. Here, a specific example is pre-sented along with a specific word of caution. In the first example, consider the casewhere two trajectory systems start at the same point, but then go in two differentdirections (one stays high on crime while the other evinces a sharp decrease). Thecorrelates associated with these two trajectories may differ and to the extent that theydo, this would potentially imply different points of intervention (while at the sametime recognizing that the same intervention may not be applicable to all offendersor even all offenders in a particular trajectory). At the same time, a specific wordof caution must be noted. Researchers need to be careful that policymakers do nottake high-rate chronic offenders (or whatever label is applied to the highest-rateoffending group) and “do” something with them. The fear here, of course, is that thehigh level of offending portrayed by these individuals will make them candidates forspecific and harsh punishment experiences.23
23 Stated differently, the risk is more about “doing something” to people predicted to be high-rateoffenders. This is the classic problem of prospective identification of high-rate offenders (Gottfred-son & Hirschi, 1986). The issue may be more magnified within the trajectory context, when groupidentification combined with the ever-present problem of reification seems to heighten the risk.
Taking Stock of Developmental Trajectories of Criminal Activity 53
Finally, for the most part, the trajectory methodology has been used to identifydistinct trajectory systems and determine how they vary along relevant covariates.Another interesting though under-developed use of the trajectory methodology isthat by identifying distinct groups, it can afford researchers new opportunities. Forexample, if a researcher using the trajectory methodology identified four distinctoffender groups by age 18 using police arrest data, s/he could then take a randomsample of five or ten individuals from each of those groups and then conduct a seriesof qualitative interviews from members of each trajectory system. This approachallows the trajectory methodology to use the empirical information to form a quali-tative component to the study without selecting individuals based on some relativelyarbitrary criterion.
This chapter reviewed what has been learned about crime over the life-coursewith the adoption of the trajectory methodology. This new method is being usedincreasingly often and offers some glimpses to criminal activity that are unavail-able with other methods. Of course, this does not mean that this approach is supe-rior to other approaches; it is but one in the criminologist’s toolkit. Researchersstudying the natural history of offending have at their disposal a number of impor-tant methodological tools that can be used to document the patterning of crimi-nal activity. All of these tools make assumptions, and all of these tools have bothstrengths and weaknesses. Research should capitalize on these strengths, developapproaches that recognize and modify weaknesses, and continue to investigate theissues addressed in this chapter. Replication and convergence of substantive con-clusions across different methodologies, is important because it speaks directly tofundamental debates in the field of criminology in general, and developmental crim-inology in particular.
Acknowledgment The author would like to thank Robert Brame, John Laub, Akiva Liberman,Bengt Muthen, Edward Mulvey, Daniel Nagin, and Robert Sampson for comments andsuggestions.
References
Abroms, L., Simons-Morton, B., Haynie, D. L., & Chen, R. (2005). Psychosocial predictors ofsmoking trajectories during middle and high school. Addiction, 100, 852–861.
Bauer, D. J., & Curran, P. J. (2003). Distributional assumptions of growth mixture models: Impli-cations for overextraction of latent trajectory classes. Psychological Methods, 8, 338–363.
Blokland, A. A. J., Nagin, D. S., & Nieuwbeerta, P. (2005). Life span offending trajectories of aDutch conviction cohort. Criminology, 43, 919–954.
Blokland, A. A. J., & Paul Nieuwbeerta, P. (2005). The effects of life circumstances on longitudinaltrajectories of offending. Criminology, 43, 1203–1240.
Blumstein, A., Cohen, J., & Farrington, D. P. (1988a). Criminal career research: Its value forcriminology. Criminology, 26, 1–35.
Blumstein, A., Cohen, J., & Farrington, D. P. (1988b). Longitudinal and criminal career research:Further clarifications. Criminology, 26, 57–74.
Blumstein, A., Cohen, J., Roth, J. A., & Visher, C. A. (Eds.). (1986). Criminal careers and careercriminals. Washington, DC: National Academy Press.
54 A. R. Piquero
Bongers, I. L., Koot, H. M., van der Ende, J., & Verhulst, F. C. (2004). Developmental trajectoriesof externalizing behaviors in childhood and adolescence. Child Development, 75, 1523–1537.
Blumstein, A., Farrington, D. P., & Moitra, S. (1985). Delinquency careers: Innocents, desisters,and persisters. In M. Tonry & N. Morris (Eds.), Crime and justice: An annual review ofresearch (Vol. 6, pp. 187–219). Chicago: University of Chicago Press.
Blumstein, A., & Moitra, S. (1980). Identification of ‘career criminals’ from ‘chronic offenders’in a cohort. Law and Policy Quarterly, 2, 321–334.
Brame, R., Bushway, S., & Paternoster, R. (2003). Examining the prevalence of criminal desis-tance. Criminology, 41, 423–448.
Brame, R., Bushway, S. D., Paternoster, R., & Thornberry, T. (2005). Temporal linkages in violentand nonviolent criminal activity. Journal of Quantitative Criminology, 21, 149–174.
Brame, R., Mulvey, E. P., & Piquero, A. R. (2001a). On the development of different kinds ofcriminal activity. Sociological Methods and Research, 29, 319–341.
Brame, R., Nagin, D. S., & Tremblay, R. E. (2001b). Developmental trajectories of physical aggres-sion from school entry to late adolescence. Journal of Child Psychology and Psychiatry, 42,503–512.
Brame, R., Nagin, D. S., & Wasserman, L. (2006). Exploring some analytical characteristics offinite mixture models. Journal of Quantitative Criminology, 22, 31–59.
Britt, C. L. (1992). Constancy and change in the U. S. age distribution of crime: A test of theinvariance hypothesis. Journal of Quantitative Criminology, 8, 175–187.
Broidy, L. M., Nagin, D. S., Tremblay, R. E., Bates, J. E., Brame, R., Dodge, K. A., et al. (2003).Developmental trajectories of childhood disruptive behaviors and adolescent delinquency: Asix-site, cross-national study. Developmental Psychology, 39, 222–245.
Bushway, S. D., Brame, R., & Paternoster, R. (1999). Assessing stability and change in crimi-nal offending: A comparison of random effects, semiparametric, and fixed effects modelingstrategies. Journal of Quantitative Criminology, 15, 23–61.
Bushway, S. D., Piquero, A. R., Broidy, L. M., Cauffman, E., & Mazerolle, P. (2001). An empiricalframework for studying desistance as a process. Criminology, 39, 491–516.
Bushway, S. D., Thornberry, T. P., & Krohn, M. D. (2003). Desistance as a developmental process:A comparison of static and dynamic approaches. Journal of Quantitative Criminology, 19,129–153.
Casswell, S., Pledger, M., & Pratap, S. (2002). Trajectories of drinking from 18 to 26 years: Iden-tification and prediction. Addiction, 97, 1427–1437.
Chassin, L., Flora, D. B., & King, K. M. (2004). Trajectories of alcohol and drug use and depen-dence from adolescence to adulthood: The effects of familial alcoholism and personality. Jour-nal of Abnormal Psychology, 113, 483–498.
Chassin, L., Pitts, S. C., & Prost, J. (2002). Binge drinking trajectories from adolescence to emerg-ing adulthood in a high-risk sample: Predictors and substance abuse outcomes. Journal ofConsulting and Clinical Psychology, 70, 67–78.
Chassin, L., Presson, C. C., Pitts, S.C., & Sherman, S. J. (2000). The natural history of cigarettesmoking from adolescence to adulthood in a midwestern community sample: Multiple trajec-tories and their psychosocial correlates. Health Psychology, 19, 223–231.
Christ, M., Krishnan, R., Nagin, D. S., Kraut, R., & Gunther, O. (2001). Trajectories of individualWWW usage: Implications for electronic commerce. Proceedings of the 34th Hawaii Interna-tional Conference on System Science, 1–8.
Chung, I-J., Hawkins, J. D., Gilchrist, L. D., Hill, K. G., & Nagin, D. S. (2002). Identifying andpredicting offending trajectories among poor children. Social Service Review, 76, 663–685.
Chung, I-J., Hill, K. G., Hawkins, J. D., & Gilchrist, L. D. (2002). Childhood predictors of offensetrajectories. Journal of Research in Crime and Delinquency, 39, 60–90.
Colder, C. R., Balanda, K., Mayhew, K. P., Pentz, M. A., Mehta, P., Campbell, R. T., et al. (2001).Identifying trajectories of adolescent smoking: An application of latent growth mixture mod-eling. Health Psychology, 20, 127–135.
Colder, C. R., Campbell, R. T., Ruel, E., Richardson, J. L., & Flay, B. R. (2002). A finite mixturemodel of growth trajectories of adolescent alcohol use: Predictors and consequences. Journalof Consulting and Clinical Psychology, 70, 976–985.
Taking Stock of Developmental Trajectories of Criminal Activity 55
Cote, S., Tremblay, R. E., Nagin, D. S., Zoccolillo, M., & Vitaro, F. (2002a). Childhood behavioralprofiles leading to adolescent conduct disorder: Risk trajectories for boys and girls. Journal ofthe American Academy of Child and Adolescent Psychiatry, 41, 1086–1094.
Cote, S., Tremblay, R. E., Nagin, D. S., Zoccolillo, M., & Vitaro, F. (2002b). The developmentof impulsivity, fearfulness, and helpfulness, during childhood: Patterns of consistency andchange in the trajectories of boys and girls. Journal of Child Psychology and Psychiatry, 43,609–618.
Cote, S., Zoccolillo, M., Tremblay, R. E., Nagin, D. S., & Vitaro, F. (2001). Predicting girls’conduct disorder in adolescence from childhood trajectories of disruptive behaviors. Journalof the American Academy of Child and Adolescent Psychiatry, 40, 678–684.
Curran, P. J., & Willoughby, M. T. (2003). Implications of latent trajectory models for the study ofdevelopmental psychopathology. Development and Psychopathology, 15, 581–612.
D’Unger, A. V., Land, K. C., & McCall, P. L. (2002). Sex differences in age patterns of delin-quent/criminal careers: Results from poisson latent class analyses of the Philadelphia BirthCohort. Journal of Quantitative Criminology, 18, 349–375.
D’Unger, A. V., Land, K. C., McCall, P. L., & Nagin, D. S. (1998). How many latent classesof delinquent/criminal careers? Results from mixed poisson regression analyses of theLondon, Philadelphia, and Racine cohort studies. American Journal of Sociology, 103,1593–1630.
Eggleston, E. P., Laub, J. H., & Sampson, R. J. (2004). Methodological sensitivities to latentclass analysis of long-term criminal trajectories. Journal of Quantitative Criminology, 20,1–26.
Ellickson, P. L., Martino, S. C., & Collins, R. L. (2004). Marijuana use from adolescence to youngadulthood: Multiple developmental trajectories and their associated outcomes. Health Psy-chology, 23, 299–307.
Elliott, D. S. (1994). 1993 Presidential Address: Serious, violent offenders: Onset, developmentalcourse, and termination. Criminology, 32, 1–22.
Ezell, M. E., & Cohen, L. E. (2005). Desisting from crime: Continuity and change in long-termcrime patterns of serious chronic offenders. Oxford: Oxford University Press.
Farrington, D. P. (1979). Longitudinal research on crime and delinquency. In N. Morris & M.Tonry (Eds.), Crime and justice: An annual review of research (Vol. 1, pp. 289–348). Chicago:University of Chicago Press.
Fergusson, D. M., & Horwood, L. J. (2002). Male and female offending trajectories. Developmentand Psychopathology, 14, 159–177.
Fergusson, D. M., Horwood, L. J., & Nagin, D. S. (2000). Offending trajectories in a New Zealandcohort. Criminology, 38, 525–552.
Francis, B., Soothill, K., & Fligelstone, R. (2004). Identifying patterns and pathways of offend-ing behaviour: A new approach to typologies of crime. European Journal of Criminology, 1,47–88.
Gottfredson, M. R., & Hirschi, T. (1986). The true value of lambda would appear to be zero: Anessay on career criminals, criminal careers, selective incapacitation, cohort studies, and relatedtopics. Criminology, 24, 213–233.
Gottfredson, M. R., & Hirschi, T. (1988). Science, public policy, and the career paradigm. Crimi-nology, 26, 37–55.
Gottfredson, M. R., & Hirschi, T. (1990). A general theory of crime. Stanford, CA: Stanford Uni-versity Press.
Greenberg, D. F. (1991). Modeling criminal careers. Criminology, 29, 17–45.Griffiths, E., & Chavez, J. M. (2004). Communities, street guns and homicide trajectories in
Chicago, 1980–1995: Merging methods for examining homicide trends across space and time.Criminology, 42, 941–978.
Guo, J., Chung, I-J., Hill, K. G., Hawkins, J. D., Catalano, R. F., & Abbott, R. D. (2002). Devel-opmental relationships between adolescent substance use and risky sexual behavior in youngadulthood. Journal of Adolescent Health, 31, 354–362.
Hamil-Luker, J. (2005). Trajectories of public assistance receipt among female high schooldropouts. Population Research and Policy Review, 24, 673–694.
56 A. R. Piquero
Hamil-Luker, J., Land, K. C., & Blau, J. (2004). Diverse trajectories of cocaine use through earlyadulthood among rebellious and socially conforming youth. Social Science Research, 33,300–321.
Haviland, A. M., & Nagin, D. S. (2005). Causal inferences with group based trajectory models.Psychometrika, 70, 557–578.
Hill, K. G., White, H. R., Chung, I-J., Hawkins, J. D., & Catalano, R. F. (2000). Early adult out-comes of adolescent binge-drinking: Person- and variable-centered analyses of binge drinkingtrajectories. Alcoholism: Clinical and Experimental Research, 24, 892–901.
Hix-Small, H., Duncan, T. E., Duncan, S. C., & Okut, H. (2004). A multivariate associative finitegrowth mixture modeling approach examining adolescent alcohol and marijuana use. Journalof Psychopathology and Behavioral Assessment, 26, 255–270.
Hynes, K., & Clarkberg, M. (2005). Women’s employment patterns during early parenthood: Agroup-based trajectory analysis. Journal of Marriage and Family, 67, 222–239.
Jackson, K. M., Sher, K. J., & Schulenberg, J. E. (2005). Conjoint developmental trajectories ofyoung adult alcohol and tobacco use. Journal of Abnormal Psychology, 114, 612–626.
Jackson, K. M., Sher, K. J., & Wood, P. K. (2000). Trajectories of concurrent substance usedisorders: A developmental, typological approach to comorbidity. Alcoholism: Clinical andExperimental Research, 24, 902–913.
Jacob, T., Bucholz, K. K., Sartor, C. E., Howell, D. N., & Wood, P. K. (2005). Drinking trajectoriesfrom adolescence to the mid-forties among alcohol dependent males. Journal of Studies onAlcohol, 66, 745–755.
Jones, B. L., Nagin, D. S., & Roeder, K. (2001). A SAS procedure based on mixture mod-els for estimating developmental trajectories. Sociological Methods and Research, 29,374–393.
Kobner, O. (1893). Die methode einer wissenschaftlichen ruckfallsstatistik alsgrundlageeiner reform der kriminalstatistik. Zeitschrift Gesamter Strafrechtswissenschaft, 13,670–689.
Kreuter, F., & Muthén, B. (2006a). Analyzing criminal trajectory profiles: Bridging multilevel andgroup-based approaches using growth mixture modeling. Unpublished Manuscript.
Kreuter, F., & Muthén, B. (2006b). How to model population heterogeneity? Methodological chal-lenge to the analysis of empirically derived criminal trajectory profiles. In G. R. Hancock &K. M. Samuelsen, (Eds.), Advances in latent variable mixture models (forthcoming). Char-lotte, NC: Information Age Publishing, Inc.
Lacourse, E., Cote, S., Nagin, D. S., Vitaro, F., Brendgen, M., & Tremblay, R. E. (2002). Alongitudinal-experimental approach to testing theories of antisocial behavior. Developmentand Psychopathology, 14, 909–924.
Lacourse, E., Nagin, D. S., Tremblay, R. E., Vitaro, F., & Claes, M. (2003). Developmental tra-jectories of boys’ delinquent group membership and facilitation of violent behaviors duringadolescence. Development and Psychopathology, 15, 183–197.
Land, K. C., McCall, P. L., & Nagin, D. S. (1996). A comparison of poisson, negative binomial,and semiparametric mixed poisson regression models, with empirical applications to criminalcareers data. Sociological Methods and Research, 24, 387–442.
Land, K. C., & Nagin, D. S. (1996). Micro-models of criminal careers: A synthesis of the criminalcareers and life course approaches via semiparametric mixed poisson regression models withempirical applications. Journal of Quantitative Criminology, 12, 163–191.
Land, K. C., Nagin, D. S., & McCall, P. L. (2001). Discrete-time hazard regression models withhidden heterogeneity. Sociological Methods and Research, 29, 342–373.
Laub, J. H., Nagin, D. S., & Sampson, R. J. (1998). Trajectories of change in criminaloffending: Good marriages and the desistance process. American Sociological Review, 63,25–238.
Laub, J. H., & Sampson, R. J. (2001). Understanding desistance from crime. In M. Tonry (Ed.),Crime and justice: An annual review of research (Vol. 28, pp. 1–69) Chicago: University ofChicago Press.
Laub, J. H., & Sampson, R. J. (2003). Shared beginnings, divergent lives: Delinquent boys to age70. Cambridge, MA: Harvard University Press.
Taking Stock of Developmental Trajectories of Criminal Activity 57
Le Blanc, M., & Loeber, R. (1998). Developmental criminology updated. In M. Tonry (Ed.), Crimeand justice: A review of research (Vol. 23, pp. 115–198) Chicago: University of Chicago Press.
Li, F., Duncan, T. E., & Hops, H. (2001). Examining developmental trajectories in adolescentalcohol use using piecewise growth mixture modeling analysis. Journal of Studies on Alcohol,62, 199–210.
Li, F., Barrera, M., Jr., Hops, H., & Fisher, K. J. (2002). The longitudinal influence of peers onthe development of alcohol use in late adolescence: A growth mixture analysis. Journal ofBehavioral Medicine, 25, 293–315.
Loeber, R., & Hay, D. F. (1994). Developmental approaches to aggression and conduct prob-lems. In M. Rutter & D. F. Hay (Eds.), Development through life: A handbook for clinicians(pp. 488–516). Oxford: Blackwell Scientific.
Loeber, R., & Le Blanc, M. (1990). Toward a developmental criminology. In M. Tonry & N. Morris(Eds.), Crime and justice: A review of research (Vol. 12, pp. 375–473). Chicago: University ofChicago Press.
Loughran, T., & Nagin, D. S. (2006). Finite sample effects in group-based trajectory models. Soci-ological Methods & Research, 35, 250–278.
Marshall, J. (2005). Juvenile offending trajectories: A South Australian study. Office of CrimeStatistics and Research, Government of South Australia, Department of Justice.
Maughan, B., Pickles, A., Rowe, R., Costello, E. J., & Angold, A. (2000). Developmental trajecto-ries of aggressive and non-aggressive conduct problems. Journal of Quantitative Criminology,16, 199–221.
McCord, J. (2000). Longitudinal analysis: An introduction to the special issue. Journal of Quanti-tative Criminology, 16, 113–116.
McDermott, S., & Nagin, D. S. (2001). Same or different? Comparing offending groups and covari-ates over time. Sociological Methods and Research, 29, 282–318.
Moffitt, T. E. (1993). ‘Life-course-persistent’ and ‘adolescence-limited’ antisocial behavior: Adevelopmental taxonomy. Psychological Review, 100, 674–701.
Moffitt, T. E. (1994). Natural histories of delinquency. In E. Weitekamp & H-J. Kerner(Eds.), Cross-national longitudinal research on human development and criminal behavior(pp. 3–61). Dordrecht, The Netherlands: Kluwer Academic Press.
Moffitt, T. E. (2006). Life-course persistent versus adolescence-limited antisocial behavior. In D.Cicchetti & D. Cohen (Eds.), Developmental psychopathology (2nd ed., pp. 570–598). NewYork: Wiley.
Mustillo, S., Worthman, C., Erkanli, A., Keeler, G., Angold, A., & Costello, E. J. (2003). Obesityand psychiatric disorder: Developmental trajectories. Pediatrics, 111, 851–859.
Muthén, B. (2004). Latent variable analysis: Growth mixture modeling and related techniques forlongitudinal data. In D. Kaplan (Ed.), Handbook of quantitative methodology for the socialsciences (pp. 345–368). Newbury Park, CA: Sage Publications.
Muthén, B. (2006). The potential of growth mixture modeling. Commentary. Infant and ChildDevelopment, 15, 623–625.
Muthén, B. (2007). Personal communication (e-mail). January 24, 2007.Muthén, B., & Asparouhov, T. (2006). Growth mixture analysis: Models with non-gaussian random
effects. In G. Fitzmaurice, M. Davidian, G. Verbeke, & G. Molenberghs, (Eds.), Advances inlongitudinal data analysis (forthcoming). Chapman & Hall/CRC Press.
Muthén, B., & Muthén, L. (2000). Integrating person-centered and variable-centered analysis:Growth mixture modeling with latent trajectory classes. Alcoholism: Clinical and Experimen-tal Research, 24, 882–891.
Muthén, B., & Shedden, K. (1999). Finite mixture modeling with mixture outcomes using the EMalgorithm. Biometrics, 55, 463–469.
Nagin, D. S. (1999). Analyzing developmental trajectories: A semi-parametric, group-basedapproach. Psychological Methods, 4, 139–177.
Nagin, D. S. (2004a). Response to methodological sensitivities to latent class analysis of long-termcriminal trajectories. Journal of Quantitative Criminology, 20, 27–36.
Nagin, D. S. (2005). Group-based modeling of development over the life course. Cambridge, MA:Harvard University Press.

58 A. R. Piquero
Nagin, D. S., Farrington, D. P., & Moffitt, T. E. (1995). Life-course trajectories of different typesof offenders. Criminology, 33, 111–140.
Nagin, D. S., & Land, K. C. (1993). Age, criminal careers, and population heterogeneity:Specification and estimation of a nonparametric, mixed poisson model. Criminology, 31,327–362.
Nagin, D. S, Pagani, L., Tremblay, R. E., & Vitaro, F. (2003). Life course turning points: A casestudy of the effect of school failure on interpersonal violence. Development and Psychopathol-ogy, 15, 343–361.
Nagin, D. S., & Tremblay, R. E. (1999). Trajectories of boys’ physical aggression, opposition, andhyperactivity on the path to physically violent and non-violent juvenile delinquency. ChildDevelopment, 70, 1181–1196.
Nagin, D. S., & Tremblay, R. E. (2001a). Parental and early childhood predictors of persistentphysical aggression in boys from kindergarten to high school. Archives of General Psychiatry,58, 389–394.
Nagin, D. S., & Tremblay, R. E. (2001b). Analyzing developmental trajectories of distinct butrelated behaviors: A group-based method. Psychological Methods, 6, 18–34.
Nagin, D. S., & Tremblay, R. E. (2005a). Developmental trajectory groups: Fact of fiction? Crim-inology, 43, 873–904.
Nagin, D. S., & Tremblay, R. E. (2005b). From seduction to passion: A response to Sampson andLaub. Criminology, 43, 915–918.
National Institute of Child and Human Development (NICHD). (2004). Trajectories of phys-ical aggression from toddlerhood to middle childhood. Monographs of the Society forResearch in Child Development Serial No. 278, Vol. 69, No. 4. Boston, MA: BlackwellPublishing.
Oesterle, S., Hill, K. G., Hawkins, J. D., Guo, J., Catalano, R. F., & Abbott, R. D. (2004). Adoles-cent heavy episodic drinking trajectories and health in young adulthood. Journal of Studies onAlcohol, 65, 204–212.
Orlando, M., Tucker, J. S., Ellickson, P. L., & Klein, D. J. (2004). Developmental trajectories ofcigarette smoking and their correlates from early adolescence to young adulthood. Journal ofConsulting and Clinical Psychology, 72, 400–410.
Paternoster, R., Brame, R., & Farrington, D. P. (2001). On the relationship betweenadolescent and adult conviction frequencies. Journal of Quantitative Criminology, 17,201–226.
Patterson, G. R. (1993). Orderly change in a stable world: The antisocial trait as a chimera. Journalof Consulting and Clinical Psychology, 61, 911–919.
Patterson, G. R. (1997). A developmental model for late-onset delinquency. In D. W. Osgood (Ed.),Motivation and delinquency: Nebraska symposium on motivation (pp. 119–177). Lincoln, NE:University of Nebraska Press.
Piquero, A. R. (2004). Somewhere between persistence and desistance: The intermittency of crim-inal careers. In R. Immarigeon & S. Maruna (Eds.), After crime and punishment: Pathways tooffender reintegration (pp. 102–125). England: Willan Publishing.
Piquero, A. R., Brame, R., Mazerolle, P., & Haapanen, R. (2002). Crime in emerging adulthood.Criminology, 40, 137–169.
Piquero, A. R., Brame, R., & Moffitt, T. E. (2005). Extending the study of continuity and change:Gender differences in adolescent and adult offending. Journal of Quantitative Criminology,21, 219–243.
Piquero, A. R., Blumstein, A., Brame, R., Haapenen, R., Mulvey, E. P., & Nagin, D. S. (2001).Assessing the impact of exposure time and incapacitation on longitudinal trajectories of crim-inal offending. Journal of Adolescent Research, 16, 54–74.
Piquero, A. R., David, P. Farrington, and Alfred Blumstein. (2007). Key Issues in Criminal CareerResearch: New Analyses of the Cambridge Study in Delinquent Development. Cambridge:Cambridge University Press.
Piquero, A. R., Fagan, J., Mulvey, E. P., Steinberg, L., & Odgers, C. (2005). Developmental tra-jectories of legal socialization among serious adolescent offenders. Journal of Criminal Law& Criminology, 96, 267–298.
Taking Stock of Developmental Trajectories of Criminal Activity 59
Piquero, A. R., Farrington, D. P., & Blumstein, A. (2003). The criminal career paradigm. In M.Tonry (Ed.), Crime and justice: A review of research (Vol. 30, pp. 359–506). Chicago: Univer-sity of Chicago Press.
Piquero, A. R. & Terrie E. Moffitt. (2005). Explaining the Facts of Crime: How the Develop-mental Taxonomy Replies to Farrington’s Invitation. In David P. Farrington (Ed.), IntegratedDevelopmental & Life-Course Theories of Offending: Advances in Criminological Theory (pp.51–72). New Brunswick, NJ: Transaction.
Piquero, N. L., & Piquero, A. R. (2006). Democracy and intellectual property: Examining trajecto-ries of software piracy. Annals of the American Academy of Political and Social Science, 605,104–127.
Raudenbush, S. (2001). Toward a coherent framework for comparing trajectories of individualchange. In L. M. Collins & A. G. Sayer (Eds.), New methods for the analysis of change(pp. 35–64). Washington, DC: APA.
Roeder, K., Lynch, K., & Nagin, D. S. (1999). Modeling uncertainty in latent class membership:A case study in criminology. Journal of the American Statistical Association, 94, 766–776.
Sampson, R. J., & Laub, J. H. (1993). Crime in the making. Cambridge, MA: Harvard UniversityPress.
Sampson, R. J., & Laub, J. H. (2003). Life-course desisters? Trajectories of crime among delin-quent boys followed to age 70. Criminology, 41, 555–592.
Sampson, R. J., & Laub, J. H. (2005). Seductions of method: Rejoinder to Nagin and Tremblay’sDevelopmental Trajectory Groups: Fact or Fiction? Criminology, 43, 905–914.
Sampson, R. J., Laub, J. H., & Eggleston, E. P. (2004). On the robustness and validity of groups.Journal of Quantitative Criminology, 20, 37–42.
Schaeffer, C. M., Petras, H., Ialongo, N., Poduska, J., & Kellam, S. (2003). Modeling growthin boys’ aggressive behavior across elementary school: Links to later criminal involvement,conduct disorder, and antisocial personality disorder. Developmental Psychology, 39, 1020–1035.
Séguin, J. R., Assaad, J-M., Nagin, D. S., & Tremblay, R. E. (2004). Cognitive-neuropsychologicalfunction in chronic physical aggression and hyperactivity. Journal of Abnormal Psychology,113, 603–613.
Shaw, C. (1930). The Jack roller: A delinquent boy’s own story. Chicago: University of ChicagoPress.
Shaw, D. S., Gilliom, M., Ingoldsby, E. M., & Nagin, D. S. (2003). Trajectories leading to school-age conduct problems. Developmental Psychology, 39, 189–200.
Shaw, D. S., Lacourse, E., & Nagin, D. S. (2005). Developmental trajectories of conduct problemsand hyperactivity from ages 2 to 10. Journal of Child Psychology and Psychiatry, 46, 931–942.
Stoolmiller, M., Kim, H. K., & Capaldi, D. M. (2005). The course of depressive symptoms in menfrom early adolescence to young adulthood: Identifying latent trajectories and early predictors.Journal of Abnormal Psychology, 114, 331–345.
Stouthamer-Loeber, M., Wei, E., Loeber, R., & Masten, A. S. (2004). Desistance from persistentserious delinquency in the transition to adulthood. Development and Psychopathology, 16,897–918.
Tremblay, R. E., Japel, C., Perusse, D., McDuff, P., Boivin, M., Zoccolillo, M., et al. (1999). Thesearch for the age of ‘onset’ of physical aggression: Rousseau and Bandura revisited. CriminalBehaviour and Mental Health, 9, 8–23.
Tremblay, R. R, Nagin, D. S., Séguin, J., Zoccolillo, M., Zelazo, P., Boivin, M., Pérusse, D.,& Japel, C. (2004). Physical aggression during early childhood: Trajectories and predictors.Pediatrics, 114, 43–50.
Thornberry, T. P., & Krohn, M. D. (2003). Taking stock of delinquency: An overview of findingsfrom contemporary longitudinal studies. Kluwer Academic Publishers: Dordrecht.
Tucker, J. S., Ellickson, P. L., Orlando, M., Martino, S. C., & Klein, D. J. (2005). Substance usetrajectories from early adolescence to emerging adulthood: A comparison of smoking, bingedrinking, and marijuana use. Journal of Drug Issues, 35, 307–332.
Tucker, J. S., Orlando, M., & Ellickson, P. L. (2003). Patterns and correlates of binge drinkingtrajectories from early adolescence to young adulthood. Health Psychology, 22, 79–87.
60 A. R. Piquero
von Mayr, G. (1917). Statistics and gesellschaftslehre. Kriminalstatistik, 3, 425–426.von Scheel, H. (1890). Zur einfuhrung in die kriminalstatistik insbesondere diegenige des
deutschen reichs. Allgemeines Statistisches Archiv, 1, 183–194.Wang, C-P., Brown, C. H., & Bandeen-Roche, K. (2005). Residual diagnostics for growth mix-
ture models: Examining the impact of a preventive intervention on multiple trajectories ofaggressive behavior. Journal of the American Statistical Association, 100, 1054–1076.
Weisburd, D., Bushway, S., Lum, C., & Yang, S-M. (2004). Trajectories of crime at places: Alongitudinal study of street segments in the city of Seattle. Criminology, 42, 283–322.
Weitekamp, E. G. M., & Kerner, H-J. (Eds.). (1994). Cross-national longitudinal research onhuman development and criminal behavior. Kluwer Academic Publishers: Dordrecht.
White, H. R., Bates, M. E., & Buyske, S. (2001). Adolescence-limited versus persistent delin-quency: Extending Moffitt’s hypothesis into adulthood. Journal of Abnormal Psychology, 110,600–609.
White, H. R., Johnson, V., & Buyske, S. (2000). Parental modeling and parenting behavior effectson offspring alcohol and cigarette use: A growth curve analysis. Journal of Substance Abuse,32, 287–310.
White, H. R., Pandina, R. J., & Chen, P-H. (2001). Developmental trajectories of cigarette usefrom early adolescence into young adulthood. Drug and Alcohol Dependence, 65, 167–178.
Wiesner, M., & Capaldi, D. (2003). Relations of childhood and adolescent factors to offendingtrajectories of young men. Journal of Research in Crime and Delinquency, 40, 231–262.
Wiesner, M., & Silbereisen, R. K. (2003). Trajectories of delinquent behavior in adolescence andtheir covariates: Relations with initial and time-averaged factors. Journal of Adolescence, 26,753–771.
Wiesner, M., & Windle, M. (2004). Assessing covariates of adolescent delinquency trajectories: Alatent growth mixture modeling approach. Journal of Youth and Adolescence, 33, 431–442.
Windle, M., Mun, E. Y., & Windle, R. C. (2005). Adolescent-to-young adulthood heavy drinkingtrajectories and their prospective predictors. Journal of Studies on Alcohol, 66, 313–323.
Wolfgang, M. E., Figlio, R. M., & Sellin, T. (1972). Delinquency in a birth cohort. Chicago:University of Chicago Press.
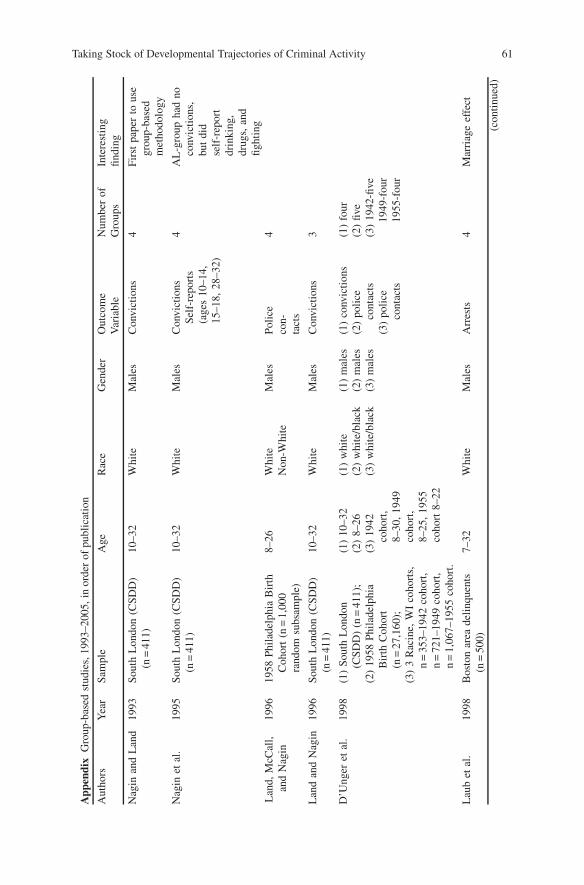
Taking Stock of Developmental Trajectories of Criminal Activity 61
App
endi
xG
roup
-bas
edst
udie
s,19
93–2
005,
inor
der
ofpu
blic
atio
n
Aut
hors
Yea
rSa
mpl
eA
geR
ace
Gen
der
Out
com
eV
aria
ble
Num
ber
ofG
roup
sIn
tere
stin
gfin
ding
Nag
inan
dL
and
1993
Sout
hL
ondo
n(C
SDD
)(n
=41
1)10
–32
Whi
teM
ales
Con
vict
ions
4Fi
rst
pape
rto
use
grou
p-ba
sed
met
hodo
logy
Nag
inet
al.
1995
Sout
hL
ondo
n(C
SDD
)(n
=41
1)10
–32
Whi
teM
ales
Con
vict
ions
Self
-rep
orts
(age
s10
–14,
15–1
8,28
–32)
4A
L-g
roup
had
noco
nvic
tion
s,bu
tdi
dse
lf-r
epor
tdr
inki
ng,
drug
s,an
dfig
htin
gL
and,
McC
all,
and
Nag
in19
9619
58Ph
ilad
elph
iaB
irth
Coh
ort
(n=
1,00
0ra
ndom
subs
ampl
e)
8–26
Whi
teN
on-W
hite
Mal
esPo
lice
con-
tact
s
4
Lan
dan
dN
agin
1996
Sout
hL
ondo
n(C
SDD
)(n
=41
1)10
–32
Whi
teM
ales
Con
vict
ions
3
D’U
nger
etal
.19
98(1
)So
uth
Lon
don
(CSD
D)
(n=
411)
;(2
)19
58Ph
ilad
elph
iaB
irth
Coh
ort
(n=
27,1
60);
(3)
3R
acin
e,W
Ico
hort
s,n
=35
3–19
42co
hort
,n
=72
1–19
49co
hort
,n
=1,
067–
1955
coho
rt.
(1)
10–3
2(2
)8–
26(3
)19
42co
hort
,8–
30,
1949
coho
rt,
8–25
,19
55co
hort
8–22
(1)
whi
te(2
)w
hite
/bla
ck(3
)w
hite
/bla
ck
(1)
mal
es(2
)m
ales
(3)
mal
es
(1)
conv
icti
ons
(2)
poli
ceco
ntac
ts(3
)po
lice
cont
acts
(1)
four
(2)
five
(3)
1942
-five
1949
-fou
r19
55-f
our
Lau
bet
al.
1998
Bos
ton
area
deli
nque
nts
(n=
500)
7–32
Whi
teM
ales
Arr
ests
4M
arri
age
effe
ct
(con
tinu
ed)
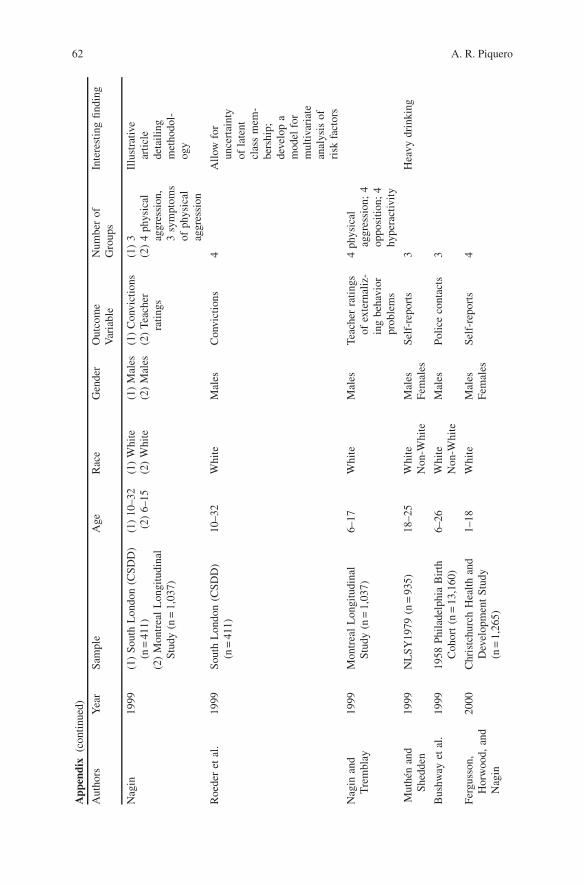
62 A. R. Piquero
App
endi
x(c
onti
nued
)
Aut
hors
Yea
rSa
mpl
eA
geR
ace
Gen
der
Out
com
eV
aria
ble
Num
ber
ofG
roup
sIn
tere
stin
gfin
ding
Nag
in19
99(1
)So
uth
Lon
don
(CSD
D)
(n=
411)
(2)
Mon
trea
lL
ongi
tudi
nal
Stud
y(n
=1,
037)
(1)
10–3
2(2
)6–
15(1
)W
hite
(2)
Whi
te(1
)M
ales
(2)
Mal
es(1
)C
onvi
ctio
ns(2
)Te
ache
rra
ting
s
(1)
3(2
)4
phys
ical
aggr
essi
on,
3sy
mpt
oms
ofph
ysic
alag
gres
sion
Illu
stra
tive
arti
cle
deta
ilin
gm
etho
dol-
ogy
Roe
der
etal
.19
99So
uth
Lon
don
(CSD
D)
(n=
411)
10–3
2W
hite
Mal
esC
onvi
ctio
ns4
All
owfo
run
cert
aint
yof
late
ntcl
ass
mem
-be
rshi
p;de
velo
pa
mod
elfo
rm
ultiv
aria
tean
alys
isof
risk
fact
ors
Nag
inan
dT
rem
blay
1999
Mon
trea
lL
ongi
tudi
nal
Stud
y(n
=1,
037)
6–17
Whi
teM
ales
Teac
her
rati
ngs
ofex
tern
aliz
-in
gbe
havi
orpr
oble
ms
4ph
ysic
alag
gres
sion
;4
oppo
siti
on;
4hy
pera
ctiv
ity
Mut
hén
and
Shed
den
1999
NL
SY19
79(n
=93
5)18
–25
Whi
teN
on-W
hite
Mal
esFe
mal
esSe
lf-r
epor
ts3
Hea
vydr
inki
ng
Bus
hway
etal
.19
9919
58Ph
ilad
elph
iaB
irth
Coh
ort
(n=
13,1
60)
6–26
Whi
teN
on-W
hite
Mal
esPo
lice
cont
acts
3
Ferg
usso
n,H
orw
ood,
and
Nag
in
2000
Chr
istc
hurc
hH
ealt
han
dD
evel
opm
ent
Stud
y(n
=1,
265)
1–18
Whi
teM
ales
Fem
ales
Self
-rep
orts
4
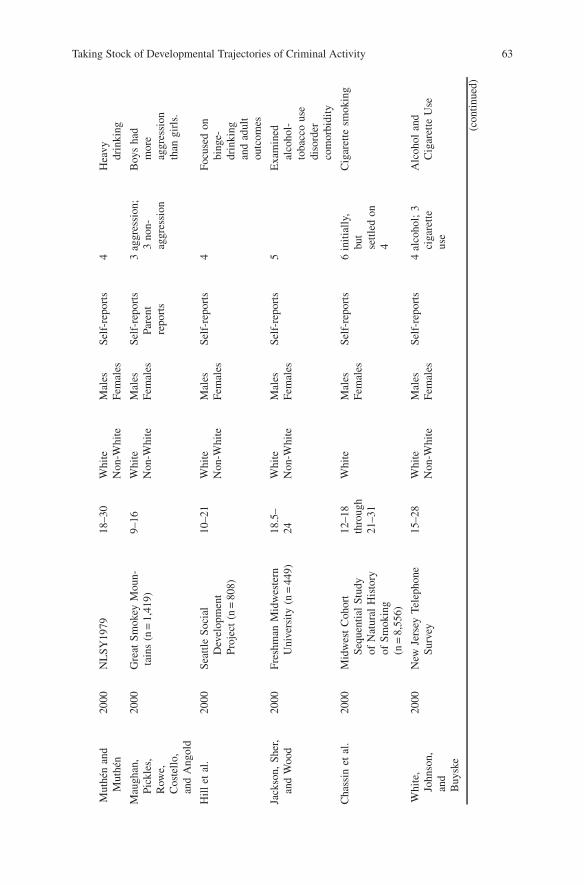
Taking Stock of Developmental Trajectories of Criminal Activity 63
Mut
hén
and
Mut
hén
2000
NL
SY19
7918
–30
Whi
teN
on-W
hite
Mal
esFe
mal
esSe
lf-r
epor
ts4
Hea
vydr
inki
ng
Mau
ghan
,Pi
ckle
s,R
owe,
Cos
tell
o,an
dA
ngol
d
2000
Gre
atSm
okey
Mou
n-ta
ins
(n=
1,41
9)9–
16W
hite
Non
-Whi
teM
ales
Fem
ales
Self
-rep
orts
Pare
ntre
port
s
3ag
gres
sion
;3
non-
aggr
essi
on
Boy
sha
dm
ore
aggr
essi
onth
angi
rls.
Hill
etal
.20
00Se
attle
Soci
alD
evel
opm
ent
Proj
ect
(n=
808)
10–2
1W
hite
Non
-Whi
teM
ales
Fem
ales
Self
-rep
orts
4Fo
cuse
don
bing
e-dr
inki
ngan
dad
ult
outc
omes
Jack
son,
Sher
,an
dW
ood
2000
Fres
hman
Mid
wes
tern
Uni
vers
ity
(n=
449)
18.5
–24
Whi
teN
on-W
hite
Mal
esFe
mal
esSe
lf-r
epor
ts5
Exa
min
edal
coho
l-to
bacc
ous
edi
sord
erco
mor
bidi
ty
Cha
ssin
etal
.20
00M
idw
est
Coh
ort
Sequ
enti
alSt
udy
ofN
atur
alH
isto
ryof
Smok
ing
(n=
8,55
6)
12–1
8th
roug
h21
–31
Whi
teM
ales
Fem
ales
Self
-rep
orts
6in
itia
lly,
but
sett
led
on4
Cig
aret
tesm
okin
g
Whi
te,
John
son,
and
Buy
ske
2000
New
Jers
eyTe
leph
one
Surv
ey15
–28
Whi
teN
on-W
hite
Mal
esFe
mal
esSe
lf-r
epor
ts4
alco
hol;
3ci
gare
tte
use
Alc
ohol
and
Cig
aret
teU
se
(con
tinu
ed)
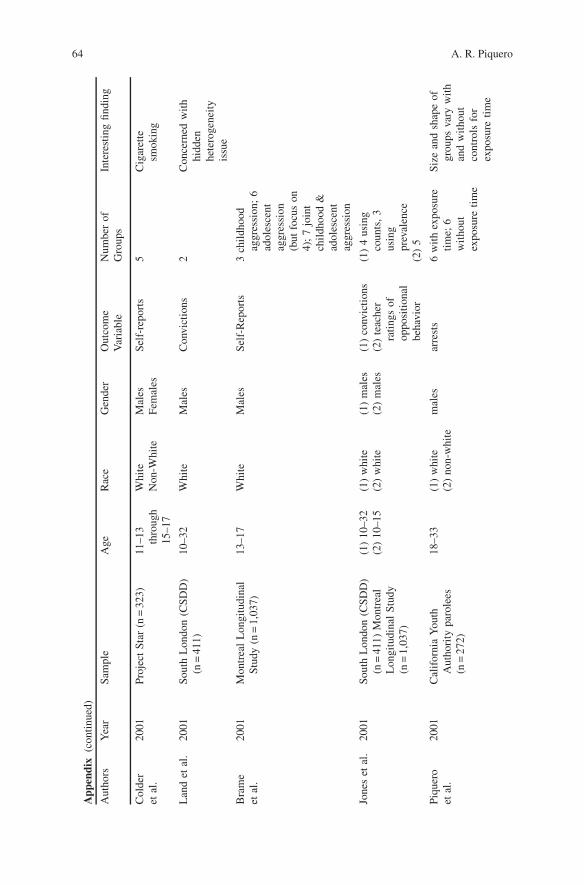
64 A. R. Piquero
App
endi
x(c
onti
nued
)
Aut
hors
Yea
rSa
mpl
eA
geR
ace
Gen
der
Out
com
eV
aria
ble
Num
ber
ofG
roup
sIn
tere
stin
gfin
ding
Col
der
etal
.20
01Pr
ojec
tSt
ar(n
=32
3)11
–13
thro
ugh
15–1
7
Whi
teN
on-W
hite
Mal
esFe
mal
esSe
lf-r
epor
ts5
Cig
aret
tesm
okin
g
Lan
det
al.
2001
Sout
hL
ondo
n(C
SDD
)(n
=41
1)10
–32
Whi
teM
ales
Con
vict
ions
2C
once
rned
wit
hhi
dden
hete
roge
neit
yis
sue
Bra
me
etal
.20
01M
ontr
eal
Lon
gitu
dina
lSt
udy
(n=
1,03
7)13
–17
Whi
teM
ales
Self
-Rep
orts
3ch
ildh
ood
aggr
essi
on;
6ad
oles
cent
aggr
essi
on(b
utfo
cus
on4)
;7
join
tch
ildh
ood
&ad
oles
cent
aggr
essi
on
Jone
set
al.
2001
Sout
hL
ondo
n(C
SDD
)(n
=41
1)M
ontr
eal
Lon
gitu
dina
lSt
udy
(n=
1,03
7)
(1)
10–3
2(2
)10
–15
(1)
whi
te(2
)w
hite
(1)
mal
es(2
)m
ales
(1)
conv
icti
ons
(2)
teac
her
rati
ngs
ofop
posi
tion
albe
havi
or
(1)
4us
ing
coun
ts,
3us
ing
prev
alen
ce(2
)5
Piqu
ero
etal
.20
01C
alif
orni
aY
outh
Aut
hori
typa
role
es(n
=27
2)
18–3
3(1
)w
hite
(2)
non-
whi
tem
ales
arre
sts
6w
ith
expo
sure
tim
e;6
wit
hout
expo
sure
tim
e
Size
and
shap
eof
grou
psva
ryw
ith
and
wit
hout
cont
rols
for
expo
sure
tim
e
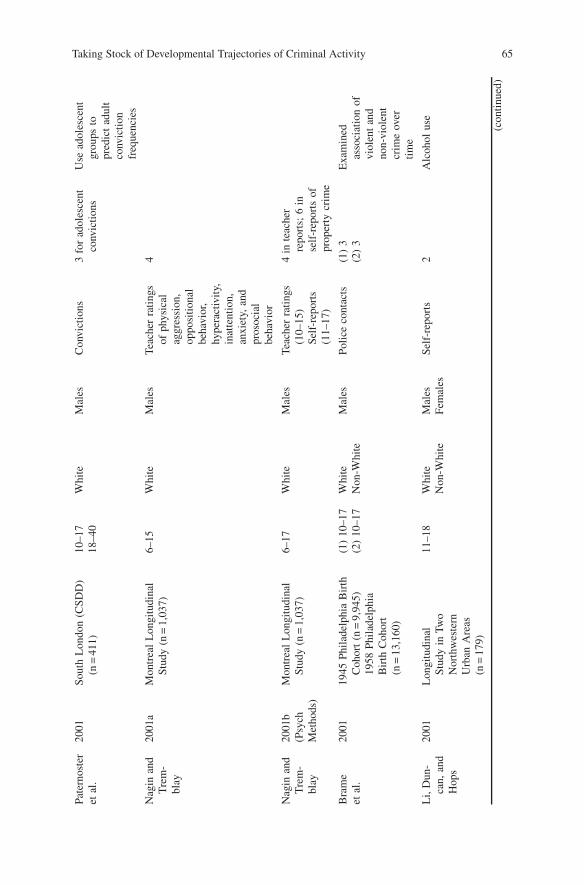
Taking Stock of Developmental Trajectories of Criminal Activity 65
Pate
rnos
ter
etal
.20
01So
uth
Lon
don
(CSD
D)
(n=
411)
10–1
718
–40
Whi
teM
ales
Con
vict
ions
3fo
rad
oles
cent
conv
icti
ons
Use
adol
esce
ntgr
oups
topr
edic
tad
ult
conv
icti
onfr
eque
ncie
s
Nag
inan
dT
rem
-bl
ay
2001
aM
ontr
eal
Lon
gitu
dina
lSt
udy
(n=
1,03
7)6–
15W
hite
Mal
esTe
ache
rra
ting
sof
phys
ical
aggr
essi
on,
oppo
siti
onal
beha
vior
,hy
pera
ctiv
ity,
inat
tent
ion,
anxi
ety,
and
pros
ocia
lbe
havi
or
4
Nag
inan
dT
rem
-bl
ay
2001
b(P
sych
Met
hods
)
Mon
trea
lL
ongi
tudi
nal
Stud
y(n
=1,
037)
6–17
Whi
teM
ales
Teac
her
rati
ngs
(10–
15)
Self
-rep
orts
(11–
17)
4in
teac
her
repo
rts;
6in
self
-rep
orts
ofpr
oper
tycr
ime
Bra
me
etal
.20
0119
45Ph
ilad
elph
iaB
irth
Coh
ort
(n=
9,94
5)19
58Ph
ilad
elph
iaB
irth
Coh
ort
(n=
13,1
60)
(1)
10–1
7(2
)10
–17
Whi
teN
on-W
hite
Mal
esPo
lice
cont
acts
(1)
3(2
)3
Exa
min
edas
soci
atio
nof
viol
ent
and
non-
viol
ent
crim
eov
erti
me
Li,
Dun
-ca
n,an
dH
ops
2001
Lon
gitu
dina
lSt
udy
inTw
oN
orth
wes
tern
Urb
anA
reas
(n=
179)
11–1
8W
hite
Non
-Whi
teM
ales
Fem
ales
Self
-rep
orts
2A
lcoh
olus
e
(con
tinu
ed)
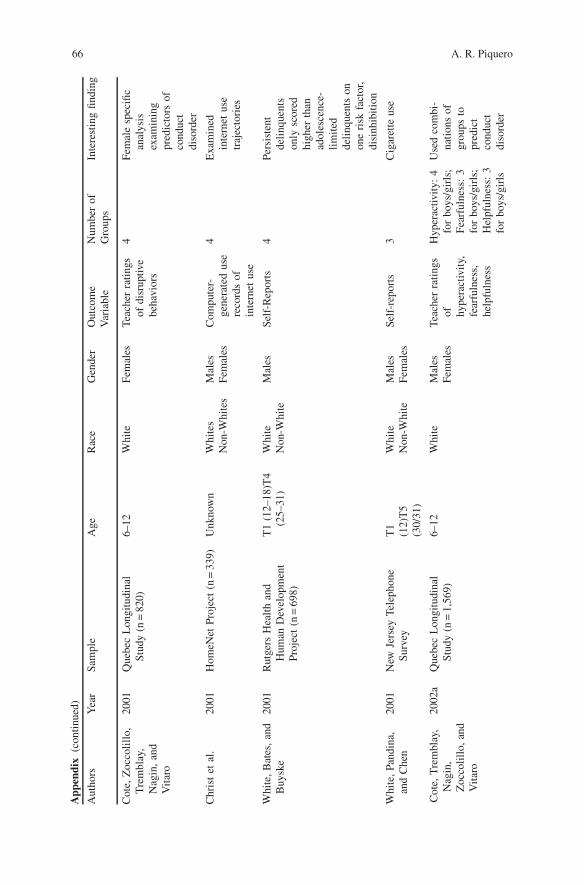
66 A. R. Piquero
App
endi
x(c
onti
nued
)
Aut
hors
Yea
rSa
mpl
eA
geR
ace
Gen
der
Out
com
eV
aria
ble
Num
ber
ofG
roup
sIn
tere
stin
gfin
ding
Cot
e,Z
occo
lill
o,T
rem
blay
,N
agin
,an
dV
itar
o
2001
Que
bec
Lon
gitu
dina
lSt
udy
(n=
820)
6–12
Whi
teFe
mal
esTe
ache
rra
ting
sof
disr
uptiv
ebe
havi
ors
4Fe
mal
esp
ecifi
can
alys
isex
amin
ing
pred
icto
rsof
cond
uct
diso
rder
Chr
ist
etal
.20
01H
omeN
etPr
ojec
t(n
=33
9)U
nkno
wn
Whi
tes
Non
-Whi
tes
Mal
esFe
mal
esC
ompu
ter-
gene
rate
dus
ere
cord
sof
inte
rnet
use
4E
xam
ined
inte
rnet
use
traj
ecto
ries
Whi
te,B
ates
,an
dB
uysk
e20
01R
utge
rsH
ealt
han
dH
uman
Dev
elop
men
tPr
ojec
t(n
=69
8)
T1
(12–
18)T
4(2
5–31
)W
hite
Non
-Whi
teM
ales
Self
-Rep
orts
4Pe
rsis
tent
deli
nque
nts
only
scor
edhi
gher
than
adol
esce
nce-
lim
ited
deli
nque
nts
onon
eri
skfa
ctor
,di
sinh
ibit
ion
Whi
te,P
andi
na,
and
Che
n20
01N
ewJe
rsey
Tele
phon
eSu
rvey
T1
(12)
T5
(30/
31)
Whi
teN
on-W
hite
Mal
esFe
mal
esSe
lf-r
epor
ts3
Cig
aret
teus
e
Cot
e,T
rem
blay
,N
agin
,Z
occo
lill
o,an
dV
itar
o
2002
aQ
uebe
cL
ongi
tudi
nal
Stud
y(n
=1,
569)
6–12
Whi
teM
ales
Fem
ales
Teac
her
rati
ngs
of hype
ract
ivit
y,fe
arfu
lnes
s,he
lpfu
lnes
s
Hyp
erac
tivit
y:4
for
boys
/gir
ls;
Fear
fuln
ess:
3fo
rbo
ys/g
irls
;H
elpf
ulne
ss:
3fo
rbo
ys/g
irls
Use
dco
mbi
-na
tion
sof
grou
psto
pred
ict
cond
uct
diso
rder
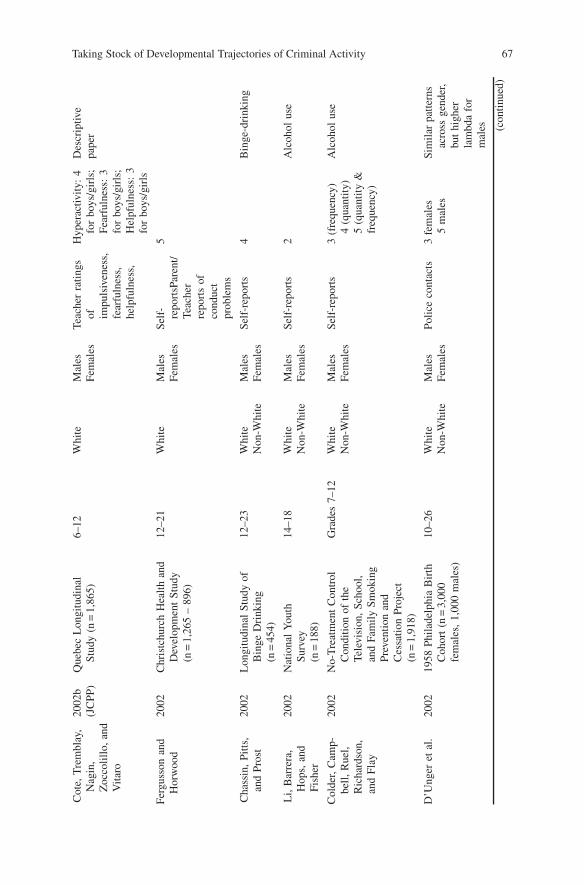
Taking Stock of Developmental Trajectories of Criminal Activity 67
Cot
e,T
rem
blay
,N
agin
,Z
occo
lill
o,an
dV
itar
o
2002
b(J
CPP
)Q
uebe
cL
ongi
tudi
nal
Stud
y(n
=1,
865)
6–12
Whi
teM
ales
Fem
ales
Teac
her
rati
ngs
of impu
lsiv
enes
s,fe
arfu
lnes
s,he
lpfu
lnes
s,
Hyp
erac
tivit
y:4
for
boys
/gir
ls;
Fear
fuln
ess:
3fo
rbo
ys/g
irls
;H
elpf
ulne
ss:
3fo
rbo
ys/g
irls
Des
crip
tive
pape
r
Ferg
usso
nan
dH
orw
ood
2002
Chr
istc
hurc
hH
ealt
han
dD
evel
opm
ent
Stud
y(n
=1,
265
–89
6)
12–2
1W
hite
Mal
esFe
mal
esSe
lf-
repo
rtsP
aren
t/Te
ache
rre
port
sof
cond
uct
prob
lem
s
5
Cha
ssin
,Pi
tts,
and
Pros
t20
02L
ongi
tudi
nal
Stud
yof
Bin
geD
rink
ing
(n=
454)
12–2
3W
hite
Non
-Whi
teM
ales
Fem
ales
Self
-rep
orts
4B
inge
-dri
nkin
g
Li,
Bar
rera
,H
ops,
and
Fish
er
2002
Nat
iona
lY
outh
Surv
ey(n
=18
8)
14–1
8W
hite
Non
-Whi
teM
ales
Fem
ales
Self
-rep
orts
2A
lcoh
olus
e
Col
der,
Cam
p-be
ll,R
uel,
Ric
hard
son,
and
Flay
2002
No-
Tre
atm
ent
Con
trol
Con
diti
onof
the
Tele
visi
on,
Scho
ol,
and
Fam
ily
Smok
ing
Prev
enti
onan
dC
essa
tion
Proj
ect
(n=
1,91
8)
Gra
des
7–12
Whi
teN
on-W
hite
Mal
esFe
mal
esSe
lf-r
epor
ts3
(fre
quen
cy)
4(q
uant
ity)
5(q
uant
ity
&fr
eque
ncy)
Alc
ohol
use
D’U
nger
etal
.20
0219
58Ph
ilad
elph
iaB
irth
Coh
ort
(n=
3,00
0fe
mal
es,
1,00
0m
ales
)
10–2
6W
hite
Non
-Whi
teM
ales
Fem
ales
Poli
ceco
ntac
ts3
fem
ales
5m
ales
Sim
ilar
patt
erns
acro
ssge
nder
,bu
thi
gher
lam
bda
for
mal
es (con
tinu
ed)
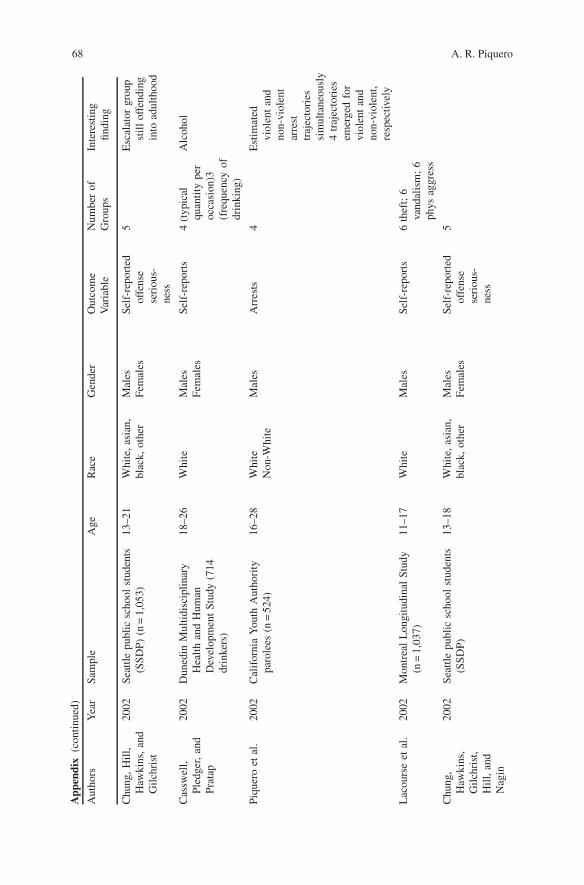
68 A. R. Piquero
App
endi
x(c
onti
nued
)
Aut
hors
Yea
rSa
mpl
eA
geR
ace
Gen
der
Out
com
eV
aria
ble
Num
ber
ofG
roup
sIn
tere
stin
gfin
ding
Chu
ng,
Hil
l,H
awki
ns,
and
Gil
chri
st
2002
Seat
tlepu
blic
scho
olst
uden
ts(S
SDP)
(n=
1,05
3)13
–21
Whi
te,a
sian
,bl
ack,
othe
rM
ales
Fem
ales
Self
-rep
orte
dof
fens
ese
riou
s-ne
ss
5E
scal
ator
grou
pst
ill
offe
ndin
gin
toad
ulth
ood
Cas
swel
l,Pl
edge
r,an
dPr
atap
2002
Dun
edin
Mul
tidi
scip
linar
yH
ealt
han
dH
uman
Dev
elop
men
tSt
udy
(714
drin
kers
)
18–2
6W
hite
Mal
esFe
mal
esSe
lf-r
epor
ts4
(typ
ical
quan
tity
per
occa
sion
)3(f
requ
ency
ofdr
inki
ng)
Alc
ohol
Piqu
ero
etal
.20
02C
alif
orni
aY
outh
Aut
hori
typa
role
es(n
=52
4)16
–28
Whi
teN
on-W
hite
Mal
esA
rres
ts4
Est
imat
edvi
olen
tan
dno
n-vi
olen
tar
rest
traj
ecto
ries
sim
ulta
neou
sly
4tr
ajec
tori
esem
erge
dfo
rvi
olen
tan
dno
n-vi
olen
t,re
spec
tivel
y
Lac
ours
eet
al.
2002
Mon
trea
lL
ongi
tudi
nal
Stud
y(n
=1,
037)
11–1
7W
hite
Mal
esSe
lf-r
epor
ts6
thef
t;6
vand
alis
m;
6ph
ysag
gres
s
Chu
ng,
Haw
kins
,G
ilch
rist
,H
ill,
and
Nag
in
2002
Seat
tlepu
blic
scho
olst
uden
ts(S
SDP)
13–1
8W
hite
,asi
an,
blac
k,ot
her
Mal
esFe
mal
esSe
lf-r
epor
ted
offe
nse
seri
ous-
ness
5
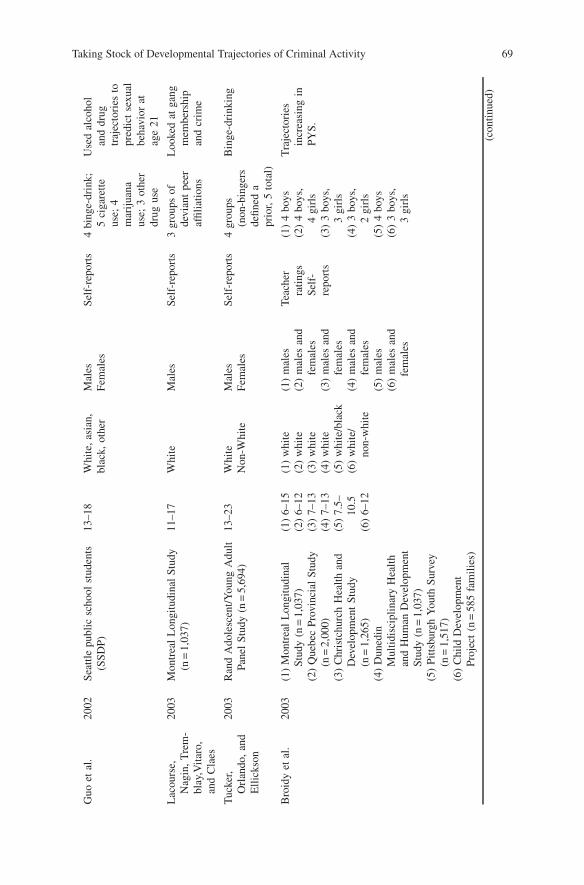
Taking Stock of Developmental Trajectories of Criminal Activity 69
Guo
etal
.20
02Se
attle
publ
icsc
hool
stud
ents
(SSD
P)13
–18
Whi
te,a
sian
,bl
ack,
othe
rM
ales
Fem
ales
Self
-rep
orts
4bi
nge-
drin
k;5
ciga
rett
eus
e;4
mar
ijua
naus
e;3
othe
rdr
ugus
e
Use
dal
coho
lan
ddr
ugtr
ajec
tori
esto
pred
ict
sexu
albe
havi
orat
age
21
Lac
ours
e,N
agin
,T
rem
-bl
ay,V
itar
o,an
dC
laes
2003
Mon
trea
lL
ongi
tudi
nal
Stud
y(n
=1,
037)
11–1
7W
hite
Mal
esSe
lf-r
epor
ts3
grou
psof
devi
ant
peer
affil
iati
ons
Loo
ked
atga
ngm
embe
rshi
pan
dcr
ime
Tuc
ker,
Orl
ando
,an
dE
llic
kson
2003
Ran
dA
dole
scen
t/Y
oung
Adu
ltPa
nel
Stud
y(n
=5,
694)
13–2
3W
hite
Non
-Whi
teM
ales
Fem
ales
Self
-rep
orts
4gr
oups
(non
-bin
gers
defin
eda
prio
r,5
tota
l)
Bin
ge-d
rink
ing
Bro
idy
etal
.20
03(1
)M
ontr
eal
Lon
gitu
dina
lSt
udy
(n=
1,03
7)(2
)Q
uebe
cPr
ovin
cial
Stud
y(n
=2,
000)
(3)
Chr
istc
hurc
hH
ealt
han
dD
evel
opm
ent
Stud
y(n
=1,
265)
(4)
Dun
edin
Mul
tidi
scip
lina
ryH
ealt
han
dH
uman
Dev
elop
men
tSt
udy
(n=
1,03
7)(5
)Pi
ttsb
urgh
You
thSu
rvey
(n=
1,51
7)(6
)C
hild
Dev
elop
men
tPr
ojec
t(n
=58
5fa
mil
ies)
(1)
6–15
(2)
6–12
(3)
7–13
(4)
7–13
(5)
7.5–
10.5
(6)
6–12
(1)
whi
te(2
)w
hite
(3)
whi
te(4
)w
hite
(5)
whi
te/b
lack
(6)
whi
te/
non-
whi
te
(1)
mal
es(2
)m
ales
and
fem
ales
(3)
mal
esan
dfe
mal
es(4
)m
ales
and
fem
ales
(5)
mal
es(6
)m
ales
and
fem
ales
Teac
her
rati
ngs
Self
-re
port
s
(1)
4bo
ys(2
)4
boys
,4
girl
s(3
)3
boys
,3
girl
s(4
)3
boys
,2
girl
s(5
)4
boys
(6)
3bo
ys,
3gi
rls
Tra
ject
orie
sin
crea
sing
inPY
S.
(con
tinu
ed)
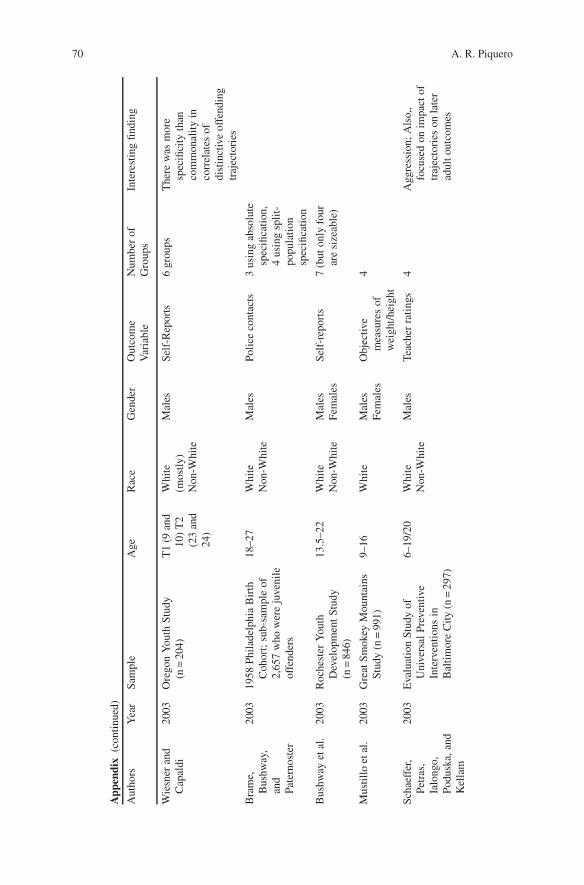
70 A. R. Piquero
App
endi
x(c
onti
nued
)
Aut
hors
Yea
rSa
mpl
eA
geR
ace
Gen
der
Out
com
eV
aria
ble
Num
ber
ofG
roup
sIn
tere
stin
gfin
ding
Wie
sner
and
Cap
aldi
2003
Ore
gon
You
thSt
udy
(n=
204)
T1
(9an
d10
)T
2(2
3an
d24
)
Whi
te(m
ostl
y)N
on-W
hite
Mal
esSe
lf-R
epor
ts6
grou
psT
here
was
mor
esp
ecifi
city
than
com
mon
alit
yin
corr
elat
esof
dist
inct
ive
offe
ndin
gtr
ajec
tori
es
Bra
me,
Bus
hway
,an
dPa
tern
oste
r
2003
1958
Phil
adel
phia
Bir
thC
ohor
t;su
b-sa
mpl
eof
2,65
7w
how
ere
juve
nile
offe
nder
s
18–2
7W
hite
Non
-Whi
teM
ales
Poli
ceco
ntac
ts3
usin
gab
solu
tesp
ecifi
cati
on,
4us
ing
spli
t-po
pula
tion
spec
ifica
tion
Bus
hway
etal
.20
03R
oche
ster
You
thD
evel
opm
ent
Stud
y(n
=84
6)
13.5
–22
Whi
teN
on-W
hite
Mal
esFe
mal
esSe
lf-r
epor
ts7
(but
only
four
are
size
able
)
Mus
till
oet
al.
2003
Gre
atSm
okey
Mou
ntai
nsSt
udy
(n=
991)
9–16
Whi
teM
ales
Fem
ales
Obj
ectiv
em
easu
res
ofw
eigh
t/he
ight
4
Scha
effe
r,Pe
tras
,Ia
long
o,Po
dusk
a,an
dK
ella
m
2003
Eva
luat
ion
Stud
yof
Uni
vers
alPr
even
tive
Inte
rven
tion
sin
Bal
timor
eC
ity(n
=29
7)
6–19
/20
Whi
teN
on-W
hite
Mal
esTe
ache
rra
ting
s4
Agg
ress
ion;
Als
o„fo
cuse
don
impa
ctof
traj
ecto
ries
onla
ter
adul
tout
com
es
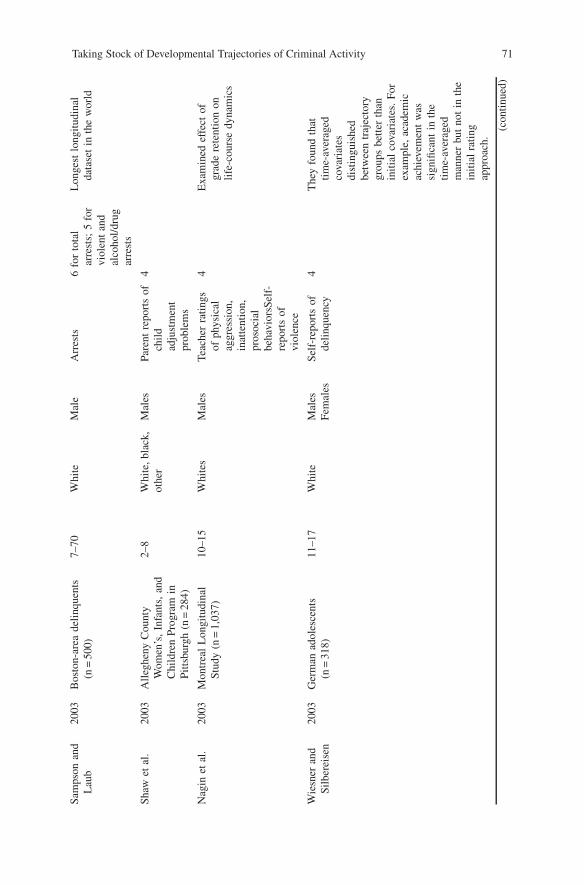
Taking Stock of Developmental Trajectories of Criminal Activity 71
Sam
pson
and
Lau
b20
03B
osto
n-ar
eade
linq
uent
s(n
=50
0)7–
70W
hite
Mal
eA
rres
ts6
for
tota
lar
rest
s;5
for
viol
ent
and
alco
hol/
drug
arre
sts
Lon
gest
long
itud
inal
data
set
inth
ew
orld
Shaw
etal
.20
03A
lleg
heny
Cou
nty
Wom
en’s
,In
fant
s,an
dC
hild
ren
Prog
ram
inP
itts
burg
h(n
=28
4)
2–8
Whi
te,b
lack
,ot
her
Mal
esPa
rent
repo
rts
ofch
ild
adju
stm
ent
prob
lem
s
4
Nag
inet
al.
2003
Mon
trea
lL
ongi
tudi
nal
Stud
y(n
=1,
037)
10–1
5W
hite
sM
ales
Teac
her
rati
ngs
ofph
ysic
alag
gres
sion
,in
atte
ntio
n,pr
osoc
ial
beha
vior
sSel
f-re
port
sof
viol
ence
4E
xam
ined
effe
ctof
grad
ere
tent
ion
onli
fe-c
ours
edy
nam
ics
Wie
sner
and
Silb
erei
sen
2003
Ger
man
adol
esce
nts
(n=
318)
11–1
7W
hite
Mal
esFe
mal
esSe
lf-r
epor
tsof
deli
nque
ncy
4T
hey
foun
dth
atti
me-
aver
aged
cova
riat
esdi
stin
guis
hed
betw
een
traj
ecto
rygr
oups
bett
erth
anin
itia
lco
vari
ates
.Fo
rex
ampl
e,ac
adem
icac
hiev
emen
tw
assi
gnifi
cant
inth
eti
me-
aver
aged
man
ner
but
not
inth
ein
itia
lra
ting
appr
oach
.
(con
tinu
ed)

72 A. R. Piquero
App
endi
x(c
onti
nued
)
Aut
hors
Yea
rSa
mpl
eA
geR
ace
Gen
der
Out
com
eV
aria
ble
Num
ber
ofG
roup
sIn
tere
stin
gfin
ding
Oes
terl
eet
al.
2004
Seat
tlepu
blic
scho
olst
uden
ts(S
SDP)
13–1
8W
hite
,asi
an,
blac
k,ot
her
Mal
esFe
mal
esSe
lf-r
epor
tsof
heav
ydr
inki
ng
4U
sed
heav
ydr
inki
ngtr
ajec
tori
esto
pred
ict
heal
thst
atus
and
beha
vior
atag
e24
Egg
lest
onet
al.
2004
Bos
ton-
area
deli
nque
nts
(n=
500)
7–70
Whi
teM
ale
Arr
ests
6fo
rto
tal
arre
sts,
diff
eren
tnu
mbe
rsfo
rot
her
anal
yses
Met
hodo
logi
cal
piec
esh
owin
gdi
ffer
ent
traj
ecto
ries
depe
ndin
gon
deat
h,fo
llow
-up,
and
inca
rcer
atio
n
NIC
HD
2004
NIC
HD
Stud
yof
Ear
lyC
hild
Car
e(1
0U
SC
ities
,n=
1,19
5)
2–9
Whi
teN
on-W
hite
Mal
esFe
mal
esM
othe
rra
ting
s5
Agg
ress
ion
Orl
ando
,T
ucke
r,E
llic
kson
,an
dK
lein
2004
Ran
dA
dole
scen
t&
You
ngA
dult
Pane
lSt
udy
(n=
5,91
4)
13–2
3W
hite
Non
-Whi
teM
ale
Fem
ale
Self
-rep
orts
6Sm
okin
g(q
uant
ity
and
freq
uenc
y)
Tre
mbl
ayet
al.
2004
Que
bec
fam
ilie
sw
ith
afiv
e-m
onth
old
new
born
(n=
572
fam
ilie
s)
17–4
2m
onth
sW
hite
Mal
esFe
mal
esM
othe
rra
ting
sof
phys
ical
aggr
essi
onat
17,3
0,an
d42
mon
ths
afte
rbi
rth
3
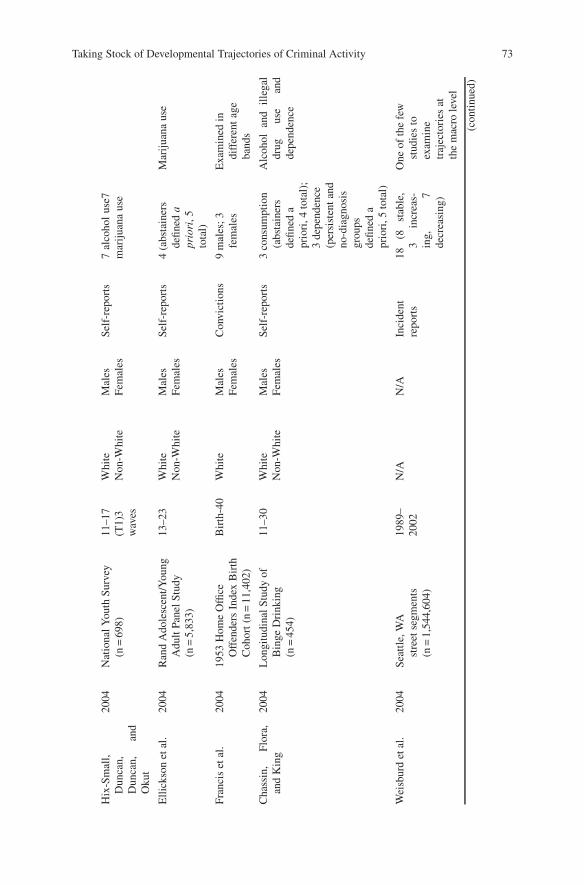
Taking Stock of Developmental Trajectories of Criminal Activity 73
Hix
-Sm
all,
Dun
can,
Dun
can,
and
Oku
t
2004
Nat
iona
lYou
thSu
rvey
(n=
698)
11–1
7(T
1)3
wav
es
Whi
teN
on-W
hite
Mal
esFe
mal
esSe
lf-r
epor
ts7
alco
hol
use7
mar
ijua
naus
e
Elli
ckso
net
al.
2004
Ran
dA
dole
scen
t/You
ngA
dult
Pane
lStu
dy(n
=5,
833)
13–2
3W
hite
Non
-Whi
teM
ales
Fem
ales
Self
-rep
orts
4(a
bsta
iner
sde
fined
apr
iori
,5to
tal)
Mar
ijua
naus
e
Fran
cis
etal
.20
0419
53H
ome
Offi
ceO
ffen
ders
Inde
xB
irth
Coh
ort(
n=
11,4
02)
Bir
th-4
0W
hite
Mal
esFe
mal
esC
onvi
ctio
ns9
mal
es;3
fem
ales
Exa
min
edin
diff
eren
tag
eba
nds
Cha
ssin
,Fl
ora,
and
Kin
g20
04L
ongi
tudi
nalS
tudy
ofB
inge
Dri
nkin
g(n
=45
4)
11–3
0W
hite
Non
-Whi
teM
ales
Fem
ales
Self
-rep
orts
3co
nsum
ptio
n(a
bsta
iner
sde
fined
apr
iori
,4to
tal)
;3
depe
nden
ce(p
ersi
sten
tand
no-d
iagn
osis
grou
psde
fined
apr
iori
,5to
tal)
Alc
ohol
and
ille
gal
drug
use
and
depe
nden
ce
Wei
sbur
det
al.
2004
Seat
tle,
WA
stre
etse
gmen
ts(n
=1,
544,
604)
1989
–20
02N
/AN
/AIn
cide
ntre
port
s18
(8st
able
,3
incr
eas-
ing,
7de
crea
sing
)
One
ofth
efe
wst
udie
sto
exam
ine
traj
ecto
ries
atth
em
acro
leve
l
(con
tinu
ed)
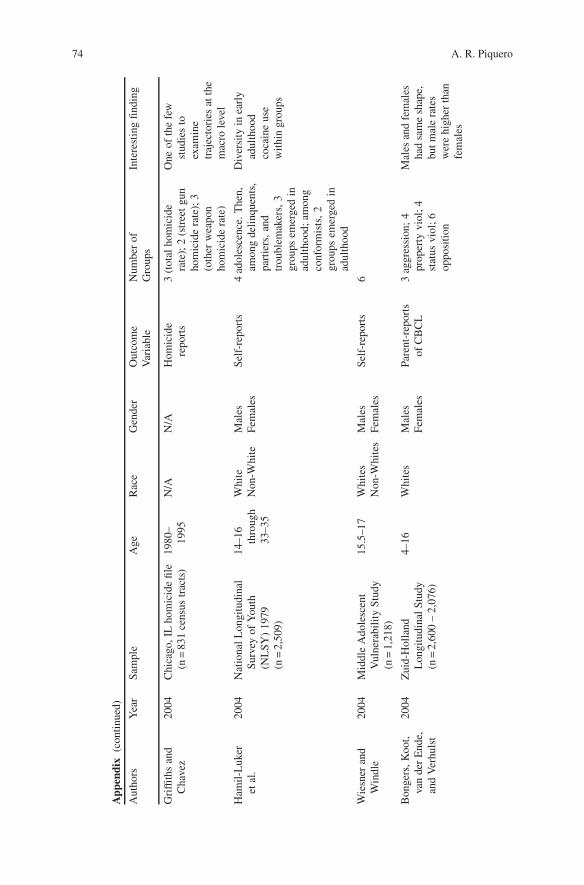
74 A. R. Piquero
App
endi
x(c
onti
nued
)
Aut
hors
Yea
rSa
mpl
eA
geR
ace
Gen
der
Out
com
eV
aria
ble
Num
ber
ofG
roup
sIn
tere
stin
gfin
ding
Gri
ffith
san
dC
have
z20
04C
hica
go,I
Lho
mic
ide
file
(n=
831
cens
ustr
acts
)19
80–
1995
N/A
N/A
Hom
icid
ere
port
s3
(tot
alho
mic
ide
rate
);2
(str
eet
gun
hom
icid
era
te);
3(o
ther
wea
pon
hom
icid
era
te)
One
ofth
efe
wst
udie
sto
exam
ine
traj
ecto
ries
atth
em
acro
leve
l
Ham
il-L
uker
etal
.20
04N
atio
nalL
ongi
tudi
nal
Surv
eyof
You
th(N
LSY
)19
79(n
=2,
509)
14–1
6th
roug
h33
–35
Whi
teN
on-W
hite
Mal
esFe
mal
esSe
lf-r
epor
ts4
adol
esce
nce.
The
n,am
ong
deli
nque
nts,
part
iers
,and
trou
blem
aker
s,3
grou
psem
erge
din
adul
thoo
d;am
ong
conf
orm
ists
,2gr
oups
emer
ged
inad
ulth
ood
Div
ersi
tyin
earl
yad
ulth
ood
coca
ine
use
wit
hin
grou
ps
Wie
sner
and
Win
dle
2004
Mid
dle
Ado
lesc
ent
Vul
nera
bili
tySt
udy
(n=
1,21
8)
15.5
–17
Whi
tes
Non
-Whi
tes
Mal
esFe
mal
esSe
lf-r
epor
ts6
Bon
gers
,Koo
t,va
nde
rE
nde,
and
Ver
huls
t
2004
Zui
d-H
olla
ndL
ongi
tudi
nalS
tudy
(n=
2,60
0–
2,07
6)
4–16
Whi
tes
Mal
esFe
mal
esPa
rent
-rep
orts
ofC
BC
L3
aggr
essi
on;
4pr
oper
tyvi
ol;4
stat
usvi
ol;6
oppo
siti
on
Mal
esan
dfe
mal
esha
dsa
me
shap
e,bu
tmal
era
tes
wer
ehi
gher
than
fem
ales
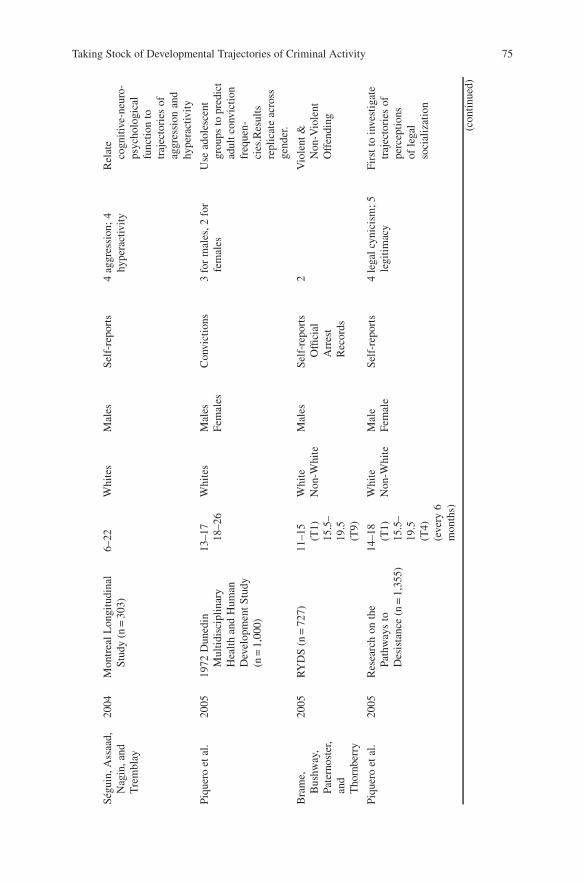
Taking Stock of Developmental Trajectories of Criminal Activity 75
Ségu
in,A
ssaa
d,N
agin
,and
Tre
mbl
ay
2004
Mon
trea
lLon
gitu
dina
lSt
udy
(n=
303)
6–22
Whi
tes
Mal
esSe
lf-r
epor
ts4
aggr
essi
on;
4hy
pera
ctiv
ity
Rel
ate
cogn
itiv
e-ne
uro-
psyc
holo
gica
lfu
ncti
onto
traj
ecto
ries
ofag
gres
sion
and
hype
ract
ivit
y
Piqu
ero
etal
.20
0519
72D
uned
inM
ulti
disc
ipli
nary
Hea
lth
and
Hum
anD
evel
opm
entS
tudy
(n=
1,00
0)
13–1
718
–26
Whi
tes
Mal
esFe
mal
esC
onvi
ctio
ns3
for
mal
es,2
for
fem
ales
Use
adol
esce
ntgr
oups
topr
edic
tad
ultc
onvi
ctio
nfr
eque
n-ci
es.R
esul
tsre
plic
ate
acro
ssge
nder
.
Bra
me,
Bus
hway
,Pa
tern
oste
r,an
dT
horn
berr
y
2005
RY
DS
(n=
727)
11–1
5(T
1)15
.5–
19.5
(T9)
Whi
teN
on-W
hite
Mal
esSe
lf-r
epor
tsO
ffici
alA
rres
tR
ecor
ds
2V
iole
nt&
Non
-Vio
lent
Off
endi
ng
Piqu
ero
etal
.20
05R
esea
rch
onth
ePa
thw
ays
toD
esis
tanc
e(n
=1,
355)
14–1
8(T
1)15
.5–
19.5
(T4)
(eve
ry6
mon
ths)
Whi
teN
on-W
hite
Mal
eFe
mal
eSe
lf-r
epor
ts4
lega
lcyn
icis
m;5
legi
tim
acy
Firs
tto
inve
stig
ate
traj
ecto
ries
ofpe
rcep
tion
sof
lega
lso
cial
izat
ion
(con
tinu
ed)
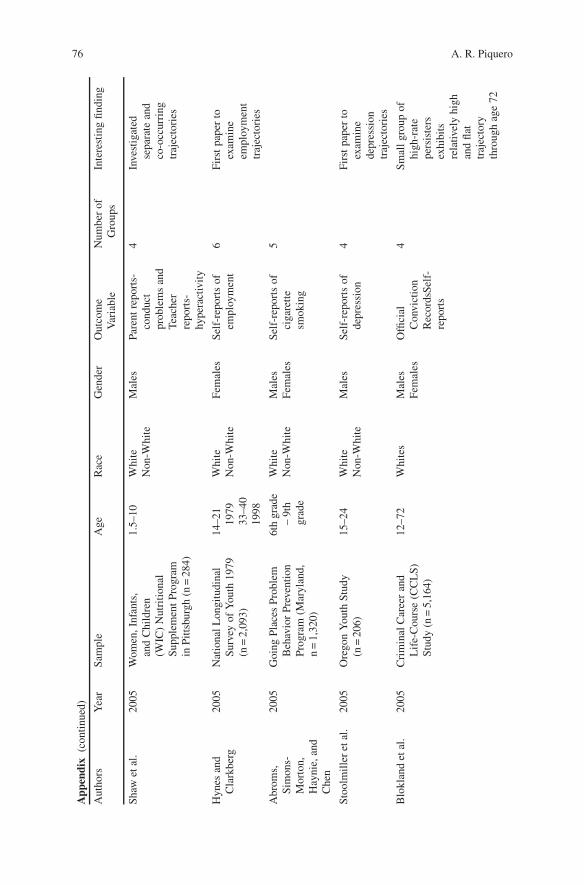
76 A. R. Piquero
App
endi
x(c
onti
nued
)
Aut
hors
Yea
rSa
mpl
eA
geR
ace
Gen
der
Out
com
eV
aria
ble
Num
ber
ofG
roup
sIn
tere
stin
gfin
ding
Shaw
etal
.20
05W
omen
,Inf
ants
,an
dC
hild
ren
(WIC
)N
utri
tion
alSu
pple
men
tPro
gram
inP
itts
burg
h(n
=28
4)
1.5–
10W
hite
Non
-Whi
teM
ales
Pare
ntre
port
s-co
nduc
tpr
oble
ms
and
Teac
her
repo
rts-
hype
ract
ivit
y
4In
vest
igat
edse
para
tean
dco
-occ
urri
ngtr
ajec
tori
es
Hyn
esan
dC
lark
berg
2005
Nat
iona
lLon
gitu
dina
lSu
rvey
ofY
outh
1979
(n=
2,09
3)
14–2
119
7933
–40
1998
Whi
teN
on-W
hite
Fem
ales
Self
-rep
orts
ofem
ploy
men
t6
Firs
tpa
per
toex
amin
eem
ploy
men
ttr
ajec
tori
es
Abr
oms,
Sim
ons-
Mor
ton,
Hay
nie,
and
Che
n
2005
Goi
ngPl
aces
Prob
lem
Beh
avio
rPr
even
tion
Prog
ram
(Mar
ylan
d,n
=1,
320)
6th
grad
e–
9th
grad
e
Whi
teN
on-W
hite
Mal
esFe
mal
esSe
lf-r
epor
tsof
ciga
rett
esm
okin
g
5
Sto
olm
ille
ret
al.
2005
Ore
gon
You
thSt
udy
(n=
206)
15–2
4W
hite
Non
-Whi
teM
ales
Self
-rep
orts
ofde
pres
sion
4Fi
rst
pape
rto
exam
ine
depr
essi
ontr
ajec
tori
es
Blo
klan
det
al.
2005
Cri
min
alC
aree
ran
dL
ife-
Cou
rse
(CC
LS)
Stud
y(n
=5,
164)
12–7
2W
hite
sM
ales
Fem
ales
Offi
cial
Con
vict
ion
Rec
ords
Self
-re
port
s
4Sm
allg
roup
ofhi
gh-r
ate
pers
iste
rsex
hibi
tsre
lativ
ely
high
and
flat
traj
ecto
ryth
roug
hag
e72
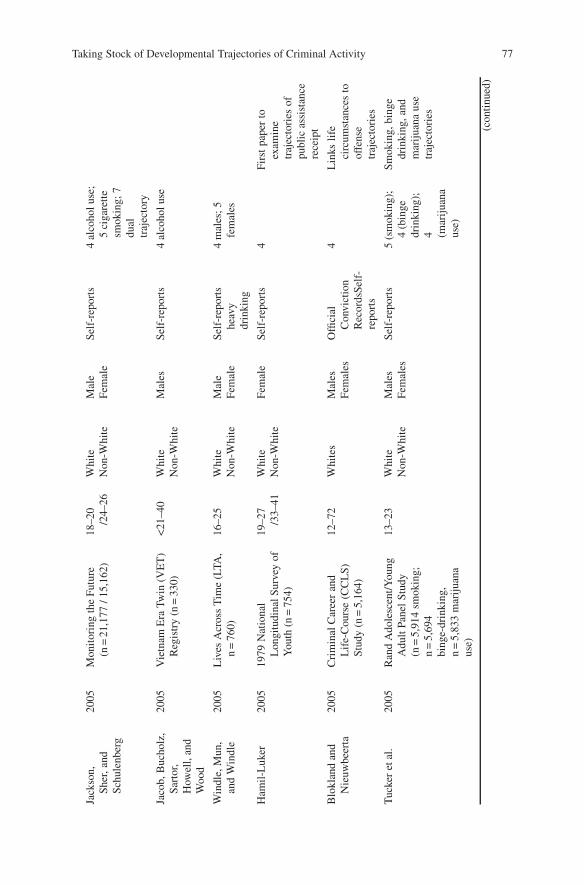
Taking Stock of Developmental Trajectories of Criminal Activity 77
Jack
son,
Sher
,and
Schu
lenb
erg
2005
Mon
itor
ing
the
Futu
re(n
=21
,177
/15,
162)
18–2
0/2
4–26
Whi
teN
on-W
hite
Mal
eFe
mal
eSe
lf-r
epor
ts4
alco
holu
se;
5ci
gare
tte
smok
ing;
7du
altr
ajec
tory
Jaco
b,B
ucho
lz,
Sart
or,
How
ell,
and
Woo
d
2005
Vie
tnam
Era
Twin
(VE
T)
Reg
istr
y(n
=33
0)<
21–4
0W
hite
Non
-Whi
teM
ales
Self
-rep
orts
4al
coho
luse
Win
dle,
Mun
,an
dW
indl
e20
05L
ives
Acr
oss
Tim
e(L
TA,
n=
760)
16–2
5W
hite
Non
-Whi
teM
ale
Fem
ale
Self
-rep
orts
heav
ydr
inki
ng
4m
ales
;5fe
mal
es
Ham
il-L
uker
2005
1979
Nat
iona
lL
ongi
tudi
nalS
urve
yof
You
th(n
=75
4)
19–2
7/3
3–41
Whi
teN
on-W
hite
Fem
ale
Self
-rep
orts
4Fi
rst
pape
rto
exam
ine
traj
ecto
ries
ofpu
blic
assi
stan
cere
ceip
t
Blo
klan
dan
dN
ieuw
beer
ta20
05C
rim
inal
Car
eer
and
Lif
e-C
ours
e(C
CL
S)St
udy
(n=
5,16
4)
12–7
2W
hite
sM
ales
Fem
ales
Offi
cial
Con
vict
ion
Rec
ords
Self
-re
port
s
4L
inks
life
circ
umst
ance
sto
offe
nse
traj
ecto
ries
Tuc
ker
etal
.20
05R
and
Ado
lesc
ent/
You
ngA
dult
Pane
lSt
udy
(n=
5,91
4sm
okin
g;n
=5,
694
bing
e-dr
inki
ng,
n=
5,83
3m
arij
uana
use)
13–2
3W
hite
Non
-Whi
teM
ales
Fem
ales
Self
-rep
orts
5(s
mok
ing)
;4
(bin
gedr
inki
ng);
4 (mar
ijua
naus
e)
Smok
ing,
bing
edr
inki
ng,a
ndm
arij
uana
use
traj
ecto
ries
(con
tinu
ed)
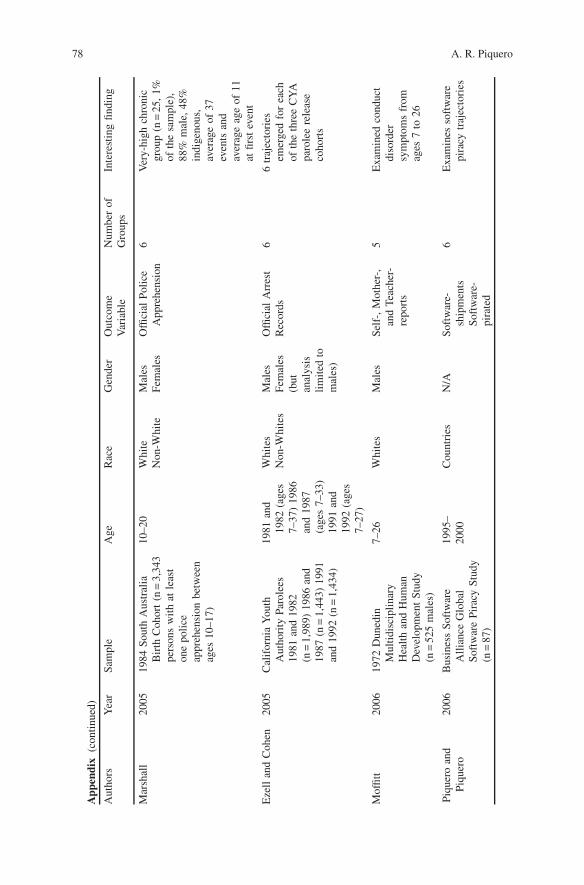
78 A. R. Piquero
App
endi
x(c
onti
nued
)
Aut
hors
Yea
rSa
mpl
eA
geR
ace
Gen
der
Out
com
eV
aria
ble
Num
ber
ofG
roup
sIn
tere
stin
gfin
ding
Mar
shal
l20
0519
84So
uth
Aus
tral
iaB
irth
Coh
ort
(n=
3,34
3pe
rson
sw
ith
atle
ast
one
poli
ceap
preh
ensi
onbe
twee
nag
es10
–17)
10–2
0W
hite
Non
-Whi
teM
ales
Fem
ales
Offi
cial
Poli
ceA
ppre
hens
ion
6V
ery-
high
chro
nic
grou
p(n
=25
,1%
ofth
esa
mpl
e),
88%
mal
e,48
%in
dige
nous
,av
erag
eof
37ev
ents
and
aver
age
age
of11
atfir
stev
ent
Eze
llan
dC
ohen
2005
Cal
ifor
nia
You
thA
utho
rity
Paro
lees
1981
and
1982
(n=
1,98
9)19
86an
d19
87(n
=1,
443)
1991
and
1992
(n=
1,43
4)
1981
and
1982
(age
s7–
37)
1986
and
1987
(age
s7–
33)
1991
and
1992
(age
s7–
27)
Whi
tes
Non
-Whi
tes
Mal
esFe
mal
es(b
utan
alys
isli
mit
edto
mal
es)
Offi
cial
Arr
est
Rec
ords
66
traj
ecto
ries
emer
ged
for
each
ofth
eth
ree
CY
Apa
role
ere
leas
eco
hort
s
Mof
fitt
2006
1972
Dun
edin
Mul
tidi
scip
lina
ryH
ealt
han
dH
uman
Dev
elop
men
tSt
udy
(n=
525
mal
es)
7–26
Whi
tes
Mal
esSe
lf-,
Mot
her-
,an
dTe
ache
r-re
port
s
5E
xam
ined
cond
uct
diso
rder
sym
ptom
sfr
omag
es7
to26
Piqu
ero
and
Piqu
ero
2006
Bus
ines
sSo
ftw
are
All
ianc
eG
loba
lSo
ftw
are
Pira
cySt
udy
(n=
87)
1995
–20
00C
ount
ries
N/A
Soft
war
e-sh
ipm
ents
Soft
war
e-pi
rate
d
6E
xam
ines
soft
war
epi
racy
traj
ecto
ries


![Neurobehavioral and Developmental Trajectories Associated ... · with cognition, some groups report no abnormalities in language [21], whiles others report more subtle and narrow](https://static.fdocuments.net/doc/165x107/5f4703fe4bb95626d129ad66/neurobehavioral-and-developmental-trajectories-associated-with-cognition-some.jpg)


