Tables and Non Parametric Tests Lecture 5 Non-normal Data Log-normal data Transform Data Compare the...
16
Tables and Non Parametric Tests Lecture 5
-
Upload
allen-rustin -
Category
Documents
-
view
222 -
download
2
Transcript of Tables and Non Parametric Tests Lecture 5 Non-normal Data Log-normal data Transform Data Compare the...

Tables and Non Parametric Tests
Tables and Non Parametric Tests
Lecture 5

Non-normal Data
0 5 10 15
Observed Value
0
3
6
9
12
15
Exp
ect
ed
No
rmal
Va
lue
Normal Q-Q Plot of Not Normal
-10 0 10 20
Observed Value
-10
0
10
20
Ex
pe
cte
d N
orm
al V
alu
e
Normal Q-Q Plot of Not Normal Either
Log-normal dataLog-normal data
Transform DataTransform Data
Compare the means of the transformed (normal) data
Compare the means of the transformed (normal) data
Binomial dataBinomial data
Really non-normal data
Really non-normal data

Binomial Data
Are the proportions of Turks in Aalborg and Århus the same?
Non-Turks
Turks
Aalborg 465 35
Århus 358 42
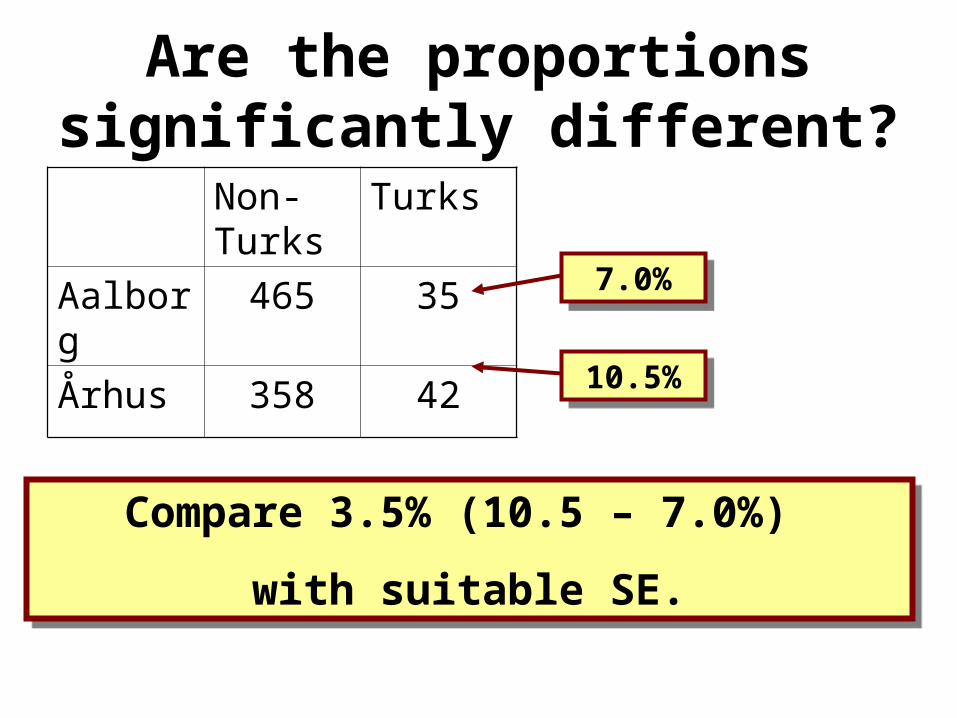
Are the proportions significantly different?
Non-Turks
Turks
Aalborg 465 35
Århus 358 42
7.0%7.0%
10.5%10.5%
Compare 3.5% (10.5 – 7.0%)
with suitable SE.
Compare 3.5% (10.5 – 7.0%)
with suitable SE.

Another Approach
Non-Turks
Turks
Aalborg 465 35
Århus 358 42
Non-Turks
Turks
Aalborg 457 43
Århus 366 34
ObservedObserved ExpectedExpected
In total 77 turks in a 900 sample, i.e. 8.6%
In total 77 turks in a 900 sample, i.e. 8.6%
We expect 34 turks in
Århus (8.6% of 400) We expect 34 turks in
Århus (8.6% of 400)

Same proprotion in Aalborg and Århus?
Non-Turks
Turks
Aalborg 465 35
Århus 358 42
Non-Turks
Turks
Aalborg 457 43
Århus 366 34
ObservedObserved ExpectedExpected
Observed and expected should be
close
Observed and expected should be
close

How to do it in SPSS
…or data could be organized in 900 rows
…or data could be organized in 900 rows

Cross-Tabs
City * Etnicity Crosstabulation
Count
465 35 500
358 42 400
823 77 900
Aalborg
Århus
City
Total
Non-Turk Turk
Etnicity
Total

Tricks

City * Etnicity Crosstabulation
465 35 500
457,2 42,8 500,0
93,0% 7,0% 100,0%
358 42 400
365,8 34,2 400,0
89,5% 10,5% 100,0%
823 77 900
823,0 77,0 900,0
91,4% 8,6% 100,0%
Count
Expected Count
% within City
Count
Expected Count
% within City
Count
Expected Count
% within City
Aalborg
Århus
City
Total
Non-Turk Turk
Etnicity
Total
Output
Chi-Square Tests
3,480b 1 ,062
3,047 1 ,081
3,454 1 ,063
,072 ,041
3,476 1 ,062
900
Pearson Chi-Square
Continuity Correctiona
Likelihood Ratio
Fisher's Exact Test
Linear-by-LinearAssociation
N of Valid Cases
Value dfAsymp. Sig.
(2-sided)Exact Sig.(2-sided)
Exact Sig.(1-sided)
Computed only for a 2x2 tablea.
0 cells (,0%) have expected count less than 5. The minimum expected count is34,22.
b.
Expected values
Expected values
ProportionsProportions
P-valueP-value
Test Statistic
Test Statistic
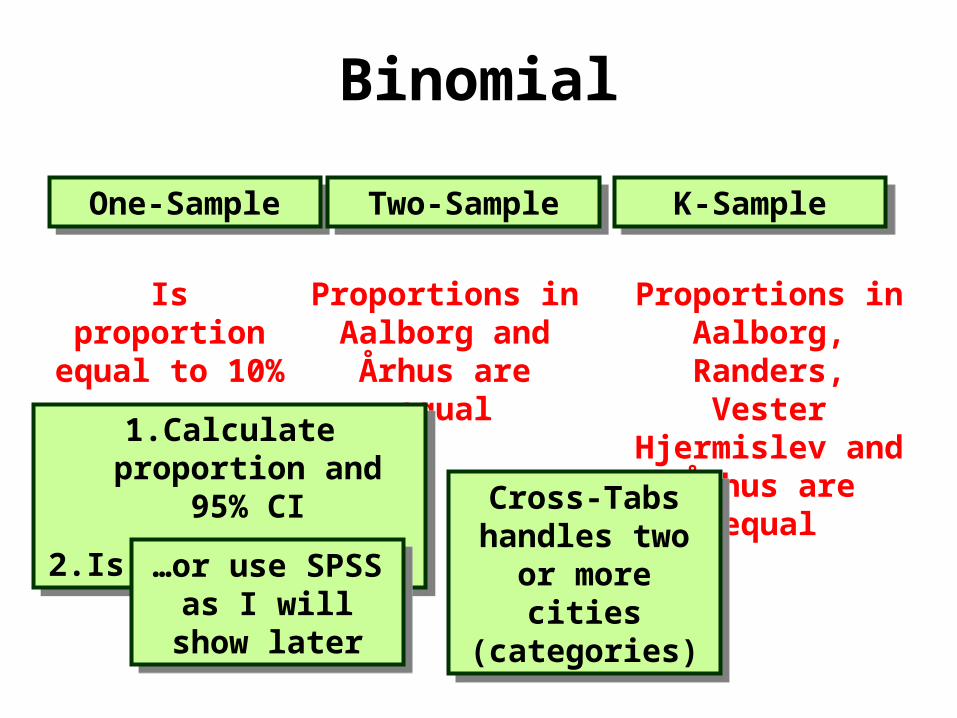
Binomial
One-SampleOne-Sample Two-SampleTwo-Sample K-SampleK-Sample
Is proportion equal to 10%
Proportions in Aalborg and
Århus are equal
Proportions in Aalborg, Randers, Vester Hjermislev
and Århus are equal
Cross-Tabs handles two or
more cities (categories)
Cross-Tabs handles two or
more cities (categories)
1. Calculate proportion and 95% CI
2. Is 10% in the CI?
1. Calculate proportion and 95% CI
2. Is 10% in the CI?
…or use SPSS as I will show
later
…or use SPSS as I will show
later

One-Sample (Symmetry or Location)
Kiama Blowhole Data
• Highly skew distribution
• Average approx 40 sec
• Rarely above 100 sec
Median equal to 40 sec?
Only above 100 sec in 1% of the eruptions?
Normal distributed ?
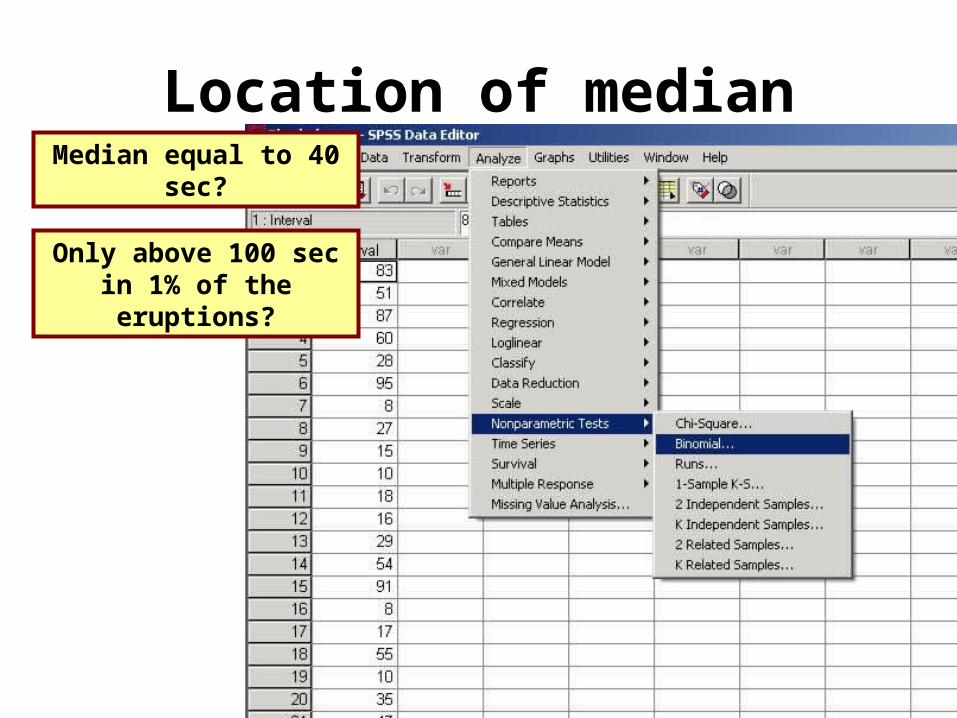
Location of medianMedian equal to 40
sec?
Only above 100 sec in 1% of the eruptions?
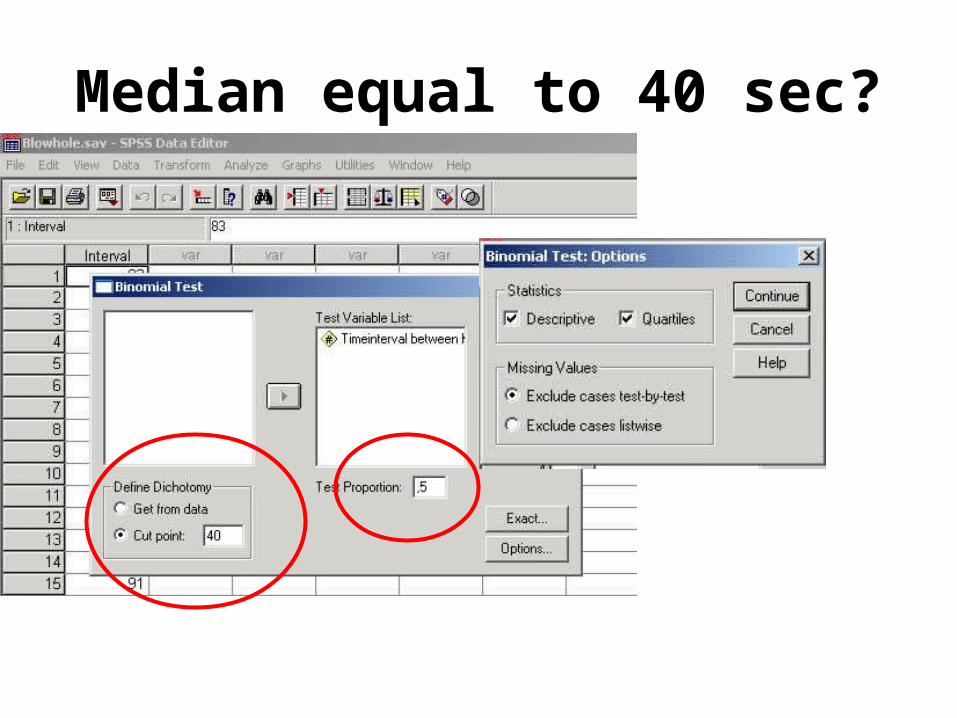
Median equal to 40 sec?

Output
Descriptive Statistics
64 39,83 33,751 7 169 14,25 28,00 60,00Timeintervalbetween KiamaBlowhole eruptions
N Mean Std. Deviation Minimum Maximum 25th 50th (Median) 75th
Percentiles
NPar Tests
Binomial Test
<= 40 41 ,64 ,50 ,033a
> 40 23 ,36
64 1,00
Group 1
Group 2
Total
Timeintervalbetween KiamaBlowhole eruptions
Category NObserved
Prop. Test Prop.Asymp. Sig.
(2-tailed)
Based on Z Approximation.a.
NOPE!Median equal to 40 sec?

Only above 100 sec in 1% of the eruptions?
Binomial Test
<= 100 62 ,97 ,01 ,000a
> 100 2 ,03
64 1,00
Group 1
Group 2
Total
Timeintervalbetween KiamaBlowhole eruptions
Category NObserved
Prop. Test Prop.Asymp. Sig.
(1-tailed)
Based on Z Approximation.a.