TABLE OF CONTENTS - World...
10
Foreword vii Acknowledgements viii Executive Summary ix Abbreviations and Acronyms xi Country Classification According to Region xii Country Classification According to Income xiii 1. Introduction 1 2. Global Waste Management Practices 4 3. Waste Generation 8 4. Waste Collection 13 5. Waste Composition 16 6. Waste Disposal 22 7. Waste and the Environment 25 A Note on the Reliability of Solid Waste Data 32 TABLE OF CONTENTS Maxim Tupikov /Shutterstock.com
-
Upload
phunghuong -
Category
Documents
-
view
221 -
download
0
Transcript of TABLE OF CONTENTS - World...
Foreword vii
Acknowledgements viii
Executive Summary ix
Abbreviations and Acronyms xi
Country Classification According to Region xii
Country Classification According to Income xiii
1. Introduction 1
2. Global Waste Management Practices 4
3. Waste Generation 8
4. Waste Collection 13
5. Waste Composition 16
6. Waste Disposal 22
7. Waste and the Environment 25
A Note on the Reliability of Solid Waste Data 32
TABLE OF CONTENTSMaxim Tupikov /Shutterstock.com

iv URBAN DEVELOPMENT SERIES – KNOWLEDGE PAPERS
Annexes
A. Map of Regions 36
B. Map of Income Distribution 38
C. Availability of MSW Data by Country 40
D. Countries Excluded for Lack of Data 45
E. Estimated Solid Waste Management Costs 46
F. MSW Generation Data for Cities Over 100,000 47
G. MSW Collection Data for Cities Over 100,000 63
H. MSW Disposal Methods for Cities Over 100,000 71
I. MSW Composition Data for Cities Over 100,000 78
J. MSW Generation by Country — Current Data and Projections for 2025 80
K. MSW Collection Rates by Country 84
L. MSW Disposal Methods by Country 87
M. MSW Composition by Country 90
N. IPCC Classification of MSW Composition 93
O. The Global City Indicators Program 94
References 95

WHAT A WASTE: A GLOBAL REVIEW OF SOLID WASTE MANAGEMENT v
List of Tables1. Comparison of solid waste management practices by income level 52. Generators and types of solid waste 73. Current waste generation per capita by region 94. Waste generation projections for 2025 by region 105. Current waste generation per capita by income level 106. Waste generation projections for 2025 by income 117. Sources for 2025 projections of solid waste generation 128. Average MSW generation rates by income 129. Types of waste and their sources 1610. Types of waste composition by income level 1911. MSW disposal by income 2312. MSW disposal in two contrasting regions 2413. Landfill classifications 2914. Landfill methane emissions and total GHG emissions for selected countries 3015. Technical GHG mitigation opportunities by waste management component 31
List of Figures1. Waste generation by region 92. Waste generation by income level 113. Urban waste generation by income level and year 124. Waste collection rates by income 155. Waste collection rates by region 156. Waste composition in China 177. Global solid waste composition 178. Waste composition by income 199. Solid waste composition by income and year 2010. Waste composition by region 2111. Total MSW disposed of worldwide 2212. Low-income countries waste disposal 2413. Upper middle-income countries waste disposal 2414. Waste hierarchy 27
List of Boxes1. What a Waste 1999: What’s changed (and what hasn’t) in the last decade 22. Definitions of Municipal Solid Waste 43. Components of an Integrated Solid Waste Management Plan 254. Integrated Sustainable Waste Management Framework 26

Solid waste management is the one thing just about every city government provides for its residents. While service levels, environ-mental impacts and costs vary dramatically, solid waste management is arguably the most important municipal service and serves as a prerequisite for other municipal action.
Currently, world cities generate about 1.3 billion tonnes of solid waste per year. This volume is expected to increase to 2.2 billion tonnes by 2025. Waste generation rates will more than double over the next twenty years in lower income countries. Globally, solid waste management costs will increase from today’s annual $205.4 billion to about $375.5 billion in 2025. Cost increases will be most severe in low income countries (more than 5-fold increases) and lower-middle income countries (more than 4-fold increases).
The global impacts of solid waste are growing fast. Solid waste is a large source of methane, a powerful GHG that is particularly impactful in the short-term. The recycling industry, with more
than two million informal waste pickers, is now a global business with international markets and extensive supply and transportation networks. Locally, uncollected solid waste contributes to flooding, air pollution, and public health impacts such as respiratory ailments, diarrhea and dengue fever. In lower income country cities solid waste management is usually a city’s single largest budgetary item.
The report you have before you is an important one that provides a quick snapshot of the state of today’s global solid waste management practices. A credible estimate is made for what the situation will look like in 2025. The findings are sobering. Improving solid waste management, especially in low income countries, is an urgent priority. Hopefully, this report will contribute to the dialogue that leads to much-needed action.
Rachel KyteVice President and Head of Network, Sustainable DevelopmentThe World Bank
FOREWORD ITC landfill and recycling center, Ankara, Turkey
Photo: ©Simone D. McCourtie/World Bank
Photo: Perinaz Bhada-Tata
Ghabawi landfill, Amman, Jordan
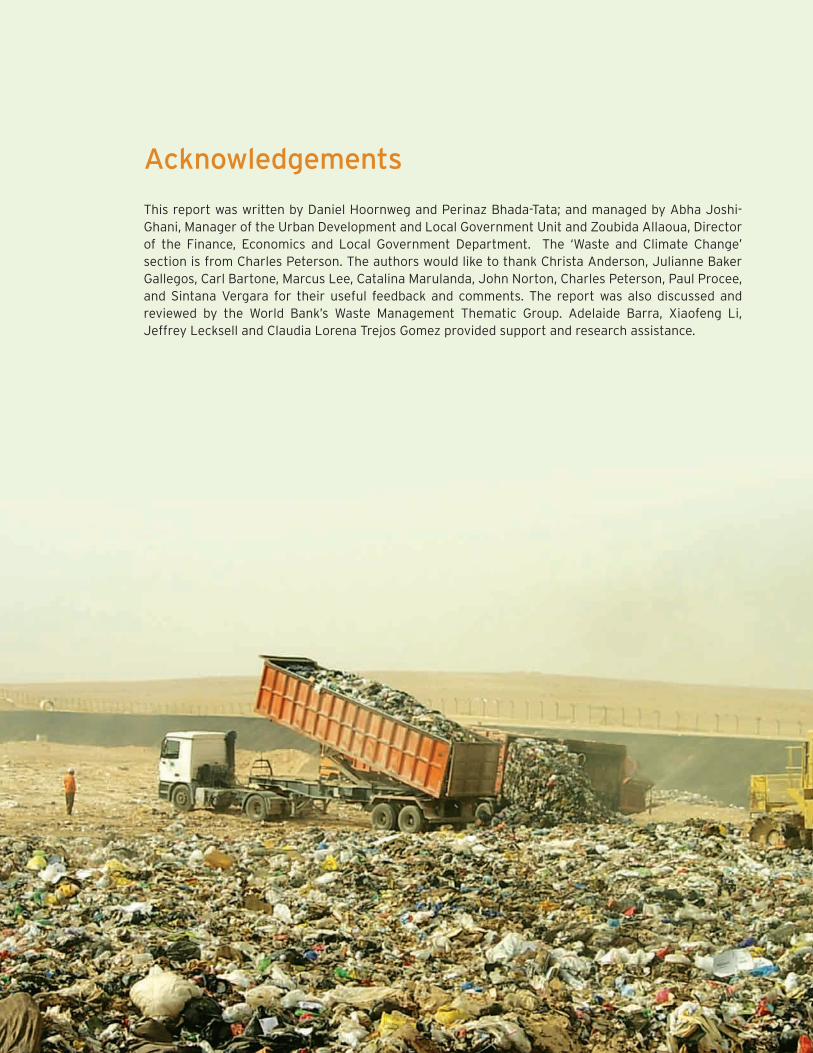
Acknowledgements
This report was written by Daniel Hoornweg and Perinaz Bhada-Tata; and managed by Abha Joshi-Ghani, Manager of the Urban Development and Local Government Unit and Zoubida Allaoua, Director of the Finance, Economics and Local Government Department. The ‘Waste and Climate Change’ section is from Charles Peterson. The authors would like to thank Christa Anderson, Julianne Baker Gallegos, Carl Bartone, Marcus Lee, Catalina Marulanda, John Norton, Charles Peterson, Paul Procee, and Sintana Vergara for their useful feedback and comments. The report was also discussed and reviewed by the World Bank’s Waste Management Thematic Group. Adelaide Barra, Xiaofeng Li, Jeffrey Lecksell and Claudia Lorena Trejos Gomez provided support and research assistance.

EXECUTIVE SUMMARYAs the world hurtles toward its urban future, the amount of municipal solid waste (MSW), one of the most important by-products of an urban lifestyle, is growing even faster than the rate of urbanization. Ten years ago there were 2.9 billion urban residents who generated about 0.64 kg of MSW per person per day (0.68 billion tonnes per year). This report estimates that today these amounts have increased to about 3 billion residents generating 1.2 kg per person per day (1.3 billion tonnes per year). By 2025 this will likely increase to 4.3 billion urban residents generating about 1.42 kg/capita/day of municipal solid waste (2.2 billion tonnes per year).
Municipal solid waste management is the most important service a city provides; in low-income countries as well as many middle-income countries, MSW is the largest single budget item for cities and one of the largest employers. Solid waste is usually the one service that falls completely
within the local government’s purview. A city that cannot effectively manage its waste is rarely able to manage more complex services such as health, education, or transportation.
Poorly managed waste has an enormous impact on health, local and global environment, and economy; improperly managed waste usually results in down-stream costs higher than what it would have cost to manage the waste properly in the first place. The global nature of MSW includes its contribution to GHG emissions, e.g. the methane from the organic fraction of the waste stream, and the increasingly global linkages of products, urban practices, and the recycling industry.
This report provides consolidated data on MSW generation, collection, composition, and disposal by country and by region. Despite its importance, reliable global MSW information is not typically available. Data is often inconsistent, incomparable and incomplete; however as suggested in this report there is now enough MSW information to estimate
Ghabawi landfill, Amman, Jordan
Golf course: post closure use of landfill site
Photo: Perinaz Bhada-Tata
Photo: Ron Perry/Oki Golf

x URBAN DEVELOPMENT SERIES – KNOWLEDGE PAPERS
global amounts and trends. The report also makes projections on MSW generation and composition for 2025 in order for decision makers to prepare plans and budgets for solid waste management in the coming years. Detailed annexes provide available MSW generation, collection, compo-sition, and disposal data by city and by country.
Globally, waste volumes are increasing quickly – even faster than the rate of urbanization. Similar to rates of urbanization and increases in GDP, rates of MSW growth are fastest in China, other parts of East Asia, and parts of Eastern Europe and the Middle East. Municipal planners should manage solid waste in as holistic a manner as possible. There is a strong correlation between urban solid waste generation rates and GHG emissions. This link is likely similar with other urban inputs/outputs such as waste water and total energy use. Reviewing MSW in an integrated manner with a more holistic approach, focusing on urban form and lifestyle choice may yield broader benefits.
Pollution such as solid waste, GHG emissions and ozone-depleting substances are by-products of urbanization and increasing affluence.
Improving MSW is one of the most effective ways to strengthen overall municipal management and is usually a prerequisite for other, more compli-cated, municipal services. Waste workers, both formal and informal, have a significant impact on overall MSW programming. While in more affluent countries ageing workers are a growing challenge, the effective integration of waste pickers, particu-larly in low-income countries, is critical.
This report is a follow-up to What a Waste: Solid Waste Management in Asia, a Working Paper Published by the East Asia and the Pacific Region Urban and Local Government Sector of the World Bank in 1999. The report has been expanded to include the entire world, given data availability and increased inter-dependence between nations and linkages in global trade, particularly that of secondary materials.
Men pick up used cardboard boxes to
sell for recycling in the San Joaquin open-air market in
Salvador, Brazil
Photo: Alejandro Lipszyc/World Bank

WHAT A WASTE: A GLOBAL REVIEW OF SOLID WASTE MANAGEMENT xi
Abbreviations and Acronyms
AFR Africa region
C&D Construction and demolition
CDM Clean Development Mechanism
EAP East Asia and Pacific region
ECA Europe and Central Asia region
GDP Gross Domestic Product
GHG Greenhouse gas
HIC High-income country
ICI Industrial, commercial, and institutional
IPCC Intergovernmental Panel on Climate Change
ISWM Integrated solid waste management
Kg/capita/day kilograms per capita per day
LCR Latin America and the Caribbean region
LIC Low-income country
LMIC Lower middle-income country
MENA Middle East and North Africa region
METAP Mediterranean Environmental Technical Assistance Program
MRF Materials recovery facility
MSW Municipal solid waste
mtCO2e Million tonnes of carbon dioxide equivalent
OECD Organisation for Economic Co-operation and Development
PAHO Pan-American Health Organization
RDF Refuse–derived fuel
SAR South Asia region
SWM Solid waste management
tCO2e Tons of carbon dioxide equivalent
UMIC Upper middle-income country

xii URBAN DEVELOPMENT SERIES – KNOWLEDGE PAPERS
Africa (AFR)
East Asia & Pacific
(EAP)
Eastern & Central Asia
(ECA)
Latin America & the Caribbean
(LAC)
Middle East & North Africa
(MENA)
Organisation for Economic Co-operation
and Development (OECD)
South Asia (SAR)
Angola Brunei Darussalam Albania Antigua and Barbuda Algeria Andorra Bangladesh
Benin Cambodia Armenia Argentina Bahrain Australia Bhutan
Botswana China Belarus Bahamas, The Egypt, Arab Rep. Austria India
Burkina Faso Fiji Bulgaria Barbados Iran, Islamic Rep. Belgium Maldives
Burundi Hong Kong Croatia Belize Iraq Canada Nepal
Cameroon Indonesia Cyprus Bolivia Israel Czech Republic Pakistan
Cape Verde Lao PDR Estonia Brazil Jordan Denmark Sri Lanka
Central African Republic Macao, China Georgia Chile Kuwait Finland
Chad Malaysia Latvia Colombia Lebanon France
Comoros Marshall Islands Lithuania Costa Rica Malta Germany
Congo, Dem. Rep. Mongolia Macedonia, FYR Cuba Morocco Greece
Congo, Rep. Myanmar Poland Dominica Oman Hungary
Cote d’Ivoire Philippines Romania Dominican Republic Qatar Iceland
Eritrea Singapore Russian Federation Ecuador Saudi Arabia Ireland
Ethiopia Solomon Islands Serbia El Salvador Syrian Arab Republic Italy
Gabon Thailand Slovenia Grenada Tunisia Japan
Gambia Tonga Tajikistan Guatemala United Arab Emirates Korea, South
Ghana Vanuatu Turkey Guyana West Bank and Gaza Luxembourg
Guinea Vietnam Turkmenistan Haiti Monaco
Kenya Honduras Netherlands
Lesotho Jamaica New Zealand
Liberia Mexico Norway
Madagascar Nicaragua Portugal
Malawi Panama Slovak Republic
Mali Paraguay Spain
Mauritania Peru Sweden
Mauritius St. Kitts and Nevis Switzerland
Mozambique St. Lucia United Kingdom
Namibia St. Vincent and the Grenadines
United States
Niger Suriname
Nigeria Trinidad and Tobago
Rwanda Uruguay
Sao Tome and Principe Venezuela, RB
Senegal
Seychelles
Sierra Leone
South Africa
Sudan
Swaziland
Tanzania
Togo
Uganda
Zambia
Zimbabwe
Country Classification According to Region

WHAT A WASTE: A GLOBAL REVIEW OF SOLID WASTE MANAGEMENT xiii
Lower Income (LI) Lower Middle Income (LMI) Upper Middle Income (UMI) High Income (HIC)
Chad Bulgaria Colombia Barbados
Comoros Cameroon Costa Rica Belgium
Congo, Dem. Rep. Cape Verde Cuba Brunei Darussalam
Eritrea China Dominica Canada
Ethiopia Congo, Rep. Dominican Republic Croatia
Gambia Cote d'Ivoire Fiji Cyprus
Ghana Ecuador Gabon Czech Republic
Guinea Egypt, Arab Rep. Georgia Denmark
Haiti El Salvador Grenada Estonia
Kenya Guatemala Jamaica Finland
Lao PDR Guyana Latvia France
Liberia Honduras Lebanon Germany
Madagascar India Lithuania Greece
Malawi Indonesia Malaysia Hong Kong, China
Mali Iran, Islamic Rep. Mauritius Hungary
Mauritania Iraq Mexico Iceland
Mongolia Jordan Myanmar Ireland
Mozambique Lesotho Namibia Israel
Nepal Macedonia, FYR Panama Italy
Niger Maldives Peru Japan
Rwanda Marshall Islands Poland Korea, South
Senegal Morocco Romania Kuwait
Serbia Nicaragua Russian Federation Luxembourg
Sierra Leone Nigeria Seychelles Macao, China
Tanzania Pakistan South Africa Malta
Togo Paraguay St. Kitts and Nevis Monaco
Uganda Philippines St. Lucia Netherlands
Vanuatu Sao Tome and Principe St. Vincent and the Grenadines New Zealand
Vietnam Solomon Islands Suriname Norway
Zambia Sri Lanka Tajikistan Oman
Zimbabwe Sudan Uruguay Portugal
Swaziland Venezuela, RB Qatar
Syrian Arab Republic Saudi Arabia
Thailand Singapore
Tonga Slovak Republic
Tunisia Slovenia
Turkey Spain
Turkmenistan Sweden
West Bank and Gaza Switzerland
Trinidad and Tobago
United Arab Emirates
United Kingdom
United States
Country Classification According to Income