Table of Contents Source: Israeli Central Bureau of Statistics, Statistical Abstract of Israel No.64...
31
-
Upload
stanley-lyons -
Category
Documents
-
view
217 -
download
0
Transcript of Table of Contents Source: Israeli Central Bureau of Statistics, Statistical Abstract of Israel No.64...


Table of Contents
Source: Israeli Central Bureau of Statistics, Statistical Abstract of Israel No.64 – 2013. Table 14.3
• Israeli Economy 3 - 6 • Research and Development 7 - 9 • Health Economics and Health Status 10 - 18• Sick Funds 19 - 24• Health Basket and Additional Technology 25 - 31

Israel: Gross Domestic Product, Per Capita 2006-2012 (NIS)(at 2010 prices)
2006 2007 2008 2009 2010 2011 2012 ₪ 90,000
₪ 95,000
₪ 100,000
₪ 105,000
₪ 110,000
₪ 115,000
₪ 120,000
₪ 102,278
₪ 107,386
₪ 110,145 ₪ 109,567
₪ 113,667
₪ 116,686
₪ 118,422
Source: Israeli Central Bureau of Statistics, Statistical Abstract of Israel No.64 – 2013. Table 14.3

Israel: Gross Domestic Product (Million, NIS) 2006-2012at 2010 prices
2006 2007 2008 2009 2010 2011 2012 ₪ -
₪ 100,000
₪ 200,000
₪ 300,000
₪ 400,000
₪ 500,000
₪ 600,000
₪ 700,000
₪ 800,000
₪ 900,000
₪ 1,000,000
₪ 724,988 ₪ 775,166
₪ 809,689 ₪ 819,793 ₪ 866,230
₪ 905,847 ₪ 936,209
Source: Israeli Central Bureau of Statistics, Statistical Abstract of Israel No.64 – 2013. Table 14.3

Gross Domestic Product (expenditure approach)Per head, US $, current prices, current PPPs
Luxe
mbourg
Norway
Switz
erlan
d
United St
ates
Australi
a
Netherl
ands
Austria
Irelan
d
Swed
en
Denmark
Canad
a
German
y
Belgium
Finlan
d
Icelan
d
United Kingd
om
OECD - T
otal
France
Euro
area
(17 co
untries)
Japan
Euro
pean Union (2
7 countri
es) Italy
Spain
New Ze
aland
Korea
*** I
srael
Slove
nia
Czech Rep
ublic
Greece
$-
$10,000
$20,000
$30,000
$40,000
$50,000
$60,000
$70,000
$80,000
$90,000
$100,000
$86
,740
$61
,047
$51
,359
$49
,782
$43
,350
$42
,573
$42
,142
$41
,528
$41
,452
$40
,945
$40
,450
$39
,729
$38
,814
$37
,325
$36
,536
$36
,092
$35
,654
$35
,505
$35
,340
$33
,834
$32
,713
$32
,648
$31
,607
$31
,585
$29
,786
$28
,905
$27
,330
$26
,208
$25
,836
$88
,276
$65
,638
$53
,733
$51
,689
$43
,146
$43
,848
$43
,578
$43
,176
$42
,176
$41
,231
$40
,069
$38
,282
$37
,569
$37
,446
$36
,249
$36
,194
$33
,664
$33
,139
$32
,081
$30
,800
$29
,830
$27
,493
$26
,706
2012 2011
Source: OECD ://http. . / . ? =558stats oecd org index aspx queryid

GDP Growth (annual %) 2012Ch
ile
Mex
ico
Aust
ralia
Port
ugal
Esto
nia
Israe
l
Norw
ay
New
Zea
land
Turk
ey
Unite
d St
ates
Kore
a, R
ep.
Slov
ak R
epub
lic
Japa
n
Pola
nd
Cana
da
Icela
nd
Switz
erla
nd
Irela
nd
Aust
ria
Swed
en
Germ
any
Luxe
mbo
urg
Fran
ce
Finl
and
Belg
ium
Denm
ark
Neth
erla
nds
Czec
h Re
publ
ic
Spai
n
Hung
ary
Slov
enia
Italy
Gree
ce
-8.00
-6.00
-4.00
-2.00
0.00
2.00
4.00
6.00
8.00
5.56
3.92
3.40
3.25
3.22
3.20
3.09
2.97
2.24
2.21
2.04
2.00
1.94
1.90
1.71
1.64
0.97
0.94
0.85
0.74
0.67
0.31
0.27
0.01
-0.2
1-0
.28
-0.4
7-0
.96
-1.3
2-1
.42
-1.7
0-2
.30
-2.3
7-6
.38
Source: The World Bank

2011 National Expenditure on Research & Development, per capita (USD$)
Finlan
d
Switz
erlan
d
Swed
en
Denmark Isr
ael
Austria
United St
ates
German
yJap
an
Icelan
dKorea
Norway
Australi
a
Netherl
and
Belgium
France
OECD
Irelan
d
United Kingd
om
Czech Rep
ublic Italy
Spain
New Ze
eland
Portuga
l
Greece
$0
$200
$400
$600
$800
$1,000
$1,200
$1,400
$1,600
$1,175
Source: Statistical Abstract of Israel 2013-No.64, Central Bureau of Statistics, Israel. Table 28.26

National Expenditure on Research & Development (2011), as percentage of GDP
Israe
l
Finlan
dKorea
Swed
enJap
an
Denmark
Switz
erlan
d
Austria
German
y
Icelan
d
United St
ates
Australi
a
France
Netherl
and
Belgium
OECD
Czech Rep
ublic
Irelan
d
United Kingd
om
Norway
Portuga
lIta
ly
New Ze
eland
Spain
Greece
0
0.5
1
1.5
2
2.5
3
3.5
4
4.54.2
3.83.6
3.3 3.33.1
2.92.8 2.8
2.7
2.32.2 2.2
2 2 21.8
1.7 1.71.6
1.51.3 1.3
1.2
0.6
Source: Statistical Abstract of Israel 2013-No.64, Central Bureau of Statistics, Israel. Table 28.26

Israel: Patent Applications 19
6319
6419
6519
6619
6719
6819
6919
7019
7119
7219
7319
7419
7519
7619
7719
7819
7919
8019
8119
8219
8319
8419
8519
8619
8719
8819
8919
9019
9119
9219
9319
9419
9519
9619
9719
9819
9920
0020
0120
0220
0320
0420
0520
0620
0720
0820
0920
1020
11
0
1000
2000
3000
4000
5000
6000
7000
8000
9000
10000
1608
1727
1785
1892
1765
1816 20
6020
4821
62 2331
2349
2094
1915
1863 2021
1989
2120
2104
2132
2207
2295 26
9027
2728
30 3035
2859 30
4828
5626
3023
27 2635
2701 31
5921
0114
4531
0639
0452
0386
2750
9545
69 4870
4808
7239
6394
6214
5387 58
5655
26
451
441
412
397
291
290
231
247
383
394
374
344
483
561
508
632
595
669
727
707
687
696
790
819
823 99
510
4210
5210
87 1400
1318
1261
1266
1218 14
41 1950
2053
1599
1248
1213
1329 15
4431
625
716
1515
2813
8714
5013
60
Patent applications, nonresidents Patent applications, residents
Source: http://data.worldbank.org/indicator/IP.PAT.NRES/countries?display=default

Israel: National Expenditure on Health as % of GDP
1991 1992 1993 1994 1995 1996 1997 1998 1999 2000 2001 2002 2003 2004 2005 2006 2007 2008 2009 2010 2011 20126.0
6.5
7.0
7.5
8.0
8.5
6.9
7.2
7.4
7.9
7.7 7.8
8.0
7.8
7.6 7.6
8.2 8.1
8.0
7.9 7.9
7.7 7.7
7.8 7.8 7.8 7.8
7.9
Source: Statistical Abstract of Israel 2013-No.64, Central Bureau of Statistics, Israel. Table 6.1

2011: National Expenditure on Health ($) - Expenditure per capita, PPP
United St
ates
Norway
Switz
erlan
d
Netherl
ands
Luxe
mbourg
Austria
Canad
a
Denmark
German
y
France
Belgium
Swed
en
Australi
a
Irelan
d
United Kingd
om
Finlan
d
Icelan
dJap
an
New Ze
aland
Spain Ita
ly
Portuga
l
Slove
nia
Greece
Korea
ISRAEL
Czech Rep
ublic
Slova
kia
Hungary
Chile
Poland
Estonia
Mexico
Turke
y$0
$1,000
$2,000
$3,000
$4,000
$5,000
$6,000
$7,000
$8,000
$9,000
$2,183
Source: Statistical Abstract of Israel 2013-No.64, Central Bureau of Statistics, Israel. Table 28.2

Israel: National Expenditure on Healthby Operating Sector and Financing Sector
19901991
19921993
19941995
19961997
19981999
20002001
20022003
20042005
20062007
20082009
20102011
2012
0.0%
20.0%
40.0%
60.0%
80.0%
100.0%
120.0%
20.5
%
19.5
%
21.5
%
20.0
%
27.3
%
22.0
%
22.9
% 39.7
%
39.7
%
38.8
%
36.7
%
37.1
%
38.2
%
37.7
%
37.0
%
36.1
%
35.6
%
33.8
%
34.1
%
35.5
%
35.5
%
34.5
%
34.6
%
26.0
%
25.9
%
24.3
%
24.0
% 22.5
% 44.4
%
45.3
% 26.2
%
24.2
%
25.1
%
25.2
%
25.1
%
25.2
%
25.1
%
25.3
%
25.0
%
25.3
%
25.4
%
25.8
%
25.1
%
25.6
%
25.5
%
24.5
%
46.9
%
49.0
%
51.0
%
51.2
%
45.7
%
31.4
%
30.0
%
31.9
%
33.9
%
33.4
%
35.9
%
35.9
%
34.4
%
35.3
%
34.3
%
36.9
%
37.1
%
38.9
%
38.2
%
37.9
%
37.3
%
38.4
%
39.2
%
6.6%
5.6% 3.2%
4.8%
4.5% 2.2% 2.6%
2.2%
2.2%
2.7%
2.2%
1.9%
2.1%
1.9%
2.2% 2.0%
2.1%
1.8%
1.9%
1.5%
1.6%
1.6%
1.7%
DONATION FROM ABROAD Private financing Total Tax Public financing
Source: Statistical Abstract of Israel 2013-No.64, Central Bureau of Statistics, Israel. Table 6.3

2011 Health Expenditure, Public and Private (% of total health expenditure)
Netherl
ands
Norway
Denmark
Czech Rep
ublic
United Kingd
om
Swed
en
Romania
Japan Ita
ly
France
Belgium
German
y
Austria
Turke
y
Finlan
d
Australi
a
Switz
erlan
d
Hungary
Portuga
lIsr
ael
Greece
United St
ates
0%
20%
40%
60%
80%
100%
120%
86%
86%
85%
84%
83%
81%
80%
80%
77%
77%
76%
76%
76%
75%
75%
69%
65%
65%
64%
62%
61%
46%
14%
14%
15%
16%
17%
19%
20%
20%
23%
23%
24%
24%
24%
25%
25%
31%
35%
35%
36%
38%
39%
54%
Private Health Expenditure 2011 Public Health Expenditure 2011
Source: http://data.worldbank.org/indicator/SH.XPD.PUBL

2011 Life Expectancy at Birth, Female (years)
Hong Kong S
AR, China
San M
arino
Japan
Spain
France
Switz
erlan
d
Faero
e Isla
ndsIta
ly
Korea, R
ep.
Singa
pore
Euro
area
Australi
a
Icelan
d
Portuga
l
Austria
Malta
Finlan
d
Swed
enIsr
ael
Luxe
mbourg
Norway
Macao SA
R, China
Slove
nia
Canad
a
Belgium
German
y
High in
come:
OECDGree
ce
Netherl
ands
Euro
pean Union
Puerto Rico
Irelan
d
New Ze
aland
United Kingd
om80
81
82
83
84
85
86
87
88
Source :://http. . / / . . 00. .data worldbank org indicator SP DYN LE FE IN
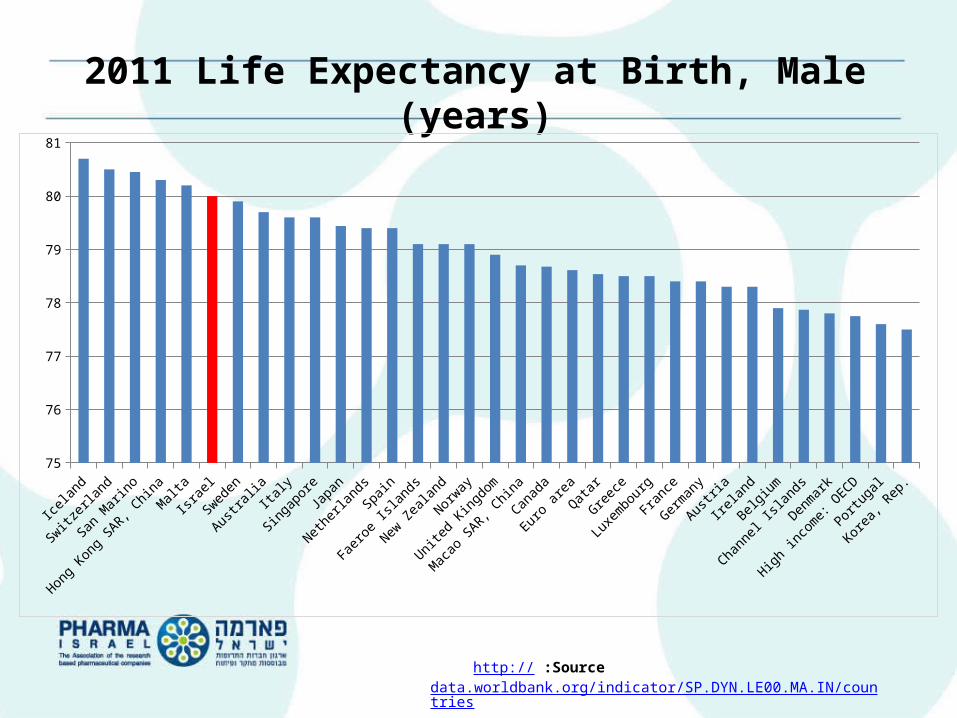
2011 Life Expectancy at Birth, Male (years)
Icelan
d
Switz
erlan
d
San M
arino
Hong Kong S
AR, China
Malta
Israe
l
Swed
en
Australi
aIta
ly
Singa
poreJap
an
Netherl
ands
Spain
Faero
e Isla
nds
New Ze
aland
Norway
United Kingd
om
Macao SA
R, China
Canad
a
Euro
area
Qatar
Greece
Luxe
mbourg
France
German
y
Austria
Irelan
d
Belgium
Channel
Islands
Denmark
High in
come:
OECD
Portuga
l
Korea, R
ep.
75
76
77
78
79
80
81
Source :://http. . / / . . 00. . /data worldbank org indicator SP DYN LE MA IN countries

2011: Practicing Physicians (doctors)density per 1000 population
Austria
Italy
Spain
German
y
Switz
erlan
d
Norway
Czech Rep
ublic
Icelan
d
Australi
a
Estonia
Israe
l (1)
France
Hungary
Luxe
mbourg
Belgium
United Kingd
omIre
land
New Ze
aland
Slove
nia
United St
ates
0.0
1.0
2.0
3.0
4.0
5.0
6.0
4.8
4.1 4.13.8 3.8 3.7 3.6
3.53.3 3.3 3.3
3.1 3.0 3.0 2.9 2.82.7 2.6
2.5 2.5
OECD (2013), "Practising physicians (doctors)", Health: Key Tables from OECD, No. 29.

Israel: Immunization Coverage of Two-Year-Olds (%, 2005-2010)
Var HAV 1 MMR 1 (1)IPV 3 OPV 3 DTP 4 Hib 4 HBV 30
10
20
30
40
50
60
70
80
90
100
200520062007200820092010
Source: Statistical Abstract of Israel 2013-No.64, Central Bureau of Statistics, Israel. Table 6.12

2010-2012 Israel: Bed Occupancy, By Departmentrates per 1,000 residents
Inter
nal med
icine
Pulm
onary m
edicin
e
Acu
te ge
riatri
cs
Neu
rology
Onco
logy
Ven
ereal
and derm
atology
Bone m
arrow tr
ansp
lants
Gen
eral in
tensiv
e care
Card
iac in
tensiv
e care
Resp
iratory
intensiv
e care
Ped
iatric
s
Ped
iatric
inten
sive c
are
Neo
natology
Ped
iatric
surge
ry
Gen
eral su
rgery
Orth
opedics
Uro
logy
Neu
rosu
rgery
Card
iothoracic s
urgery
Vasc
ular su
rgery
Plas
tic surge
ry
Ophthalm
ology
Ea
r, nose,
thro
at
Oral
surge
ry
Gyn
aeco
logy
Obste
trics
Obser
vation w
ard
Psychiat
ric ca
re0%
10%
20%
30%
40%
50%
60%
2012 2011 2010

Israel: Segmentation of Sick Funds Expenses 2011-2012
26.1%
42.3%
20.9%
6.2%3.7%0.0%
0.9% 26.0%
41.8%
20.6%
6.6%3.9%-0.2%
1.2%
Wages Hospitalization Drugs and medical devices Paid medical treatment Administration FinancingDevelopment
2012
2011

Sick Funds' Pharmaceutical Expenditure(Included and excluded in Health Basket) Millions NIS
2005 2006 2007 2008 2009 2010 2011 2012 ₪ -
₪ 500
₪ 1,000
₪ 1,500
₪ 2,000
₪ 2,500
₪ 3,000
₪ 3,500
₪ 4,000
₪ 4,500
₪ 5,000
₪ 3,582 ₪ 3,747 ₪ 3,809
₪ 3,482 ₪ 3,652
₪ 3,790
₪ 4,045 ₪ 4,197
₪ 1,257 ₪ 1,299
₪ 1,590 ₪ 1,608 ₪ 1,729 ₪ 1,746 ₪ 1,814
₪ 2,048
₪ 526 ₪ 579 ₪ 602 ₪ 555 ₪ 549 ₪ 603 ₪ 610 ₪ 664 ₪ 680 ₪ 721 ₪ 786 ₪ 716 ₪ 737 ₪ 738 ₪ 823 ₪ 905
כללית מכבי לאומית מאוחדת
החולים 2012 מקור: קופות פעילות על מסכם . דוח ספטמבר, הבריאות 2013משרד

Total Expense per Drugs & Medical Devices (included/excluded in HB)Million NIS) )
2012 2011 2010 2009 20080
1000
2000
3000
4000
5000
6000
7000
3288 3032 3325 3122 2874
15721341
14811430
1285
538
483
604576
550
734
680
670681
614
Total Meuhedet Leumit Maccabi
החולים 2012 מקור: קופות פעילות על מסכם . דוח ספטמבר, הבריאות 2013משרד

2011 Pharmaceutical Expenditure per capita (US $ / at current prices and PPPs)
United St
ates
Canad
a
Greece
Irelan
dFra
nce
German
y
Belgium
Hungary
Spain
Austria
Switz
erlan
d
Slova
k Rep
ublic
Icelan
dIta
ly
Netherl
ands
Swed
en
Slove
nia
Portuga
l
Finlan
dKorea
Czech Rep
ublic
Norway
Poland
New Ze
aland
Estonia
Chile$0
$200
$400
$600
$800
$1,000
$1,20099
5.0
751.
5
673.
4
647.
7
641.
1
632.
6
630.
9
564.
0
535.
8
533.
1
530.
7
525.
0
508.
3
487.
3
479.
3
474.
0
471.
3
469.
0
446.
2
444.
9
394.
2
387.
7
326.
3
298.
0
279.
8
197.
4
Source: Key tables from OECD - ISSN 2075-8480 - © OECD 2013

Sick Funds Expenses/Income for/from Drugs & Medical Devices
2009 Clalit
2009 Leumit
2009 Macc
abi
2009 Meu
hedet
2010 Clalit
2010 Leumit
2010 Macc
abi
2010 Meu
hedet
2011 Clalit
2011 Leumit
2011 Macc
abi
2011 Meu
hedet
2012 Clalit
2012 Leumit
2012 Macc
abi
2012 Meu
hedet
0
500
1000
1500
2000
2500
3000
3500
4000
4500
3,424
644
1,621
718
3,650
676
1,682
711
3,980
711
1,785
810
4,197
664
2,048
905
Expenses Income
החולים מקור: קופות פעילות על מסכם משרד. 2012, 2011, 2010, 2009דוחהבריאות.

Gap Between Sick Funds’ Expenses/Income for/from Copayment for Drugs and Medical Devices (million NIS)
2009201020112012
-6000
-5000
-4000
-3000
-2000
-1000
0
-1,978-2,131-2,448-2,613
-1,113-1,141
-1,232
-1,448 -447-456
-551
-636
-397-430
-471
-509
LeumitMeuhedetMaccabiClalit
החולים מקור: קופות פעילות על מסכם משרד. 2012, 2011, 2010, 2009דוחהבריאות.

New Technology Addition and Health Basket Cost - Year, Million NIS
הסל להרחבת הוועדה נתוני על ישראל פארמה עיבוד
2004 2005 2006 2007 2008 2009 2010 2011 2012 *2013 ₪ -
₪ 5,000
₪ 10,000
₪ 15,000
₪ 20,000
₪ 25,000
₪ 30,000
₪ 35,000
₪ 40,000
₪ 22,007 ₪ 22,768 ₪ 24,041 ₪ 24,946
₪ 26,583 ₪ 28,142
₪ 30,333 ₪ 32,593
₪ 34,708 ₪ 36,964
₪ 60 ₪ 388 ₪ 467 ₪ 237 ₪ 450 ₪ 416 ₪ 350 ₪ 300 ₪ 300 ₪ 300
New Technology Addition and Health Basket Cost - Year, Million NIS
Health Basket Millions NIS Technology addition

New Technology Addition as a % of the Health Basket
הסל להרחבת הוועדה נתוני על ישראל פארמה עיבוד
2004 2006 2007 2008 2009 2010 2011 2012 20130.00%
0.50%
1.00%
1.50%
2.00%
2.50%
0.27%
1.71%
1.94%
0.95%
1.69%
1.48%
1.15%
0.92% 0.86%

Additional Technology : Budget & Patients 2001-2013
עיבוד להרחבתהסל פארמה הוועדה נתוני על ישראל
2004 2005 2006 2007 2008 2009 2010 2011 2012 2013 ₪ -
₪ 50
₪ 100
₪ 150
₪ 200
₪ 250
₪ 300
₪ 350
₪ 400
₪ 450
₪ 500
0
50,000
100,000
150,000
200,000
250,000
300,000
350,000
400,000
₪ 60
₪ 388
₪ 458
₪ 237
₪ 450 ₪ 416
₪ 350
₪ 300 ₪ 300 ₪ 300
422
122,437
89,738
57,061159,685
340,110
68,277
232,318
30,349
297,249
Technology addition (million nis) # of patients (estimate)

Additional Technology : Budget & Number of Technologies
הסל להרחבת הוועדה נתוני על ישראל פארמה עיבוד
2004 2006 2007 2008 2009 2010 2011 2012 20130
100
200
300
400
500
600
0
20
40
60
80
100
120
140
160
180
200
60
355
509
450
401
350
300 300 300
5
4331
84
75 66
4049
50
Technology addition (million nis) Number of technologies

Segmentation of the Additional Technology 2004-2013 by Medical DomainMillion NIS% /
הסל להרחבת הוועדה נתוני על ישראל פארמה עיבוד
1097.1802939; 34%
352.9795; 11%
212.27916386; 7%198.511521; 6%
189.62392625; 6%
172.572; 5%
105.248279; 3%
87.51745088; 3%
72.263; 2%
68.9260775; 2%
67.32584; 2%
63.133; 2%
55.951; 2%49.9578; 2%
399.57095466; 13%
Oncology אונקולוגיה
דם וכלי Cardiovascular לב
Endocrinology אנדוקרינולוגיה
Neurology נוירולוגיה
זיהומיות Infectious diseases מחלות
Hematoncology המטואונקולוגיה
Lung ריאות
Gastro anthology גסטרואנטרולוגיה
Nephrology נפרולוגיה
ומין Skin עור
Psychiatry פסיכיאטריה
וראומטולוגיה Bone and Rheumatology עצמות
Pain כאב
Genetics גנטיקה
Other אחר

Additional Technology Between the Years 2004-2013 by Medical Domain- Estimated Number of Patients
הסל להרחבת הוועדה נתוני על ישראל פארמה עיבוד
Cardiova
scular
Infectious d
isease
s
Geneti
csLu
ng
Endocri
nologySk
in Pain
Neuro
logy
Psychiat
ry
Oncology
Bone and Rheu
matology
Gastro
anthology
Nephro
logy
Hemato
ncology
-
50,000
100,000
150,000
200,000
250,000
199,750
178,696
149,002
96,49389,238
53,080 51,020
34,653 32,850 31,026
6,835 6,011 5,858 2,161

Erosion of the Technological Addition to the Health Basket 2001-2013
2001 2002 2003 2004 2005 2006 2007 2008 2009 2010 2011 2012 20130
50
100
150
200
250
300
350
400
450
500
0.65
0.75
0.85
0.95
1.05
1.15
1.25
1.35
199
129
60.4
7
388.
4 458.
1
237.
3
450
416.
1
350
300
300.
1
299.
6
199
129
60
388
458
237
450
416
350
279 30
0
246
199
128
56
363
422
214
404
357
291
225
235
189
199
124
52
330 37
7
187
346
300
240
182
185
146
תקציב - הטכנולוגית התוספת) ( ₪ מיליוני (**)בפועל
נטו טכנולוגית תוספת
מחירים עליית בגין שחיקה) לצרכן) מחירים מדד
דמוגרפי גידול בגין שחיקה) מתוקננות) נפשות
המחירים מדד
) אחוזים ) אכלוסייה גידול
ישראל, מקור: פארמה עיבוד