
Table 3B.1: Capacity Assessment for Agat-Santa Rita STPguamwaterworks.org/Adobe...
32
Appendix 3B: Capacity Assessment Calculation Sheets October 2006 Final WRMP 1 Table 3B.1: Capacity Assessment for Agat-Santa Rita STP Description Capacity assessment calculations Compared with original design (f) Unit General Assume: System is not restricted by air requirement Operating depth(a) 14 N/A (h) ft Total volume(a) (See additional calculations for details) 65,753.5 N/A ft³ 491,870.0 N/A gal Aerobic digestion zone Arc angle 158.7 N/A º Volume 28,986.3 24,600.0 ft³ 216,817.8 184,008.0 gal Assume: Hydraulic detention time (b - page 837) (Design range = 12-18 day) 17.0 N/A d Available maximum incoming flow 12,754.0 N/A gpd Select waste sludge flow rate/influent flow rate 0.017 N/A Available process capacity of aerobic digester 750,234.5 N/A gpd Contact aeration basin Arc angle 36.7 N/A º Volume 6,703.2 14,300.0 ft³ 50,143.4 106,964.0 gal Assume: Hydraulic detention time(b - page 550) (Design range = 0.1 - 1.0 hours) 0.9 1.7 hours Available process capacity of contact aeration basin 1,337,157.7 755,040.0 gpd Reaeration basin Arc angle 145.7 N/A º Volume 26,611.9 28,500.0 ft³ 199,070.7 213,180.0 gal Assume : Hydraulic detention time(b - page 550) (Design range = 3-6 hours) 5 6.8 hours Available process capacity of reaeration basin 955,539.4 752,400.0 gpd Contact aeration + reaeration design (c) Assume: MLSS in contact aeration tank(b - page 550) (Design range = 1,000 - 3,000 mg/L) 2,500.0 N/A mg/L Assume: MLSS in reaeration tank(b - page 550) (Design range = 4,000-9,000 mg/L) 6,000.0 N/A mg/L Microorganism concentration in clarifier effluent (d) 20.0 N/A mg/L Clarifier flow rate/Influent flow rate 0.983 N/A Waste sludge rate/Influent flow rate 0.017 N/A Select microorganism concentration of waste sludge 11,000.0 N/A mg/L Assume: Solid retention time (SRT) (b - page 550) (Design range = 5-15 days) 7.0 N/A D Available process capacity of combined aeration and reaeration tanks 912,321.7 N/A gpd
Transcript of Table 3B.1: Capacity Assessment for Agat-Santa Rita STPguamwaterworks.org/Adobe...

Appendix 3B: Capacity Assessment Calculation Sheets
October 2006 Final WRMP 1
Table 3B.1: Capacity Assessment for Agat-Santa Rita STP
Description Capacity
assessment calculations
Compared with
original design (f)
Unit
General Assume: System is not restricted by air requirement Operating depth(a) 14 N/A(h) ft Total volume(a) (See additional calculations for details) 65,753.5 N/A ft³ 491,870.0 N/A gal Aerobic digestion zone Arc angle 158.7 N/A º Volume 28,986.3 24,600.0 ft³ 216,817.8 184,008.0 gal Assume: Hydraulic detention time (b - page 837) (Design range = 12-18 day) 17.0 N/A d Available maximum incoming flow 12,754.0 N/A gpd Select waste sludge flow rate/influent flow rate 0.017 N/A Available process capacity of aerobic digester 750,234.5 N/A gpd Contact aeration basin Arc angle 36.7 N/A º Volume 6,703.2 14,300.0 ft³ 50,143.4 106,964.0 gal
Assume: Hydraulic detention time(b - page 550) (Design range = 0.1 - 1.0 hours) 0.9 1.7 hours Available process capacity of contact aeration basin 1,337,157.7 755,040.0 gpd Reaeration basin Arc angle 145.7 N/A º Volume 26,611.9 28,500.0 ft³ 199,070.7 213,180.0 gal
Assume : Hydraulic detention time(b - page 550) (Design range = 3-6 hours) 5 6.8 hours Available process capacity of reaeration basin 955,539.4 752,400.0 gpd Contact aeration + reaeration design (c) Assume: MLSS in contact aeration tank(b - page 550) (Design range = 1,000 - 3,000 mg/L) 2,500.0 N/A mg/L
Assume: MLSS in reaeration tank(b - page 550) (Design range = 4,000-9,000 mg/L) 6,000.0 N/A mg/L Microorganism concentration in clarifier effluent (d) 20.0 N/A mg/L Clarifier flow rate/Influent flow rate 0.983 N/A Waste sludge rate/Influent flow rate 0.017 N/A Select microorganism concentration of waste sludge 11,000.0 N/A mg/L
Assume: Solid retention time (SRT) (b - page 550) (Design range = 5-15 days) 7.0 N/A D Available process capacity of combined aeration and reaeration tanks 912,321.7 N/A gpd

Appendix 3B: Capacity Assessment Calculation Sheets
2 October 2006 Final WRMP 2
Description Capacity
assessment calculations
Compared with
original design (f)
Unit
Check return activated sludge flow rate (b - page 550) Approach - Mass balance around contact aeration and reaeration tanks Microorganism concentration in raw water influent (d) 0.0 N/A mg/L Return activated sludge flow rate/influent flow rate 0.29 N/A Secondary Clarifier Arc angle 360.0 N/A º Diameter 40.0 N/A ft Operating depth 10.7 N/A ft Volume 13,489.1 13,250.0 ft³ Assume: Available overflow surface area (e) 1,203.0 N/A ft²
Assume: Overflow rate (b - page 588) (Design range = 400-1,200 gpd/ft²) 600.0 565.0 gpd/ft² Available process capacity of secondary clarifier 721,800.0 743,377.0 gpd Sludge drying bed Total unit = 8 Operating width (each unit) 22.5 N/A ft Operating Length (each unit) 90.0 N/A ft Total approximated area (g) 15,945.0 16,300.0 ft² Approach 1: Area per person Assume: Required area of sludge drying beds for one person (b - page 873) (Design range = 1.75-2.50 ft²/person) 2.2 N/A
ft²/ person
Maximum number of people generating wastewater that sludge drying beds can handle 7,248 8,500 persons Assume: Wastewater flow rate per person (b - page 27) (Design range = 60 - 100 gpd per person for better home) 80.0 N/A
gpd/ person
Available maximum flow capacity 579,818.0 N/A gpd Approach 2: Sludge-loading rate
Assume: Sludge-loading rate (b - 873) (Design range = 12-20 lb dry solids/ft².yr) 14.0 N/A
lb dry solids/ ft².yr
Total approximated area (g) 15,945.0 16,300.0 ft²
Maximum sludge that can be wasted 223,230.0 N/A
lb dry solids/ yr
Maximum sludge that can be wasted 612.0 N/A
lb dry solids/ day
Find digested suspended solid concentration (b - page 838) From aerobic digester design, Incoming sludge to aerobic digestion 12,754.0 N/A gpd 1,705.0 N/A ft³/d Influent suspended solids from secondary clarifier to aerobic digester 11,000.0 N/A mg/L Reaction-rate constant (kd) 0.07 N/A d-1
Appendix 3B: Capacity Assessment Calculation Sheets
October 2006 Final WRMP 3
Description Capacity
assessment calculations
Compared with
original design (f)
Unit
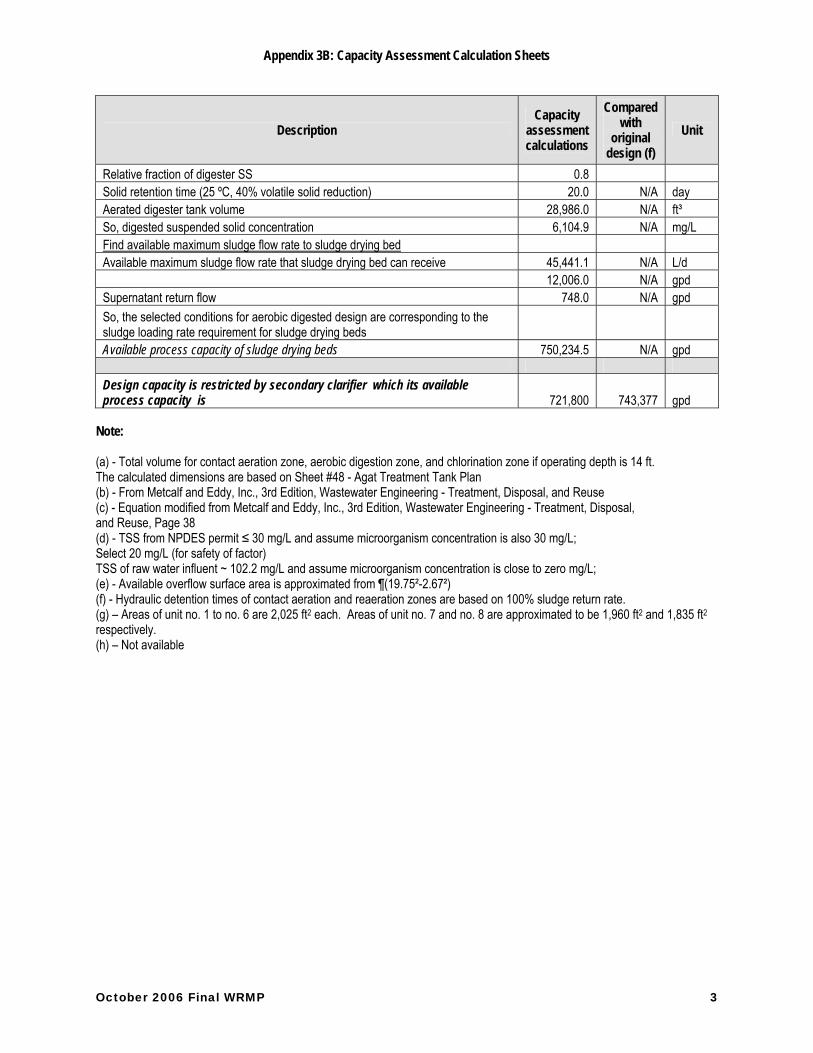
Relative fraction of digester SS 0.8 Solid retention time (25 ºC, 40% volatile solid reduction) 20.0 N/A day Aerated digester tank volume 28,986.0 N/A ft³ So, digested suspended solid concentration 6,104.9 N/A mg/L Find available maximum sludge flow rate to sludge drying bed Available maximum sludge flow rate that sludge drying bed can receive 45,441.1 N/A L/d 12,006.0 N/A gpd Supernatant return flow 748.0 N/A gpd So, the selected conditions for aerobic digested design are corresponding to the sludge loading rate requirement for sludge drying beds Available process capacity of sludge drying beds 750,234.5 N/A gpd Design capacity is restricted by secondary clarifier which its available process capacity is 721,800 743,377 gpd
Note: (a) - Total volume for contact aeration zone, aerobic digestion zone, and chlorination zone if operating depth is 14 ft. The calculated dimensions are based on Sheet #48 - Agat Treatment Tank Plan (b) - From Metcalf and Eddy, Inc., 3rd Edition, Wastewater Engineering - Treatment, Disposal, and Reuse (c) - Equation modified from Metcalf and Eddy, Inc., 3rd Edition, Wastewater Engineering - Treatment, Disposal, and Reuse, Page 38 (d) - TSS from NPDES permit ≤ 30 mg/L and assume microorganism concentration is also 30 mg/L; Select 20 mg/L (for safety of factor) TSS of raw water influent ~ 102.2 mg/L and assume microorganism concentration is close to zero mg/L; (e) - Available overflow surface area is approximated from ¶(19.75²-2.67²) (f) - Hydraulic detention times of contact aeration and reaeration zones are based on 100% sludge return rate. (g) – Areas of unit no. 1 to no. 6 are 2,025 ft2 each. Areas of unit no. 7 and no. 8 are approximated to be 1,960 ft2 and 1,835 ft2 respectively. (h) – Not available

Appendix 3B: Capacity Assessment Calculation Sheets
4 October 2006 Final WRMP 4
Agat-Santa Rita STP - Capacity Assessment
0.75
0.75
0.72
0.91
0.96
1.34
0.0
0.1
0.2
0.3
0.4
0.5
0.6
0.7
0.8
0.9
1.0
1.1
1.2
1.3
1.4
1.5
1.6
1.7
1.8
1.9
2.0
Sludge dry ing beds
Aerobic digestion tank
Secondary clarifier
Contact aeration + reaeration tanks
Reaeration tank
Contact aeration tank
Unit
proc
esse
s
Flow rate (MGD)
Design Capacity from 2004 CPE Report - 0.75
Sludge loading rate
HRT
Overflow rate
SRT
HRT
HRT
The bar chart above compares the design capacity from the 2004 CPE report versus the calculated capacities.
Description of Assessment
Agat-Santa Rita STP is a package system providing secondary wastewater treatment. For the calculation, the simplified flow diagram is drawn below:
Note: Q = Influent flow rate (MGD)
Appendix 3B: Capacity Assessment Calculation Sheets
October 2006 Final WRMP 5
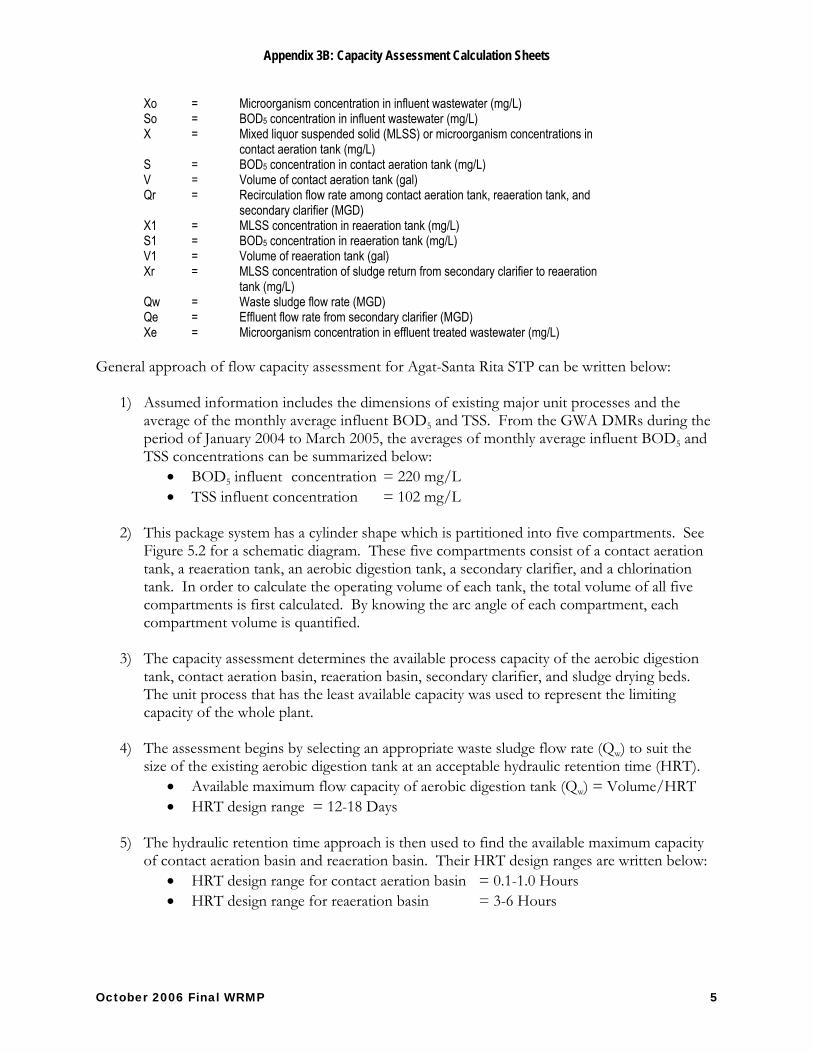
Xo = Microorganism concentration in influent wastewater (mg/L) So = BOD5 concentration in influent wastewater (mg/L)
X = Mixed liquor suspended solid (MLSS) or microorganism concentrations in contact aeration tank (mg/L)
S = BOD5 concentration in contact aeration tank (mg/L) V = Volume of contact aeration tank (gal)
Qr = Recirculation flow rate among contact aeration tank, reaeration tank, and secondary clarifier (MGD)
X1 = MLSS concentration in reaeration tank (mg/L) S1 = BOD5 concentration in reaeration tank (mg/L) V1 = Volume of reaeration tank (gal)
Xr = MLSS concentration of sludge return from secondary clarifier to reaeration tank (mg/L)
Qw = Waste sludge flow rate (MGD) Qe = Effluent flow rate from secondary clarifier (MGD) Xe = Microorganism concentration in effluent treated wastewater (mg/L) General approach of flow capacity assessment for Agat-Santa Rita STP can be written below:
1) Assumed information includes the dimensions of existing major unit processes and the average of the monthly average influent BOD5 and TSS. From the GWA DMRs during the period of January 2004 to March 2005, the averages of monthly average influent BOD5 and TSS concentrations can be summarized below:
• BOD5 influent concentration = 220 mg/L • TSS influent concentration = 102 mg/L
2) This package system has a cylinder shape which is partitioned into five compartments. See
Figure 5.2 for a schematic diagram. These five compartments consist of a contact aeration tank, a reaeration tank, an aerobic digestion tank, a secondary clarifier, and a chlorination tank. In order to calculate the operating volume of each tank, the total volume of all five compartments is first calculated. By knowing the arc angle of each compartment, each compartment volume is quantified.
3) The capacity assessment determines the available process capacity of the aerobic digestion
tank, contact aeration basin, reaeration basin, secondary clarifier, and sludge drying beds. The unit process that has the least available capacity was used to represent the limiting capacity of the whole plant.
4) The assessment begins by selecting an appropriate waste sludge flow rate (Qw) to suit the
size of the existing aerobic digestion tank at an acceptable hydraulic retention time (HRT). • Available maximum flow capacity of aerobic digestion tank (Qw) = Volume/HRT • HRT design range = 12-18 Days
5) The hydraulic retention time approach is then used to find the available maximum capacity
of contact aeration basin and reaeration basin. Their HRT design ranges are written below: • HRT design range for contact aeration basin = 0.1-1.0 Hours • HRT design range for reaeration basin = 3-6 Hours
Appendix 3B: Capacity Assessment Calculation Sheets
6 October 2006 Final WRMP 6
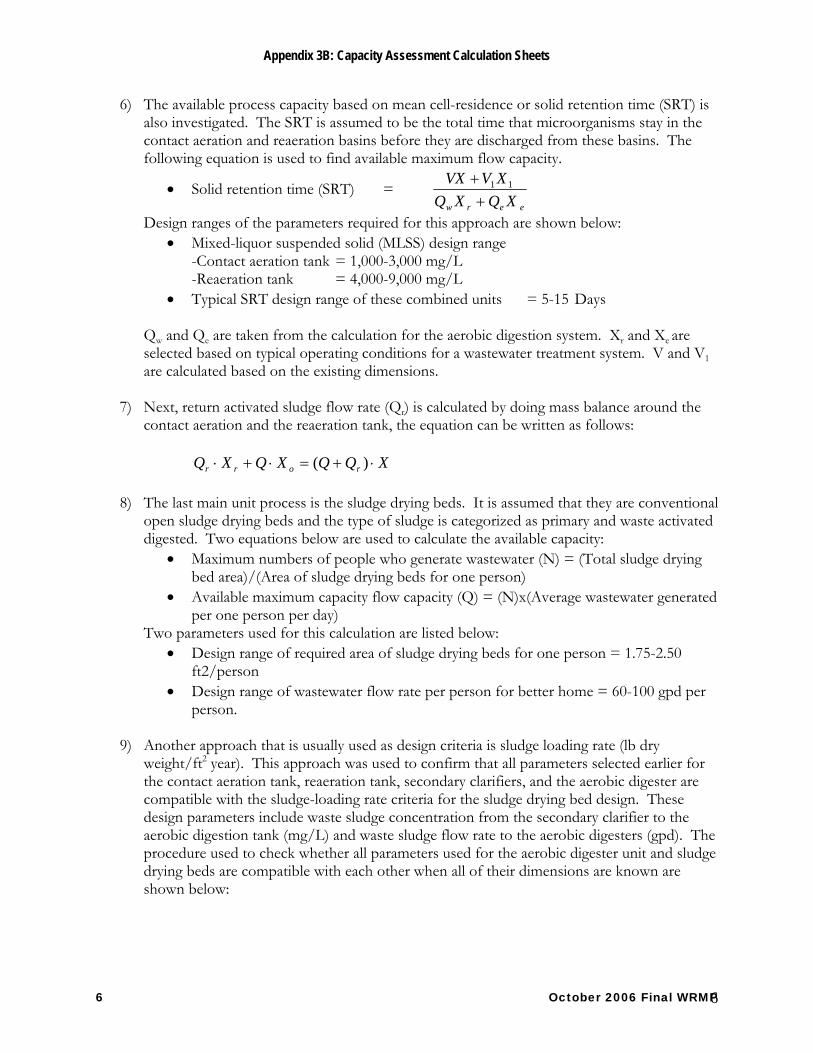
6) The available process capacity based on mean cell-residence or solid retention time (SRT) is also investigated. The SRT is assumed to be the total time that microorganisms stay in the contact aeration and reaeration basins before they are discharged from these basins. The following equation is used to find available maximum flow capacity.
• Solid retention time (SRT) = eerw XQXQ
XVVX++ 11
Design ranges of the parameters required for this approach are shown below: • Mixed-liquor suspended solid (MLSS) design range
-Contact aeration tank = 1,000-3,000 mg/L -Reaeration tank = 4,000-9,000 mg/L
• Typical SRT design range of these combined units = 5-15 Days Qw and Qe are taken from the calculation for the aerobic digestion system. Xr and Xe are selected based on typical operating conditions for a wastewater treatment system. V and V1 are calculated based on the existing dimensions.
7) Next, return activated sludge flow rate (Qr) is calculated by doing mass balance around the
contact aeration and the reaeration tank, the equation can be written as follows:
XQQXQXQ rorr ⋅+=⋅+⋅ )(
8) The last main unit process is the sludge drying beds. It is assumed that they are conventional open sludge drying beds and the type of sludge is categorized as primary and waste activated digested. Two equations below are used to calculate the available capacity:
• Maximum numbers of people who generate wastewater (N) = (Total sludge drying bed area)/(Area of sludge drying beds for one person)
• Available maximum capacity flow capacity (Q) = (N)x(Average wastewater generated per one person per day)
Two parameters used for this calculation are listed below: • Design range of required area of sludge drying beds for one person = 1.75-2.50
ft2/person • Design range of wastewater flow rate per person for better home = 60-100 gpd per
person.
9) Another approach that is usually used as design criteria is sludge loading rate (lb dry weight/ft2 year). This approach was used to confirm that all parameters selected earlier for the contact aeration tank, reaeration tank, secondary clarifiers, and the aerobic digester are compatible with the sludge-loading rate criteria for the sludge drying bed design. These design parameters include waste sludge concentration from the secondary clarifier to the aerobic digestion tank (mg/L) and waste sludge flow rate to the aerobic digesters (gpd). The procedure used to check whether all parameters used for the aerobic digester unit and sludge drying beds are compatible with each other when all of their dimensions are known are shown below:
Appendix 3B: Capacity Assessment Calculation Sheets
October 2006 Final WRMP 7
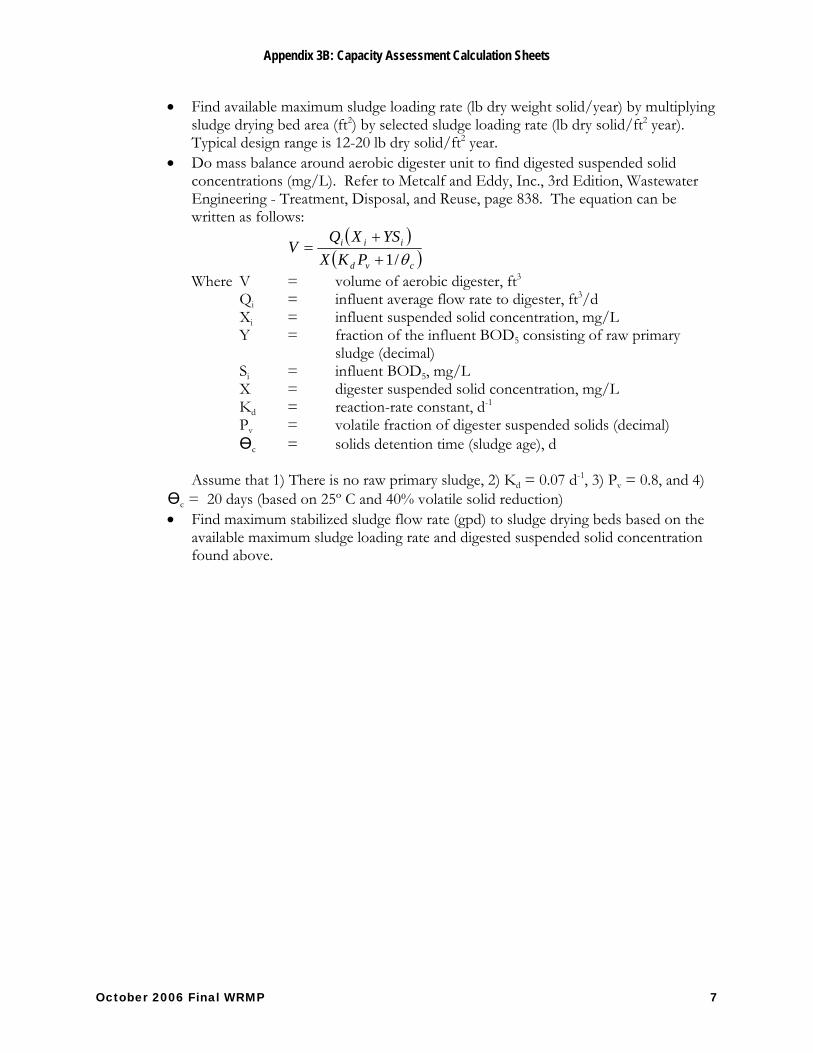
• Find available maximum sludge loading rate (lb dry weight solid/year) by multiplying sludge drying bed area (ft2) by selected sludge loading rate (lb dry solid/ft2 year). Typical design range is 12-20 lb dry solid/ft2 year.
• Do mass balance around aerobic digester unit to find digested suspended solid concentrations (mg/L). Refer to Metcalf and Eddy, Inc., 3rd Edition, Wastewater Engineering - Treatment, Disposal, and Reuse, page 838. The equation can be written as follows:
( )( )cvd
iii
PKXYSXQ
Vθ/1+
+=
Where V = volume of aerobic digester, ft3 Qi = influent average flow rate to digester, ft3/d Xi = influent suspended solid concentration, mg/L
Y = fraction of the influent BOD5 consisting of raw primary sludge (decimal)
Si = influent BOD5, mg/L X = digester suspended solid concentration, mg/L Kd = reaction-rate constant, d-1 Pv = volatile fraction of digester suspended solids (decimal) Өc = solids detention time (sludge age), d
Assume that 1) There is no raw primary sludge, 2) Kd = 0.07 d-1, 3) Pv = 0.8, and 4) Өc = 20 days (based on 25º C and 40% volatile solid reduction) • Find maximum stabilized sludge flow rate (gpd) to sludge drying beds based on the
available maximum sludge loading rate and digested suspended solid concentration found above.

Appendix 3B: Capacity Assessment Calculation Sheets
8 October 2006 Final WRMP 8
Table 3B.2: Capacity Assessment for Hagatna STP
Description Capacity
assessment calculations
Compared with other designs (g)
Unit
Primary clarifier -Type – Rectangular -Number – 3 -Length (each) 120.0 120.0 ft -Width (each) 34.0 34.0 ft -Side water depth 10.0 10.0 ft -Surface area (total) 12,240.0 12,240.0 ft² -Weir length (total) (b) 204.0 204.0 ft -Volume (total) 122,400.0 N/A(h) ft³ 915,552.0 915,613.0 gal Criteria 1: Surface overflow rates (SOR) Assume: Surface overflow rates (SOR) @ AADF (c - page 475) (Design range = 800-1,200 gpd/ft²) 900.0 980.0 gpd/ft² Available maximum capacity @ AADF 11.0 12.0 MGD Assume: Surface overflow rates (SOR) @ PHF (c - page 475) (Design range = 2,000-3,000 gpd/ft²) 2,000 1,716 gpd/ft² Available maximum capacity @ PHF 24.5 21.0 MGD Criteria 2: Hydraulic retention time (HRT) Assume: Hydraulic retention time (HRT) @ AADF (c - page 475) (Design range = 1.50-2.50 hours) 1.90 1.83 hours Available maximum capacity @ AADF 11.6 12.0 MGD Criteria 3: Weir overflow rate (WOR) Assume: Weir overflow rate @ AADF (c - page 475) (Design range = 10,000-40,000 gpd/ft) 38,000.0 58,824.0 gpd/ft Available maximum capacity @ AADF (d) 7.7 12.0 MGD Find: Primary sludge volume per Mgal Assume: Removal efficiency of suspended solid 0.6 N/A Average influent TSS (Data from Jan 04 to Mar 05) 94.0 N/A mg/L Dry solid (e) 471.0 N/A lb Assume: Specific gravity of sludge (c - page 485) 1.05 N/A Assume: Solid concentration (c - page 485) (Design range = 4-12%) 4.7 N/A % Primary sludge volume per Mgal (f) 1,145.0 N/A gal Aerobic digesters Assume: Oxygen requirement is not restricted. -Number - 4 -Type - Square -Length (each) 36.0 32.0 ft -Max. sludge water depth (SWD) 18.0 18.0 ft -Avg. working SWD 14.0 15.0 ft

Appendix 3B: Capacity Assessment Calculation Sheets
October 2006 Final WRMP 9
Description Capacity
assessment calculations
Compared with other designs (g)
Unit
Assume: 20% of volume occupied by settled grit -Active volume fraction 80.0 80.0 % -Active volume (total) 58,061.0 N/A ft³ 434,295.0 367,682.0 gal Assume: Hydraulic retention time (HRT) (c - page 837) (Design range = 15-20 days) 19.0 27.9 d Available max. capacity (primary sludge) 22,857.6 13,200.0 gpd Assume: Solid concentration = 4.7% Available max. capacity (raw wastewater) 20.0 N/A MGD Design capacity is restricted by primary clarifier system which its available maximum flow is 11.0 12.0 MGD
Note: (a) - Firm pump capacity with largest unit out of service (OOS) should equal or exceed PHF (EPA Class I reliability). (b) - Effluent weirs are on both side of the effluent trough. (c) - From Metcalf and Eddy, Inc., 3rd Edition, Wastewater Engineering - Treatment, Disposal, and Reuse (d) - Weir loading has little effect on the performance of primary clarifiers. Therefore it may be used larger than 40,000 gpd/ft. (e) - Dry solid = (removal efficiency of total suspended solid)(avg. inf. TSS)((8.34 lb/Mgal)(mg/L))(1.0 Mgal) (f) - Primary sludge volume per Mgal = (dry solid, lb)(100)/((specific gravity)(solid concentration, %)(62.4 lb/ft3)/(7.48 gal/ft3)) (g) - Compared with comprehensive performance evaluation of the Hagatna STP report prepared by Duenas & Associates, Inc. and Boyle Engineering Corporation (h) - Not available

Appendix 3B: Capacity Assessment Calculation Sheets
10 October 2006 Final WRMP 10
Hagatna STP - Capacity Assessment
0.0
20.0
11.0-1
.0 1.0
3.0
5.0
7.0
9.0
11.0
13.0
15.0
17.0
19.0
21.0
23.0
25.0
Centrifuges
Aerobic digesters
Primary clarifiers
Unit
proc
esse
s
Flow rate (MGD)
Design Capacity from 2002 CPE Report - 12 M GD
Hydraulic retention time
Surface overflow rate
0.0 (Not Operation)
The bar chart above represents the design capacity from the 2002 CPE report versus the calculated capacities.
Description of Assessment For the Hagatna STP, the unit operations selected for the process capacity assessment were three primary clarifiers and four aerobic digesters. Stabilized sludge from the sludge decant tank is not treated at this STP but it is currently sent to the Northern District STP for disposal. It is assumed that the pumping and blower systems function properly and do not restrict the capacity of treatment plant. The process unit that provides the least available capacity will be used to represent the design capacity of the whole plant. General steps of the capacity assessment are as follows:
1) Below are the averages of the monthly average influent BOD5 and TSS concentrations taken from the DMR during the period of January 2004 to March 2005.
• Average of monthly average influent BOD5 concentration = 209 mg/L • Average of monthly average influent TSS concentration = 93 mg/L
2) The primary clarifiers capacity is assessed based on three criteria including surface overflow
rates (SOR), hydraulic retention time (HRT), and weir overflow rate (WOR). In general, WOR has little effect on the design of primary clarifiers. Therefore, the calculated flow capacity based on WOR is used as supplementary information for design purposes. Below are the design ranges for the basic parameters of this primary clarifier designs.
• SOR design ranges =800-1,200 (average flow) gpd/ft2 =2,000-3,000 (peak flow) gpd/ft2

Appendix 3B: Capacity Assessment Calculation Sheets
October 2006 Final WRMP 11
• HRT design range =1.5-2.5 (average flow) Hours • WOR design range =10,000-40,000 (average flow) gpd/ft
3) Primary sludge volume per MGD of wastewater influent is determined next. This calculated
volume ratio of primary sludge and wastewater influent is used to assess the available capacity of the aerobic digesters. The following parameters and their design ranges were used for this assessment:
• Removal efficiency: No design range (65% removal efficiency is assumed.) • Average influent TSS concentration (mg/L) (The average of monthly average
influent TSS concentrations reported in the GWA DMRs during January 2004 to March 2005 were used.)
• Specific gravity of sludge: Typical design = 1.05 • Solid concentration: Design range = 4-12%
Dry solids were calculated by the equation written in note (f) above. The calculated value of dry solids is then used to calculate the primary sludge volume per MGD of wastewater influent.
4) Hydraulic retention time is used as a criteria to calculate the available maximum primary sludge flow rate that enters the four aerobic digesters. Then, the available capacity (in terms of influent wastewater flow) of the aerobic digesters can be calculated by using the ratio found in item 3).
Appendix 3B: Capacity Assessment Calculation Sheets
12 October 2006 Final WRMP 12
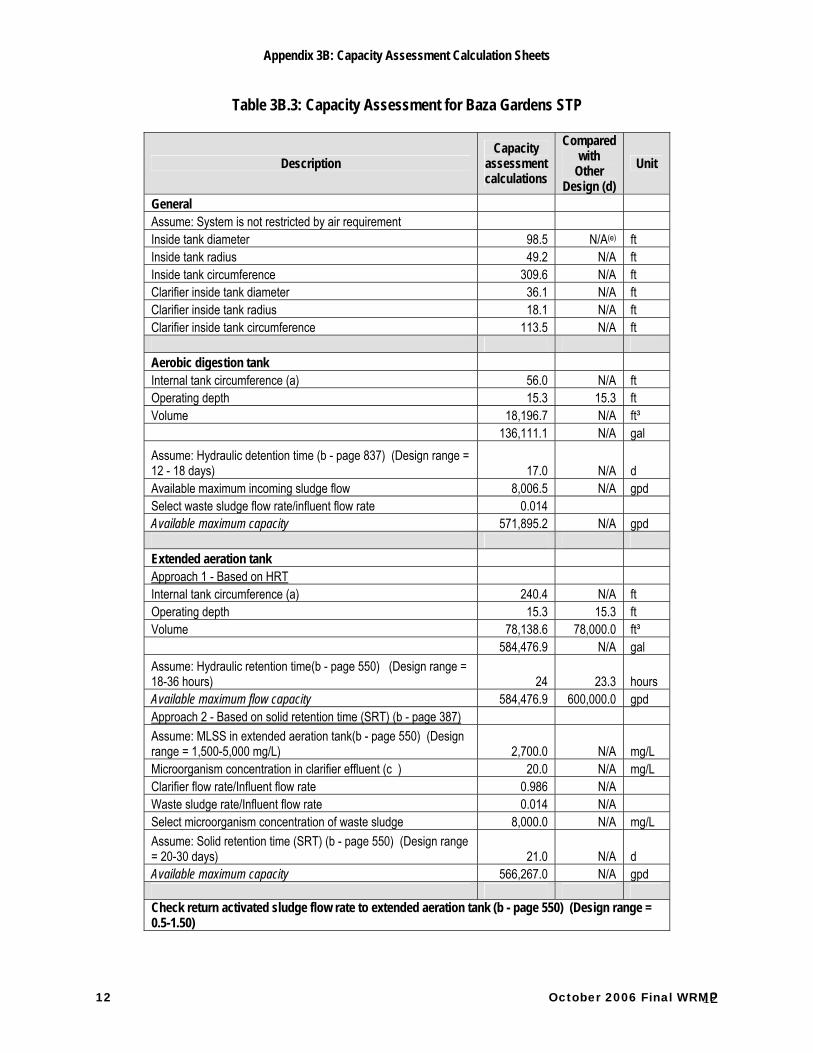
Table 3B.3: Capacity Assessment for Baza Gardens STP
Description Capacity
assessment calculations
Compared with
Other Design (d)
Unit
General Assume: System is not restricted by air requirement Inside tank diameter 98.5 N/A(e) ft Inside tank radius 49.2 N/A ft Inside tank circumference 309.6 N/A ft Clarifier inside tank diameter 36.1 N/A ft Clarifier inside tank radius 18.1 N/A ft Clarifier inside tank circumference 113.5 N/A ft Aerobic digestion tank Internal tank circumference (a) 56.0 N/A ft Operating depth 15.3 15.3 ft Volume 18,196.7 N/A ft³ 136,111.1 N/A gal Assume: Hydraulic detention time (b - page 837) (Design range = 12 - 18 days) 17.0 N/A d Available maximum incoming sludge flow 8,006.5 N/A gpd Select waste sludge flow rate/influent flow rate 0.014 Available maximum capacity 571,895.2 N/A gpd Extended aeration tank Approach 1 - Based on HRT Internal tank circumference (a) 240.4 N/A ft Operating depth 15.3 15.3 ft Volume 78,138.6 78,000.0 ft³ 584,476.9 N/A gal Assume: Hydraulic retention time(b - page 550) (Design range = 18-36 hours) 24 23.3 hours Available maximum flow capacity 584,476.9 600,000.0 gpd Approach 2 - Based on solid retention time (SRT) (b - page 387) Assume: MLSS in extended aeration tank(b - page 550) (Design range = 1,500-5,000 mg/L) 2,700.0 N/A mg/L Microorganism concentration in clarifier effluent (c ) 20.0 N/A mg/L Clarifier flow rate/Influent flow rate 0.986 N/A Waste sludge rate/Influent flow rate 0.014 N/A Select microorganism concentration of waste sludge 8,000.0 N/A mg/L Assume: Solid retention time (SRT) (b - page 550) (Design range = 20-30 days) 21.0 N/A d Available maximum capacity 566,267.0 N/A gpd Check return activated sludge flow rate to extended aeration tank (b - page 550) (Design range = 0.5-1.50)

Appendix 3B: Capacity Assessment Calculation Sheets
October 2006 Final WRMP 13
Description Capacity
assessment calculations
Compared with
Other Design (d)
Unit
Approach - Mass balance around extended aeration tank Microorganism concentration in raw water influent (c ) 0.00 N/A mg/L Return activated sludge flow rate/influent flow rate 0.51 N/A Secondary clarifier Feed Well Diameter 7.00 N/A ft Feed Well Radius 3.50 N/A ft Operating depth 15.3 15.3 ft Volume 15,049.8 15,600.0 ft³ 112,572.2 N/A gal Available overflow surface area 986.9 1,020.0 ft² Assume: Overflow rate (b - page 588) (Design range = 200-800 gpd/ft²) 600.0 600.0 gpd/ft² Available maximum capacity 592,121.6 600,000.0 gpd Design capacity is restricted by extended aeration tank which its available maximum capacity is 566,267 600,000 gpd
Note: (a) - There are 47 front spray header nozzles. Based on tank inner wall, distance (arc length) between nozzles is 6.584 ft. There are 36.5, 2, and 8.5 nozzles within extended aeration, chlorination contact, and aerobic sludge digestion zones respectively. (b) - Metcalf and Eddy, Inc., 3rd Edition, Wastewater Engineering - Treatment, Disposal, and Reuse (c) - TSS from NPDES permit ≤ 30 mg/L and assume microorganism concentration is also 30 mg/L; Select 20 mg/L (for safety factor). TSS of raw water influent ~ 104.7 mg/L and assume microorganism concentration is close to zero mg/L. (d) - Data from Winzler & Kelly Consulting Engineers (2004). Comprehensive Performance Evaluation Baza Gardens Wastewater Treatment Plant (e) - Not available
Appendix 3B: Capacity Assessment Calculation Sheets
14 October 2006 Final WRMP 14
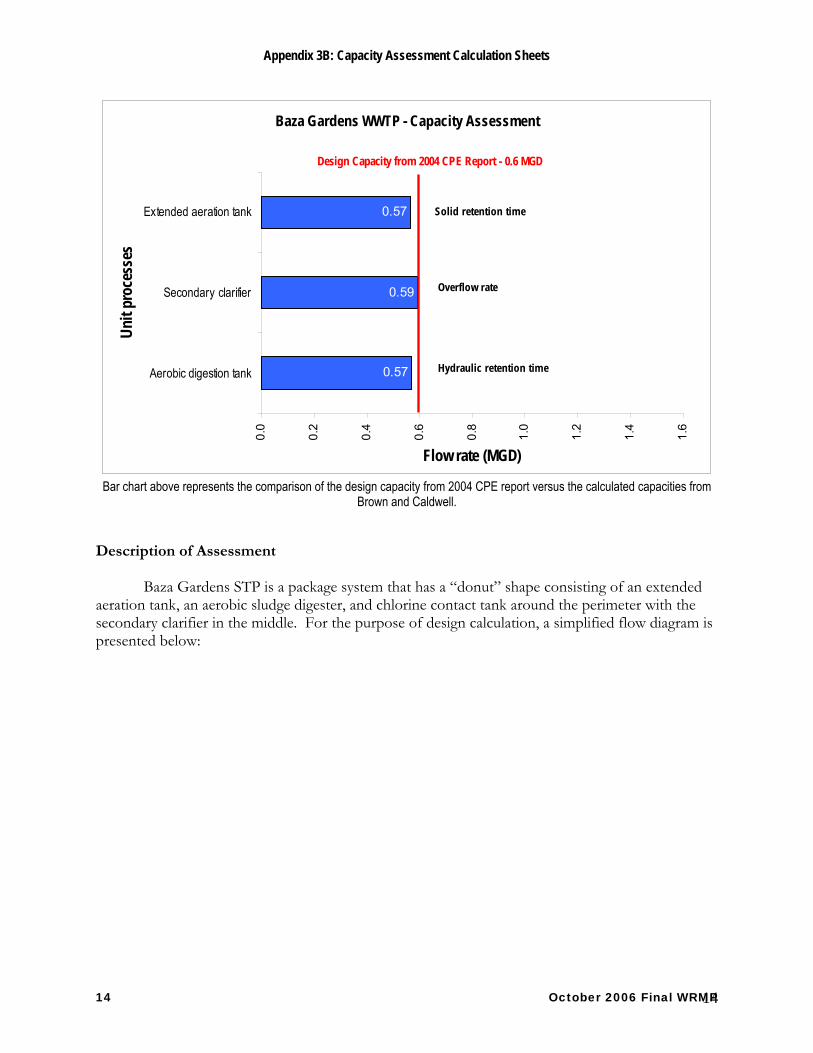
Baza Gardens WWTP - Capacity Assessment
0.57
0.59
0.57
0.0
0.2
0.4
0.6
0.8
1.0
1.2
1.4
1.6
Aerobic digestion tank
Secondary clarifier
Extended aeration tank
Unit
proc
esse
s
Flow rate (MGD)
Design Capacity from 2004 CPE Report - 0.6 MGD
Overflow rate
Hydraulic retention time
Solid retention time
Bar chart above represents the comparison of the design capacity from 2004 CPE report versus the calculated capacities from
Brown and Caldwell. Description of Assessment Baza Gardens STP is a package system that has a “donut” shape consisting of an extended aeration tank, an aerobic sludge digester, and chlorine contact tank around the perimeter with the secondary clarifier in the middle. For the purpose of design calculation, a simplified flow diagram is presented below:

Appendix 3B: Capacity Assessment Calculation Sheets
October 2006 Final WRMP 15
Note: Q = Influent flow rate (MGD) Xo = Microorganism concentration in influent wastewater (mg/L) So = BOD5 concentration in influent wastewater (mg/L)
X = Mixed liquor suspended solid (MLSS) or microorganism concentrations in extended aeration tank (mg/L)
S = BOD5 concentration in extended aeration tank (mg/L) V = Volume of extended aeration tank (gal)
Qr = Sludge return flow rate (MGD) Xr = MLSS concentration of sludge return from secondary clarifier to extended
aeration tank or to aerobic digestion tank (mg/L) Qw = Waste sludge flow rate (MGD) Qe = Effluent flow rate from secondary clarifier (MGD) Xe = Microorganism concentration in effluent (mg/L) Main unit processes selected for the capacity assessment include the extended aeration tank, aerobic digestion tank, and secondary clarifier. It is assumed that pumping and blower systems are working properly and do not restrict the capacity. Facility headworks including a bar screen, aerated grit chamber, and comminutor are assumed to function and do not restrict the treatment capacity. The unit operation that provides the least available capacity will represent the maximum available capacity of the whole plant. Below are steps to evaluate the available capacity for each unit operation.
1) Assumed information includes dimensions of the existing major unit processes and the average of the monthly average influent BOD5 and TSS. The averages of monthly average influent BOD5 and TSS concentrations were taken from GWA’s DMRs during the time period of January 2004 to March 2005:
• Average of monthly average influent BOD5 concentration = 187 mg/L • Average of monthly average influent TSS concentration = 105 mg/L
Tank volumes for each unit process can be found by using similar calculation methods applied for the Agat-Santa Rita STP assessment.

Appendix 3B: Capacity Assessment Calculation Sheets
16 October 2006 Final WRMP 16
2) The available capacity of the aerobic digestion tank is evaluated first by selecting a waste sludge flow rate appropriate for its size (volume). The assessment will be based on an appropriate hydraulic retention time, the design range is shown below:
• HRT design range for the aerobic digestion tank = 12-18 Days
3) Next, the capacity of the extended aeration tank is assessed based on two design criteria, HRT and SRT. Approach 1 – Based on HRT The following steps are used to calculate the capacity:
• HRT for an extended aeration tank is selected. (Design range is 18-36 hours.) • Available maximum capacity = Volume of extended aeration tank/HRT
Approach 2 - Based on SRT
SRT equation below:
eerw XQXQ
VXSRT+
=
When all other variables and parameters including tank volume, Qw/Q, Qe/Q, X, and SRT are known (or assumed), the available maximum flow capacity can be calculated. Below summarizes the design parameters used in this calculation:
• MLSS design range = 1,500-5,000 mg/L • SRT design range = 20-30 Days
The Qw/Q, and Qe/Q, values applied here correspond to the capacity assessment for the aerobic digestion system. The MLSS concentration, Xr is selected based on a typical operating range. In order to confirm that the above capacity assessment is properly performed, the return activated sludge ratio (Qr/Q) is calculated. This is to confirm whether this ratio is in the design range. A mass balance of microorganisms around the extended aeration tank is performed, based on the equation below:
))(())(())(( 0 XQQXQXQ rrr +=+
The design range of return activated sludge ratio for an extended aeration system is 0.5 to 1.5.
4) The next process unit to consider for the capacity assessment is the secondary clarifier. An
overflow rate design range of 200-800 gpd/ft2 is used as a criteria, in conjunction with the known existing surface area of the secondary clarifier, to determine the available maximum capacity for this process unit.

Appendix 3B: Capacity Assessment Calculation Sheets
October 2006 Final WRMP 17
Table 3B.4: Capacity Assessment for Umatac-Merizo STP
Description Capacity
assessment calculations
Compared with Other Design (c )
Unit
Aerated facultative lagoon Lagoon surface width 166.7 N/A(c) ft Lagoon surface length 300.0 N/A ft Lagoon Bottom width 80.6 N/A ft Lagoon bottom length 208.3 N/A ft Depth 15.0 N/A ft Slope 0.34 N/A ft Total volume (a) 500,880.5 N/A ft Select operating depth 12.5 12.5 ft Operating volume 417,400.4 436,000.0 ft³ 3,122,155.0 3,261,280.0 gal Approach: Detention time Assume: Detention time (b – Table 8-4, page 533) (Design range = 5-20 days) 6.0 7.0 d Available maximum capacity 520,359.2 465,897.1 gal Overland flow/Treatment disposal system Information is not available. Recirculation pond Information is not available. Design flow capacity based on aerated facultative lagoon is 520,359 391,000 gpd
Note: (a) - Total volume can be found from sum of rectangular volume based on the bottom area of lagoon and half of the difference of rectangular volume based on surface area of lagoon and rectangular volume based on bottom area of lagoon. (b) – From Crites and Tchobanoglous, Small and Decentralized Wastewater Management Systems (c ) - Not available

Appendix 3B: Capacity Assessment Calculation Sheets
18 October 2006 Final WRMP 18
Umatac-Merizo STP - Capacity Assessment
0.520
0.0
0.2
0.4
0.6
0.8
Overland disposal system
Aerated facultative lagoon
Unit p
roce
sses
Flow rate (MGD)
Design Capacity from 2004 CPE Report - 0.39
Under evaluation
Hydraulic detention time
The bar chart above is a comparison of the design capacity from the 2004 CPE report versus the calculated capacity of the aerated facultative lagoon. Description of Assessment According to available current information, only the aerated facultative lagoon was evaluated for the capacity assessment. Unit processes including pumps and surface aerators are assumed to function properly and provide enough capacities. The dimension of the lagoon is known. The averages of monthly average influent BOD5 and TSS concentrations, 216 and 70 mg/L, respectively are taken from GWA’s DMRs during the time period of January 2004 to March 2005.
Detention time is selected as the criteria to determine the available maximum capacity for this unit process. The typical design range is from 5 to 20 days. Full-scale stress testing is recommended to assess the capacity of the overland flow/treatment disposal system.

Appendix 3B: Capacity Assessment Calculation Sheets
October 2006 Final WRMP 19
Table 3B.5: Capacity Assessment for Northern District STP
Description Capacity
assessment calculations
Compared with other designs (d)
Unit
Aerated grit chamber and grit classifier -Width (each) 22.0 N/A(f) ft -Length 54.3 N/A ft -Operating depth 14.0 N/A ft -Volume (each) 16,709.0 16,650.0 ft³ -Volume (total) 33,418.0 33,300.0 ft³ 249,967.0 249,084.0 gal Assume: Hydraulic retention time (HRT) @ PHF (a - page 462) (Design range = 2-5 minutes) 3.0 N/A min Available maximum capacity @ PHF 12.0 N/A mgd Primary clarifier -Type – Circular -Number – 2 -Diameter (each) 130.0 130.0 ft -Side water depth (each) 7.0 7.0 ft -Surface area (total) 26,546.0 26,546.0 ft² -Weir length (total) 817.0 817.0 ft -Volume (total) 185,822 N/A ft³ 1,389,949.0 1,390,065.0 gal Criteria 1: Surface overflow rates (SOR) Assume: Surface overflow rates (SOR) @ AADF (a - page 475) (Design range = 800-1,200 gpd/ft²) 900.0 1,000.0 gpd/ft² Available maximum capacity @ AADF 12.0 13.0 MGD Assume: Surface overflow rates (SOR) @ PHF (a - page 475) (Design range = 2,000-3,000 gpd/ft²) 2,000.0 2,000.0 gpd/ft² Available maximum capacity @ PHF 26.6 26.6 MGD Criteria 2: Hydraulic retention time (HRT) Assume: Hydraulic retention time (HRT) @ AADF (a - page 475) (Design range = 1.5-2.5 hours) 2.0 2.8 hours Available maximum capacity @ AADF 16.7 N/A MGD Criteria 3: Weir overflow rate Assume: Weir overflow rate @ AADF (a - page 475) (Design range = 10,000-40,000 gpd/ft2) 16,000.0 14,691.0 gpd/ft Available maximum capacity @ AADF 13.0 N/A MGD Find: Primary sludge volume per Mgal Assume: Removal efficiency of suspended solid 0.6 N/A
Assume: Average influent TSS (based on the average of monthly average DMR during Jan 04 - Mar 05)) 108.0 N/A mg/L Dry solid (b) 542.0 N/A lb

Appendix 3B: Capacity Assessment Calculation Sheets
20 October 2006 Final WRMP 20
Description Capacity
assessment calculations
Compared with other designs (d)
Unit
Assume: Specific gravity of sludge (a - page 485) 1.05 N/A
Assume: Solid concentration (a - page 485) (Design range = 4-12 %) 4.7 N/A %
Primary sludge volume per Mgal (c) 1,316.36.0 N/A gal/Mgal Anaerobic digesters -Number – 2 -Type – Circular -Diameter (each) 80.0 80.0 ft -Max. sludge water depth (SWD) 21.0 21.0 ft -Avg. working SWD 18.0 18.0 ft Assume: The primary anaerobic digester provides degradation process and the secondary anaerobic digester provides sedimentation process. -Volume of primary digester 90,514.0 90,514.0 ft³ 677,047.0 677,047.0 gal Appraoch 1: Population basis - hydraulic retention time Assume: The primary anaerobic digester is operated between high rate and standard rate digestion mode and mesophilic condition.
Assume: Hydraulic retention time (HRT) (a - page 823) (Design range = 30-60 days - stand rate and 15-20 days - high -rate) 40.0 N/A d Available max. capacity (primary sludge) 16,926.2 N/A gpd Assume: Solid concentration = 4.7% Available max. capacity (raw wastewater) 12.9 N/A MGD Approach 2: Volatile solid loading factor Assume: The primary anaerobic digester is operated between high rate and standard rate digestion mode and mesophic condition. Volume of primary anaerobic digestion tank 90,514.00 N/A ft³
Selected volatile sludge loading factor (lb/ft3 d) (a - page 821) (Based on sludge concentration = 4.7% and hydraulic retention time = 20 days) 0.11 N/A lb/ft³.d Volatile sludge loading 9,956.5 N/A lb/d
Total solid (Assume - 60% of total solid is volatile solids.) 16,594.2 N/A lb/d Sludge concentration (based on 4.7%) 47,000.0 N/A mg/L 0.1 N/A lb/L Incoming sludge flow rate 160,485.8 N/A L/d 42,395.5 N/A gpd
Primary sludge volume per Mgal 1,316.4 N/A gal/Mgal Available maximum capacity (raw wastewater) 32.2 N/A MGD Sludge Drying Beds Type - Rectangular concrete drying beds with center drainage trench

Appendix 3B: Capacity Assessment Calculation Sheets
October 2006 Final WRMP 21
Description Capacity
assessment calculations
Compared with other designs (d)
Unit
Number of beds 8 8 beds Width (each) 30.0 30.0 ft Length (each) 105.0 105.0 ft Area (each) 3,150.0 3,150.0 ft² Total area 25,200.0 25,200.0 ft² Approach 1: Area per person
Assume: Required area of sludge drying beds for one person (a - page 873) (Design range = 1.0-1.5 ft²/person) 1.25 N/A ft²/ person Maximum number of people generating wastewater that sludge drying bed can handle 20,160 8,500 persons
Assume: Wastewater flow rate per person (a - page 27) (design range = 60-100 gpd per person for better home) 80.0 N/A
gpd/ person
Available maximum flow capacity 1.6 N/A MGD Approach 2: Sludge-loading rate 2.1) Find max. sludge that can be wasted
Assume: Sludge loading rate (a - 873) (Design range = 25-30 lb dry solids/ft².yr) 27.0 N/A
lb dry solids/ ft².yr
Total area 25,200.0 N/A ft²
Maximum sludge that can be wasted 680,400.0 N/A lb dry weight/yr
Maximum sludge that can be wasted 1,864.0 N/A lb dry weight/day
2.2) Find the relationship between sludge flow from secondary anaerobic digester (lb dry solids/day) and wastewater flow influent (e - page 1262-1263) For the calculation purpose, assume - sludge flow from primary clarifiers 1.0 N/A MGD Sludge concentration (from primary clarifiers) 47,000.0 N/A mg/L Sludge mass flow (from primary clarifiers) 391,980.0 N/A lb/d VSS fraction in sludge flow (from primary clarifiers) 0.60 N/A
Sludge mass flow (fixed solids) (from primary clarifiers) 156,792.0 N/A lb/d
Total solid concentrations of sludge from primary anaerobic digester 36,000.0 N/A mg/L Sludge mass flow (from primary anaerobic digester) 300,240.0 N/A lb/d Volumetric flow balance: Total sludge hydraulic flow (from primary clarifiers) (Q) = Supernatant hydraulic flow ( from secondary anaerobic digester) (Qs) + Sludge hydraulic flow (from secondary anaerobic digester) (Qsdb)……Equation 1 So, Qs = 1-Qsdb Total solid concentrations of supernatant from secondary anaerobic digester 20,000.0 N/A mg/L

Appendix 3B: Capacity Assessment Calculation Sheets
22 October 2006 Final WRMP 22
Description Capacity
assessment calculations
Compared with other designs (d)
Unit
Total solid concentrations of sludge from secondary anaerobic digester 43,000.0 N/A mg/L Mass balance of secondary anaerobic digester: (Q)(36,000)(8.34) = (Qs)(20,000)(8.34) + (Qsdb)(43,000)(8.34) …….. Equation 2 From Equation 1 and 2, Qsdb 0.70 N/A MGD Qs 0.30 N/A MGD So, sludge mass flow (from secondary anaerobic digester to sludge drying beds) = 249,475.0 N/A lb/d
Therefore, 1 MGD of sludge flow from primary clarifier will generate sludge mass flow to sludge drying beds = 249,475.0 N/A lb/d
But primary sludge volume per 1 MGD of raw wastewater influent = 1,316.0 N/A gpd Therefore, 1 MGD of raw wastewater influent will generate sludge mass flow to sludge drying beds = 328.0 N/A lb/d 2.3) Find available maximum flow capacity Available maximum capacity 5.7 N/A MGD Note: Available maximum flow capacity for sludge drying beds is selected based on approach 2 because it is believed that it provides more accurate calculation than approach 1.
Design flow capacity is restricted by sludge drying beds which its available maximum capacity is 5.7 12.0 MGD
Note: (a) - From Metcalf and Eddy, Inc., 3rd Edition, Wastewater Engineering - Treatment, Disposal, and Reuse (b) - Dry solid = (removal efficiency of total suspended solid)(avg. inf. TSS)((8.34 lb/Mgal)(mg/L))(1.0 Mgal) (c) - Primary sludge volume per Mgal = (dry solid, lb)(100)/((specific gravity)(solid concentration, %)(62.4 lb/ft3)/(7.48 gal/ft3)) (d) - Compared with comprehensive performance evaluation of the Northern District STP report prepared by Duenas & Associates, Inc. and Boyle Engineering Corporation (e) - Design of Municipal Wastewater Treatment Plants Handbook, WEF, ASCE, 1992 (f) - Not available
Appendix 3B: Capacity Assessment Calculation Sheets
October 2006 Final WRMP 23
Northern District STP - Capacity Assessment
0.0
5.7
17.1
11.9
0.0
2.0
4.0
6.0
8.0
10.0
12.0
14.0
16.0
18.0
20.0
22.0
24.0
Centrifuges
Sludge Drying Beds
Anaerobic digesters
Primary clarifier
Unit
proc
esse
s
Flow rate (MGD)
Design Capacity from 2002 CPE Report - 12 MGD
Overflow rate
Sludge loading rate
Hydraulic retention time
0.0 Not Operation
The bar chart above is a comparison of the design capacity from 2002 CPE report versus the calculated capacities. Description of Assessment The Northern District STP is a primary sewage treatment plant. Capacity assessments are performed on its main unit processes including the aerated grit removal system, primary clarifiers, anaerobic digesters, and sludge drying beds. Currently, centrifuges for dewatering are not in service, eight sludge drying beds are used instead. They receive sludge wastes not only from Northern District STP but also Hagatna STP and Baza Gardens STP. Below is a step-by-step approach to perform the capacity assessment of each main unit process (note redundant and spare tankage and equipment were not part of the assessment).
1) Given information of sizes of each unit process from existing drawings and the raw water characteristics from the GWA’s DMRs. Raw wastewater parameters used for this assessment are the averages of monthly average of BOD5 and TSS taken during the time period beginning from January 2004 to March 2005.
• Average of monthly average BOD5 influent concentration = 222 mg/L • Average of monthly average TSS influent concentration = 105 mg/L
2) The available maximum capacity of aerated grit chamber was assessed based on HRT. The
HRT design ranges of pre-aeration tanks and aerated grit chambers are 10 to 45 minutes and 2-5 minutes respectively.
3) Next, three approaches were selected to calculate the available maximum capacity of the
primary clarifiers, including SOR, HRT, and WOR.

Appendix 3B: Capacity Assessment Calculation Sheets
24 October 2006 Final WRMP 24
Approach 1 - SOR Both average flow and peak flow are investigated. The available maximum process capacity can be found by multiplying SOR and the total surface area of the primary clarifiers. Typical SOR design ranges are 800-1,200 gpd/ft2 for average flow and 2,000-3,000 gpd/ft2 for peak hourly flow. Approach 2 – HRT Typical HRT design range is 1.5 to 2.5 hours for average flow. The available maximum capacity can be calculated by the following equation: Available maximum capacity = Total primary clarifier volumes/HRT Approach 3 – WOR Typical weir rate design range is 10,000 to 40,000 gpd/ft2. The available maximum capacity can be calculated based on the equation written below: Available maximum capacity = (Total weir length) x (Weir overflow rate)
4) The capacity assessment for the anaerobic digestion tanks is determined by first calculating
the available primary sludge treatment capacity. Then, the available maximum influent wastewater flow can be calculated, which can be shown by the following equation: Available influent wastewater capacity = (Available primary sludge treatment capacity) x (Primary sludge volume per Mgal of raw wastewater influent) The primary sludge treatment capacity is calculated based on the hydraulic retention time (HRT) - design range of 30 to 60 days. The equations used to find primary sludge volume per Mgal of raw wastewater influent are shown below:
Primary sludge volume per Mgal = (Dry solid, lb)(100)/((Specific gravity)(Solid concentration, %)(62.4 lb/ft3)/(7.48 gal/ft3)) Dry solid = (Removal efficiency of total suspended solid)(Avg. inf. TSS)((8.34 lb/Mgal)(mg/L))(1.0 Mgal)
The assumptions used to calculate the primary sludge volume include:
• Removal efficiency of suspended solid = 60 % • Average of monthly average TSS concentration = 108 mg/L • Specific gravity = 1.05
Design range of solids concentration is 4 to 12%. Two approaches used to investigate the available maximum capacity of the anaerobic digesters include population basis HRT and volatile solids loading factor.

Appendix 3B: Capacity Assessment Calculation Sheets
October 2006 Final WRMP 25
Given data -Tank dimensions and raw wastewater influent TSS and BOD5 concentrations
-Design ranges of all parameters were selected from Wastewater Engineering, Treatment, Disposal, and Reuse by Metcalf & Eddy, 3rd Edition.
Approach 1 – Population basis - HRT Assume 1) The primary anaerobic digester is operated between high rate and standard
rate and in mesophilic conditions. 2) HRT is selected based on two design ranges (30 to 60 days for stand rate, and 15 to 20 days for high rate). 3) Solid concentration = 4.7%
Approach 2 – Volatile solids loading factor Assume 1) The volatile sludge loading factor (lb/ft3d) is selected based on a:
sludge concentration = 4.7%, and hydraulic retention time = 20 days. 2) 60% of the total solids from the primary clarifier are volatile solids. 3) Sludge concentration from primary clarifiers = 4.7% Steps to calculate the available maximum flow capacity are as follows: 1) Volatile sludge loading = (Volatile sludge loading factor) x (Volume of primary anaerobic digestion tank)
2) Find total solids mass flow = (Volatile sludge loading from step 1)/(0.6) 3) Find sludge volumetric flow from primary clarifier = (Total solids)/(Sludge concentration)
4) Available maximum capacity = (Sludge flow from primary clarifier)/(primary sludge volume/Mgal)
5) For the sludge drying beds, two approached are used as follows:
Approach 1 - Area per person Known – Size of sludge drying beds Assume – 1) Required area of sludge drying beds per person (Design range = 1 to 1.5 ft2/person) 2) Wastewater flow generated from 1 person (Design range = 60 – 100 gpd per person) Steps to find available maximum wastewater flow capacity are 1) Find maximum number of people generating wastewater that sludge drying beds can
handle. 2) Find available maximum capacity (MGD)
Approach 2 – Sludge loading rate approach Given – Size of sludge drying beds
Appendix 3B: Capacity Assessment Calculation Sheets
26 October 2006 Final WRMP 26
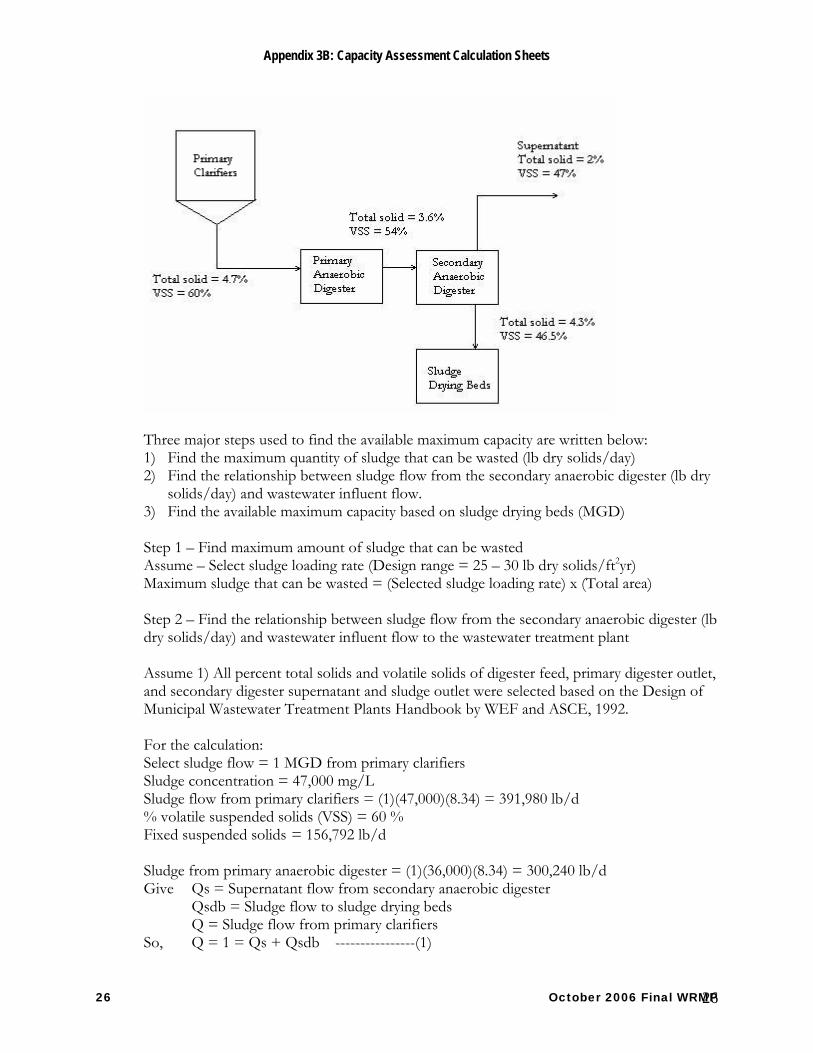
Three major steps used to find the available maximum capacity are written below: 1) Find the maximum quantity of sludge that can be wasted (lb dry solids/day) 2) Find the relationship between sludge flow from the secondary anaerobic digester (lb dry
solids/day) and wastewater influent flow. 3) Find the available maximum capacity based on sludge drying beds (MGD)
Step 1 – Find maximum amount of sludge that can be wasted Assume – Select sludge loading rate (Design range = 25 – 30 lb dry solids/ft2yr) Maximum sludge that can be wasted = (Selected sludge loading rate) x (Total area) Step 2 – Find the relationship between sludge flow from the secondary anaerobic digester (lb dry solids/day) and wastewater influent flow to the wastewater treatment plant Assume 1) All percent total solids and volatile solids of digester feed, primary digester outlet, and secondary digester supernatant and sludge outlet were selected based on the Design of Municipal Wastewater Treatment Plants Handbook by WEF and ASCE, 1992. For the calculation: Select sludge flow = 1 MGD from primary clarifiers Sludge concentration = 47,000 mg/L Sludge flow from primary clarifiers = (1)(47,000)(8.34) = 391,980 lb/d % volatile suspended solids (VSS) = 60 % Fixed suspended solids = 156,792 lb/d Sludge from primary anaerobic digester = (1)(36,000)(8.34) = 300,240 lb/d Give Qs = Supernatant flow from secondary anaerobic digester Qsdb = Sludge flow to sludge drying beds Q = Sludge flow from primary clarifiers So, Q = 1 = Qs + Qsdb ----------------(1)
Appendix 3B: Capacity Assessment Calculation Sheets
October 2006 Final WRMP 27
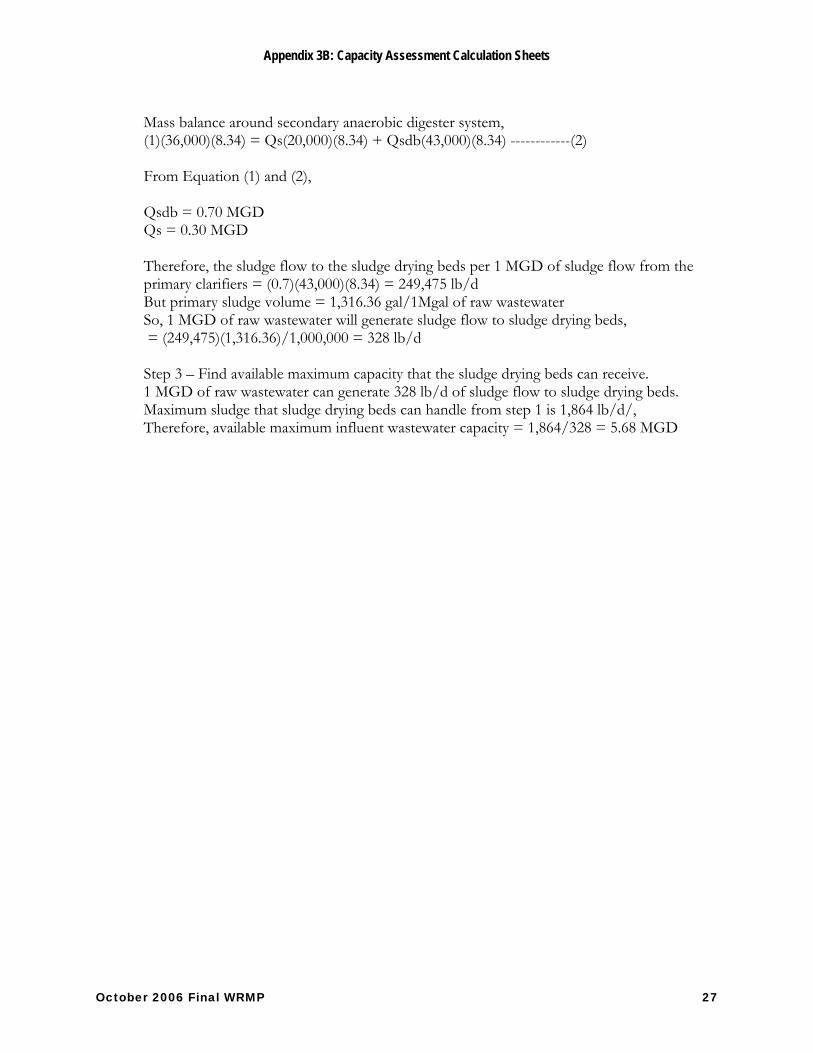
Mass balance around secondary anaerobic digester system, (1)(36,000)(8.34) = Qs(20,000)(8.34) + Qsdb(43,000)(8.34) ------------(2) From Equation (1) and (2), Qsdb = 0.70 MGD Qs = 0.30 MGD Therefore, the sludge flow to the sludge drying beds per 1 MGD of sludge flow from the primary clarifiers = (0.7)(43,000)(8.34) = 249,475 lb/d But primary sludge volume = 1,316.36 gal/1Mgal of raw wastewater So, 1 MGD of raw wastewater will generate sludge flow to sludge drying beds, = (249,475)(1,316.36)/1,000,000 = 328 lb/d Step 3 – Find available maximum capacity that the sludge drying beds can receive. 1 MGD of raw wastewater can generate 328 lb/d of sludge flow to sludge drying beds.
Maximum sludge that sludge drying beds can handle from step 1 is 1,864 lb/d/, Therefore, available maximum influent wastewater capacity = 1,864/328 = 5.68 MGD
Appendix 3B: Capacity Assessment Calculation Sheets
28 October 2006 Final WRMP 28
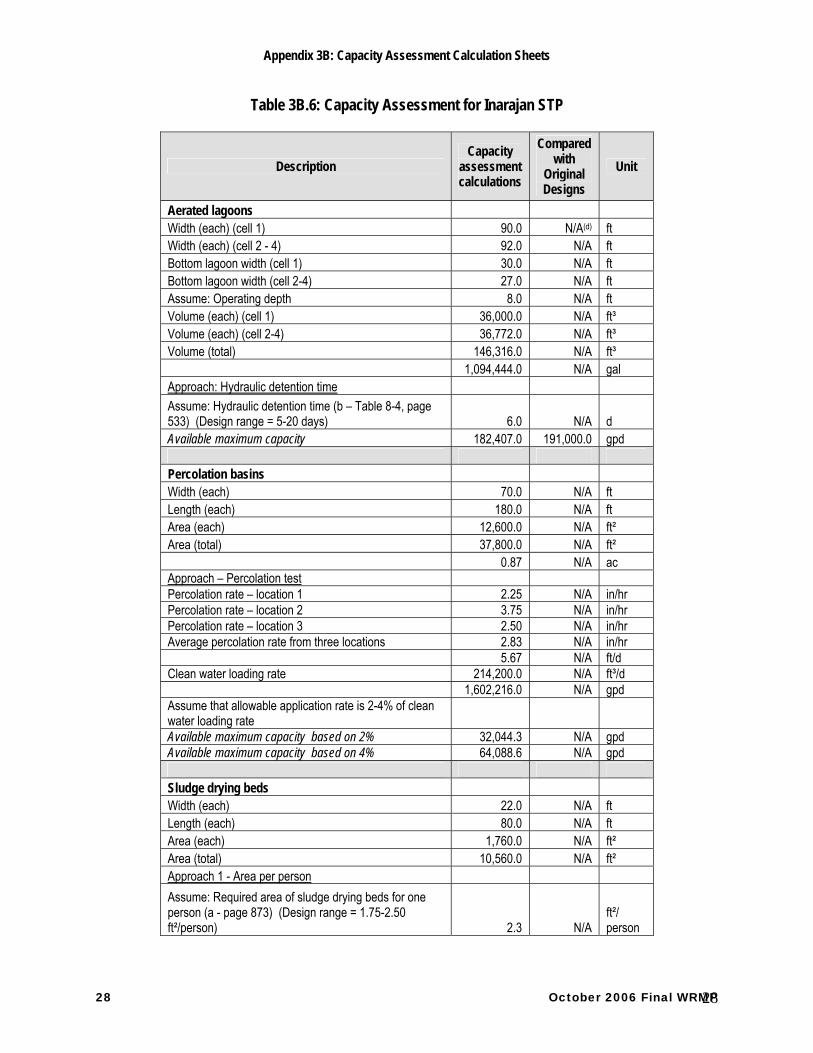
Table 3B.6: Capacity Assessment for Inarajan STP
Description Capacity
assessment calculations
Compared with
Original Designs
Unit
Aerated lagoons Width (each) (cell 1) 90.0 N/A(d) ft Width (each) (cell 2 - 4) 92.0 N/A ft Bottom lagoon width (cell 1) 30.0 N/A ft Bottom lagoon width (cell 2-4) 27.0 N/A ft Assume: Operating depth 8.0 N/A ft Volume (each) (cell 1) 36,000.0 N/A ft³ Volume (each) (cell 2-4) 36,772.0 N/A ft³ Volume (total) 146,316.0 N/A ft³ 1,094,444.0 N/A gal Approach: Hydraulic detention time Assume: Hydraulic detention time (b – Table 8-4, page 533) (Design range = 5-20 days) 6.0 N/A d Available maximum capacity 182,407.0 191,000.0 gpd Percolation basins Width (each) 70.0 N/A ft Length (each) 180.0 N/A ft Area (each) 12,600.0 N/A ft² Area (total) 37,800.0 N/A ft² 0.87 N/A ac Approach – Percolation test Percolation rate – location 1 2.25 N/A in/hr Percolation rate – location 2 3.75 N/A in/hr Percolation rate – location 3 2.50 N/A in/hr Average percolation rate from three locations 2.83 N/A in/hr 5.67 N/A ft/d Clean water loading rate 214,200.0 N/A ft³/d 1,602,216.0 N/A gpd Assume that allowable application rate is 2-4% of clean water loading rate Available maximum capacity based on 2% 32,044.3 N/A gpd Available maximum capacity based on 4% 64,088.6 N/A gpd Sludge drying beds Width (each) 22.0 N/A ft Length (each) 80.0 N/A ft Area (each) 1,760.0 N/A ft² Area (total) 10,560.0 N/A ft² Approach 1 - Area per person Assume: Required area of sludge drying beds for one person (a - page 873) (Design range = 1.75-2.50 ft²/person) 2.3 N/A
ft²/ person
Appendix 3B: Capacity Assessment Calculation Sheets
October 2006 Final WRMP 29
Description Capacity
assessment calculations
Compared with
Original Designs
Unit
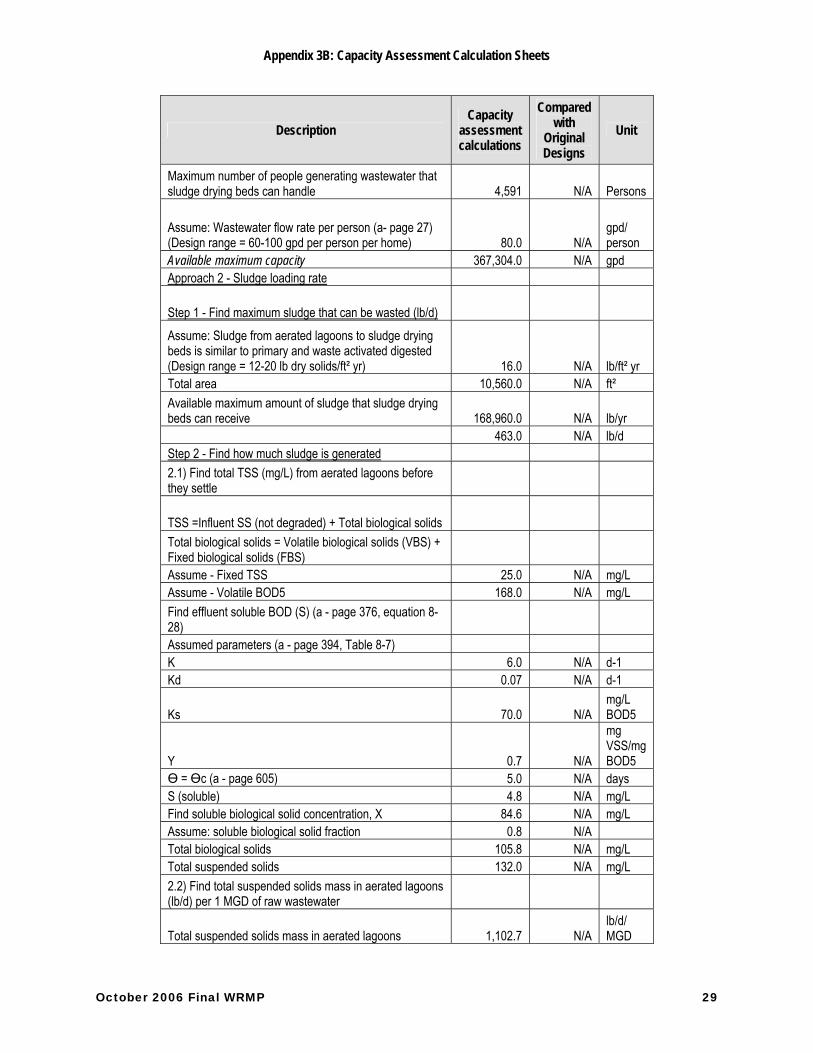
Maximum number of people generating wastewater that sludge drying beds can handle 4,591 N/A Persons
Assume: Wastewater flow rate per person (a- page 27) (Design range = 60-100 gpd per person per home) 80.0 N/A
gpd/ person
Available maximum capacity 367,304.0 N/A gpd Approach 2 - Sludge loading rate
Step 1 - Find maximum sludge that can be wasted (lb/d) Assume: Sludge from aerated lagoons to sludge drying beds is similar to primary and waste activated digested (Design range = 12-20 lb dry solids/ft² yr) 16.0 N/A lb/ft² yr Total area 10,560.0 N/A ft² Available maximum amount of sludge that sludge drying beds can receive 168,960.0 N/A lb/yr 463.0 N/A lb/d Step 2 - Find how much sludge is generated 2.1) Find total TSS (mg/L) from aerated lagoons before they settle
TSS =Influent SS (not degraded) + Total biological solids Total biological solids = Volatile biological solids (VBS) + Fixed biological solids (FBS) Assume - Fixed TSS 25.0 N/A mg/L Assume - Volatile BOD5 168.0 N/A mg/L Find effluent soluble BOD (S) (a - page 376, equation 8-28) Assumed parameters (a - page 394, Table 8-7) K 6.0 N/A d-1 Kd 0.07 N/A d-1
Ks 70.0 N/A mg/L BOD5
Y 0.7 N/A
mg VSS/mg BOD5
Ө = Өc (a - page 605) 5.0 N/A days S (soluble) 4.8 N/A mg/L Find soluble biological solid concentration, X 84.6 N/A mg/L Assume: soluble biological solid fraction 0.8 N/A Total biological solids 105.8 N/A mg/L Total suspended solids 132.0 N/A mg/L 2.2) Find total suspended solids mass in aerated lagoons (lb/d) per 1 MGD of raw wastewater
Total suspended solids mass in aerated lagoons 1,102.7 N/A lb/d/ MGD

Appendix 3B: Capacity Assessment Calculation Sheets
30 October 2006 Final WRMP 30
Description Capacity
assessment calculations
Compared with
Original Designs
Unit
Step 3 - Find available maximum flow capacity Available maximum capacity 419,802.4 N/A gpd Design flow capacity is restricted by percolation basins which its available maximum capacity is
32,044 - 64,089 191,000 gpd
Note: (a) - From Metcalf and Eddy, Inc., 3rd Edition, Wastewater Engineering - Treatment, Disposal, and Reuse (b) - From Crites and Tchobanoglous, Small and Decentralized Wastewater Management Systems (c ) – BOD effluent required in NPDES permit is less than 30 mg/L. (d) - Not available
Inarajan STP - Capacity Assessment
0.42
0.06
0.18
0.0
0.1
0.2
0.3
0.4
0.5
0.6
Sludge drying beds
Percolation basins
Aerated lagoons
Unit
proc
esse
s
Flow rate (MGD)
Design Capacity from 1994 Fac. Plan - 0.19 MGD
Hydraulic detention time
Sludge loading rate
Percolation test
The bar chart above is a comparison of the design capacity from the 1994 Guam Islandwide Wastewater Facilities Plan versus the calculated capacities. Description of Assessment Main unit processes of the Inarajan STP for the capacity assessment includes aerated lagoons, percolation basins, and sludge drying beds. Since this STP is operated at zero discharge to the river (or flows to the river were not monitored) no DMR data was available. The capacity assessment of each unit process was carried out as following:

Appendix 3B: Capacity Assessment Calculation Sheets
October 2006 Final WRMP 31
1) All sizing information for main unit processes was based on the system drawings. 2) Two approaches are applied to find the available maximum capacity of the aerated lagoons.
Available maximum capacity for this case can be found by dividing the total lagoon volumes with the hydraulic detention time, with a design range of 5 to 20 days.
3) Three percolation basins are used to receive effluent water after biologically treated by aerated lagoons and distributed by the dosing chamber. Effluent water is divided into three lines in parallel and sent to these three percolation basins. The average percolation rate from percolation testing at three locations closing to the percolation basins was determined. Then, typically 2-4% of the average percolation rate would be used as a reliable application rate for disposal.
4) The last unit process for the capacity assessment of this STP was the sludge drying beds. Six
sludge drying beds are used to dry wet sludge which is pumped from the four aerated lagoons where stabilized sludge is settled at the bottom of each cell. Based on information from existing drawings, these sludge drying beds are the conventional sand drying bed type. The capacity assessment is based on the required area used to treat generated wastewater by one person. Because aerated lagoons provide a secondary treatment, the type of sludge selected for this assessment is primary and waste activated digested. The design range of the required sludge drying bed area per person is, 1.75-2.50 ft 2/ person, for this type of sludge. In order to find the available maximum capacity of this unit process, two calculation steps were carried out.
• Finding the maximum number of people that the sludge drying beds can employ (N). N = (Total area of sludge drying beds) x (Required sludge drying area per person)
• Determining the maximum available flow capacity (Q) by assuming the amount of wastewater that is generated by one person each day. Wastewater amounts depend upon the sources. For this case, the source is assumed to be individual residences. Design range of wastewater flow rates for this type of source is 60-100 gallon/person· day and a typical number of 80 gallon/person· day was assumed.
5) Another approach selected to find the capacity of the sludge drying beds is sludge loading
rate. Three main steps to attain the available maximum raw wastewater flow that sludge drying beds can receive are Step 1 Find maximum sludge that sludge drying beds can handle based on a design range of 12-20 lb dry solids/ft2yr. It is assumed that the sludge from aerated lagoons to drying beds can be categorized as primary and waste activated type digested sludge. Available maximum sludge loading = (Selected sludge loading rate) x (Total area of sludge drying beds) Step 2 Find how much sludge is generated in the aerated lagoons (lb/d) per 1 MGD of incoming raw wastewater. 2.1) Find total mixed liquor suspended solids (MLSS) (X) (mg/L) in the aerated lagoons before they settle.

Appendix 3B: Capacity Assessment Calculation Sheets
32 October 2006 Final WRMP 32
Total MLSS = Influent suspended solids (not degraded) + Total biological solids Total biological solids = Volatile biological solids + Fixed biological solids Assume: Fixed TSS concentration = 25 mg/L Soluble BOD5 concentration = 168 mg/L
Find soluble effluent BOD5 concentration (S) = 1)(
)1(−−
+
d
ds
kYkkK
θθ
Then, find X = θdkSSY
+−
1)( 0
Where, Ks = Half-velocity constant, mg/L BOD5 Ө = Hydraulic retention time, days kd = Endogeneous decay coefficient, d-1
Y = Maximum yield coefficient, mg VSS/mg BOD5 k = Maximum rate of substrate utilization per unit mass of
microorganisms, d-1
S0 = Soluble BOD5 influent concentration, mg/L S = Soluble BOD5 effluent concentration, mg/L Assume: 80% of total biological solids are volatile:
Then, total biological solid concentration = X/0.8 mg/L Total mixed liquor suspended solids (TMLSS) = X/0.8 + Influent suspended solids (fixed)
2.2) Find sludge mass (lb/d) per 1 MGD of incoming raw wastewater Sludge mass generated from aerated lagoons = (TMLSS) x (1) x (8.34) lb/d
Step 3: Find the available maximum influent wastewater flow rate that sludge drying beds can receive
Available maximum influent wastewater flow rate = (1,000,000) x (maximum sludge flow that can be generated from aerated lagoons (from step 1), lb/d)/(Sludge mass generated from aerated lagoons per 1 MGD (from step 2), lb/d/MGD)
Approach 2 is believed to be more accurate than approach 1. Population basis generally provides only a rough design calculation. Therefore, the calculated available maximum raw wastewater flow capacity from approach 2 will be selected as a criteria for the capacity assessment of the sludge drying beds.