T2002 Rotating Equipment -...
17
T2002 Rotating Equipment Stephen E. Plaisance, Technical Leader, GE Energy with assistance from Alan L. Dougherty, DuPont Sabine River Works John R. Dugas, DuPont Sabine River Works Equipment Protection & Performance Monitoring Using System 1 ® and Bently Performance TM SE TM Software Prepared for the AIChE Spring National Meeting, EPC Conference Orlando, Florida April 23 – 27, 2006
Transcript of T2002 Rotating Equipment -...

T2002
Rotating Equipment
Stephen E. Plaisance, Technical Leader, GE Energy
with assistance from
Alan L. Dougherty, DuPont Sabine River Works
John R. Dugas, DuPont Sabine River Works
Equipment Protection & Performance Monitoring Using System 1®
and
Bently PerformanceTM SETM Software
Prepared for the AIChE Spring National Meeting, EPC Conference Orlando, Florida
April 23 – 27, 2006

Equipment Protection & Performance Monitoring Using System 1® and Bently
PerformanceTM
SETM
Software
Stephen E. Plaisance, GE Energy
ABSTRACT
Monitoring systems have evolved from standing a nickel on its edge on top of the machine bearing cover or holding a screwdriver to one’s temple, to high-speed simultaneous multi-channel data collection from permanently installed reliable vibration transducers and collaboration with process data from a myriad of sensors. Data from a host of platforms through a cornucopia of transmission protocols are displayed real time on CRT displays, LCD displays or even high definition plasma display screens and deposited into ever increasing Gbytes of digital storage. Data processing overload by an ever-decreasing number of plant engineers is being addressed by an increasing number of willing vendors and contractors all with the conceptual idea to relieve the overloaded remaining end users. Today, plant personnel need a strategy to assimilate the data into useful information. At the heart of any effective asset management strategy - often a combination of condition-based, interval-based, and other approaches particular to the needs and economics of each asset - is a common thread. Information. Managing assets requires not just data, but information.
GE Energy’s System 1® optimization and diagnostic software is an integrated, module, and scalable platform specifically designed to collect and manage asset-related data and convert that data to information using powerful embedded and fully customizable Decision Support™ capabilities. Nameplate data, baseline data, real-time condition data, process data, lessons learned, and any other relevant data and information regardless of where it originates or the type of asset to which it pertains. Additionally, Bently PERFORMANCE™ System Extender™ (SE™) software extends the functionality of System 1 software to include online thermodynamic performance monitoring of machinery. This platform was an upgrade from a previously installed Bently Nevada™ system at Dupont Sabine River Works plant in Orange, TX, on several compressor trains in its ethylene unit. The system was chosen to evaluate the overall performance condition of the units.
INTRODUCTION DuPont Sabine River Works (SRW) plant is located in Orange, Texas. The Ethylene unit consists of six major compressor trains. These are the Charge Gas Booster Compressor, the Charge Gas Compressor, the Methane Compressor, the Propylene Compressor (containing three stages) and the Propylene Compressor with one side load and one extraction stage, and the Ethylene Refrigeration Compressor. In 1995 the plant invested in coatings for its compressor rotors to combat the fouling that would periodically reduce flow rates and result not only in reduced production, but also in costly wash cycles and short-term turnarounds for more intensive cleanings. Additionally, the plant invested in Bently Nevada Performance monitoring software in 1997 to coincide with the existing Bently Nevada vibration-monitoring platform, Data Manager 2000. This paper will show how the plant in managing their operational risks has utilized performance software and vibration monitoring software.

STEAM TURBINE FOULING - PERFORMANCE MONITORING1:
The first performance part of this paper deals with a steam turbine fouling issue that used performance data to assist the plant in recovering production throughput. In 1999 the plant went into a turn around to apply coatings to the steam turbines and verified that the compressor rotor coatings had had the intended effect of reducing the typical fouling. A few months after returning to service, the Charge Gas Compressor steam turbine started to exhibit signs of fouling that was being seen in increased steam rates, lower efficiency and reduced ethylene production. The root cause analysis would lead to the manual control of adding the chemicals for controlling boiler water chemistry and steam quality problems arose with carryover that led to the fouling issue with the steam turbine
2. An online water wash was
conducted in January 2000.
Figures 1 through Figures 7 use an oval to highlight the effects of the first online water wash that was conducted in Jan 2000 after the 1999 turnaround.

The effect of the fouling in the steam turbine was a 10% loss in efficiency that was practically reclaimed after the January 2000 on line water wash (Figure 3). The fouling was also requiring an increased demand in steam as can be seen in Figure 4 below.
Figure 1 Zoom in on Steam Turbine Horsepower
Figure 2 Steam Turbine Efficiency

Finally, the effects of the ethylene production will be seen in the following plots. First, the degradation in steam turbine efficiency and increased steam rate was having a detrimental effect on machine train speed. As seen in Figure 4, 300RPM increase was achieved in the high-speed section of the machine train after the on-line water wash.
Figure 3 Steam Turbine Steam Rate
Figure 4 Charge Gas Compressor 2nd - 4th Stage Speed

This speed change resulted in a recovery of the lost mass flow due to the steam turbine fouling effects on operation. Figure 6 reflects the change in mass flow after the 1999 turnaround until the January on line water wash of the steam turbine (denoted by the oval).
Figure 7 is a shorter timeframe of Figure 6 showing the discharge flow decreasing from 365,000lbs/hr to 335,000lbs/hr. The online water wash performed in early January 2000 returned the mass flow to 365,000lbs/hr.
As with any procedure, online water washes need to be run through a cost benefit evaluation. This cost is usually in the form of lower plant rates in order to minimize thrust loads
on the turbine. The benefits can be an increase in throughput of product production. The plant conducted a cost analysis review to determine the optimum frequency to manage their costs versus recovery gains in production rates. Careful analysis such as this can enhance the plant’s bottom line as risk factors (such as stress on machines, production loss) can be managed. Having the right information (in this case, performance data) and the placing of all the pieces of the puzzle in their complex orders, can provide a clearer picture to overall plant profitability.
VIBRATION MONITORING WITH PERFORMANCE MONITORING
DuPont SRW transitioned its vibration monitoring platform to System 1 optimization and diagnostic software. System 1 incorporates the historical focus of Bently Nevada products on condition monitoring for rotating and reciprocating machinery by combining support for online and offline data sources. These included selected communications processors and portable data collectors, resulting in a unified online/offline system. However, System 1 extends condition monitoring capabilities beyond just machinery to include other plant assets as well – assets such as vessels, piping, boilers, heat exchangers, valves, instruments, and virtually any equipment for which condition information is desired.
3
Additionally the Performance Monitor 2000 package was transitioned to the Bently PERFORMANCE SE. Bently PERFORMANCE SE software extends the functionality of System 1 by adding integrated thermodynamic performance monitoring. It can be used for machinery such as gas and steam turbines, rotating and reciprocating compressors, and pumps. It can also be used for non-rotating assets such as boilers, heat exchangers, and other thermal machines. The software uses the same database and display components as System 1, resulting in a seamless, integrated system with a single user interface.
4
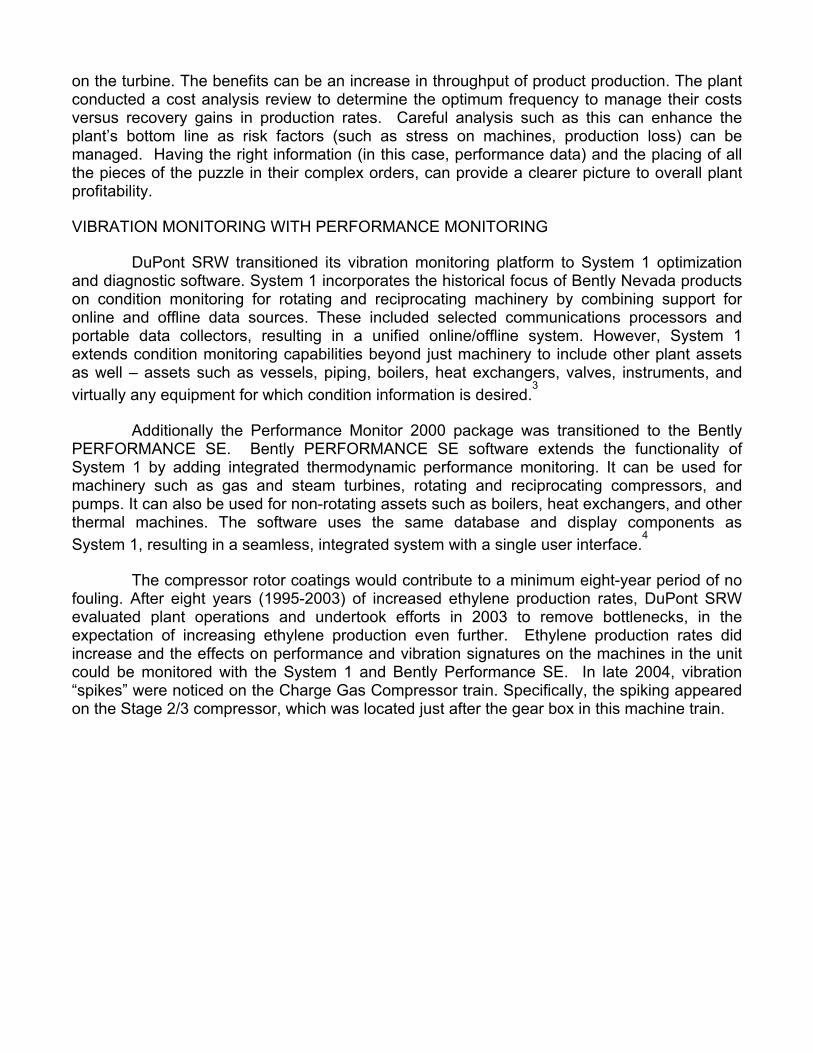
The compressor rotor coatings would contribute to a minimum eight-year period of no fouling. After eight years (1995-2003) of increased ethylene production rates, DuPont SRW evaluated plant operations and undertook efforts in 2003 to remove bottlenecks, in the expectation of increasing ethylene production even further. Ethylene production rates did increase and the effects on performance and vibration signatures on the machines in the unit could be monitored with the System 1 and Bently Performance SE. In late 2004, vibration “spikes” were noticed on the Charge Gas Compressor train. Specifically, the spiking appeared on the Stage 2/3 compressor, which was located just after the gear box in this machine train.
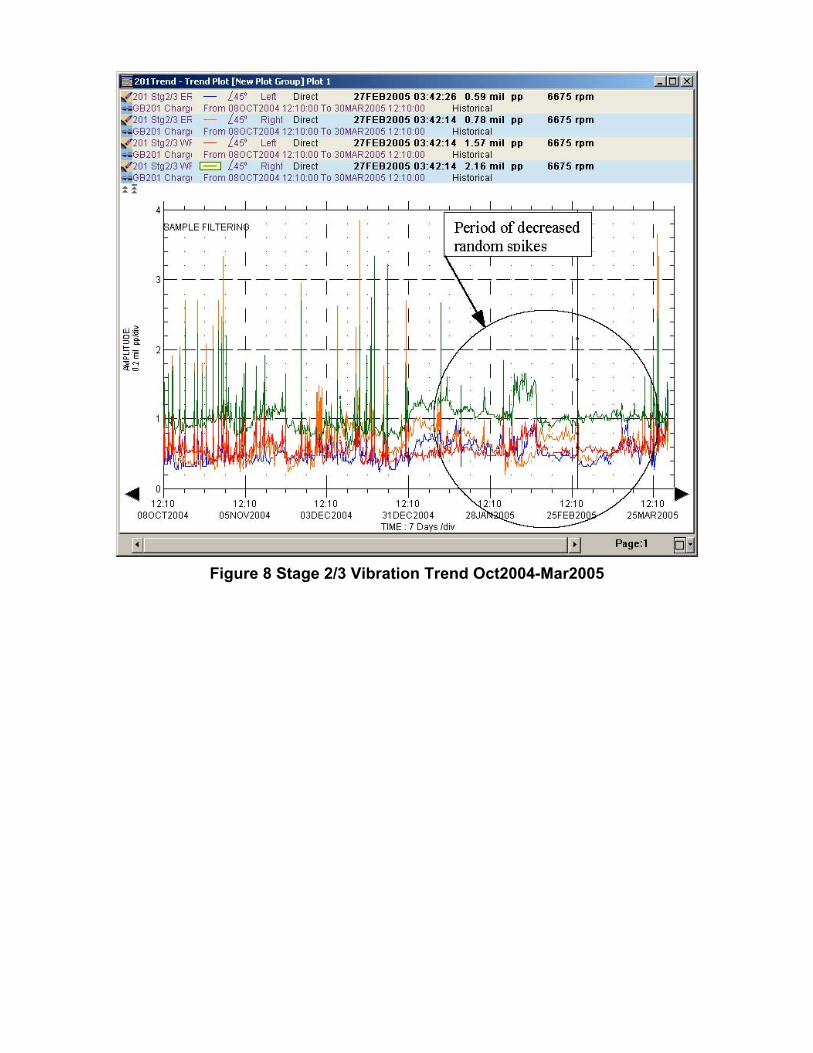
Figure 8 Stage 2/3 Vibration Trend Oct2004-Mar2005

In general practice, this plant used its performance data to obtain indications of possible/probable fouling issues. As noted earlier, coatings applied to the compressor rotors had already resulted in reduced fouling indicators but after the 2003 turnaround and debottlenecking effort, higher mass flow rates were seen in the compressors. Figure 9 reflects the trend in efficiency for the first three stages of the Charge Gas Compressor train and it was noted that Stage 2 efficiency would routinely go over 100%. A review of the data and calculations revealed that one of the possible causes might be liquid carry over. In general practice, the plant has noticed that polytropic head trends have been the dominant indicator of potential fouling issues.
Performance variables and vibration measurements are sampled and stored within the same platform, making it easier to associate vibration events with performance changes and vice versa. However, sudden vibration events may be too quick to show up on the performance trends. On 30 March 2005, a vibration spike on the Stage 2/3 compressor bearings resulted in a unit shutdown. The vibration and process data was reviewed to get insight into the reason for the vibration spike. Vibration levels had been running consistently less than 2.5 mil pp on both bearings when an event occurred which caused the vibration to exceed 10 mil pp. The interlocks worked and shut the machine train down. The small orbit in the center of each plot in Figure 10 was collected just 40 seconds prior to the bigger orbits shown in the plot.

To get another perspective of the magnitude of this spike, the inboard bearing orbit was superimposed onto the shaft centerline plot and it can be plainly seen that the size of the orbit was restricted by the bearing clearance. See Figure 11.

The plant engineering group reviewed the performance and vibration data and determined that the unit could be restarted without any need for further inspection but did take steps to monitor the data closely for potential developments. The unit ran for two more months before the vibration spiked high enough to cause a shutdown. Plans had been made for an online wash cycle, as fouling appeared to be the culprit in the random vibration spike that kept appearing after the shutdown on 30 March 2005. A brief turnaround was initiated to inspect the rotors in this train. Figure 12 below is a picture of the Stage 2/3 rotor with a fresh, clean coating applied for the purpose of restricting fouling.
5Figure 13, and Figure 14 show the
effects of fouling from the higher rates after the 2003 turnaround.

The higher run rates from the 2003 outage were obtained but they also resulted in more carryover and subsequent fouling than had been seen previously. The monitoring of the vibration and performance parameters enabled the plant to make informed decisions for their continued success and productivity.
PERFORMANCE – REVISITED - INSTRUMENTATION Process plants typically do not have the instrumentation installed in locations available for optimum performance calculations. Thermodynamic heat rate calculations are performed in the software based on temperature, pressure, and flow measurements. Once the controlled volume is identified and the available instrumentation recognized then a careful analysis of the parameters required for the performance calculations is undertaken. Online spectrometry to obtain real time gas composition for the calculations has usually been the biggest deficiency for performance calculations. Temperature probes, pressure transducers and flow metering instruments generally are not present at all the inlets and outlets of each required controlled volume. However, once identified, necessary instrumentation can be added to the machines to get reliable performance calculations. Additionally, the compressor manufacturer’s performance curves need to be obtained so that expected and actual performance values can be plotted to ensure calculations are good and that the compressor is delivering performance it was designed to provide. These performance curves can be loaded into the Bently Performance SE software

Once the curves are loaded into the software and the performance curve is created for the plotting of the desired value, a sanity check needs to be performed to ensure the correct data is being sent to the calculations and then back to the display. When data is plotted on the performance curve that is significantly outside the manufacturer’s provided curves, then an evaluation as to whether the data is correct needs to be conducted (see Figure 15). In this example, the Dynamic Data Exchange Share (DDEShare) that was created was calling the data for an incorrect stage. The DDEShare was easily corrected and the result is seen in Figure 16. Typical performance calculations, Polytropic Head, Polytropic Efficiency, Power, Volume Flow, Expected Discharge Pressure, etc. can be plotted on the performance curves to evaluate manufacturer’s expectations versus actual measurements.

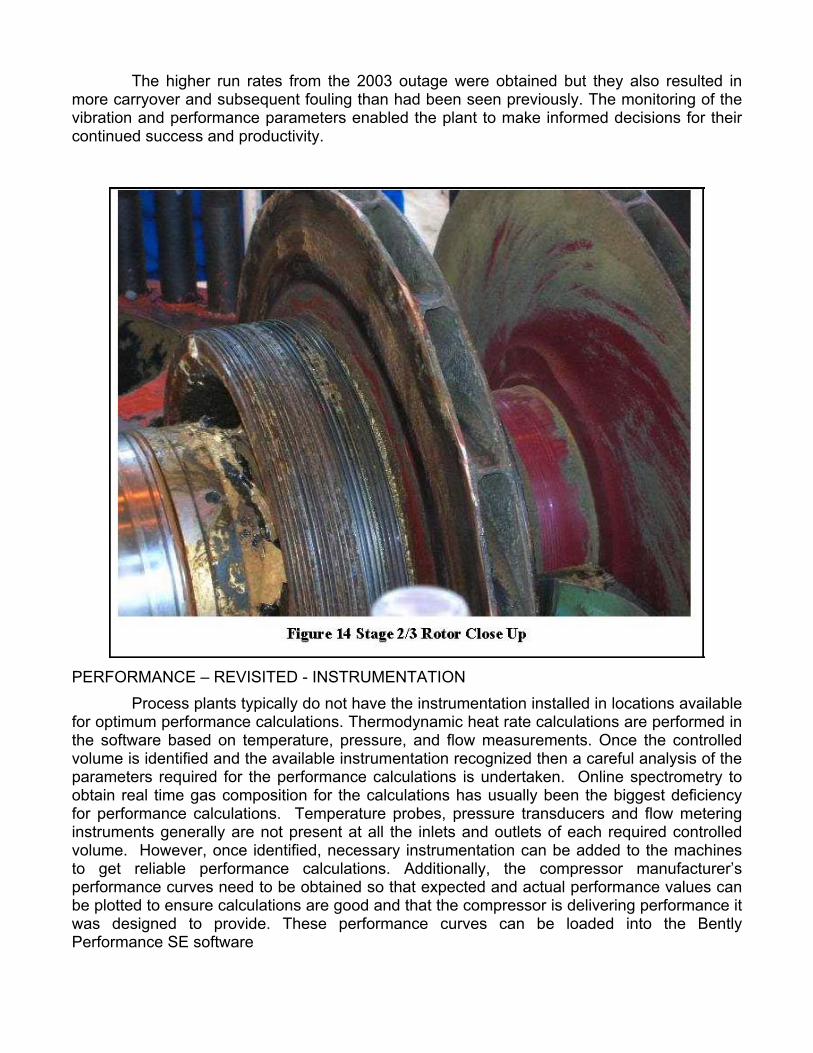
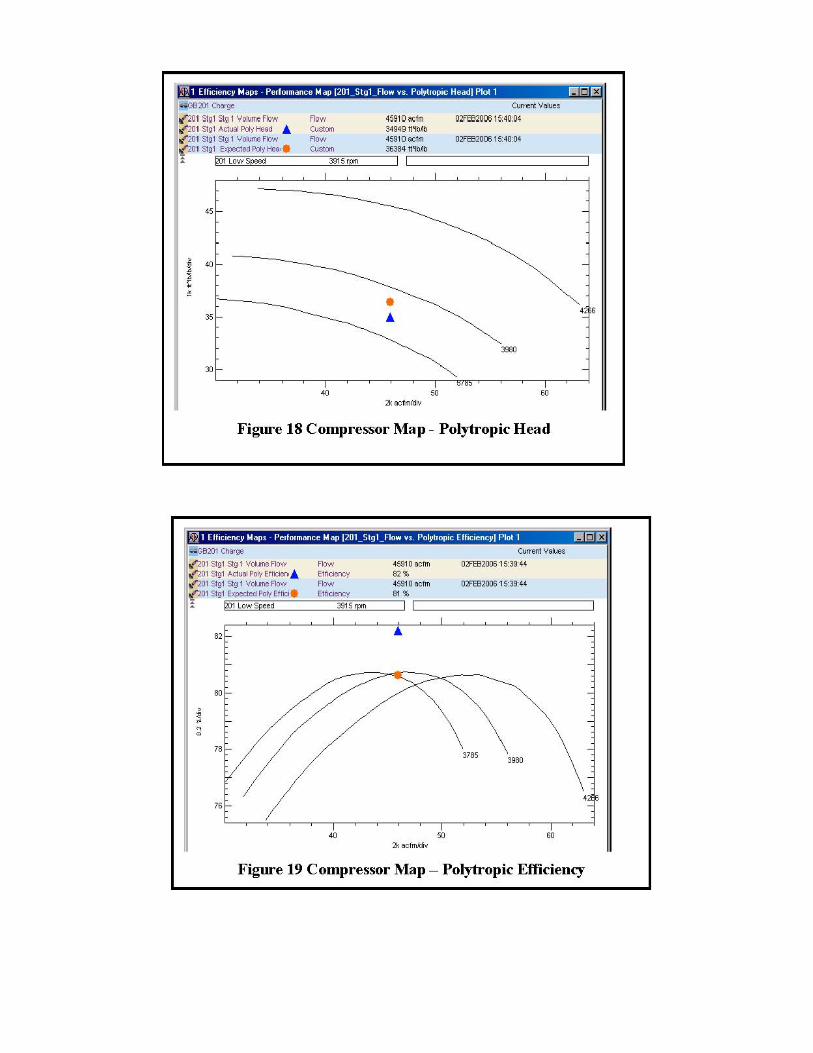
Figures 17, 18, and 19 are examples of some of the additional plots available with Bently PERFORMANCE SE and System 1 software. When the compressor manufacturer provides the surge line, this can be included in the compressor map. The compressor maps then allow the plant to view how close they are operating to any critical points and have an idea for their stability margin.

SUMMARY Vibration Monitoring is an important ingredient in any condition based monitoring program. Additionally, on line performance monitoring is an equally important part of the same condition based monitoring system. Some of the critical measurements required for performance monitoring (temperature, pressure, flow meters) may need to be added to the instrument base as the requisite transducers installed at the optimum locations might be hard to find in established processing plants that were built over 20 years ago. And while the composite accuracy of these instruments will affect any performance calculation, still, when the data is available and properly correlated, plants have more insight into the risks of operations and can deliver refined decisions for continued operations in the wake of events. Inspection of machines after an unplanned shutdown produces major cost not only in lost production, but also in possible liability damages as a result of contractual product delivery schedules. With data and information in the appropriate trained hands, some inspections could be avoided and cost savings immediately recognized. ACKNOWLEDGEMENTS Founded in 1802, DuPont puts science to work by creating sustainable solutions essential to a better, safer, healthier life for people everywhere. Operating in more than 70 countries, DuPont offers a wide range of innovative products and services for markets including agriculture, nutrition, electronics, communications, safety and protection, home and construction, transportation and apparel. The Sabine River Works (SRW) site in Orange, Texas has helped to contribute to DuPont’s success for over 50 years, with its first ethylene plant in operation in 1948. A new ethylene plant was placed in operation in May 1967, and continues to supply ethylene for use in the manufacture of ethylene copolymers at both SRW and Victoria, Texas plant sites and for export to other users in the United States’ Gulf Coast region. GE Energy ( www.ge.com/energy ) is one of the world's leading suppliers of power generation and energy delivery technologies, with 2005 revenue of $16.5 billion. Based in Atlanta, Georgia, GE Energy works in all areas of the energy industry including coal, oil, natural gas and nuclear energy; renewable resources such as water, wind, solar and biogas; and other alternative fuels. Numerous GE Energy products are certified under ecomagination, GE's corporate-wide initiative to aggressively bring to market new technologies that will help customers meet pressing environmental challenges. GE Energy’s optimization and control business features Bently Nevada Asset condition monitoring products and services that assess and ensure the mechanical and thermodynamic health of industrial equipment. With operations in Minden, Nev. and offices in the principal industrial centers of over 40 countries, this group serves a broad base of more than 25,000 global customers in the power generation, petrochemical and other industries. 1 Plots and Analysis courtesy of and used with permission of, DuPont Sabine River Works
2 Steam Turbine Fouling, John R. Dugas, Session 92, 2002 AIChE Spring National Meeting
3 See www.bently.com for more information
4 See www.bently.com for more information.
5 Pictures courtesy of, and used with permission of, DuPont Sabine River Works
System 1, Bently Performance, SE, Decision Support, and Bently Nevada are trademarks of General Electric Company.