t Brinker International, · t Brinker International, ... and marketing strategy. ... buffalo...
61
Transcript of t Brinker International, · t Brinker International, ... and marketing strategy. ... buffalo...


t Brinker International,® we believe that
being the best in the business isn’t
something you achieve but rather
something you continually strive for. We
are always looking ahead...anticipating
consumer trends and leveraging our
talent and resources. The three stars of
the Brinker logo represent our strengths: People,
Quality, and Profitability. Such ideals are at the very
heart of every decision we make. Our logo also
depicts the eight flames that ignite our mission –
Customers, Shareholders, Food, Team, Concepts,
Culture, Partners, and Community. The passion and
dedication with which we manage our business are
based on these driving forces. And on the journey
ahead, we’re committed to “Serving the World a
Great Taste of Life!”TM
A
1
®


4
Selected Financial Highlights(Amounts in thousands, except per share amounts)
2002 2001 2000
Systemwide Sales $ 3,401,652 $ 3,040,377 $ 2,660,429
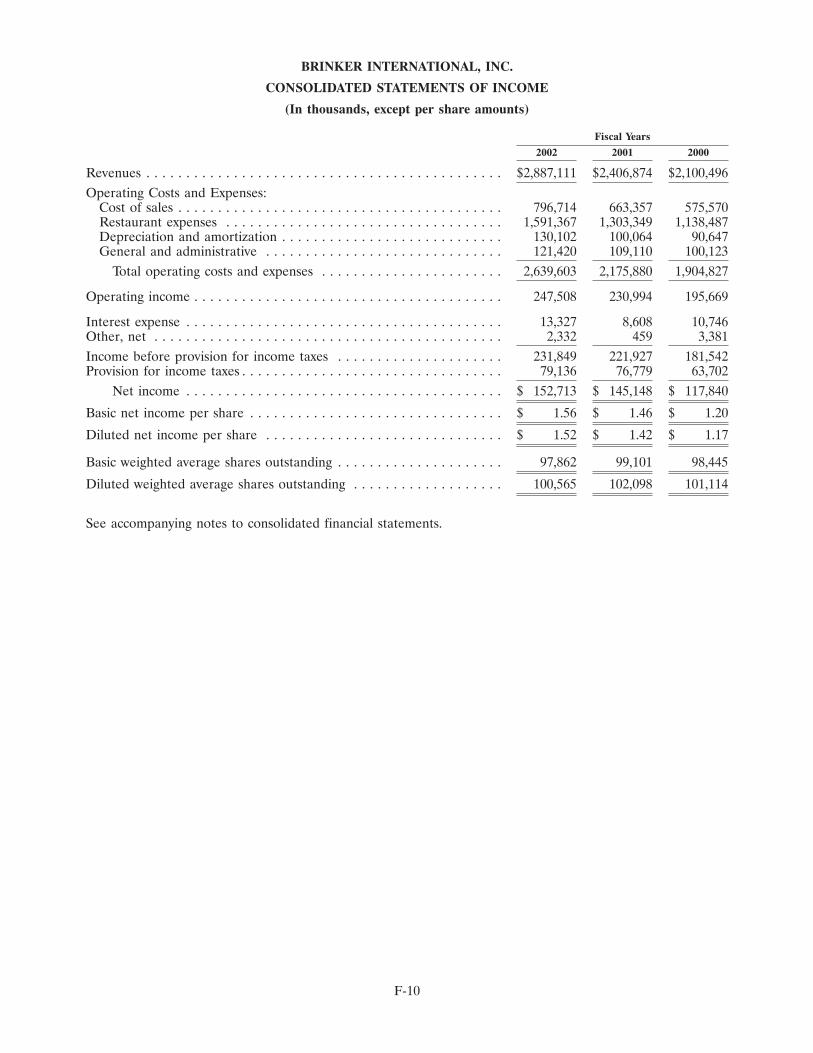
Revenues 2,887,111 2,406,874 2,100,496
Operating costs and expenses:
Cost of sales 796,714 663,357 575,570
Restaurant expenses 1,591,367 1,303,349 1,138,487
Depreciation and amortization 130,102 100,064 90,647
General and administrative 121,420 109,110 100,123
Total operating costs and expenses 2,639,603 2,175,880 1,904,827
Operating Income 247,508 230,994 195,669
Interest expense 13,327 8,608 10,746
Other, net 2,332 459 3,381
Income before provision for income taxes 231,849 221,927 181,542
Provision for income taxes 79,136 76,779 63,702
Net income $ 152,713 $ 145,148 $ 117,840
Basic net income per share $ 1.56 $ 1.46 $ 1.20
Diluted net income per share $ 1.52 $ 1.42 $ 1.17
Basic weighted average shares outstanding 97,862 99,101 98,445
Diluted weighted average shares outstanding 100,565 102,098 101,114
Number of Restaurants Revenues(in billions)
1998 1999 2000 2001 2002 1998
1.9
1268
1.5624 707 774
899
1039
1.82.1
2.4
2.9
2.3
2.7
3.0
3.4
1999 2000 2001 2002
11431038
933806
Company Operated Systemwide
ver the past year, we have witnessed a series of unbelievable
events that have profoundly affected our nation, our economy,
and our daily lives. As Americans, we have responded with
strength and optimism, demonstrating once more the indomitable spirit that defines
our way of life. As a company, Brinker International also faced a complex and shifting
landscape following these events. We have challenged and reexamined who we are
and where we are going, and we have confirmed that, even in an uncertain environ-
ment, our long-term game plan is strategically sound and remains intact. In short,
we’ve looked at the critical issues for the journey ahead and made the decision to
stay the course.
Taking the lessons learned from almost three decades of solid success, we’ve
focused our resources to maintain Brinker’s position as an innovative and dynamic
leader in our industry. More than ever, our guests are looking for satisfying social
interaction with family and friends in a relaxed atmosphere. As the world’s premier
casual dining company, we are committed to providing that enjoyable experience
and keeping dining options lively and on-trend. The key long-term drivers of
our business – consumer lifestyles, demographics, dual-income households, the
inconvenience of cooking at home, and the ever present time crunch – remain
relevant and hold true for the foreseeable future.
Brinker’s vibrant concept portfolio is exceptionally well positioned for the growth
and development of new restaurants – today and for the long haul. We’re proud to
stake our claim to the “casual side of casual dining,” and millions of guests clearly
To Our Shareholders, Employees, and Guests
5
O

6
Douglas H. Brooks
President and
Chief Operating Officer
Ronald A. McDougall
Chairman of the Board and
Chief Executive Officer
appreciate our modest price points. Our concept line-up is unmatched in both depth
and quality. Our dedicated, fully integrated concept management teams have great
leaders who combine vision with decisiveness and an entrepreneurial spirit. These
seasoned and passionate individuals continue to focus their attention on building the
equity of their individual restaurant brands. Each team is driven by a desire to
provide a consummate dining atmosphere and unparalleled service to every guest,
while exercising responsible fiscal stewardship systemwide. Established and emerging
concepts are refining their culinary cultures to deliver the optimum customer
experience in each of their competitive segments. We’re introducing our exciting
flavor profiles to an increasingly larger audience throughout the world, while
providing our shareholders with enhanced value and consistent performance.
Unwavering commitment from our staff to exceed expectations is what keeps
Brinker stable and at the forefront of our industry. And staying ahead of consumer
trends helps us keep loyal guests year after year.
In spite of all the extraordinary events that occurred, fiscal 2002 was an exceptional
year in terms of strong results along with several noteworthy milestones.
• Added 129 new restaurants, bringing our systemwide total to 1,268 units.
• Systemwide sales surpassed $3.4 billion.
• Honored as one of “America’s Most Admired Companies” by Fortune magazine.
• Acquired 39 Chili’s and future development rights in 11 states from a
franchise partner.
7

• Opened restaurants in 3 new countries – Taiwan, Qatar, and Oman – giving us a
presence in 22 countries.
• Romano’s Macaroni Grill won Restaurants & Institutions’ “Platinum Choice in
Chains” award for the fourth straight year.
• Opened a new Chili’s in Anchorage, Alaska, expanding our national presence
to 49 states.
• Received a Platinum Award from Forbes magazine as one of “America’s
Best Big Companies.”
• Stock price hit an all-time high.
These milestones have been accomplished by actively building on our success.
At Brinker we’re unwilling to rest on our laurels. Our innovative concept teams
constantly examine the fundamentals of their operations, looking for areas to
enhance our product offerings and service while satisfying the sophisticated tastes of
our guests. Targeted and disciplined expansion, stressing the basics while raising the
bar, building an infrastructure in pace with growth, cultivating a worldwide team of
talented and energetic employees, and adherence to integrity are among the key
elements that keep Brinker International proud of its achievements and enthusiastic
about the future.
We’re also proud to be part of a team that is committed to giving back to its
community and working together to benefit our neighbors. In fiscal 2002, our
restaurants participated in the national “Dine Out for America” program, donating
8
funds to those affected by the events of last fall. Each year, Brinker International
sponsors and operates The Pavilion at the Byron Nelson Golf Classic, donating the
proceeds to a number of charities including the Salesmanship Club, Texas Scottish
Rite Hospital for Children, and Limbs for Life. And our team members systemwide
contribute countless volunteer hours and fundraising efforts in support of local charities.
It’s an exciting time to be a part of Brinker International as we capitalize on
the tremendous momentum we’ve established. We will continue to adapt to the
challenging external landscape and maintain our uncompromising commitment to
quality, our growth strategy, and our shared vision. We have the right concepts, the
right leaders, and the right game plan. Individually strong, we’re unbeatable as a
team, and we’re determined to “stay the course.” We thank you, the shareholders,
employees, and guests, for placing your confidence in us as we move forward with
direction and purpose.
Douglas H. Brooks
President and
Chief Operating Officer
Ronald A. McDougall
Chairman of the Board and
Chief Executive Officer
9
With bold, unique flavors and a fun, high-energy atmosphere, Chili’s Grill & Bar® is
appealing to visitors in ever-increasing numbers. Expansion continues with more
restaurant openings than ever before and over five consecutive years of same-store
sales increases. We entered our 49th state, with record-breaking sales, in Anchorage,
Alaska, while Chili’s international representation increased to 22 countries with the
addition of venues in Qatar, Oman, and Taiwan. Our new prototypes are also
succeeding in untapped, smaller markets and high-traffic spots like airports and
regional malls, thus expanding the potential size of the Chili’s universe.
We’re building the Perfect Pepper with constant enhancement of our culinary focus
and marketing strategy. Our immediately recognizable has become the icon of
the Chili’s® brand, representing the heart and soul of the concept. And our Baby Back
Ribs jingle, given a new twist in advertising by *NSYNC and showing up unexpect-
edly in other high-profile media, is now firmly established in popular culture.
Chili’s is committed to providing our guests with new and exciting menu items
while keeping the sizzle of our Famous and Favorites such as Big Mouth Burgers,®
Baby Back Ribs, Fajitas, and the Presidente Margarita.® Convenience is another
aspect of fulfilling our goal of being the customer’s first choice in casual dining.
Chili’s To Go has become an integral part of our business, with the majority of our
locations equipped with dedicated areas and employees. If you’re on the run, we
make sure you can Get In. Get Out. Get On With Your Life.® Whether our guests enjoy
Chili’s Different, Delicious, and Distinctive food in our appealing and casual ambiance,
at home, or anywhere in between, Chili’s is always Like No Place Else.TM
10


The welcoming, old-world atmosphere of Romano’s Macaroni Grill®, filled with
the tastes and aromas of a traditional Italian kitchen, continues to charm guests in
markets large and small. Eighteen new restaurants opened this year, with 22
more planned in the coming year. Guests agree that our newest prototype reinforces
Macaroni Grill® as an all-occasion dining destination by providing a feeling of
greater warmth with reduced ambient noise and more booth seating. Our visitors
continue to be welcomed by our familiar fresh white gladiolas, string lights, and
open kitchens. The Chefs Make It. You Take It.® curbside delivery campaign has
introduced a tremendously successful way for our guests to experience authentic
Italian meals with family and friends at home.
Our distinctive chef-driven menu is developed with imported Italian ingredients
like olive oil, sun-dried tomatoes, balsamic vinegar, prosciutto, and Parmesan and
buffalo mozzarella cheese. A newly redesigned menu showcases favorites like the
Mama’s Trio and Spaghettini and Meatballs while featuring signature dishes like
Chicken Portobello and Filet Firenza. New selections such as the Chicken Florentine
Salad, Sole Parmigiano, Tuscan Lunch, and the popular Create Your Own Pasta have
been extremely well received. Guests can now enjoy more of our famous house
Chardonnay, Chianti, and White Zinfandel wines with the introduction of 1.5-
liter bottles served at their table on our signature honor program. Macaroni Grill
stimulates the creativity of our staff annually with a Chef’s Culinary Challenge and
vendor-sponsored “Passion of Italy” tours, which allow many of our managers and
chefs to experience firsthand the spirit of Italian culture and cuisine. Our success is
reflected in the receipt, for the fourth year in a row, of the Restaurants and Institutions’
“Platinum Choice in Chains” award. Clearly guests agree with our chefs, management,
and staff that at Romano’s Macaroni Grill, Life Is Delicious.TM
12


On The Border’s® unbeaten combination of classic Tex-Mex favorites and Mesquite-
Fired Fajitas paired with award-winning Margaritas in a colorful, fun atmosphere
brings our guests back again and again. We’re determined to win the revolution in
the Mexican casual dining market by focusing our efforts on enhancing the overall
guest experience. Our success is based on our menu, and we’ve concentrated on
improving favorite selections by expanding our fajita offerings and create-your-own
combos. Popular choices such as Quesadillas, Enchiladas, Fajitas, and our famous
Border Sampler have been augmented by new items like Salmon Mexicano,
Blackened Chicken Salad, and Carnitas. Our To Go service continues to expand with
dedicated entrances and service as guests discover the convenience and appeal of On
The Border. On The Go.TM We’ve brought our relaxed atmosphere and bold flavors to
new locations with the opening of 12 restaurants in the past year. And we’re
refining that atmosphere by employing rich, new colors, a bolder décor, and signage
featuring our new logo. Remodeling is now complete in Dallas and will encompass
72 more stores in the next year. In addition to physical changes, our latest advertising
campaign focused on the good times and good value to be shared at On The Border.
Excitement and energy, fun and flavor are the key elements of a festive experience
with family and friends. Enjoying the best in delicious Mexican favorites and lively
ambiance puts On The Border. Off The Map.®
14


Maggiano’s Little Italy® transports guests back to an earlier time, when families
shared bountiful platters of hearty fare and meals were celebrations of old-world
heritage prepared with care. At Maggiano’s,® rich oak paneling, white linens
atop red-checked tablecloths, fresh flowers, and a warm greeting at the door are
reminiscent of the genuine hospitality that was New York’s Little Italy in 1945.
Generous portions of delicious, time-honored family recipes are served family-style
in a vibrant yet comfortable setting distinctive enough to observe a special occasion
but casual enough to grab a meal after a ballgame. Ideal for weddings, business
functions, and any of life’s celebrations, Maggiano’s inviting banquet rooms evoke
the aura of an old-world club, individualized for our guests by our creative catering
specialists. Signature dishes such as Lasagna, Veal and Mushroom Cannelloni,
Rigatoni “D,”® Chicken Saltimbocca, Stuffed Mushrooms, and Maggiano’s Salad
exemplify our menu, complemented by a superb selection of wines and delectable
desserts like our scrumptious Vera’s Lemon Cookies and an award-winning Tiramisu.
The popularity of the Maggiano’s concept continues to grow with 5 new restaurants
opening in the year ahead. Most of our 20 locations offer carry-out meals for an
authentic Italian-American feast anywhere. At Maggiano’s, great and abundant food
is a shared experience, a love affair between all that is American and all that is
Italian. From authentic pasta to prime steaks and seafood, it’s prepared from scratch
– always robust and memorable. Whether our guests are planning a private party in
a lavishly appointed banquet room, a carry-out meal to enjoy at home, or a romantic
dinner for two in our elegantly lit dining room, they’re finding that There’s A Little
Italy Deep Inside Us All.
16

Pleasing the palate from sunup to sundown, the Corner Bakery CafeSM is serving
fresh and delicious breakfasts, sandwiches, salads, and sweets in neighborhoods and
destinations across the country. Our concept is uniquely adaptable to many locations,
from department stores to office buildings, train stations to suburban retail centers,
offering easy access to all the specialties that have earned Corner BakerySM tremendous
guest loyalty and frequency. Thirteen new restaurants brought the immediately
recognizable black-and-white-striped awning to locations in our existing markets;
plans are underway for 12 more openings in the coming year. Embracing all three
mealtimes and anything in between, we’re committed to providing a variety of
selections from down-home to decadent. Our menu is always being refined, with
additions like Pesto Cavatappi Pasta, Chicken Santa Fe Salad, and the Uptown
Turkey Sandwich joining our signature Panini and favorites like the Corner Combo
and Trio Salad. And, of course, convenience and ease are also central to Corner
Bakery’s mission as carry-out and catering continue to flourish. While guest
satisfaction remains the heart of our business, we’re also proud to be recognized by
our industry colleagues. This year, Corner Bakery Cafe was honored with People
Report’s “Top Achiever” award for management retention and diversity. Good people
working together to provide good food whenever and wherever it’s wanted is a
cornerstone to Corner Bakery’s success. Whether our guests are shopping, traveling,
feeding business associates or a party crowd, or looking for a quick snack or dinner
out, the Corner Bakery Cafe’s fresh and tasty selections will Feed the Day.TM
18

Cozymel’s Coastal GrillSM celebrates the rich culture, cuisine, and family traditions
of the Latin and Caribbean coasts in a lush, tropical ambiance. Distinctive sauces,
flavorful spices, grilled beef and chicken, slow-roasted pork, and fresh seafood recall
the resonant tastes and textures of tropical islands. The sights and smells of
Cozymel’s® open kitchens and swirling margarita machines promise an adventurous
dining experience with menu favorites such as our La Marina, Yucatan Especial, Roast
Pork Adobado, Paella, and signature fresh fish specials. Unique drink specialties like
Cozy On The Beach, the Maya Rita,TM the Cozyman Sampler, and Cuban Mojitos
add to the refreshing spirit of an island party. We’re continuing to explore the
delights of the tropics by testing new selections for our menu that blend the old-
and new-world culinary heritage of European settlers and ancient civilizations with
contemporary variations. Our new focus at Cozymel’s reflects the relaxed hospitality
of the Yucatan peninsula, the Bahamas, Cuba, and Jamaica. These cultures have
influenced the culinary direction of our menu and the innovative design of our new
prototype planned to open in Austin in the coming year. At Cozymel’s, we want our
guests to savor the atmosphere. They can sit back, relax, and enjoy the spirited,
friendly welcome, the lively island music, and the best dishes from some of the most
desirable locations in the world. If they close their eyes, they might just hear the
swaying palms and tumbling surf. Our guests can take their appetites on a trip to
Cozymel’s, where the experience is always Tropical. Not Typical.
20

At Big Bowl Asian Kitchen,SM distinctive and flavorful noodle and rice dishes
prepared in our open display kitchens blend centuries-old Asian cuisine with
contemporary, lighthearted fun. We’ve brought together the best Asian culinary tra-
ditions in our menu favorites such as Kung Pao and Lemon Chicken, Pad Thai, the
Ultimate Combo appetizer, and our You Choose interactive stir-fry bar. With so many
unique flavors to choose from, there is something for everyone at Big Bowl!®
Homemade Fresh Ginger Ginger Ale, a selection of teas and Asian beers, and
signature drinks such as our Mai Tai and the Golden Buddha Margarita provide a
refreshing complement. Hand-crafted sauces and condiments with fresh local and
seasonal produce demonstrate Big Bowl’s commitment to exceeding the expectations
of our visitors. Served in a festive, appealing, and casual ambiance of bamboo-shaded
lighting and honey maple wood, our unique and consistently delicious menu will
create an experience that guests will crave and crave often. Our newest prototype,
planned for implementation in the coming year, updates our exterior design and
signage, puts our stir-fry kitchen center stage, and sets up our island bar as a dis-
tinct destination within the restaurant. Our popular To Go entrances will continue
to be featured in the new design, providing convenient and tasty take-home options
for our customers. Annual family events like Noodlefest, Kidfest, and Chinese New
Year honor the Asian heritage of our culinary culture while establishing a series of
celebrations that will keep our guests coming back for more. A recent “Hot Concept
of the Year” award winner, Big Bowl has also been recognized both nationally and
locally for its child-friendly menu and atmosphere. The kids’ menu comes tucked
inside a Chinese carry-out carton containing a fortune cookie, toy, and children’s
chopsticks designed for young fingers. Appealing to all ages and for every occasion,
Big Bowl is Fresh Asian Cooking.
22

Rockfish Seafood Grill® presents delicious and unique seafood in a warm and lively
atmosphere. Whether surrounded by the rustic pine of a mountain fly-fishing
lodge or the sleek look reminiscent of a mahogany-planked powerboat, our guests
are enthusiastic about our open kitchens, distinctive menu, creative chefs, and
knowledgeable wait staff.
Our range of menu choices keeps diners coming back for more. Favorites like
our generous Shrimp Basket, Fish Tacos, Stuffed Fish, Rock-a-Rita Margarita,
18-ounce beer schooner, and award-winning Mexican Shrimp Martini are just a few
of the reasons why. We want our visitors to experiment with all we have to offer so
we give them lots of choices – from how their selection is prepared to a range of
blackboard specials created daily by our Chef Partners for each of their respective
restaurants. Kids are encouraged to try new things with our playful View–Master
children’s menu. And our concept is finding a warm welcome wherever we go. This
past year, Rockfish opened its 12th restaurant in Texas and recently opened its
first store outside of Texas near Phoenix in Chandler, Arizona. Our management
formula continues to prove its success with the recruitment of passionate and
entrepreneurial Chef Partners for 9 more openings in the coming year. We’re also
expanding our To Go service and introducing party platters at all locations to make
the Rockfish experience one our guests can share anywhere. Teamwork is the
driving force of our success and the cornerstone of our Rock Solid culture of Respect,
Attitude, Empowerment, and Integrity. At Rockfish, our staff is inspired and
challenged to exceed customers’ expectations and believe in their own power to
contribute to the realization of our goals. Great word of mouth from satisfied guests
has spurred our achievements and proven that when you provide fun, service, energy,
and outstanding food at affordable prices, Fish Happens.
24
®


Corporate Officers
Joseph A. Reeves, Jr.
Chairman of the Board &
Chief Executive Officer
Michael J. Mayell
President & Chief Operating Officer
James H. Shonsey
Vice President of Finance & Capital Markets
Lloyd V. DeLano
Vice President and Chief Accounting Officer
Joseph A. Reeves, Jr.
Chairman of the Board &
Chief Executive Officer
Michael J. Mayell
President & Chief Operating Officer
James H. Shonsey
Vice President of Finance & Capital Markets
Lloyd V. DeLano
Vice President and Chief Accounting Officer
Gary A. Messersmith
Partner, Fouts & Moore, L.L.P.
Jack A. Prizzi
President, Jack A. Prizzi & Co.
Investment and Financial Advisors
Michael J. Mayell
President & Chief Operating Officer
James T. Bond
General Manager of
H. L. Hawkins Jr. Oil and Gas
Joseph A. Reeves, Jr.
Chairman of the Board &
Chief Executive Officer
Michael J. Mayell
President & Chief Operating Officer
James T. Bond
General Manager of
H. L. Hawkins Jr. Oil and Gas
E. L. Henry
Partner, Adams & Reese
Joe E. Kares
Partner, Kares & Chilar
Gary A. Messersmith
Partner, Fouts & Moore, L.L.P.
Jack A. Prizzi
President, Jack A. Prizzi & Co.
Investment and Financial Advisors
Michael J. Mayell
President & Chief Operating Officer
James T. Bond
General Manager of
H. L. Hawkins Jr. Oil and Gas
E. L. Henry
Partner, Adams & Reese
Joe E. Kares
Partner, Kares & Chilar
Gary A. Messersmith
Partner, Fouts & Moore, L.L.P.
Jack A. Prizzi
President, Jack A. Prizzi & Co.
Investment and Financial Advisors
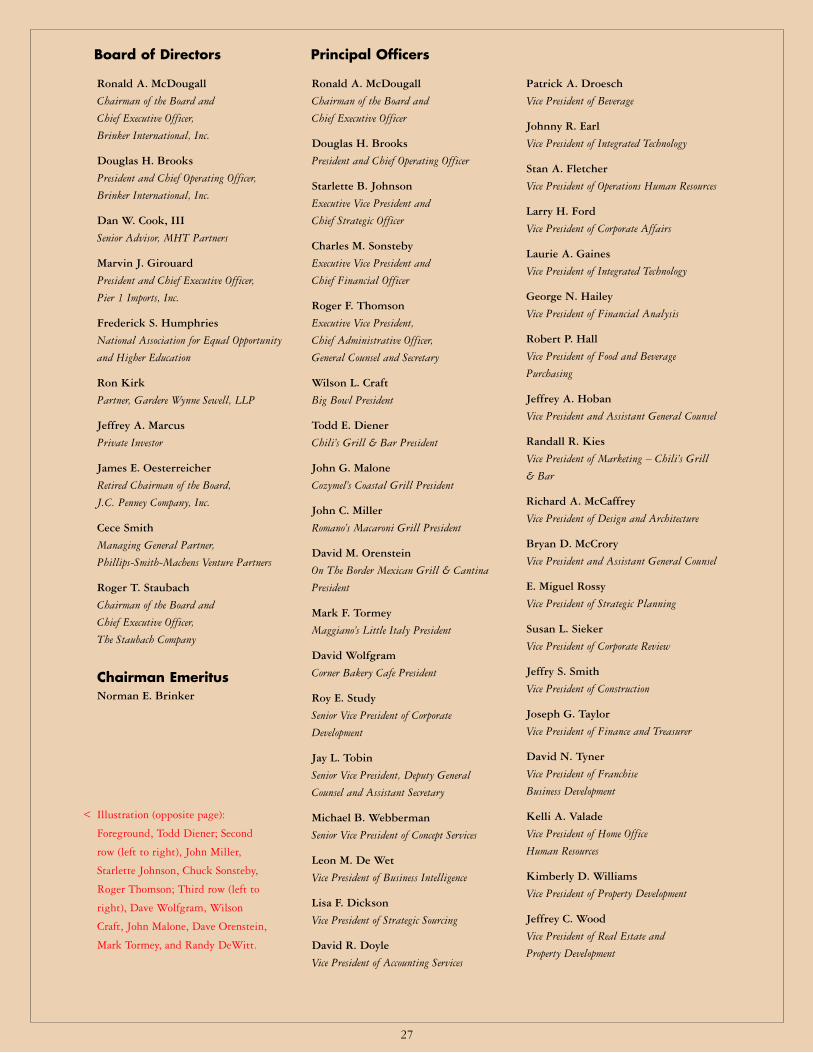
Ronald A. McDougall
Chairman of the Board and
Chief Executive Officer,
Brinker International, Inc.
Douglas H. Brooks
President and Chief Operating Officer,
Brinker International, Inc.
Dan W. Cook, III
Senior Advisor, MHT Partners
Marvin J. Girouard
President and Chief Executive Officer,
Pier 1 Imports, Inc.
Frederick S. Humphries
National Association for Equal Opportunity
and Higher Education
Ron Kirk
Partner, Gardere Wynne Sewell, LLP
Jeffrey A. Marcus
Private Investor
James E. Oesterreicher
Retired Chairman of the Board,
J.C. Penney Company, Inc.
Cece Smith
Managing General Partner,
Phillips-Smith-Machens Venture Partners
Roger T. Staubach
Chairman of the Board and
Chief Executive Officer,
The Staubach Company
Chairman EmeritusNorman E. Brinker
Ronald A. McDougall
Chairman of the Board and
Chief Executive Officer
Douglas H. Brooks
President and Chief Operating Officer
Starlette B. Johnson
Executive Vice President and
Chief Strategic Officer
Charles M. Sonsteby
Executive Vice President and
Chief Financial Officer
Roger F. Thomson
Executive Vice President,
Chief Administrative Officer,
General Counsel and Secretary
Wilson L. Craft
Big Bowl President
Todd E. Diener
Chili’s Grill & Bar President
John G. Malone
Cozymel’s Coastal Grill President
John C. Miller
Romano’s Macaroni Grill President
David M. Orenstein
On The Border Mexican Grill & Cantina
President
Mark F. Tormey
Maggiano’s Little Italy President
David Wolfgram
Corner Bakery Cafe President
Roy E. Study
Senior Vice President of Corporate
Development
Jay L. Tobin
Senior Vice President, Deputy General
Counsel and Assistant Secretary
Michael B. Webberman
Senior Vice President of Concept Services
Leon M. De Wet
Vice President of Business Intelligence
Lisa F. Dickson
Vice President of Strategic Sourcing
David R. Doyle
Vice President of Accounting Services
Patrick A. Droesch
Vice President of Beverage
Johnny R. Earl
Vice President of Integrated Technology
Stan A. Fletcher
Vice President of Operations Human Resources
Larry H. Ford
Vice President of Corporate Affairs
Laurie A. Gaines
Vice President of Integrated Technology
George N. Hailey
Vice President of Financial Analysis
Robert P. Hall
Vice President of Food and Beverage
Purchasing
Jeffrey A. Hoban
Vice President and Assistant General Counsel
Randall R. Kies
Vice President of Marketing – Chili’s Grill
& Bar
Richard A. McCaffrey
Vice President of Design and Architecture
Bryan D. McCrory
Vice President and Assistant General Counsel
E. Miguel Rossy
Vice President of Strategic Planning
Susan L. Sieker
Vice President of Corporate Review
Jeffry S. Smith
Vice President of Construction
Joseph G. Taylor
Vice President of Finance and Treasurer
David N. Tyner
Vice President of Franchise
Business Development
Kelli A. Valade
Vice President of Home Office
Human Resources
Kimberly D. Williams
Vice President of Property Development
Jeffrey C. Wood
Vice President of Real Estate and
Property Development
Board of Directors Principal Officers
27
Illustration (opposite page):
Foreground, Todd Diener; Second
row (left to right), John Miller,
Starlette Johnson, Chuck Sonsteby,
Roger Thomson; Third row (left to
right), Dave Wolfgram, Wilson
Craft, John Malone, Dave Orenstein,
Mark Tormey, and Randy DeWitt.
<

CHILI’S GRILL & BAR
Todd E. Diener
President
Scott D. Nietschmann
Senior Vice President and
Chief Operating Officer
Larry J. Lindsey
Senior Vice President of Operations
John T. McGlone
Senior Vice President of Operations
Jan M. Barr
Vice President of Human Resources
Jon B. Burgin
Vice President and Assistant General Counsel
Randall R. Kies
Vice President of Marketing
Brian J. Kolodziej
Vice President of Culinary Operations
Tommy A. Lee
Vice President of Business Analysis
Theodore V. Leovich
Vice President of Franchise Operations
Robert J. Murphy
Vice President of New Market Development
Joseph A. Mutti
Vice President of Concept Development
Vickie D. Parker
Vice President of Training
MAGGIANO’S LITTLE ITALY
Mark F. Tormey
President and Chief Operating Officer
Jonathan A. Fox
Senior Vice President of Beverage and
Culinary Development
Yorgo Koutsogiorgas
Senior Vice President of Human Resources
ROMANO’S MACARONI GRILL
John C. Miller
President
David C. Schmille
Senior Vice President and
Chief Operating Officer
Dale A. Goss
Vice President of Concept Development
Diana L. Hovey
Vice President of Marketing
Jennifer A. Percival
Vice President of Human Resources
and Training
Bruce K. Ballard
Regional Vice President of Operations
William J. Richardson
Regional Vice President of Operations
ON THE BORDER MEXICAN GRILL & CANTINA
David M. Orenstein
President
Krista M. Gibson
Vice President of Marketing
Lisa S. Warren
Vice President of Concept Development
CORNER BAKERY CAFE
David Wolfgram
President and Chief Operating Officer
Nancy L. Hampton
Vice President of Marketing
Riccardo R. Scicchitano
Vice President of Food and Beverage
James D. Vinz
Vice President of Operations
COZYMEL’S COASTAL GRILL
John G. Malone
President
BIG BOWL
Wilson L. Craft
President
Matthew P. McMillin
Vice President of Culinary Operations
Ginna Shannon
Vice President of Operations
Dan A. Ormond
Regional Vice President of Operations
ROCKFISH SEAFOOD GRILL
Randall M. DeWitt
President
Timothy G. Fox
Vice President of Development
Clay D. McAfee
Vice President of Operations
Kenneth S. Bowers
Executive Chef
IN MEMORIAM
Kenny Dennis 1953-2002
On August 5, 2002, our beloved Kenny
Dennis lost his courageous battle with brain
cancer. For 26 years, Kenny, President of On
The Border, brought a tremendous “can do”
attitude and love of life to work everyday. A
remarkable leader, partner, and colleague,
Kenny was also a wonderful friend, husband,
and father. He found a place in his heart for
everyone he came in contact with. His influ-
ence will always be felt by those who knew
and loved him – he will be deeply missed.
Principal Officers In Restaurant Concepts
28

Shareholder Information
Executive Offices Brinker International, Inc. 6820 LBJ Freeway Dallas, TX 75240
Annual Meeting Thursday, November 14, 2002 at 10:00 a.m.At the Westin Park Central Hotel (Grand Ballroom, Salons A, B, and C) 12720 Merit Drive Dallas, TX 75251
Stock Transfer Agent and Registrar Mellon Investor Services LLC 85 Challenger Road Ridgefield Park, NJ 07660 Customer Service (800) 635-9270 TDD for Hearing Impaired (800) 231-5469 www.melloninvestor.com
NYSE Symbol: EAT
AuditorsKPMG LLP 200 Crescent Court, Suite 300 Dallas, TX 75201-1885
10-K Availability The Company will furnish to any shareholder, without charge, a copy of the Company'sannual report filed with the Securities and Exchange Commission on Form 10-K for the 2002 fiscal year upon written request from the shareholder addressed to:
Secretary/Investor Relations Brinker International, Inc. 6820 LBJ Freeway Dallas, TX 75240 (972)980-9917www.brinker.com
Chili's Grill & Bar, Romano's Macaroni Grill, Cozymel's Coastal Grill, On The Border Mexican Grill & Cantina, Maggiano's Little Italy, Big Bowl Asian Kitchen, and Corner Bakery Cafe are registered and/or proprietary trademarks of Brinker Restaurant Corporation. Rockfish Seafood Grill is a registered trademark of Rockfisb, L.P.
hijklFINANCIAL INFORMATION
INDEX TO FINANCIAL STATEMENTS
Page
Selected Financial Data . . . . . . . . . . . . . . . . . . . . . . . . . . . . . . . . . . . . . . . . . . . . . . . . . . . . . . . . . . F-1
Management’s Discussion and Analysis of Financial Condition and Results of Operations . . . . . . . . . . F-2
Consolidated Statements of Income—Fiscal Years Ended June 26, 2002, June 27, 2001, and June 28,2000 . . . . . . . . . . . . . . . . . . . . . . . . . . . . . . . . . . . . . . . . . . . . . . . . . . . . . . . . . . . . . . . . . . . . . . F-10
Consolidated Balance Sheets—June 26, 2002 and June 27, 2001 . . . . . . . . . . . . . . . . . . . . . . . . . . . . . F-11
Consolidated Statements of Shareholders’ Equity—Fiscal Years Ended June 26, 2002, June 27, 2001,and June 28, 2000 . . . . . . . . . . . . . . . . . . . . . . . . . . . . . . . . . . . . . . . . . . . . . . . . . . . . . . . . . . . . F-12
Consolidated Statements of Cash Flows—Fiscal Years Ended June 26, 2002, June 27, 2001, andJune 28, 2000 . . . . . . . . . . . . . . . . . . . . . . . . . . . . . . . . . . . . . . . . . . . . . . . . . . . . . . . . . . . . . . . F-13
Notes to Consolidated Financial Statements . . . . . . . . . . . . . . . . . . . . . . . . . . . . . . . . . . . . . . . . . . . F-14
Independent Auditors’ Report . . . . . . . . . . . . . . . . . . . . . . . . . . . . . . . . . . . . . . . . . . . . . . . . . . . . . F-27
Management’s Responsibility for Consolidated Financial Statements . . . . . . . . . . . . . . . . . . . . . . . . . . F-28
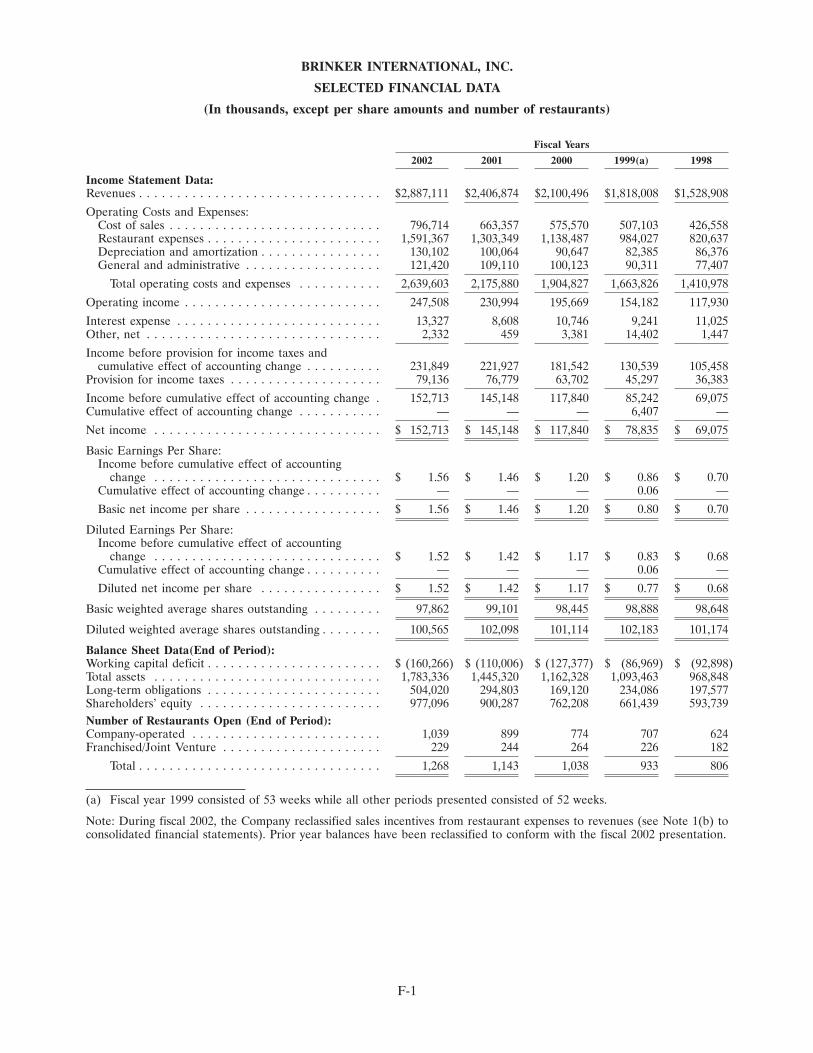
BRINKER INTERNATIONAL, INC.
SELECTED FINANCIAL DATA
(In thousands, except per share amounts and number of restaurants)
Fiscal Years
2002 2001 2000 1999(a) 1998
Income Statement Data:Revenues . . . . . . . . . . . . . . . . . . . . . . . . . . . . . . . . $2,887,111 $2,406,874 $2,100,496 $1,818,008 $1,528,908
Operating Costs and Expenses:Cost of sales . . . . . . . . . . . . . . . . . . . . . . . . . . . . 796,714 663,357 575,570 507,103 426,558Restaurant expenses . . . . . . . . . . . . . . . . . . . . . . . 1,591,367 1,303,349 1,138,487 984,027 820,637Depreciation and amortization . . . . . . . . . . . . . . . . 130,102 100,064 90,647 82,385 86,376General and administrative . . . . . . . . . . . . . . . . . . 121,420 109,110 100,123 90,311 77,407
Total operating costs and expenses . . . . . . . . . . . 2,639,603 2,175,880 1,904,827 1,663,826 1,410,978
Operating income . . . . . . . . . . . . . . . . . . . . . . . . . . 247,508 230,994 195,669 154,182 117,930
Interest expense . . . . . . . . . . . . . . . . . . . . . . . . . . . 13,327 8,608 10,746 9,241 11,025Other, net . . . . . . . . . . . . . . . . . . . . . . . . . . . . . . . 2,332 459 3,381 14,402 1,447
Income before provision for income taxes andcumulative effect of accounting change . . . . . . . . . . 231,849 221,927 181,542 130,539 105,458
Provision for income taxes . . . . . . . . . . . . . . . . . . . . 79,136 76,779 63,702 45,297 36,383
Income before cumulative effect of accounting change . 152,713 145,148 117,840 85,242 69,075Cumulative effect of accounting change . . . . . . . . . . . — — — 6,407 —
Net income . . . . . . . . . . . . . . . . . . . . . . . . . . . . . . $ 152,713 $ 145,148 $ 117,840 $ 78,835 $ 69,075
Basic Earnings Per Share:Income before cumulative effect of accounting
change . . . . . . . . . . . . . . . . . . . . . . . . . . . . . . $ 1.56 $ 1.46 $ 1.20 $ 0.86 $ 0.70Cumulative effect of accounting change . . . . . . . . . . — — — 0.06 —
Basic net income per share . . . . . . . . . . . . . . . . . . $ 1.56 $ 1.46 $ 1.20 $ 0.80 $ 0.70
Diluted Earnings Per Share:Income before cumulative effect of accounting
change . . . . . . . . . . . . . . . . . . . . . . . . . . . . . . $ 1.52 $ 1.42 $ 1.17 $ 0.83 $ 0.68Cumulative effect of accounting change . . . . . . . . . . — — — 0.06 —
Diluted net income per share . . . . . . . . . . . . . . . . $ 1.52 $ 1.42 $ 1.17 $ 0.77 $ 0.68
Basic weighted average shares outstanding . . . . . . . . . 97,862 99,101 98,445 98,888 98,648
Diluted weighted average shares outstanding . . . . . . . . 100,565 102,098 101,114 102,183 101,174
Balance Sheet Data(End of Period):Working capital deficit . . . . . . . . . . . . . . . . . . . . . . . $ (160,266) $ (110,006) $ (127,377) $ (86,969) $ (92,898)Total assets . . . . . . . . . . . . . . . . . . . . . . . . . . . . . . 1,783,336 1,445,320 1,162,328 1,093,463 968,848Long-term obligations . . . . . . . . . . . . . . . . . . . . . . . 504,020 294,803 169,120 234,086 197,577Shareholders’ equity . . . . . . . . . . . . . . . . . . . . . . . . 977,096 900,287 762,208 661,439 593,739Number of Restaurants Open (End of Period):Company-operated . . . . . . . . . . . . . . . . . . . . . . . . . 1,039 899 774 707 624Franchised/Joint Venture . . . . . . . . . . . . . . . . . . . . . 229 244 264 226 182
Total . . . . . . . . . . . . . . . . . . . . . . . . . . . . . . . . 1,268 1,143 1,038 933 806
(a) Fiscal year 1999 consisted of 53 weeks while all other periods presented consisted of 52 weeks.
Note: During fiscal 2002, the Company reclassified sales incentives from restaurant expenses to revenues (see Note 1(b) toconsolidated financial statements). Prior year balances have been reclassified to conform with the fiscal 2002 presentation.
F-1
MANAGEMENT’S DISCUSSION AND ANALYSIS OFFINANCIAL CONDITION AND RESULTS OF OPERATIONS
GENERAL
For an understanding of the significant factors that influenced the performance of BrinkerInternational, Inc. (the ‘‘Company’’) during the past three fiscal years, the following discussion should be read inconjunction with the consolidated financial statements and related notes found elsewhere in this annual report.
The Company has a 52/53 week fiscal year ending on the last Wednesday in June. Fiscal years 2002, 2001 and2000, which ended on June 26, 2002, June 27, 2001 and June 28, 2000, respectively, each contained 52 weeks.
RESULTS OF OPERATIONS FOR FISCAL YEARS 2002, 2001, AND 2000
The following table sets forth expenses as a percentage of total revenues for the periods indicated forrevenue and expense items included in the consolidated statements of income:
Percentage of Total RevenuesFiscal Years
2002 2001 2000
Revenues . . . . . . . . . . . . . . . . . . . . . . . . . . . . . . . . . . . . . . . . . . . . . . . . . . . 100.0% 100.0% 100.0%
Operating Costs and Expenses:Cost of sales . . . . . . . . . . . . . . . . . . . . . . . . . . . . . . . . . . . . . . . . . . . . . . . 27.6% 27.6% 27.4%Restaurant expenses . . . . . . . . . . . . . . . . . . . . . . . . . . . . . . . . . . . . . . . . . . 55.1% 54.1% 54.2%Depreciation and amortization . . . . . . . . . . . . . . . . . . . . . . . . . . . . . . . . . . 4.5% 4.2% 4.3%General and administrative . . . . . . . . . . . . . . . . . . . . . . . . . . . . . . . . . . . . . 4.2% 4.5% 4.8%
Total operating costs and expenses . . . . . . . . . . . . . . . . . . . . . . . . . . . . . . 91.4% 90.4% 90.7%
Operating income . . . . . . . . . . . . . . . . . . . . . . . . . . . . . . . . . . . . . . . . . . . . . 8.6% 9.6% 9.3%
Interest expense . . . . . . . . . . . . . . . . . . . . . . . . . . . . . . . . . . . . . . . . . . . . . . . 0.5% 0.4% 0.5%Other, net . . . . . . . . . . . . . . . . . . . . . . . . . . . . . . . . . . . . . . . . . . . . . . . . . . . 0.1% — 0.2%
Income before provision for income taxes . . . . . . . . . . . . . . . . . . . . . . . . . . . . 8.0% 9.2% 8.6%Provision for income taxes . . . . . . . . . . . . . . . . . . . . . . . . . . . . . . . . . . . . . . . 2.7% 3.2% 3.0%
Net income . . . . . . . . . . . . . . . . . . . . . . . . . . . . . . . . . . . . . . . . . . . . . . . 5.3% 6.0% 5.6%
REVENUES
Revenue growth of 20.0% and 14.6% in fiscal 2002 and 2001, respectively, was attributable primarily to theincreases in sales weeks driven by new unit expansion, acquisitions of units from former franchise partners andincreases in comparable store sales. Revenues for fiscal 2002 increased due to a 19.1% increase in sales weeksand a 1.5% increase in comparable store sales. Revenues for fiscal 2001 increased due to a 9.9% increase in salesweeks and a 4.4% increase in comparable store sales. Menu price increases were 1.8% and 2.2% in fiscal 2002and 2001, respectively.
COSTS AND EXPENSES (as a Percent of Revenues)
Cost of sales remained flat for fiscal 2002 due to unfavorable commodity price variances for dairy and cheeseand product mix changes to menu items with higher percentage food costs, offset by menu price increases andfavorable commodity price variances for seafood. Cost of sales increased for fiscal 2001 due to unfavorablecommodity price variances for beef and seafood, produce, and beverages and product mix changes to menu itemswith higher percentage food costs. These unfavorable variances were partially offset by menu price increases andfavorable commodity price variances for other commodities.
Restaurant expenses increased in fiscal 2002 due primarily to an approximate $11.0 million expense relatedto the settlement of certain California labor law issues, an approximate $8.7 million impairment charge related tothe write-off of a portion of the notes receivable from Eatzi’s Corporation, and increased labor wage rates. These
F-2

MANAGEMENT’S DISCUSSION AND ANALYSIS OFFINANCIAL CONDITION AND RESULTS OF OPERATIONS
increases were partially offset by increased sales leverage and menu price increases. Restaurant expensesdecreased in fiscal 2001 due primarily to increased sales leverage, menu price increases, and labor productivitygains, but were partially offset by increased labor wage rates and utility costs.
Depreciation and amortization increased in fiscal 2002 due primarily to new unit construction, ongoingremodel costs, the acquisition of previously leased equipment and certain real estate assets, and restaurantsacquired during fiscal 2002 and 2001. These increases were partially offset by increased sales leverage, a decliningdepreciable asset base for older units, and the elimination of goodwill and certain other intangibles amortizationin accordance with Statement of Financial Accounting Standards (‘‘SFAS’’) No. 142. Depreciation andamortization decreased in fiscal 2001 due primarily to increased sales leverage, utilization of equipment leasingfacilities, and a declining depreciable asset base for older units. Partially offsetting these decreases were increasesin depreciation and amortization related to new unit construction, ongoing remodel costs and restaurantsacquired during fiscal 2001.
General and administrative expenses decreased in fiscal 2002 and fiscal 2001 as compared to the respectiveprior fiscal years as a result of the Company’s continued focus on controlling corporate expenditures relative toincreasing revenues and increased sales leverage resulting from new unit openings and acquisitions.
Interest expense increased for fiscal 2002 as compared to fiscal 2001 as a result of amortization of debtissuance costs and debt discounts on the Company’s $431.7 million convertible debt. These increases werepartially offset by lower interest rates on floating rate debt, a decrease in interest expense on senior notes due toa scheduled repayment, and an increase in interest capitalization related to new restaurant construction activity.Interest expense decreased for fiscal 2001 as compared to fiscal 2000 as a result of decreased average borrowingsand interest rates on the Company’s credit facilities, increased sales leverage, and a decrease in interest expenseon senior notes due to a scheduled repayment. These decreases were partially offset by a decrease in theconstruction-in-progress balances subject to interest capitalization and an increase in borrowings related torestaurants acquired.
Other, net increased in fiscal 2002 as compared to fiscal 2001 due to a decrease in the market value of theCompany’s savings plan investments which are used to offset the savings plan obligation, partially offset by areduction in the Company’s share of losses in equity method investees. Other, net decreased in fiscal 2001 as aresult of a reduction in the Company’s share of losses in equity method investees, caused in part by theacquisition of the remaining interest in the Big Bowl restaurant concept, which is now consolidated in theaccompanying financial statements, and the sale of the Wildfire restaurant concept.
INCOME TAXES
The Company’s effective income tax rate was 34.1%, 34.6%, and 35.1% in fiscal 2002, 2001, and 2000,respectively. The decrease in fiscal 2002 is primarily due to the elimination of goodwill amortization inaccordance with SFAS No. 142 and a decrease in the effective state tax rates. The decrease in fiscal 2001 is due tothe receipt of a tax credit refund.
NET INCOME AND NET INCOME PER SHARE
Fiscal 2002 net income and diluted net income per share increased 5.2% and 7.0%, respectively, comparedto fiscal 2001. Excluding the after-tax effects of the California labor law settlement ($7.3 million) and Eatzi’simpairment charge ($5.8 million), net income and diluted net income per share increased for fiscal 2002 by14.3% and 16.2%, respectively, compared to fiscal 2001. The increase in both net income and diluted net incomeper share, excluding the one-time charges, was primarily due to increasing revenues driven by increases in salesweeks and comparable store sales, decreases in general and administrative expenses and the elimination ofgoodwill amortization, partially offset by increases in restaurant expenses and depreciation and amortization as apercent of revenues.
Fiscal 2001 net income and diluted net income per share increased 23.2% and 21.4%, respectively,compared to fiscal 2000. The increase in both net income and diluted net income per share was primarily due toincreasing revenues driven by increases in comparable store sales and sales weeks and decreases in restaurant
F-3
MANAGEMENT’S DISCUSSION AND ANALYSIS OFFINANCIAL CONDITION AND RESULTS OF OPERATIONS
expenses, depreciation and amortization expenses, and general and administrative expenses as a percent ofrevenues.
IMPACT OF INFLATION
The Company has not experienced a significant overall impact from inflation. As operating expensesincrease, the Company, to the extent permitted by competition, recovers increased costs through a combinationof menu price increases and reviewing, then implementing, alternative products or processes.
LIQUIDITY AND CAPITAL RESOURCES
The working capital deficit increased from $110.0 million at June 27, 2001 to $160.3 million at June 26, 2002,and net cash provided by operating activities increased from $246.8 million for fiscal 2001 to $390.0 million forfiscal 2002 due primarily to the timing of operational receipts and payments. The Company believes that itsvarious sources of capital, including availability under existing credit facilities and cash flow from operatingactivities, are adequate to finance operations as well as the repayment of current debt obligations.
Long-term debt outstanding at June 26, 2002 consisted of $255.0 million of zero coupon convertible seniordebentures ($431.7 million principal less $176.7 million representing an unamortized debt discount),$46.0 million of unsecured senior notes ($42.8 million principal plus $3.2 million representing the effect ofchanges in interest rates on the fair value of the debt), $43.5 million in assumed debt related to the acquisition ofrestaurants from a former franchise partner ($38.8 million principal plus $4.7 million representing a debtpremium), $35.0 million in assumed capital lease obligations related to the acquisition of restaurants from aformer franchise partner ($19.5 million principal plus $15.5 million representing a debt premium), $63.5 millionof borrowings on credit facilities, and obligations under other capital leases. The Company has credit facilitiestotaling $375.0 million. At June 26, 2002, the Company had $311.5 million in available funds from these facilities.
In October 2001, the Company issued $431.7 million of zero coupon convertible senior debentures andreceived proceeds totaling approximately $250.0 million. The Company used the proceeds for repayment ofexisting indebtedness, restaurant acquisitions, purchases of outstanding common stock under the Company’sstock repurchase plan and for general corporate purposes.
In July 2001, the Company made a $12.3 million capital contribution to Rockfish Seafood Grill (‘‘Rockfish’’)in exchange for an approximate 40% ownership interest in the legal entities owning and developing Rockfish.Additionally, in June and November 2001, the Company acquired three On The Border and thirty-nine Chili’srestaurants from its franchise partners Hal Smith and Sydran, respectively, for $60.5 million. The Companyfinanced these acquisitions through existing credit facilities, the zero coupon convertible senior debentures andcash provided by operations.
In February 2002, the Company acquired the remaining assets leased under its $80.0 million equipmentleasing facilities and $75.0 million real estate leasing facility for $36.2 million and $56.8 million, respectively, andterminated the leasing arrangements. The acquisitions were primarily funded by utilizing amounts availableunder existing credit facilities.
Capital expenditures consist of purchases of land for future restaurant sites, the cost of new restaurantconstruction, purchases of new and replacement restaurant furniture and equipment, the acquisition ofpreviously leased equipment and real estate assets, and ongoing remodeling programs. Capital expenditures, netof amounts funded under the respective equipment and real estate leasing facilities, were $371.1 million for fiscal2002 compared to $205.2 million for fiscal 2001. The increase is due primarily to the acquisition of the remainingassets leased under the equipment and real estate leasing facilities and an increase in the number of new storeopenings. The Company estimates that its fiscal 2003 capital expenditures will approximate $335.0 million. Thesecapital expenditures will be funded primarily from operations and existing credit facilities.
The Board of Directors authorized an increase in the stock repurchase plan of $100.0 million in August 2001and an additional $100.0 million in April 2002, bringing the Company’s total share repurchase program to$410.0 million. Pursuant to the Company’s stock repurchase plan, approximately 5.1 million shares of its common
F-4
MANAGEMENT’S DISCUSSION AND ANALYSIS OFFINANCIAL CONDITION AND RESULTS OF OPERATIONS
stock were repurchased for $136.1 million during fiscal 2002. As of June 26, 2002, approximately 16.0 millionshares had been repurchased for $327.6 million under the stock repurchase plan. The Company repurchasescommon stock to offset the dilutive effect of stock option exercises, satisfy obligations under its savings plans, andfor other corporate purposes. The repurchased common stock is reflected as a reduction of shareholders’ equity.The Company financed the repurchase program through a combination of cash provided by operations,drawdowns on its available credit facilities and the issuance of the zero coupon convertible senior debentures.
In August 2002, the Company entered into a letter of intent with Philip J. Romano and Eatzi’s Corporationto divest its interest in the Eatzi’s concept. As a result, an approximate $8.7 million impairment charge wasrecorded reducing the Eatzi’s notes receivable to $11.0 million. The Company expects to collect the remainingbalance of the notes in the second quarter of fiscal 2003.
The Company is not aware of any other event or trend which would potentially affect its liquidity. In theevent such a trend develops, the Company believes that there are sufficient funds available under its creditfacilities and from its strong internal cash generating capabilities to adequately manage the expansion of thebusiness.
QUANTITATIVE AND QUALITATIVE DISCLOSURES ABOUT MARKET RISK
The Company is exposed to market risk from changes in interest rates on debt and certain leasing facilitiesand from changes in commodity prices. A discussion of the Company’s accounting policies for derivativeinstruments is included in the summary of significant accounting policies in the notes to the consolidatedfinancial statements.
The Company may from time to time utilize interest rate swaps to manage overall borrowing costs andreduce exposure to adverse fluctuations in interest rates. The Company does not use derivative instruments fortrading purposes and has procedures in place to monitor and control derivative use.
The Company is exposed to interest rate risk on short-term and long-term financial instruments carryingvariable interest rates. The Company’s variable rate financial instruments, including the outstanding borrowingsof credit facilities and notional amounts of interest rate swaps, totaled $224.1 million at June 26, 2002. Theimpact on the Company’s annual results of operations of a one-point interest rate change on the outstandingbalance of these variable rate financial instruments as of June 26, 2002 would be approximately $2.2 million.
The Company purchases certain commodities such as beef, chicken, flour, and cooking oil. Thesecommodities are generally purchased based upon market prices established with vendors. These purchasearrangements may contain contractual features that limit the price paid by establishing certain price floors orcaps. The Company does not use financial instruments to hedge commodity prices because these purchasearrangements help control the ultimate cost paid and any commodity price aberrations are generally short termin nature.
This market risk discussion contains forward-looking statements. Actual results may differ materially fromthis discussion based upon general market conditions and changes in domestic and global financial markets.
CRITICAL ACCOUNTING POLICIES
Our significant accounting policies are disclosed in Note 1 to our consolidated financial statements. Thefollowing discussion addresses our most critical accounting policies, which are those that are most important tothe portrayal of our financial condition and results, and that require significant judgment.
Property and Equipment
Property and equipment are depreciated on a straight-line basis over the estimated useful lives of the assets.The useful lives of the assets are based upon the Company’s expectations for the period of time that the asset willbe used to generate revenue. The Company periodically reviews the assets for changes in circumstances whichmay impact their useful lives.
F-5

MANAGEMENT’S DISCUSSION AND ANALYSIS OFFINANCIAL CONDITION AND RESULTS OF OPERATIONS
Impairment of Long-Lived Assets
The Company reviews property and equipment for impairment when events or circumstances indicate itmight be impaired. The Company tests impairment using historical cash flows and other relevant facts andcircumstances as the primary basis for its estimates of future cash flows. This process requires the use ofestimates and assumptions which are subject to a high degree of judgment. In addition, at least annually theCompany assesses the recoverability of goodwill and other intangible assets related to its restaurant concepts.These impairment tests require the Company to estimate fair values of its restaurant concepts by makingassumptions regarding future cash flows and other factors. If these assumptions change in the future, theCompany may be required to record impairment charges for these assets.
Financial Instruments
The Company enters into interest rate swaps to manage fluctuations in interest expense and to maintain thevalue of fixed-rate debt. The fair value of these swaps is estimated using widely accepted valuation methods. Thevaluation of derivatives involves considerable judgment, including estimates of future interest rate curves.Changes in those estimates may materially affect the value of the Company’s derivatives.
Self-Insurance
The Company is self-insured for certain losses related to general liability and workers’ compensation. TheCompany maintains stop loss coverage with third party insurers to limit its total exposure. The self-insuranceliability represents an estimate of the ultimate cost of claims incurred as of the balance sheet date. The estimatedliability is not discounted and is established based upon analysis of historical data and actuarial estimates, and isreviewed by the Company on a quarterly basis to ensure that the liability is appropriate. If actual trends,including the severity or frequency of claims, differ from our estimates, our financial results could be impacted.
RECENT ACCOUNTING PRONOUNCEMENTS
In August 2001, the Financial Accounting Standards Board (‘‘FASB’’) issued SFAS No. 144, ‘‘Accounting forthe Impairment or Disposal of Long-Lived Assets.’’ This statement supersedes SFAS No. 121, ‘‘Accounting forthe Impairment of Long-Lived Assets and for Long-Lived Assets to be Disposed Of’’ and the accounting andreporting provisions of Accounting Principles Board Opinion No. 30, ‘‘Reporting the Results of Operations—Reporting the Effects of Disposal of a Segment of a Business, and Extraordinary, Unusual and InfrequentlyOccurring Events and Transactions.’’ SFAS No. 144 retains the fundamental provisions of SFAS No. 121, buteliminates the requirement to allocate goodwill to long-lived assets to be tested for impairment. This statementalso requires discontinued operations to be carried at the lower of cost or fair value less costs to sell andbroadens the presentation of discontinued operations to include a component of an entity rather than a segmentof a business. SFAS No. 144 is effective for fiscal years beginning after December 15, 2001, and interim periodswithin those fiscal years, with early application encouraged. The Company will adopt SFAS No. 144 in the firstquarter of fiscal 2003 and does not expect the adoption of this statement to have a material impact on its resultsof operations or financial position.
In June 2002, the FASB issued SFAS No. 146, ‘‘Accounting for Costs Associated with Exit or DisposalActivities.’’ SFAS No. 146 supersedes Emerging Issues Task Force (‘‘EITF’’) No. 94-3, ‘‘Liability Recognition forCertain Employee Termination Benefits and Other Costs to Exit an Activity (Including Certain Costs Incurred ina Restructuring).’’ SFAS No. 146 eliminates the provisions of EITF No. 94-3 that required a liability to berecognized for certain exit or disposal activities at the date an entity committed to an exit plan. SFAS No. 146requires a liability for costs associated with an exit or disposal activity to be recognized when the liability isincurred. SFAS No. 146 is effective for exit or disposal activities that are initiated after December 31, 2002. TheCompany does not expect the adoption of this statement to have a material impact on its results of operations orfinancial position.
F-6

MANAGEMENT’S DISCUSSION AND ANALYSIS OFFINANCIAL CONDITION AND RESULTS OF OPERATIONS
MANAGEMENT OUTLOOK
During fiscal 2002, the Company delivered another year of strong financial performance in a difficulteconomic environment. These results were achieved by disciplined capacity growth, opportunistic acquisitions,and diligent fiscal responsibility. Our passionate culinary culture that keeps the Company’s menu offerings on theleading edge and our unwavering focus on guest satisfaction are key contributors to our continued success.
During fiscal 2003, the Company will continue to leverage many of the initiatives that drove fiscal 2002performance. Positive lifestyle, demographic, and demand trends for food away from home help balance anuncertain economic environment. Revenue growth will be driven by higher capacity as a result of the Company’srecent acquisitions, continued brand development and an effective real estate strategy. The Company believesthe ongoing efforts to enhance our guests’ experience provide the best avenue to deliver long-term shareholdervalue.
FORWARD-LOOKING STATEMENTS
The Company wishes to caution readers that the following important factors, among others, could cause theactual results of the Company to differ materially from those indicated by forward-looking statements made inthis report and from time to time in news releases, reports, proxy statements, registration statements and otherwritten communications, as well as oral forward-looking statements made from time to time by representatives ofthe Company. Such forward-looking statements involve risks and uncertainties that may cause the Company’s orthe restaurant industry’s actual results, performance or achievements to be materially different from any futureresults, performance or achievements expressed or implied by these forward-looking statements. Factors thatmight cause actual events or results to differ materially from those indicated by these forward-looking statementsmay include matters such as future economic performance, restaurant openings, operating margins, theavailability of acceptable real estate locations for new restaurants, the sufficiency of the Company’s cash balancesand cash generated from operating and financing activities for the Company’s future liquidity and capitalresource needs, and other matters, and are generally accompanied by words such as ‘‘believes,’’ ‘‘anticipates,’’‘‘estimates,’’ ‘‘predicts,’’ ‘‘expects’’ and similar expressions that convey the uncertainty of future events oroutcomes. An expanded discussion of various risk factors follows.
Competition may adversely affect the Company’s operations and financial results.
The restaurant business is highly competitive with respect to price, service, restaurant location and foodquality, and is often affected by changes in consumer tastes, economic conditions, population and traffic patterns.The Company competes within each market with locally-owned restaurants as well as national and regionalrestaurant chains, some of which operate more restaurants and have greater financial resources and longeroperating histories than the Company. There is active competition for management personnel and for attractivecommercial real estate sites suitable for restaurants. In addition, factors such as inflation, increased food, laborand benefits costs, and difficulty in attracting hourly employees may adversely affect the restaurant industry ingeneral and the Company’s restaurants in particular.
The Company’s sales volumes generally decrease in winter months.
The Company’s sales volumes fluctuate seasonally, and are generally higher in the summer months andlower in the winter months, which may cause seasonal fluctuations in the Company’s operating results.
Changes in governmental regulation may adversely affect the Company’s ability to open new restaurants andthe Company’s existing and future operations.
Each of the Company’s restaurants is subject to licensing and regulation by alcoholic beverage control,health, sanitation, safety and fire agencies in the state, county and/or municipality in which the restaurant islocated. The Company has not encountered any difficulties or failures in obtaining the required licenses orapprovals that could delay or prevent the opening of a new restaurant and although the Company does not, at
F-7
MANAGEMENT’S DISCUSSION AND ANALYSIS OFFINANCIAL CONDITION AND RESULTS OF OPERATIONS
this time, anticipate any occurring in the future, there can be no assurance that the Company will not experiencematerial difficulties or failures that could delay the opening of restaurants in the future.
The Company is subject to federal and state environmental regulations, and although these have not had amaterial negative effect on the Company’s operations, there can be no assurance that there will not be a materialnegative effect in the future. More stringent and varied requirements of local and state governmental bodies withrespect to zoning, land use and environmental factors could delay or prevent development of new restaurants inparticular locations. The Company is subject to the Fair Labor Standards Act, which governs such matters asminimum wages, overtime and other working conditions, along with the Americans With Disabilities Act, familyleave mandates and a variety of other laws enacted by the states that govern these and other employment lawmatters. Although the Company expects increases in payroll expenses as a result of federal and state mandatedincreases in the minimum wage, and although such increases are not expected to be material, there can be noassurance that there will not be material increases in the future. However, the Company’s vendors may beaffected by higher minimum wage standards, which may result in increases in the price of goods and servicessupplied to the Company.
Inflation may increase the Company’s operating expenses.
The Company has not experienced a significant overall impact from inflation. As operating expensesincrease, the Company, to the extent permitted by competition, recovers increased costs by increasing menuprices, by reviewing, then implementing, alternative products or processes, or by implementing othercost-reduction procedures. There can be no assurance, however, that the Company will be able to continue torecover increases in operating expenses due to inflation in this manner.
Increased energy costs may adversely affect the Company’s profitability.
The Company’s success depends in part on its ability to absorb increases in utility costs. Various regions ofthe United States in which the Company operates multiple restaurants, particularly California, experiencedsignificant increases in utility prices during the 2001 fiscal year. If these increases should recur, they will have anadverse effect on the Company’s profitability.
If the Company is unable to meet its growth plan, the Company’s profitability in the future may be adverselyaffected.
The Company’s ability to meet its growth plan is dependent upon, among other things, its ability to identifyavailable, suitable and economically viable locations for new restaurants, obtain all required governmentalpermits (including zoning approvals and liquor licenses) on a timely basis, hire all necessary contractors andsubcontractors, and meet construction schedules. The costs related to restaurant and concept developmentinclude purchases and leases of land, buildings and equipment and facility and equipment maintenance, repairand replacement. The labor and materials costs involved vary geographically and are subject to general priceincreases. As a result, future capital expenditure costs of restaurant development may increase, reducingprofitability. There can be no assurance that the Company will be able to expand its capacity in accordance withits growth objectives or that the new restaurants and concepts opened or acquired will be profitable.
Unfavorable publicity relating to one or more of the Company’s restaurants in a particular brand may taintpublic perception of the brand.
Multi-unit restaurant businesses can be adversely affected by publicity resulting from poor food quality,illness or other health concerns or operating issues stemming from one or a limited number of restaurants. Inparticular, since the Company depends heavily on the ‘‘Chili’s’’ brand for a majority of its revenues, unfavorablepublicity relating to one or more Chili’s restaurants could have a material adverse effect on the Company’sbusiness, results of operations and financial condition.
F-8

MANAGEMENT’S DISCUSSION AND ANALYSIS OFFINANCIAL CONDITION AND RESULTS OF OPERATIONS
Other risk factors may adversely affect the Company’s financial performance.
Other risk factors that could cause the Company’s actual results to differ materially from those indicated inthe forward-looking statements include, without limitation, changes in economic conditions, consumerperceptions of food safety, changes in consumer tastes, governmental monetary policies, changes in demographictrends, availability of employees, terrorist acts, and weather and other acts of God.
F-9
BRINKER INTERNATIONAL, INC.
CONSOLIDATED STATEMENTS OF INCOME
(In thousands, except per share amounts)
Fiscal Years
2002 2001 2000
Revenues . . . . . . . . . . . . . . . . . . . . . . . . . . . . . . . . . . . . . . . . . . . . . $2,887,111 $2,406,874 $2,100,496Operating Costs and Expenses:
Cost of sales . . . . . . . . . . . . . . . . . . . . . . . . . . . . . . . . . . . . . . . . . 796,714 663,357 575,570Restaurant expenses . . . . . . . . . . . . . . . . . . . . . . . . . . . . . . . . . . . 1,591,367 1,303,349 1,138,487Depreciation and amortization . . . . . . . . . . . . . . . . . . . . . . . . . . . . 130,102 100,064 90,647General and administrative . . . . . . . . . . . . . . . . . . . . . . . . . . . . . . 121,420 109,110 100,123
Total operating costs and expenses . . . . . . . . . . . . . . . . . . . . . . . 2,639,603 2,175,880 1,904,827
Operating income . . . . . . . . . . . . . . . . . . . . . . . . . . . . . . . . . . . . . . . 247,508 230,994 195,669
Interest expense . . . . . . . . . . . . . . . . . . . . . . . . . . . . . . . . . . . . . . . . 13,327 8,608 10,746Other, net . . . . . . . . . . . . . . . . . . . . . . . . . . . . . . . . . . . . . . . . . . . . 2,332 459 3,381Income before provision for income taxes . . . . . . . . . . . . . . . . . . . . . 231,849 221,927 181,542Provision for income taxes . . . . . . . . . . . . . . . . . . . . . . . . . . . . . . . . . 79,136 76,779 63,702
Net income . . . . . . . . . . . . . . . . . . . . . . . . . . . . . . . . . . . . . . . . $ 152,713 $ 145,148 $ 117,840
Basic net income per share . . . . . . . . . . . . . . . . . . . . . . . . . . . . . . . . $ 1.56 $ 1.46 $ 1.20
Diluted net income per share . . . . . . . . . . . . . . . . . . . . . . . . . . . . . . $ 1.52 $ 1.42 $ 1.17
Basic weighted average shares outstanding . . . . . . . . . . . . . . . . . . . . . 97,862 99,101 98,445
Diluted weighted average shares outstanding . . . . . . . . . . . . . . . . . . . 100,565 102,098 101,114
See accompanying notes to consolidated financial statements.
F-10

BRINKER INTERNATIONAL, INC.
CONSOLIDATED BALANCE SHEETS
(In thousands, except share and per share amounts)
2002 2001
ASSETSCurrent Assets:
Cash and cash equivalents . . . . . . . . . . . . . . . . . . . . . . . . . . . . . . . . . . . . . . . . . . . . . . $ 10,091 $ 13,312Accounts receivable . . . . . . . . . . . . . . . . . . . . . . . . . . . . . . . . . . . . . . . . . . . . . . . . . . 22,613 31,438Inventories . . . . . . . . . . . . . . . . . . . . . . . . . . . . . . . . . . . . . . . . . . . . . . . . . . . . . . . . 25,190 27,351Prepaid expenses and other . . . . . . . . . . . . . . . . . . . . . . . . . . . . . . . . . . . . . . . . . . . . . 66,727 57,809Income taxes receivable . . . . . . . . . . . . . . . . . . . . . . . . . . . . . . . . . . . . . . . . . . . . . . . . 15,673 3,019Deferred income taxes . . . . . . . . . . . . . . . . . . . . . . . . . . . . . . . . . . . . . . . . . . . . . . . . . 1,660 7,295
Total current assets . . . . . . . . . . . . . . . . . . . . . . . . . . . . . . . . . . . . . . . . . . . . . . . . . 141,954 140,224Property and Equipment, at Cost:
Land . . . . . . . . . . . . . . . . . . . . . . . . . . . . . . . . . . . . . . . . . . . . . . . . . . . . . . . . . . . . 254,000 201,013Buildings and leasehold improvements . . . . . . . . . . . . . . . . . . . . . . . . . . . . . . . . . . . . . . 1,091,434 898,133Furniture and equipment . . . . . . . . . . . . . . . . . . . . . . . . . . . . . . . . . . . . . . . . . . . . . . . 635,403 478,847Construction-in-progress . . . . . . . . . . . . . . . . . . . . . . . . . . . . . . . . . . . . . . . . . . . . . . . 57,015 70,051
2,037,852 1,648,044Less accumulated depreciation and amortization . . . . . . . . . . . . . . . . . . . . . . . . . . . . . . . (682,435) (563,320)
Net property and equipment . . . . . . . . . . . . . . . . . . . . . . . . . . . . . . . . . . . . . . . . . . . 1,355,417 1,084,724Other Assets:
Goodwill . . . . . . . . . . . . . . . . . . . . . . . . . . . . . . . . . . . . . . . . . . . . . . . . . . . . . . . . . . 193,899 138,127Other . . . . . . . . . . . . . . . . . . . . . . . . . . . . . . . . . . . . . . . . . . . . . . . . . . . . . . . . . . . . 92,066 82,245
Total other assets . . . . . . . . . . . . . . . . . . . . . . . . . . . . . . . . . . . . . . . . . . . . . . . . . . . 285,965 220,372Total assets . . . . . . . . . . . . . . . . . . . . . . . . . . . . . . . . . . . . . . . . . . . . . . . . . . . . . . . $1,783,336 $1,445,320
LIABILITIES AND SHAREHOLDERS’ EQUITYCurrent Liabilities:
Current installments of long-term debt . . . . . . . . . . . . . . . . . . . . . . . . . . . . . . . . . . . . . . $ 17,292 $ 17,635Accounts payable . . . . . . . . . . . . . . . . . . . . . . . . . . . . . . . . . . . . . . . . . . . . . . . . . . . . 118,418 98,175Accrued liabilities . . . . . . . . . . . . . . . . . . . . . . . . . . . . . . . . . . . . . . . . . . . . . . . . . . . . 166,510 134,420
Total current liabilities . . . . . . . . . . . . . . . . . . . . . . . . . . . . . . . . . . . . . . . . . . . . . . . 302,220 250,230Long-term debt, less current installments . . . . . . . . . . . . . . . . . . . . . . . . . . . . . . . . . . . . . 426,679 236,060Deferred income taxes . . . . . . . . . . . . . . . . . . . . . . . . . . . . . . . . . . . . . . . . . . . . . . . . . . 17,295 6,782Other liabilities . . . . . . . . . . . . . . . . . . . . . . . . . . . . . . . . . . . . . . . . . . . . . . . . . . . . . . . 60,046 51,961
Commitments and Contingencies (Notes 8 and 14)
Shareholders’ Equity:Common stock—250,000,000 authorized shares; $.10 par value; 117,500,054 shares issued and
97,440,391 shares outstanding at June 26, 2002, and 117,501,080 shares issued and99,509,455 shares outstanding at June 27, 2001 . . . . . . . . . . . . . . . . . . . . . . . . . . . . . . 11,750 11,750
Additional paid-in capital . . . . . . . . . . . . . . . . . . . . . . . . . . . . . . . . . . . . . . . . . . . . . . . 330,191 314,867Retained earnings . . . . . . . . . . . . . . . . . . . . . . . . . . . . . . . . . . . . . . . . . . . . . . . . . . . . 954,701 801,988
1,296,642 1,128,605Less:Treasury stock, at cost (20,059,663 shares at June 26, 2002 and 17,991,625 shares at June 27,
2001) . . . . . . . . . . . . . . . . . . . . . . . . . . . . . . . . . . . . . . . . . . . . . . . . . . . . . . . . . . . . (317,674) (225,334)Accumulated other comprehensive loss . . . . . . . . . . . . . . . . . . . . . . . . . . . . . . . . . . . . . . . — (895)Unearned compensation . . . . . . . . . . . . . . . . . . . . . . . . . . . . . . . . . . . . . . . . . . . . . . . . . (1,872) (2,089)
Total shareholders’ equity . . . . . . . . . . . . . . . . . . . . . . . . . . . . . . . . . . . . . . . . . . . . . . 977,096 900,287Total liabilities and shareholders’ equity . . . . . . . . . . . . . . . . . . . . . . . . . . . . . . . . . . . . . $1,783,336 $1,445,320
See accompanying notes to consolidated financial statements.
F-11

BRINKER INTERNATIONAL, INC.
CONSOLIDATED STATEMENTS OF SHAREHOLDERS’ EQUITY
(In thousands)
AccumulatedAdditional OtherCommon Stock Paid-In Retained Treasury Comprehensive Unearned
Shares Amount Capital Earnings Stock Loss Compensation Total
Balances at June 30, 1999 . . . . . 98,847 $11,722 $285,448 $539,011 $(174,742) $ — $ — $661,439
Net income . . . . . . . . . . . . . . . — — — 117,840 — — — 117,840Purchases of treasury stock . . . . (3,668) — — — (60,707) — — (60,707)Issuances of common stock . . . . 3,291 — (3,187) — 33,832 — — 30,645Tax benefit from stock options
exercised . . . . . . . . . . . . . . . — — 10,837 — — — — 10,837Amortization of unearned
compensation . . . . . . . . . . . . — — — — — — 2,124 2,124Issuance of restricted stock, net
of forfeitures . . . . . . . . . . . . 328 32 5,074 (11) 86 — (5,151) 30
Balances at June 28, 2000 . . . . . 98,798 11,754 298,172 656,840 (201,531) — (3,027) 762,208
Net income . . . . . . . . . . . . . . . — — — 145,148 — — — 145,148Change in fair value of
derivatives, net of tax . . . . . . . — — — — — (895) — (895)
Comprehensive income . . . . . 144,253
Purchases of treasury stock . . . . (2,841) — — — (65,578) — — (65,578)Issuances of common stock . . . . 3,541 — (2,529) — 41,194 — — 38,665Tax benefit from stock options
exercised . . . . . . . . . . . . . . . — — 19,430 — — — — 19,430Amortization of unearned
compensation . . . . . . . . . . . . — — — — — — 1,307 1,307Issuance of restricted stock, net
of forfeitures . . . . . . . . . . . . 11 (4) (206) — 581 — (369) 2
Balances at June 27, 2001 . . . . . 99,509 11,750 314,867 801,988 (225,334) (895) (2,089) 900,287
Net income . . . . . . . . . . . . . . . — — — 152,713 — — — 152,713Reclassification adjustment to
earnings, net of tax . . . . . . . . — — — — — 895 — 895
Comprehensive income . . . . . 153,608
Purchases of treasury stock . . . . (5,058) — — — (136,069) — — (136,069)Issuances of common stock . . . . 2,890 — (4,602) — 42,394 — — 37,792Tax benefit from stock options
exercised . . . . . . . . . . . . . . . — — 18,826 — — — — 18,826Amortization of unearned
compensation . . . . . . . . . . . . — — — — — — 1,594 1,594Issuance of restricted stock, net
of forfeitures . . . . . . . . . . . . 99 — 1,100 — 1,335 — (1,377) 1,058
Balances at June 26, 2002 . . . . . 97,440 $11,750 $330,191 $954,701 $(317,674) $ — $ (1,872) $977,096
See accompanying notes to consolidated financial statements.
F-12
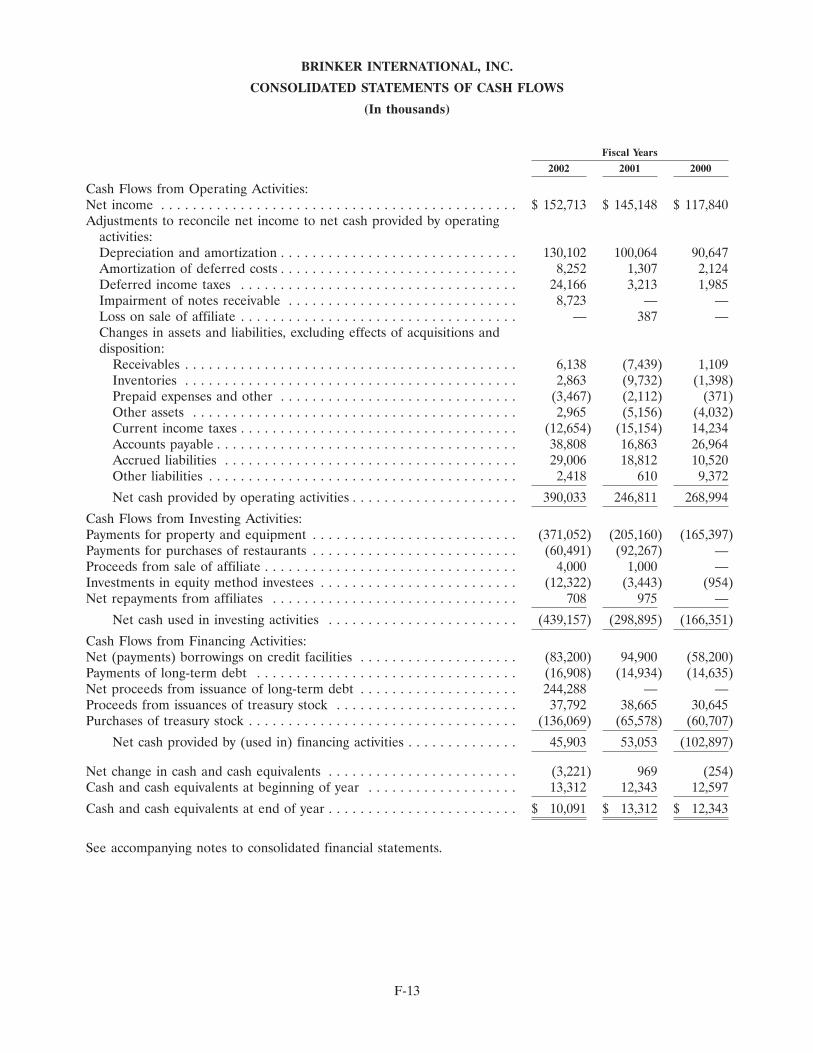
BRINKER INTERNATIONAL, INC.
CONSOLIDATED STATEMENTS OF CASH FLOWS
(In thousands)
Fiscal Years
2002 2001 2000
Cash Flows from Operating Activities:Net income . . . . . . . . . . . . . . . . . . . . . . . . . . . . . . . . . . . . . . . . . . . . . $ 152,713 $ 145,148 $ 117,840Adjustments to reconcile net income to net cash provided by operating
activities:Depreciation and amortization . . . . . . . . . . . . . . . . . . . . . . . . . . . . . . 130,102 100,064 90,647Amortization of deferred costs . . . . . . . . . . . . . . . . . . . . . . . . . . . . . . 8,252 1,307 2,124Deferred income taxes . . . . . . . . . . . . . . . . . . . . . . . . . . . . . . . . . . . 24,166 3,213 1,985Impairment of notes receivable . . . . . . . . . . . . . . . . . . . . . . . . . . . . . 8,723 — —Loss on sale of affiliate . . . . . . . . . . . . . . . . . . . . . . . . . . . . . . . . . . . — 387 —Changes in assets and liabilities, excluding effects of acquisitions anddisposition:
Receivables . . . . . . . . . . . . . . . . . . . . . . . . . . . . . . . . . . . . . . . . . . 6,138 (7,439) 1,109Inventories . . . . . . . . . . . . . . . . . . . . . . . . . . . . . . . . . . . . . . . . . . 2,863 (9,732) (1,398)Prepaid expenses and other . . . . . . . . . . . . . . . . . . . . . . . . . . . . . . (3,467) (2,112) (371)Other assets . . . . . . . . . . . . . . . . . . . . . . . . . . . . . . . . . . . . . . . . . 2,965 (5,156) (4,032)Current income taxes . . . . . . . . . . . . . . . . . . . . . . . . . . . . . . . . . . . (12,654) (15,154) 14,234Accounts payable . . . . . . . . . . . . . . . . . . . . . . . . . . . . . . . . . . . . . . 38,808 16,863 26,964Accrued liabilities . . . . . . . . . . . . . . . . . . . . . . . . . . . . . . . . . . . . . 29,006 18,812 10,520Other liabilities . . . . . . . . . . . . . . . . . . . . . . . . . . . . . . . . . . . . . . . 2,418 610 9,372
Net cash provided by operating activities . . . . . . . . . . . . . . . . . . . . . 390,033 246,811 268,994
Cash Flows from Investing Activities:Payments for property and equipment . . . . . . . . . . . . . . . . . . . . . . . . . . (371,052) (205,160) (165,397)Payments for purchases of restaurants . . . . . . . . . . . . . . . . . . . . . . . . . . (60,491) (92,267) —Proceeds from sale of affiliate . . . . . . . . . . . . . . . . . . . . . . . . . . . . . . . . 4,000 1,000 —Investments in equity method investees . . . . . . . . . . . . . . . . . . . . . . . . . (12,322) (3,443) (954)Net repayments from affiliates . . . . . . . . . . . . . . . . . . . . . . . . . . . . . . . 708 975 —
Net cash used in investing activities . . . . . . . . . . . . . . . . . . . . . . . . (439,157) (298,895) (166,351)
Cash Flows from Financing Activities:Net (payments) borrowings on credit facilities . . . . . . . . . . . . . . . . . . . . (83,200) 94,900 (58,200)Payments of long-term debt . . . . . . . . . . . . . . . . . . . . . . . . . . . . . . . . . (16,908) (14,934) (14,635)Net proceeds from issuance of long-term debt . . . . . . . . . . . . . . . . . . . . 244,288 — —Proceeds from issuances of treasury stock . . . . . . . . . . . . . . . . . . . . . . . 37,792 38,665 30,645Purchases of treasury stock . . . . . . . . . . . . . . . . . . . . . . . . . . . . . . . . . . (136,069) (65,578) (60,707)
Net cash provided by (used in) financing activities . . . . . . . . . . . . . . 45,903 53,053 (102,897)
Net change in cash and cash equivalents . . . . . . . . . . . . . . . . . . . . . . . . (3,221) 969 (254)Cash and cash equivalents at beginning of year . . . . . . . . . . . . . . . . . . . 13,312 12,343 12,597
Cash and cash equivalents at end of year . . . . . . . . . . . . . . . . . . . . . . . . $ 10,091 $ 13,312 $ 12,343
See accompanying notes to consolidated financial statements.
F-13
BRINKER INTERNATIONAL, INC.NOTES TO CONSOLIDATED FINANCIAL STATEMENTS
1. SUMMARY OF SIGNIFICANT ACCOUNTING POLICIES
(a) Basis of Presentation
The consolidated financial statements include the accounts of Brinker International, Inc. and its wholly-owned subsidiaries (the ‘‘Company’’). All intercompany accounts and transactions have been eliminated inconsolidation. The Company owns and operates, or franchises, various restaurant concepts principally located inthe United States. Investments in unconsolidated affiliates in which the Company exercises significant influence,but does not control, are accounted for by the equity method, and the Company’s share of the net income or lossof the investee is included in other, net in the consolidated statements of income.
The Company has a 52/53 week fiscal year ending on the last Wednesday in June. Fiscal years 2002, 2001 and2000, which ended on June 26, 2002, June 27, 2001 and June 28, 2000, respectively, each contained 52 weeks.
Certain prior year amounts in the accompanying consolidated financial statements have been reclassified toconform with fiscal 2002 presentation. These reclassifications have no effect on the Company’s net income orfinancial position as previously reported.
(b) Revenue Recognition
The Company records revenue from the sale of food, beverage and alcohol as products are sold. Initial feesreceived from a franchisee to establish a new franchise are recognized as income when the Company hasperformed all of its obligations required to assist the franchisee in opening a new franchise restaurant, which isgenerally upon opening of such restaurant. Continuing royalties, which are a percentage of net sales of franchisedrestaurants, are accrued as income when earned. Proceeds from the sale of gift cards are recorded as deferredrevenue and recognized as income when redeemed by the holder.
The Company adopted EITF 01-9, ‘‘Accounting for Consideration Given by a Vendor to a Customer(Including a Reseller of the Vendor’s Products),’’ effective March 28, 2002. EITF 01-9 concluded that salesincentives offered to customers to buy a product should be classified as a reduction of sales. The Companypreviously included sales incentives in restaurant expenses. Sales incentives reclassified from restaurant expensesto revenues totaled $79.5 million, $66.8 million, and $59.3 million in fiscal 2002, 2001, and 2000, respectively.These reclassifications have no effect on net income.
(c) Financial Instruments
The Company’s policy is to invest cash in excess of operating requirements in income-producinginvestments. Income-producing investments with maturities of three months or less at the time of investment arereflected as cash equivalents.
The Company’s financial instruments at June 26, 2002 and June 27, 2001 consist of cash equivalents,accounts receivable, notes receivable, and long-term debt. The fair value of these financial instrumentsapproximates the carrying amounts reported in the consolidated balance sheets. The following methods wereused in estimating the fair value of each class of financial instrument: cash equivalents and accounts receivableapproximate their carrying amounts due to the short duration of those items; notes receivable are based on thepresent value of expected future cash flows discounted at the interest rate currently offered by the Companywhich approximates rates currently being offered by local lending institutions for loans of similar terms tocompanies with comparable credit risk; and long-term debt is based on the amount of future cash flowsdiscounted using the Company’s expected borrowing rate for debt of comparable risk and maturity.
The Company does not use derivative instruments for trading purposes and the Company has procedures inplace to monitor and control their use. The Company’s use of derivative instruments is currently limited tointerest rate swaps, which are entered into with the intent of hedging exposures to changes in interest rates on theCompany’s debt and lease obligations. The Company records all derivative instruments in the consolidatedbalance sheet at fair value. The accounting for the gain or loss due to changes in fair value of the derivativeinstrument depends on whether the derivative instrument qualifies as a hedge. If the derivative instrument doesnot qualify as a hedge, the gains or losses are reported in earnings when they occur. However, if the derivativeinstrument qualifies as a hedge, the accounting varies based on the type of risk being hedged. Amountsreceivable or payable under interest rate swaps related to the debt and lease obligations are recorded as
F-14
NOTES TO CONSOLIDATED FINANCIAL STATEMENTS
adjustments to interest expense and restaurant expenses, respectively. Cash flows related to derivativetransactions are included in operating activities. See Notes 6 and 7 for additional discussion of debt-relatedagreements and derivative financial instruments and hedging activities.
(d) Inventories
Inventories, which consist of food, beverages, and supplies, are stated at the lower of cost (weighted averagecost method) or market.
(e) Property and Equipment
Buildings and leasehold improvements are amortized using the straight-line method over the lesser of thelife of the lease, including renewal options, or the estimated useful lives of the assets, which range from 5 to20 years. Furniture and equipment are depreciated using the straight-line method over the estimated useful livesof the assets, which range from 3 to 8 years.
The Company evaluates property and equipment held and used in the business for impairment wheneverevents or changes in circumstances indicate that the carrying amount of a restaurant’s assets may not berecoverable. An impairment is determined by comparing estimated undiscounted future operating cash flows fora restaurant to the carrying amount of its assets. If an impairment exists, the amount of impairment is measuredas the excess of the carrying amount over the estimated discounted future operating cash flows of the asset andthe expected proceeds upon sale of the asset. Assets held for sale are reported at the lower of carrying amount orfair value less costs to sell.
(f) Capitalized Interest
Interest costs capitalized during the construction period of restaurants were approximately $4.5 million,$2.8 million, and $3.2 million during fiscal 2002, 2001, and 2000, respectively.
(g) Advertising
Advertising costs are expensed as incurred. Advertising costs were $116.6 million, $95.4 million, and$80.7 million in fiscal 2002, 2001, and 2000, respectively, and are included in restaurant expenses in theconsolidated statements of income.
(h) Goodwill and Other Intangible Assets
Intangible assets include both goodwill and identifiable intangibles arising from the allocation of thepurchase prices of assets acquired. Goodwill represents the residual purchase price after allocation to all otheridentifiable net assets acquired. Other intangibles consist mainly of reacquired development rights andintellectual property.
The Company adopted SFAS No. 142, ‘‘Goodwill and Other Intangible Assets,’’ effective June 28, 2001.SFAS No. 142 eliminates the amortization for goodwill and other intangible assets with indefinite lives. Intangibleassets with lives restricted by contractual, legal, or other means will continue to be amortized over their usefullives. Goodwill and other intangible assets not subject to amortization are tested for impairment annually ormore frequently if events or changes in circumstances indicate that the asset might be impaired. SFAS No. 142requires a two-step process for testing impairment. First, the fair value of each reporting unit is compared to itscarrying value to determine whether an indication of impairment exists. If an impairment is indicated, then thefair value of the reporting unit’s goodwill is determined by allocating the unit’s fair value to its assets andliabilities (including any unrecognized intangible assets) as if the reporting unit had been acquired in a businesscombination. The amount of impairment for goodwill and other intangible assets is measured as the excess of itscarrying value over its fair value. No such impairment losses were recorded upon the initial adoption ofSFAS 142. Prior to the adoption of SFAS No. 142, goodwill was being amortized on a straight-line basis over 30 to40 years.
Intangible assets subject to amortization under SFAS No. 142 consist primarily of intellectual propertyrights. Amortization expense is calculated using the straight-line method over their estimated useful lives of 15 to25 years. Intangible assets not subject to amortization consist primarily of reacquired development rights. SeeNote 3 for additional disclosures related to goodwill and other intangibles.
F-15

NOTES TO CONSOLIDATED FINANCIAL STATEMENTS
(i) Self-Insurance Program
The Company utilizes a paid loss self-insurance plan for general liability and workers’ compensationcoverage. Predetermined loss limits have been arranged with insurance companies to limit the Company’s peroccurrence cash outlay. Additionally, in fiscal 2002 and 2001, the Company entered into guaranteed costagreements with an insurance company to eliminate all future general liability losses for those respective fiscalyears. Accrued expenses and other liabilities include the estimated incurred but unreported costs to settle unpaidclaims and estimated future claims.
(j) Income Taxes
Deferred tax assets and liabilities are recognized for the future tax consequences attributable to differencesbetween the financial statement carrying amounts of existing assets and liabilities and their respective tax bases.Deferred tax assets and liabilities are measured using enacted tax rates expected to apply to taxable income in theyears in which those temporary differences are expected to be recovered or settled. The effect on deferred taxassets and liabilities of a change in tax rates is recognized in income in the period that includes the enactmentdate.
(k) Stock-Based Compensation
The Company uses the intrinsic value method for measuring employee stock-based compensation cost.Under this method, compensation cost is measured as the excess, if any, of the quoted market price of theCompany’s common stock at the grant date over the amount the employee must pay for the stock. TheCompany’s policy is to grant stock options at the market value of the underlying stock at the date of grant.Proceeds from the exercise of common stock options issued to officers, directors, and key employees under theCompany’s stock option plans are credited to common stock to the extent of par value and to additional paid-incapital for the excess. Required pro forma disclosures of compensation expense determined under the fair valuemethod prescribed by SFAS No. 123, ‘‘Accounting for Stock-Based Compensation,’’ are presented in Note 9.
(l) Comprehensive Income
Comprehensive income is defined as the change in equity of a business enterprise during a period fromtransactions and other events and circumstances from non-owner sources. Comprehensive income consists of netincome and the effective unrealized portion of changes in the fair value of the Company’s cash flow hedges.
(m) Net Income Per Share
Basic earnings per share is computed by dividing income available to common shareholders by the weightedaverage number of common shares outstanding for the reporting period. Diluted earnings per share reflects thepotential dilution that could occur if securities or other contracts to issue common stock were exercised orconverted into common stock. For the calculation of diluted net income per share, the basic weighted averagenumber of shares is increased by the dilutive effect of stock options determined using the treasury stock method.For all periods presented, there were no other securities excluded from the calculation of diluted earnings pershare because their effect on the periods presented was antidilutive. The Company’s contingently convertibledebt securities are not considered for purposes of diluted earnings per share unless the required conversioncriteria have been met as of the end of the reporting period.
(n) Segment Reporting
Operating segments are components of an enterprise about which separate financial information is availablethat is evaluated regularly by the chief operating decision maker in deciding how to allocate resources and inassessing performance. The Company identifies operating segments based on management responsibility andbelieves it meets the criteria for aggregating its operating segments into a single reporting segment.
(o) Use of Estimates
The preparation of the consolidated financial statements in conformity with generally accepted accountingprinciples in the United States of America requires management to make estimates and assumptions that affectthe reported amounts of assets and liabilities and the disclosure of contingent assets and liabilities at the date ofthe consolidated financial statements and the reported amounts of revenues and costs and expenses during thereporting period. Actual results could differ from those estimates.
F-16
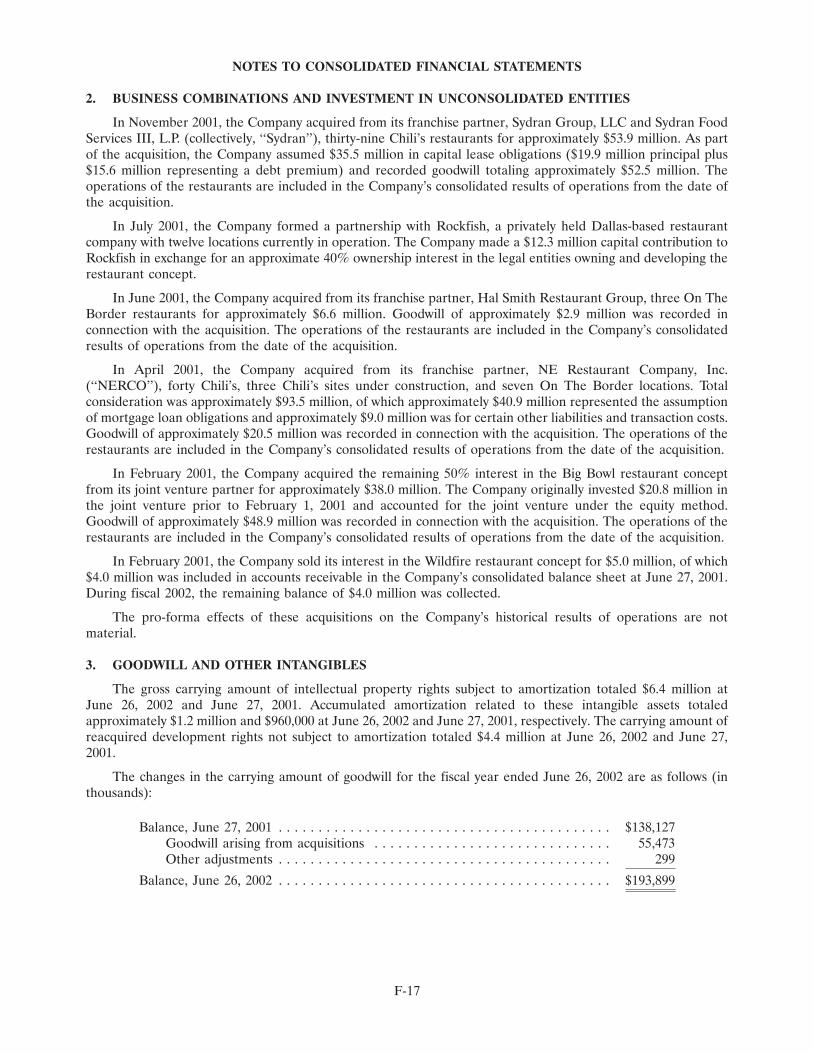
NOTES TO CONSOLIDATED FINANCIAL STATEMENTS
2. BUSINESS COMBINATIONS AND INVESTMENT IN UNCONSOLIDATED ENTITIES
In November 2001, the Company acquired from its franchise partner, Sydran Group, LLC and Sydran FoodServices III, L.P. (collectively, ‘‘Sydran’’), thirty-nine Chili’s restaurants for approximately $53.9 million. As partof the acquisition, the Company assumed $35.5 million in capital lease obligations ($19.9 million principal plus$15.6 million representing a debt premium) and recorded goodwill totaling approximately $52.5 million. Theoperations of the restaurants are included in the Company’s consolidated results of operations from the date ofthe acquisition.
In July 2001, the Company formed a partnership with Rockfish, a privately held Dallas-based restaurantcompany with twelve locations currently in operation. The Company made a $12.3 million capital contribution toRockfish in exchange for an approximate 40% ownership interest in the legal entities owning and developing therestaurant concept.
In June 2001, the Company acquired from its franchise partner, Hal Smith Restaurant Group, three On TheBorder restaurants for approximately $6.6 million. Goodwill of approximately $2.9 million was recorded inconnection with the acquisition. The operations of the restaurants are included in the Company’s consolidatedresults of operations from the date of the acquisition.
In April 2001, the Company acquired from its franchise partner, NE Restaurant Company, Inc.(‘‘NERCO’’), forty Chili’s, three Chili’s sites under construction, and seven On The Border locations. Totalconsideration was approximately $93.5 million, of which approximately $40.9 million represented the assumptionof mortgage loan obligations and approximately $9.0 million was for certain other liabilities and transaction costs.Goodwill of approximately $20.5 million was recorded in connection with the acquisition. The operations of therestaurants are included in the Company’s consolidated results of operations from the date of the acquisition.
In February 2001, the Company acquired the remaining 50% interest in the Big Bowl restaurant conceptfrom its joint venture partner for approximately $38.0 million. The Company originally invested $20.8 million inthe joint venture prior to February 1, 2001 and accounted for the joint venture under the equity method.Goodwill of approximately $48.9 million was recorded in connection with the acquisition. The operations of therestaurants are included in the Company’s consolidated results of operations from the date of the acquisition.
In February 2001, the Company sold its interest in the Wildfire restaurant concept for $5.0 million, of which$4.0 million was included in accounts receivable in the Company’s consolidated balance sheet at June 27, 2001.During fiscal 2002, the remaining balance of $4.0 million was collected.
The pro-forma effects of these acquisitions on the Company’s historical results of operations are notmaterial.
3. GOODWILL AND OTHER INTANGIBLES
The gross carrying amount of intellectual property rights subject to amortization totaled $6.4 million atJune 26, 2002 and June 27, 2001. Accumulated amortization related to these intangible assets totaledapproximately $1.2 million and $960,000 at June 26, 2002 and June 27, 2001, respectively. The carrying amount ofreacquired development rights not subject to amortization totaled $4.4 million at June 26, 2002 and June 27,2001.
The changes in the carrying amount of goodwill for the fiscal year ended June 26, 2002 are as follows (inthousands):
Balance, June 27, 2001 . . . . . . . . . . . . . . . . . . . . . . . . . . . . . . . . . . . . . . . . . . $138,127Goodwill arising from acquisitions . . . . . . . . . . . . . . . . . . . . . . . . . . . . . . 55,473Other adjustments . . . . . . . . . . . . . . . . . . . . . . . . . . . . . . . . . . . . . . . . . . 299
Balance, June 26, 2002 . . . . . . . . . . . . . . . . . . . . . . . . . . . . . . . . . . . . . . . . . . $193,899
F-17
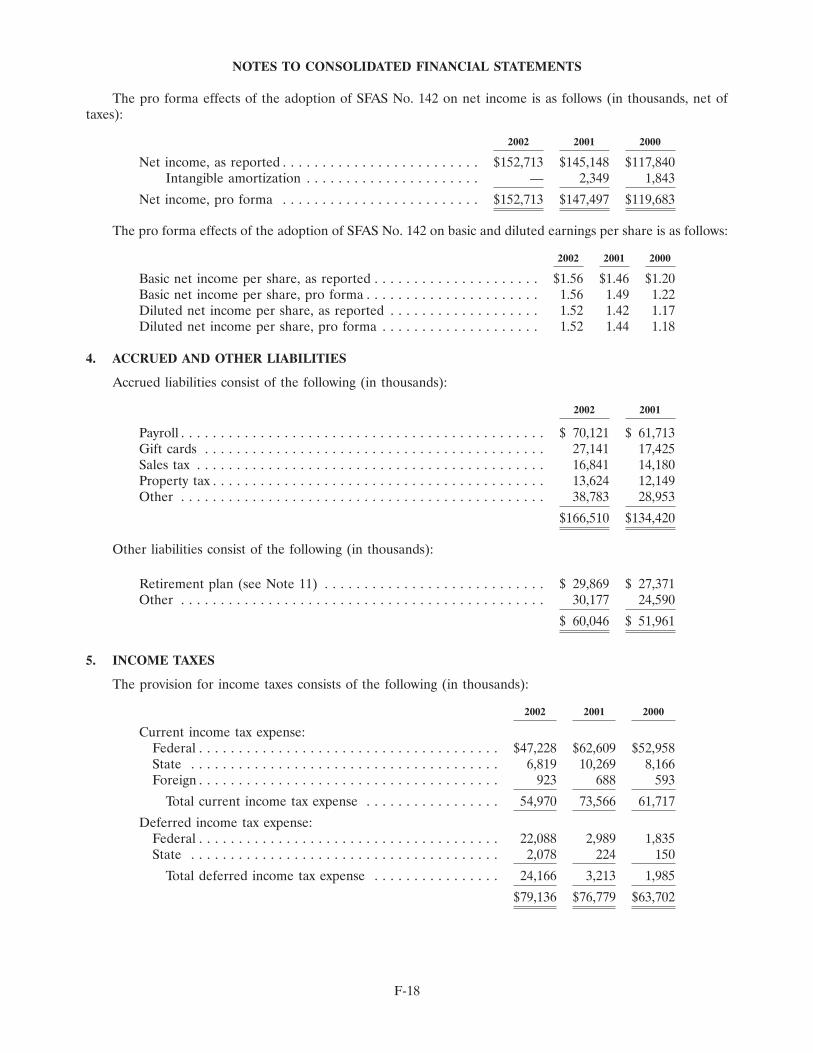
NOTES TO CONSOLIDATED FINANCIAL STATEMENTS
The pro forma effects of the adoption of SFAS No. 142 on net income is as follows (in thousands, net oftaxes):
2002 2001 2000
Net income, as reported . . . . . . . . . . . . . . . . . . . . . . . . . $152,713 $145,148 $117,840Intangible amortization . . . . . . . . . . . . . . . . . . . . . . — 2,349 1,843
Net income, pro forma . . . . . . . . . . . . . . . . . . . . . . . . . $152,713 $147,497 $119,683
The pro forma effects of the adoption of SFAS No. 142 on basic and diluted earnings per share is as follows:
2002 2001 2000
Basic net income per share, as reported . . . . . . . . . . . . . . . . . . . . . $1.56 $1.46 $1.20Basic net income per share, pro forma . . . . . . . . . . . . . . . . . . . . . . 1.56 1.49 1.22Diluted net income per share, as reported . . . . . . . . . . . . . . . . . . . 1.52 1.42 1.17Diluted net income per share, pro forma . . . . . . . . . . . . . . . . . . . . 1.52 1.44 1.18
4. ACCRUED AND OTHER LIABILITIES
Accrued liabilities consist of the following (in thousands):
2002 2001
Payroll . . . . . . . . . . . . . . . . . . . . . . . . . . . . . . . . . . . . . . . . . . . . . . $ 70,121 $ 61,713Gift cards . . . . . . . . . . . . . . . . . . . . . . . . . . . . . . . . . . . . . . . . . . . 27,141 17,425Sales tax . . . . . . . . . . . . . . . . . . . . . . . . . . . . . . . . . . . . . . . . . . . . 16,841 14,180Property tax . . . . . . . . . . . . . . . . . . . . . . . . . . . . . . . . . . . . . . . . . . 13,624 12,149Other . . . . . . . . . . . . . . . . . . . . . . . . . . . . . . . . . . . . . . . . . . . . . . 38,783 28,953
$166,510 $134,420
Other liabilities consist of the following (in thousands):
Retirement plan (see Note 11) . . . . . . . . . . . . . . . . . . . . . . . . . . . . $ 29,869 $ 27,371Other . . . . . . . . . . . . . . . . . . . . . . . . . . . . . . . . . . . . . . . . . . . . . . 30,177 24,590
$ 60,046 $ 51,961
5. INCOME TAXES
The provision for income taxes consists of the following (in thousands):
2002 2001 2000
Current income tax expense:Federal . . . . . . . . . . . . . . . . . . . . . . . . . . . . . . . . . . . . . . $47,228 $62,609 $52,958State . . . . . . . . . . . . . . . . . . . . . . . . . . . . . . . . . . . . . . . 6,819 10,269 8,166Foreign . . . . . . . . . . . . . . . . . . . . . . . . . . . . . . . . . . . . . . 923 688 593
Total current income tax expense . . . . . . . . . . . . . . . . . 54,970 73,566 61,717
Deferred income tax expense:Federal . . . . . . . . . . . . . . . . . . . . . . . . . . . . . . . . . . . . . . 22,088 2,989 1,835State . . . . . . . . . . . . . . . . . . . . . . . . . . . . . . . . . . . . . . . 2,078 224 150
Total deferred income tax expense . . . . . . . . . . . . . . . . 24,166 3,213 1,985
$79,136 $76,779 $63,702
F-18
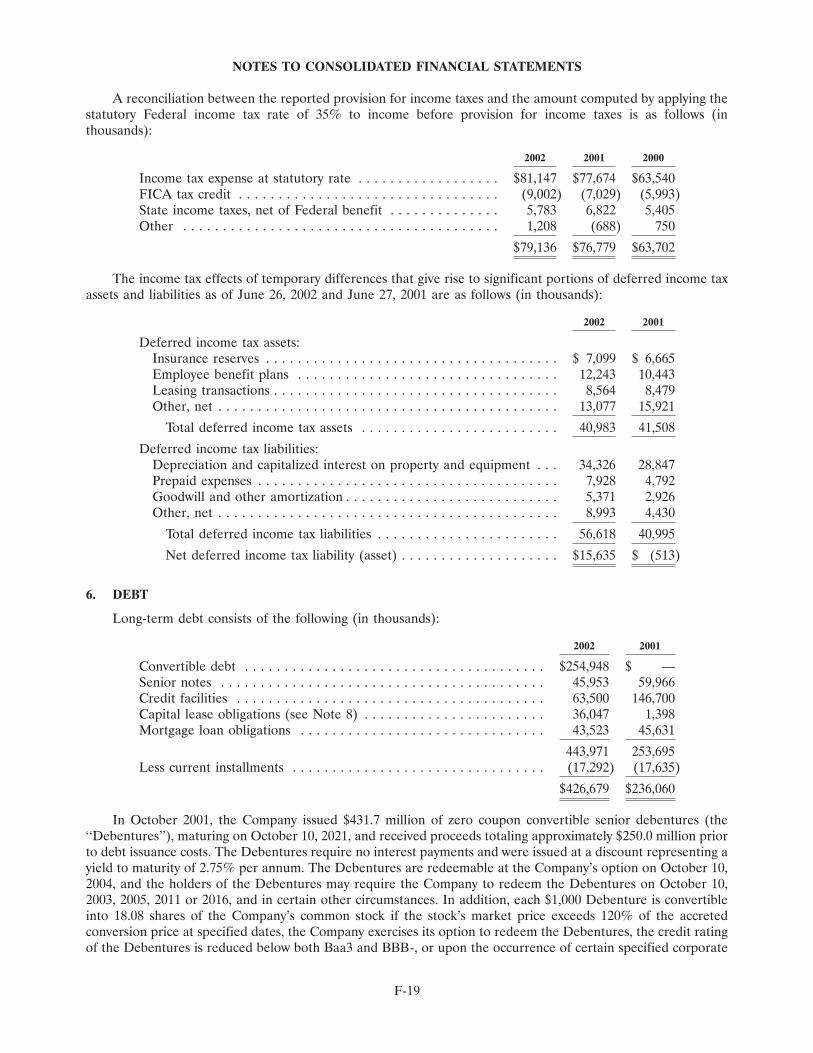
NOTES TO CONSOLIDATED FINANCIAL STATEMENTS
A reconciliation between the reported provision for income taxes and the amount computed by applying thestatutory Federal income tax rate of 35% to income before provision for income taxes is as follows (inthousands):
2002 2001 2000
Income tax expense at statutory rate . . . . . . . . . . . . . . . . . . $81,147 $77,674 $63,540FICA tax credit . . . . . . . . . . . . . . . . . . . . . . . . . . . . . . . . . (9,002) (7,029) (5,993)State income taxes, net of Federal benefit . . . . . . . . . . . . . . 5,783 6,822 5,405Other . . . . . . . . . . . . . . . . . . . . . . . . . . . . . . . . . . . . . . . . 1,208 (688) 750
$79,136 $76,779 $63,702
The income tax effects of temporary differences that give rise to significant portions of deferred income taxassets and liabilities as of June 26, 2002 and June 27, 2001 are as follows (in thousands):
2002 2001
Deferred income tax assets:Insurance reserves . . . . . . . . . . . . . . . . . . . . . . . . . . . . . . . . . . . . . $ 7,099 $ 6,665Employee benefit plans . . . . . . . . . . . . . . . . . . . . . . . . . . . . . . . . . 12,243 10,443Leasing transactions . . . . . . . . . . . . . . . . . . . . . . . . . . . . . . . . . . . . 8,564 8,479Other, net . . . . . . . . . . . . . . . . . . . . . . . . . . . . . . . . . . . . . . . . . . . 13,077 15,921
Total deferred income tax assets . . . . . . . . . . . . . . . . . . . . . . . . . 40,983 41,508
Deferred income tax liabilities:Depreciation and capitalized interest on property and equipment . . . 34,326 28,847Prepaid expenses . . . . . . . . . . . . . . . . . . . . . . . . . . . . . . . . . . . . . . 7,928 4,792Goodwill and other amortization . . . . . . . . . . . . . . . . . . . . . . . . . . . 5,371 2,926Other, net . . . . . . . . . . . . . . . . . . . . . . . . . . . . . . . . . . . . . . . . . . . 8,993 4,430
Total deferred income tax liabilities . . . . . . . . . . . . . . . . . . . . . . . 56,618 40,995
Net deferred income tax liability (asset) . . . . . . . . . . . . . . . . . . . . $15,635 $ (513)
6. DEBT
Long-term debt consists of the following (in thousands):
2002 2001
Convertible debt . . . . . . . . . . . . . . . . . . . . . . . . . . . . . . . . . . . . . . $254,948 $ —Senior notes . . . . . . . . . . . . . . . . . . . . . . . . . . . . . . . . . . . . . . . . . 45,953 59,966Credit facilities . . . . . . . . . . . . . . . . . . . . . . . . . . . . . . . . . . . . . . . 63,500 146,700Capital lease obligations (see Note 8) . . . . . . . . . . . . . . . . . . . . . . . 36,047 1,398Mortgage loan obligations . . . . . . . . . . . . . . . . . . . . . . . . . . . . . . . 43,523 45,631
443,971 253,695Less current installments . . . . . . . . . . . . . . . . . . . . . . . . . . . . . . . . (17,292) (17,635)
$426,679 $236,060
In October 2001, the Company issued $431.7 million of zero coupon convertible senior debentures (the‘‘Debentures’’), maturing on October 10, 2021, and received proceeds totaling approximately $250.0 million priorto debt issuance costs. The Debentures require no interest payments and were issued at a discount representing ayield to maturity of 2.75% per annum. The Debentures are redeemable at the Company’s option on October 10,2004, and the holders of the Debentures may require the Company to redeem the Debentures on October 10,2003, 2005, 2011 or 2016, and in certain other circumstances. In addition, each $1,000 Debenture is convertibleinto 18.08 shares of the Company’s common stock if the stock’s market price exceeds 120% of the accretedconversion price at specified dates, the Company exercises its option to redeem the Debentures, the credit ratingof the Debentures is reduced below both Baa3 and BBB-, or upon the occurrence of certain specified corporate
F-19
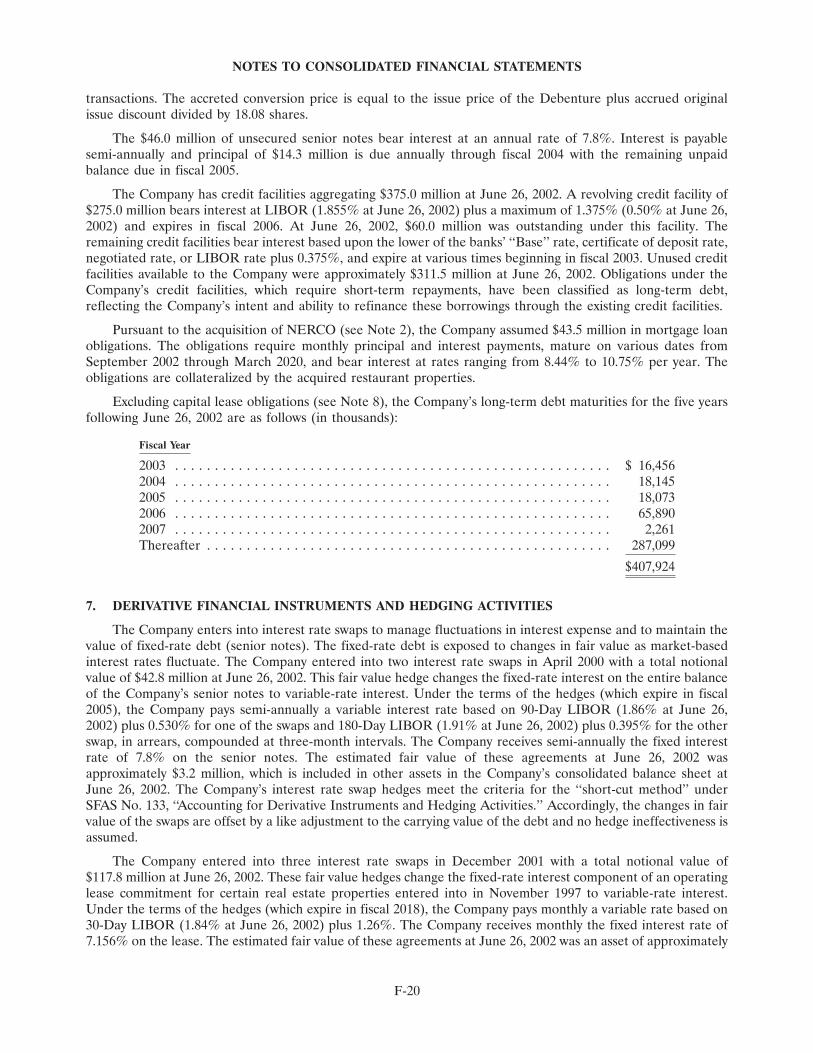
NOTES TO CONSOLIDATED FINANCIAL STATEMENTS
transactions. The accreted conversion price is equal to the issue price of the Debenture plus accrued originalissue discount divided by 18.08 shares.
The $46.0 million of unsecured senior notes bear interest at an annual rate of 7.8%. Interest is payablesemi-annually and principal of $14.3 million is due annually through fiscal 2004 with the remaining unpaidbalance due in fiscal 2005.
The Company has credit facilities aggregating $375.0 million at June 26, 2002. A revolving credit facility of$275.0 million bears interest at LIBOR (1.855% at June 26, 2002) plus a maximum of 1.375% (0.50% at June 26,2002) and expires in fiscal 2006. At June 26, 2002, $60.0 million was outstanding under this facility. Theremaining credit facilities bear interest based upon the lower of the banks’ ‘‘Base’’ rate, certificate of deposit rate,negotiated rate, or LIBOR rate plus 0.375%, and expire at various times beginning in fiscal 2003. Unused creditfacilities available to the Company were approximately $311.5 million at June 26, 2002. Obligations under theCompany’s credit facilities, which require short-term repayments, have been classified as long-term debt,reflecting the Company’s intent and ability to refinance these borrowings through the existing credit facilities.
Pursuant to the acquisition of NERCO (see Note 2), the Company assumed $43.5 million in mortgage loanobligations. The obligations require monthly principal and interest payments, mature on various dates fromSeptember 2002 through March 2020, and bear interest at rates ranging from 8.44% to 10.75% per year. Theobligations are collateralized by the acquired restaurant properties.
Excluding capital lease obligations (see Note 8), the Company’s long-term debt maturities for the five yearsfollowing June 26, 2002 are as follows (in thousands):
Fiscal Year
2003 . . . . . . . . . . . . . . . . . . . . . . . . . . . . . . . . . . . . . . . . . . . . . . . . . . . . . . . $ 16,4562004 . . . . . . . . . . . . . . . . . . . . . . . . . . . . . . . . . . . . . . . . . . . . . . . . . . . . . . . 18,1452005 . . . . . . . . . . . . . . . . . . . . . . . . . . . . . . . . . . . . . . . . . . . . . . . . . . . . . . . 18,0732006 . . . . . . . . . . . . . . . . . . . . . . . . . . . . . . . . . . . . . . . . . . . . . . . . . . . . . . . 65,8902007 . . . . . . . . . . . . . . . . . . . . . . . . . . . . . . . . . . . . . . . . . . . . . . . . . . . . . . . 2,261Thereafter . . . . . . . . . . . . . . . . . . . . . . . . . . . . . . . . . . . . . . . . . . . . . . . . . . . 287,099
$407,924
7. DERIVATIVE FINANCIAL INSTRUMENTS AND HEDGING ACTIVITIES
The Company enters into interest rate swaps to manage fluctuations in interest expense and to maintain thevalue of fixed-rate debt (senior notes). The fixed-rate debt is exposed to changes in fair value as market-basedinterest rates fluctuate. The Company entered into two interest rate swaps in April 2000 with a total notionalvalue of $42.8 million at June 26, 2002. This fair value hedge changes the fixed-rate interest on the entire balanceof the Company’s senior notes to variable-rate interest. Under the terms of the hedges (which expire in fiscal2005), the Company pays semi-annually a variable interest rate based on 90-Day LIBOR (1.86% at June 26,2002) plus 0.530% for one of the swaps and 180-Day LIBOR (1.91% at June 26, 2002) plus 0.395% for the otherswap, in arrears, compounded at three-month intervals. The Company receives semi-annually the fixed interestrate of 7.8% on the senior notes. The estimated fair value of these agreements at June 26, 2002 wasapproximately $3.2 million, which is included in other assets in the Company’s consolidated balance sheet atJune 26, 2002. The Company’s interest rate swap hedges meet the criteria for the ‘‘short-cut method’’ underSFAS No. 133, ‘‘Accounting for Derivative Instruments and Hedging Activities.’’ Accordingly, the changes in fairvalue of the swaps are offset by a like adjustment to the carrying value of the debt and no hedge ineffectiveness isassumed.
The Company entered into three interest rate swaps in December 2001 with a total notional value of$117.8 million at June 26, 2002. These fair value hedges change the fixed-rate interest component of an operatinglease commitment for certain real estate properties entered into in November 1997 to variable-rate interest.Under the terms of the hedges (which expire in fiscal 2018), the Company pays monthly a variable rate based on30-Day LIBOR (1.84% at June 26, 2002) plus 1.26%. The Company receives monthly the fixed interest rate of7.156% on the lease. The estimated fair value of these agreements at June 26, 2002 was an asset of approximately
F-20
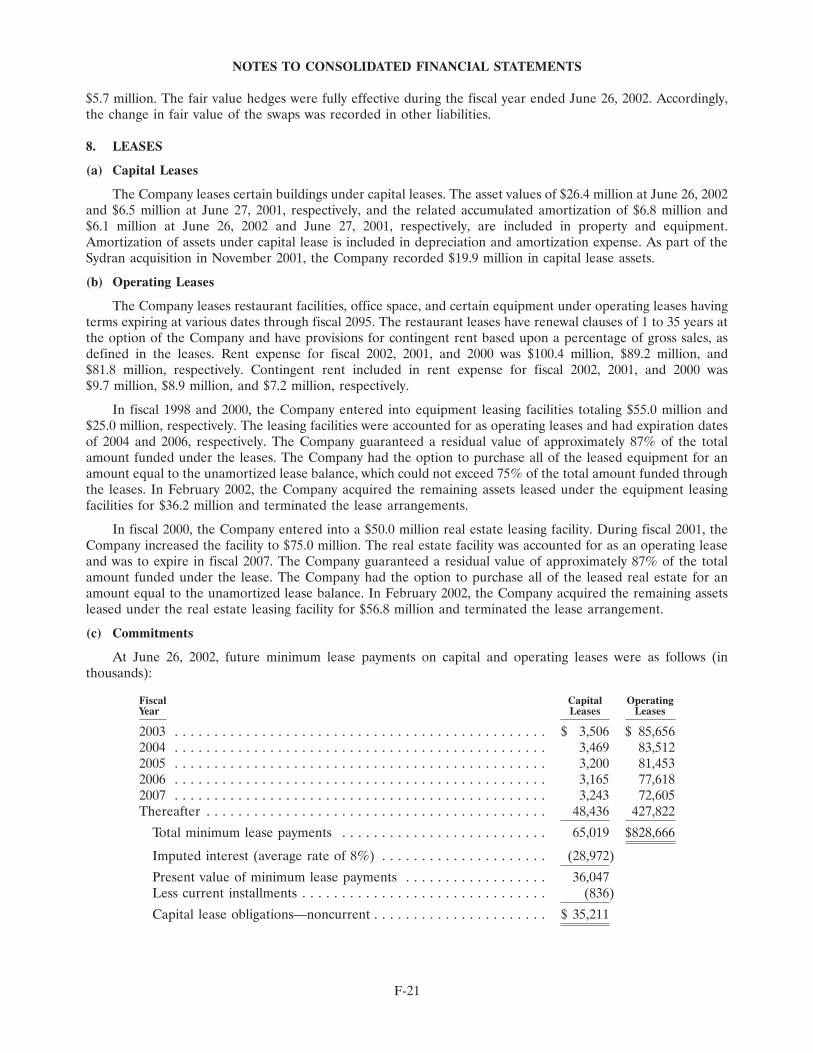
NOTES TO CONSOLIDATED FINANCIAL STATEMENTS
$5.7 million. The fair value hedges were fully effective during the fiscal year ended June 26, 2002. Accordingly,the change in fair value of the swaps was recorded in other liabilities.
8. LEASES
(a) Capital Leases
The Company leases certain buildings under capital leases. The asset values of $26.4 million at June 26, 2002and $6.5 million at June 27, 2001, respectively, and the related accumulated amortization of $6.8 million and$6.1 million at June 26, 2002 and June 27, 2001, respectively, are included in property and equipment.Amortization of assets under capital lease is included in depreciation and amortization expense. As part of theSydran acquisition in November 2001, the Company recorded $19.9 million in capital lease assets.
(b) Operating Leases
The Company leases restaurant facilities, office space, and certain equipment under operating leases havingterms expiring at various dates through fiscal 2095. The restaurant leases have renewal clauses of 1 to 35 years atthe option of the Company and have provisions for contingent rent based upon a percentage of gross sales, asdefined in the leases. Rent expense for fiscal 2002, 2001, and 2000 was $100.4 million, $89.2 million, and$81.8 million, respectively. Contingent rent included in rent expense for fiscal 2002, 2001, and 2000 was$9.7 million, $8.9 million, and $7.2 million, respectively.
In fiscal 1998 and 2000, the Company entered into equipment leasing facilities totaling $55.0 million and$25.0 million, respectively. The leasing facilities were accounted for as operating leases and had expiration datesof 2004 and 2006, respectively. The Company guaranteed a residual value of approximately 87% of the totalamount funded under the leases. The Company had the option to purchase all of the leased equipment for anamount equal to the unamortized lease balance, which could not exceed 75% of the total amount funded throughthe leases. In February 2002, the Company acquired the remaining assets leased under the equipment leasingfacilities for $36.2 million and terminated the lease arrangements.
In fiscal 2000, the Company entered into a $50.0 million real estate leasing facility. During fiscal 2001, theCompany increased the facility to $75.0 million. The real estate facility was accounted for as an operating leaseand was to expire in fiscal 2007. The Company guaranteed a residual value of approximately 87% of the totalamount funded under the lease. The Company had the option to purchase all of the leased real estate for anamount equal to the unamortized lease balance. In February 2002, the Company acquired the remaining assetsleased under the real estate leasing facility for $56.8 million and terminated the lease arrangement.
(c) Commitments
At June 26, 2002, future minimum lease payments on capital and operating leases were as follows (inthousands):
Fiscal Capital OperatingYear Leases Leases
2003 . . . . . . . . . . . . . . . . . . . . . . . . . . . . . . . . . . . . . . . . . . . . . . . $ 3,506 $ 85,6562004 . . . . . . . . . . . . . . . . . . . . . . . . . . . . . . . . . . . . . . . . . . . . . . . 3,469 83,5122005 . . . . . . . . . . . . . . . . . . . . . . . . . . . . . . . . . . . . . . . . . . . . . . . 3,200 81,4532006 . . . . . . . . . . . . . . . . . . . . . . . . . . . . . . . . . . . . . . . . . . . . . . . 3,165 77,6182007 . . . . . . . . . . . . . . . . . . . . . . . . . . . . . . . . . . . . . . . . . . . . . . . 3,243 72,605Thereafter . . . . . . . . . . . . . . . . . . . . . . . . . . . . . . . . . . . . . . . . . . . 48,436 427,822
Total minimum lease payments . . . . . . . . . . . . . . . . . . . . . . . . . . 65,019 $828,666
Imputed interest (average rate of 8%) . . . . . . . . . . . . . . . . . . . . . (28,972)
Present value of minimum lease payments . . . . . . . . . . . . . . . . . . 36,047Less current installments . . . . . . . . . . . . . . . . . . . . . . . . . . . . . . . (836)
Capital lease obligations—noncurrent . . . . . . . . . . . . . . . . . . . . . . $ 35,211
F-21
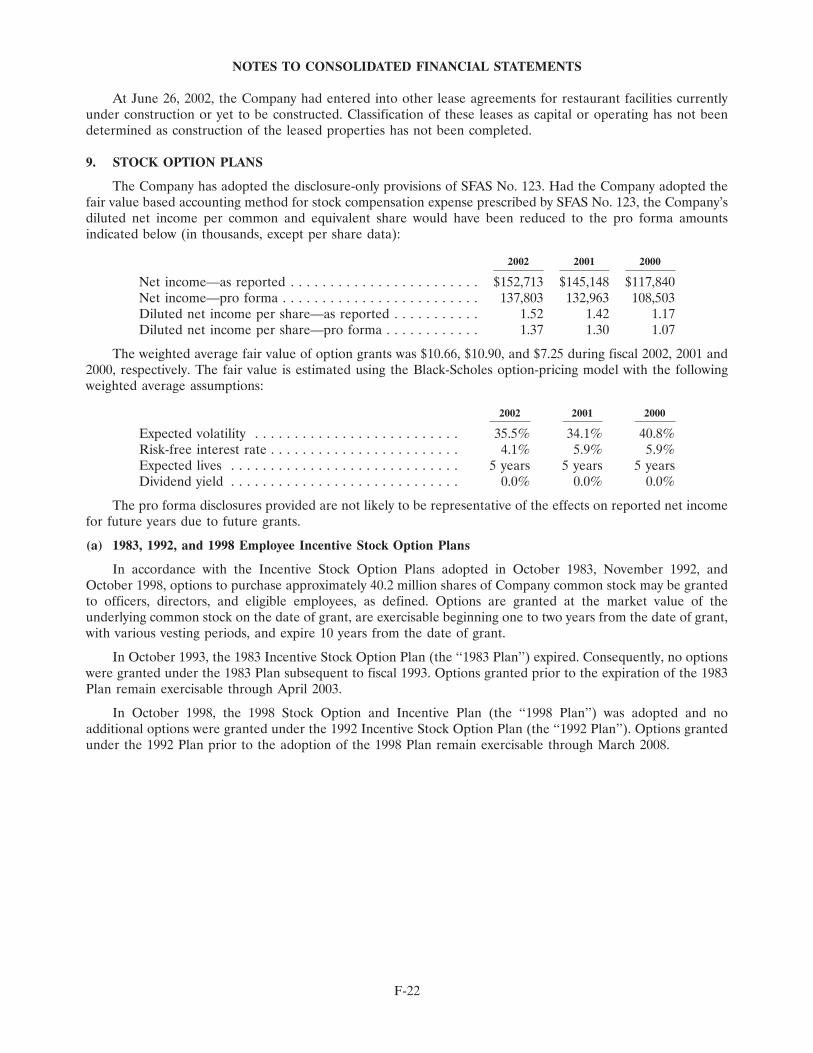
NOTES TO CONSOLIDATED FINANCIAL STATEMENTS
At June 26, 2002, the Company had entered into other lease agreements for restaurant facilities currentlyunder construction or yet to be constructed. Classification of these leases as capital or operating has not beendetermined as construction of the leased properties has not been completed.
9. STOCK OPTION PLANS
The Company has adopted the disclosure-only provisions of SFAS No. 123. Had the Company adopted thefair value based accounting method for stock compensation expense prescribed by SFAS No. 123, the Company’sdiluted net income per common and equivalent share would have been reduced to the pro forma amountsindicated below (in thousands, except per share data):
2002 2001 2000
Net income—as reported . . . . . . . . . . . . . . . . . . . . . . . . $152,713 $145,148 $117,840Net income—pro forma . . . . . . . . . . . . . . . . . . . . . . . . . 137,803 132,963 108,503Diluted net income per share—as reported . . . . . . . . . . . 1.52 1.42 1.17Diluted net income per share—pro forma . . . . . . . . . . . . 1.37 1.30 1.07
The weighted average fair value of option grants was $10.66, $10.90, and $7.25 during fiscal 2002, 2001 and2000, respectively. The fair value is estimated using the Black-Scholes option-pricing model with the followingweighted average assumptions:
2002 2001 2000
Expected volatility . . . . . . . . . . . . . . . . . . . . . . . . . . 35.5% 34.1% 40.8%Risk-free interest rate . . . . . . . . . . . . . . . . . . . . . . . . 4.1% 5.9% 5.9%Expected lives . . . . . . . . . . . . . . . . . . . . . . . . . . . . . 5 years 5 years 5 yearsDividend yield . . . . . . . . . . . . . . . . . . . . . . . . . . . . . 0.0% 0.0% 0.0%
The pro forma disclosures provided are not likely to be representative of the effects on reported net incomefor future years due to future grants.
(a) 1983, 1992, and 1998 Employee Incentive Stock Option Plans
In accordance with the Incentive Stock Option Plans adopted in October 1983, November 1992, andOctober 1998, options to purchase approximately 40.2 million shares of Company common stock may be grantedto officers, directors, and eligible employees, as defined. Options are granted at the market value of theunderlying common stock on the date of grant, are exercisable beginning one to two years from the date of grant,with various vesting periods, and expire 10 years from the date of grant.
In October 1993, the 1983 Incentive Stock Option Plan (the ‘‘1983 Plan’’) expired. Consequently, no optionswere granted under the 1983 Plan subsequent to fiscal 1993. Options granted prior to the expiration of the 1983Plan remain exercisable through April 2003.
In October 1998, the 1998 Stock Option and Incentive Plan (the ‘‘1998 Plan’’) was adopted and noadditional options were granted under the 1992 Incentive Stock Option Plan (the ‘‘1992 Plan’’). Options grantedunder the 1992 Plan prior to the adoption of the 1998 Plan remain exercisable through March 2008.
F-22
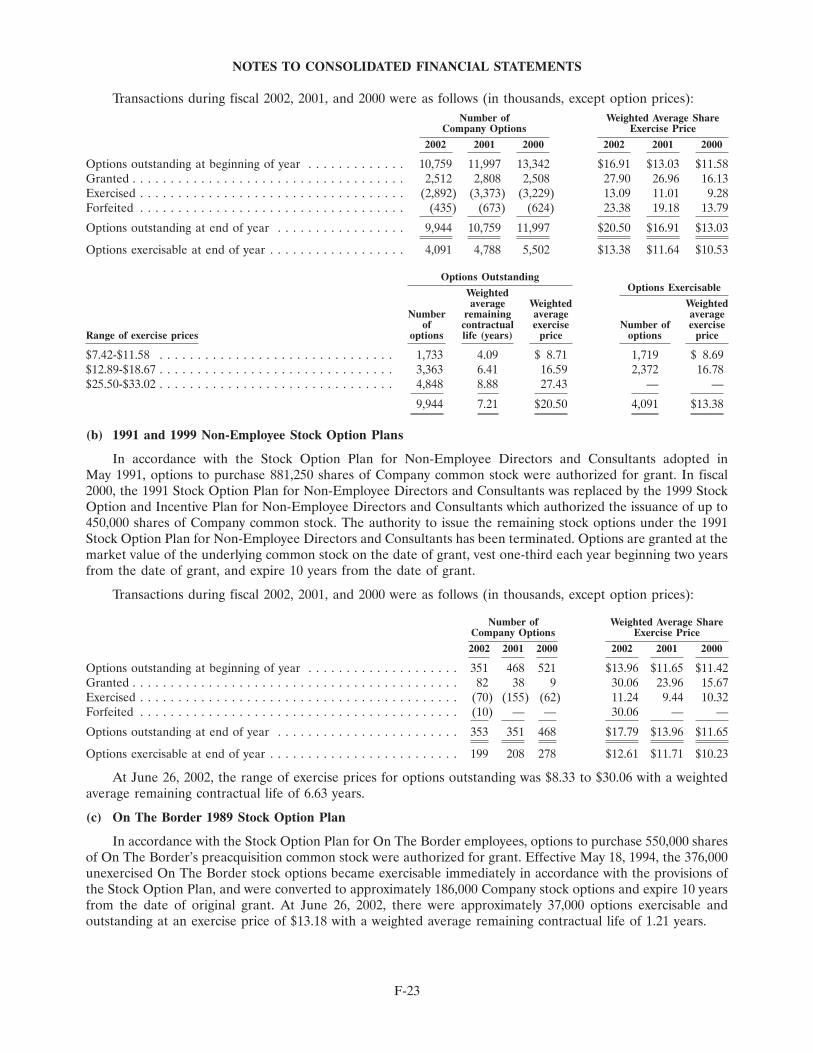
NOTES TO CONSOLIDATED FINANCIAL STATEMENTS
Transactions during fiscal 2002, 2001, and 2000 were as follows (in thousands, except option prices):Number of Weighted Average Share
Company Options Exercise Price
2002 2001 2000 2002 2001 2000
Options outstanding at beginning of year . . . . . . . . . . . . . 10,759 11,997 13,342 $16.91 $13.03 $11.58Granted . . . . . . . . . . . . . . . . . . . . . . . . . . . . . . . . . . . . 2,512 2,808 2,508 27.90 26.96 16.13Exercised . . . . . . . . . . . . . . . . . . . . . . . . . . . . . . . . . . . (2,892) (3,373) (3,229) 13.09 11.01 9.28Forfeited . . . . . . . . . . . . . . . . . . . . . . . . . . . . . . . . . . . (435) (673) (624) 23.38 19.18 13.79
Options outstanding at end of year . . . . . . . . . . . . . . . . . 9,944 10,759 11,997 $20.50 $16.91 $13.03
Options exercisable at end of year . . . . . . . . . . . . . . . . . . 4,091 4,788 5,502 $13.38 $11.64 $10.53
Options OutstandingOptions ExercisableWeighted
average Weighted WeightedNumber remaining average average
of contractual exercise Number of exerciseRange of exercise prices options life (years) price options price
$7.42-$11.58 . . . . . . . . . . . . . . . . . . . . . . . . . . . . . . . 1,733 4.09 $ 8.71 1,719 $ 8.69$12.89-$18.67 . . . . . . . . . . . . . . . . . . . . . . . . . . . . . . . 3,363 6.41 16.59 2,372 16.78$25.50-$33.02 . . . . . . . . . . . . . . . . . . . . . . . . . . . . . . . 4,848 8.88 27.43 — —
9,944 7.21 $20.50 4,091 $13.38
(b) 1991 and 1999 Non-Employee Stock Option Plans
In accordance with the Stock Option Plan for Non-Employee Directors and Consultants adopted inMay 1991, options to purchase 881,250 shares of Company common stock were authorized for grant. In fiscal2000, the 1991 Stock Option Plan for Non-Employee Directors and Consultants was replaced by the 1999 StockOption and Incentive Plan for Non-Employee Directors and Consultants which authorized the issuance of up to450,000 shares of Company common stock. The authority to issue the remaining stock options under the 1991Stock Option Plan for Non-Employee Directors and Consultants has been terminated. Options are granted at themarket value of the underlying common stock on the date of grant, vest one-third each year beginning two yearsfrom the date of grant, and expire 10 years from the date of grant.
Transactions during fiscal 2002, 2001, and 2000 were as follows (in thousands, except option prices):
Number of Weighted Average ShareCompany Options Exercise Price
2002 2001 2000 2002 2001 2000
Options outstanding at beginning of year . . . . . . . . . . . . . . . . . . . . 351 468 521 $13.96 $11.65 $11.42Granted . . . . . . . . . . . . . . . . . . . . . . . . . . . . . . . . . . . . . . . . . . . 82 38 9 30.06 23.96 15.67Exercised . . . . . . . . . . . . . . . . . . . . . . . . . . . . . . . . . . . . . . . . . . (70) (155) (62) 11.24 9.44 10.32Forfeited . . . . . . . . . . . . . . . . . . . . . . . . . . . . . . . . . . . . . . . . . . (10) — — 30.06 — —
Options outstanding at end of year . . . . . . . . . . . . . . . . . . . . . . . . 353 351 468 $17.79 $13.96 $11.65
Options exercisable at end of year . . . . . . . . . . . . . . . . . . . . . . . . . 199 208 278 $12.61 $11.71 $10.23
At June 26, 2002, the range of exercise prices for options outstanding was $8.33 to $30.06 with a weightedaverage remaining contractual life of 6.63 years.
(c) On The Border 1989 Stock Option Plan
In accordance with the Stock Option Plan for On The Border employees, options to purchase 550,000 sharesof On The Border’s preacquisition common stock were authorized for grant. Effective May 18, 1994, the 376,000unexercised On The Border stock options became exercisable immediately in accordance with the provisions ofthe Stock Option Plan, and were converted to approximately 186,000 Company stock options and expire 10 yearsfrom the date of original grant. At June 26, 2002, there were approximately 37,000 options exercisable andoutstanding at an exercise price of $13.18 with a weighted average remaining contractual life of 1.21 years.
F-23
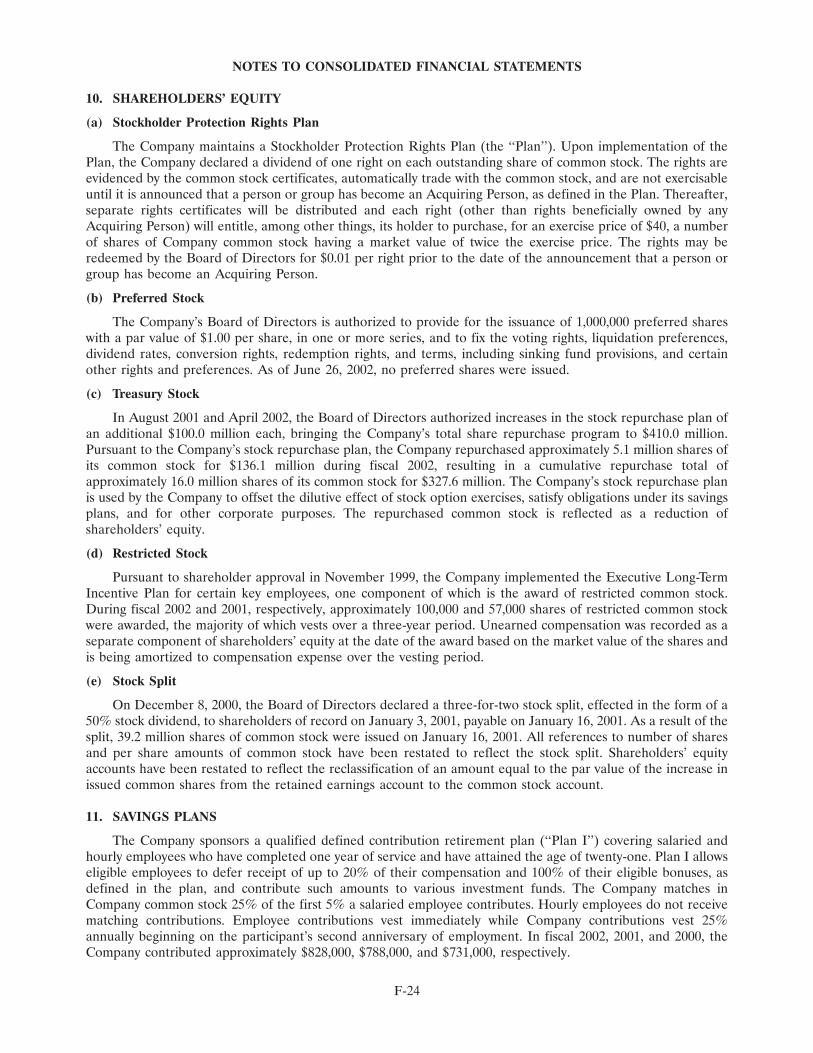
NOTES TO CONSOLIDATED FINANCIAL STATEMENTS
10. SHAREHOLDERS’ EQUITY
(a) Stockholder Protection Rights Plan
The Company maintains a Stockholder Protection Rights Plan (the ‘‘Plan’’). Upon implementation of thePlan, the Company declared a dividend of one right on each outstanding share of common stock. The rights areevidenced by the common stock certificates, automatically trade with the common stock, and are not exercisableuntil it is announced that a person or group has become an Acquiring Person, as defined in the Plan. Thereafter,separate rights certificates will be distributed and each right (other than rights beneficially owned by anyAcquiring Person) will entitle, among other things, its holder to purchase, for an exercise price of $40, a numberof shares of Company common stock having a market value of twice the exercise price. The rights may beredeemed by the Board of Directors for $0.01 per right prior to the date of the announcement that a person orgroup has become an Acquiring Person.
(b) Preferred Stock
The Company’s Board of Directors is authorized to provide for the issuance of 1,000,000 preferred shareswith a par value of $1.00 per share, in one or more series, and to fix the voting rights, liquidation preferences,dividend rates, conversion rights, redemption rights, and terms, including sinking fund provisions, and certainother rights and preferences. As of June 26, 2002, no preferred shares were issued.
(c) Treasury Stock
In August 2001 and April 2002, the Board of Directors authorized increases in the stock repurchase plan ofan additional $100.0 million each, bringing the Company’s total share repurchase program to $410.0 million.Pursuant to the Company’s stock repurchase plan, the Company repurchased approximately 5.1 million shares ofits common stock for $136.1 million during fiscal 2002, resulting in a cumulative repurchase total ofapproximately 16.0 million shares of its common stock for $327.6 million. The Company’s stock repurchase planis used by the Company to offset the dilutive effect of stock option exercises, satisfy obligations under its savingsplans, and for other corporate purposes. The repurchased common stock is reflected as a reduction ofshareholders’ equity.
(d) Restricted Stock
Pursuant to shareholder approval in November 1999, the Company implemented the Executive Long-TermIncentive Plan for certain key employees, one component of which is the award of restricted common stock.During fiscal 2002 and 2001, respectively, approximately 100,000 and 57,000 shares of restricted common stockwere awarded, the majority of which vests over a three-year period. Unearned compensation was recorded as aseparate component of shareholders’ equity at the date of the award based on the market value of the shares andis being amortized to compensation expense over the vesting period.
(e) Stock Split
On December 8, 2000, the Board of Directors declared a three-for-two stock split, effected in the form of a50% stock dividend, to shareholders of record on January 3, 2001, payable on January 16, 2001. As a result of thesplit, 39.2 million shares of common stock were issued on January 16, 2001. All references to number of sharesand per share amounts of common stock have been restated to reflect the stock split. Shareholders’ equityaccounts have been restated to reflect the reclassification of an amount equal to the par value of the increase inissued common shares from the retained earnings account to the common stock account.
11. SAVINGS PLANS
The Company sponsors a qualified defined contribution retirement plan (‘‘Plan I’’) covering salaried andhourly employees who have completed one year of service and have attained the age of twenty-one. Plan I allowseligible employees to defer receipt of up to 20% of their compensation and 100% of their eligible bonuses, asdefined in the plan, and contribute such amounts to various investment funds. The Company matches inCompany common stock 25% of the first 5% a salaried employee contributes. Hourly employees do not receivematching contributions. Employee contributions vest immediately while Company contributions vest 25%annually beginning on the participant’s second anniversary of employment. In fiscal 2002, 2001, and 2000, theCompany contributed approximately $828,000, $788,000, and $731,000, respectively.
F-24

NOTES TO CONSOLIDATED FINANCIAL STATEMENTS
The Company sponsors a non-qualified defined contribution retirement plan (‘‘Plan II’’) covering highlycompensated employees, as defined in the plan. Plan II allows eligible employees to defer receipt of up to 50% oftheir base compensation and 100% of their eligible bonuses, as defined in the plan. The Company matches inCompany common stock 25% of the first 5% of non-officer contributions while officers’ contributions arematched at the same rate with cash. Employee contributions vest immediately while Company contributions vest25% annually beginning on the participant’s second anniversary of employment. In fiscal 2002, 2001, and 2000,the Company contributed approximately $657,000, $655,000, and $543,000, respectively. At the inception of PlanII, the Company established a Rabbi Trust to fund Plan II obligations. The market value of the trust assets isincluded in other assets and the liability to Plan II participants is included in other liabilities.
12. SUPPLEMENTAL CASH FLOW INFORMATION
Cash paid for interest and income taxes is as follows (in thousands):2002 2001 2000
Interest, net of amounts capitalized . . . . . . . . . . . . . . . . . . . $ 8,229 $ 8,904 $10,192Income taxes, net of refunds . . . . . . . . . . . . . . . . . . . . . . . . 48,801 68,597 36,646
Non-cash investing and financing activities are as follows (in thousands):2002 2001 2000
Restricted common stock issued, net of forfeitures . . . . . . . . $ 2,435 $ 371 $ 5,181Increase in fair value of interest rate swaps and debt . . . . . . 286 2,867 —Decrease in fair value of forward rate agreements included
in other comprehensive income . . . . . . . . . . . . . . . . . . . . — 895 —Increase in fair value of interest rate swaps on real estate
leasing facility . . . . . . . . . . . . . . . . . . . . . . . . . . . . . . . . . 5,667 — —
During 2002, the Company purchased certain assets and assumed certain liabilities in connection with theacquisition of restaurants. The fair values of the acquired assets and liabilities recorded at the date of acquisitionare as follows (in thousands):
Property and equipment acquired . . . . . . . . . . . . . . . . . . . . . . . . . . . . . . . . . . $ 36,312Goodwill . . . . . . . . . . . . . . . . . . . . . . . . . . . . . . . . . . . . . . . . . . . . . . . . . . . . 55,473Other assets acquired . . . . . . . . . . . . . . . . . . . . . . . . . . . . . . . . . . . . . . . . . . . 8,585Capital lease obligations assumed . . . . . . . . . . . . . . . . . . . . . . . . . . . . . . . . . . (35,480)Other liabilities assumed . . . . . . . . . . . . . . . . . . . . . . . . . . . . . . . . . . . . . . . . . (4,399)
Net cash paid . . . . . . . . . . . . . . . . . . . . . . . . . . . . . . . . . . . . . . . . . . . . . . . . . $ 60,491
13. RELATED PARTY TRANSACTION
The Company has secured notes receivable from Eatzi’s Corporation (‘‘Eatzi’s’’) with a carrying value ofapproximately $11.0 million and $20.6 million at June 26, 2002 and June 27, 2001, respectively. Approximately$6.0 million of the notes receivable is convertible into nonvoting Series A Preferred Stock of Eatzi’s at the optionof the Company and matures on December 28, 2006. The remaining note receivable matures on September 28,2005.
Interest on the convertible note receivable is 10.5% per year with payments due on a quarterly basis until theprincipal balance and all accrued and unpaid interest have been paid in full. Interest on the remaining notesreceivable balance is prime rate plus 1.5% per year with payments due on a quarterly basis until the principalbalance and all accrued and unpaid interest have been paid in full. The notes receivable are included in otherassets in the accompanying consolidated balance sheets.
During fiscal 2002 and 2001, certain scheduled payments were not made as the Company continuednegotiations with Eatzi’s to restructure the notes receivable. A letter of intent was signed on August 6, 2002 todivest the Company of its interest in the concept. Under the terms of the letter, Eatzi’s has agreed to pay theCompany $11.0 million in cash and to execute a $4.0 million promissory note in consideration for its interest inthe concept. The promissory note will be unsecured and payable only upon the closing of an initial public offering
F-25

NOTES TO CONSOLIDATED FINANCIAL STATEMENTS
by Eatzi’s. Due to the uncertainty of collecting the $4.0 million promissory note, the Company will establish areserve for the entire principal balance. As a result of the divesture, in fiscal 2002 an approximate $8.7 millionimpairment charge was recorded in restaurant expenses to reduce the notes to their net realizable value.
14. CONTINGENCIES
During fiscal 2002, the Company recorded an approximate $11.0 million charge to restaurant expensesstemming from an agreement reached with the California Department of Labor Standards Enforcement(‘‘DLSE’’). The DLSE’s primary allegation involved the Company’s documentation policies related to breaksprovided to employees. The Company believes it has been in substantial compliance with the California laborlaws related to employee breaks and other employee related matters, but was unable to document all issues tothe DLSE’s satisfaction. The Company agreed to the settlement to avoid a potentially costly and protractedlitigation.
The Company is engaged in various legal proceedings and has certain unresolved claims pending. Theultimate liability, if any, for the aggregate amounts claimed cannot be determined at this time. However,management of the Company, based upon consultation with legal counsel, is of the opinion that there are nomatters pending or threatened which are expected to have a material adverse effect, individually or in theaggregate, on the Company’s consolidated financial condition or results of operations.
15. QUARTERLY RESULTS OF OPERATIONS (UNAUDITED)
The following table summarizes the unaudited consolidated quarterly results of operations for fiscal 2002and 2001 (in thousands, except per share amounts):
Fiscal Year 2002Quarters Ended
Sept. 26 Dec. 26 March 27 June 26
Revenues . . . . . . . . . . . . . . . . . . . . . . . . . . . $672,655 $685,752 $745,786 $782,918Income before provision for income taxes . . . . 60,695 52,960 51,617 66,577Net income . . . . . . . . . . . . . . . . . . . . . . . . . . 39,634 34,636 34,170 44,273Basic net income per share . . . . . . . . . . . . . . 0.40 0.35 0.35 0.45Diluted net income per share . . . . . . . . . . . . 0.39 0.35 0.34 0.44Basic weighted average shares outstanding . . . 98,963 97,718 97,694 97,675Diluted weighted average shares outstanding . 101,572 100,131 100,652 100,491
Fiscal Year 2001Quarters Ended
Sept. 27 Dec. 27 March 28 June 27
Revenues . . . . . . . . . . . . . . . . . . . . . . . . . . . $573,925 $567,546 $608,192 $657,211Income before provision for income taxes . . . . 54,311 49,714 53,801 64,101Net income . . . . . . . . . . . . . . . . . . . . . . . . . . 35,194 32,215 34,863 42,876Basic net income per share . . . . . . . . . . . . . . 0.36 0.33 0.35 0.43Diluted net income per share . . . . . . . . . . . . 0.35 0.32 0.34 0.42Basic weighted average shares outstanding . . . 98,753 98,497 99,450 99,800Diluted weighted average shares outstanding . 101,570 101,718 102,498 102,577
F-26
INDEPENDENT AUDITORS’ REPORT
The Board of DirectorsBrinker International, Inc.:
We have audited the accompanying consolidated balance sheets of Brinker International, Inc. andsubsidiaries as of June 26, 2002 and June 27, 2001, and the related consolidated statements of income,shareholders’ equity and cash flows for each of the years in the three-year period ended June 26, 2002. Theseconsolidated financial statements are the responsibility of the Company’s management. Our responsibility is toexpress an opinion on these consolidated financial statements based on our audits.
We conducted our audits in accordance with auditing standards generally accepted in the United States ofAmerica. Those standards require that we plan and perform the audit to obtain reasonable assurance aboutwhether the financial statements are free of material misstatement. An audit includes examining, on a test basis,evidence supporting the amounts and disclosures in the financial statements. An audit also includes assessing theaccounting principles used and significant estimates made by management, as well as evaluating the overallfinancial statement presentation. We believe that our audits provide a reasonable basis for our opinion.
In our opinion, the consolidated financial statements referred to above present fairly, in all materialrespects, the financial position of Brinker International, Inc. and subsidiaries as of June 26, 2002 and June 27,2001, and the results of their operations and their cash flows for each of the years in the three-year period endedJune 26, 2002 in conformity with accounting principles generally accepted in the United States of America.
KPMG LLP
Dallas, TexasJuly 31, 2002, except for Note 13,
as to which the date is August 6, 2002
F-27
MANAGEMENT’S RESPONSIBILITY FOR CONSOLIDATED FINANCIAL STATEMENTS
To Our Shareholders:
Management is responsible for the reliability of the consolidated financial statements and related notes,which have been prepared in conformity with accounting principles generally accepted in the United States ofAmerica and include amounts based upon our estimate and judgments, as required. The consolidated financialstatements have been audited and reported on by our independent auditors, KPMG LLP, who were given freeaccess to all financial records and related data, including minutes of the meetings of the Board of Directors andCommittees of the Board. We believe that the representations made to the independent auditors were valid andappropriate.
The Company maintains a system of internal controls over financial reporting designed to providereasonable assurance of the reliability of the consolidated financial statements. The Company’s internal auditfunction monitors and reports on the adequacy of the compliance with the internal control system andappropriate actions are taken to address significant control deficiencies and other opportunities for improvingthe system as they are identified. The Audit Committee of the Board of Directors, which is comprised solely ofoutside directors, provides oversight to the financial reporting process through periodic meetings with ourindependent auditors, internal auditors, and management. Both our independent auditors and internal auditorshave free access to the Audit Committee. Although no cost-effective internal control system will preclude allerrors and irregularities, we believe our controls as of and for the year ended June 26, 2002 provide reasonableassurance that the consolidated financial statements are reliable.
RONALD A. MCDOUGALLChairman of the Board and Chief Executive Officer
CHARLES M. SONSTEBYExecutive Vice President and Chief Financial Officer
F-28