Sysmic Behaviour of Curtain Wall Facades
194
POLITECNICO DI MILANO VI Facoltà – Ingegneria Edile-Architettura Corso di Laurea in Ingegneria dei Sistemi Edilizi Tesi di laurea SEISMIC BEHAVIOUR OF CURTAIN WALL FACADES A COMPARISON BETWEEN EXPERIMENTAL MOCK-UP TEST AND FINITE ELEMENT METHOD ANALYSIS Relatore: Prof. Paolo RIGONE Correlatore: Ing. Giampiero MANARA Umberto GALLI Matr. N. 755073 Anno Accademico 2010-2011
description
thesis at PoliMI
Transcript of Sysmic Behaviour of Curtain Wall Facades
POLITECNICO DI MILANO
VI Facoltà – Ingegneria Edile-Architettura
Corso di Laurea in Ingegneria dei Sistemi Edilizi
Tesi di laurea
SEISMIC BEHAVIOUR
OF CURTAIN WALL FACADES
A COMPARISON BETWEEN EXPERIMENTAL MOCK-UP
TEST AND FINITE ELEMENT METHOD ANALYSIS
Relatore: Prof. Paolo RIGONE
Correlatore: Ing. Giampiero MANARA
Umberto GALLI Matr. N. 755073
Anno Accademico 2010-2011

SUMMARY
I
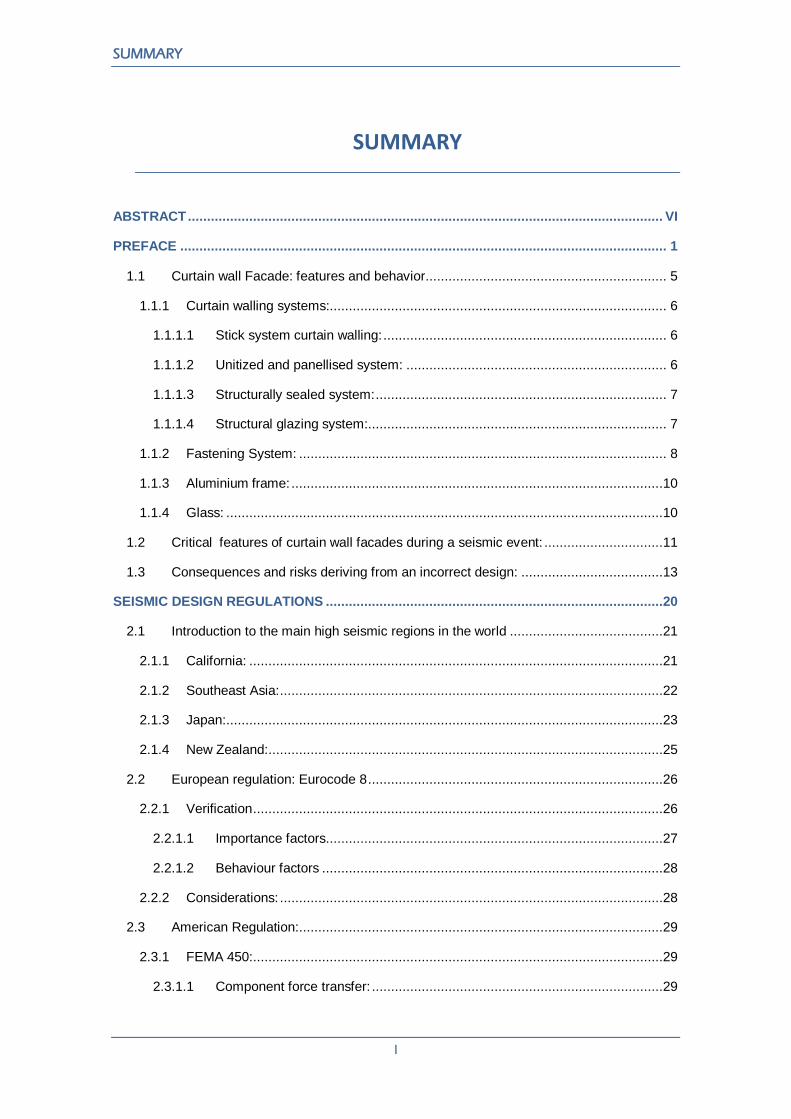
SUMMARY
ABSTRACT ............................................................................................................................ VI
PREFACE ............................................................................................................................... 1
1.1 Curtain wall Facade: features and behavior ............................................................... 5
1.1.1 Curtain walling systems:........................................................................................ 6
1.1.1.1 Stick system curtain walling: .......................................................................... 6
1.1.1.2 Unitized and panellised system: .................................................................... 6
1.1.1.3 Structurally sealed system: ............................................................................ 7
1.1.1.4 Structural glazing system:.............................................................................. 7
1.1.2 Fastening System: ................................................................................................ 8
1.1.3 Aluminium frame: .................................................................................................10
1.1.4 Glass: ..................................................................................................................10
1.2 Critical features of curtain wall facades during a seismic event: ...............................11
1.3 Consequences and risks deriving from an incorrect design: .....................................13
SEISMIC DESIGN REGULATIONS ........................................................................................20
2.1 Introduction to the main high seismic regions in the world ........................................21
2.1.1 California: ............................................................................................................21
2.1.2 Southeast Asia: ....................................................................................................22
2.1.3 Japan:..................................................................................................................23
2.1.4 New Zealand:.......................................................................................................25
2.2 European regulation: Eurocode 8 .............................................................................26
2.2.1 Verification ...........................................................................................................26
2.2.1.1 Importance factors........................................................................................27
2.2.1.2 Behaviour factors .........................................................................................28
2.2.2 Considerations: ....................................................................................................28
2.3 American Regulation: ...............................................................................................29
2.3.1 FEMA 450: ...........................................................................................................29
2.3.1.1 Component force transfer: ............................................................................29
SEISMIC BEHAVIOUR OF CURTAIN WALL FACADES Umberto Galli
II
2.3.1.2 Seismic forces: .............................................................................................30
2.3.1.3 Seismic relative displacements: ....................................................................30
2.3.1.4 Architectural components: ............................................................................31
2.3.1.5 Exterior non-structural wall elements and connections. .................................32
2.3.1.6 Seismic Drift Limits for Glass Components. ..................................................32
2.3.2 Considerations: ....................................................................................................33
2.4 New Zealand Standards...........................................................................................33
2.4.1 NZS 1170.5: ........................................................................................................33
2.4.2 Design action on parts: ........................................................................................34
2.4.2.1 Horizontal design actions:.............................................................................35
2.4.2.2 Vertical design actions: .................................................................................35
2.4.2.3 Deflection induced actions: ...........................................................................36
2.4.2.4 Part response factor Cph: ..............................................................................36
2.4.2.5 Connections: ................................................................................................36
2.4.3 Considerations: ....................................................................................................37
2.5 Japan regulation: .....................................................................................................37
2.5.1 JASS14: ..............................................................................................................37
2.5.1.1 Design specification: ....................................................................................38
2.5.1.2 Considerations: ............................................................................................38
2.6 Comparison between regulations: ............................................................................39
2.7 AAMA 501.4 and AAMA 501.6: ................................................................................40
2.7.1 AAMA 501.4-00: ..................................................................................................41
2.7.2 AAMA 501.6-00: ..................................................................................................42
2.7.3 Conclusions: ........................................................................................................43
CASE OF STUDY ...................................................................................................................45
3.1 Introduction and description of the case of study: .....................................................45
3.2 Design and comparison criteria: ...............................................................................50
3.3 Conclusions: ............................................................................................................51
EXPERIMENTAL PERFORMANCE TEST ..............................................................................53
4.1 Mock-up performance test: the background ..............................................................53

SUMMARY
III
4.1.1 GENERAL DESCRIPTION OF TESTING: ............................................................55
4.1.1.1 Air Leakage Test: .........................................................................................55
4.1.1.2 Watertightness – Static Test: ........................................................................55
4.1.1.3 Wind Resistance Test:..................................................................................56
4.1.1.4 Watertightness – Dynamic Test: ...................................................................56
4.1.1.5 Thermal Test: ...............................................................................................57
4.1.1.6 Impact Test: .................................................................................................57
4.2 Equipment and test set up: ......................................................................................59
4.3 Regulation of reference: JASS14 .............................................................................71
4.4 Experimental results: ...............................................................................................73
4.5 Air Leakage Test:.....................................................................................................85
4.5.1 Air leakage test results: ........................................................................................86
F.E.M. MODELLING ISSUES .................................................................................................89
5.1 F.E.M. realization and finite element software Straus7 .............................................89
5.2 Modelling and simplification criteria of the case of study ...........................................92
5.3 Modelling results: ...................................................................................................104
5.4 Conclusions: ..........................................................................................................113
RESULTS COMPARISON ....................................................................................................115
6.1 The numerical comparison: ....................................................................................115
6.2 Qualitative comparison:..........................................................................................121
OTHER MODELS .................................................................................................................127
7.1 Facade unit typology description: ...........................................................................127
7.1.1 Case 1: ..............................................................................................................128
7.1.2 Case 2: ..............................................................................................................129
7.2 Modelling phase:....................................................................................................130
7.3 Modelling results: ...................................................................................................136
CONCLUSIONS ...................................................................................................................147
FINAL CONSIDERATIONS AND FUTURE DEVELOPMENTS .............................................152
REFERENCES .....................................................................................................................155
APPENDIX A ........................................................................................................................160

SEISMIC BEHAVIOUR OF CURTAIN WALL FACADES Umberto Galli
IV
INDEX OF FIGURES ............................................................................................................174
INDEX OF TABLES ..............................................................................................................180
INDEX OF GRAPHS .............................................................................................................181

SUMMARY
V

ABSTRACT
The present work is the result of a six months internship period at Permasteelisa S.p.a., a
company specialized in design, production and manufacturing of curtain walls. Thanks to its
laboratory facility and engineering offices, this study could have been carried out.
In the first part an introduction about seismic phenomena and curtain wall façade is present.
The most important criteria and features to be considered in the evaluation of the seismic
behaviour of this “non-structural” element are reported. It is also fundamental the recognizing of
the displacement applied to the façade, the “inter-storey drift”, as the worst load induced by an
earthquake to a curtain wall, compared to forces and accelerations resulting from the same
seismic event. After a comparison between the main National Regulations, Japanese JASS14
Standard has been chosen as reference.
The following chapters describe the two different methods utilized: an experimental
performance mock-up test, thanks to the use of Permasteelisa facility and its “seismic beam”,
and a theoretical FEM modelling, through the use of the FEM software Straus7. A comparison
between the results of the two different methods has been carried out: in a quantitative manner,
in terms of displacements recorded during experimental tests and resulted from the FEM model
solving; in a qualitative manner, through global considerations of the physical phenomena
occurred during the experimental phase and, most of all, through the study of the FEM model
outputs, primarily the stress distribution of every component.
The results show that the considered unitized and panellized façade (structurally sealed
system) behaves optimally during an earthquake, whichever its intensity could be, satisfying all
the JASS14 standard requirements also thanks to the bearing phenomena of the alignment
screw during the hardest test cycle. The FEM model can represent at the same time an
important and complementary tool in the seismic design of a façade, but has to be improved
and refined with the addition of the friction contribute. Anyway it offers the possibility to
recognise stress values distribution and concentration points of every unit component.
ABSTRACT
VII
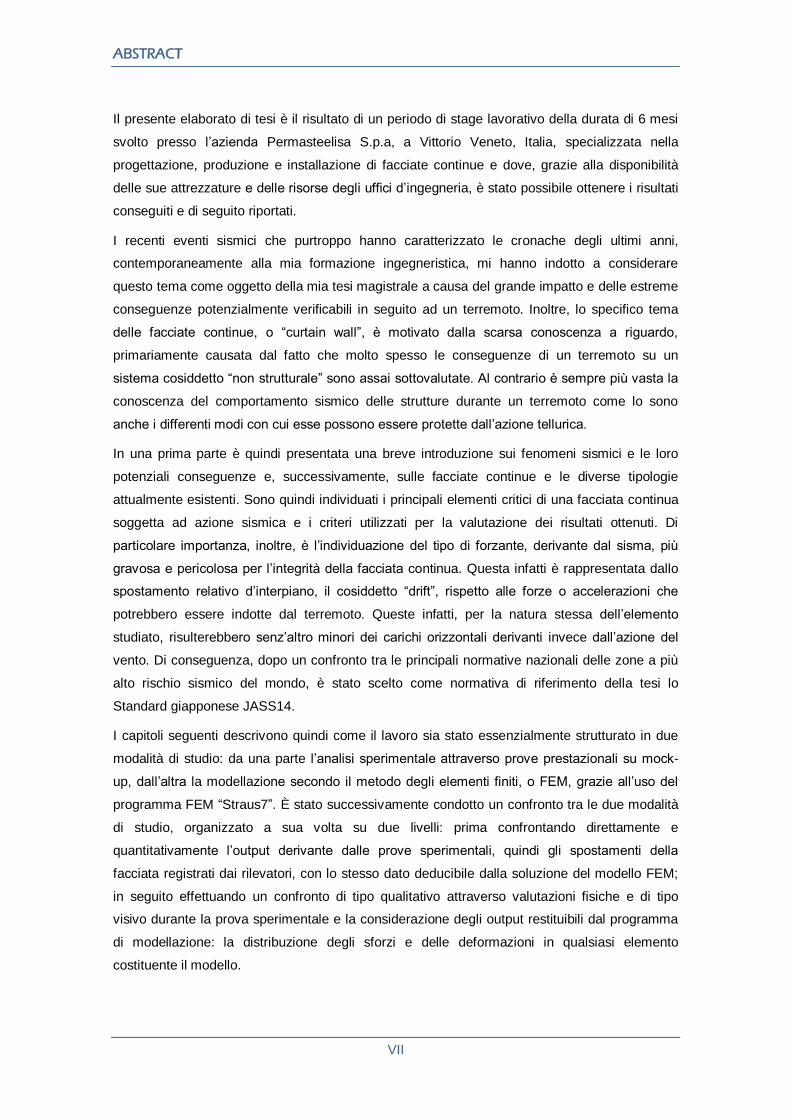
Il presente elaborato di tesi è il risultato di un periodo di stage lavorativo della durata di 6 mesi
svolto presso l’azienda Permasteelisa S.p.a, a Vittorio Veneto, Italia, specializzata nella
progettazione, produzione e installazione di facciate continue e dove, grazie alla disponibilità
delle sue attrezzature e delle risorse degli uffici d’ingegneria, è stato possibile ottenere i risultati
conseguiti e di seguito riportati.
I recenti eventi sismici che purtroppo hanno caratterizzato le cronache degli ultimi anni,
contemporaneamente alla mia formazione ingegneristica, mi hanno indotto a considerare
questo tema come oggetto della mia tesi magistrale a causa del grande impatto e delle estreme
conseguenze potenzialmente verificabili in seguito ad un terremoto. Inoltre, lo specifico tema
delle facciate continue, o “curtain wall”, è motivato dalla scarsa conoscenza a riguardo,
primariamente causata dal fatto che molto spesso le conseguenze di un terremoto su un
sistema cosiddetto “non strutturale” sono assai sottovalutate. Al contrario è sempre più vasta la
conoscenza del comportamento sismico delle strutture durante un terremoto come lo sono
anche i differenti modi con cui esse possono essere protette dall’azione tellurica.
In una prima parte è quindi presentata una breve introduzione sui fenomeni sismici e le loro
potenziali conseguenze e, successivamente, sulle facciate continue e le diverse tipologie
attualmente esistenti. Sono quindi individuati i principali elementi critici di una facciata continua
soggetta ad azione sismica e i criteri utilizzati per la valutazione dei risultati ottenuti. Di
particolare importanza, inoltre, è l’individuazione del tipo di forzante, derivante dal sisma, più
gravosa e pericolosa per l’integrità della facciata continua. Questa infatti è rappresentata dallo
spostamento relativo d’interpiano, il cosiddetto “drift”, rispetto alle forze o accelerazioni che
potrebbero essere indotte dal terremoto. Queste infatti, per la natura stessa dell’elemento
studiato, risulterebbero senz’altro minori dei carichi orizzontali derivanti invece dall’azione del
vento. Di conseguenza, dopo un confronto tra le principali normative nazionali delle zone a più
alto rischio sismico del mondo, è stato scelto come normativa di riferimento della tesi lo
Standard giapponese JASS14.
I capitoli seguenti descrivono quindi come il lavoro sia stato essenzialmente strutturato in due
modalità di studio: da una parte l’analisi sperimentale attraverso prove prestazionali su mock-
up, dall’altra la modellazione secondo il metodo degli elementi finiti, o FEM, grazie all’uso del
programma FEM “Straus7”. È stato successivamente condotto un confronto tra le due modalità
di studio, organizzato a sua volta su due livelli: prima confrontando direttamente e
quantitativamente l’output derivante dalle prove sperimentali, quindi gli spostamenti della
facciata registrati dai rilevatori, con lo stesso dato deducibile dalla soluzione del modello FEM;
in seguito effettuando un confronto di tipo qualitativo attraverso valutazioni fisiche e di tipo
visivo durante la prova sperimentale e la considerazione degli output restituibili dal programma
di modellazione: la distribuzione degli sforzi e delle deformazioni in qualsiasi elemento
costituente il modello.
SEISMIC BEHAVIOUR OF CURTAIN WALL FACADES Umberto Galli
VIII
In conclusione la facciata a cellule risulta avere potenzialmente un ottimo comportamento
durante un terremoto: durante un evento sismico, di qualunque intensità, lo specifico caso di
studio considerato soddisfa pienamente ogni requisito espresso dalla normativa JASS14,
adottata come riferimento. Questo anche grazie al fenomeno del rifollamento del foro della vite
di allineamento, che verificandosi durante il terzo e più gravoso ciclo di carico è in grado di
“disattivare” il comportamento roto-deformativo della cellula, che si limita quindi a traslare
orizzontalmente in maniera del tutto sicura per qualsiasi ampiezza di spostamento orizzontale
imposta. La modellazione FEM allo stesso tempo dimostra di poter essere uno strumento
importante per la progettazione sismica delle facciate continue, restituendo informazioni
importanti su dove si trovino eventuali picchi di sforzo e di conseguenza andando miratamente
ad intervenire nella fase di progettazione. Risulta tuttavia necessario un ulteriore affinamento
della modellazione, principalmente per quanto riguarda il contributo dato dall’attrito, qui
mancante, che deve necessariamente essere incluso per restituire valori meno ideali del
comportamento della facciata.

ABSTRACT
IX


CHAPTER 1
PREFACE
An earthquake is such a destructive and dreadful event that has no need to be introduced or
described to understand its real power and the potential consequences on the society, either
buildings or people that live and work there. In fact it is unfortunately quite common, despite its
nature of very rare event, especially in the last years, hearing from a lot of very huge seismic
events that hit in several areas of the world. Some of them were so strong to cause a tsunami
(for example the Indian Ocean Earthquake of the 26th December 2004 and the even more
recent Tohoku earthquake of the 11th March 2011) with unimaginable damages to everything
built and everyone living there (in the Japanese case there also was a nuclear meltdown).
Figure 1-1: Aftermath of Tohoku earthquake (March 2011)
Figure 1-2: Aftermath tsunami of Tohoku earthquake (March 2011)
SEISMIC BEHAVIOUR OF CURTAIN WALL FACADES Umberto Galli
2
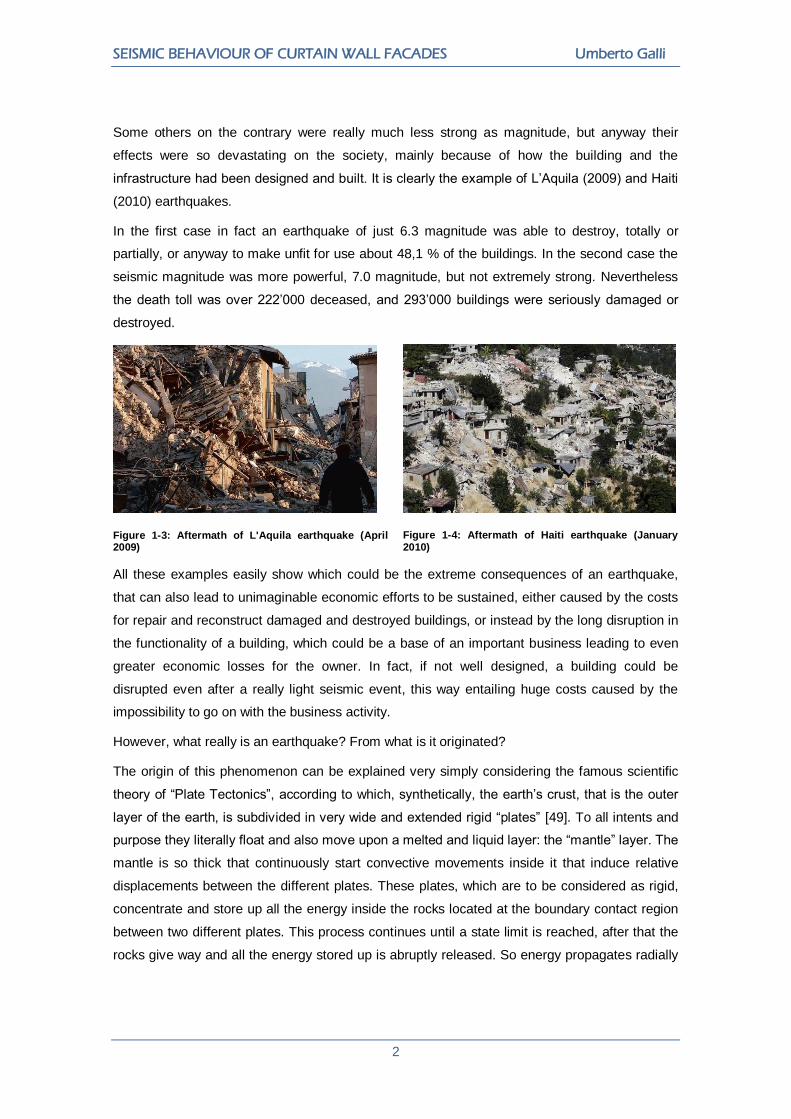
Some others on the contrary were really much less strong as magnitude, but anyway their
effects were so devastating on the society, mainly because of how the building and the
infrastructure had been designed and built. It is clearly the example of L’Aquila (2009) and Haiti
(2010) earthquakes.
In the first case in fact an earthquake of just 6.3 magnitude was able to destroy, totally or
partially, or anyway to make unfit for use about 48,1 % of the buildings. In the second case the
seismic magnitude was more powerful, 7.0 magnitude, but not extremely strong. Nevertheless
the death toll was over 222’000 deceased, and 293’000 buildings were seriously damaged or
destroyed.
Figure 1-3: Aftermath of L'Aquila earthquake (April 2009)
Figure 1-4: Aftermath of Haiti earthquake (January 2010)
All these examples easily show which could be the extreme consequences of an earthquake,
that can also lead to unimaginable economic efforts to be sustained, either caused by the costs
for repair and reconstruct damaged and destroyed buildings, or instead by the long disruption in
the functionality of a building, which could be a base of an important business leading to even
greater economic losses for the owner. In fact, if not well designed, a building could be
disrupted even after a really light seismic event, this way entailing huge costs caused by the
impossibility to go on with the business activity.
However, what really is an earthquake? From what is it originated?
The origin of this phenomenon can be explained very simply considering the famous scientific
theory of “Plate Tectonics”, according to which, synthetically, the earth’s crust, that is the outer
layer of the earth, is subdivided in very wide and extended rigid “plates” [49]. To all intents and
purpose they literally float and also move upon a melted and liquid layer: the “mantle” layer. The
mantle is so thick that continuously start convective movements inside it that induce relative
displacements between the different plates. These plates, which are to be considered as rigid,
concentrate and store up all the energy inside the rocks located at the boundary contact region
between two different plates. This process continues until a state limit is reached, after that the
rocks give way and all the energy stored up is abruptly released. So energy propagates radially

CHAPTER 1 PREFACE
3
concentric to the original breaking point that goes by the name of “hypocenter”. This is the origin
of an earthquake.
Figure 1-5: Schematic drawing representing a possible origin of an earthquake
But how can an earthquake affect a building? Which are the main dangers from its action on
society? Of course, the worst thing that could happen is the total collapse and destruction of a
building, caused by the failure of the structural system. In fact it is a very important topic and a
matter of a deep and specific study how to reduce damages to the building structure. This can
be realized in such several ways, extremely different between them also from the very
theoretical point of view [49].
Figure 1-6: Schematic drawing representing building induced behaviour during a seismic event.
For example it is possible to approach to the issue either isolating the structure of the building
from the very beginning, this way avoiding energy to “come in” and to act onto the structural
system, or, on the contrary, letting energy to come in and predisposing appropriate devices to
dissipate this energy, without damaging the structure. Another additional solution could also be
to make the structure active and selecting the structural elements failure sequence according to
that different elements, firstly beams, start to fail in a predetermined way. (Hierarchy of
resistance).

SEISMIC BEHAVIOUR OF CURTAIN WALL FACADES Umberto Galli
4
Figure 1-7: Schematic representation of possible benefits deriving from base isolation of the building
On the other hand, as clearly demonstrable and evident looking at the extensive quantity of
pictures about the several earthquakes listed above, as well as the structural failure, total or
partial, when a seismic event happens the other real issue is the danger caused by the failure of
non-structural elements, such as masonry, ceilings, cladding facades, curtain wall, shards of
broken glasses and all the equipment present inside, like shelves in warehouses, or even
outside the building, like water reservoirs on the roof.
Figure 1-8: Damage to non-structural exterior masonry walls (Christchurch, 2011)
Figure 1-9: Damages to internal furnishing and ceilings collapse (Northridge, 1994)
Figure 1-10: Collapse of non-structural masonry wall (Christchurch, 2011)
CHAPTER 1 PREFACE
5
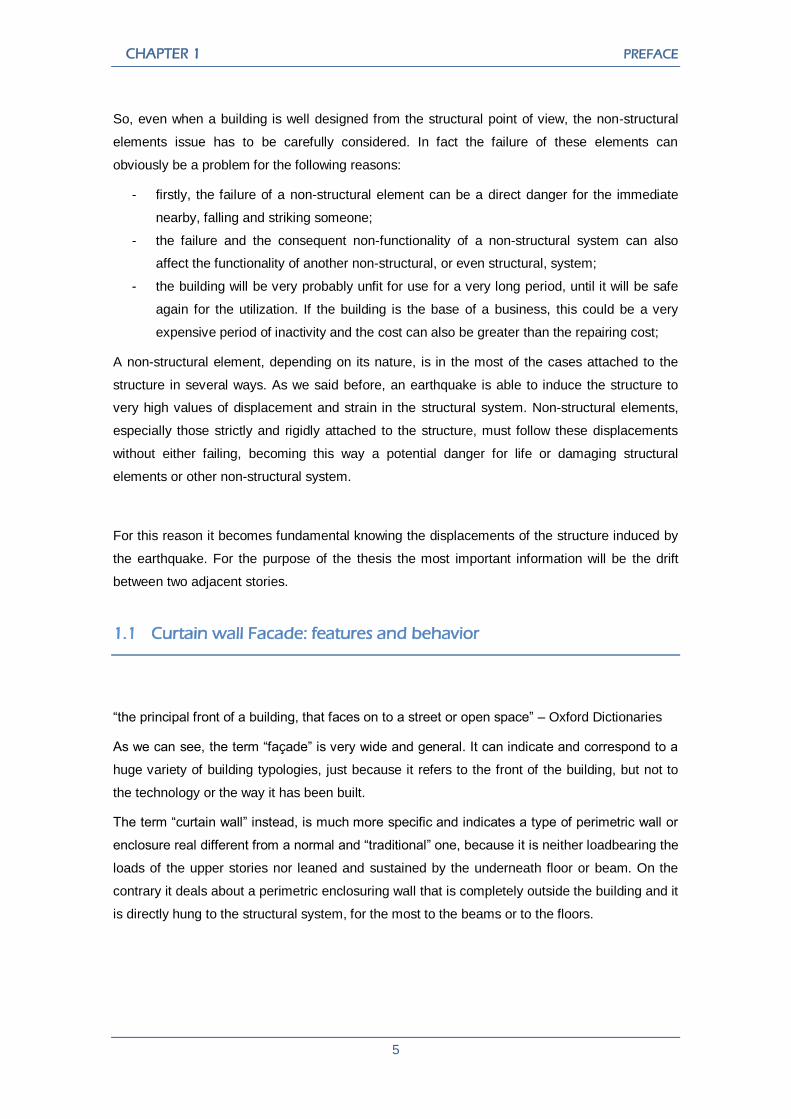
So, even when a building is well designed from the structural point of view, the non-structural
elements issue has to be carefully considered. In fact the failure of these elements can
obviously be a problem for the following reasons:
- firstly, the failure of a non-structural element can be a direct danger for the immediate
nearby, falling and striking someone;
- the failure and the consequent non-functionality of a non-structural system can also
affect the functionality of another non-structural, or even structural, system;
- the building will be very probably unfit for use for a very long period, until it will be safe
again for the utilization. If the building is the base of a business, this could be a very
expensive period of inactivity and the cost can also be greater than the repairing cost;
A non-structural element, depending on its nature, is in the most of the cases attached to the
structure in several ways. As we said before, an earthquake is able to induce the structure to
very high values of displacement and strain in the structural system. Non-structural elements,
especially those strictly and rigidly attached to the structure, must follow these displacements
without either failing, becoming this way a potential danger for life or damaging structural
elements or other non-structural system.
For this reason it becomes fundamental knowing the displacements of the structure induced by
the earthquake. For the purpose of the thesis the most important information will be the drift
between two adjacent stories.
1.1 Curtain wall Facade: features and behavior
“the principal front of a building, that faces on to a street or open space” – Oxford Dictionaries
As we can see, the term “façade” is very wide and general. It can indicate and correspond to a
huge variety of building typologies, just because it refers to the front of the building, but not to
the technology or the way it has been built.
The term “curtain wall” instead, is much more specific and indicates a type of perimetric wall or
enclosure real different from a normal and “traditional” one, because it is neither loadbearing the
loads of the upper stories nor leaned and sustained by the underneath floor or beam. On the
contrary it deals about a perimetric enclosuring wall that is completely outside the building and it
is directly hung to the structural system, for the most to the beams or to the floors.

SEISMIC BEHAVIOUR OF CURTAIN WALL FACADES Umberto Galli
6
1.1.1 Curtain walling systems:
Consequently, maintaining as a fixed point the outside position and the attachment to the
structural elements of the building, we can find again a vary huge variety of technologies for
realize a curtain wall. Very briefly we can summarize the different typologies as follows:
- Stick
- Unitized and panellised
- Structurally sealed
- Structural glazing
- Single and double skin
1.1.1.1 Stick system curtain walling:
Horizontal and vertical framing members (‘sticks’) are
normally extruded aluminium profiles, protected by
anodising or powder coating, but they may also be cold-
rolled steel (for greater fire resistance) or aluminium
clad with PVC-U. Members are cut and machined in the
factory prior their on-site assembly as a kit of parts:
vertical mullions, which are fixed to the floor slab, are
firstly erected, followed then by horizontal transoms,
which are fixed in-between mullions. Mullions are
typically spaced between 1.0 and 1.8 m centres.
1.1.1.2 Unitized and panellised system:
Unitised systems comprise narrow, storey-height
units of steel or aluminium framework, glazing and
panels pre-assembled under controlled factory
conditions. Mechanical handling is required to
position, align and fix units onto pre-positioned
brackets attached to the concrete floor slab or to
the structural frame.
Unitised systems are more complex in terms of
framing system, have higher direct costs and are
less common than stick systems.
Figure 1-11: Stick system curtain walling: schematic drawing
Figure 1-12: Unitized and panellized system curtain walling: schematic drawing

CHAPTER 1 PREFACE
7
1.1.1.3 Structurally sealed system:
Structural sealant glazing is a type of glazing that
can be applied to stick unitised and panellized
systems. Instead of mechanical means (i.e. a
pressure plate or structural gasket), the glass infill
panels are attached with a factory-applied structural
sealant (usually silicon) to metal carrier units that
are then bolted into the framing grid on site. External
joints are weather-sealed with a wet-applied sealant
or a gasket.
1.1.1.4 Structural glazing system:
Sheets of toughened glass are assembled with
special bolts and brackets and supported by a
secondary structure to create a near transparent
facade or roof with a flush external surface.
A multitude of discreet or prominent secondary
structures can be designed (e.g. space frame,
rigging or a series of mullions) to support the
glazing through special brackets. The joints
between adjacent panes/glass units are weather
sealed on site with wet-applied sealant.
Figure 1-13: Structurally sealed system curtain walling: schematic drawing
Figure 1-14: Structural glazing system: schematic drawing
SEISMIC BEHAVIOUR OF CURTAIN WALL FACADES Umberto Galli
8
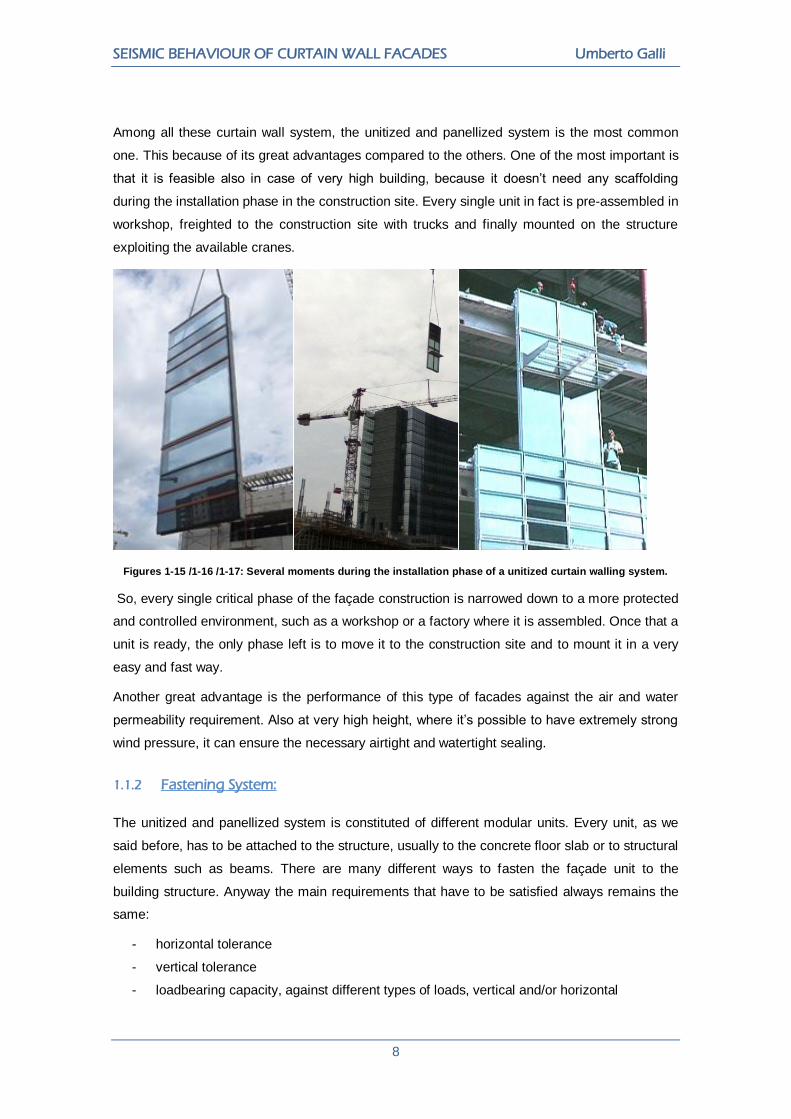
Among all these curtain wall system, the unitized and panellized system is the most common
one. This because of its great advantages compared to the others. One of the most important is
that it is feasible also in case of very high building, because it doesn’t need any scaffolding
during the installation phase in the construction site. Every single unit in fact is pre-assembled in
workshop, freighted to the construction site with trucks and finally mounted on the structure
exploiting the available cranes.
Figures 1-15 /1-16 /1-17: Several moments during the installation phase of a unitized curtain walling system.
So, every single critical phase of the façade construction is narrowed down to a more protected
and controlled environment, such as a workshop or a factory where it is assembled. Once that a
unit is ready, the only phase left is to move it to the construction site and to mount it in a very
easy and fast way.
Another great advantage is the performance of this type of facades against the air and water
permeability requirement. Also at very high height, where it’s possible to have extremely strong
wind pressure, it can ensure the necessary airtight and watertight sealing.
1.1.2 Fastening System:
The unitized and panellized system is constituted of different modular units. Every unit, as we
said before, has to be attached to the structure, usually to the concrete floor slab or to structural
elements such as beams. There are many different ways to fasten the façade unit to the
building structure. Anyway the main requirements that have to be satisfied always remains the
same:
- horizontal tolerance
- vertical tolerance
- loadbearing capacity, against different types of loads, vertical and/or horizontal

CHAPTER 1 PREFACE
9
Horizontal and vertical tolerance requirements are satisfied providing appropriate components
or brackets. Brackets represent the fixing system and there are mainly two types of them:
brackets fixing the facades to the main structure (steel or concrete) and brackets fixing facades
components (e.g. vertical supports for glass, decorative elements). They usually are made of
aluminium or steel. They must be designed to absorb tolerances, vertical and horizontal, of
façade installation and the displacements of the building during its life.
Figure 1-18: Horizontal section of the façade in correspondence of the fastening system
Figure 1-19: Vertical section of the façade in correspondence of the fastening system
SEISMIC BEHAVIOUR OF CURTAIN WALL FACADES Umberto Galli
10
Furthermore brackets and fixing devices must be designed and verified for different loads:
- the dead load coming from the self-weight of the unit itself;
- the wind load produced by the wind pressure on the façade;
- the additional load caused by people standing on the walkway in the gap, typically
present in double skin façade. Usually for the calculation the limit state method is used.
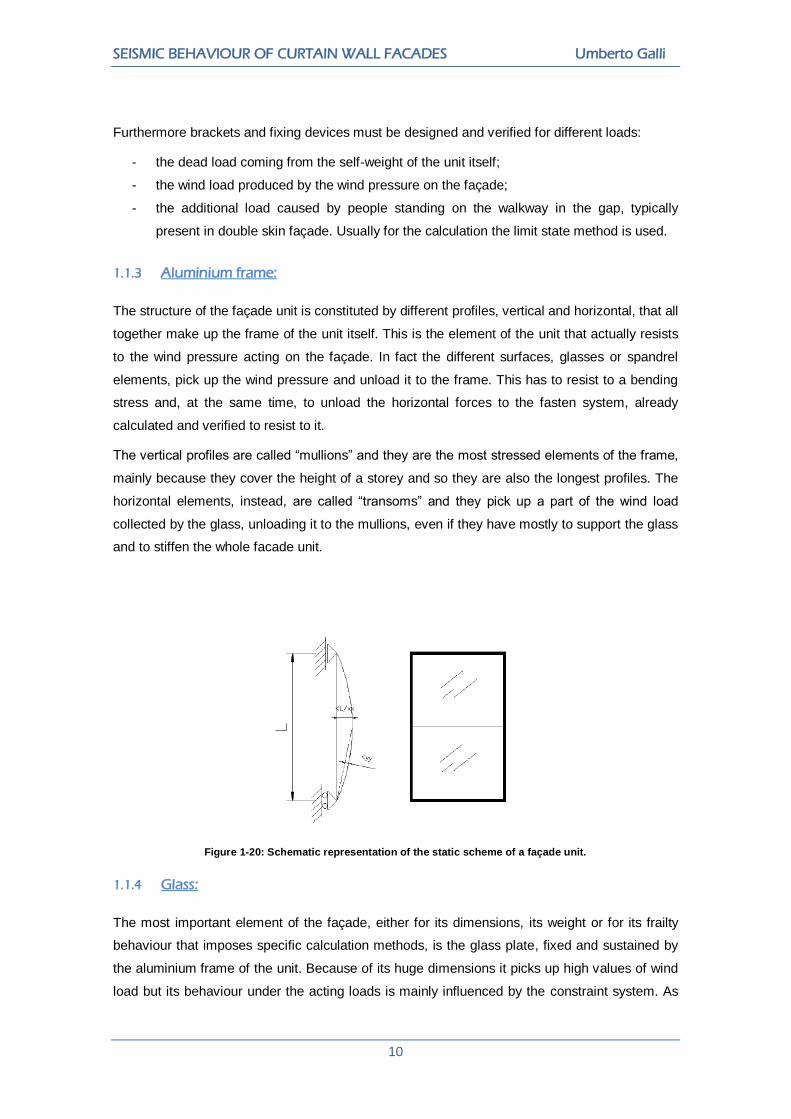
1.1.3 Aluminium frame:
The structure of the façade unit is constituted by different profiles, vertical and horizontal, that all
together make up the frame of the unit itself. This is the element of the unit that actually resists
to the wind pressure acting on the façade. In fact the different surfaces, glasses or spandrel
elements, pick up the wind pressure and unload it to the frame. This has to resist to a bending
stress and, at the same time, to unload the horizontal forces to the fasten system, already
calculated and verified to resist to it.
The vertical profiles are called “mullions” and they are the most stressed elements of the frame,
mainly because they cover the height of a storey and so they are also the longest profiles. The
horizontal elements, instead, are called “transoms” and they pick up a part of the wind load
collected by the glass, unloading it to the mullions, even if they have mostly to support the glass
and to stiffen the whole facade unit.
Figure 1-20: Schematic representation of the static scheme of a façade unit.
1.1.4 Glass:
The most important element of the façade, either for its dimensions, its weight or for its frailty
behaviour that imposes specific calculation methods, is the glass plate, fixed and sustained by
the aluminium frame of the unit. Because of its huge dimensions it picks up high values of wind
load but its behaviour under the acting loads is mainly influenced by the constraint system. As
CHAPTER 1 PREFACE
11
we said before, there are many different typologies of curtain wall and some of them are
characterized by the glass-to-frame restraint system. This can be mechanical, constituted by an
outer element called “pressure plate” pressing all along the edge of the glass against the inner
profile, so that the glass plate is tightened and fixed in the aluminium frame. Alternatively the
restraint can be constituted by a structural silicon joint (Structural sealing façade) that, under
appropriate verification and calculation method, retains the glass all along its edge, while the
weight is supported by two elements under the glass plate, to reduce the sealant joint size,
called “Setting blocks”.
1.2 Critical features of curtain wall facades during a seismic event:
A Curtain Wall Façade is, as we previously said, a non-structural element hung and attached to
the building structure by a brackets system that anchors it allowing necessary tolerances of
installation and building natural movements. However a seismic event is able to induce a high
level of ground basement acceleration to the building, even in the case of normal or not
extraordinary seismic intensity. This acceleration, as well as the base displacement, is
“translated” by the building itself to a response.
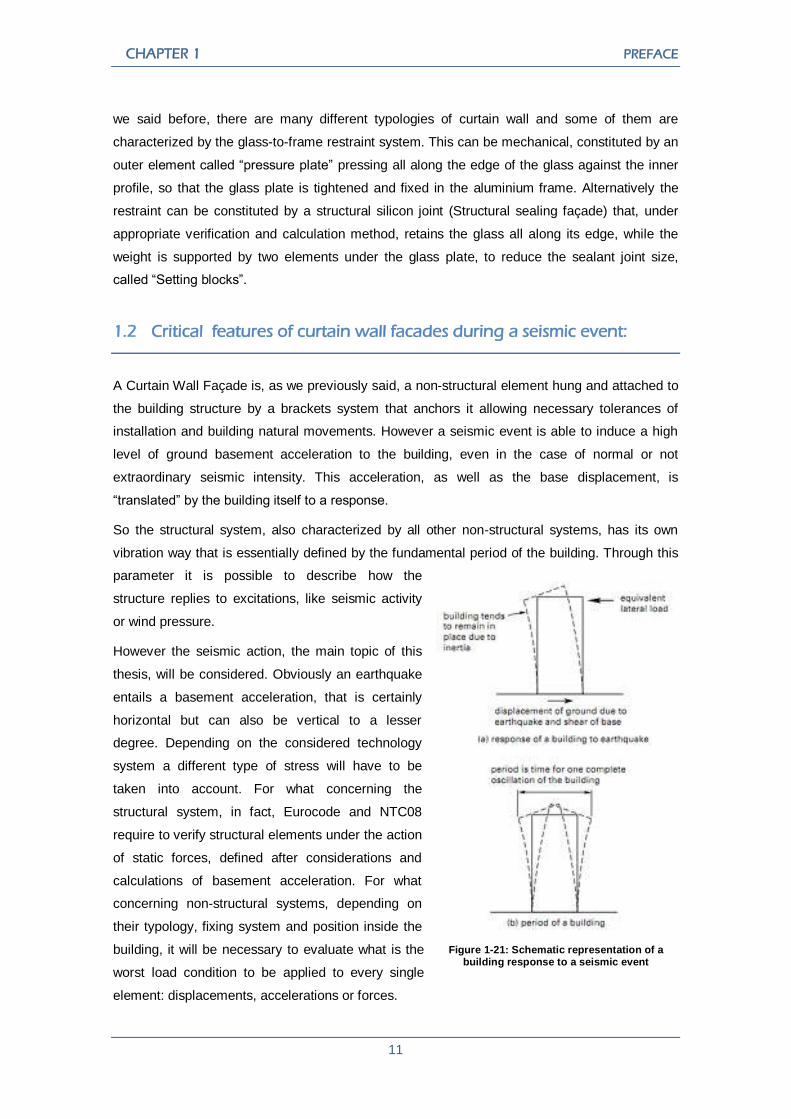
So the structural system, also characterized by all other non-structural systems, has its own
vibration way that is essentially defined by the fundamental period of the building. Through this
parameter it is possible to describe how the
structure replies to excitations, like seismic activity
or wind pressure.
However the seismic action, the main topic of this
thesis, will be considered. Obviously an earthquake
entails a basement acceleration, that is certainly
horizontal but can also be vertical to a lesser
degree. Depending on the considered technology
system a different type of stress will have to be
taken into account. For what concerning the
structural system, in fact, Eurocode and NTC08
require to verify structural elements under the action
of static forces, defined after considerations and
calculations of basement acceleration. For what
concerning non-structural systems, depending on
their typology, fixing system and position inside the
building, it will be necessary to evaluate what is the
worst load condition to be applied to every single
element: displacements, accelerations or forces.
Figure 1-21: Schematic representation of a building response to a seismic event

SEISMIC BEHAVIOUR OF CURTAIN WALL FACADES Umberto Galli
12
A non-structural element, by its nature, is not necessary for the building to resist and not to
collapse. If it fails or not, it does not really affect loadbearing capacity of the structural system,
even if, just to clarify, the collapse itself of a non-structural element entails the absorption of a
certain quantity of energy, coming from that acting on the building. Nevertheless non-structural
element must not be in any case a danger for people’s life, either outside or inside the building.
In addition, they must not be, in case of failure, able to affect the functionality of another non-
structural system, maybe life-safety such as a fire-extinguisher system. Finally, in case of
normal and ordinary earthquake magnitude, or anyway not extraordinary events, non-structural
elements must remain functional, safe and allowing, if necessary, an eventual not immediate
but postponed substitution.
Therefore it is necessary to evaluate carefully a system or a non-structural element behaviour to
understand the failure and collapse process that predominates, so that it would be possible to
take appropriate prevention measures and to intervene during its design.
However the failure mechanism of an element depends on the element itself, but also on the
type of load that acts on it. This, as we told in advance, could be an acceleration, a
displacement or a force. Therefore, depending on the non-structural system and its
characteristics, it will be necessary to evaluate which is (or are in the case there were more than
one) the worst loading condition and proceed to verify it. In the specific case of non-structural
curtain wall façade here considered, and more specifically the unitized and panellized system,
we can start making some preliminary comments about it.
Every single unit is subjected to different actions and loads and consequently it is already
verified and designed for them. It is mainly the case of the wind action. In fact air pressure
acting on high-rise building facade usually is the predominant load condition that leads the
design. This horizontal action can be both parallel and perpendicular to the plane of the façade
itself and assume extremely high values in the most of the considered cases. Consequently it
becomes immediately clear the possible result of a comparison among the application of a
force, or an action, deriving from a seismic ground acceleration and the load produced by the
wind pressure against the unit surface. The wind load, in fact, can even be an order of
magnitude stronger that the other loads. As a result glass, frame structure and fastening system
verification under wind load also implies the satisfaction of the seismic load (considered as a
force or an acceleration) verification.
For what concerning the application of a dynamic acceleration, this is necessary the result of
the specific behaviour of the building structure to which it is hung. In fact, as we previously said,
every structure has its own specific vibration way and it differently replies to the seismic action.
For this reason it would be firstly necessary to proceed with exhaustive analysis and
calculations of the building structure behaviour; subsequently a time history response of the
building itself to the seismic action should be obtained and finally the application to the facade
CHAPTER 1 PREFACE
13
unit of a time function acceleration should be considered. Anyway, even supposing to carry out
all these analysis and studies about the building behaviour, moreover depending on the specific
seismic background, the result of the application of this acceleration to the facade unit would be
again that the stress induced to the different components, firstly to the fastening system, is
extremely lower than the stress value normally reached considering the wind load at high
heights.
So then it is already possible to forecast in this phase that it will be the relative displacement
between two adjacent stories the main danger for the integrity of the several facade
components, that as a consequence will necessary must be able to put up with this
displacement.
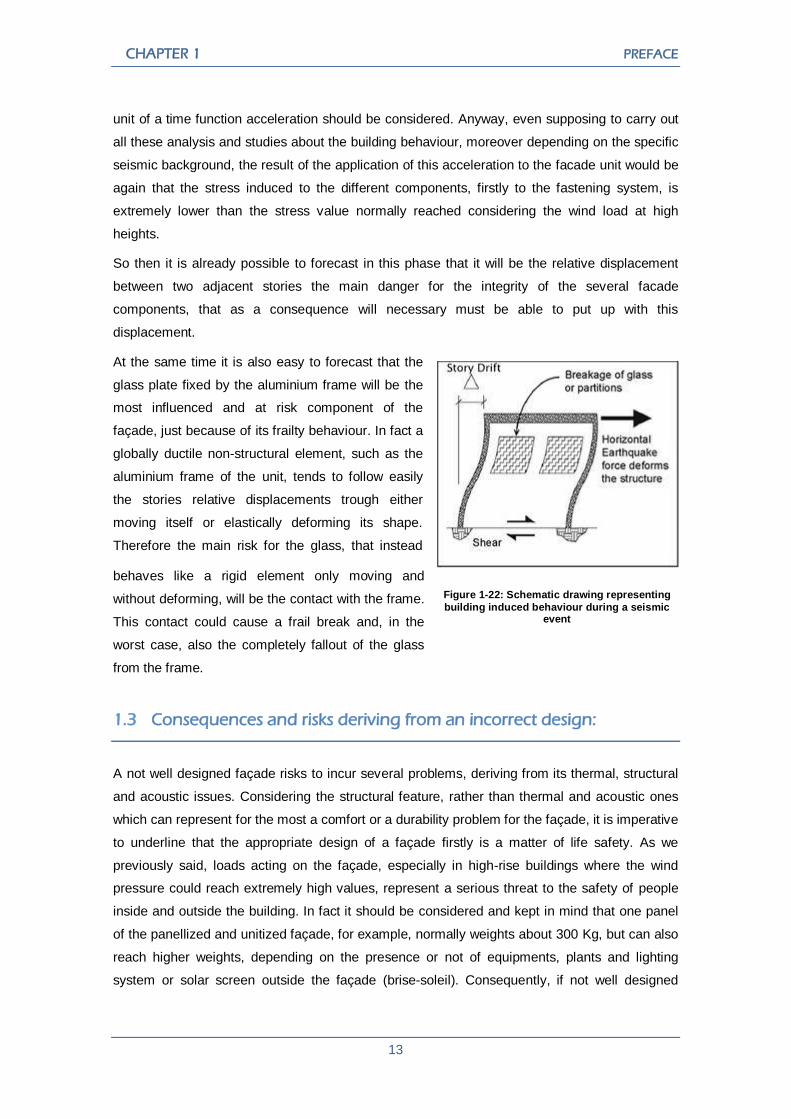
At the same time it is also easy to forecast that the
glass plate fixed by the aluminium frame will be the
most influenced and at risk component of the
façade, just because of its frailty behaviour. In fact a
globally ductile non-structural element, such as the
aluminium frame of the unit, tends to follow easily
the stories relative displacements trough either
moving itself or elastically deforming its shape.
Therefore the main risk for the glass, that instead
behaves like a rigid element only moving and
without deforming, will be the contact with the frame.
This contact could cause a frail break and, in the
worst case, also the completely fallout of the glass
from the frame.
1.3 Consequences and risks deriving from an incorrect design:
A not well designed façade risks to incur several problems, deriving from its thermal, structural
and acoustic issues. Considering the structural feature, rather than thermal and acoustic ones
which can represent for the most a comfort or a durability problem for the façade, it is imperative
to underline that the appropriate design of a façade firstly is a matter of life safety. As we
previously said, loads acting on the façade, especially in high-rise buildings where the wind
pressure could reach extremely high values, represent a serious threat to the safety of people
inside and outside the building. In fact it should be considered and kept in mind that one panel
of the panellized and unitized façade, for example, normally weights about 300 Kg, but can also
reach higher weights, depending on the presence or not of equipments, plants and lighting
system or solar screen outside the façade (brise-soleil). Consequently, if not well designed
Figure 1-22: Schematic drawing representing
building induced behaviour during a seismic event
SEISMIC BEHAVIOUR OF CURTAIN WALL FACADES Umberto Galli
14
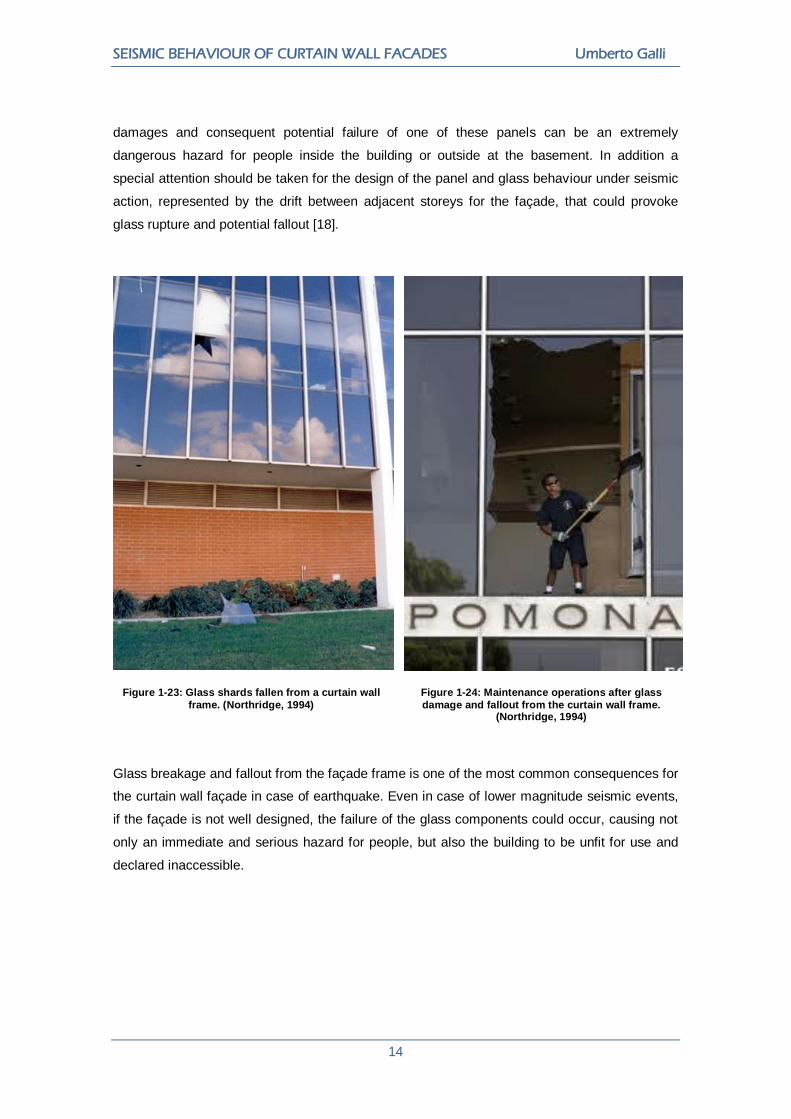
damages and consequent potential failure of one of these panels can be an extremely
dangerous hazard for people inside the building or outside at the basement. In addition a
special attention should be taken for the design of the panel and glass behaviour under seismic
action, represented by the drift between adjacent storeys for the façade, that could provoke
glass rupture and potential fallout [18].
Figure 1-23: Glass shards fallen from a curtain wall
frame. (Northridge, 1994)
Figure 1-24: Maintenance operations after glass
damage and fallout from the curtain wall frame. (Northridge, 1994)
Glass breakage and fallout from the façade frame is one of the most common consequences for
the curtain wall façade in case of earthquake. Even in case of lower magnitude seismic events,
if the façade is not well designed, the failure of the glass components could occur, causing not
only an immediate and serious hazard for people, but also the building to be unfit for use and
declared inaccessible.
CHAPTER 1 PREFACE
15
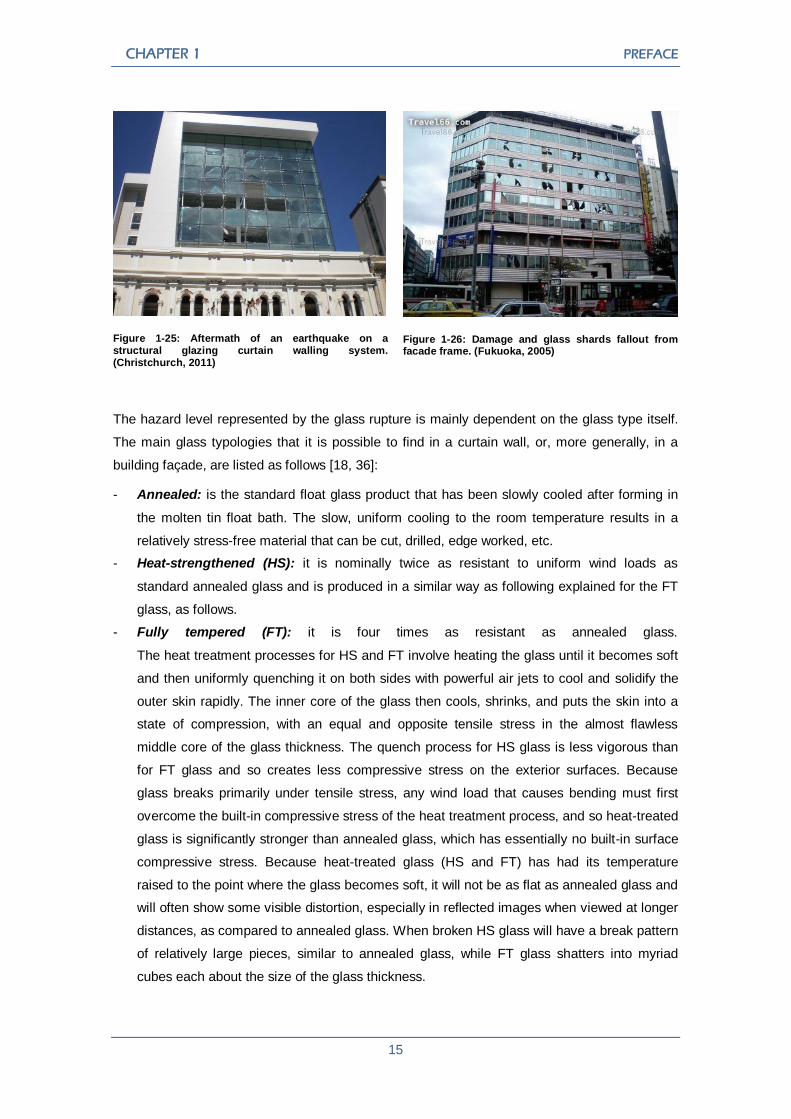
Figure 1-25: Aftermath of an earthquake on a structural glazing curtain walling system. (Christchurch, 2011)
Figure 1-26: Damage and glass shards fallout from facade frame. (Fukuoka, 2005)
The hazard level represented by the glass rupture is mainly dependent on the glass type itself.
The main glass typologies that it is possible to find in a curtain wall, or, more generally, in a
building façade, are listed as follows [18, 36]:
- Annealed: is the standard float glass product that has been slowly cooled after forming in
the molten tin float bath. The slow, uniform cooling to the room temperature results in a
relatively stress-free material that can be cut, drilled, edge worked, etc.
- Heat-strengthened (HS): it is nominally twice as resistant to uniform wind loads as
standard annealed glass and is produced in a similar way as following explained for the FT
glass, as follows.
- Fully tempered (FT): it is four times as resistant as annealed glass.
The heat treatment processes for HS and FT involve heating the glass until it becomes soft
and then uniformly quenching it on both sides with powerful air jets to cool and solidify the
outer skin rapidly. The inner core of the glass then cools, shrinks, and puts the skin into a
state of compression, with an equal and opposite tensile stress in the almost flawless
middle core of the glass thickness. The quench process for HS glass is less vigorous than
for FT glass and so creates less compressive stress on the exterior surfaces. Because
glass breaks primarily under tensile stress, any wind load that causes bending must first
overcome the built-in compressive stress of the heat treatment process, and so heat-treated
glass is significantly stronger than annealed glass, which has essentially no built-in surface
compressive stress. Because heat-treated glass (HS and FT) has had its temperature
raised to the point where the glass becomes soft, it will not be as flat as annealed glass and
will often show some visible distortion, especially in reflected images when viewed at longer
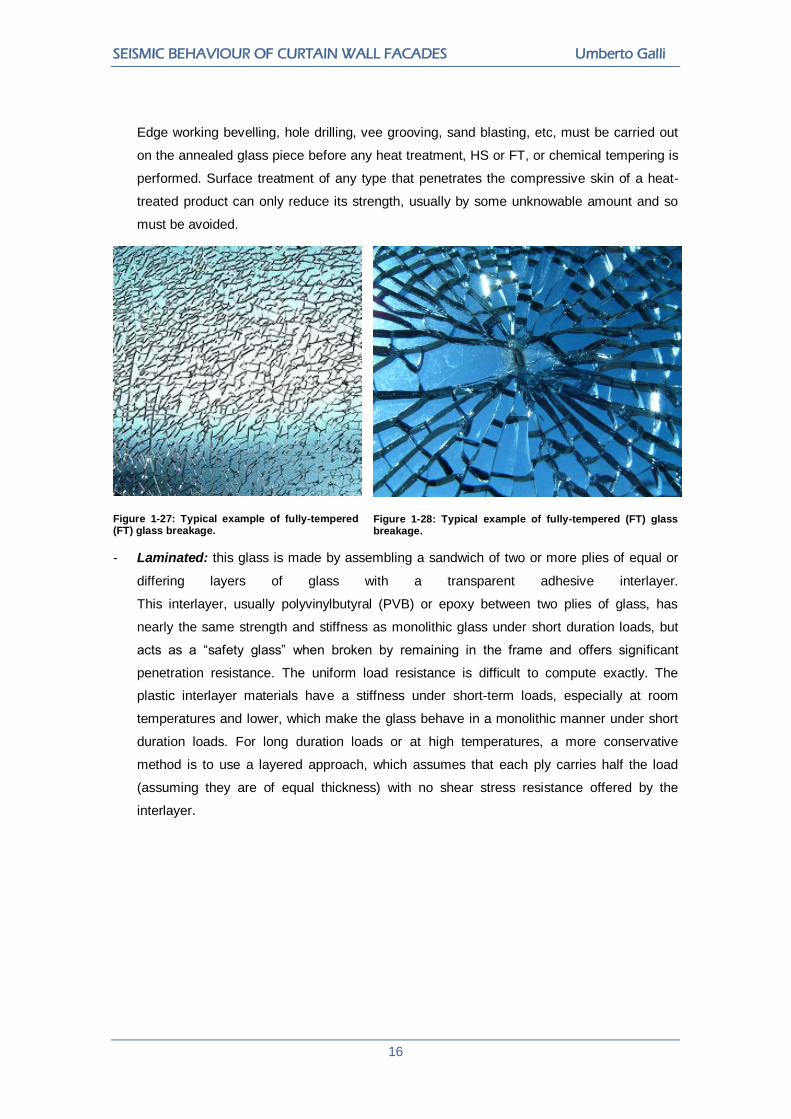
distances, as compared to annealed glass. When broken HS glass will have a break pattern
of relatively large pieces, similar to annealed glass, while FT glass shatters into myriad
cubes each about the size of the glass thickness.
SEISMIC BEHAVIOUR OF CURTAIN WALL FACADES Umberto Galli
16
Edge working bevelling, hole drilling, vee grooving, sand blasting, etc, must be carried out
on the annealed glass piece before any heat treatment, HS or FT, or chemical tempering is
performed. Surface treatment of any type that penetrates the compressive skin of a heat-
treated product can only reduce its strength, usually by some unknowable amount and so
must be avoided.
Figure 1-27: Typical example of fully-tempered (FT) glass breakage.
Figure 1-28: Typical example of fully-tempered (FT) glass breakage.
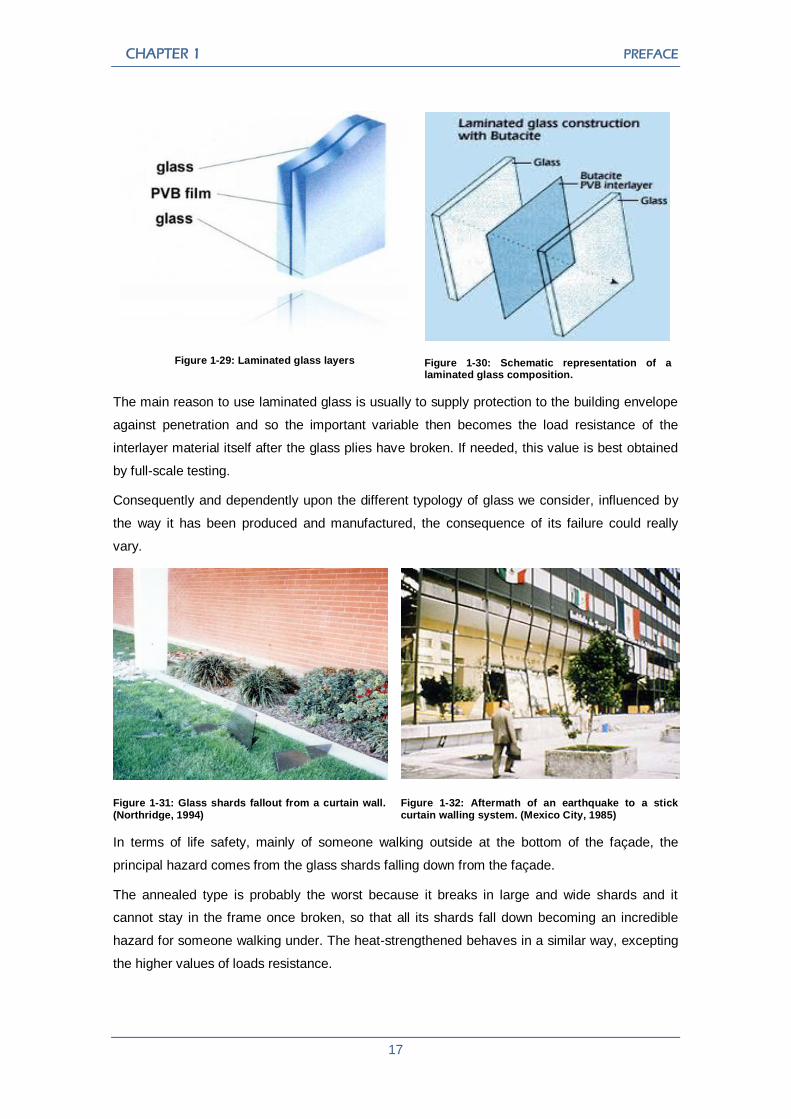
- Laminated: this glass is made by assembling a sandwich of two or more plies of equal or
differing layers of glass with a transparent adhesive interlayer.
This interlayer, usually polyvinylbutyral (PVB) or epoxy between two plies of glass, has
nearly the same strength and stiffness as monolithic glass under short duration loads, but
acts as a “safety glass” when broken by remaining in the frame and offers significant
penetration resistance. The uniform load resistance is difficult to compute exactly. The
plastic interlayer materials have a stiffness under short-term loads, especially at room
temperatures and lower, which make the glass behave in a monolithic manner under short
duration loads. For long duration loads or at high temperatures, a more conservative
method is to use a layered approach, which assumes that each ply carries half the load
(assuming they are of equal thickness) with no shear stress resistance offered by the
interlayer.
CHAPTER 1 PREFACE
17
Figure 1-29: Laminated glass layers
Figure 1-30: Schematic representation of a laminated glass composition.
The main reason to use laminated glass is usually to supply protection to the building envelope
against penetration and so the important variable then becomes the load resistance of the
interlayer material itself after the glass plies have broken. If needed, this value is best obtained
by full-scale testing.
Consequently and dependently upon the different typology of glass we consider, influenced by
the way it has been produced and manufactured, the consequence of its failure could really
vary.
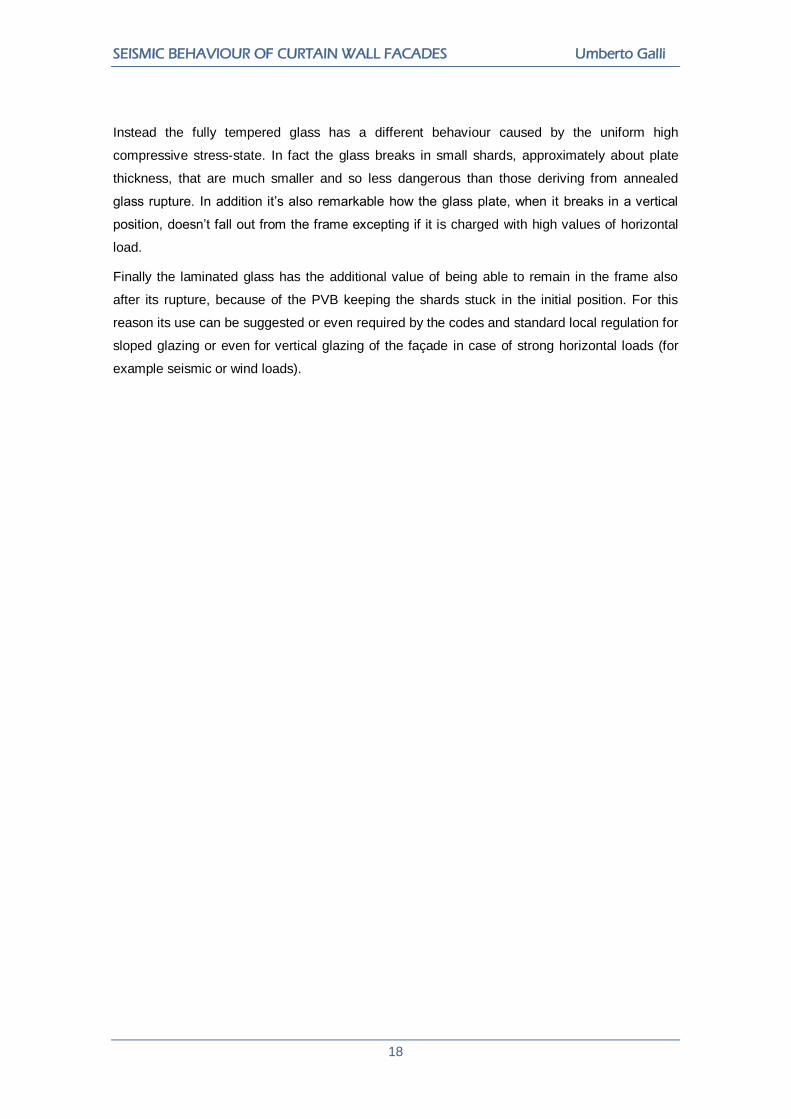
Figure 1-31: Glass shards fallout from a curtain wall. (Northridge, 1994)
Figure 1-32: Aftermath of an earthquake to a stick curtain walling system. (Mexico City, 1985)
In terms of life safety, mainly of someone walking outside at the bottom of the façade, the
principal hazard comes from the glass shards falling down from the façade.
The annealed type is probably the worst because it breaks in large and wide shards and it
cannot stay in the frame once broken, so that all its shards fall down becoming an incredible
hazard for someone walking under. The heat-strengthened behaves in a similar way, excepting
the higher values of loads resistance.
SEISMIC BEHAVIOUR OF CURTAIN WALL FACADES Umberto Galli
18
Instead the fully tempered glass has a different behaviour caused by the uniform high
compressive stress-state. In fact the glass breaks in small shards, approximately about plate
thickness, that are much smaller and so less dangerous than those deriving from annealed
glass rupture. In addition it’s also remarkable how the glass plate, when it breaks in a vertical
position, doesn’t fall out from the frame excepting if it is charged with high values of horizontal
load.
Finally the laminated glass has the additional value of being able to remain in the frame also
after its rupture, because of the PVB keeping the shards stuck in the initial position. For this
reason its use can be suggested or even required by the codes and standard local regulation for
sloped glazing or even for vertical glazing of the façade in case of strong horizontal loads (for
example seismic or wind loads).

CHAPTER 1 PREFACE
19

CHAPTER 2
SEISMIC DESIGN REGULATIONS
Of course, an important starting point in the study and evaluation of this topic is the
consideration and the comparison of several local regulations and their approach to the seismic
design of non-structural elements such as curtain wall facades.
The reason of the importance of considering and evaluating the possible differences among
different approaches to the same problem is clearly understandable. These national regulations
represent the expression of the “state of the art” about this topic of a specific country or region
of the world. Consequently a designer that has to deal with the project of a curtain wall façade,
or even more generally of a non-structural element, must meet the requirements contained and
expressed by these standards. Furthermore, an additional value is given by the importance of
considering and comparing the approach to the same problem from extremely different points of
view, such as those that can result from countries and regions of the world with deeply different
traditions, building technologies and know-how. In fact in the present chapter national standards
actually in force in the main seismic region of the world will be described and compared finding
out both common points and differences for the same issue.

CHAPTER 2 SEISMIC DESIGN REGULATIONS
21
2.1 Introduction to the main high seismic regions in the world
In the first introductive chapter the basic principles that rules and explains how an earthquake
occurs and develops have been described, mainly through the Tectonic Plate theory [49].
According to this theory it is possible to subdivide the whole earth crust in several huge rigid
plates that slide and move one against the others.
Figure 2-1: Tectonic Plate theory subdivision of the earth crust
As a consequence different high seismic regions are present around the world. In these
geographical areas the probability to experience an earthquake in a specified period of time is
much higher than everywhere else. Just considering the brief list of seismic events presented in
the first chapter it is possible to find out where these regions could be located.
2.1.1 California:
It is the case of the whole western area of North America,
especially located in California, where the Pacific Plate
(on the west) meets with the North American Plate (on the
east) along the famous San Andreas fault, 1100 km long,
the principal element of the San Andreas fault system
where concentrates a very high seismic activity.
The following two figures show the incredible San
Andreas Fault extension.
Figure 2-2: California high-seismicity area
SEISMIC BEHAVIOUR OF CURTAIN WALL FACADES Umberto Galli
22
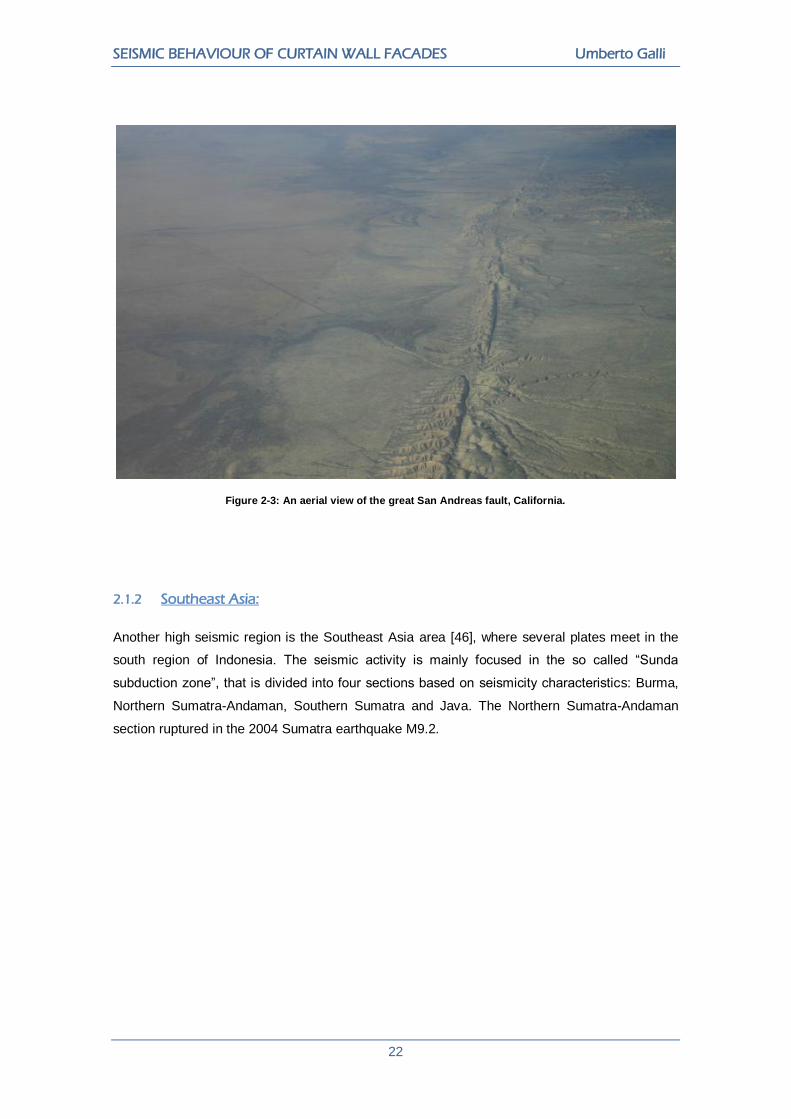
Figure 2-3: An aerial view of the great San Andreas fault, California.
2.1.2 Southeast Asia:
Another high seismic region is the Southeast Asia area [46], where several plates meet in the
south region of Indonesia. The seismic activity is mainly focused in the so called “Sunda
subduction zone”, that is divided into four sections based on seismicity characteristics: Burma,
Northern Sumatra-Andaman, Southern Sumatra and Java. The Northern Sumatra-Andaman
section ruptured in the 2004 Sumatra earthquake M9.2.

CHAPTER 2 SEISMIC DESIGN REGULATIONS
23
Figure 2-4: Southeast Asia region: in particular evidence the “Sunda subduction zone”.
2.1.3 Japan:
One of the other most active regions in the world is, of course, the Japanese area, where
earthquakes are basically generated by the Pacific Plate moving westward and being subducted
beneath the northern part of Japan, which is located on the Okhotsk Plate [2, 35].
SEISMIC BEHAVIOUR OF CURTAIN WALL FACADES Umberto Galli
24
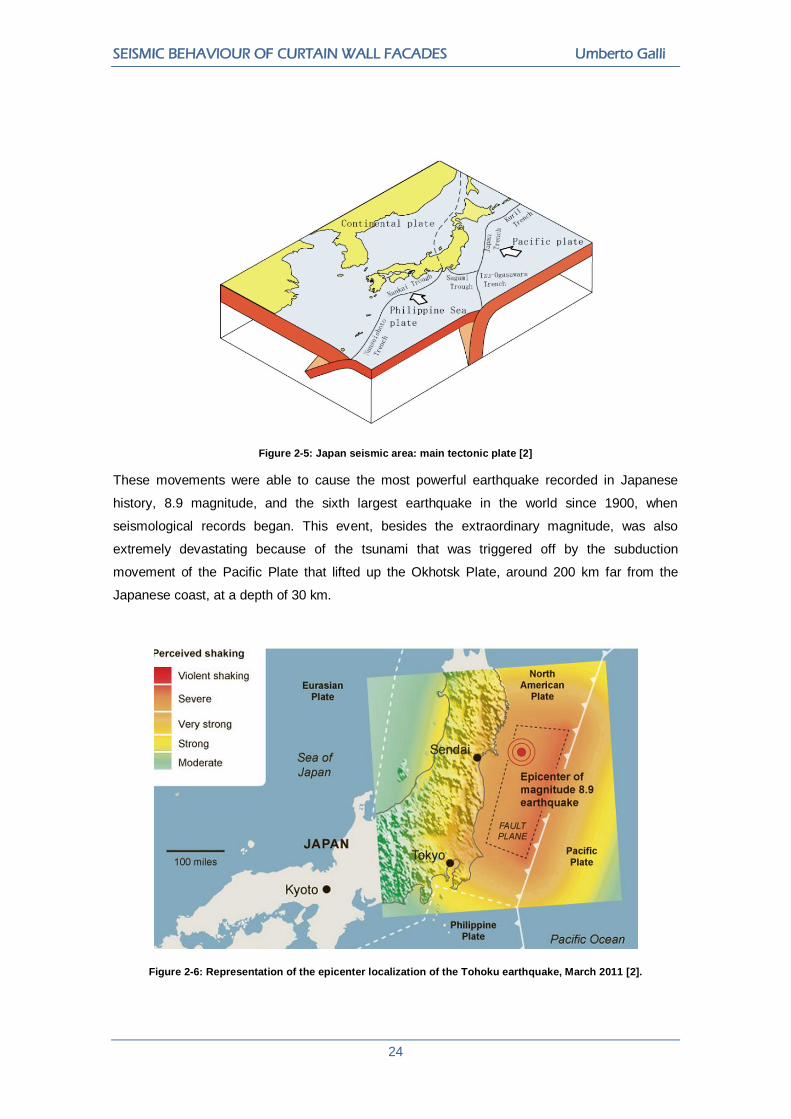
Figure 2-5: Japan seismic area: main tectonic plate [2]
These movements were able to cause the most powerful earthquake recorded in Japanese
history, 8.9 magnitude, and the sixth largest earthquake in the world since 1900, when
seismological records began. This event, besides the extraordinary magnitude, was also
extremely devastating because of the tsunami that was triggered off by the subduction
movement of the Pacific Plate that lifted up the Okhotsk Plate, around 200 km far from the
Japanese coast, at a depth of 30 km.
Figure 2-6: Representation of the epicenter localization of the Tohoku earthquake, March 2011 [2].

CHAPTER 2 SEISMIC DESIGN REGULATIONS
25
2.1.4 New Zealand:
Always sited in the so called “Pacific Ring of Fire”, another high seismic-hazardous region is
New Zealand. This country lies at the edge of both the Australian and Pacific tectonic plates
[32]. To the northeast of New Zealand, and underneath North Island, the Pacific Plate is moving
towards and being subducted below the Australian Plate. To the South of New Zealand, and
underneath Fiordland, the two plates are also moving toward each other, but here the Australian
Plate is being subducted under the Pacific Plate.
2-7: Shakemap of Darfield Earthquake, New Zealand (3 September 2010) [32].
New Zealand experiences every year thousands of earthquakes and in the past two years two
different severe earthquakes hit Christchurch: the first, M7.1, in September 2010 and the
second, M6.3, in February 2011. Both earthquakes were generated by faults which were
completely unknown. As a result of the high seismic level of almost the whole country surface,
passed through by the boundary between Australian and Pacific plates, New Zealand has one
of the strictest regulation concerning the seismic design.
Finally, for comparison completeness, European regulation “Eurocode 8” will be also considered
and evaluated, despite Europe is not a high-seismic hazard area.

SEISMIC BEHAVIOUR OF CURTAIN WALL FACADES Umberto Galli
26
2.2 European regulation: Eurocode 8
Within the European standard [28] Chapter 4.3 is dedicated to the structural analysis. Here is
possible to find, at section 4.3.5, the Eurocode 8 requirements for building non-structural
elements. Firstly, an interesting point to be analysed is how the standard classify non-structural
elements. They are named as “appendages”, to clearly identify with just a word their main
characteristic behaviour that is to be attached to structural elements. Then some examples are
listed: “parapets, gables, antennae, mechanical appendages and equipment, curtain walls,
partitions, railings”.
The very first general requirement of the standard requests that all these building elements
“shall, together with their supports, be verified to resist the design seismic action”. Therefore it is
possible to notice how a great importance is already given to the supporting and fastening
system. This system in fact has a key role in the failure mechanism of the non-structural
element.
Subsequently, before proceeding to the simplified method, it is specified that in case of “non-
structural elements of great importance or of a particularly dangerous nature, the seismic
analysis shall be based on a realistic model of the relevant structures and on the use of
appropriate response spectra derived from the response of the supporting structural elements of
the main seismic resisting system.”
For all other cases a simplified method is described, consisting in the verification of a static
seismic horizontal force Fa application to the considered non-structural element.
2.2.1 Verification
Non-structural elements, as well as their connections and attachments or anchorages, shall be
verified for the seismic design situation. The local transmission of actions to the structure by the
fastening of non-structural elements and their influence on the structural behaviour should be taken
into account. The requirements for fastenings to concrete are given in EN1992-1-1:2004
The effects of the seismic action may be determined by applying to the non-structural element a
horizontal force Fa which is defined as follows:
Equation 2-1
CHAPTER 2 SEISMIC DESIGN REGULATIONS
27
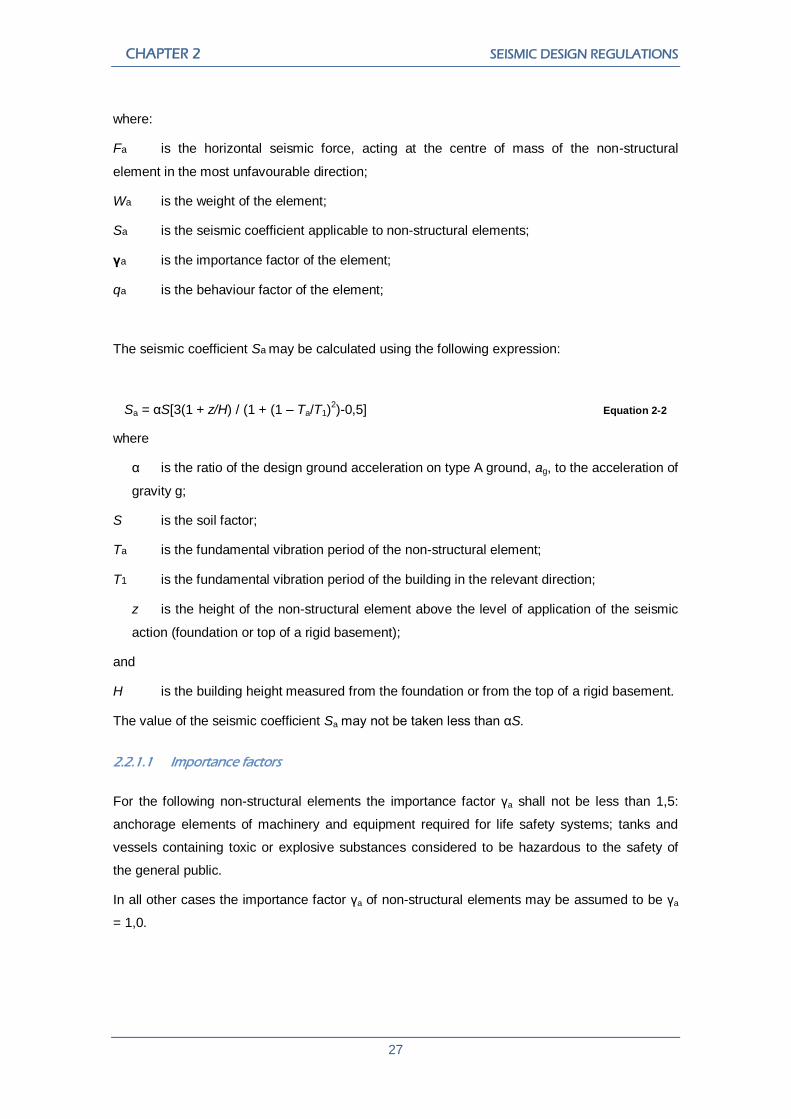
where:
Fa is the horizontal seismic force, acting at the centre of mass of the non-structural
element in the most unfavourable direction;
Wa is the weight of the element;
Sa is the seismic coefficient applicable to non-structural elements;
γa is the importance factor of the element;
qa is the behaviour factor of the element;
The seismic coefficient Sa may be calculated using the following expression:
Sa = αS[3(1 + z/H) / (1 + (1 – Ta/T1)2)-0,5] Equation 2-2
where
α is the ratio of the design ground acceleration on type A ground, ag, to the acceleration of
gravity g;
S is the soil factor;
Ta is the fundamental vibration period of the non-structural element;
T1 is the fundamental vibration period of the building in the relevant direction;
z is the height of the non-structural element above the level of application of the seismic
action (foundation or top of a rigid basement);
and
H is the building height measured from the foundation or from the top of a rigid basement.
The value of the seismic coefficient Sa may not be taken less than αS.
2.2.1.1 Importance factors
For the following non-structural elements the importance factor γa shall not be less than 1,5:
anchorage elements of machinery and equipment required for life safety systems; tanks and
vessels containing toxic or explosive substances considered to be hazardous to the safety of
the general public.
In all other cases the importance factor γa of non-structural elements may be assumed to be γa
= 1,0.
SEISMIC BEHAVIOUR OF CURTAIN WALL FACADES Umberto Galli
28
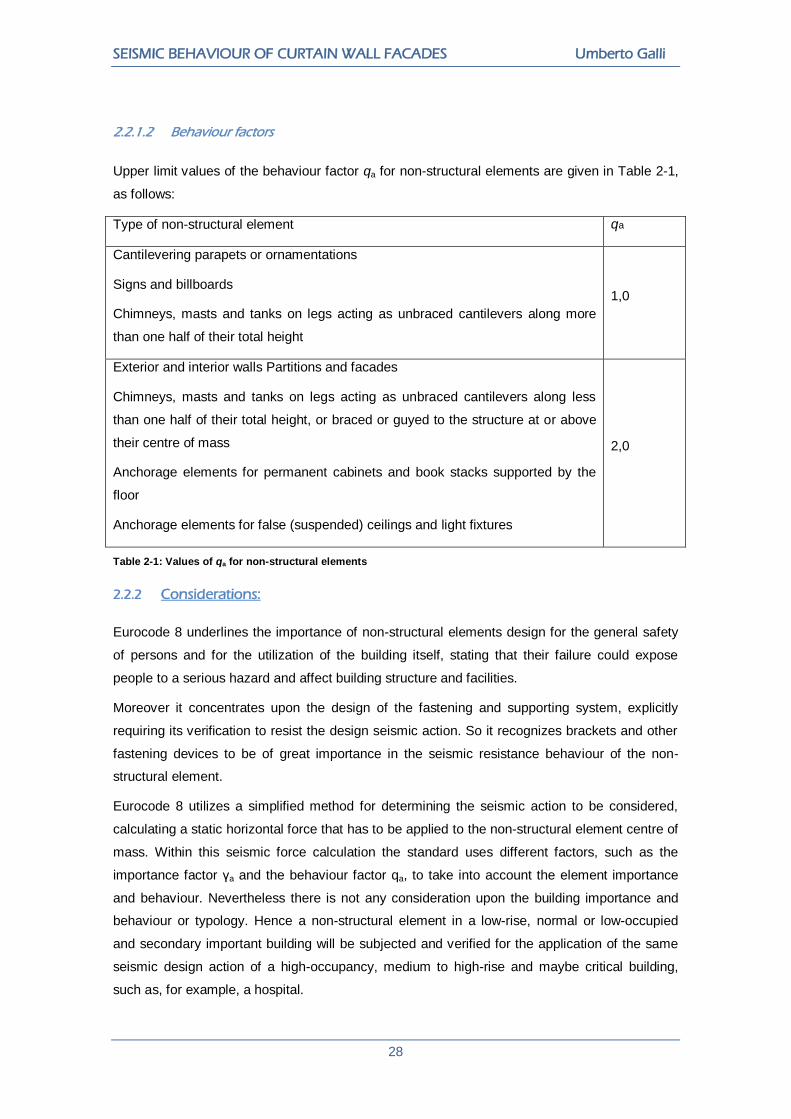
2.2.1.2 Behaviour factors
Upper limit values of the behaviour factor qa for non-structural elements are given in Table 2-1,
as follows:
Type of non-structural element qa
Cantilevering parapets or ornamentations
Signs and billboards
Chimneys, masts and tanks on legs acting as unbraced cantilevers along more
than one half of their total height
1,0
Exterior and interior walls Partitions and facades
Chimneys, masts and tanks on legs acting as unbraced cantilevers along less
than one half of their total height, or braced or guyed to the structure at or above
their centre of mass
Anchorage elements for permanent cabinets and book stacks supported by the
floor
Anchorage elements for false (suspended) ceilings and light fixtures
2,0
Table 2-1: Values of qa for non-structural elements
2.2.2 Considerations:
Eurocode 8 underlines the importance of non-structural elements design for the general safety
of persons and for the utilization of the building itself, stating that their failure could expose
people to a serious hazard and affect building structure and facilities.
Moreover it concentrates upon the design of the fastening and supporting system, explicitly
requiring its verification to resist the design seismic action. So it recognizes brackets and other
fastening devices to be of great importance in the seismic resistance behaviour of the non-
structural element.
Eurocode 8 utilizes a simplified method for determining the seismic action to be considered,
calculating a static horizontal force that has to be applied to the non-structural element centre of
mass. Within this seismic force calculation the standard uses different factors, such as the
importance factor γa and the behaviour factor qa, to take into account the element importance
and behaviour. Nevertheless there is not any consideration upon the building importance and
behaviour or typology. Hence a non-structural element in a low-rise, normal or low-occupied
and secondary important building will be subjected and verified for the application of the same
seismic design action of a high-occupancy, medium to high-rise and maybe critical building,
such as, for example, a hospital.
CHAPTER 2 SEISMIC DESIGN REGULATIONS
29
2.3 American Regulation:
The National Earthquake Hazards Reduction Program (NEHRP) was established by the U.S.
Congress when it passed the Earthquake Hazards Reduction Act of 1977, Public Law (PL) 95-
124 [1]. In its initial NEHRP authorization in 1977, and in subsequent reauthorizations, U.S.
Congress has recognized that several key Federal agencies can contribute to earthquake
mitigation efforts. Today, there are four primary NEHRP agencies:
- Federal Emergency Management Agency (FEMA) of the Department of Homeland
Security;
- National Institute of Standards and Technology (NIST) of the Department of Commerce
(NIST is the lead NEHRP agency);
- National Science Foundation (NSF);
- United States Geological Survey (USGS) of the Department of the Interior.
One of the goals of the Department of Homeland Security’s FEMA and the NEHRP is to
encourage design and building practices that address the earthquake hazard and minimize the
resulting risk of damage and injury. In this section is presented the content of the 2003 edition of
the NEHRP Recommended Provisions for Seismic Regulation of New Buildings and Other
Structures (FEMA 450-1/2003 Edition) [33], consisting in criteria and requirements for the
design and verification of building subjected to earthquakes ground motion.
2.3.1 FEMA 450:
The Provisions present criteria for the design and construction of structure to resist earthquake
ground motion. The design earthquake ground motion levels specified herein could result in
both structural and non-structural damage. For the architectural components calculation and
verification the Provisions dedicate a large section, in Chapter 6. In particular there is also a part
specifically dealing about non-structural elements like exterior wall panels. In the following
sections an extract of the Provisions is reported.
2.3.1.1 Component force transfer:
Components shall be attached such that the component forces are transferred to the structure.
Component attachments that are intended to resist seismic forces shall be bolted, welded, or
otherwise positively fastened without consideration of frictional resistance produced by the
effects of gravity. A continuous load path of sufficient strength and stiffness between the
component and the supporting structure shall be verified. Local elements of the supporting
structure shall be designed for the component forces where such forces control the design of
the elements or their connections. In this instance, the component forces shall be those
determined in the following section, except that modifications to Fp and Rp due to anchorage

SEISMIC BEHAVIOUR OF CURTAIN WALL FACADES Umberto Galli
30
conditions need not to be considered. The design documents shall include sufficient information
concerning the attachments to verify compliance with the requirements of these Provisions.
2.3.1.2 Seismic forces:
The seismic design force, Fp, applied in the horizontal direction shall be centred at the
component’s centre of gravity and distributed relative to the component's mass distribution and
shall be determined as follows:
Equation 2-3
Exception: If the component period, Tp , is greater than Tflx where Tflx = (1 + 0.25 z/h) SD1 /SDS ,
the value of Fp may be reduced by the ratio of Tflx / Tp.
Fp is not required to be taken as greater than:
Fp =1.6SDS IpWp Equation 2-4
and Fp shall not be taken as less than:
Fp = 0.3SDS IpWp Equation 2-5
The force Fp shall be independently applied in each of two orthogonal horizontal directions in
combination with service loads. In addition, the non-structural component shall be designed for
a concurrent vertical force ± 0.2SDS Wp.
Where wind loads on non-structural exterior walls or building code horizontal loads on interior
partitions exceed Fp, such loads shall govern the strength design, but the detailing requirements
and limitations prescribed in this chapter shall apply.
2.3.1.3 Seismic relative displacements:
The relative seismic displacements, Dp, for use in component design shall be determined in as
follows:
Dp =δxA −δ yA Equation 2-6
Dp is not required to be taken greater than:
Equation 2-7
The effects of relative seismic displacement shall be considered in combination with
displacement caused by other loads as appropriate.

CHAPTER 2 SEISMIC DESIGN REGULATIONS
31
2.3.1.4 Architectural components:
Architectural components, and their supports and attachments, shall satisfy the requirements of
this section. Appropriate coefficients shall be selected from Table 2-2, as follows:
Architectural Component or Element ap Rp
Interior non-structural walls and partitions
Plain masonry walls
All other walls and partitions
1,0
1,0
1,5
2,5
Cantilever Elements, unbraced or braced (to structural frame) below their centres of mass:
Parapets and cantilevered interior non-structural walls
Chimneys and stacks where laterally supported by structures
2,5
2,5
2,5
2,5
Cantilever elements, braced (to structural frame) above their centres of mass:
Parapets
Chimneys and stacks
Exterior non-structural walls
1,0
1,0
1,0
2,5
2,5
2,5
Exterior non-structural wall elements and connections
Wall element
Body of wall-panel connections
Fasteners of the connecting system
1,0
1,0
1,25
2,5
2,5
1,0
Veneer
High deformability elements and attachments
Low deformability elements and attachments
1,0
1,0
2,5
1,5
Penthouses (except where framed by an extension of the building frame) 2,5 3,5
Ceilings
All
1,0
2,5
Cabinets
Storage cabinets and laboratory equipment
1,0
2,5
Access floors
Special access floors
All other
1,0
1,0
2,5
1,5
Appendages and ornamentation 2,5 2,5
Signs and billboards 2,5 2,5
Other rigid components:
High deformability elements and attachments
Limited deformability elements and attachments
Low deformability elements and attachments
1,0
1,0
1,0
3,5
2,5
1,5
Other flexible components
High deformability elements and attachments
Limited deformability elements and attachments
Low deformability elements and attachments
2,5
2,5
2,5
3,5
2,5
1,5
Table 2-2: Coefficients for Architectural Components [33].
SEISMIC BEHAVIOUR OF CURTAIN WALL FACADES Umberto Galli
32
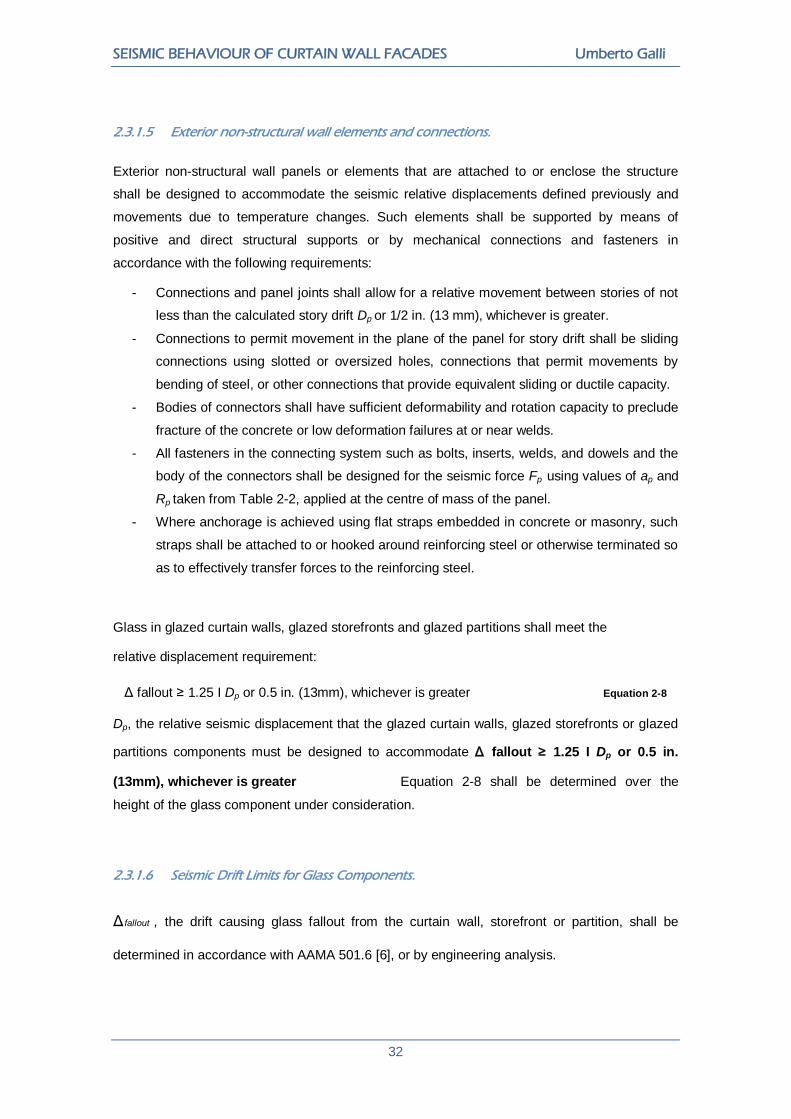
2.3.1.5 Exterior non-structural wall elements and connections.
Exterior non-structural wall panels or elements that are attached to or enclose the structure
shall be designed to accommodate the seismic relative displacements defined previously and
movements due to temperature changes. Such elements shall be supported by means of
positive and direct structural supports or by mechanical connections and fasteners in
accordance with the following requirements:
- Connections and panel joints shall allow for a relative movement between stories of not
less than the calculated story drift Dp or 1/2 in. (13 mm), whichever is greater.
- Connections to permit movement in the plane of the panel for story drift shall be sliding
connections using slotted or oversized holes, connections that permit movements by
bending of steel, or other connections that provide equivalent sliding or ductile capacity.
- Bodies of connectors shall have sufficient deformability and rotation capacity to preclude
fracture of the concrete or low deformation failures at or near welds.
- All fasteners in the connecting system such as bolts, inserts, welds, and dowels and the
body of the connectors shall be designed for the seismic force Fp using values of ap and
Rp taken from Table 2-2, applied at the centre of mass of the panel.
- Where anchorage is achieved using flat straps embedded in concrete or masonry, such
straps shall be attached to or hooked around reinforcing steel or otherwise terminated so
as to effectively transfer forces to the reinforcing steel.
Glass in glazed curtain walls, glazed storefronts and glazed partitions shall meet the
relative displacement requirement:
Δ fallout ≥ 1.25 I Dp or 0.5 in. (13mm), whichever is greater Equation 2-8
Dp, the relative seismic displacement that the glazed curtain walls, glazed storefronts or glazed
partitions components must be designed to accommodate Δ fallout ≥ 1.25 I Dp or 0.5 in.
(13mm), whichever is greater Equation 2-8 shall be determined over the
height of the glass component under consideration.
2.3.1.6 Seismic Drift Limits for Glass Components.
Δ fallout , the drift causing glass fallout from the curtain wall, storefront or partition, shall be
determined in accordance with AAMA 501.6 [6], or by engineering analysis.

CHAPTER 2 SEISMIC DESIGN REGULATIONS
33
2.3.2 Considerations:
FEMA 450 provides a calculation method based on several coefficients to obtain the seismic
force to be applied to the considered non-structural element centre of mass.
The provided equation, as possible to view from Table 2-2, is applicable to a great variety of
elements.
As well, some others requirements are provided for exterior non structural wall panels or
elements, mainly about the possibility for the façade to accommodate and permit the inter-
storey drift of the building structure without damages and specifically focusing on the fastening
system design details.
Finally, after the specific requirement according to that glazed curtain walls, glazed storefronts
and glazed partitions shall meet the relative displacement requirement Δfallout ≥ 1.25 I Dp or 0.5
in. (13mm), whichever is greater, FEMA 450 [33] suggests a specific regulation (AAMA 501.6
[6]) for the experimental method through that is possible to obtain the minimum inter-storey drift
value causing glass fallout, Δfallout.
2.4 New Zealand Standards
2.4.1 NZS 1170.5:
The New Zealand Standard NZS 1170.5 [53] sets out procedures and criteria for establishing
the earthquake actions to be used in the limit state design of structures and parts of structures
within New Zealand. The section of the standard that has to be considered in this case is
Section 8, “Requirements for parts and components”, where it is required that all parts of
structures, including permanent, non-structural components and their connection, and
permanent services and equipment supported by structures, shall be designed for the
earthquake actions specified. All these elements are recognised and named “parts” in the code.
The following Table 2-3 reports the classification criteria of parts proposed by the standard:

SEISMIC BEHAVIOUR OF CURTAIN WALL FACADES Umberto Galli
34
Table 2-3: Parts classification criteria [53].
Where ULS corresponds to Ultimate Limit State and SLS to Serviceability Limit State.
For category P.1, P.2 and P.3 parts the scope is limited to parts that weigh more than 10 Kg
and are able to fall more than 3 m onto a publicly accessible area.
Where the mass of the part is in excess of 20% of the combined mass of the part and the
primary structure and its lowest translational period is greater than 0.2 seconds, a special study
shall be carried out to determine the dynamic characteristics of the part.
2.4.2 Design action on parts:
New Zealand standards require the consideration of both a vertical and a horizontal action
application to every single part for its verification during a seismic event. In the following
sections the calculation methods to obtain these parameters are reported.

CHAPTER 2 SEISMIC DESIGN REGULATIONS
35
2.4.2.1 Horizontal design actions:
The horizontal design earthquake actions on a part, Fph, shall be determined from the following
Fph = Cp(Tp) Cph RpWp 3.6 Wp Equation 2-9:
Fph = Cp(Tp) Cph RpWp 3.6 Wp Equation 2-9
where:
Cp(Tp)= the horizontal design coefficient of the part, depending on the site hazard, the period of
the part, a factor depending on the part spectral shape and a coefficient related to the floor
height considered.
Cph = the part horizontal response factor, chosen in according to the ductility of the part
from the following Table 2-4.
Rp = the part risk factor, as given by Table 2-3
Wp = the weight of the part.
2.4.2.2 Vertical design actions:
Parts that are sensitive to vertical acceleration amplification shall be designed for vertical
earthquake actions. Unless determined by a special study, the vertical earthquake actions on a
part, Fpv, shall be calculated using the following Fpv = Cpv Cvd RpWp ≤ 2.5Wp
Equation 2-10:
Fpv = Cpv Cvd RpWp ≤ 2.5Wp Equation 2-10
where:
Cpv = parts vertical response factor, chosen in according to the ductility of the part from the
following Table 2-4.
Cvd = the vertical design action coefficient determined from Section 5 (“Design earthquake
actions”) for the period of the system supporting the part.
Rp = the part risk factor, as given by Table 2-3
Wp = the weight of the part.

SEISMIC BEHAVIOUR OF CURTAIN WALL FACADES Umberto Galli
36
2.4.2.3 Deflection induced actions:
Where the part is connected to the primary structure on more than one level, the part shall be
designed to sustain the actions resulting from the relative deflections that occur for the limit
state being considered.
2.4.2.4 Part response factor Cph:
The part horizontal factor, Cph, shall be as provided in Table 2-4 with the ductility of the part μp =
1.0 unless the level of floor acceleration is such as to bring about yielding of the part.
The part vertical response factor, Cpv, shall be determined according to Table 2-4 with μp = 1.0
unless otherwise determined by special study.
For serviceability limit states μp = 1.0.
Table 2-4: Part response factors [53].
2.4.2.5 Connections:
Non-ductile connections for parts shall be designed for seismic actions corresponding to a
ductility factor of the part of μp = 1.25.
Non-ductile connections include, but are not limited to, expansion anchors, shallow chemical
anchors or shallow (non-ductile) cast-in-place anchors in tension and not engaged with the main
reinforcement.
Other connections may be designed for a greater value of μp where the specific detailing can be
verified to sustain not less than 90% of their design action effects at a displacement greater
than twice their yield displacement under reversed cyclic loading.

CHAPTER 2 SEISMIC DESIGN REGULATIONS
37
2.4.3 Considerations:
New Zealand Regulation requires the verification of non-structural elements, called “parts”,
under the application of a seismic action to the centre of mass of the element. The equation
provided and its coefficients are very similar to the calculation method prescribed by the
European Regulation Eurocode 8. The seismic action to be applied is not only a horizontal force
but also a vertical oriented one. In particular, NZS requires also a specific minimum ductility
factor, equal to 1,25, of the considered part. A deeper analysis will be carried out in the
following section 2.6.
2.5 Japan regulation:
As described in the introduction of the present chapter, Japan is one of the highest-seismicity
area of the world, because of its location on the so called “Pacific Ring of Fire” [2, 35]. As a
consequence the study of seismic events and the prevention applied to the building design and
construction phases are extremely important. In fact Japanese regulations offer a specific code
for the design of façade and curtain walls subjected to seismic actions: the JASS14 standard
[10], in the following sections described and briefly commented.
2.5.1 JASS14:
A first consideration is proposed by the regulation: seismic energy is grouped into two major
types, P-waves (primary waves), a faster conveyance and mainly longitudinal acting, and the
other S-waves (secondary waves), a slower conveyance than P-waves and mainly in the
transversal direction acting. When the building is exposed to such energies, the curtain wall
must structurally be safe under forces such as:
- Impact forces against P-waves = Curtain wall dead load x vertical acceleration
- Impact forces against S-waves = Curtain wall dead load x horizontal acceleration
The study on these forces includes a safety verification: calculate cross-section strength by
multiplying each member with specified acceleration speed and compare with short-term
allowable stress of each component (mainly checked around brackets). Details of the study are
left out, because they deal about a simple structural analysis.
The Japanese standard mainly focuses on the study method for curtain wall secondary
deformation occurred due to story drift of the building.
When a story drift happened by earthquake, relative displacement occurs between floors.
When the story displacements occur in curtain walls, relative displacements are generated in
frames and glasses so that the members need to be checked based on the required
performances. Checking methods on each grade are explained in the following.

SEISMIC BEHAVIOUR OF CURTAIN WALL FACADES Umberto Galli
38
2.5.1.1 Design specification:
Regulations specify different levels or “Grades”, depending on a single parameter H, the inter-
story height. Each of these three levels is related to a different seismic hazard and probability of
happening and the façade is requested to guarantee particular performances.
The standard design requirements are as follows:
- Grade 1 = H/300: no damage on internal and external components. This is the grade of
earthquakes that frequently happen in Japan.
- Grade 2 = H/200: all external components must not exceed the allowable stress. The
prolonged use is possible according to the extent in which sealing is repaired. This is the
grade of largest scale earthquakes that happened in the past.
- Grade 3 = H/100: neither the damage of the glass nor the dropout of any components is
allowed. This is the grade of largest scale earthquakes that are forecasted to happen in
the next 100 years.
Where H = floor height.
2.5.1.2 Considerations:
The Japanese regulation presented above focuses on different aspects of the façade seismic
behaviour verification in the event of earthquake. In fact, while on one hand a “traditional” force-
based design is recommended considering both the horizontal and the vertical accelerations
induced by the earthquake to the façade elements, on the other hand three different levels,
distinguished by several specific performance requirements, are recognised and have to be
verified in the design of the façade. Consequently this has to guarantee different performances
in function of the seismic event that could occur. To each of these levels or grades is associated
an increasing level of hazard, that varies from “the highest-probable seismic event”, passing by
the “greatest earthquake ever happened in the past”, until reach “the greatest earthquake
expected for the next 100 years”. Therefore it is possible to say that this regulation is a
performance-based design regulation.
In addition another, and maybe more, important consideration is that the three different grades
of performance required are based and depend on a single parameter that varies in function of
the performance level hazard. This value is a displacement that has to be statically applied to
the façade. Hence this time the design of the façade is displacement-based, and not force-
based as usually. Finally the requirement specifies that the displacement that has to be applied
depends on a façade characteristic itself: the inter-storey height “H”.

CHAPTER 2 SEISMIC DESIGN REGULATIONS
39
2.6 Comparison between regulations:
After the consideration of the described National Standards and Codes could be useful to alight
on the comparison that can be made about the differences between them and, on the contrary,
the possible similarities and common points present.
Every National Standard, except for the Japanese one, offers and requires the verification of a
detailed calculation method, based on several different coefficients, through that is possible to
obtain the horizontal seismic action that has to be applied to the centre of mass of the
considered non-structural element. The equations provided by National Regulations are very
similar, especially American and New Zealand ones, based on several coefficients through that
is possible to consider different types of non-structural elements, building structures, site ground
conditions, bracket systems or importance factors. It must be underlined instead that the
Japanese Standard JASS14 is specifically focused on the verification of the curtain wall seismic
behaviour. On the contrary, the other regulations are generally referred to the design of non-
structural elements, so that, as a consequence, they are more generic and they have to use
different coefficients to be able to consider each of the several possible elements to be verified,
including curtain wall systems.
Another important difference is that only American and New Zealand regulations consider,
providing specific equations, the vertical acceleration to be applied to non-structural elements.
The Japanese Standard requires that the façade has to be verified under both the horizontal
and the vertical acceleration, but it does not provide any specific equation for their value
calculation.
For what concerning instead the consideration of the inter-storey drift value, is evident how the
European Eurocode 8 does not take into account this parameter and it does not require any
specific verification about it.
American and obviously Japanese Regulations specifically consider the inter-storey drift. FEMA
requires that in any case the non-structural element has to accommodate the relative
displacement between two adjacent storeys. JASS14 actually does not consider specifically the
drift parameter, but on the contrary requires the façade to accommodate an horizontal applied
displacement, relative between the upper and the lower floor slabs, calculated and based on the
inter-storey height H and specifying several performance objectives for each of the three grades
reported. New Zealand regulation considers instead the inter-storey drift, but only marginally
saying that in case it would be greater than the displacement permitted by the non-structural
elements, then this must be isolated from the building structure. Anyway this is a quite generic
requirement because does not suggest any indication about how isolate the non-structural
element.
SEISMIC BEHAVIOUR OF CURTAIN WALL FACADES Umberto Galli
40
On the contrary New Zealand Regulation is the only one requiring a minimum value of ductility
of the fastening system of the non-structural element, called “part”, that should be at least equal
to 1,25.
Finally then, the American regulation is the only one that, requiring the inter-storey drift to be
accommodated by the non-structural element, indicates and specifies additional references to
carry out the experimental performance mock-up tests and to evaluate, always through an
experimental test, the so called Δfallout, the displacement able to cause the glass plate fallout
from the façade frame.
2.7 AAMA 501.4 and AAMA 501.6:
This thesis tries, among the others scopes of the work, to underline the importance of the
proper design of curtain wall unitized and panellized systems under seismic action.
However a “proper” design has to be supported by an extensive knowledge about the specific
behaviour of the considered element. This knowledge, especially in case of an intricate topic
such as the behaviour of a non-structural element made of different components with extremely
different mechanical behaviour (glass plate and aluminium extruded profiles) subjected to an
unpredictable and unexpected action such as the seismic one, in addition even filtered by the
structure in a unique specific way, can be achieved not only with a theoretic finite element
modelling analysis campaign or with a wide experimental campaign, but with both them,
associated and developed together for the establishment of a huge data bank and a
background on which base the aware design.
This wide and comprehensive knowledge does not exist yet, but there have already been some
steps forward, especially about experimental test methods.
American Architectural Manufacturers Association (AAMA) for example provides a mock-up test
guidelines for evaluating the behaviour of a storefront system subjected to the inter-storey drift
and for determining the seismic drift causing glass fallout from a wall system, respectively
AAMA 501.4-00 [7] and AAMA 501.6-01 [6] standards.
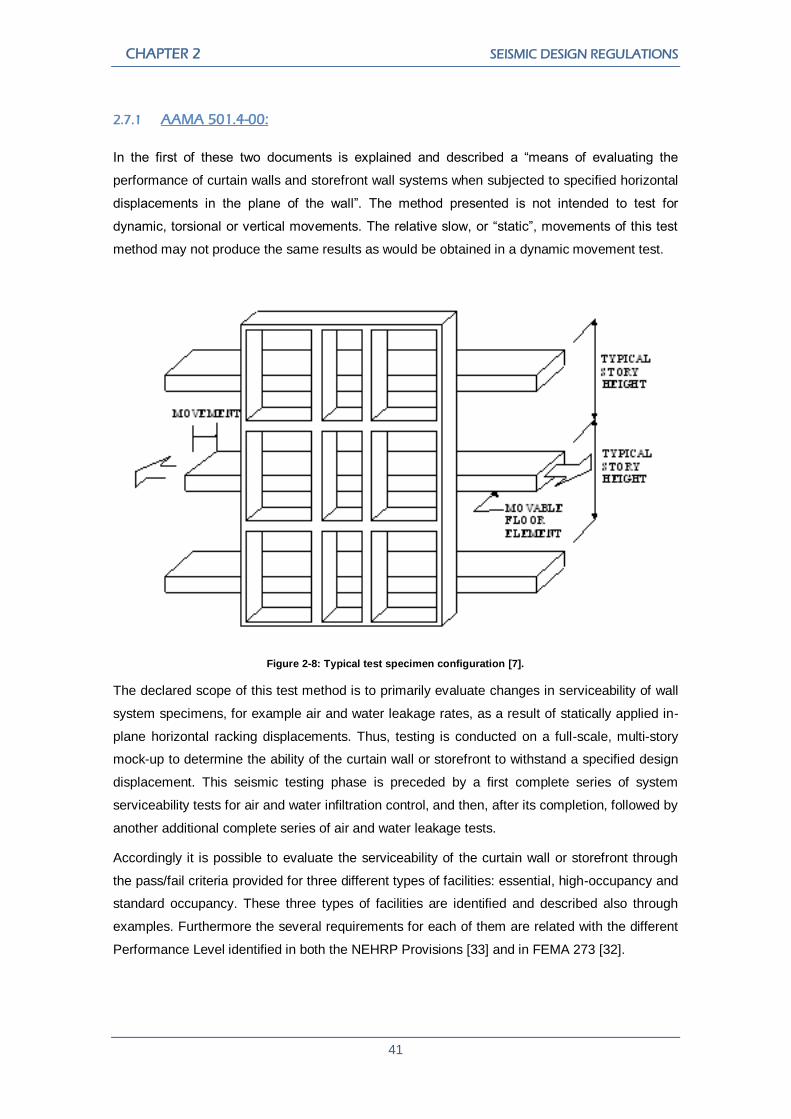
CHAPTER 2 SEISMIC DESIGN REGULATIONS
41
2.7.1 AAMA 501.4-00:
In the first of these two documents is explained and described a “means of evaluating the
performance of curtain walls and storefront wall systems when subjected to specified horizontal
displacements in the plane of the wall”. The method presented is not intended to test for
dynamic, torsional or vertical movements. The relative slow, or “static”, movements of this test
method may not produce the same results as would be obtained in a dynamic movement test.
Figure 2-8: Typical test specimen configuration [7].
The declared scope of this test method is to primarily evaluate changes in serviceability of wall
system specimens, for example air and water leakage rates, as a result of statically applied in-
plane horizontal racking displacements. Thus, testing is conducted on a full-scale, multi-story
mock-up to determine the ability of the curtain wall or storefront to withstand a specified design
displacement. This seismic testing phase is preceded by a first complete series of system
serviceability tests for air and water infiltration control, and then, after its completion, followed by
another additional complete series of air and water leakage tests.
Accordingly it is possible to evaluate the serviceability of the curtain wall or storefront through
the pass/fail criteria provided for three different types of facilities: essential, high-occupancy and
standard occupancy. These three types of facilities are identified and described also through
examples. Furthermore the several requirements for each of them are related with the different
Performance Level identified in both the NEHRP Provisions [33] and in FEMA 273 [32].

SEISMIC BEHAVIOUR OF CURTAIN WALL FACADES Umberto Galli
42
In contrast is possible to underline that this standard requires the application at least of three
cycles of displacements to the specimen, but it doesn’t provide any information about how to
determine or calculate the different amplitudes of movement to be applied. The “Test Agency”,
as named in the document, is charged of the determination of these amplitudes. Finally is also
not provided any information or minimum requirements about the duration of the test, that again
will be determine by the “Test Agency”. The sole requirement is that the test must be conducted
enough slowly to avoid any acceleration or deceleration.
2.7.2 AAMA 501.6-00:
AAMA 501.6 [6] instead has the purpose of describing “a dynamic racking crescendo test for
determining Δfallout”, defined as the “in-plane dynamic drift causing glass fallout from a glazed
curtain wall panel, a glazed storefront panel or a glazed partition panel”. This experimental
determination is required by the National Earthquake Hazards Reduction Program (NEHRP) in
the specific case that no sufficient clearance has been provided between glass edges and wall
frame glazing pockets to prevent contact during seismic design displacement in the main
structural system of the building. The following Figure 2-9 shows how a dynamic racking test
facility is structured.
Figure 2-9: Dynamic racking test facility [6].
The “crescendo test”, named in this standard, consists of a concatenated series of “ramp up”
intervals and “constant amplitude” intervals. Ramp up and constant amplitude intervals shall
consist of four sinusoidal cycles each. Thus the glazed specimen is moved back and forth
horizontally in sinusoidal motions at gradually and progressively higher racking amplitudes,
exactly as in a musical crescendo. In the following Figure 2-10 the entire drift time history of a
crescendo test is reported.
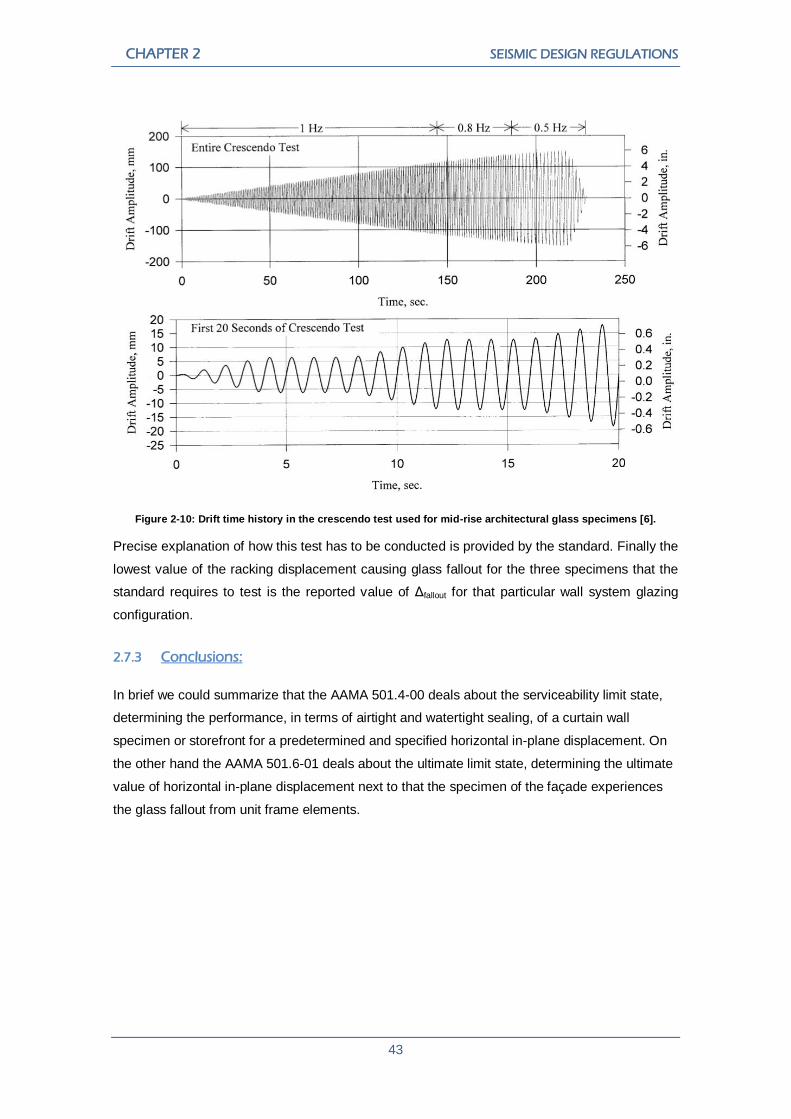
CHAPTER 2 SEISMIC DESIGN REGULATIONS
43
Figure 2-10: Drift time history in the crescendo test used for mid-rise architectural glass specimens [6].
Precise explanation of how this test has to be conducted is provided by the standard. Finally the
lowest value of the racking displacement causing glass fallout for the three specimens that the
standard requires to test is the reported value of Δfallout for that particular wall system glazing
configuration.
2.7.3 Conclusions:
In brief we could summarize that the AAMA 501.4-00 deals about the serviceability limit state,
determining the performance, in terms of airtight and watertight sealing, of a curtain wall
specimen or storefront for a predetermined and specified horizontal in-plane displacement. On
the other hand the AAMA 501.6-01 deals about the ultimate limit state, determining the ultimate
value of horizontal in-plane displacement next to that the specimen of the façade experiences
the glass fallout from unit frame elements.

SEISMIC BEHAVIOUR OF CURTAIN WALL FACADES Umberto Galli
44

CHAPTER 3
CASE OF STUDY
This thesis focuses on the study of the seismic behaviour of a specific typology of curtain wall:
the unitized and panellized system. For this purpose a comparison between two different
methods of study of the same topic will be conducted: on one hand the experimental campaign
of test on a real specimen of the façade, a mock-up on a 1:1 scale of the effective façade of the
case of study considered, and, on the other hand, the finite element analysis (FEM) modelling of
the same specific façade, considering a single unit of the façade and trying to render it through
the use of the finite element software “Straus7”.
3.1 Introduction and description of the case of study:
The specific case of study taken into account is a recent project, commissioned by the final
client, the Manchester Metropolitan University Business School, on November 2009 to
Permasteelisa S.p.a. and carried out from July 2010 to January 2011, the official completion
date.
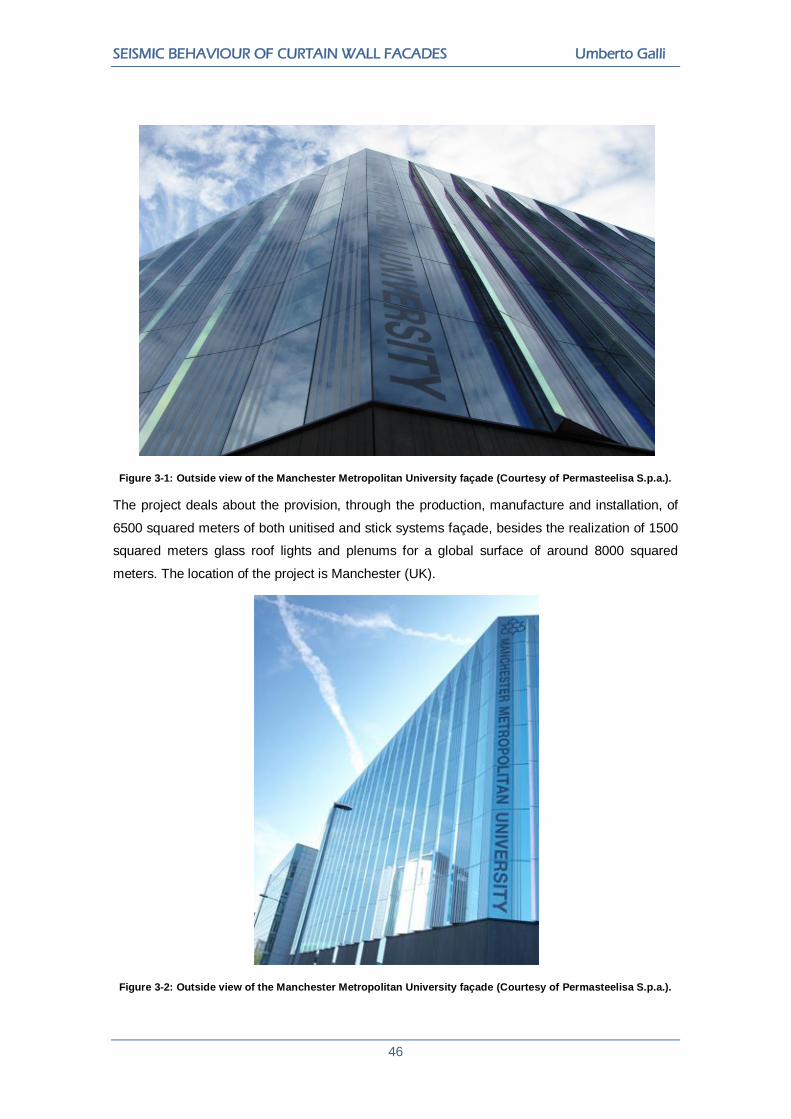
SEISMIC BEHAVIOUR OF CURTAIN WALL FACADES Umberto Galli
46
Figure 3-1: Outside view of the Manchester Metropolitan University façade (Courtesy of Permasteelisa S.p.a.).
The project deals about the provision, through the production, manufacture and installation, of
6500 squared meters of both unitised and stick systems façade, besides the realization of 1500
squared meters glass roof lights and plenums for a global surface of around 8000 squared
meters. The location of the project is Manchester (UK).
Figure 3-2: Outside view of the Manchester Metropolitan University façade (Courtesy of Permasteelisa S.p.a.).

CHAPTER 3 CASE OF STUDY
47
Figure 3-3: Global view of the Manchester Metropolitan University building (Courtesy of Permasteelisa S.p.a.).
Actually the experimental campaign introduced at the beginning of the present chapter has
been originally thought and successively carried out in order to investigate and evaluate the real
difference in the behaviour of two different types of structural silicon joint: Sika SG500, with a
cross-section area equal to 10 x 6 mm, and Sika SG550, with a cross-section area equal to 6 x
6 mm. The façade in fact is a structurally sealed curtain wall type, unitized and panellized
system, characterized by a single glass plate of 1452 x 3752 mm dimensions retained to the
aluminium frame through the use of structural silicon.
In order to evaluate the different behaviour of the two mentioned types of silicon joints, a
performance mock-up series of tests has been conducted. For this purpose the already
described Japanese Standard JASS14 [10] has been taken as reference point and all its
directions, especially about the three different displacement amplitudes to be applied to the
façade, have been carried out. Consequently, the mock-up experimental campaign of tests has
not been commissioned because of a real need in the seismic design verification of the façade
behaviour during an earthquake. Considering in fact the really low-seismic geographical area of
Manchester it would be an extremely unlikely event. However the proceeding method followed
allows to directly use and compare the obtained results of the carried out experimental tests, as
in the following sections and chapters will be deeply explained.
The façade unit frame is constituted by aluminium (type 6063 T6 – BS EN 755-2:1997 [34]; type
6005 T6 – BS EN 755-2:1997 [34]) extruded profiles, mullions and transoms, all characterised
by a male-female type of joint to link different adjacent units.
Finally, the fasten system is constituted by aluminium brackets, hooks and steel bolts that all
together keep the facade attached to the structure. In the following images and drawings it is
possible to view the several components just listed.
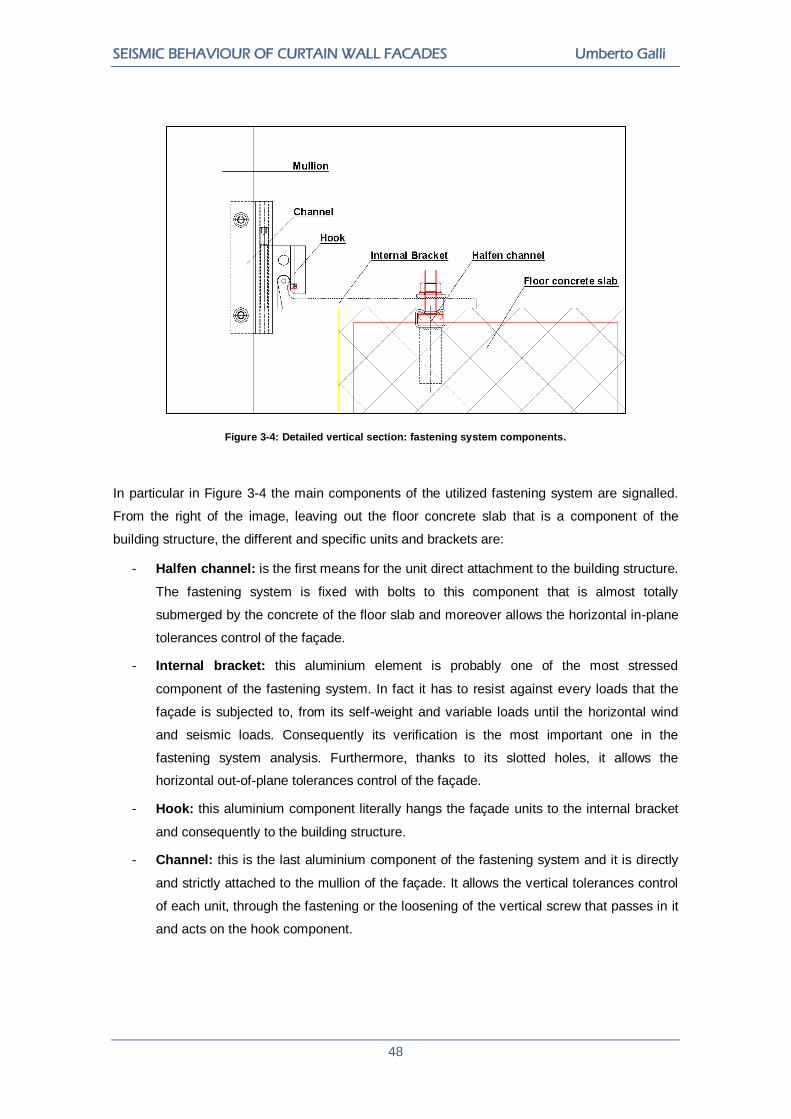
SEISMIC BEHAVIOUR OF CURTAIN WALL FACADES Umberto Galli
48
Figure 3-4: Detailed vertical section: fastening system components.
In particular in Figure 3-4 the main components of the utilized fastening system are signalled.
From the right of the image, leaving out the floor concrete slab that is a component of the
building structure, the different and specific units and brackets are:
- Halfen channel: is the first means for the unit direct attachment to the building structure.
The fastening system is fixed with bolts to this component that is almost totally
submerged by the concrete of the floor slab and moreover allows the horizontal in-plane
tolerances control of the façade.
- Internal bracket: this aluminium element is probably one of the most stressed
component of the fastening system. In fact it has to resist against every loads that the
façade is subjected to, from its self-weight and variable loads until the horizontal wind
and seismic loads. Consequently its verification is the most important one in the
fastening system analysis. Furthermore, thanks to its slotted holes, it allows the
horizontal out-of-plane tolerances control of the façade.
- Hook: this aluminium component literally hangs the façade units to the internal bracket
and consequently to the building structure.
- Channel: this is the last aluminium component of the fastening system and it is directly
and strictly attached to the mullion of the façade. It allows the vertical tolerances control
of each unit, through the fastening or the loosening of the vertical screw that passes in it
and acts on the hook component.
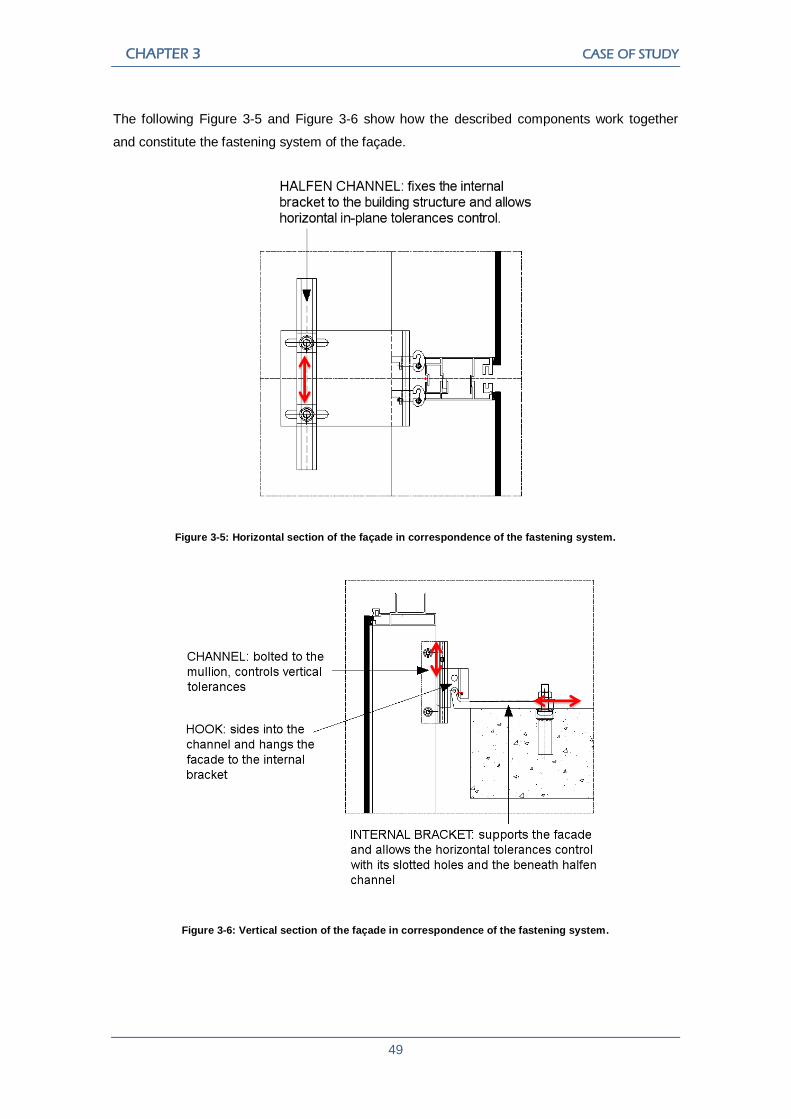
CHAPTER 3 CASE OF STUDY
49
The following Figure 3-5 and Figure 3-6 show how the described components work together
and constitute the fastening system of the façade.
Figure 3-5: Horizontal section of the façade in correspondence of the fastening system.
Figure 3-6: Vertical section of the façade in correspondence of the fastening system.

SEISMIC BEHAVIOUR OF CURTAIN WALL FACADES Umberto Galli
50
3.2 Design and comparison criteria:
The previous chapter shows and describes the differences and compares the requirements of
several main world regulations about the seismic design and verification of a non-structural
component. As it has been noticed and underlined in the conclusions about this comparison,
there is a strong attention, transposed in very similar calculation methods, on the application to
the non-structural element studied and considered of an action (a force) in the centre of mass of
the element itself.
Some regulations also include a displacement-based requirement that demands the non-
structural element to follow and accommodate the building movements, especially focused on
the inter-story drift, induced by the seismic action on the building.
It is firstly important to specify and to underline that these regulations requirements have been
wrote up and designed for the general verification and calculation of a non-structural element of
the building. However the specification “non-structural” element indicates a very wide and
various category, that comprehends interior and exterior elements, walls and partitions, ceilings,
cabinets, ornamentations and furniture in general.
With this in mind it is possible to understand how all these regulations are not specific for the
verification under seismic action of the curtain wall façade, especially of an high-rise building. Of
course it is not a strict rule, but is also undeniable that a curtain wall, and more specifically the
unitized and panellized system, is a characteristic curtain wall technology system of a medium-
to-high rise building.
Consequently the wind pressure is the strongest action, even by an order of magnitude, that will
load the façade and the single unit, this way leading the design and verification process of the
façade and its components [18, 51]. On the contrary standards and regulations requirements
demand for the verification of the facade under the action of a force. This is obviously more
significant for all the internal buildings elements and components, such as furniture, equipment
and shelves, and it is relatively more comparable to the wind action for external non-structural
elements at low heights.
For a typical unitized and panellized curtain walling system, instead, the first consideration
before proceeding to the modelling and testing phase concerns the seismic action to be applied
to the façade, calculated as indicated and specified by the regulations (for example FEMA and
NZS). This action is almost an order of magnitude less strong than the wind load that the façade
would be designed and verified for. As a consequence every single façade unit and every its
component are already studied and designed for a stronger action.

CHAPTER 3 CASE OF STUDY
51
Another important consideration that could be made is that, always because of the assumptions
on which the standards are based on, the explicit requirement of applying the calculated force to
the centre of mass of the element always derives by the non-specificity of the regulations
themselves. Obviously this design method is reasonable and correct for the most of the
“external non-structural elements”: in case of low-rise buildings these elements are mainly
constituted by cladding panels, probably precast and made of concrete or similar material and
more generally simpler than a unitized and panellized façade unit. In fact in this case it is
necessary to keep in mind the elaborate and sharp structure of the unit. In particular, the
application of a single specific force in a single specific point, centre of mass of the facade unit,
risks to activate a wrong path of load and to concentrate the most of the stresses in the glass
plate and in its retaining system. On the contrary the most stressed component of the unit will
be the fastening system, responsible for the façade attachment to the structure. However
brackets, as we previously said, already have to be verified for a stronger load such as the wind
load.
3.3 Conclusions:
Therefore after all these considerations it is understandable how displacements have to be the
primary requirement to be considered, studied and on which the design has to be based. In fact
they represent the main hazard for the integrity of the unit in case of seismic events, proved that
the action induced by an earthquake to a curtain wall façade, especially the unitized and
panellized system here considered, is much less strong than the wind pressure load.
The importance of this type of design and its principles is primarily deriving and caused by, on
one hand, the characteristic brittle behaviour of the glass and, on the other hand, the light
aluminium extruded profile frame of the unit and its consequent easily deformable behaviour
under imposed displacements. In fact, as we previously introduced, one of the most frequent
consequences of an earthquake on this type of non-structural elements is just the glass failure
and its fallout from the façade frame.

SEISMIC BEHAVIOUR OF CURTAIN WALL FACADES Umberto Galli
52

CHAPTER 4
EXPERIMENTAL PERFORMANCE
TEST
This chapter will focus on the presentation and description of the equipment utilized and the
strategies adopted for the experimental test campaign on the available case of study mock-up.
Here it will be firstly presented a brief background of mock-up performance tests and
experimental campaign, for a better understanding of the meaning of this practice and its
various and several possibilities of use. Secondly, a complete description of the facility utilized
for the experimental campaign and the equipment available is provided. Subsequently a brief
chapter will resume what already said about the Japanese Regulation and explain how it has
been utilized for the seismic performance test as regulation of reference. Finally the results of
this proceeding will be listed and commented.
4.1 Mock-up performance test: the background
As is customary, previous the definitive approval of the façade for a specific project, a series of
performance tests must be carried out in the laboratory before starting the production and the
site erection. All these performance tests, that can help to increase the probability of trouble free
performance of the wall on the completed building, are conducted on a 1:1 scale model of the
façade, having exactly the same characteristics of the real final product.
SEISMIC BEHAVIOUR OF CURTAIN WALL FACADES Umberto Galli
54
It is very important that the wall test specimen have to be a faithful reproduction of the real
curtain wall and that it must be constructed and fixed just as it is to be installed on the building,
with the same conditions of attachments, support and continuity of structural components. [5,
30, 31]
It is also not necessary to reproduce the actual building frame which is to support the wall.
Normally the sample to be tested is attached to a steel structure composed by steel columns
and adjustable beams that can be moved up and down to reproduce the building story height.
This model of the real façade is usually called “Mock-up” and has been originally born for the
visual check of the façade aesthetic quality. As a consequence, having this resource at
disposal, a whole series of performance tests have been developed around it.
Laboratory tests are aimed at evaluating the curtain wall performance and tests are generally
conducted for either exploratory or certification purposes.
- Exploratory tests are carried out during the development of the curtain wall design, and
conducted, as in case of Permasteelisa Group, at the laboratory of the manufacturer with
his own facility and staff, or by an independent testing laboratory. Such tests may be
unrealistic severe, even to destruction, in order to discover design weaknesses and
suggest design improvements. In some laboratories very high pressures can be
achieved during structural tests, up to 12 kPa.
- Certification tests are conducted for the purpose of verifying that a wall conforms with
specifications, or proving the acceptability of a design to the architect and/or owner. This
type of testing may be specified by the architect and they are conducted, or witnessed
by an impartial testing agency.
The most typical tests are the “Structural performance test at the design wind pressure”, the
“Static and dynamic water-tightness” and the “Air leakage test”, mainly because deals about the
primary performance expected from a façade element. In addition there are also many others
tests that could be carried out, as for example the “Impact Test” where a specific dynamic
punctual force is applied to the façade, both to frame profiles and glass plates, through the use
of a pendulum mass. Again, the “Thermal cyclic test”, conducted to evaluate an exterior wall
system’s ability to maintain weather tightness (air leakage and water penetration) after exposure
to a specific number of thermal cycles. The test is performed covering the outdoor side of the
tested mock-up with an enclosure equipped with a means to raise or lower the exterior ambient
temperature.

CHAPTER 4 EXPERIMENTAL PERFORMANCE TEST
55
4.1.1 GENERAL DESCRIPTION OF TESTING:
4.1.1.1 Air Leakage Test:
This test is conducted with the scope of measuring the quantity of air (airflow), measured in
m3/h, that passes through the test specimen. To do this, a differential pressure, both positive
and negative, has to be applied to the test chamber. During each step of increment the air flow
is measured by mean of an air flow meter (e.g. diaphragm or Pitot Tube). A figure is plotted on a
chart showing the actual air leakage, obtained dividing the total air leakage by the specimen
area. This performance test, for example, has been conducted during the seismic experimental
series of tests of the case of study, right before and after the first and lowest magnitude series
of applied displacements, with the aim of evaluating the loss of functionality (in terms of air-
tightness) of the facade after a minor seismic event.
Standard references for this performance mock-up test are for example EN 12153 [22], ASTM
E283 [15]
4.1.1.2 Watertightness – Static Test:
Similarly to the previous, pressure increments are
applied to the test specimen (positive pressure
increments) while water is sprayed by mean of a
spraying grid of nozzles, positioned in front of the test
specimen. The water rate sprayed on to the sample
is different from standard to standard. In many EN
standards water test is required 2 l/min/m2, whilst for
BS and ASTM standards the minimum water flow
rate required is equal to 3.4 l/min/m2. The test is to
be considered successful if no water is penetrated
during and after the completion of the test.
Standard references for this performance mock-up
test are for example EN 12154 [27], EN 12155 [26],
and ASTM E331 [17].
Figure 4-1: Watertightness static test.

SEISMIC BEHAVIOUR OF CURTAIN WALL FACADES Umberto Galli
56
4.1.1.3 Wind Resistance Test:
This is properly a structural test: positive and negative pressure increments are applied to the
test specimen (five pulsations from 0 to 100% of design wind load in accordance to CWCT
standard, four increments equal to 25% of design wind load each up to 100% according to EN
standards). Then the pressure is dropped to zero. During those increment the deflections of the
main framings of the sample are recorded by mean of displacement transducers applied on the
internal face of them. At the satisfactorily completion of all the tests, a safety test is conducted
at both positive and negative wind design pressures, incremented of 50%, in order to verify the
security. Only the residual displacements are taken after the test.
Standard references for this performance mock-up test are for example EN 12179 [24], ASTM
E330 [16], and AAMA TIR A11-04 [4].
4.1.1.4 Watertightness – Dynamic Test:
This is an additional weather test required only by
CWCT (BS) and AAMA standard. It consists on
positioning in front of the test specimen an aero
engine capable of generating an artificial wind.
During the tests the water is sprayed on to the
façade whilst the engine is running. This way the
specimen is subjected to a dynamic pressure and
vibrations, that will reproduce a very severe condition
of work. These conditions are maintained for 15
minutes and, at the end of the test, a visual
inspection is needed to ensure that no water has
entered during and after the completion of the test.
Standard references for this performance mock-up
test are for example ENV 13050 [25] and AAMA
501.1-05 [8].
Figure 4-2: Water-tightness dynamic test.

CHAPTER 4 EXPERIMENTAL PERFORMANCE TEST
57
4.1.1.5 Thermal Test:
Thermal tests are conducted with two different purposes:
- condensation test
- thermal cycles
The first is a test performed to verify that no condensation occurs during the normal winter
working conditions. The indoor temperature and relative humidity are kept constant as well as
the outdoor temperature. To achieve such conditions, a thermal chamber is applied onto the
external face of the test specimen and, by mean of industrial refrigerators, the temperature is
dropped at the required value. At Permasteelisa Group test facility the thermal chamber is able
to chill the external air up to –20°C and more. The internal conditions are maintained in a
steady-state by using an air conditioning system.
The second test is required when is needed to assess thermal-induced movements of the
building. Three cooling/heating cycles are performed on the specimen, cooling down the
outdoor temperature up to –5 / -10°C; then the temperature is kept stable, normally for half one
hour and subsequently raised up to +70/ +80°C for the same period. Three of these cycles are
repeated continuously. At the end of the test an air infiltration and water tightness tests are
repeated to check whether no significant change has verified during the test.
Standard reference for this performance mock-up test is for example AAMA 501.5-98 [9].
4.1.1.6 Impact Test:
A very important component of the curtain wall is the glazing system. Because a curtain walling
system is mainly composed by glass, it is very important that this component complains to
proper safety standards. If one person falls on to the internal face of the curtain wall or, during
the cleaning operations of the exterior face of the glazing an accidental impact occurs on the
external face of the curtain wall, it is needed to ensure certain safety conditions to the
occupants and to the persons that work in the building. That’s why many impact test are often
carried out on curtain walls.
An impact test is normally performed with an impactor made with a bag filled with sand, or lead
shots or glass spheres, with a weight comprised within 45 and 50 Kg.
The impactor is attached to a rope, fixed firmly on a bracket on the wall. Then is raised up as a
pendulum. Once the impactor is released it swings freely on to the sample to test and it delivers
a kinetic energy equal to: En = mgh, where “E” is expressed in Joules, “m” is the mass of the

SEISMIC BEHAVIOUR OF CURTAIN WALL FACADES Umberto Galli
58
impactor in Kg (normally 50 or 45 Kg), “g” is the gravitational acceleration (9.81 m/sec2) and “h”
is he drop height in meters.
Hence, a mass of 50 Kg, that swings from a drop height of 1.80 meters, developed a kinetic
energy of 900 J approximately.
The following Figure 4-3 and Figure 4-4 show an example of impact test on a facade mock-up.
Figure 4-3: Impact resistance mock-up test (Courtesy of Permasteelisa S.p.a.).
Figure 4-4: Impact resistance mock-up test (Courtesy of Permasteelisa S.p.a.).
Standard references for this performance mock-up test are for example PrEN 12600 [29], PrEN
14019 [23] and BS 6206 [48].

CHAPTER 4 EXPERIMENTAL PERFORMANCE TEST
59
4.2 Equipment and test set up:
In this specific case, the mock-up performance test facility of Permasteelisa Spa has been
utilized. In the following image one side of the test area is shown during the installation phase of
a façade mock-up belonging to a Saudi Arabian project situated in Riyad.
Figure 4-5: Outside view of the Permasteelisa mock-up performance test facility (Courtesy of Permasteelisa S.p.a.).
The facility consists of a wide and various specific technical equipment, able to cover the whole
series of performance tests usually required for the façade verification.
In the specific case of study of this thesis, the interest has been obviously focused on the
seismic performance test equipment available in the company facility. This consists essentially
of a so called “seismic beam”, that is in practice a beam that, through the use of an hydraulic
system actuator, is able to induce a static displacement or even an acceleration in each
direction of the space at the same time. Unfortunately, to induce to the façade units mounted on
it an acceleration, it is also necessary an additional software system control not available at the
moment for the company.

SEISMIC BEHAVIOUR OF CURTAIN WALL FACADES Umberto Galli
60
Anyway, as widely introduced in the previous chapters, the most important load that is
necessary to consider is a displacement application to the façade, either because of its greater
importance in the seismic behaviour determination or because the acceleration that would have
been applied to the façade is necessarily the result of a previous complete structural analysis of
the specific building in the specific region where it is placed. However it was impossible to carry
out this structural analysis because of the lack of data about the structural system of the
building.
In the following image the seismic performance test side of the facility, with the close-up blue
coloured seismic beam, is shown. A particular feature to be noticed is the provision, around the
place where the façade units will be installed, of wooden panels through that is possible to
make the mock-up airtight and so to subsequently test, besides the seismic behaviour, also its
potential air and water leakage.
Figure 4-6: Seismic performance test facility: in close-up the blue coloured “seismic beam” (Courtesy of Permasteelisa S.p.a.).
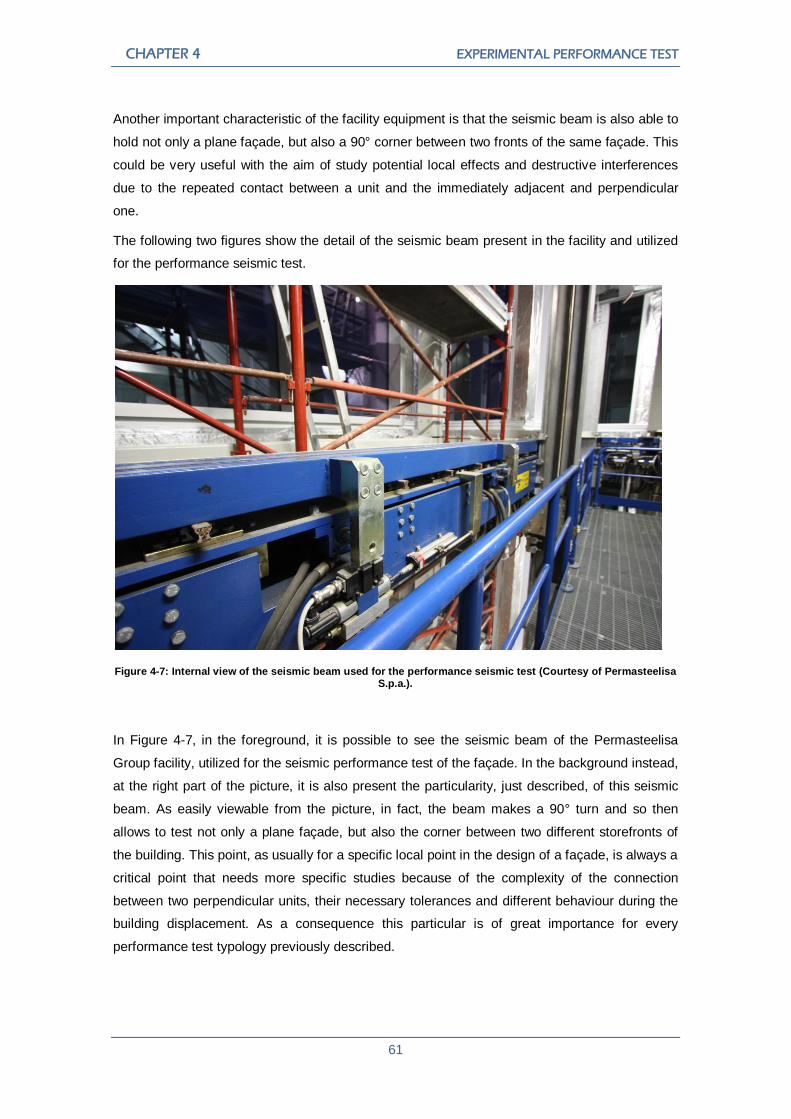
CHAPTER 4 EXPERIMENTAL PERFORMANCE TEST
61
Another important characteristic of the facility equipment is that the seismic beam is also able to
hold not only a plane façade, but also a 90° corner between two fronts of the same façade. This
could be very useful with the aim of study potential local effects and destructive interferences
due to the repeated contact between a unit and the immediately adjacent and perpendicular
one.
The following two figures show the detail of the seismic beam present in the facility and utilized
for the performance seismic test.
Figure 4-7: Internal view of the seismic beam used for the performance seismic test (Courtesy of Permasteelisa S.p.a.).
In Figure 4-7, in the foreground, it is possible to see the seismic beam of the Permasteelisa
Group facility, utilized for the seismic performance test of the façade. In the background instead,
at the right part of the picture, it is also present the particularity, just described, of this seismic
beam. As easily viewable from the picture, in fact, the beam makes a 90° turn and so then
allows to test not only a plane façade, but also the corner between two different storefronts of
the building. This point, as usually for a specific local point in the design of a façade, is always a
critical point that needs more specific studies because of the complexity of the connection
between two perpendicular units, their necessary tolerances and different behaviour during the
building displacement. As a consequence this particular is of great importance for every
performance test typology previously described.
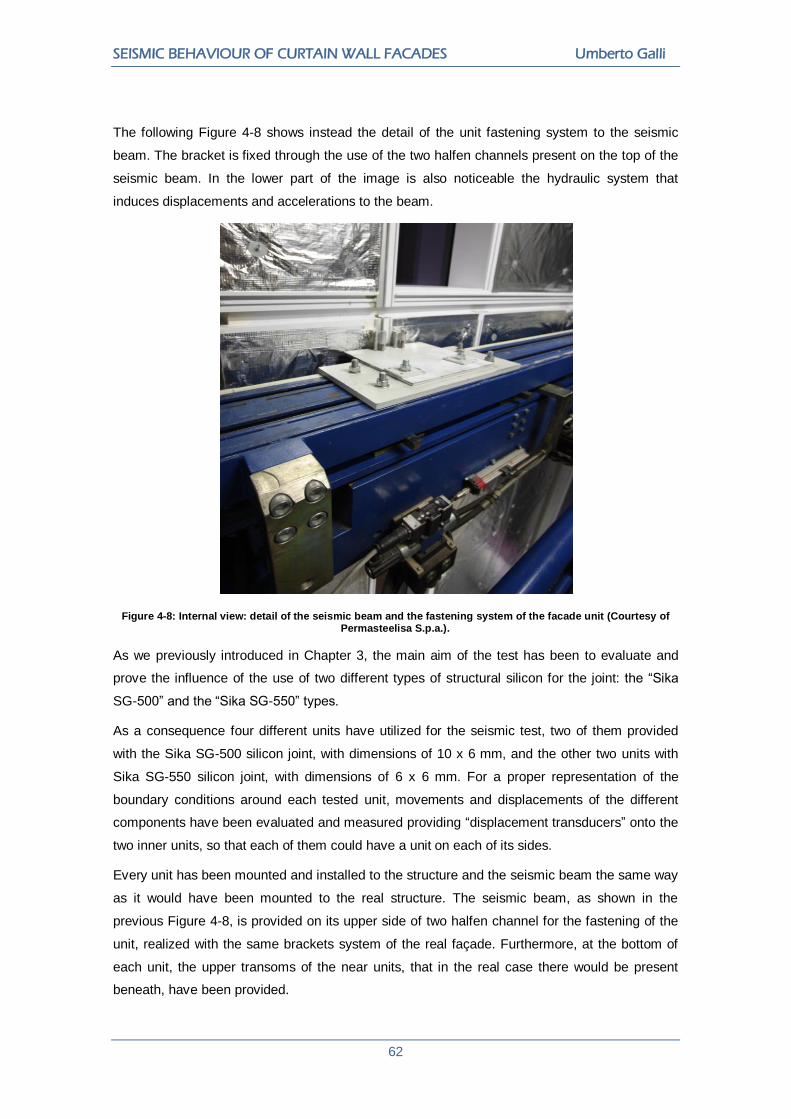
SEISMIC BEHAVIOUR OF CURTAIN WALL FACADES Umberto Galli
62
The following Figure 4-8 shows instead the detail of the unit fastening system to the seismic
beam. The bracket is fixed through the use of the two halfen channels present on the top of the
seismic beam. In the lower part of the image is also noticeable the hydraulic system that
induces displacements and accelerations to the beam.
Figure 4-8: Internal view: detail of the seismic beam and the fastening system of the facade unit (Courtesy of Permasteelisa S.p.a.).
As we previously introduced in Chapter 3, the main aim of the test has been to evaluate and
prove the influence of the use of two different types of structural silicon for the joint: the “Sika
SG-500” and the “Sika SG-550” types.
As a consequence four different units have utilized for the seismic test, two of them provided
with the Sika SG-500 silicon joint, with dimensions of 10 x 6 mm, and the other two units with
Sika SG-550 silicon joint, with dimensions of 6 x 6 mm. For a proper representation of the
boundary conditions around each tested unit, movements and displacements of the different
components have been evaluated and measured providing “displacement transducers” onto the
two inner units, so that each of them could have a unit on each of its sides.
Every unit has been mounted and installed to the structure and the seismic beam the same way
as it would have been mounted to the real structure. The seismic beam, as shown in the
previous Figure 4-8, is provided on its upper side of two halfen channel for the fastening of the
unit, realized with the same brackets system of the real façade. Furthermore, at the bottom of
each unit, the upper transoms of the near units, that in the real case there would be present
beneath, have been provided.

CHAPTER 4 EXPERIMENTAL PERFORMANCE TEST
63
The installation scheme is shown as in the following Figure 4-9:
Figure 4-9: Installation scheme of the mock-up tested facade units.
The following figures show how the unit is attached to the seismic beam. The details of the
bracket system are reported and shown: these two drawings show the upper constraint points of
the facade, fixed to the seismic beam.
Figure 4-10: Detailed drawings of the façade fastening system: vertical (left) and horizontal (right) sections.
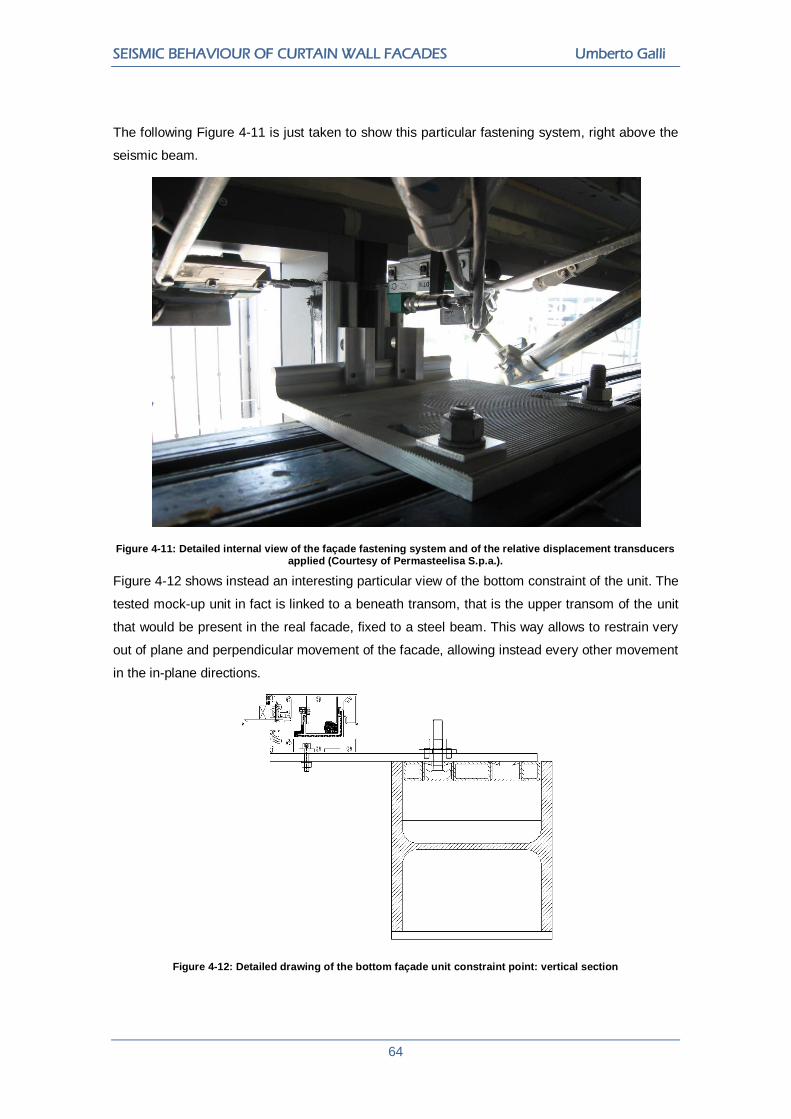
SEISMIC BEHAVIOUR OF CURTAIN WALL FACADES Umberto Galli
64
The following Figure 4-11 is just taken to show this particular fastening system, right above the
seismic beam.
Figure 4-11: Detailed internal view of the façade fastening system and of the relative displacement transducers applied (Courtesy of Permasteelisa S.p.a.).
Figure 4-12 shows instead an interesting particular view of the bottom constraint of the unit. The
tested mock-up unit in fact is linked to a beneath transom, that is the upper transom of the unit
that would be present in the real facade, fixed to a steel beam. This way allows to restrain very
out of plane and perpendicular movement of the facade, allowing instead every other movement
in the in-plane directions.
Figure 4-12: Detailed drawing of the bottom façade unit constraint point: vertical section

CHAPTER 4 EXPERIMENTAL PERFORMANCE TEST
65
During a seismic event the facade, as introduced, is subjected to a relative inter-storey drift. For
the performance mock-up test this relative movement between two adjacent floors is statically
applied through the seismic beam displacement.
The expected unit behaviour is an initial rigid rotation, followed then by a deformation of the
aluminium frame shape. The aim of the experimental campaign is obviously to evaluate the
global behaviour of the façade and, most of all, to establish if any damage to the glass plates,
the aluminium frame or any component of the unit, occurs during an increasingly amplitude
series of applied displacements.
In the following Figure 4-13 it is shown how essentially a unit of a curtain wall unitized and
panellized system façade is expected to behave during an earthquake and under an applied
displacement “D”:
Figure 4-13: Schematic drawing representing the forecasted façade unit behaviour with an inter-storey horizontal displacement applied.
So then, two steps are essentially recognized in the global façade unit behaviour:
- Step 1: The first of the two steps is characterized by a unit rigid rotation. The whole
facade unit, the frame with the glass and all its components, rotates rigidly until being
locked by the garter sleeve between two units.
- Step 2: The frame, once that the unit has been locked during its rigid rotation, starts
deforming and the unit shape leans to a rhomboidal new shape. This is the potential
critical moment for the integrity of the glass plate because of the risk of a contact
between a corner of the glass plate and the aluminium frame.
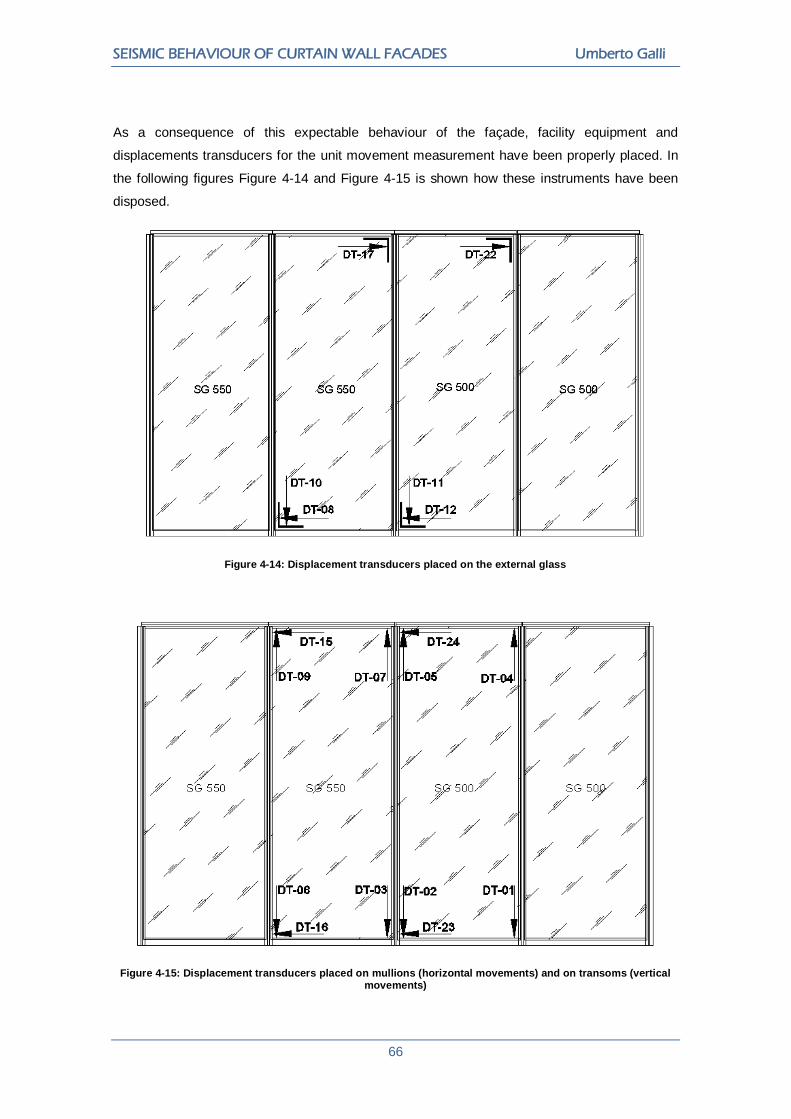
SEISMIC BEHAVIOUR OF CURTAIN WALL FACADES Umberto Galli
66
As a consequence of this expectable behaviour of the façade, facility equipment and
displacements transducers for the unit movement measurement have been properly placed. In
the following figures Figure 4-14 and Figure 4-15 is shown how these instruments have been
disposed.
Figure 4-14: Displacement transducers placed on the external glass
Figure 4-15: Displacement transducers placed on mullions (horizontal movements) and on transoms (vertical movements)
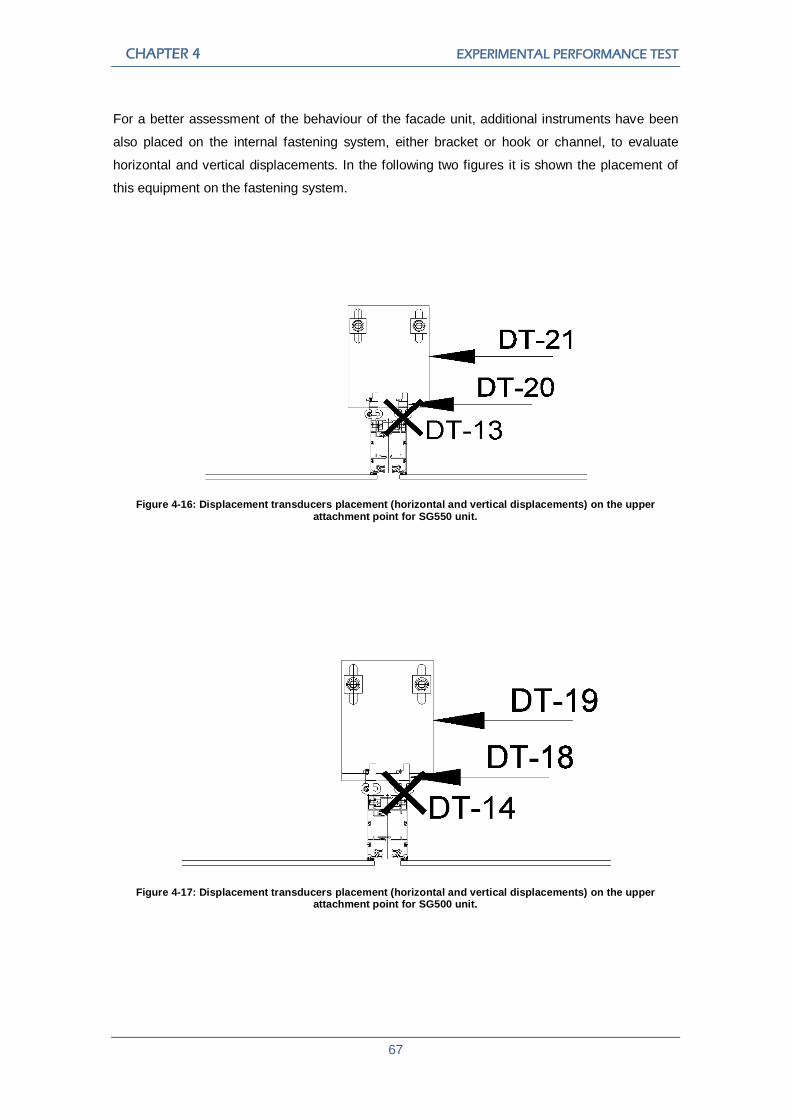
CHAPTER 4 EXPERIMENTAL PERFORMANCE TEST
67
For a better assessment of the behaviour of the facade unit, additional instruments have been
also placed on the internal fastening system, either bracket or hook or channel, to evaluate
horizontal and vertical displacements. In the following two figures it is shown the placement of
this equipment on the fastening system.
Figure 4-16: Displacement transducers placement (horizontal and vertical displacements) on the upper attachment point for SG550 unit.
Figure 4-17: Displacement transducers placement (horizontal and vertical displacements) on the upper attachment point for SG500 unit.
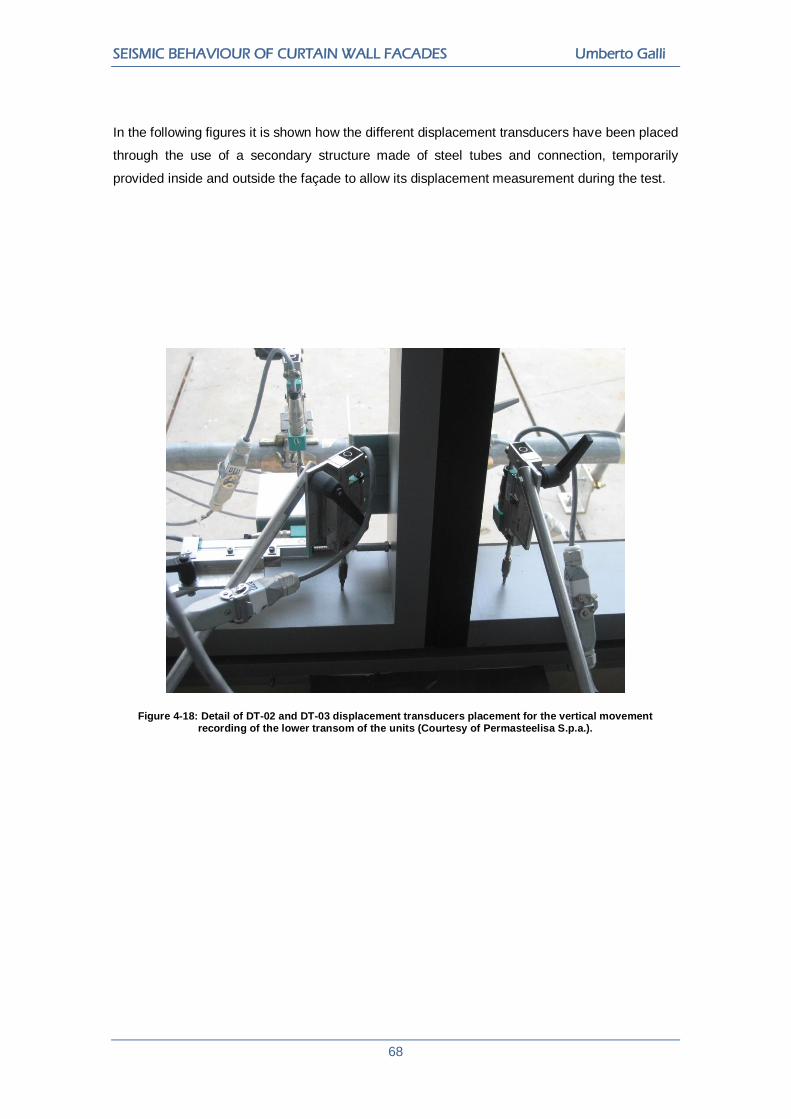
SEISMIC BEHAVIOUR OF CURTAIN WALL FACADES Umberto Galli
68
In the following figures it is shown how the different displacement transducers have been placed
through the use of a secondary structure made of steel tubes and connection, temporarily
provided inside and outside the façade to allow its displacement measurement during the test.
Figure 4-18: Detail of DT-02 and DT-03 displacement transducers placement for the vertical movement recording of the lower transom of the units (Courtesy of Permasteelisa S.p.a.).

CHAPTER 4 EXPERIMENTAL PERFORMANCE TEST
69
Figure 4-19: Detail of DT-16 Displacement transducer placement for the horizontal movement recording at the lower corner of the unit (Courtesy of Permasteelisa S.p.a.).
Figure 4-20: Detail of the DT-11 displacement transducer placement for the vertical movement recording at the lower corner of the glass (Courtesy of Permasteelisa S.p.a.).

SEISMIC BEHAVIOUR OF CURTAIN WALL FACADES Umberto Galli
70
Figure 4-21: Detail of the DT-19 displacement transducer placement for the horizontal movement recording of the bracket (Courtesy of Permasteelisa S.p.a.).
Figure 4-22: Detail of the DT-13 displacement transducer placement for the vertical movement recording at the upper corner of the glass (Courtesy of Permasteelisa S.p.a.).

CHAPTER 4 EXPERIMENTAL PERFORMANCE TEST
71
4.3 Regulation of reference: JASS14
As briefly introduced at the beginning of the chapter, for the seismic performance test of the
façade the Japan standard JASS14 [10] has been utilized as reference. This regulation deals
specifically about the seismic behaviour evaluation of a curtain wall façade subjected to a
seismic action.
There are specified three different and increasing levels of performance of the façade
respectively for three recognised and described different levels of increasingly hazardous
seismic event. These levels are called and defined as follows:
- Grade 1 = H/300: no component of the façade, neither internal or external, must be
damaged by the seismic action. To this performance level is associated a high-
probability seismic event in the Japan territory.
- Grade 2 = H/200: external components must not exceed the admissible tension. In
addition the structural sealing must be fixed to rehabilitate the service conditions of the
façade. To this performance level is associated the verification of the greatest
earthquake ever happened in the past.
- Grade 3 = H/100: no damages to the glass plates or fall of components are admissible.
To this performance level is associated the verification of the greatest earthquake
expected for the next 100 years.
where “H” is the inter-storey height.
The aim of the Japanese standard is clearly to verify that the façade is able to follow and resist,
without any serious damage, the inter-storey drift. On the contrary it does not require any force-
based verification, that for such an element, already designed for wind pressure, would be less
significant.
The three different requirements, associated to each of the specified and described levels of
performance or “Grades”, demand that a displacement, calculated in function of the inter-storey
height “H”, should be applied to the façade. For the specific case of study of Manchester
Metropolitan University, the building has an inter-storey height H = 3750 millimetres.
With this only information it is possible to obtain the load, that in practice is a displacement, to
be applied to the mock-up. Distinguishing between the different grades, the three displacement
cases are as follows:
- Grade 1 = H/300 = 3750/300 = 12,50 mm
- Grade 2 = H/200 = 3750/200 = 18,75 mm
- Grade 3 = H/100 = 3750/100 = 37,50 mm
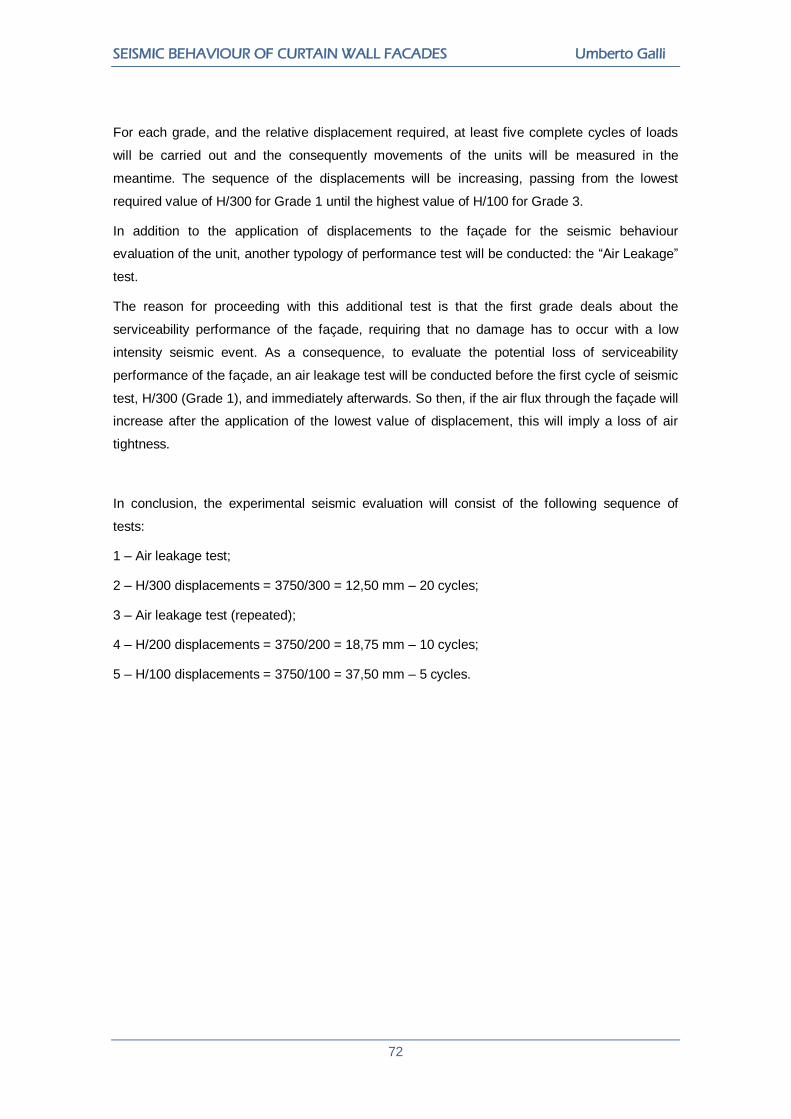
SEISMIC BEHAVIOUR OF CURTAIN WALL FACADES Umberto Galli
72
For each grade, and the relative displacement required, at least five complete cycles of loads
will be carried out and the consequently movements of the units will be measured in the
meantime. The sequence of the displacements will be increasing, passing from the lowest
required value of H/300 for Grade 1 until the highest value of H/100 for Grade 3.
In addition to the application of displacements to the façade for the seismic behaviour
evaluation of the unit, another typology of performance test will be conducted: the “Air Leakage”
test.
The reason for proceeding with this additional test is that the first grade deals about the
serviceability performance of the façade, requiring that no damage has to occur with a low
intensity seismic event. As a consequence, to evaluate the potential loss of serviceability
performance of the façade, an air leakage test will be conducted before the first cycle of seismic
test, H/300 (Grade 1), and immediately afterwards. So then, if the air flux through the façade will
increase after the application of the lowest value of displacement, this will imply a loss of air
tightness.
In conclusion, the experimental seismic evaluation will consist of the following sequence of
tests:
1 – Air leakage test;
2 – H/300 displacements = 3750/300 = 12,50 mm – 20 cycles;
3 – Air leakage test (repeated);
4 – H/200 displacements = 3750/200 = 18,75 mm – 10 cycles;
5 – H/100 displacements = 3750/100 = 37,50 mm – 5 cycles.

CHAPTER 4 EXPERIMENTAL PERFORMANCE TEST
73
4.4 Experimental results:
In this section the results of the experimental tests previously described are reported. The
graphs refer to the most meaningful points displacements recorded. The totality of the graphs is
listed in the Appendix A.
Vertical displacement of the upper transom (right corner) for H/300, H/200, H/100 respectively:
Dis
pla
cem
en
t [m
m]
Time [s]
Graph 4-1: Vertical displacement of the upper transom (right corner) – H/300 series.
Dis
pla
cem
en
t [m
m]
Time [s]
Graph 4-2: Vertical displacement of the upper transom (right corner) – H/200 series.
Dis
pla
cem
en
t [m
m]
Time [s]
Graph 4-3: Vertical displacement of the upper transom (right corner) – H/100 series.
DT - 04
-0,5
0
0,5
1
1,5
2
2,5
3
0 100 200 300 400 500 600 700 800 900
Tempo [s]
Sp
osta
men
to [
mm
]
DT - 04
-0,5
0
0,5
1
1,5
2
2,5
3
3,5
4
0 100 200 300 400 500 600
Tempo [s]
Sp
ost
amen
to [
mm
]
DT - 04
-2
-1
0
1
2
3
4
5
6
7
8
0 200 400 600 800 1000
Tempo [s]
Sp
ost
amen
to [
mm
]
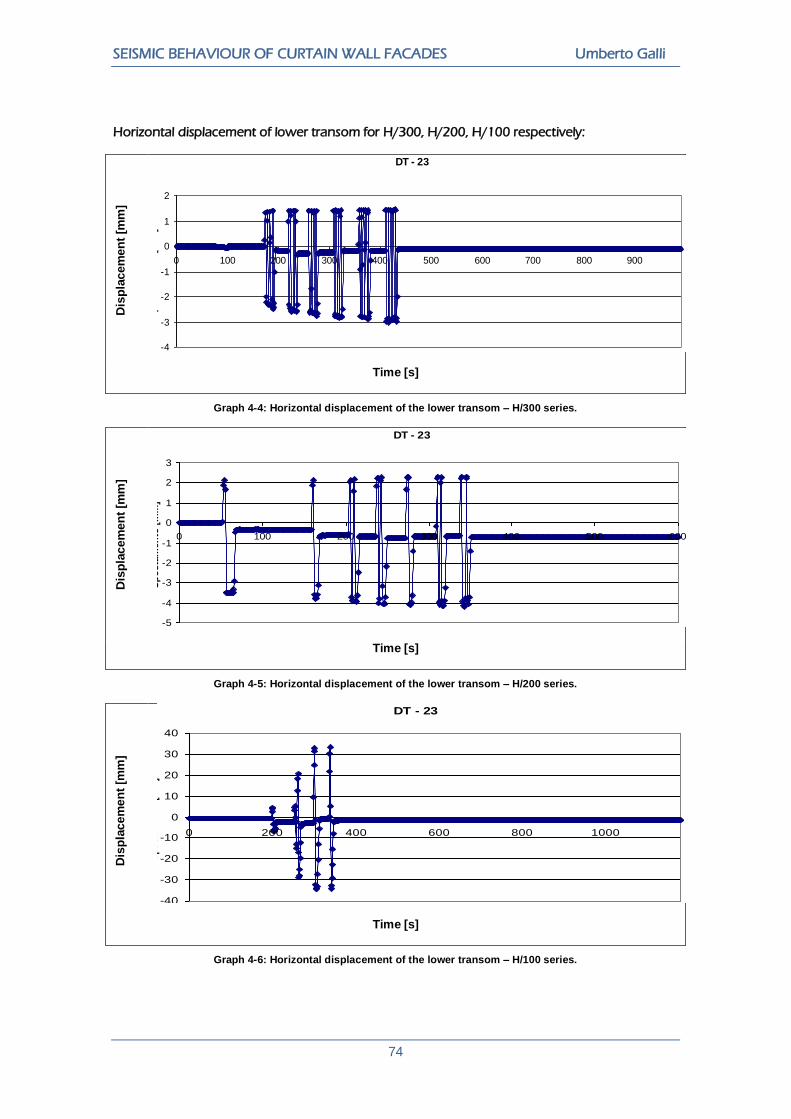
SEISMIC BEHAVIOUR OF CURTAIN WALL FACADES Umberto Galli
74
Horizontal displacement of lower transom for H/300, H/200, H/100 respectively: D
isp
lacem
en
t [m
m]
Time [s]
Graph 4-4: Horizontal displacement of the lower transom – H/300 series.
Dis
pla
cem
en
t [m
m]
Time [s]
Graph 4-5: Horizontal displacement of the lower transom – H/200 series.
Dis
pla
cem
en
t [m
m]
Time [s]
Graph 4-6: Horizontal displacement of the lower transom – H/100 series.
DT - 23
-4
-3
-2
-1
0
1
2
0 100 200 300 400 500 600 700 800 900
Tempo [s]
Sp
osta
men
to [
mm
]
DT - 23
-5
-4
-3
-2
-1
0
1
2
3
0 100 200 300 400 500 600
Tempo [s]
Sp
osta
men
to [
mm
]
DT - 23
-40
-30
-20
-10
0
10
20
30
40
0 200 400 600 800 1000
Tempo [s]
Sp
ost
amen
to [
mm
]
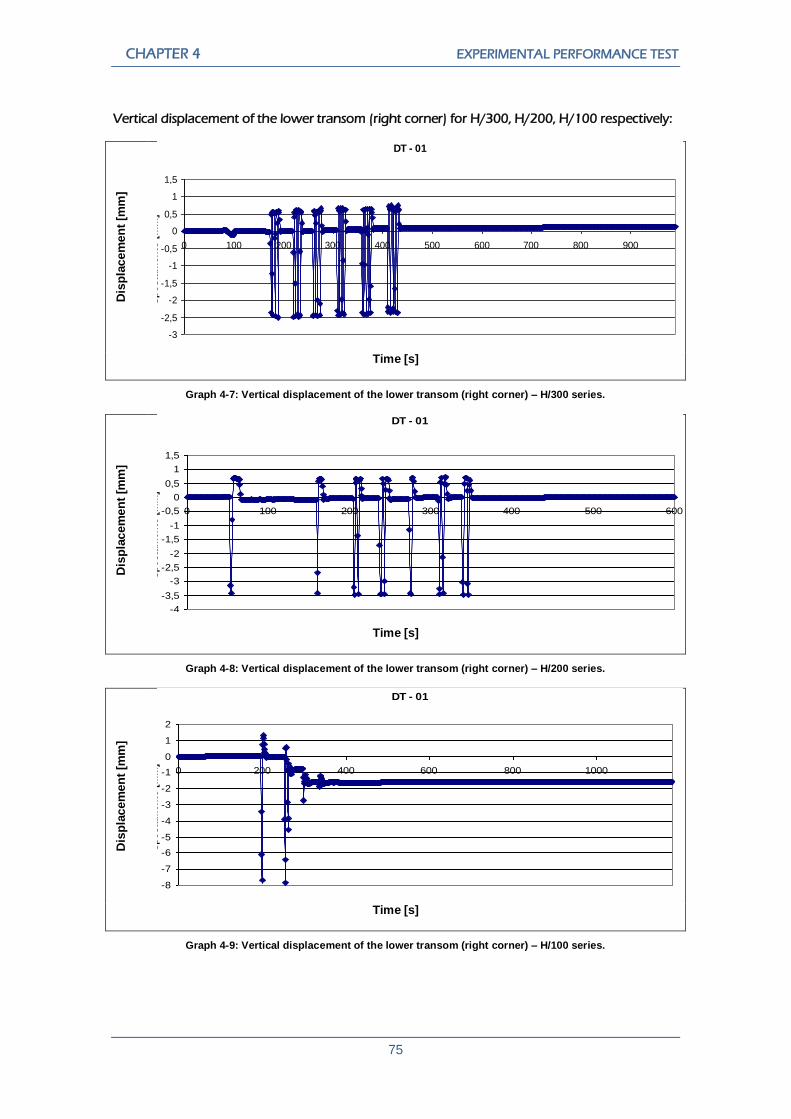
CHAPTER 4 EXPERIMENTAL PERFORMANCE TEST
75
Vertical displacement of the lower transom (right corner) for H/300, H/200, H/100 respectively: D
isp
lacem
en
t [m
m]
Time [s]
Graph 4-7: Vertical displacement of the lower transom (right corner) – H/300 series.
Dis
pla
cem
en
t [m
m]
Time [s]
Graph 4-8: Vertical displacement of the lower transom (right corner) – H/200 series.
Dis
pla
cem
en
t [m
m]
Time [s]
Graph 4-9: Vertical displacement of the lower transom (right corner) – H/100 series.
DT - 01
-3
-2,5
-2
-1,5
-1
-0,5
0
0,5
1
1,5
0 100 200 300 400 500 600 700 800 900
Tempo [s]
Sp
osta
men
to [
mm
]
DT - 01
-4
-3,5
-3
-2,5
-2
-1,5
-1
-0,5
0
0,5
1
1,5
0 100 200 300 400 500 600
Tempo [s]
Sp
osta
men
to [
mm
]
DT - 01
-8
-7
-6
-5
-4
-3
-2
-1
0
1
2
0 200 400 600 800 1000
Tempo [s]
Sp
osta
men
to [
mm
]
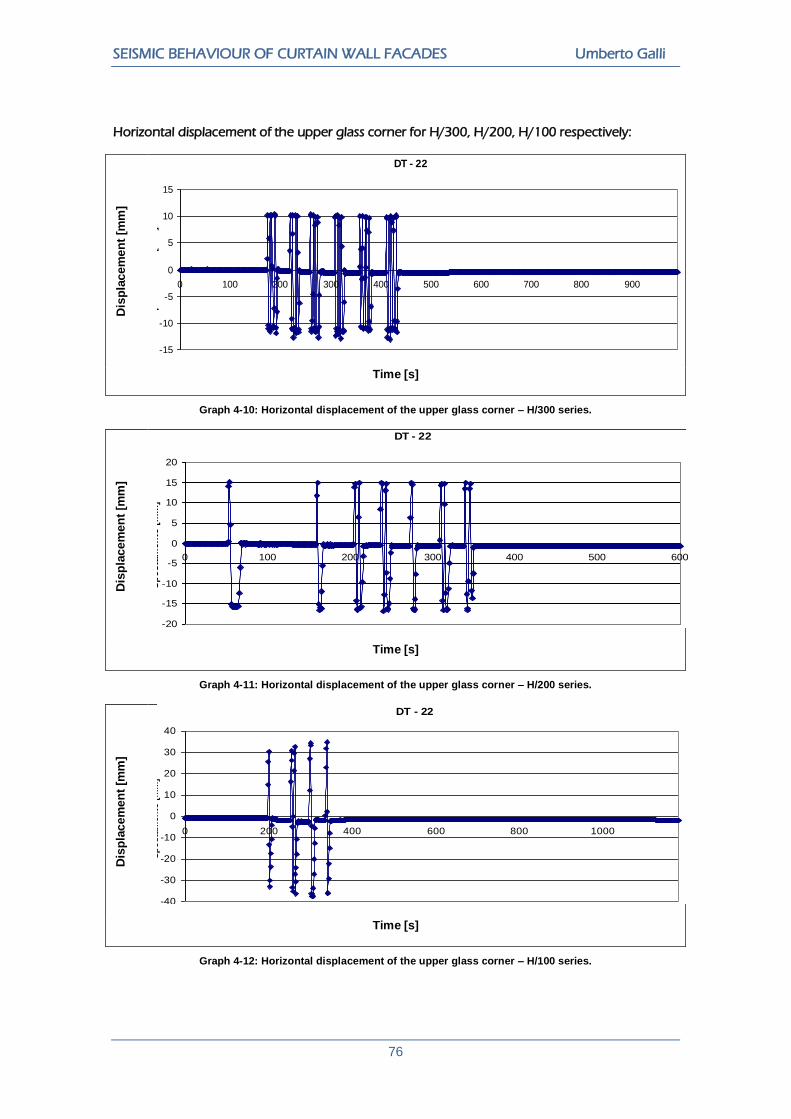
SEISMIC BEHAVIOUR OF CURTAIN WALL FACADES Umberto Galli
76
Horizontal displacement of the upper glass corner for H/300, H/200, H/100 respectively: D
isp
lacem
en
t [m
m]
Time [s]
Graph 4-10: Horizontal displacement of the upper glass corner – H/300 series.
Dis
pla
cem
en
t [m
m]
Time [s]
Graph 4-11: Horizontal displacement of the upper glass corner – H/200 series.
Dis
pla
cem
en
t [m
m]
Time [s]
Graph 4-12: Horizontal displacement of the upper glass corner – H/100 series.
DT - 22
-15
-10
-5
0
5
10
15
0 100 200 300 400 500 600 700 800 900
Tempo [s]
Sp
osta
men
to [
mm
]
DT - 22
-20
-15
-10
-5
0
5
10
15
20
0 100 200 300 400 500 600
Tempo [s]
Sp
osta
men
to [
mm
]
DT - 22
-40
-30
-20
-10
0
10
20
30
40
0 200 400 600 800 1000
Tempo [s]
Sp
osta
men
to [
mm
]

CHAPTER 4 EXPERIMENTAL PERFORMANCE TEST
77
Horizontal displacement of bracket for H/300, H/200, H/100 respectively: D
isp
lacem
en
t [m
m]
Time [s]
Graph 4-13: Bracket horizontal displacement – H/300 series.
Dis
pla
cem
en
t [m
m]
Time [s]
Graph 4-14: Bracket horizontal displacement – H/200 series.
Dis
pla
cem
en
t [m
m]
Time [s]
Graph 4-15: Bracket horizontal displacement – H/100 series.
DT - 19
-20
-15
-10
-5
0
5
10
15
20
0 100 200 300 400 500 600 700 800 900
Tempo [s]
Sp
osta
men
to [
mm
]
DT - 19
-25
-20
-15
-10
-5
0
5
10
15
20
25
0 100 200 300 400 500 600
Tempo [s]
Sp
osta
men
to [
mm
]
DT - 19
-40
-30
-20
-10
0
10
20
30
40
0 200 400 600 800 1000
Tempo [s]
Sp
ost
amen
to [
mm
]
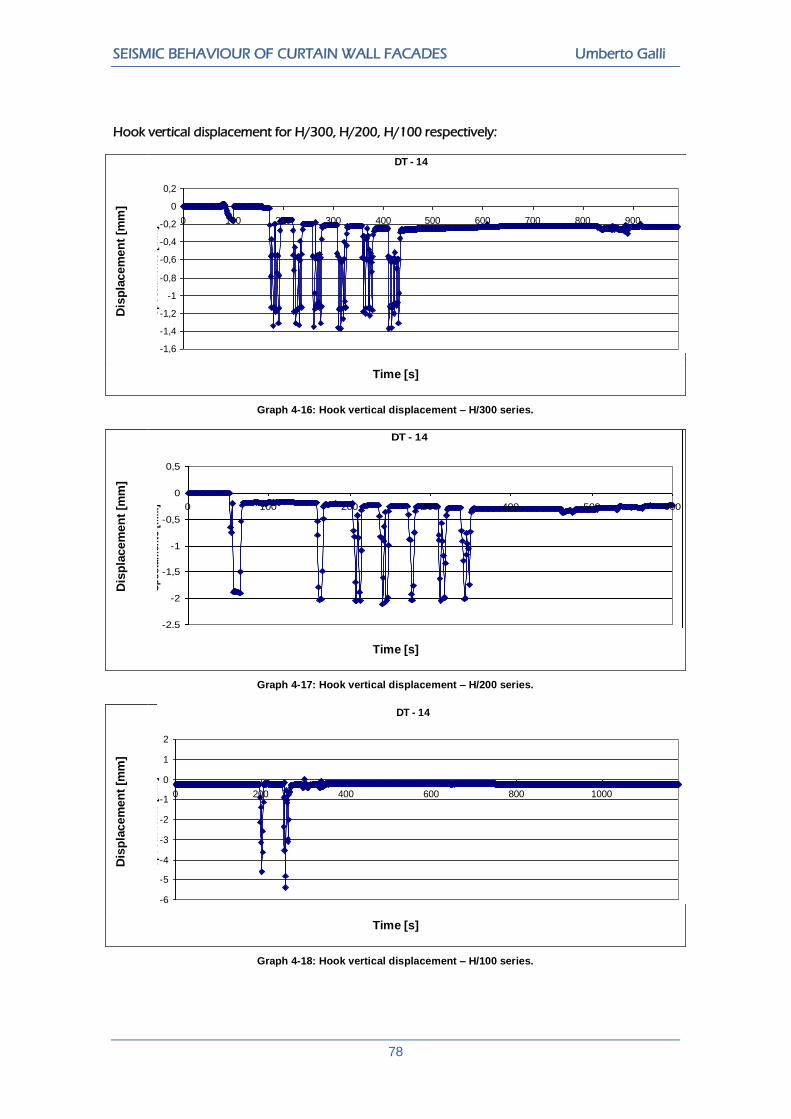
SEISMIC BEHAVIOUR OF CURTAIN WALL FACADES Umberto Galli
78
Hook vertical displacement for H/300, H/200, H/100 respectively: D
isp
lacem
en
t [m
m]
Time [s]
Graph 4-16: Hook vertical displacement – H/300 series.
Dis
pla
cem
en
t [m
m]
Time [s]
Graph 4-17: Hook vertical displacement – H/200 series.
Dis
pla
cem
en
t [m
m]
Time [s]
Graph 4-18: Hook vertical displacement – H/100 series.
DT - 14
-1,6
-1,4
-1,2
-1
-0,8
-0,6
-0,4
-0,2
0
0,2
0 100 200 300 400 500 600 700 800 900
Tempo [s]
Sp
osta
men
to [
mm
]
DT - 14
-2,5
-2
-1,5
-1
-0,5
0
0,5
0 100 200 300 400 500 600
Tempo [s]
Sp
osta
men
to [
mm
]
DT - 14
-6
-5
-4
-3
-2
-1
0
1
2
0 200 400 600 800 1000
Tempo [s]
Sp
osta
men
to [
mm
]

CHAPTER 4 EXPERIMENTAL PERFORMANCE TEST
79
From these graphs about the movements, both vertical and horizontal, of different points of the
unit it is possible to extract some considerations concerning the global behaviour of the façade.
Firstly, it is clearly visible the leaning of the unit to rotate when a horizontal displacement is
applied to the façade. In fact, considering for example two different points, such as the lower
corner of the glass plate (at the bottom of the facade unit) and the upper transom (at the top of
the unit), their displacement transducers record a positive vertical displacement. This just
derives from the rotational behaviour of the unit. The immediately subsequent consideration is
that this leaning to a rotational behaviour is as more increased in terms of vertical displacement
recorded by the displacement transducers as wider is the horizontal displacement applied to the
façade. So then, taking the lower corner of the glass plate as a model, its vertical displacement
during the three horizontal displacement sequences is as follows:
about 3,4 mm for a horizontal displacement of 12,50 mm
about 4,1 mm for a horizontal displacement of 18,75 mm
about 9,5 mm for a horizontal displacement of 37,50 mm
On the contrary, when the horizontal displacement applied to the façade inverts its direction, for
example from a positive displacement of +12,50 mm to a negative and contrary displacement of
-12,50 mm, for the same point the vertical displacement recordings assume smaller values,
tending to zero. In fact in this situation, the alignment screw that links a unit to the other
immediately above is still a restraint to the unit horizontal translation, but, whilst for a positive
direction of the applied horizontal displacement the unit tends to a rotational movement, for a
negative and contrary direction the unit deforms its shape instead of rotating.
Of course, since the rotational movements avoid an excessive unit deformation with a
consequential risk of glass damages and failure, this particular phase, characterized instead by
the rhomboidal deformation of the unit, is probably the most hazardous for the glass
components integrity and has to be carefully taken in consideration.
However the most important feature of the unit behaviour, that is possible to evaluate with this
performance test, is surely what occurs during the third and hardest series of load,
corresponding to the H/100 horizontal displacement. In fact, as it is clearly visible, during this
last cycle the vertical displacement recorded starts reaching in a first moment the highest value
of the entire sequence of test. This was obviously predicted and expectable for the reasons
formerly explained and described.
However, in a second moment the same point records reach already a lower value during the
second cycle of load and, most of all, starting from the third cycle, the value registered suddenly
tends to zero. Nevertheless the horizontal displacement recordings of the various points of the
unit are constantly varying and assume values close to the H/100 horizontal displacement
applied to the top of the unit.
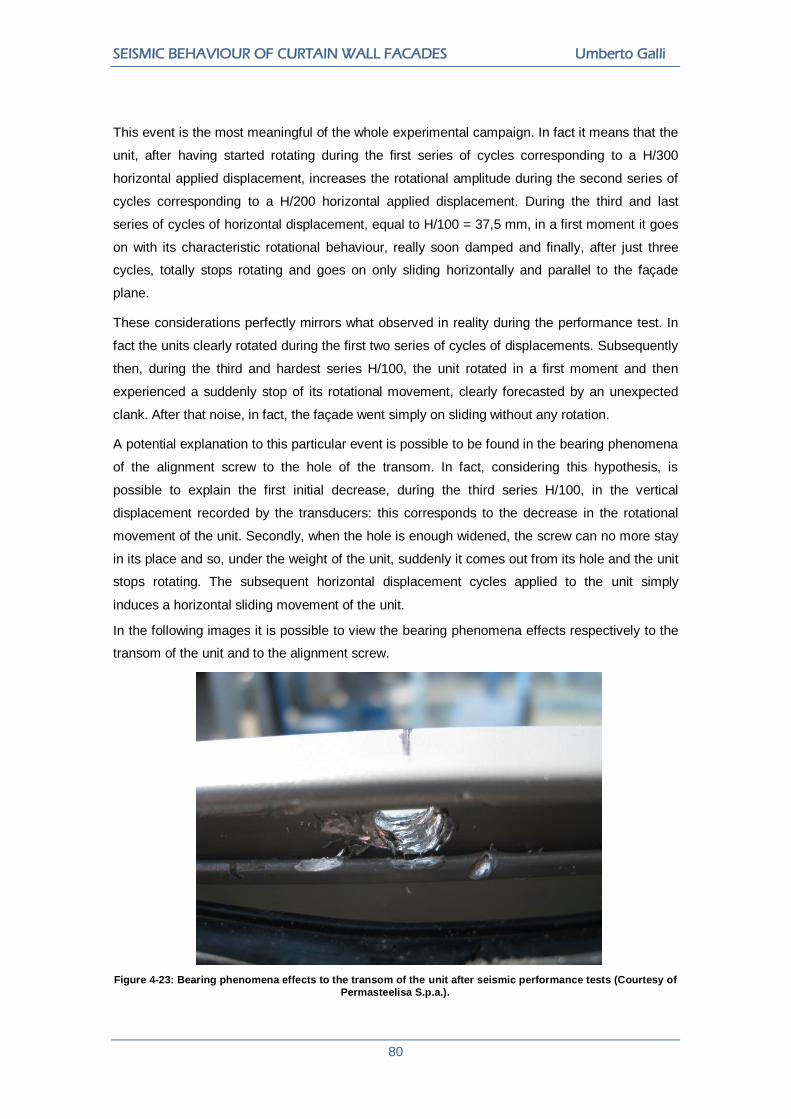
SEISMIC BEHAVIOUR OF CURTAIN WALL FACADES Umberto Galli
80
This event is the most meaningful of the whole experimental campaign. In fact it means that the
unit, after having started rotating during the first series of cycles corresponding to a H/300
horizontal applied displacement, increases the rotational amplitude during the second series of
cycles corresponding to a H/200 horizontal applied displacement. During the third and last
series of cycles of horizontal displacement, equal to H/100 = 37,5 mm, in a first moment it goes
on with its characteristic rotational behaviour, really soon damped and finally, after just three
cycles, totally stops rotating and goes on only sliding horizontally and parallel to the façade
plane.
These considerations perfectly mirrors what observed in reality during the performance test. In
fact the units clearly rotated during the first two series of cycles of displacements. Subsequently
then, during the third and hardest series H/100, the unit rotated in a first moment and then
experienced a suddenly stop of its rotational movement, clearly forecasted by an unexpected
clank. After that noise, in fact, the façade went simply on sliding without any rotation.
A potential explanation to this particular event is possible to be found in the bearing phenomena
of the alignment screw to the hole of the transom. In fact, considering this hypothesis, is
possible to explain the first initial decrease, during the third series H/100, in the vertical
displacement recorded by the transducers: this corresponds to the decrease in the rotational
movement of the unit. Secondly, when the hole is enough widened, the screw can no more stay
in its place and so, under the weight of the unit, suddenly it comes out from its hole and the unit
stops rotating. The subsequent horizontal displacement cycles applied to the unit simply
induces a horizontal sliding movement of the unit.
In the following images it is possible to view the bearing phenomena effects respectively to the
transom of the unit and to the alignment screw.
Figure 4-23: Bearing phenomena effects to the transom of the unit after seismic performance tests (Courtesy of
Permasteelisa S.p.a.).

CHAPTER 4 EXPERIMENTAL PERFORMANCE TEST
81
Figure 4-24: Alignment screw after seismic performance tests (Courtesy of Permasteelisa S.p.a.).
More globally it is possible to underline that after all the series scheduled by the performance
test, even the third and hardest H/100, no damages are resulting to the glass plate or the
aluminium frame of the unit and neither to the fastening system. The only one component that
occurs damage is the already mentioned alignment screw, which firstly bears the hole of the
transom and then comes out making the unit only sliding under the applied displacement.
For this reason the considered façade behaviour against a seismic event seems to be optimal,
because, as it will be precisely described in the following section, the façade:
- totally maintains its serviceability performance for the first Grade 1 of requirements;
- does not occur any damage during the second Grade 2;
- finally, during the third and most severe Grade 3, simply deactivates after just few cycles
of displacements its rotational and deformational behaviour, sliding without any damage
for any subsequently applied displacement.
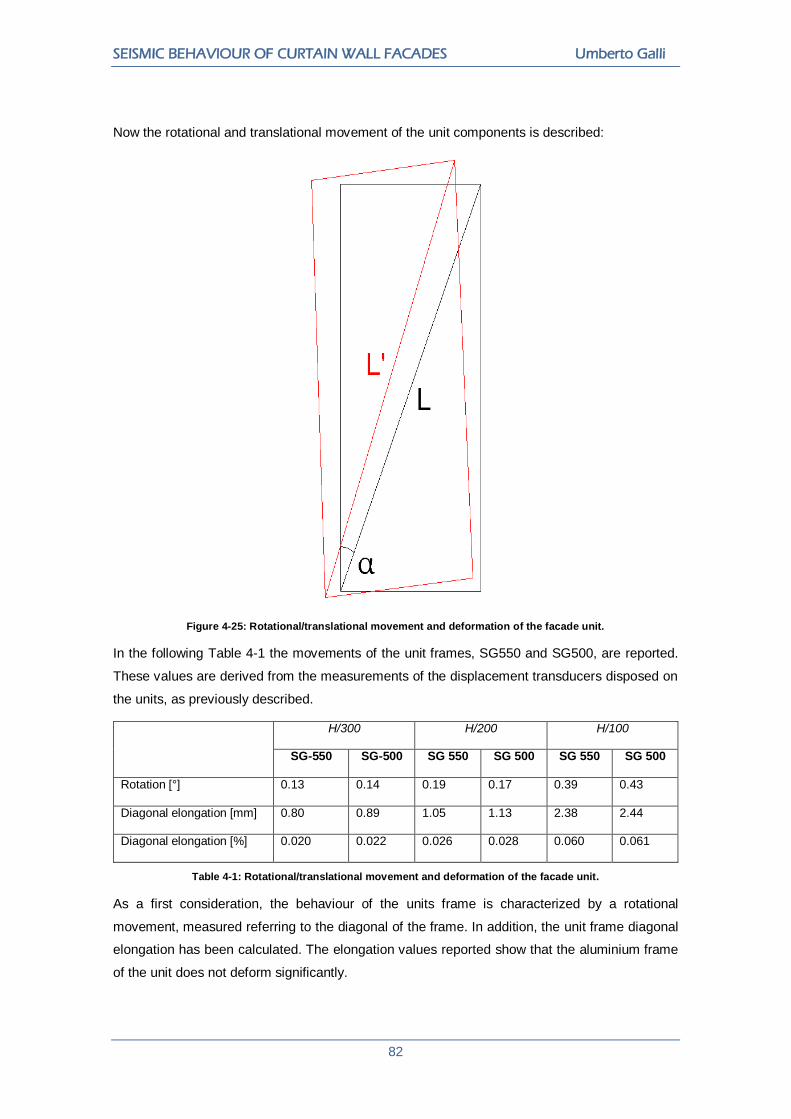
SEISMIC BEHAVIOUR OF CURTAIN WALL FACADES Umberto Galli
82
Now the rotational and translational movement of the unit components is described:
Figure 4-25: Rotational/translational movement and deformation of the facade unit.
In the following Table 4-1 the movements of the unit frames, SG550 and SG500, are reported.
These values are derived from the measurements of the displacement transducers disposed on
the units, as previously described.
H/300 H/200 H/100
SG-550 SG-500 SG 550 SG 500 SG 550 SG 500
Rotation [°] 0.13 0.14 0.19 0.17 0.39 0.43
Diagonal elongation [mm] 0.80 0.89 1.05 1.13 2.38 2.44
Diagonal elongation [%] 0.020 0.022 0.026 0.028 0.060 0.061
Table 4-1: Rotational/translational movement and deformation of the facade unit.
As a first consideration, the behaviour of the units frame is characterized by a rotational
movement, measured referring to the diagonal of the frame. In addition, the unit frame diagonal
elongation has been calculated. The elongation values reported show that the aluminium frame
of the unit does not deform significantly.

CHAPTER 4 EXPERIMENTAL PERFORMANCE TEST
83
Figure 4-26: Rotational/translational movement of the glass plate.
In the following Table 4-2 the movements of the glass plate, SG550 and SG500, are reported.
These values are derived from the measurements of the displacement transducers disposed on
the units as previously described.
H/300 H/200 H/100
SG 550 SG 500 SG 550 SG 500 SG 550 SG 500
Rotation [°] 0.13 0.14 0.19 0.18 0.32 0.29
Table 4-2: Rotational/translational movement of the glass plate.
In this case, the glass plate has a different behaviour from the aluminium frame. Of course it
rotates, following the frame movement because of the structural silicon retaining system, but,
instead of deforming its shape, the glass plate behaves like a rigid element, so that no
deformation to its diagonal has been recorded.
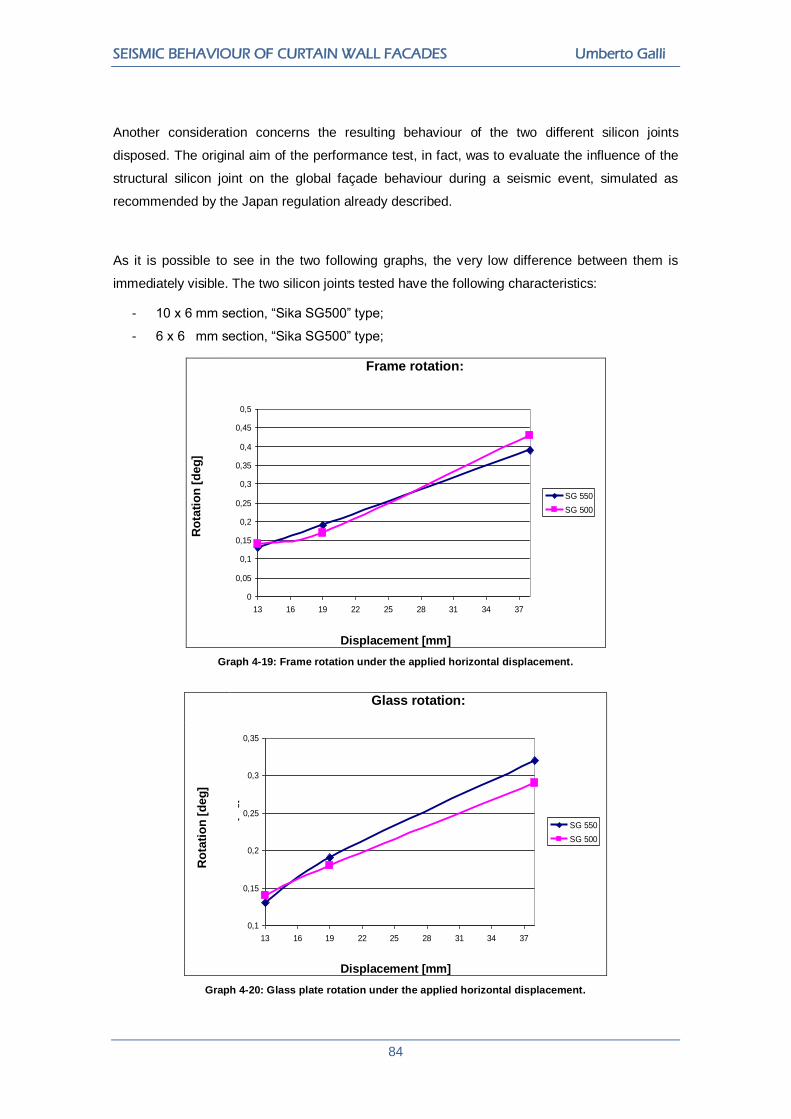
SEISMIC BEHAVIOUR OF CURTAIN WALL FACADES Umberto Galli
84
Another consideration concerns the resulting behaviour of the two different silicon joints
disposed. The original aim of the performance test, in fact, was to evaluate the influence of the
structural silicon joint on the global façade behaviour during a seismic event, simulated as
recommended by the Japan regulation already described.
As it is possible to see in the two following graphs, the very low difference between them is
immediately visible. The two silicon joints tested have the following characteristics:
- 10 x 6 mm section, “Sika SG500” type;
- 6 x 6 mm section, “Sika SG500” type;
Ro
tati
on
[d
eg
]
Frame rotation:
Displacement [mm]
Graph 4-19: Frame rotation under the applied horizontal displacement.
Ro
tati
on
[d
eg
]
Glass rotation:
Displacement [mm]
Graph 4-20: Glass plate rotation under the applied horizontal displacement.
Angolo di rotazione telaio
0
0,05
0,1
0,15
0,2
0,25
0,3
0,35
0,4
0,45
0,5
13 16 19 22 25 28 31 34 37
Spostamento [mm]
Ro
tazio
ne [
deg
]
SG 550
SG 500
Angolo di rotazione vetro
0,1
0,15
0,2
0,25
0,3
0,35
13 16 19 22 25 28 31 34 37
Spostamento [mm]
Ro
tazio
ne [
deg
]
SG 550
SG 500
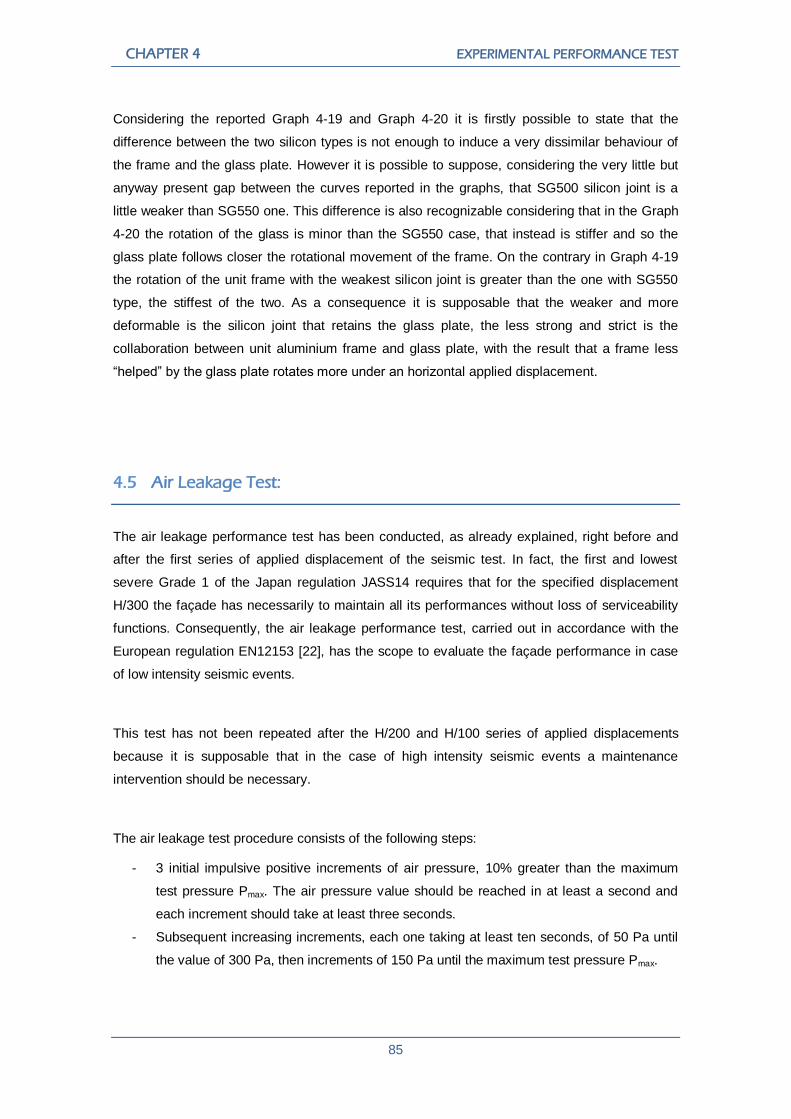
CHAPTER 4 EXPERIMENTAL PERFORMANCE TEST
85
Considering the reported Graph 4-19 and Graph 4-20 it is firstly possible to state that the
difference between the two silicon types is not enough to induce a very dissimilar behaviour of
the frame and the glass plate. However it is possible to suppose, considering the very little but
anyway present gap between the curves reported in the graphs, that SG500 silicon joint is a
little weaker than SG550 one. This difference is also recognizable considering that in the Graph
4-20 the rotation of the glass is minor than the SG550 case, that instead is stiffer and so the
glass plate follows closer the rotational movement of the frame. On the contrary in Graph 4-19
the rotation of the unit frame with the weakest silicon joint is greater than the one with SG550
type, the stiffest of the two. As a consequence it is supposable that the weaker and more
deformable is the silicon joint that retains the glass plate, the less strong and strict is the
collaboration between unit aluminium frame and glass plate, with the result that a frame less
“helped” by the glass plate rotates more under an horizontal applied displacement.
4.5 Air Leakage Test:
The air leakage performance test has been conducted, as already explained, right before and
after the first series of applied displacement of the seismic test. In fact, the first and lowest
severe Grade 1 of the Japan regulation JASS14 requires that for the specified displacement
H/300 the façade has necessarily to maintain all its performances without loss of serviceability
functions. Consequently, the air leakage performance test, carried out in accordance with the
European regulation EN12153 [22], has the scope to evaluate the façade performance in case
of low intensity seismic events.
This test has not been repeated after the H/200 and H/100 series of applied displacements
because it is supposable that in the case of high intensity seismic events a maintenance
intervention should be necessary.
The air leakage test procedure consists of the following steps:
- 3 initial impulsive positive increments of air pressure, 10% greater than the maximum
test pressure Pmax. The air pressure value should be reached in at least a second and
each increment should take at least three seconds.
- Subsequent increasing increments, each one taking at least ten seconds, of 50 Pa until
the value of 300 Pa, then increments of 150 Pa until the maximum test pressure Pmax.
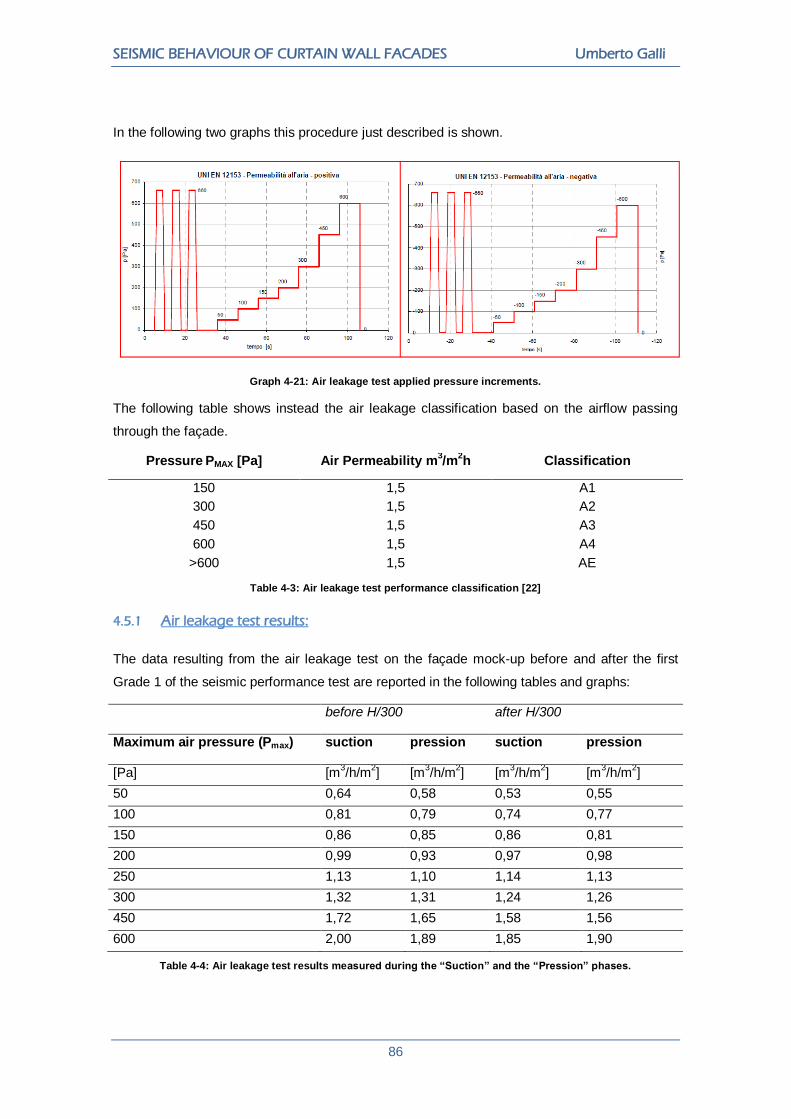
SEISMIC BEHAVIOUR OF CURTAIN WALL FACADES Umberto Galli
86
In the following two graphs this procedure just described is shown.
Graph 4-21: Air leakage test applied pressure increments.
The following table shows instead the air leakage classification based on the airflow passing
through the façade.
Pressure PMAX [Pa] Air Permeability m3/m
2h Classification
150 1,5 A1
300 1,5 A2
450 1,5 A3
600 1,5 A4
>600 1,5 AE
Table 4-3: Air leakage test performance classification [22]
4.5.1 Air leakage test results:
The data resulting from the air leakage test on the façade mock-up before and after the first
Grade 1 of the seismic performance test are reported in the following tables and graphs:
before H/300 after H/300
Maximum air pressure (Pmax) suction pression suction pression
[Pa] [m3/h/m
2] [m
3/h/m
2] [m
3/h/m
2] [m
3/h/m
2]
50 0,64 0,58 0,53 0,55
100 0,81 0,79 0,74 0,77
150 0,86 0,85 0,86 0,81
200 0,99 0,93 0,97 0,98
250 1,13 1,10 1,14 1,13
300 1,32 1,31 1,24 1,26
450 1,72 1,65 1,58 1,56
600 2,00 1,89 1,85 1,90
Table 4-4: Air leakage test results measured during the “Suction” and the “Pression” phases.
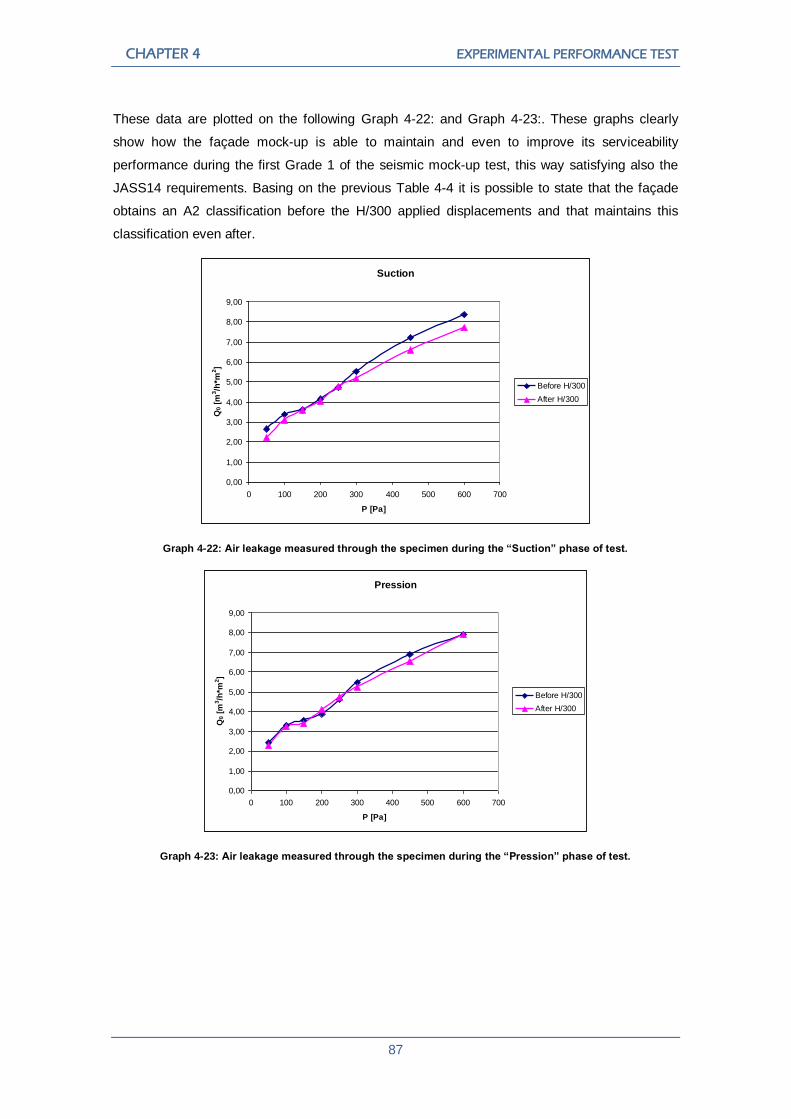
CHAPTER 4 EXPERIMENTAL PERFORMANCE TEST
87
These data are plotted on the following Graph 4-22: and Graph 4-23:. These graphs clearly
show how the façade mock-up is able to maintain and even to improve its serviceability
performance during the first Grade 1 of the seismic mock-up test, this way satisfying also the
JASS14 requirements. Basing on the previous Table 4-4 it is possible to state that the façade
obtains an A2 classification before the H/300 applied displacements and that maintains this
classification even after.
Graph 4-22: Air leakage measured through the specimen during the “Suction” phase of test.
Graph 4-23: Air leakage measured through the specimen during the “Pression” phase of test.
Suction
0,00
1,00
2,00
3,00
4,00
5,00
6,00
7,00
8,00
9,00
0 100 200 300 400 500 600 700
P [Pa]
Q0 [
m3/h
*m2]
Before H/300
After H/300
Pression
0,00
1,00
2,00
3,00
4,00
5,00
6,00
7,00
8,00
9,00
0 100 200 300 400 500 600 700
P [Pa]
Q0 [
m3/h
*m2]
Before H/300
After H/300

SEISMIC BEHAVIOUR OF CURTAIN WALL FACADES Umberto Galli
88

CHAPTER 5
F.E.M. MODELLING ISSUES
In this chapter it will be presented and described how the modelling phase of this study has
been structured and carried out. As we said in the previous chapters, the main aim of the thesis
is to find out the characteristic behaviour of a complicate element, such as a unit of a unitized
and panellized curtain wall system, under a seismic action through the use of both experimental
and finite element analysis. With this in mind, in the following section it will be presented the
criteria and strategies adopted to realize the Finite Element Model (F.E.M.).
5.1 F.E.M. realization and finite element software Straus7
Finite element method is an important branch of computational mechanics. It is a kind of
numerical methods in which various mechanics problems are solved by discretizing related
continuums. It has already been one of the most powerful techniques for dealing with problems
in mechanics, physics and engineering computations and it can be used for a wide variety of
problems in linear and nonlinear solid mechanics, dynamics, in accordance with the
development of computer technology FEM, as shown in Figure 5-1:
- Divides a structure into small elements
- Assumes each element to be a mathematical model
- Assembles the elements and solves the overall

SEISMIC BEHAVIOUR OF CURTAIN WALL FACADES Umberto Galli
90
Figure 5-1: Schematization of the finite element method process.
Characteristics of FEM are as follows [37, 38]:
- It is a kind of numerical experiment without experimental devices, models, or
instruments. Hence it is economical and time-saving.
- It can solve actual structural problems by using some models, although their shapes and
loads are complex. It is even used for non-structural problems.
- It relies on computer technology for both hardware and software.
- It does not give an exact solution but solves approximately, because structures are
modelled as a combination of simple elements and/or loads.
In simple terms, a finite element model (i.e. the mesh and other data necessary to define the
problem) is a numerical model used for simulating the behaviour of a physical system, and in
developing such a model, the finite element analyst needs to consider the following:
- The geometric representation of the physical system (mesh)
- The description of the materials used (constitutive equations)
- Externally applied loads and constraints (boundary conditions)
- The analysis required for solving the problem (solver selection)
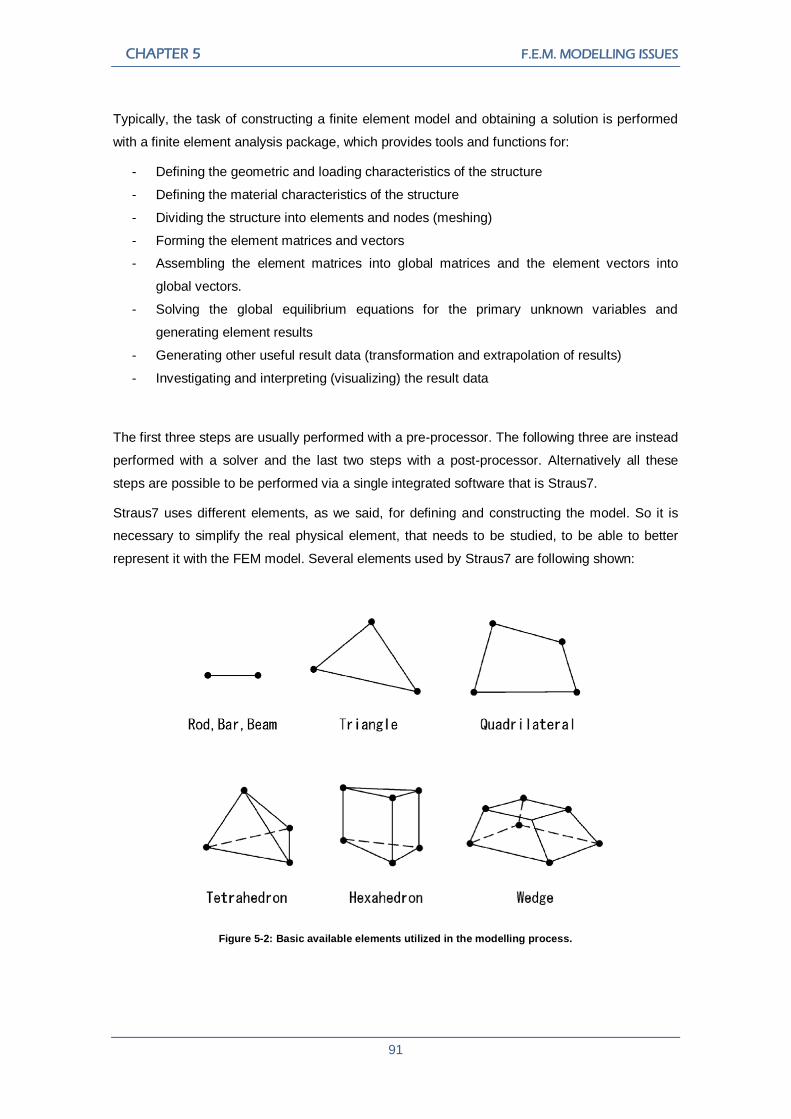
CHAPTER 5 F.E.M. MODELLING ISSUES
91
Typically, the task of constructing a finite element model and obtaining a solution is performed
with a finite element analysis package, which provides tools and functions for:
- Defining the geometric and loading characteristics of the structure
- Defining the material characteristics of the structure
- Dividing the structure into elements and nodes (meshing)
- Forming the element matrices and vectors
- Assembling the element matrices into global matrices and the element vectors into
global vectors.
- Solving the global equilibrium equations for the primary unknown variables and
generating element results
- Generating other useful result data (transformation and extrapolation of results)
- Investigating and interpreting (visualizing) the result data
The first three steps are usually performed with a pre-processor. The following three are instead
performed with a solver and the last two steps with a post-processor. Alternatively all these
steps are possible to be performed via a single integrated software that is Straus7.
Straus7 uses different elements, as we said, for defining and constructing the model. So it is
necessary to simplify the real physical element, that needs to be studied, to be able to better
represent it with the FEM model. Several elements used by Straus7 are following shown:
Figure 5-2: Basic available elements utilized in the modelling process.
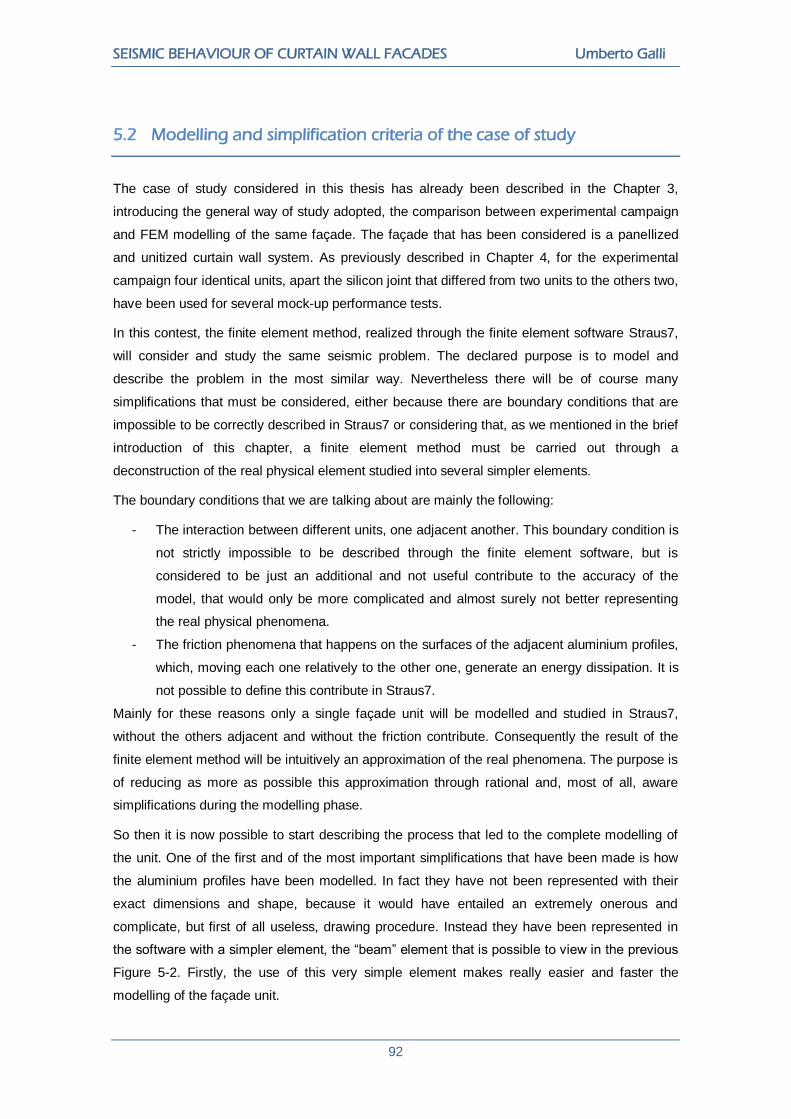
SEISMIC BEHAVIOUR OF CURTAIN WALL FACADES Umberto Galli
92
5.2 Modelling and simplification criteria of the case of study
The case of study considered in this thesis has already been described in the Chapter 3,
introducing the general way of study adopted, the comparison between experimental campaign
and FEM modelling of the same façade. The façade that has been considered is a panellized
and unitized curtain wall system. As previously described in Chapter 4, for the experimental
campaign four identical units, apart the silicon joint that differed from two units to the others two,
have been used for several mock-up performance tests.
In this contest, the finite element method, realized through the finite element software Straus7,
will consider and study the same seismic problem. The declared purpose is to model and
describe the problem in the most similar way. Nevertheless there will be of course many
simplifications that must be considered, either because there are boundary conditions that are
impossible to be correctly described in Straus7 or considering that, as we mentioned in the brief
introduction of this chapter, a finite element method must be carried out through a
deconstruction of the real physical element studied into several simpler elements.
The boundary conditions that we are talking about are mainly the following:
- The interaction between different units, one adjacent another. This boundary condition is
not strictly impossible to be described through the finite element software, but is
considered to be just an additional and not useful contribute to the accuracy of the
model, that would only be more complicated and almost surely not better representing
the real physical phenomena.
- The friction phenomena that happens on the surfaces of the adjacent aluminium profiles,
which, moving each one relatively to the other one, generate an energy dissipation. It is
not possible to define this contribute in Straus7.
Mainly for these reasons only a single façade unit will be modelled and studied in Straus7,
without the others adjacent and without the friction contribute. Consequently the result of the
finite element method will be intuitively an approximation of the real phenomena. The purpose is
of reducing as more as possible this approximation through rational and, most of all, aware
simplifications during the modelling phase.
So then it is now possible to start describing the process that led to the complete modelling of
the unit. One of the first and of the most important simplifications that have been made is how
the aluminium profiles have been modelled. In fact they have not been represented with their
exact dimensions and shape, because it would have entailed an extremely onerous and
complicate, but first of all useless, drawing procedure. Instead they have been represented in
the software with a simpler element, the “beam” element that is possible to view in the previous
Figure 5-2. Firstly, the use of this very simple element makes really easier and faster the
modelling of the façade unit.

CHAPTER 5 F.E.M. MODELLING ISSUES
93
Secondly, instead of using a thick and extensive modelling with the use of the “brick” element, it
makes the computational times and the solving process really faster.
Finally, with the possibility of assigning to the beam element the exact properties of the real
aluminium profiles, either in terms of sections (imported with the exact shape and dimensions
from the design drawings) or in terms of material properties (available in the software material
library), the final “beam” model results much more accurate than a “brick” modelling. In fact this
last typology of modelling would entail, besides the already mentioned complications in the
drawing phase, an extremely difficult problem in the modelling of the joint between different
profiles, with the certainty to incur into bigger approximations or errors than the “beam”
modelling. In this case, on the contrary, the joint is only defined as a hinge, without any
rotational resistance. This kind of modelling is not really exact, but however it is very similar to
the reality, because in the real unit the connection between two different aluminium profiles has
an extremely low rotational stiffness, so that a hinge could finely represent the real behaviour of
this joint.
Then, the following issue to face has been the modelling of the constrain system of the unit.
This specific type of unitized and panellized curtain wall system makes use of a particular
fastening system developed and produced by Permasteelisa S.p.a., already presented in
Chapter 3.
The fastening system components are such important elements that have to be carefully
verified under every single load acting on the façade and every single significant combination of
these loads. Since that, as explained in Chapter 1, the application of an acceleration or a force
deriving from seismic events represents a minor hazard compared to the risk for the façade
caused by wind load and that, instead, the deformation and the relative displacements of the
building structure are to be considered and analysed for the deriving potential problems or
damages to the unit frame and glass plate, the fastening system components will not be
specifically considered and modelled in Straus7. Of course, fundamentally will be the proper
description of the same global constraint scheme of the unit that will be realized through
simplified points of constraint.
However brackets, hooks and channels are already verified for wind loads and the FEM method
used for their description is briefly presented. In the following images in fact is possible to see
the complete tri-dimensional model of these components, realized with “Brick” elements instead
of bi-dimensional “Beam” elements. Both the FEM model and the final result representation,
through the use of a colour contour for the stress distribution, are proposed for each fastening
component.
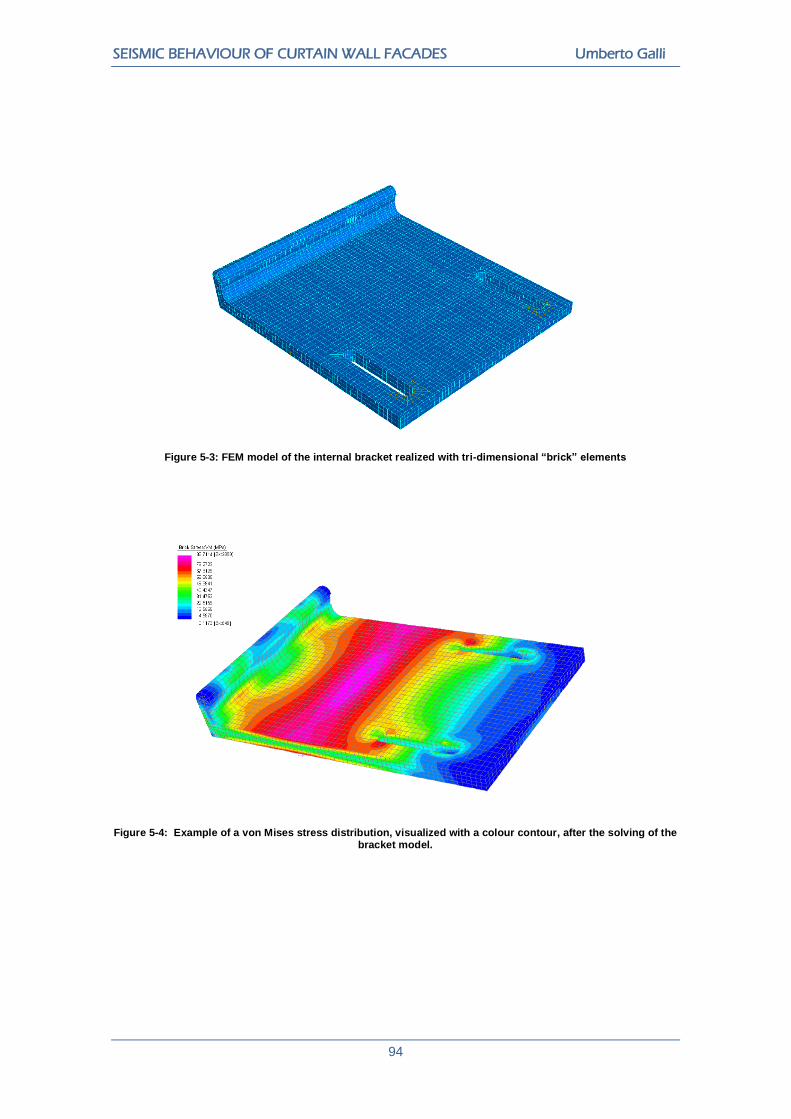
SEISMIC BEHAVIOUR OF CURTAIN WALL FACADES Umberto Galli
94
Figure 5-3: FEM model of the internal bracket realized with tri-dimensional “brick” elements
Figure 5-4: Example of a von Mises stress distribution, visualized with a colour contour, after the solving of the bracket model.
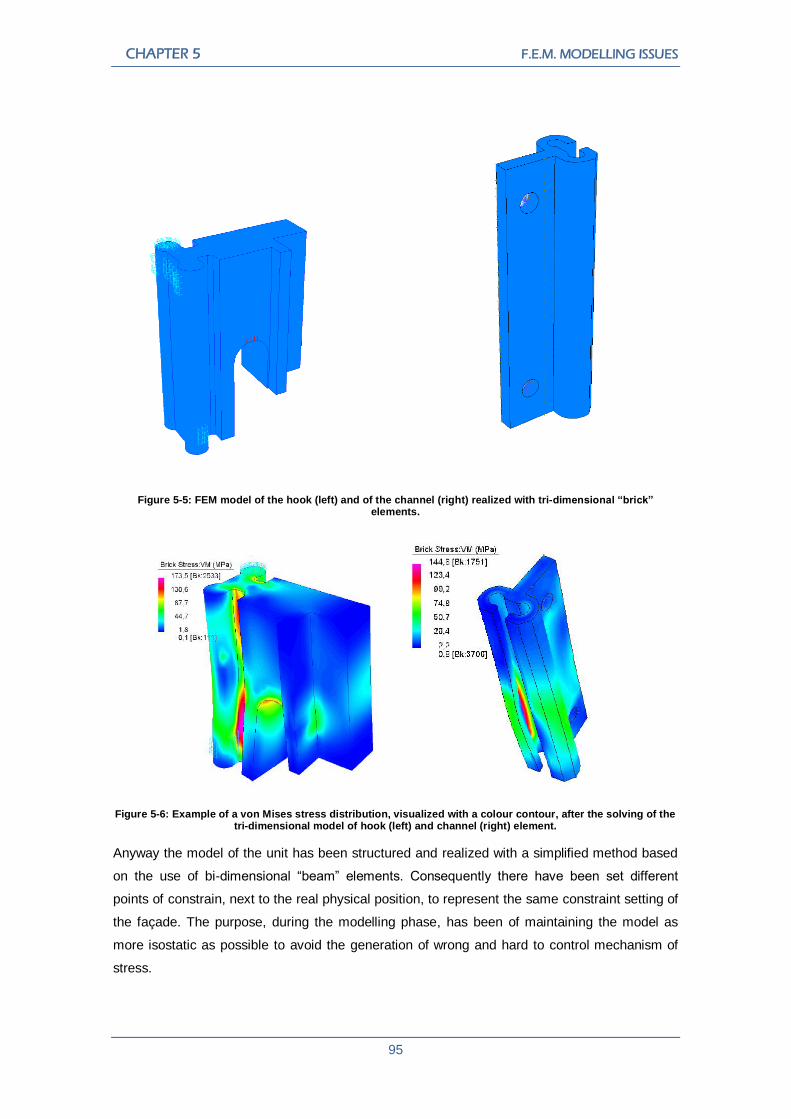
CHAPTER 5 F.E.M. MODELLING ISSUES
95
Figure 5-5: FEM model of the hook (left) and of the channel (right) realized with tri-dimensional “brick” elements.
Figure 5-6: Example of a von Mises stress distribution, visualized with a colour contour, after the solving of the tri-dimensional model of hook (left) and channel (right) element.
Anyway the model of the unit has been structured and realized with a simplified method based
on the use of bi-dimensional “beam” elements. Consequently there have been set different
points of constrain, next to the real physical position, to represent the same constraint setting of
the façade. The purpose, during the modelling phase, has been of maintaining the model as
more isostatic as possible to avoid the generation of wrong and hard to control mechanism of
stress.
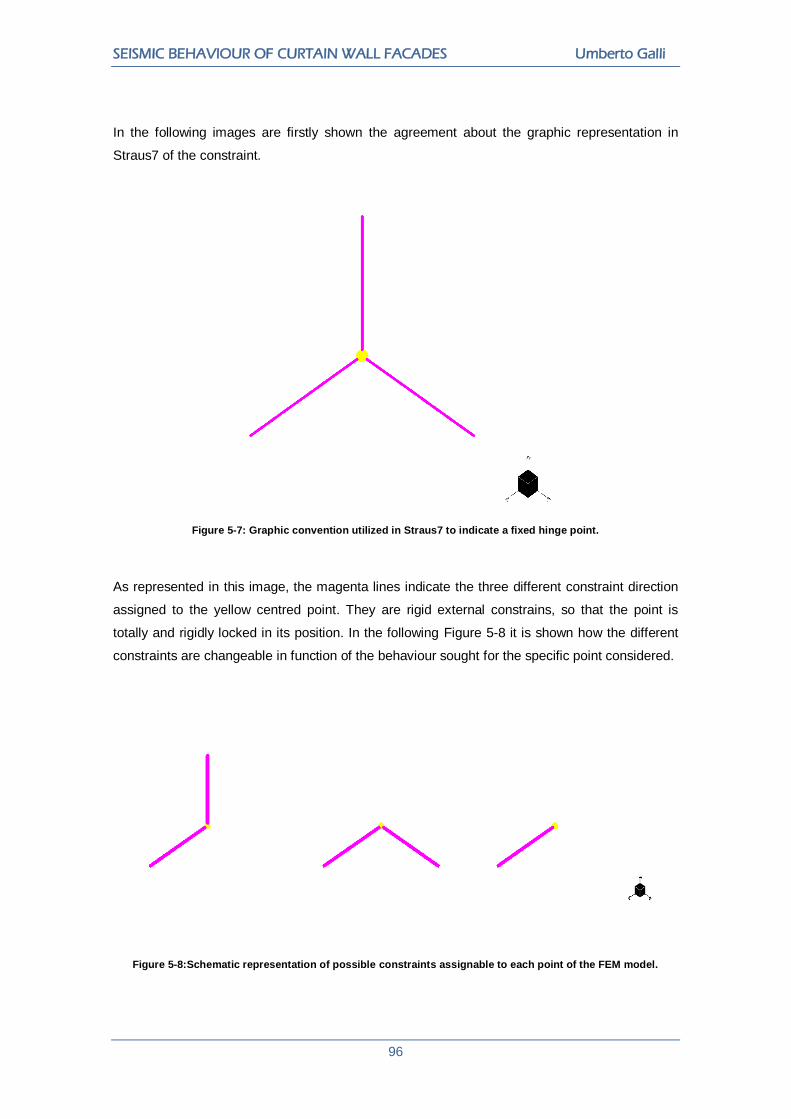
SEISMIC BEHAVIOUR OF CURTAIN WALL FACADES Umberto Galli
96
In the following images are firstly shown the agreement about the graphic representation in
Straus7 of the constraint.
Figure 5-7: Graphic convention utilized in Straus7 to indicate a fixed hinge point.
As represented in this image, the magenta lines indicate the three different constraint direction
assigned to the yellow centred point. They are rigid external constrains, so that the point is
totally and rigidly locked in its position. In the following Figure 5-8 it is shown how the different
constraints are changeable in function of the behaviour sought for the specific point considered.
Figure 5-8:Schematic representation of possible constraints assignable to each point of the FEM model.

CHAPTER 5 F.E.M. MODELLING ISSUES
97
Considering now the unit of the façade studied, the constraint scheme sought is quite simple. Of
course the unit must be globally restrained in the space and not labile, but the several fastening
points express each one a different constraint towards the unit.
For example the vertical direction is restrained by the two upper fastening points, where it is
present the bracket system already viewed in some images in Chapters 1 and 3. These
brackets express instead a different constrain in the horizontal direction. In fact they both
restrain the out of plane horizontal direction against, for example, the wind pressure for which
they have to be verified.
The horizontal in plane direction is instead differenced, because one of the two brackets
restrains the unit displacement in this direction while the other one leave it free to move. This
constrain scheme is justified by the necessity of the unit to expand under the thermal load.
Since that the unit can be globally described as a plane element, the significant expansion
directions will be the two in-plane ones.
For this reason at the bottom of the unit it is present a fastening system, constituted by the
connection between the horizontal bottom transom of the upper unit and the horizontal top
transom of the lower unit, that restrains the unit movements only in the out-of-plane direction but
leaves it free to expand in the other two in-plane directions. This scheme is represented and
modelled in Straus7 as it is possible to view in the following figures.
Figure 5-9: Facade unit frame constituted by “beam” elements and details of the utilized static scheme.

SEISMIC BEHAVIOUR OF CURTAIN WALL FACADES Umberto Galli
98
As specifically explained and described before, in Chapters 2 and 4, the unit behaviour during a
seismic event is mainly characterized by an initial rigid rotation followed then by a deformation
of the aluminium frame that tends to a rhombus shape, with the consequential risk of glass
rupture and fallout from the unit. Therefore, to represent properly this characteristic behaviour,
during the modelling phase it is necessary to leave the suitable degree of freedom: the rotation
of the unit in its plane.
For this reason a specific and particular system of constrains has been studied for the upper
fixing points. More specifically, the displacement in the perpendicular out-of-plane direction has
been restraint while instead, for the vertical in-plane direction, a particular element of Straus7,
named “point contact” has been adopted.
This element is properly a “beam” element, but it does not represent a real physical element. Its
function is only to express a punctual contact between two different points of the model, setting
a constraint equation between them. In practice, a point contact is an element that becomes
active only when it is in compression. These elements are used to model gaps or special
connection between two nodes in nonlinear analysis. The contact status is monitored through
the relative axial movement of the nodes. For geometric nonlinear analysis, the relative
displacement can be measured in the original direction of the element or also in the current
axial direction. For this case is necessary to maintain as a constraint the original direction, that
express the contact between the hook of the unit that hangs to the bracket attached to the floor
slab.
With a constrain system structured as just described, the model is able to globally behave in a
similar way to the real physical phenomena, firstly rigidly rotating and then also deforming its
shape. Hence the global displacement behaviour of the unit has been achieved by the
modelling, but it is now necessary to correctly describe the most important part of the model: the
glass plate and, most of all, its retaining system that attaches it to the aluminium frame.
The great importance of properly modelling this particular element is clearly understandable,
mainly for two reasons. In fact while the glass sheet is easy to be modelled by means of a huge
plate element subsequently finely subdivided in more than two thousands small and regular
plates, the retaining system is directly able to influence the behaviour not only of the glass, but
also of the whole unit modelled:
- Firstly because of the great stiffness and the rigid behaviour of the glass material
that makes the whole unit stiffer;
- Secondly because of the great complexity of properly modelling such a material, like
the structural silicon, that in this case is primarily subjected to a tangential stress.
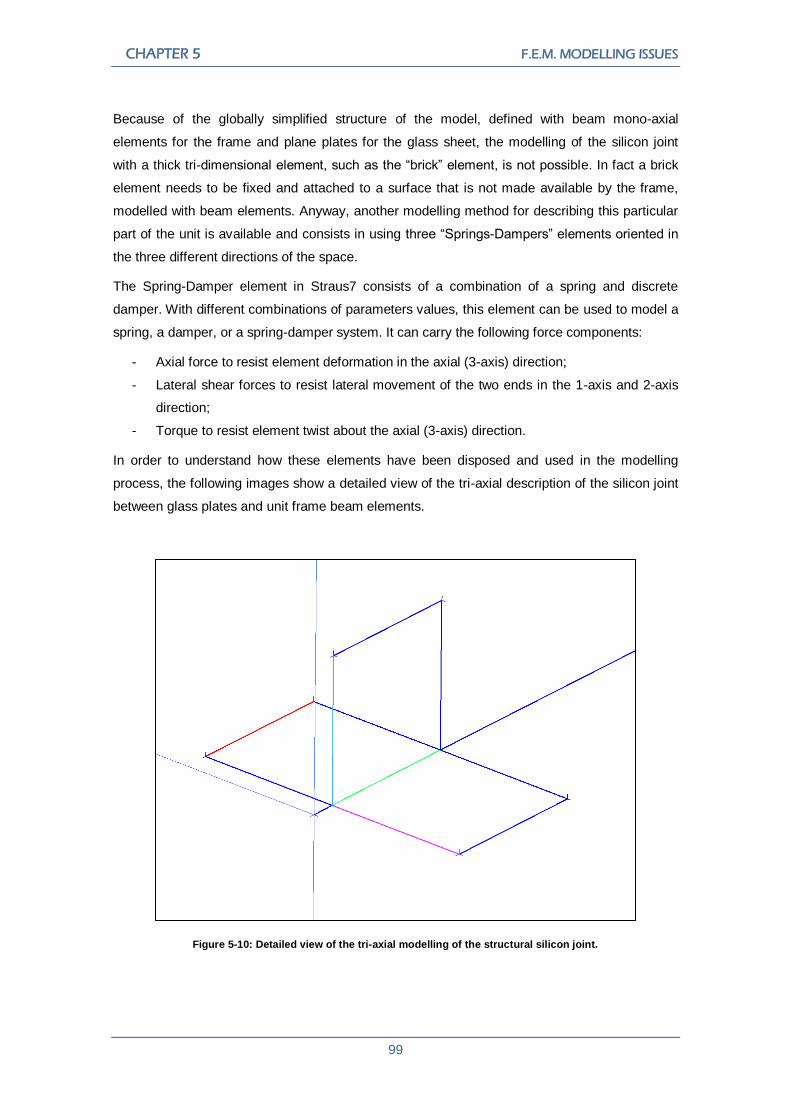
CHAPTER 5 F.E.M. MODELLING ISSUES
99
Because of the globally simplified structure of the model, defined with beam mono-axial
elements for the frame and plane plates for the glass sheet, the modelling of the silicon joint
with a thick tri-dimensional element, such as the “brick” element, is not possible. In fact a brick
element needs to be fixed and attached to a surface that is not made available by the frame,
modelled with beam elements. Anyway, another modelling method for describing this particular
part of the unit is available and consists in using three “Springs-Dampers” elements oriented in
the three different directions of the space.
The Spring-Damper element in Straus7 consists of a combination of a spring and discrete
damper. With different combinations of parameters values, this element can be used to model a
spring, a damper, or a spring-damper system. It can carry the following force components:
- Axial force to resist element deformation in the axial (3-axis) direction;
- Lateral shear forces to resist lateral movement of the two ends in the 1-axis and 2-axis
direction;
- Torque to resist element twist about the axial (3-axis) direction.
In order to understand how these elements have been disposed and used in the modelling
process, the following images show a detailed view of the tri-axial description of the silicon joint
between glass plates and unit frame beam elements.
Figure 5-10: Detailed view of the tri-axial modelling of the structural silicon joint.

SEISMIC BEHAVIOUR OF CURTAIN WALL FACADES Umberto Galli
100
In Figure 5-10 it is possible to notice, on the left side, the light-blue coloured lines that represent
the glass plate edges. In fact, to ease the visualization of the tri-axial disposition of the “Spring-
Damper” elements, the glass plates have been represented through a wireframe mode.
Consequently it is possible to recognise each of the three “Spring-Damper” elements by the
three different colours assigned to them: green, cyan and magenta. Each colour corresponds to
a different “Spring-Damper” element, as explained afterwards. On the contrary, the red-coloured
beam on the left side is a “Zero-gap” element, a specific type of beam able to describe the
potential contact between the glass plate and the unit frame, when the distance between its end
points assumes a zero value, through the assumption of an almost-infinite axial stiffness.
For the purpose of modelling the silicon joint, it is possible not to consider the damping
contribute and to use these elements only as springs in the three space directions. So then, it
has been necessary to evaluate and assign an appropriate stiffness values to every single
spring element for each direction, because the structural silicon material behaves differently,
more specifically with a different stiffness, depending on the direction and the type of stress to
which it is subjected. In particular, the shearing stress direction, which is for the purpose of the
thesis the most important one, has a different stiffness compared to the compressive stress
direction. Both these stiffness values have been calculated on the basis of a previous FEM
study carried on by Sika Technology AG, a branch of Sika, the manufacturer of the structural
silicon utilized, commercially named “Sikasil SG-500”.
This document recommends, for the spring stiffness calculation, to utilize the following equation:
Equation 5-1
Where:
- k is the spring constant
- c is the stiffness of the sealant
0,44 N/mm2 for Sikasil SG-500: direction perpendicular to the joint
0,49 N/mm2 for Sikasil SG-500: direction parallel to the joint
- Ak is the bonding area [mm2]
- d is the thickness of the structural joint [mm]
Obviously, as clearly understandable considering the equation just mentioned, the presence of
the terms “Ak” and “d” entails a joint dimensions dependence on the spring stiffness calculation.
Actually, the choice of how finely discretize the structural silicon joint has not been a free
choice, because it has been forced and influenced by the previous discretization of the glass
plate. As a result, a five centimetres long fundamental unit has been obtained, so that both “Ak”
and “d” has been determined and the spring stiffness values for each of the three different
space directions have been calculated. For the two directions, parallel and perpendicular to the
joint, respectively the stiffness values 40,83 N/mm and 36,47 N/mm have been calculated and
assigned.
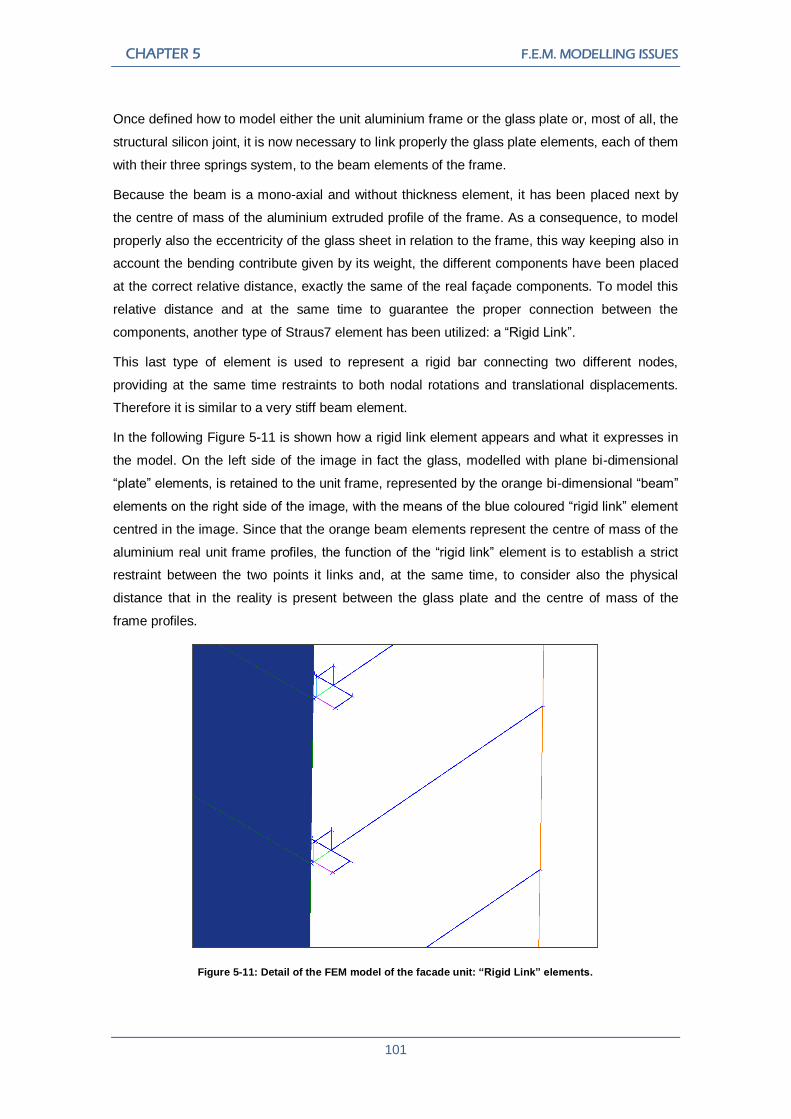
CHAPTER 5 F.E.M. MODELLING ISSUES
101
Once defined how to model either the unit aluminium frame or the glass plate or, most of all, the
structural silicon joint, it is now necessary to link properly the glass plate elements, each of them
with their three springs system, to the beam elements of the frame.
Because the beam is a mono-axial and without thickness element, it has been placed next by
the centre of mass of the aluminium extruded profile of the frame. As a consequence, to model
properly also the eccentricity of the glass sheet in relation to the frame, this way keeping also in
account the bending contribute given by its weight, the different components have been placed
at the correct relative distance, exactly the same of the real façade components. To model this
relative distance and at the same time to guarantee the proper connection between the
components, another type of Straus7 element has been utilized: a “Rigid Link”.
This last type of element is used to represent a rigid bar connecting two different nodes,
providing at the same time restraints to both nodal rotations and translational displacements.
Therefore it is similar to a very stiff beam element.
In the following Figure 5-11 is shown how a rigid link element appears and what it expresses in
the model. On the left side of the image in fact the glass, modelled with plane bi-dimensional
“plate” elements, is retained to the unit frame, represented by the orange bi-dimensional “beam”
elements on the right side of the image, with the means of the blue coloured “rigid link” element
centred in the image. Since that the orange beam elements represent the centre of mass of the
aluminium real unit frame profiles, the function of the “rigid link” element is to establish a strict
restraint between the two points it links and, at the same time, to consider also the physical
distance that in the reality is present between the glass plate and the centre of mass of the
frame profiles.
Figure 5-11: Detail of the FEM model of the facade unit: “Rigid Link” elements.
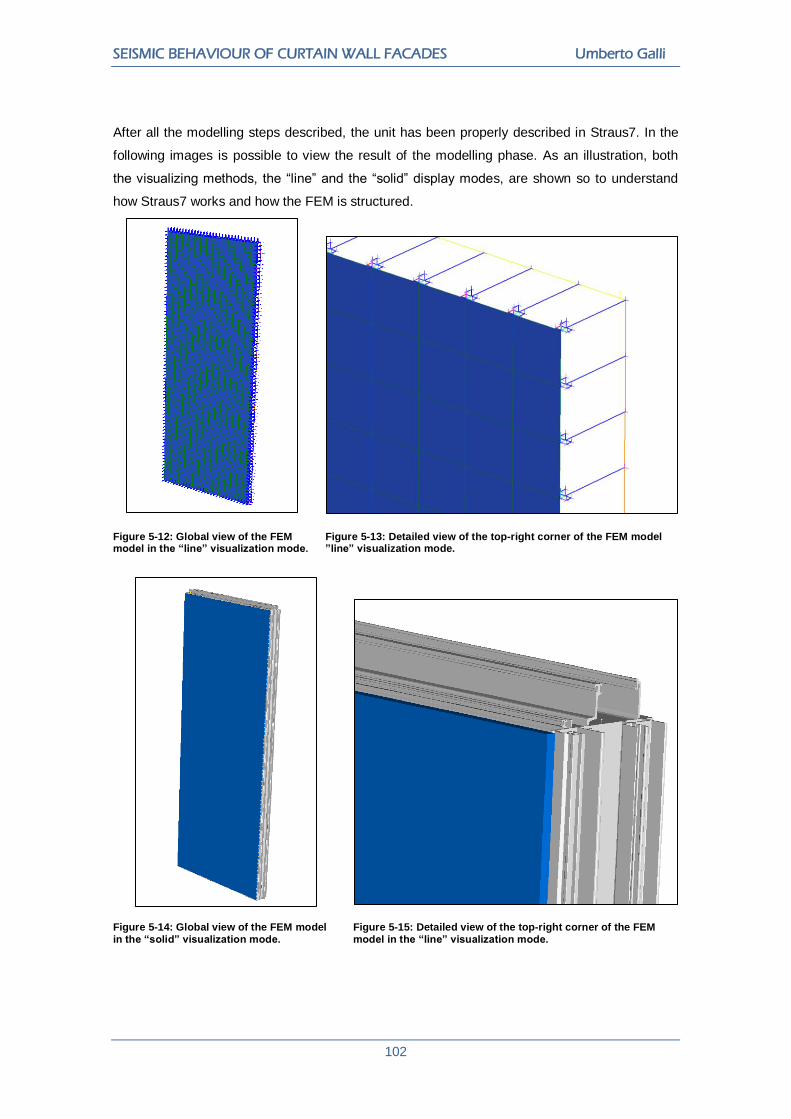
SEISMIC BEHAVIOUR OF CURTAIN WALL FACADES Umberto Galli
102
After all the modelling steps described, the unit has been properly described in Straus7. In the
following images is possible to view the result of the modelling phase. As an illustration, both
the visualizing methods, the “line” and the “solid” display modes, are shown so to understand
how Straus7 works and how the FEM is structured.
Figure 5-12: Global view of the FEM model in the “line” visualization mode.
Figure 5-13: Detailed view of the top-right corner of the FEM model ”line” visualization mode.
Figure 5-14: Global view of the FEM model in the “solid” visualization mode.
Figure 5-15: Detailed view of the top-right corner of the FEM model in the “line” visualization mode.
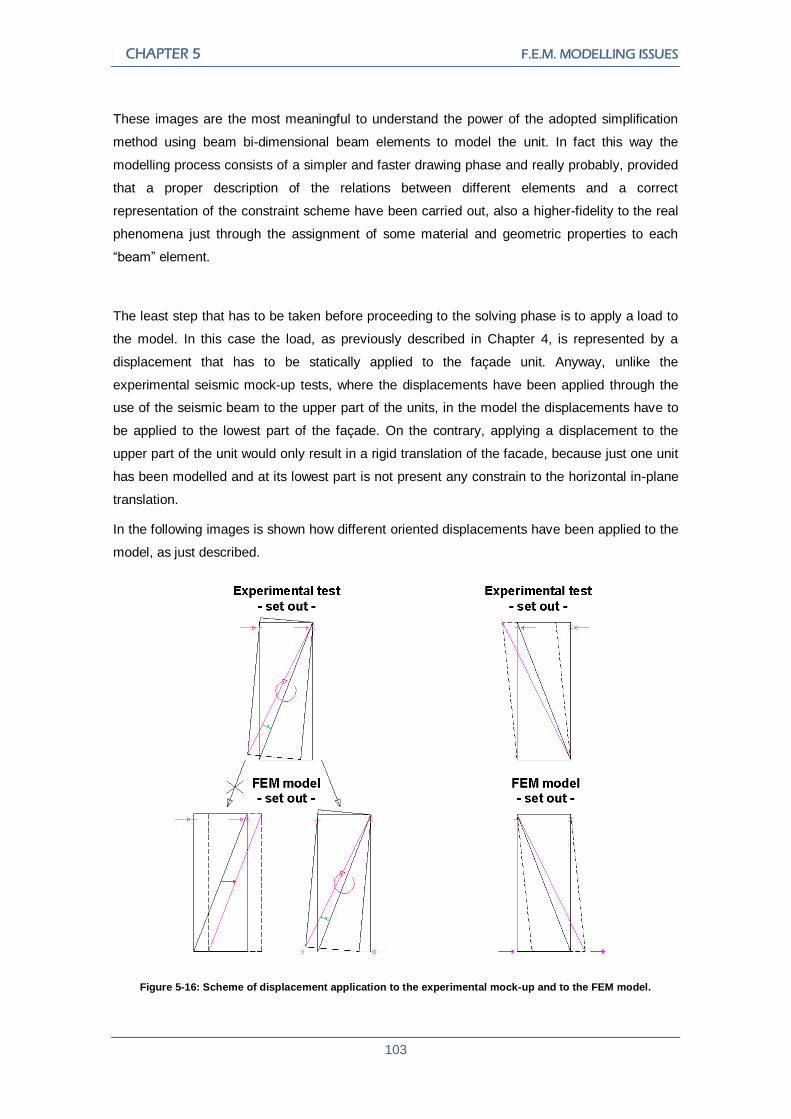
CHAPTER 5 F.E.M. MODELLING ISSUES
103
These images are the most meaningful to understand the power of the adopted simplification
method using beam bi-dimensional beam elements to model the unit. In fact this way the
modelling process consists of a simpler and faster drawing phase and really probably, provided
that a proper description of the relations between different elements and a correct
representation of the constraint scheme have been carried out, also a higher-fidelity to the real
phenomena just through the assignment of some material and geometric properties to each
“beam” element.
The least step that has to be taken before proceeding to the solving phase is to apply a load to
the model. In this case the load, as previously described in Chapter 4, is represented by a
displacement that has to be statically applied to the façade unit. Anyway, unlike the
experimental seismic mock-up tests, where the displacements have been applied through the
use of the seismic beam to the upper part of the units, in the model the displacements have to
be applied to the lowest part of the façade. On the contrary, applying a displacement to the
upper part of the unit would only result in a rigid translation of the facade, because just one unit
has been modelled and at its lowest part is not present any constrain to the horizontal in-plane
translation.
In the following images is shown how different oriented displacements have been applied to the
model, as just described.
Figure 5-16: Scheme of displacement application to the experimental mock-up and to the FEM model.

SEISMIC BEHAVIOUR OF CURTAIN WALL FACADES Umberto Galli
104
The displacements that have been applied are, of course, the three values required by the
Japan JASS14 standards, as previously described and carried out in the experimental phase:
- for “Grade 1” it is H/300 corresponding to a 12,50 millimetres displacement;
- for “Grade 2” it is H/200 corresponding to a 18,75 millimetres displacement;
- for “Grade 3” it is H/100 corresponding to a 37,50 millimetres displacement.
Anyway, in addition to these already described displacements, others ten displacements of a
constant three millimetres-step increasing magnitude have been applied. This procedure allows
a more accurate definition of the façade unit behaviour in function of the applied displacement.
As a consequence, to compare properly the results of the experimental campaign, where only
the three main displacements have been applied, for the other displacement amplitudes
considered the value has been obtained through a linearization.
Finally, to finalize the load case of the model, the only one still missing contribute is the gravity
acceleration. Since every different element in Straus7, representing a real physical component
of the unit in the reality, has been defined and completed with the corresponding exact
dimensions and material properties, besides its graphic representation of element without
thickness, it is possible to apply to the whole model a vertical negative acceleration, equal to the
gravity acceleration, to consider also the self-weight of the unit.
5.3 Modelling results:
The application to the unit of the loads, as it has just been described, induces the facade to
perform the described and introduced behaviour. This consists of an initial rotation and a
subsequently mixed phase of rotation and deformation of the unit for the “positive” direction of
the applied displacement, whilst for the “negative” direction only a deformation phase of the unit
behaviour is expected.
To evaluate the amplitude of the unit rotation and directly compare the rotational/deformational
phase of the model with the experimental results as already explained in Chapter 4, it is
possible to take as a reference the frame diagonal creating a fictitious element, such as a spring
with very low values of stiffness, and, after the solver has terminated the calculation of the
model, reading the rotational movements of this element.
Postponing until the next chapter the direct comparison between the modelling results and the
experimental campaign results of the previous chapter, it is now possible to evaluate and take
some preliminary considerations about the behaviour of the model.
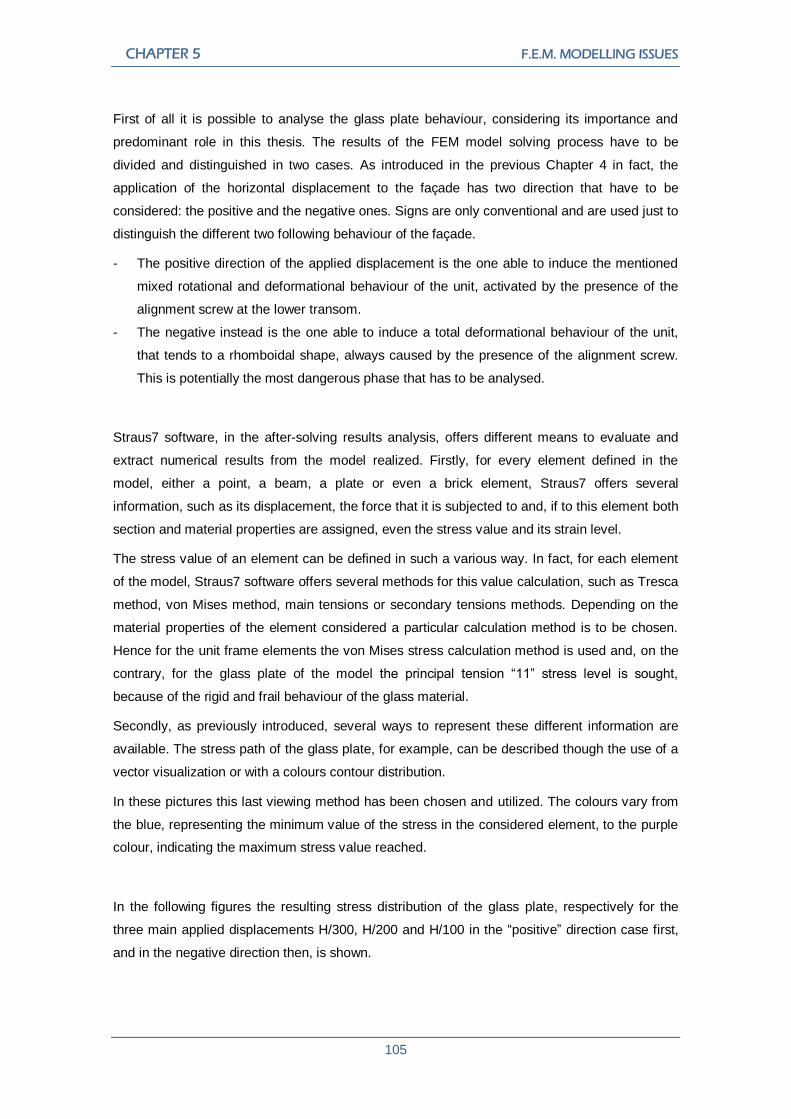
CHAPTER 5 F.E.M. MODELLING ISSUES
105
First of all it is possible to analyse the glass plate behaviour, considering its importance and
predominant role in this thesis. The results of the FEM model solving process have to be
divided and distinguished in two cases. As introduced in the previous Chapter 4 in fact, the
application of the horizontal displacement to the façade has two direction that have to be
considered: the positive and the negative ones. Signs are only conventional and are used just to
distinguish the different two following behaviour of the façade.
- The positive direction of the applied displacement is the one able to induce the mentioned
mixed rotational and deformational behaviour of the unit, activated by the presence of the
alignment screw at the lower transom.
- The negative instead is the one able to induce a total deformational behaviour of the unit,
that tends to a rhomboidal shape, always caused by the presence of the alignment screw.
This is potentially the most dangerous phase that has to be analysed.
Straus7 software, in the after-solving results analysis, offers different means to evaluate and
extract numerical results from the model realized. Firstly, for every element defined in the
model, either a point, a beam, a plate or even a brick element, Straus7 offers several
information, such as its displacement, the force that it is subjected to and, if to this element both
section and material properties are assigned, even the stress value and its strain level.
The stress value of an element can be defined in such a various way. In fact, for each element
of the model, Straus7 software offers several methods for this value calculation, such as Tresca
method, von Mises method, main tensions or secondary tensions methods. Depending on the
material properties of the element considered a particular calculation method is to be chosen.
Hence for the unit frame elements the von Mises stress calculation method is used and, on the
contrary, for the glass plate of the model the principal tension “11” stress level is sought,
because of the rigid and frail behaviour of the glass material.
Secondly, as previously introduced, several ways to represent these different information are
available. The stress path of the glass plate, for example, can be described though the use of a
vector visualization or with a colours contour distribution.
In these pictures this last viewing method has been chosen and utilized. The colours vary from
the blue, representing the minimum value of the stress in the considered element, to the purple
colour, indicating the maximum stress value reached.
In the following figures the resulting stress distribution of the glass plate, respectively for the
three main applied displacements H/300, H/200 and H/100 in the “positive” direction case first,
and in the negative direction then, is shown.
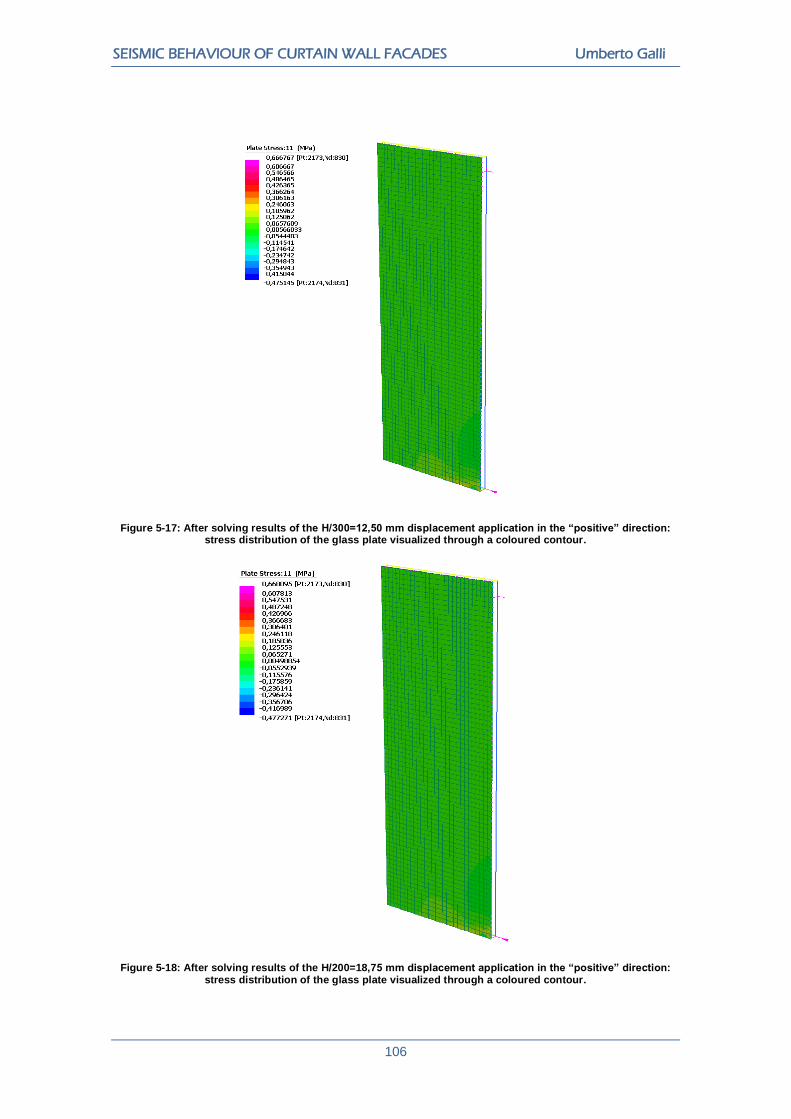
SEISMIC BEHAVIOUR OF CURTAIN WALL FACADES Umberto Galli
106
Figure 5-17: After solving results of the H/300=12,50 mm displacement application in the “positive” direction: stress distribution of the glass plate visualized through a coloured contour.
Figure 5-18: After solving results of the H/200=18,75 mm displacement application in the “positive” direction: stress distribution of the glass plate visualized through a coloured contour.

CHAPTER 5 F.E.M. MODELLING ISSUES
107
Figure 5-19: After solving results of the H/100=37,50 mm displacement application in the “positive” direction: stress distribution of the glass plate visualized through a coloured contour.
As possible to see viewing Figure 5-19, the stress values in the glass plates are extremely low
and their variation is almost negligible. In addition this values are very similar to the values in
the case of standard condition of load, namely without seismic actions or displacements applied
and only with the gravity acceleration left. Therefore it is easy to understand how the seismic
action, also in the worst case of Grade 3 with a H/100=37,50 millimetres applied in the “positive”
direction, is not able to induce high level of stress in the glass plate in this specific case of
structural sealed facade. On the contrary it is supposable that a different retaining system, such
as the mechanical pressure plate, would have been much more hazardous for the glass
integrity.
Another important characteristic of the glass behaviour is that it rotates correctly, following the
frame movement, and that it is properly sustained by the setting block at the lower corner. So
the model is able to adequately represent the behaviour of the real mock-up, where the glass
rigidly rotates, inducing low values of stress in the silicon joint and unloading its weight on the
setting block at the bottom. This characteristic behaviour is easily understandable looking at the
stress concentration in one of the two bottom corners of the glass plate.
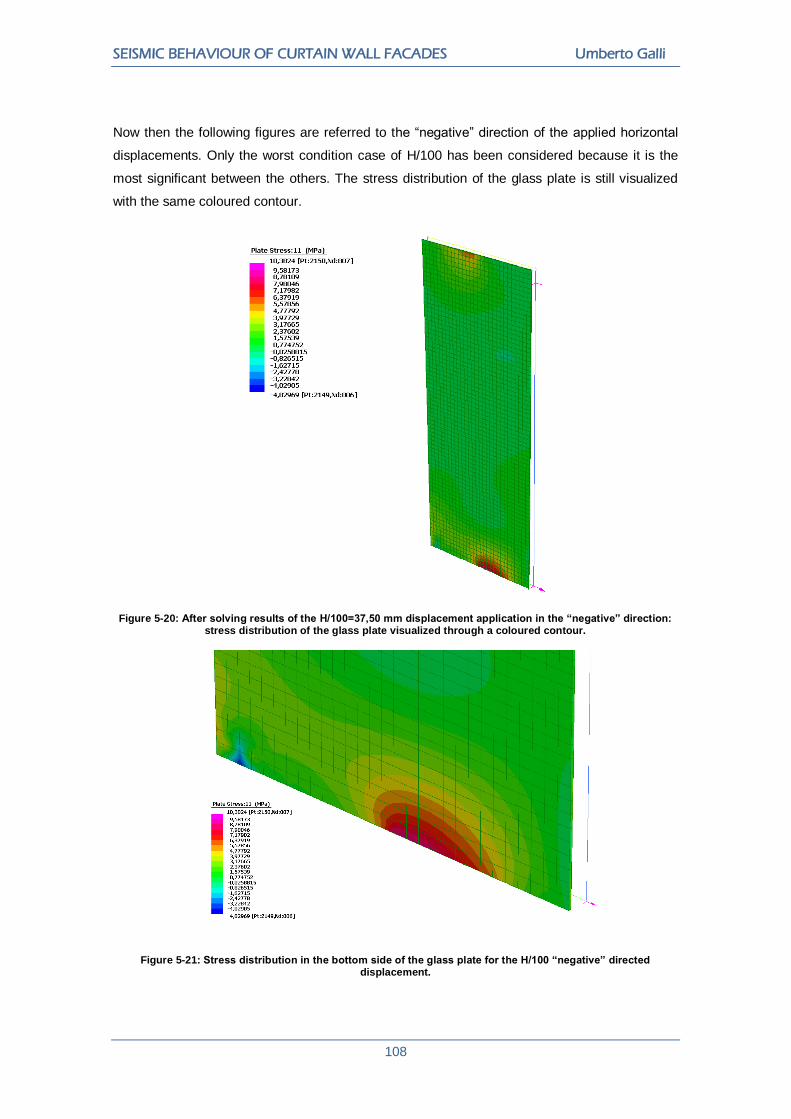
SEISMIC BEHAVIOUR OF CURTAIN WALL FACADES Umberto Galli
108
Now then the following figures are referred to the “negative” direction of the applied horizontal
displacements. Only the worst condition case of H/100 has been considered because it is the
most significant between the others. The stress distribution of the glass plate is still visualized
with the same coloured contour.
Figure 5-20: After solving results of the H/100=37,50 mm displacement application in the “negative” direction: stress distribution of the glass plate visualized through a coloured contour.
Figure 5-21: Stress distribution in the bottom side of the glass plate for the H/100 “negative” directed displacement.

CHAPTER 5 F.E.M. MODELLING ISSUES
109
Figure 5-22: Detailed view of the bottom left corner stress distribution: a peak compressive stress value is identified.
The application of a negative directed displacement, as shown in the previous images,
generates a different stress distribution in the glass plate. Specifically, the glass remains for the
most uniformly stressed, as indicated by the dominant green colour. Two main concentrations of
stress this time are induced in the bottom right corner and in the opposite top left corner of the
plate. This stress distribution, clearly different from the previous case of the positive directed
displacement, derives from the expected deformational behaviour of the unit. The frame in fact
deforms its shape tending to a rhombus from the beginning of the negative displacement. The
weight of the glass plate and the presence of the left side setting block that supports it
concentrates the stress in the close area around that point. The two red coloured concentration
zones are instead generated by a traction stress, caused by the structural silicon joint along the
plate edges.
Furthermore from these images it is also possible to better understand the great difference
between the positive and the negative directions of the horizontal displacement applied to the
façade. In fact, considering the worst condition corresponding to the H/100 case, the maximum
value of stress reached by the glass plate passes from the extremely low value of 0,68 MPa of
the positive displacement, to more than ten-times higher value of 10,38 MPa of the inverted
direction case. This was obviously an expected result, because during the negative direction of
displacement the façade is not able to freely rotate like in the positive one. On the contrary it is
deformed to a rhombus shape. Considering that the glass plate is not able to assume this shape
because of its extremely rigid behaviour, the higher stress peak value was supposable.
This value is a moderate-high stress for a glass plate (in the present case of study an annealed
type), but still enough low to maintain the integrity of this component without any risk.

SEISMIC BEHAVIOUR OF CURTAIN WALL FACADES Umberto Galli
110
Nevertheless the meaningful of this analysis is clearly to show which is the potential great risk
deriving from an applied horizontal relative displacement to the façade. This in fact, as a
consequence, must necessarily be able to resist and properly deform its components to avoid
any damage and consequential hazard.
For what concerning the aluminium frame of the unit, the model reveals that its profiles are low-
stressed. The “total stress fibre” values, which consider each contribute given by the bending,
the shear and the axial actions, remains in the elastic field, either for the positive or the inverted
negative direction of the displacement even though with differences between the two cases as
following explained.
In the following images is possible to view the “Total Fibre Stress” stress distribution of the unit
frame, considering the most significant condition of H/100=37,50 mm displacement applied in
both the positive, first, and negative direction, then. A “solid” visualization mode is proposed to
ease the view of the colour contour, as customary utilized.
Figure 5-23: After solving results of the H/100=37,50 mm displacement application in the “positive” direction: stress distribution of the unit frame profiles visualized through a coloured contour in the “solid” mode.
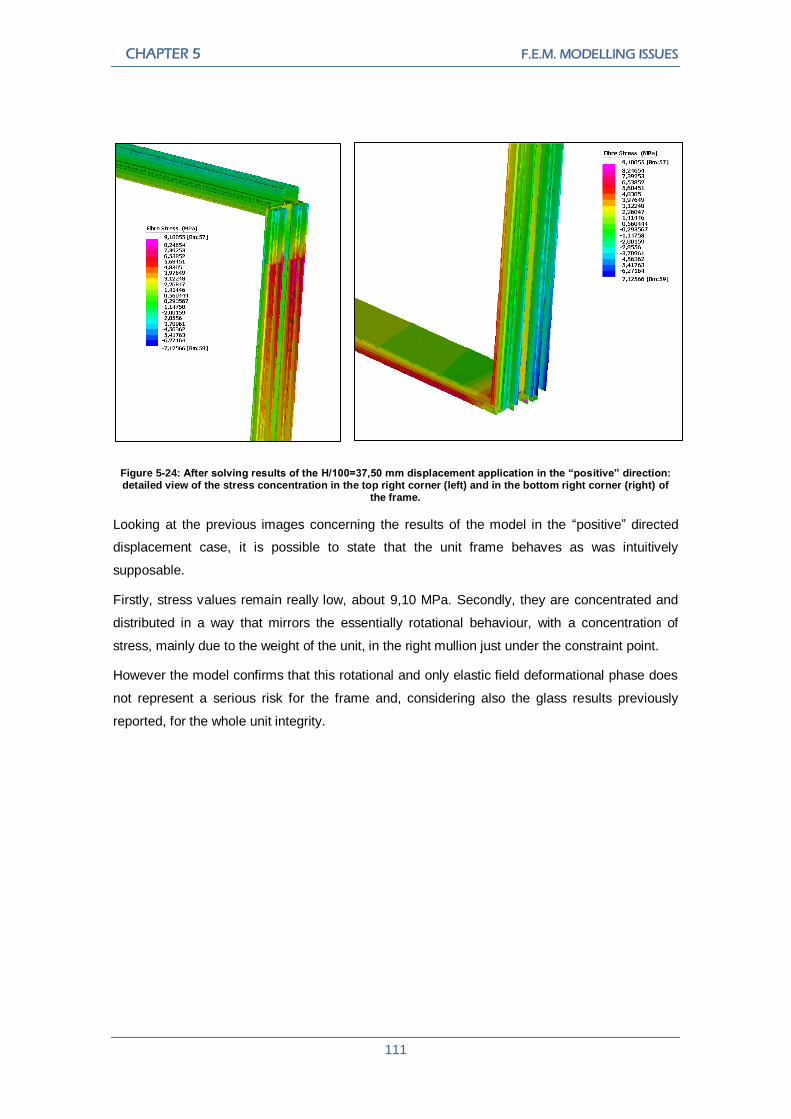
CHAPTER 5 F.E.M. MODELLING ISSUES
111
Figure 5-24: After solving results of the H/100=37,50 mm displacement application in the “positive” direction: detailed view of the stress concentration in the top right corner (left) and in the bottom right corner (right) of
the frame.
Looking at the previous images concerning the results of the model in the “positive” directed
displacement case, it is possible to state that the unit frame behaves as was intuitively
supposable.
Firstly, stress values remain really low, about 9,10 MPa. Secondly, they are concentrated and
distributed in a way that mirrors the essentially rotational behaviour, with a concentration of
stress, mainly due to the weight of the unit, in the right mullion just under the constraint point.
However the model confirms that this rotational and only elastic field deformational phase does
not represent a serious risk for the frame and, considering also the glass results previously
reported, for the whole unit integrity.

SEISMIC BEHAVIOUR OF CURTAIN WALL FACADES Umberto Galli
112
Figure 5-25: After solving results of the H/100=37,50 mm displacement application in the “negative” direction: stress distribution of the unit frame profiles visualized through a coloured contour in the “solid” mode.
Figure 5-26: After solving results of the H/100=37,50 mm displacement application in the “negative” direction: detailed view of the stress concentration in the top right corner (left) and in the bottom right corner (right) of
the frame.
As already shown by the glass plate analysis, again the unit frame stress distribution confirms
that the inverted and “negative” directed displacement case is the most hazardous condition of
load for the façade unit. In fact the stress values reach a peak of about 69 MPa, that is 7 times
greater than in the positive directed displacement case. Nevertheless, besides this great
increase, it must be underlined that also in this worst condition stress values remain in the
elastic field.
CHAPTER 5 F.E.M. MODELLING ISSUES
113
The spring elements representing the structural silicon joint have not been assigned with a
section. Anyway it is possible to obtain how much axial force they take, and then, known the
physical dimension of the discrete element of silicon joint represented, is possible to calculate
the stress to which the silicon would be subjected. Analyzing the distribution of the forces in the
spring elements along the glass plate edges is clearly evident how the silicon joint takes only a
low value of stress, because the weight of the glass is totally sustained by the two setting blocks
under the glass.
5.4 Conclusions:
However it is finally necessary to underline that, considering the rotational and deformational
phase of the façade behaviour, corresponding to the so called “positive” directed displacement
case, the unit rotational movements resulting from the solving of the FEM model follow really
closely the theoretical values obtainable from a geometric calculation.
Therefore, as will be more specifically analysed in the following Chapter 6, the model behaviour
is closer to an ideal description than to the experimental test results. This is, in first
approximation, possible to be explained considering that in the FEM model the friction
contribute has not been taken into account and that only one unit is considered and studied.
As a consequence of this chapter and the analysis of the FEM model results reported, a
preliminary conclusion could be given: the FEM model is able to globally represent the
behaviour of a curtain wall façade single unit under the static application of an horizontal
displacement representing the inter-storey relative drift induced to the building structure during a
seismic event.
The two described and distinguished phases, one roto-deformational in the “Positive” direction
of the displacement and the other totally deformational in the “negative” oriented direction, are
described by the model and for each of them displacements, stress and strain values of every
single components of the model are provided. After the nonlinear solving of the FEM model is
possible to state that in both the two recognised phases the façade behaves as theoretically
expected and does not reach too high level of stress or deformation, so that it is possible to
suppose that the glass plate and the frame integrity would not be at risk.
Anyway the lack of friction contribute in the FEM modelling surely influences the result, that
probably remains too close to an ideal representation of the phenomena considered. In this
case it is supposable that considering also the proper boundary conditions and the contribute
given by the friction between each components and units of the façade, higher values of stress
and strain, firstly for the glass plate, would be obtained.

SEISMIC BEHAVIOUR OF CURTAIN WALL FACADES Umberto Galli
114

CHAPTER 6
RESULTS COMPARISON
In the two previous chapters the experimental campaign, first, and the FEM modelling and
analysis, then, of the same case of study, the Manchester Metropolitan University project, have
been presented, described in details and analysed. The results of both the phases have been
then separately reported and preliminary commented.
In this chapter will be presented a comparison between experimental and modelling results,
mainly with the aim of determine the quality and the truthfulness of the model compared to a
real physical test conducted with the same procedure. Essentially, two different comparisons
are in the following considered:
- a numerical and quantitative confrontation, where the outputs of the experimental tests
(the displacements recorded by the transducers) are compared to the corresponding
outputs taken from the FEM model solving results. In this confrontation only the
rotational and deformational phase of the façade behaviour for the “positive” direction of
the applied displacement has been considered because more significant compared to
the other totally deformational phase for the inverted sign direction of the horizontal
displacement;
- a qualitative comparison. Since that the experimental tests are able to return only the
displacements of the façade components, also a qualitative comparison is carried out
between global observations taken during the performance seismic tests and the
considerations resulting from the reported FEM model solving.
6.1 The numerical comparison:
As already explained in the previous Chapter 4, the experimental campaign returns the
description of the façade behaviour under an applied series of displacements through the use of
transducers placed in several points of each unit and their displacement recordings. In addition
an air leakage test, conducted right before and after the execution of the first series of applied
displacements H/300, has been carried out to evaluate the loss of serviceability performance of
the façade. Finally, a qualitative observation of the façade behaviour during the performance
seismic test has been carried out.

SEISMIC BEHAVIOUR OF CURTAIN WALL FACADES Umberto Galli
116
As a consequence of this so structured procedure, set out referring to the Japan JASS14
regulation, the FEM modelling of the façade mirrors the same global arrangement. So then, as
reported in the previous Chapter 5, the unit frame and the glass plate diagonal rotational
movements have been extracted from the model to ease the direct comparison between
experimental campaign and FEM modelling results. The rotational phase of the unit movements
has been considered because it offers a more significant comparison about the quality of the
FEM model.
Consequently, frame and glass plate diagonals have been chosen because they directly
represent the global behaviour of a single whole unit. The following methods have been utilized
to determine the diagonal rotational movements:
- experimental campaign: vertical and horizontal displacement recordings of the glass
plate and aluminium frame corners have been utilized to determine the rotation of the
relative diagonal;
- FEM modelling: a fictitious element, either for the glass plate or for the aluminium frame
diagonal, has been created: a “spring-damper” element, with extremely low stiffness
values and no damping parameters assignment. Its function after the solving process of
the model is simply to return the rotational movement values for the unit frame and the
glass plate. The extremely low stiffness parameters assigned to this element avoids any
kind of influence on the global model behaviour.
While the mock-up performance tests have been characterized by only three series of cycles of
applied increasing amplitude displacements, H/300, H/200 and finally H/100, the model solving
has been instead carried out with a finer-step increasing scale of values. In fact the
displacements applied to the unit start from 3 mm, more or less corresponding to an H/1250
amplitude, increasing then with steps equal to 3 millimetres, until the last value: H/100 equal to
37,50 mm, the same of the experimental campaign. As a result the plotted graphic curve
describing the model behaviour count this way 13 intermediate values and it is much more
detailed than the just three points-based curve that describes the experimental campaign
results. Therefore the experimental curve has been finally linearized between its three main
values to more finely compare modelling and experimental results.
In the following graphs the different curves obtained from the described analysis and tests,
respectively for the unit frame and for the glass plate behaviour, are shown.
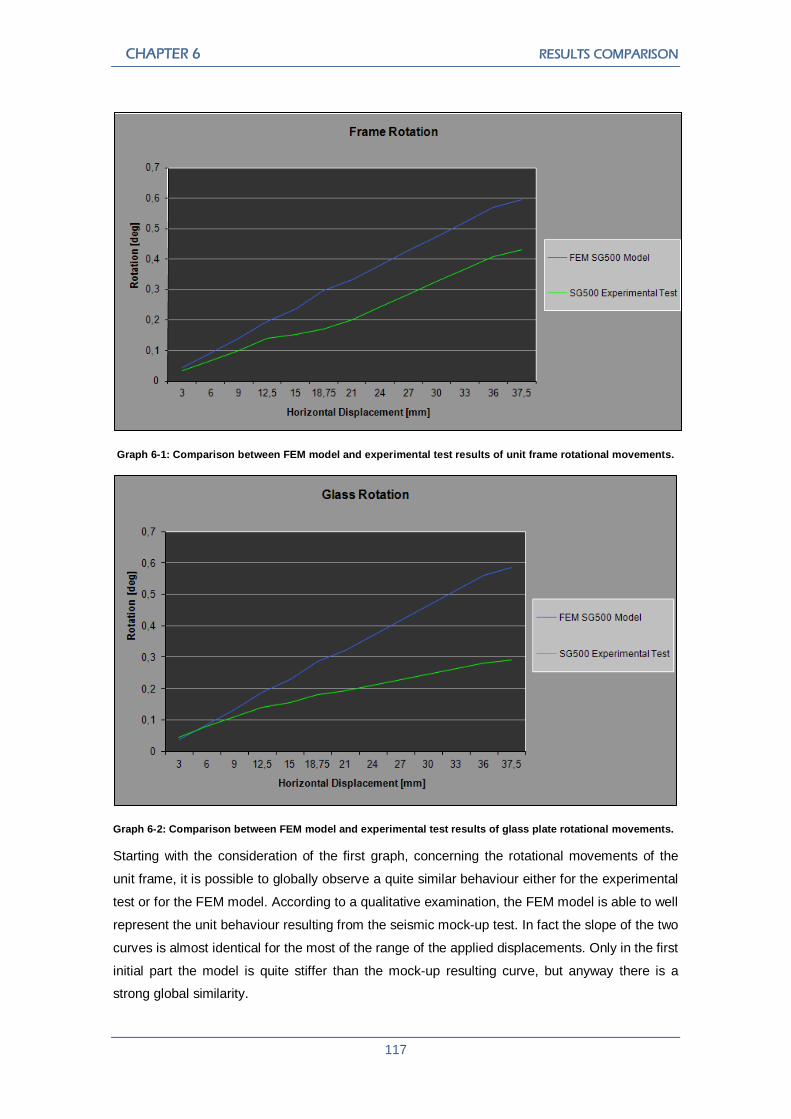
CHAPTER 6 RESULTS COMPARISON
117
Graph 6-1: Comparison between FEM model and experimental test results of unit frame rotational movements.
Graph 6-2: Comparison between FEM model and experimental test results of glass plate rotational movements.
Starting with the consideration of the first graph, concerning the rotational movements of the
unit frame, it is possible to globally observe a quite similar behaviour either for the experimental
test or for the FEM model. According to a qualitative examination, the FEM model is able to well
represent the unit behaviour resulting from the seismic mock-up test. In fact the slope of the two
curves is almost identical for the most of the range of the applied displacements. Only in the first
initial part the model is quite stiffer than the mock-up resulting curve, but anyway there is a
strong global similarity.

SEISMIC BEHAVIOUR OF CURTAIN WALL FACADES Umberto Galli
118
On the contrary, a quantitative examination of the graph leads to a more different model
behaviour compared to the mock-up case. In fact, besides the initial range of applied
displacements where the results from the FEM model and the experimental test are really
similar, for the most of the comparison the rotational movement of the FEM model is greater
than that recorded during the performance mock-up test. In addition is possible to notice that
this gap between the two curves is, for the most, equal to a constant value.
This quantitative difference between the FEM model and the experimental tests results is
supposable to be essentially caused by the friction phenomena. The façade and its seismic test,
in fact, have been modelled in Straus7 environment without contribute of the friction. This has
not been a free choice but only a consequence of other factors, such as:
- the study of a single unit at a time, that inevitably excludes the contact, and so also the
friction, of the unit components with other external surfaces.
- the modelling intrinsic difficulty in properly representing friction phenomena with Straus7.
In fact the FEM software is not able to consider easily this contribute. There is only one
possibility of considering it through the use of a specific beam element, the “point-
contact” element, that activates when subjected to compression and can also include a
friction contribute. Anyway this way of considering the friction phenomena is difficult to
be used because of the linear and mono-dimensional nature of the element itself. In
addition, after several attempts of introducing this important contribute, it was clear that
friction definition constitutes a great source of problems for the solving process, this way
always resulting in a divergence of the nonlinear iterative solution.
Secondly, necessary considerations are to be taken about the subsequent Graph 6-2,
concerning the rotational movements of the glass plate. As it is immediately understandable and
clearly visible from this graph, the FEM model glass plate behaves in a pronounced different
way compared to the mock-up case during the experimental test. Either a qualitative or a
quantitative analysis of this comparison shows this difference. However, compared to the
quantitative consideration, mostly influenced by the already described and explained different
behaviour (Graph 6-1) of the whole unit, the most important analysis that this time has to be
done is a qualitative one.
In fact, leaving out the gap between the two curves, the particular feature to consider is their
pronounced different slope. While the experimental glass plate behaviour is described by a few
slope line, the FEM model line is much more sloped. So it is immediately deducible that the
modelling of the structural silicon joint, the only element that attaches the glass plate to the unit
frame, is too stiff compared to the experimental resulting behaviour.
After an initial coincident starting point the two lines diverge and reach different values of
rotational movements. More specifically, during the experimental tests the glass plate rotates
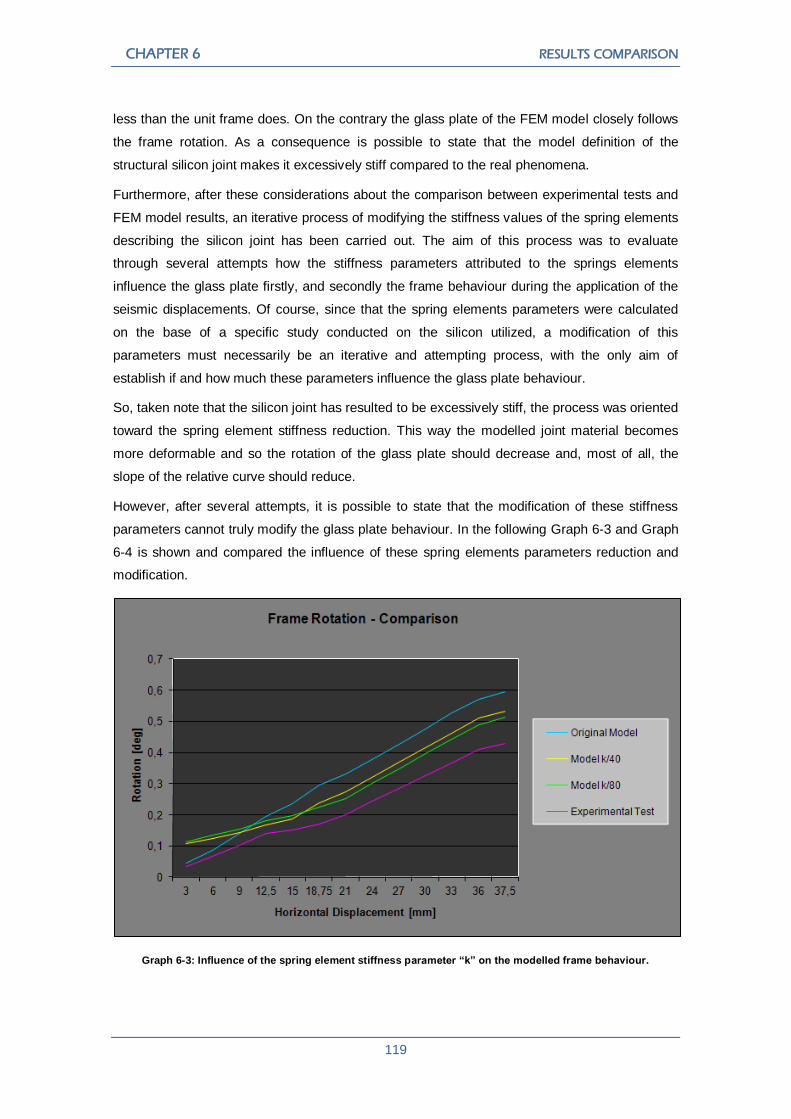
CHAPTER 6 RESULTS COMPARISON
119
less than the unit frame does. On the contrary the glass plate of the FEM model closely follows
the frame rotation. As a consequence is possible to state that the model definition of the
structural silicon joint makes it excessively stiff compared to the real phenomena.
Furthermore, after these considerations about the comparison between experimental tests and
FEM model results, an iterative process of modifying the stiffness values of the spring elements
describing the silicon joint has been carried out. The aim of this process was to evaluate
through several attempts how the stiffness parameters attributed to the springs elements
influence the glass plate firstly, and secondly the frame behaviour during the application of the
seismic displacements. Of course, since that the spring elements parameters were calculated
on the base of a specific study conducted on the silicon utilized, a modification of this
parameters must necessarily be an iterative and attempting process, with the only aim of
establish if and how much these parameters influence the glass plate behaviour.
So, taken note that the silicon joint has resulted to be excessively stiff, the process was oriented
toward the spring element stiffness reduction. This way the modelled joint material becomes
more deformable and so the rotation of the glass plate should decrease and, most of all, the
slope of the relative curve should reduce.
However, after several attempts, it is possible to state that the modification of these stiffness
parameters cannot truly modify the glass plate behaviour. In the following Graph 6-3 and Graph
6-4 is shown and compared the influence of these spring elements parameters reduction and
modification.
Graph 6-3: Influence of the spring element stiffness parameter “k” on the modelled frame behaviour.
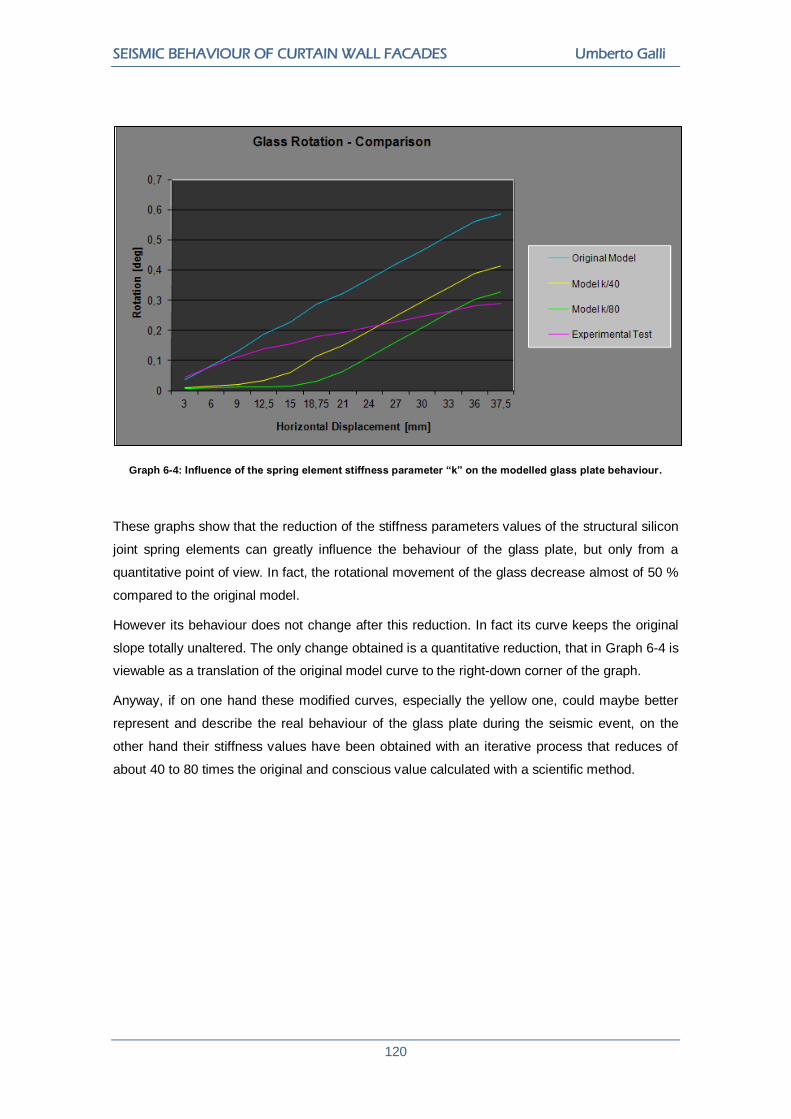
SEISMIC BEHAVIOUR OF CURTAIN WALL FACADES Umberto Galli
120
Graph 6-4: Influence of the spring element stiffness parameter “k” on the modelled glass plate behaviour.
These graphs show that the reduction of the stiffness parameters values of the structural silicon
joint spring elements can greatly influence the behaviour of the glass plate, but only from a
quantitative point of view. In fact, the rotational movement of the glass decrease almost of 50 %
compared to the original model.
However its behaviour does not change after this reduction. In fact its curve keeps the original
slope totally unaltered. The only change obtained is a quantitative reduction, that in Graph 6-4 is
viewable as a translation of the original model curve to the right-down corner of the graph.
Anyway, if on one hand these modified curves, especially the yellow one, could maybe better
represent and describe the real behaviour of the glass plate during the seismic event, on the
other hand their stiffness values have been obtained with an iterative process that reduces of
about 40 to 80 times the original and conscious value calculated with a scientific method.
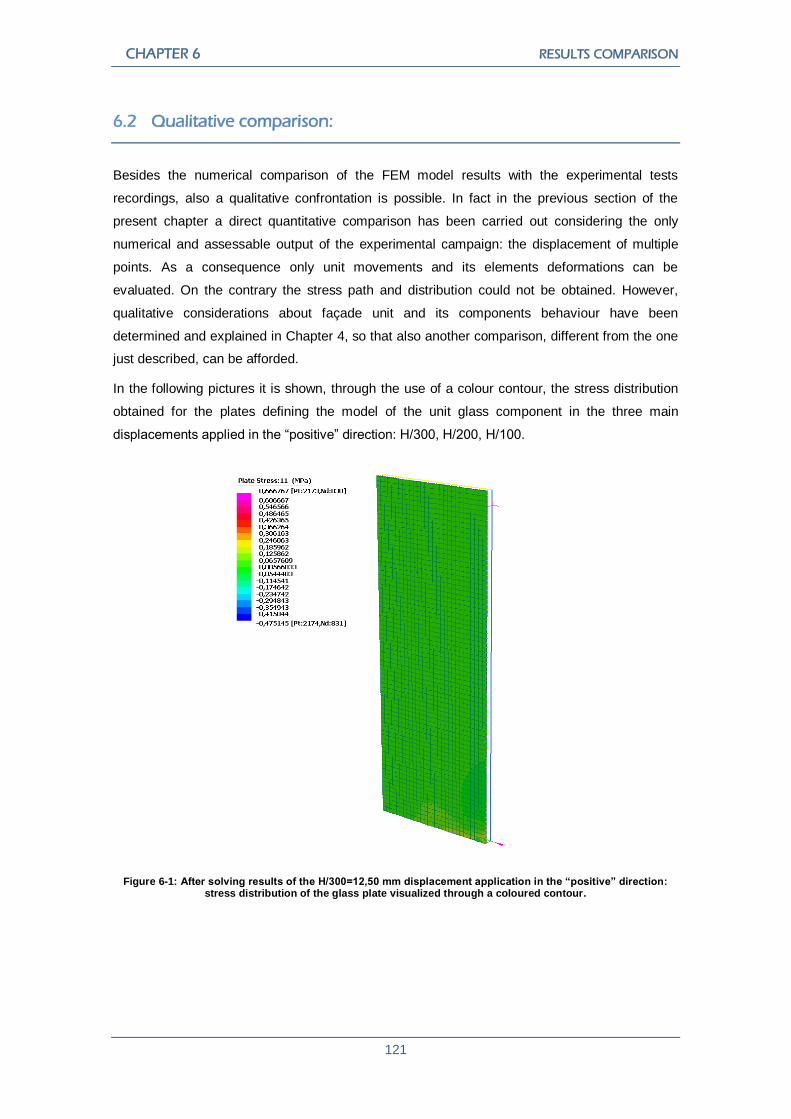
CHAPTER 6 RESULTS COMPARISON
121
6.2 Qualitative comparison:
Besides the numerical comparison of the FEM model results with the experimental tests
recordings, also a qualitative confrontation is possible. In fact in the previous section of the
present chapter a direct quantitative comparison has been carried out considering the only
numerical and assessable output of the experimental campaign: the displacement of multiple
points. As a consequence only unit movements and its elements deformations can be
evaluated. On the contrary the stress path and distribution could not be obtained. However,
qualitative considerations about façade unit and its components behaviour have been
determined and explained in Chapter 4, so that also another comparison, different from the one
just described, can be afforded.
In the following pictures it is shown, through the use of a colour contour, the stress distribution
obtained for the plates defining the model of the unit glass component in the three main
displacements applied in the “positive” direction: H/300, H/200, H/100.
Figure 6-1: After solving results of the H/300=12,50 mm displacement application in the “positive” direction: stress distribution of the glass plate visualized through a coloured contour.

SEISMIC BEHAVIOUR OF CURTAIN WALL FACADES Umberto Galli
122
Figure 6-2: After solving results of the H/200=18,75 mm displacement application in the “positive” direction: stress distribution of the glass plate visualized through a coloured contour.
Figure 6-3: After solving results of the H/100=37,50 mm displacement application in the “positive” direction: stress distribution of the glass plate visualized through a coloured contour.

CHAPTER 6 RESULTS COMPARISON
123
These pictures represent the different stress distribution respectively for the H/300, H/200 and
H/100 displacement applied.
First of all stress values scale on the top-left corner of the images has to be evaluated and
analysed. Each of the three pictures reported shows that, even in the worst case (Figure 6-3) of
an horizontal applied displacement of 37,50 mm (H/100), the stress minimum and maximum
values remain extremely low, very close to the original and normal-condition case, without the
application of an horizontal displacement to the unit.
However, carefully analysing the pictures proposed, the correctness of the modelling method is
evident. In fact during an imposed rotation of the unit frame, the glass plate colour contour
underlines a stress concentration in the bottom-right corner of the plate, where, under the new
rotated set of the glass, the most of the plate weight unloads to the right one of the two setting
blocks carrying almost the whole glass plate weight.
Hence, besides the definition of the stiffness values of the spring is not close to the real
phenomena (as results from the direct quantitative confrontation of the experimental and
modelling results in terms of rotational movements), considering also the previous numerical
comparison section described, the modelling method chosen for the silicon joint is able to
represent properly its behaviour during a horizontal displacement application to the façade,
without a high or even relevant transmission of stress to the glass plate and at the same time
inducing to it the proper rotating movement.
Another important consideration is that the model is able to correctly describe also the unit
frame behaviour that, also from a stress distribution point of view, seems to remain close to the
real phenomena. In fact, during the performed experimental tests, the transducers placed onto
the unit frame pointed out that the façade, after the application of the different displacement
amplitudes, was essentially re-aligned to the original position.
This fact induces to suppose that every single unit of the façade firstly rotates and deforms its
shape during the application of the displacement, subsequently instead comes back to its
original position returning the assumed deformation. For this reason is reasonably supposable
that the unit frame always remains in the elastic field of stress, and then, once the applied
displacement turns back to zero value, returns its deformation coming back to the original
position.
Considering now the modelling results is clearly possible to state that also the FEM model
behaves this way. In the following picture the stress distribution, determined according to the
“Total Fibre” stress calculation method, of the unit frame in the case of an horizontal “positive”
oriented displacement is shown.
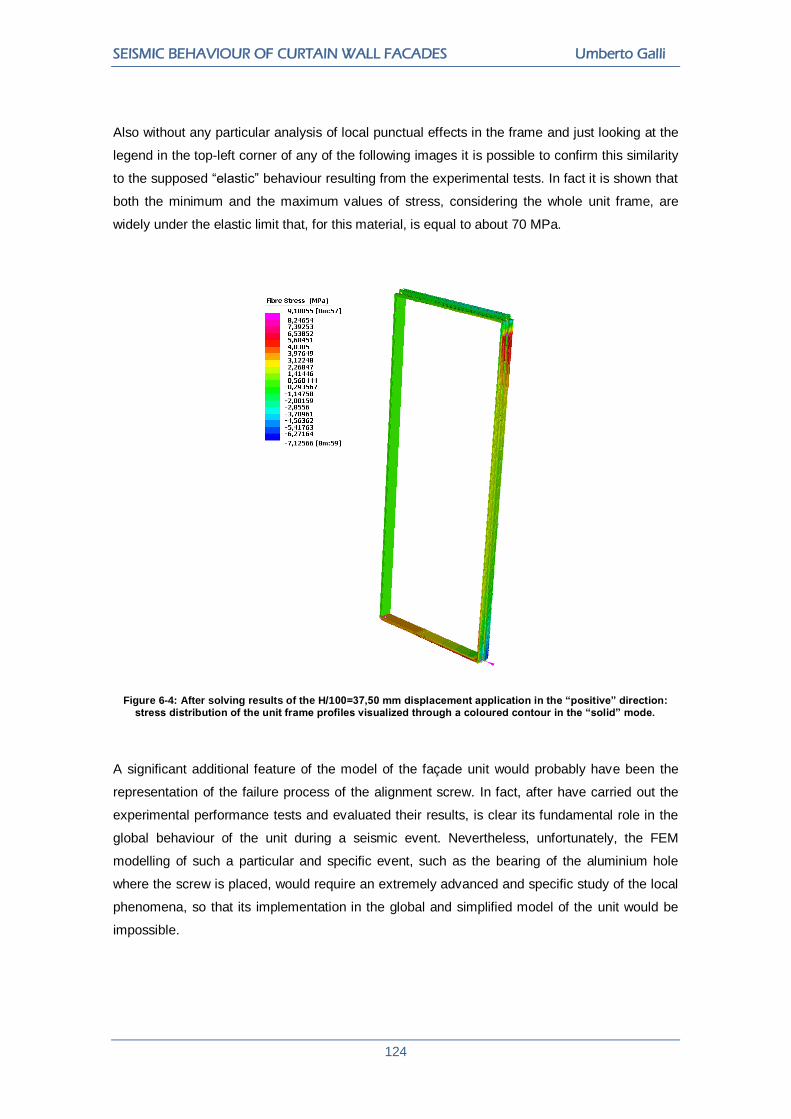
SEISMIC BEHAVIOUR OF CURTAIN WALL FACADES Umberto Galli
124
Also without any particular analysis of local punctual effects in the frame and just looking at the
legend in the top-left corner of any of the following images it is possible to confirm this similarity
to the supposed “elastic” behaviour resulting from the experimental tests. In fact it is shown that
both the minimum and the maximum values of stress, considering the whole unit frame, are
widely under the elastic limit that, for this material, is equal to about 70 MPa.
Figure 6-4: After solving results of the H/100=37,50 mm displacement application in the “positive” direction: stress distribution of the unit frame profiles visualized through a coloured contour in the “solid” mode.
A significant additional feature of the model of the façade unit would probably have been the
representation of the failure process of the alignment screw. In fact, after have carried out the
experimental performance tests and evaluated their results, is clear its fundamental role in the
global behaviour of the unit during a seismic event. Nevertheless, unfortunately, the FEM
modelling of such a particular and specific event, such as the bearing of the aluminium hole
where the screw is placed, would require an extremely advanced and specific study of the local
phenomena, so that its implementation in the global and simplified model of the unit would be
impossible.
CHAPTER 6 RESULTS COMPARISON
125
Anyway, the real aim of the FEM model is to describe the façade behaviour in the previous
phase of translation, rotation and deformation of its units and components. In fact this is the
most hazardous moment for the integrity of the façade and all its components. After the bearing
of the aluminium hole caused by the alignment screw the façade starts simply to translate
without any particular rotation or deformation of the units, and so without any more risk for glass
breakage or even fallout from the frame.
On the contrary, granted that for the worst seismic event and grade of the Japan regulation
JASS14 the façade simply translates horizontally after the just described bearing phenomena,
an important feature of the model becomes instead the lack of presence of this failure
mechanism. In fact the so structured model continues to simulate and calculate the rotational
and deformational behaviour of the unit also for the worst (even greater values, if required)
displacement applied, equal to 37,50 mm. As a consequence is hence possible to investigate
the stress and strain distribution or the displacement and rotational movements of the façade
unit for the worst condition required.

SEISMIC BEHAVIOUR OF CURTAIN WALL FACADES Umberto Galli
126
CHAPTER 7
OTHER MODELS
During the FEM modelling of the main case of study presented, where a comparison between
the FEM model and the experimental performance tests has been proposed and described,
other two additional examples of modelling have been evaluated. These are always real
projects of façade: one has been already produced and it is in the installation phase. The other
is still in the design and development phase, before the final installation. The aim of other two
additional modelling examples is to evaluate the modelling issue of different types of curtain wall
unitized and panellized system façade, mainly from the glass retaining method point of view. In
fact, differing from the Manchester Metropolitan University case of study, these other two
facades are characterized by a pressure plate retaining system of the glass, instead of the
described and analysed structural silicon joint. As a direct consequence the issue and the
critical points of the behaviour of this kind of façade will be obviously different, besides the
problem will anyway be the hazard given by the glass potential rupture and consequent fallout
from the frame.
7.1 Facade unit typology description:
Both the projects are characterized by a unitized and panellized system for the realization of a
double-skin facade. The external skin is different for the two considered cases, either for the
function or for the technology system and materials utilized, but anyway its consideration is not
significant, since that in both projects it is directly linked to the building structure without
influencing the façade and internal skin mechanical behaviour.
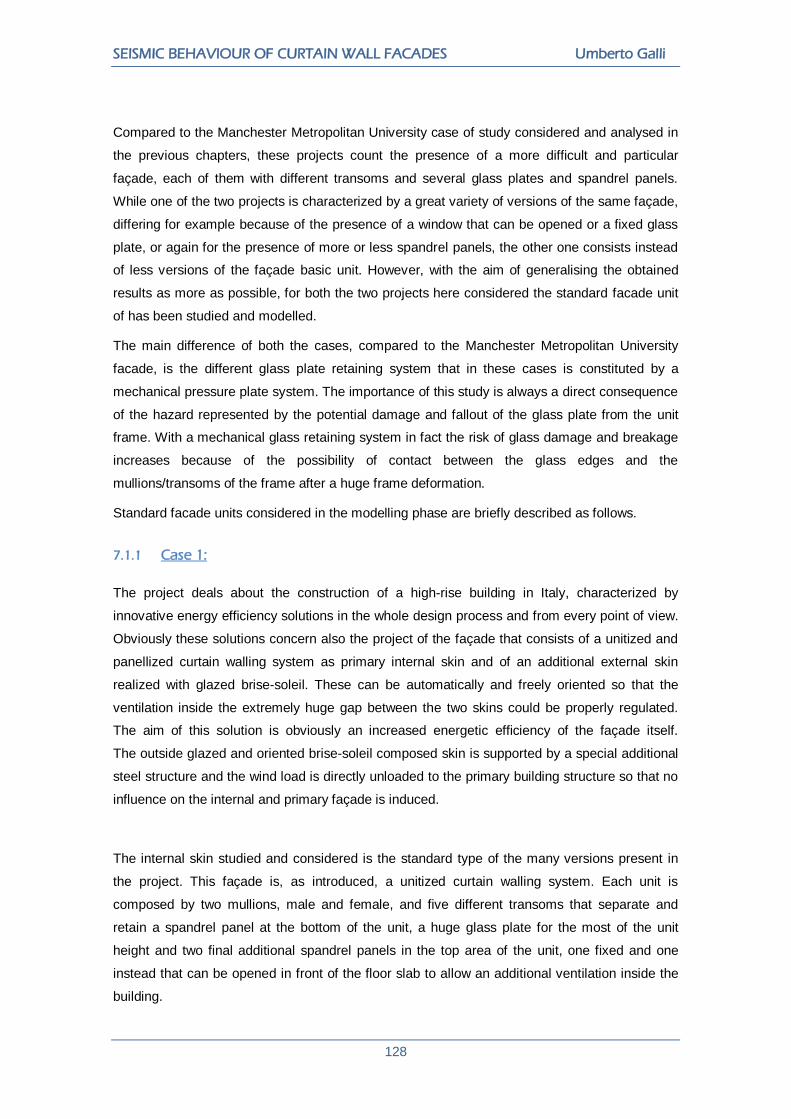
SEISMIC BEHAVIOUR OF CURTAIN WALL FACADES Umberto Galli
128
Compared to the Manchester Metropolitan University case of study considered and analysed in
the previous chapters, these projects count the presence of a more difficult and particular
façade, each of them with different transoms and several glass plates and spandrel panels.
While one of the two projects is characterized by a great variety of versions of the same façade,
differing for example because of the presence of a window that can be opened or a fixed glass
plate, or again for the presence of more or less spandrel panels, the other one consists instead
of less versions of the façade basic unit. However, with the aim of generalising the obtained
results as more as possible, for both the two projects here considered the standard facade unit
of has been studied and modelled.
The main difference of both the cases, compared to the Manchester Metropolitan University
facade, is the different glass plate retaining system that in these cases is constituted by a
mechanical pressure plate system. The importance of this study is always a direct consequence
of the hazard represented by the potential damage and fallout of the glass plate from the unit
frame. With a mechanical glass retaining system in fact the risk of glass damage and breakage
increases because of the possibility of contact between the glass edges and the
mullions/transoms of the frame after a huge frame deformation.
Standard facade units considered in the modelling phase are briefly described as follows.
7.1.1 Case 1:
The project deals about the construction of a high-rise building in Italy, characterized by
innovative energy efficiency solutions in the whole design process and from every point of view.
Obviously these solutions concern also the project of the façade that consists of a unitized and
panellized curtain walling system as primary internal skin and of an additional external skin
realized with glazed brise-soleil. These can be automatically and freely oriented so that the
ventilation inside the extremely huge gap between the two skins could be properly regulated.
The aim of this solution is obviously an increased energetic efficiency of the façade itself.
The outside glazed and oriented brise-soleil composed skin is supported by a special additional
steel structure and the wind load is directly unloaded to the primary building structure so that no
influence on the internal and primary façade is induced.
The internal skin studied and considered is the standard type of the many versions present in
the project. This façade is, as introduced, a unitized curtain walling system. Each unit is
composed by two mullions, male and female, and five different transoms that separate and
retain a spandrel panel at the bottom of the unit, a huge glass plate for the most of the unit
height and two final additional spandrel panels in the top area of the unit, one fixed and one
instead that can be opened in front of the floor slab to allow an additional ventilation inside the
building.

CHAPTER 7 OTHER MODELS
129
The three spandrel panels are essentially made of insulation material, very light and with low
mechanical properties, so that their contribution to the facade unit behaviour during a seismic
event can be left out.
The glass plate is an insulated glass unit, or “IGU”, composed by an external annealed glass
plate with a thickness equal to 10 mm, a 12 mm wide gap and a laminated internal glass,
composed by two annealed 8 mm thick plates and an intermediate Polyvinylbutyral (PVB) layer
with a thickness equal to 0,76 mm. The dimensions of the façade unit are 1500 X 3664 mm and
the IGU measures instead 1396 X 2376 mm. Consequently is possible to underline the huge
dimensions of the glass plate present in this case.
The constraint scheme of the façade is the same of the already described Manchester
Metropolitan University case of study (Chapter 3) and it is also in common with the other
project, the Case 2, described in the following section.
7.1.2 Case 2:
In this second case of study, unlike the previous described Case 1, the project deals about the
construction of a medium-rise building placed in Spain. The façade consists of a unitized and
panellized curtain wall, still characterized by an external provision of a brise-soleil for the solar
shielding of the building, but this time not glazed and neither able to be oriented. They are made
of ceramic material and fixed to a secondary mullion structure that supports the whole weight
and that is directly linked to the main building structure avoiding any influence on the facade
behaviour.
Similarly to the previous described Case 1, the internal skin studied and considered is again the
standard type of the various versions present in the project. Each unit of the façade, sizing 2600
X 3800 mm respectively width and height, is composed by aluminium extruded profiles, among
which two mullions, male and female, and five different transoms that separate and retain a
spandrel panel at the top of the unit and three glass plates beneath, each one of different
dimensions.
Again, the top spandrel panel is essentially made of insulation material, very light and with low
mechanical properties, so that its contribution to the unit behaviour during a seismic event can
be left out.
Glass plates are all insulated glass unit, or “IGU”, composed by an external annealed plate with
a thickness equal to 10 mm, a 12 mm wide gap and a laminated internal glass, composed by
two annealed 6 mm thick plates and an intermediate Polyvinylbutyral layer with a thickness
equal to 0,76 mm.
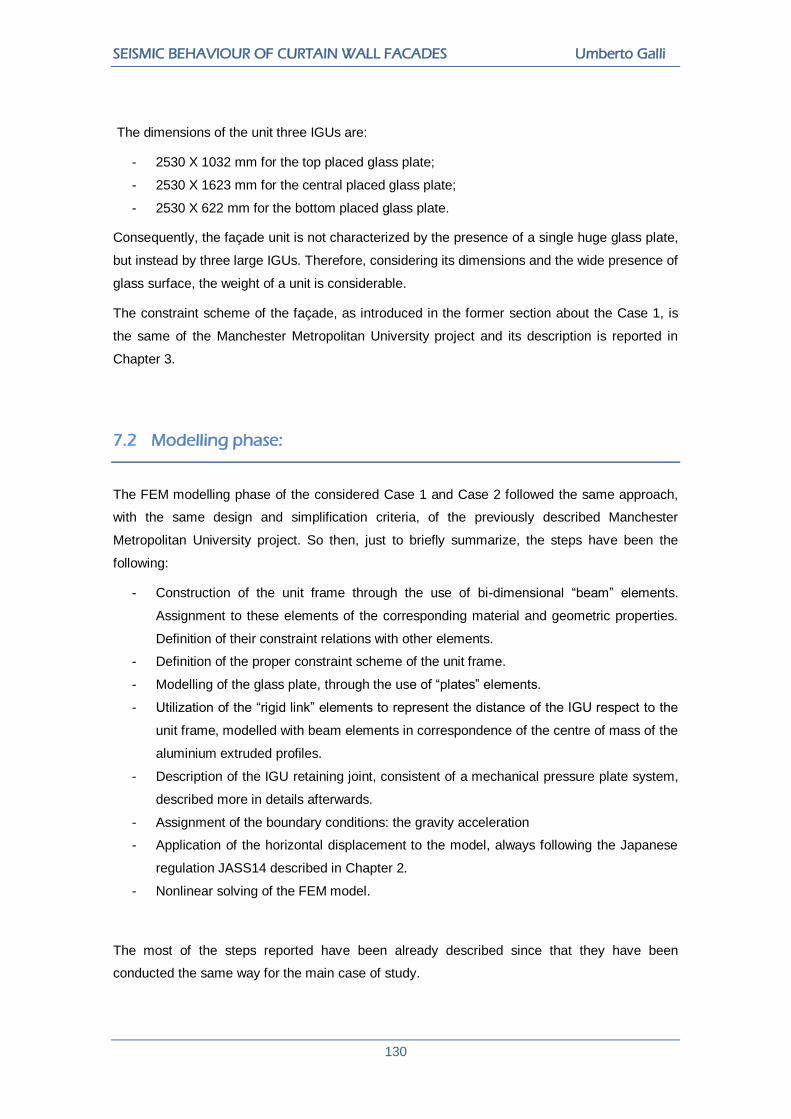
SEISMIC BEHAVIOUR OF CURTAIN WALL FACADES Umberto Galli
130
The dimensions of the unit three IGUs are:
- 2530 X 1032 mm for the top placed glass plate;
- 2530 X 1623 mm for the central placed glass plate;
- 2530 X 622 mm for the bottom placed glass plate.
Consequently, the façade unit is not characterized by the presence of a single huge glass plate,
but instead by three large IGUs. Therefore, considering its dimensions and the wide presence of
glass surface, the weight of a unit is considerable.
The constraint scheme of the façade, as introduced in the former section about the Case 1, is
the same of the Manchester Metropolitan University project and its description is reported in
Chapter 3.
7.2 Modelling phase:
The FEM modelling phase of the considered Case 1 and Case 2 followed the same approach,
with the same design and simplification criteria, of the previously described Manchester
Metropolitan University project. So then, just to briefly summarize, the steps have been the
following:
- Construction of the unit frame through the use of bi-dimensional “beam” elements.
Assignment to these elements of the corresponding material and geometric properties.
Definition of their constraint relations with other elements.
- Definition of the proper constraint scheme of the unit frame.
- Modelling of the glass plate, through the use of “plates” elements.
- Utilization of the “rigid link” elements to represent the distance of the IGU respect to the
unit frame, modelled with beam elements in correspondence of the centre of mass of the
aluminium extruded profiles.
- Description of the IGU retaining joint, consistent of a mechanical pressure plate system,
described more in details afterwards.
- Assignment of the boundary conditions: the gravity acceleration
- Application of the horizontal displacement to the model, always following the Japanese
regulation JASS14 described in Chapter 2.
- Nonlinear solving of the FEM model.
The most of the steps reported have been already described since that they have been
conducted the same way for the main case of study.

CHAPTER 7 OTHER MODELS
131
The following images show the complete FEM model resulting from the carrying out of the
previously listed steps, both for Case 1 and Case 2. In particular, as already done in Chapter 5,
a parallel representation in the “line” and “solid” visualization modes is provided.
Figure 7-1: Global view of the “Case 1” FEM model: “line” visualisation mode (left) and “solid” visualisation
mode (right).
Figure 7-2: Global view of the “Case 2” FEM model: “line” visualisation mode (left) and “solid” visualisation
mode (right).
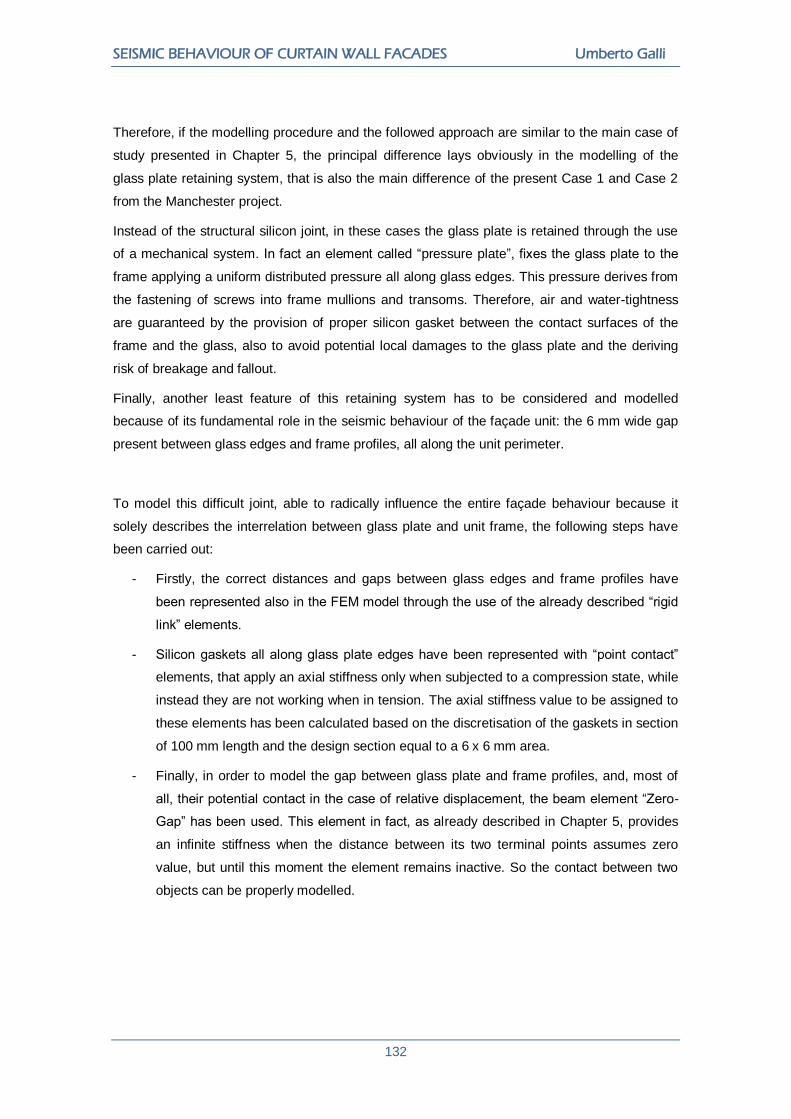
SEISMIC BEHAVIOUR OF CURTAIN WALL FACADES Umberto Galli
132
Therefore, if the modelling procedure and the followed approach are similar to the main case of
study presented in Chapter 5, the principal difference lays obviously in the modelling of the
glass plate retaining system, that is also the main difference of the present Case 1 and Case 2
from the Manchester project.
Instead of the structural silicon joint, in these cases the glass plate is retained through the use
of a mechanical system. In fact an element called “pressure plate”, fixes the glass plate to the
frame applying a uniform distributed pressure all along glass edges. This pressure derives from
the fastening of screws into frame mullions and transoms. Therefore, air and water-tightness
are guaranteed by the provision of proper silicon gasket between the contact surfaces of the
frame and the glass, also to avoid potential local damages to the glass plate and the deriving
risk of breakage and fallout.
Finally, another least feature of this retaining system has to be considered and modelled
because of its fundamental role in the seismic behaviour of the façade unit: the 6 mm wide gap
present between glass edges and frame profiles, all along the unit perimeter.
To model this difficult joint, able to radically influence the entire façade behaviour because it
solely describes the interrelation between glass plate and unit frame, the following steps have
been carried out:
- Firstly, the correct distances and gaps between glass edges and frame profiles have
been represented also in the FEM model through the use of the already described “rigid
link” elements.
- Silicon gaskets all along glass plate edges have been represented with “point contact”
elements, that apply an axial stiffness only when subjected to a compression state, while
instead they are not working when in tension. The axial stiffness value to be assigned to
these elements has been calculated based on the discretisation of the gaskets in section
of 100 mm length and the design section equal to a 6 x 6 mm area.
- Finally, in order to model the gap between glass plate and frame profiles, and, most of
all, their potential contact in the case of relative displacement, the beam element “Zero-
Gap” has been used. This element in fact, as already described in Chapter 5, provides
an infinite stiffness when the distance between its two terminal points assumes zero
value, but until this moment the element remains inactive. So the contact between two
objects can be properly modelled.

CHAPTER 7 OTHER MODELS
133
Leaving out the previous steps of modelling, the following pictures are focused on the detailed
view of the just described retaining joint between frame and glass.
Figure 7-3: Detailed view of the top right corner of the glass plate and the means of “rigid link” elements, blue coloured, to link it to the frame (referred to Case 1).
Figure 7-2: Global view of the “Case 2” FEM model: “line” visualisation mode (left) and “solid”
visualisation mode (right).Figure 7-2 offers a global view, in both the “line” and “solid”
visualisation mode, of the façade unit as modelled in Straus7. In these images, and more
particularly in the following Figure 7-3, it is possible to recognise the multitude of element,
especially “rigid link” elements, utilized to discretize and represent the retaining joint between
the glass plate and the unit frame profiles. A detailed view of the series of assembled elements
utilized for the modelling of the retaining joint is shown in the following Figure 7-4.

SEISMIC BEHAVIOUR OF CURTAIN WALL FACADES Umberto Galli
134
Figure 7-4: Detailed view of the means “rigid link” (blue), “spring-damper” (light-blue) and “zero-gap” (red) elements for the retaining joint modelling (referred to Case 2).
More specifically it is possible to notice how the group of elements, repeated thousands of times
all along the glass plate edges for a finer discretisation of the border joint, differs alternatively
one from each other because of two of the three present beam elements that link the glass plate
to the structure, constituted by the blue coloured “rigid link”.
In fact, as viewable in the following two detailed images of the so structured joint definition, the
two out-of-plane beam elements linked to the glass plate are in a first case red coloured and in
a second case blue coloured.

CHAPTER 7 OTHER MODELS
135
Figure 7-5: Detailed view of one of the two alternating retaining joint modelling solutions. This picture represents the one with both “spring-damper” (out-of-plane) and “zero-gap” (in-plane) elements provided
(referred to Case 2).
Figure 7-6: Detailed view of the other one retaining joint modelling solutions. This time the one, consistent only of “zero-gap” (in-plane and out-of-plane) elements, is provided (referred to Case 2).
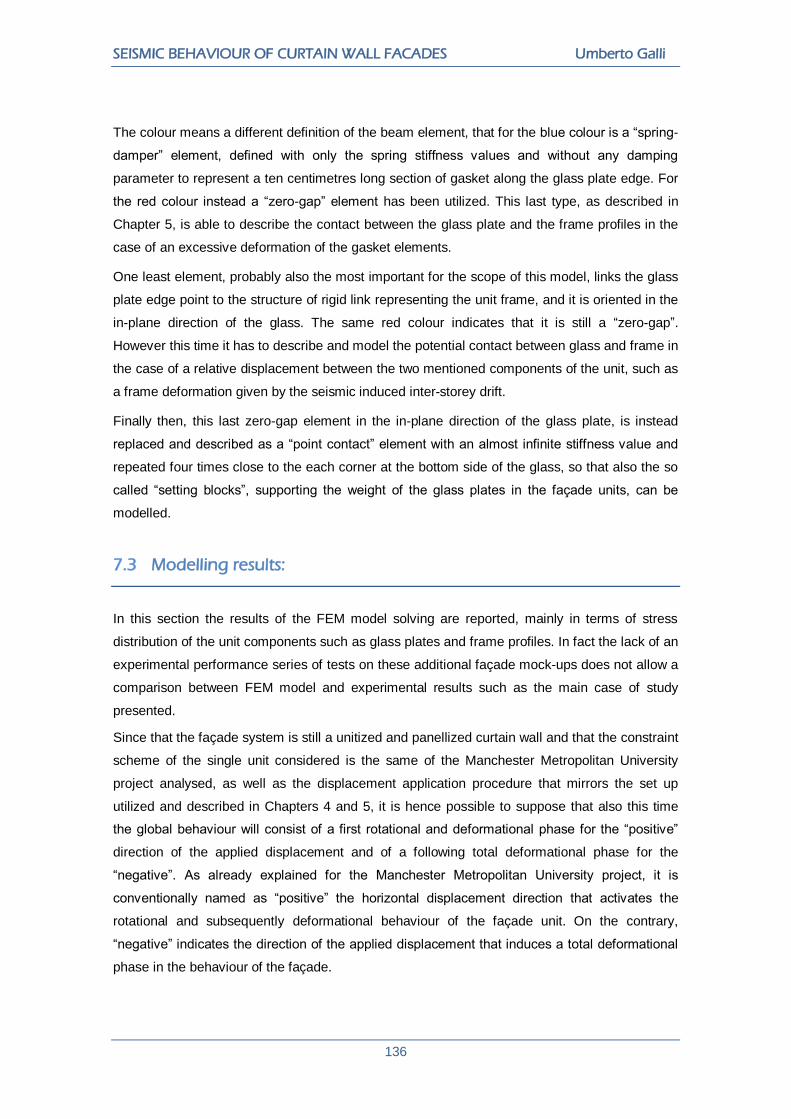
SEISMIC BEHAVIOUR OF CURTAIN WALL FACADES Umberto Galli
136
The colour means a different definition of the beam element, that for the blue colour is a “spring-
damper” element, defined with only the spring stiffness values and without any damping
parameter to represent a ten centimetres long section of gasket along the glass plate edge. For
the red colour instead a “zero-gap” element has been utilized. This last type, as described in
Chapter 5, is able to describe the contact between the glass plate and the frame profiles in the
case of an excessive deformation of the gasket elements.
One least element, probably also the most important for the scope of this model, links the glass
plate edge point to the structure of rigid link representing the unit frame, and it is oriented in the
in-plane direction of the glass. The same red colour indicates that it is still a “zero-gap”.
However this time it has to describe and model the potential contact between glass and frame in
the case of a relative displacement between the two mentioned components of the unit, such as
a frame deformation given by the seismic induced inter-storey drift.
Finally then, this last zero-gap element in the in-plane direction of the glass plate, is instead
replaced and described as a “point contact” element with an almost infinite stiffness value and
repeated four times close to the each corner at the bottom side of the glass, so that also the so
called “setting blocks”, supporting the weight of the glass plates in the façade units, can be
modelled.
7.3 Modelling results:
In this section the results of the FEM model solving are reported, mainly in terms of stress
distribution of the unit components such as glass plates and frame profiles. In fact the lack of an
experimental performance series of tests on these additional façade mock-ups does not allow a
comparison between FEM model and experimental results such as the main case of study
presented.
Since that the façade system is still a unitized and panellized curtain wall and that the constraint
scheme of the single unit considered is the same of the Manchester Metropolitan University
project analysed, as well as the displacement application procedure that mirrors the set up
utilized and described in Chapters 4 and 5, it is hence possible to suppose that also this time
the global behaviour will consist of a first rotational and deformational phase for the “positive”
direction of the applied displacement and of a following total deformational phase for the
“negative”. As already explained for the Manchester Metropolitan University project, it is
conventionally named as “positive” the horizontal displacement direction that activates the
rotational and subsequently deformational behaviour of the façade unit. On the contrary,
“negative” indicates the direction of the applied displacement that induces a total deformational
phase in the behaviour of the façade.
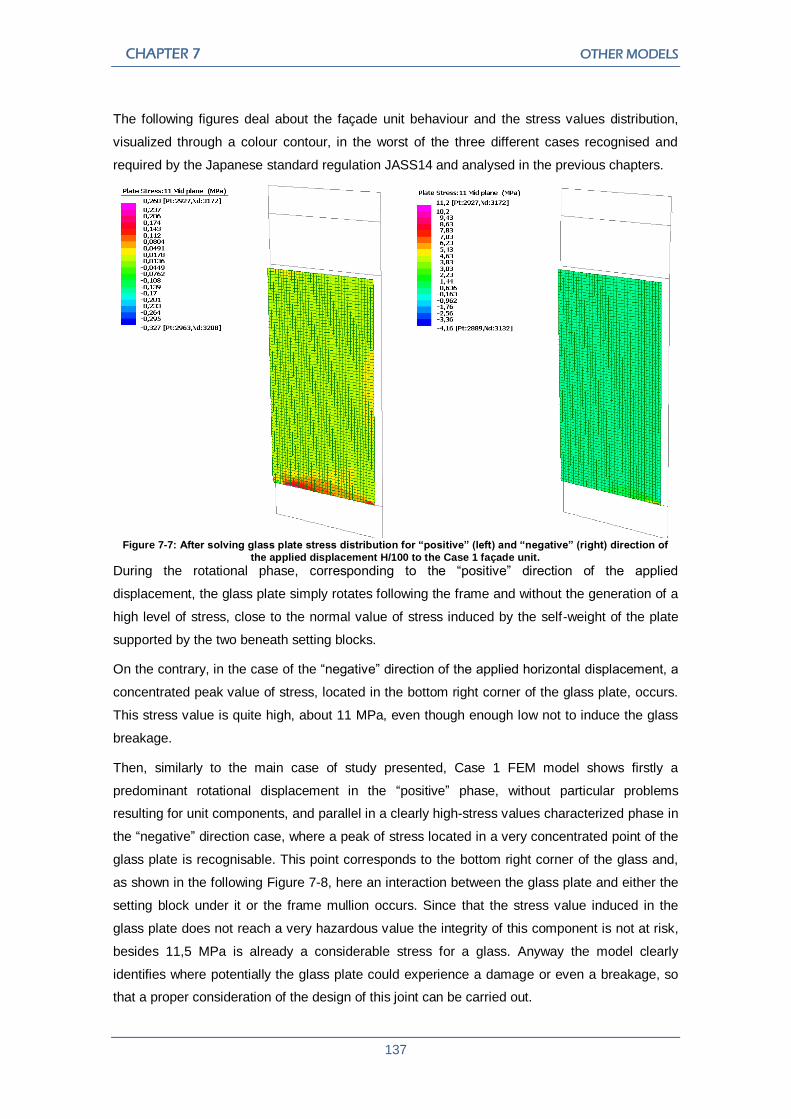
CHAPTER 7 OTHER MODELS
137
The following figures deal about the façade unit behaviour and the stress values distribution,
visualized through a colour contour, in the worst of the three different cases recognised and
required by the Japanese standard regulation JASS14 and analysed in the previous chapters.
Figure 7-7: After solving glass plate stress distribution for “positive” (left) and “negative” (right) direction of
the applied displacement H/100 to the Case 1 façade unit.
During the rotational phase, corresponding to the “positive” direction of the applied
displacement, the glass plate simply rotates following the frame and without the generation of a
high level of stress, close to the normal value of stress induced by the self-weight of the plate
supported by the two beneath setting blocks.
On the contrary, in the case of the “negative” direction of the applied horizontal displacement, a
concentrated peak value of stress, located in the bottom right corner of the glass plate, occurs.
This stress value is quite high, about 11 MPa, even though enough low not to induce the glass
breakage.
Then, similarly to the main case of study presented, Case 1 FEM model shows firstly a
predominant rotational displacement in the “positive” phase, without particular problems
resulting for unit components, and parallel in a clearly high-stress values characterized phase in
the “negative” direction case, where a peak of stress located in a very concentrated point of the
glass plate is recognisable. This point corresponds to the bottom right corner of the glass and,
as shown in the following Figure 7-8, here an interaction between the glass plate and either the
setting block under it or the frame mullion occurs. Since that the stress value induced in the
glass plate does not reach a very hazardous value the integrity of this component is not at risk,
besides 11,5 MPa is already a considerable stress for a glass. Anyway the model clearly
identifies where potentially the glass plate could experience a damage or even a breakage, so
that a proper consideration of the design of this joint can be carried out.

SEISMIC BEHAVIOUR OF CURTAIN WALL FACADES Umberto Galli
138
Figure 7-8: Detailed view of the corner stress concentration of the Case 1 glass plate in the “negative” H/100 condition.
Considering now the unit frame behaviour under the same applied displacement H/100, in both
the “positive” and the “negative” direction of load, the following results in terms of stress
distribution have been obtained after the solving of the FEM model.
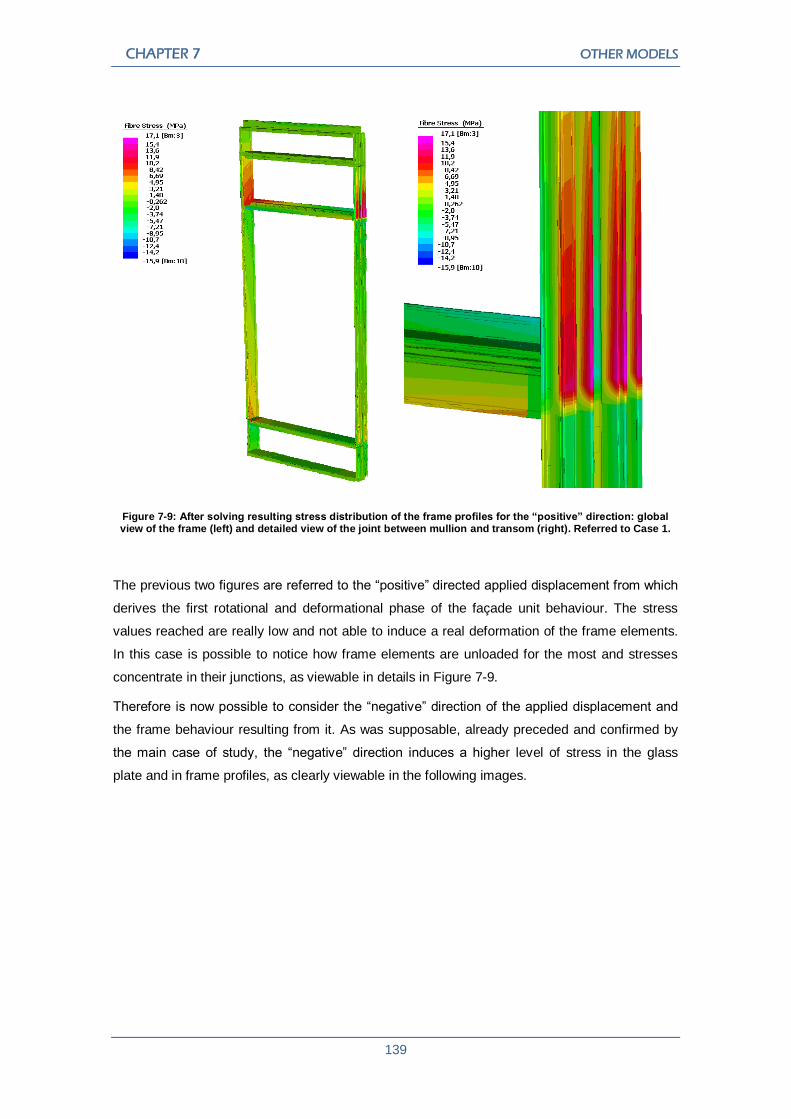
CHAPTER 7 OTHER MODELS
139
Figure 7-9: After solving resulting stress distribution of the frame profiles for the “positive” direction: global view of the frame (left) and detailed view of the joint between mullion and transom (right). Referred to Case 1.
The previous two figures are referred to the “positive” directed applied displacement from which
derives the first rotational and deformational phase of the façade unit behaviour. The stress
values reached are really low and not able to induce a real deformation of the frame elements.
In this case is possible to notice how frame elements are unloaded for the most and stresses
concentrate in their junctions, as viewable in details in Figure 7-9.
Therefore is now possible to consider the “negative” direction of the applied displacement and
the frame behaviour resulting from it. As was supposable, already preceded and confirmed by
the main case of study, the “negative” direction induces a higher level of stress in the glass
plate and in frame profiles, as clearly viewable in the following images.
SEISMIC BEHAVIOUR OF CURTAIN WALL FACADES Umberto Galli
140
Figure 7-10: After solving resulting stress distribution of the frame profiles for the “negative” direction: global view of the frame (left) and detailed view of the joint between mullion and transom (right). Referred to Case 1.
If the resulting stress distribution in the profiles is globally similar to the one resulting from the
“positive” direction of the applied displacement, since that every element is uniformly low-
stressed while peak values are reached in correspondence of the junctions between transoms
and mullions, on the contrary its minimum and maximum values are really increased. An
increment of the stress values in frame profiles was obviously expectable, as forecasted by the
main case of study Manchester Metropolitan University project FEM model. Anyway this time
extremely high peak values of stress are reached, greater also than the aluminium yielding limit.
As a consequence of the FEM analysis here carried out it is supposable that the conduction of a
complete seismic performance mock-up test on Case 1 façade, as required by Japanese
regulation JASS14 and deeply described in Chapter 4, would result in a plastic deformation of
the frame profiles, concentrated and localized in the junctions between mullions and transoms,
and in the generation of considerable stress values at the bottom corners of the glass plate.
Considering the localization in a restricted and weaker area of the glass, such as the corner,
and the conservative approach of the FEM model, necessarily structured without the
consideration of friction contribute, this stress concentration could cause damages to the glass
plate and threaten its integrity.
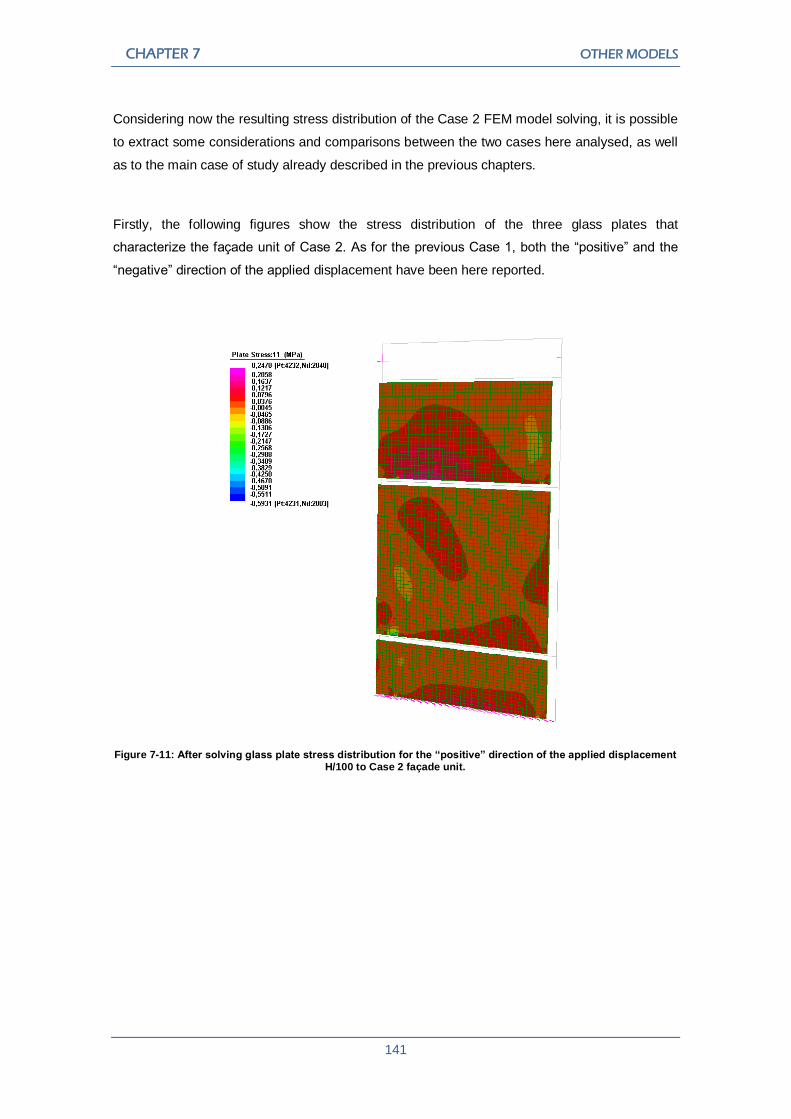
CHAPTER 7 OTHER MODELS
141
Considering now the resulting stress distribution of the Case 2 FEM model solving, it is possible
to extract some considerations and comparisons between the two cases here analysed, as well
as to the main case of study already described in the previous chapters.
Firstly, the following figures show the stress distribution of the three glass plates that
characterize the façade unit of Case 2. As for the previous Case 1, both the “positive” and the
“negative” direction of the applied displacement have been here reported.
Figure 7-11: After solving glass plate stress distribution for the “positive” direction of the applied displacement H/100 to Case 2 façade unit.

SEISMIC BEHAVIOUR OF CURTAIN WALL FACADES Umberto Galli
142
Figure 7-12: After solving glass plate stress distribution for the “negative” direction of the applied displacement H/100 to Case 2 façade unit.
The “positive” direction of the horizontal applied displacement, corresponding to the H/100
grade of the JASS14, generates in the glass plates of the façade unit, similarly to the other
analysed cases of study, a stress distribution characterized by low maximum and minimum
values, a global uniform distribution in the plates and peak values localized in very concentrated
areas, again close to elements corners.
So then, again, evaluating the model displacements through the after solving results of the
“positive” direction applied, it is possible to confirm that this case of load is characterized by a
rotational and only few deformational phase, with the stress distribution viewable in Figure 7-11.
Considering now the stress distribution of the glass plates given by the “negative” direction of
the applied horizontal displacement, viewable from Figure 7-12, as expected there is an
increase of the peak stress values. These are still placed in the corners of the plates and reach
values not really hazardous for the integrity of the glass. Nevertheless the approach of the
model, that behaves more ideally due to the lack of friction contribute, imposes not to
underestimate the stress values induced to the glass plates, that with a more accurate
modelling could result higher.
Therefore, similarly to the previous Case 1, a particular attention during the design of the glass
and its constraint in correspondence of the corner has to be taken

CHAPTER 7 OTHER MODELS
143
For what concerning the frame stress distribution, the following figures show a general similarity
to the expected behaviour, resulting from the previous carried out FEM models, characterized
by low-stressed elements, peak values concentrated in the junctions between mullions and
transoms, a really low stress state in the “positive” direction of the applied displacement and,
simultaneously, a higher stress state in the “negative” one.
Figure 7-13: After solving resulting stress distribution of the frame profiles for the “positive” direction: global view of the frame. Referred to Case 2.
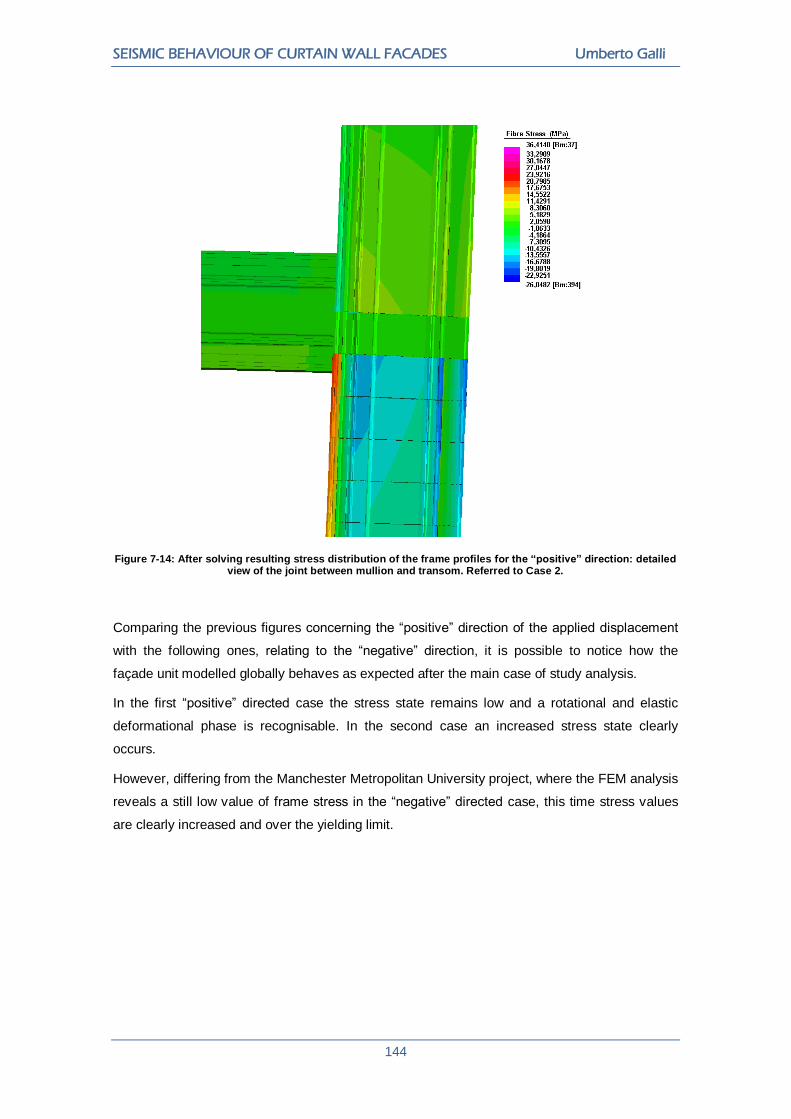
SEISMIC BEHAVIOUR OF CURTAIN WALL FACADES Umberto Galli
144
Figure 7-14: After solving resulting stress distribution of the frame profiles for the “positive” direction: detailed view of the joint between mullion and transom. Referred to Case 2.
Comparing the previous figures concerning the “positive” direction of the applied displacement
with the following ones, relating to the “negative” direction, it is possible to notice how the
façade unit modelled globally behaves as expected after the main case of study analysis.
In the first “positive” directed case the stress state remains low and a rotational and elastic
deformational phase is recognisable. In the second case an increased stress state clearly
occurs.
However, differing from the Manchester Metropolitan University project, where the FEM analysis
reveals a still low value of frame stress in the “negative” directed case, this time stress values
are clearly increased and over the yielding limit.

CHAPTER 7 OTHER MODELS
145
Figure 7-15: After solving resulting stress distribution of the frame profiles for the “negative” direction: global view of the frame. Referred to Case 2.
Figure 7-16: After solving resulting stress distribution of the frame profiles for the “negative” direction: detailed view of the joint between mullion and transom. Referred to Case 2.

SEISMIC BEHAVIOUR OF CURTAIN WALL FACADES Umberto Galli
146
CHAPTER 8
CONCLUSIONS
The described work and study carried out for the development of the present thesis has
primarily dealt about the comprehension of a curtain walling façade behaviour, more particularly
of a unitized and panellized system, subjected to a seismic action.
Two different approaches have been fundamentally utilized: the experimental performance
mock-up test, thanks to the use of Permasteelisa Group facility, and the theoretical FEM
modelling through the use of the FEM software Straus7. Consequently a comparison between
the results of the two different phases has been carried out, on one hand directly and
quantitatively in terms of displacements recorded during experimental tests and resulted from
the solving of the model, on the other hand in a qualitatively manner through global
consideration of the physical phenomena occurred during the experimental phase and, most of
all, through the study of the FEM model solving outputs, primarily the stress distribution of every
element.
As a result of the previous chapters some conclusions about the unitized and panellized system
façade during a seismic event have been reached and described. This chapter is aimed at
summarizing them for a final and global consideration about the carried out work and potential
future developments.
Since that, as introduced and described in the first chapter, the most serious hazard type of load
on a curtain walling unitized and panellized system façade is recognized to be the relative
displacement between two adjacent stories, the so called inter-story drift, in the following
Chapter 2, dealing about the comparison between the most important National Standards and
Regulations all over the world, the Japanese Standard JASS14 resulted to be the most
representative of the problem and the most feasible with the available facility means.
SEISMIC BEHAVIOUR OF CURTAIN WALL FACADES Umberto Galli
148
Due to external causes and reasons it has been impossible to directly and in person carry out a
complete performance mock-up test. However a previous mock-up test, actually carried out with
the original aim of evaluate the different behaviour of two types of structural silicon joints but
anyway conducted exactly referring to the JASS14 Standard requirements, was fortunately
available and its results, in terms of unit recorded displacements, have been utilized.
Parallel to the evaluation and consideration of these experimental test results, a FEM model has
been realized through the use of the FEM software Straus7, considering the most critical
features of the unitized system façade and trying to carefully and faithfully describe the
interaction between glass plate and unit frame, probably the most important factor to be
investigated. The FEM model solving results have been consequently compared with the
experimental ones and the following conclusions have been obtained.
Both the experimental performance series of test and the FEM model globally reveal an optimal
façade behaviour under the seismic action, considered through the application of a series of
horizontal in-plane and out-of-plane displacements.
Firstly, the experimental mock-up tests showed that the specific case of study considered, the
Manchester Metropolitan University project façade, is perfectly able to respect all the discussed
requirements of the JASS14 Standard. In fact the mock-up:
- remains totally serviceable after the first Grade 1=H/300, as it results from the air
leakage test carried out right before and after the application of the first series of
displacements;
- goes on with the same and increased amplitude rotational and deformational behaviour
during the second Grade 2=H/200, required for a high-intensity seismic event;
- during the last and hardest Grade 3=H/100, it starts in a first moment with the same
behaviour and after just one cycle it deactivates itself with the bearing phenomena of the
alignment screw to the transom of the unit. The consequent behaviour is an absolutely
safe sliding horizontal movement of the façade.
The FEM model solving showed a globally similar behaviour of the unit, correctly describing the
rotational and deformational behaviour of the façade during all the applied horizontal
displacements, in and out-of-plane oriented. The stress distribution resulting showed an obvious
different behaviour depending on the direction of the applied displacement:
- during the “positive” direction a mainly rotational and displacement-characterized
phase, with low values of stress in every component of the unit;
- during the “negative” phase, a mostly deformational behaviour characterized by
increased stress values, even though still in the elastic field.
CHAPTER 8 CONCLUSIONS
149
It must be underlined that the two additional models, Case 1 and Case 2, describing other two
real façades, with a different glass retaining system realized with a mechanical pressure plate,
showed the same global behaviour in both “positive” and “negative” phases.
Nevertheless definitely higher values of stress occur in the second phase, exceeding the
yielding stress value of the aluminium profiles but remaining under 10 MPa for what concerning
the glass plate.
However the FEM modelling results and their comparison with the experimental ones show that
the model remains excessively close to an ideal description of the façade behaviour, because
the lack of the friction contribute could not be left out. The values of stress obtained for each
component are therefore destined to increase with the consideration of this contribute.
Anyway the FEM model is a precious evaluating tool for the potential behaviour of façade under
applied loads, not only the seismic one. For example, thanks to the FEM model solving, it is
evident looking at the after solving stress distribution how stress concentrates in the joint
connections of the frame profiles and, most important, at the corner of the glass plate. As a
consequence of these results a proper design and specific investigations of these local points
can be carried out.
For the specific case of study characterized by the structural silicon joint, the three springs
description of this retaining system represents a good starting point for the model of a structural
silicon façade. In fact the FEM modelling is able to represent and describe the constraint of the
glass plate and to transmit stress value to it. Nevertheless the comparison with the experimental
results showed a clear difference between the model behaviour and the real one, potentially
due to the elastic numerical definition, in terms of stiffness values, of the springs defining the
silicon joint.
Finally the other two additional models, characterized by the mechanical retaining system, seem
to represent correctly this fundamental joint between glass plate and frame profiles, even
though must be underlined the lack of a direct comparison with a performance mock-up test.
After all these considerations is possible to state that a unitized and panellized system façade
potentially behaves in an optimal way under a seismic action applied. The term “potentially” is
mandatory because it must be necessarily underlined that only one case of study, a single
series of performance test, cannot prove in an exhaustive way and statistically represent the
unitized and panellized system seismic behaviour.
Nevertheless the results indicates that this type of curtain wall is able to behaves in an elastic
way in the first two Grade of the reference JASS14 Standard, corresponding to a low-to-
medium/high intensity seismic event, avoiding any kind of damage to its components and
remaining perfectly serviceable, as proved by the air leakage performance test after Grade 1
and by the total lack of visible and recorded residual deformation of the unit after Grade 2.
During Grade 3, corresponding to the worst seismic event predicted in the following 100 years,

SEISMIC BEHAVIOUR OF CURTAIN WALL FACADES Umberto Galli
150
the façade deactivates its typical “resisting” behaviour through the mentioned bearing
phenomena of screw of alignment and subsequently slides horizontally, avoiding any possible
damage to its components, included the glass plate elements.
As a consequence, this way the façade behaves not only in the safest way, but also in the best
way from a purely economic point of view. In fact for low-to-medium/high intensity seismic
events the façade resists and remains serviceable, does not require extraordinary repairs and
allows the operational continuity. For the highest and worst Grade 3, corresponding to an
extraordinary strong seismic event, the façade deactivates itself and limits to slide horizontally.
This is optimal because this way the maintenance intervention will be probably restricted just to
the re-alignment of the units and the substitution of the screws. Anyway a total substitution of
every single unit will not be necessary and the economic losses will surely be much lower.
CHAPTER 8 CONCLUSIONS
151
CHAPTER 9
FINAL CONSIDERATIONS AND
FUTURE DEVELOPMENTS
This work fits in a really wide and still poorly known research field, such as the seismic
behaviour of a façade non-structural element. Consequently even more unknown it is the
specific behaviour of a curtain walling unitized and panellized system façade during a seismic
event.
Of course this is only a very first step in the whole understanding process of this particular topic
and, most of all, represents a first attempt in the characterization and description through the
use of a FEM software, such as Straus7, of the façade response to a seismic action.
Nevertheless both the experimental campaign of performance tests carried out on the
presented case of study and its representation through the FEM modelling have revealed
important aspects of this topic. On one hand, in fact, the mock-up performance tests have
shown that the specific case studied is able to behave in a manner that totally satisfies the
specified requirements of the Japanese standard JASS14. On the other hand the FEM model of
the façade revealed critical points and local concentrations of stress in the unit components,
fundamental to design properly and consciously the façade with the aim of avoid any potential
damage to its components, first of all the glass plate.
Consequently, if on one hand the experimental mock-up tests are a fundamental evaluating tool
for the real façade behaviour, not replaceable by a FEM-based only design, and proved that the
unitized and panellized system, even though with a sole case of study not statistically
exhaustive, potentially behaves in an optimal way, on the other hand the FEM modelling
represents a very useful and complementary tool for the design of the façade, allowing to return
the output impossible to be obtained from the experimental tests: the stress distribution of every
single component.

CHAPTER 9 FINAL CONSIDERATIONS AND FUTURE
DEVELOPMENTS
153
With this in mind I think that, considering the mentioned potential consequences of the damage
or the collapse of a curtain walling façade, both in terms of life safety and economic losses, and
taken note that the knowledge of the matter is still really poor, there are still wide margins of
development for the experimental methods of testing, and, most of all, for a complete FEM
characterization of the problem.
All the three realized models, in fact, were greatly influenced by the lack of friction contribute so
that the resulting behaviour has been too close to an ideal characterization of the problem. The
insertion in the modelling also of this factor would surely return a more faithfully result on which
the design could be subsequently based. Finally, also the description of the structural silicon
joint, in the main case of study, has necessarily to be carried on and improved, probably with a
different definition of the spring elements utilized, that actually describe the silicon material only
in an elastic way.
In conclusion this could be considered as a first step in the complete definition of the seismic
behaviour of a unitized and panellized system curtain walling façade and, mainly, in its FEM
modelling, that surely represents an important and complementary tool for a proper seismic
design.

SEISMIC BEHAVIOUR OF CURTAIN WALL FACADES Umberto Galli
154
REFERENCES
[1] Public Law 95-124, 42 U.S.C. 7701, Eartquake Hazards Reduction Act of 1977, 1977.
[2] Earthquake Research Committee, National Seismic Hazard Maps for Japan, 2005.
[3] AAMA CW-DG-1-96, Aluminium Curtain Wall Design Guide Manual, AAMA,
Schaunburg, IL, USA, 1996
[4] AAMA TIR A11-04 Maximum Allowable Deflection of Framing Systems for Building
Cladding Components at Design Wind Load, AAMA, 2004
[5] AAMA 501-94, Methods of Test For Exterior Walls, AAMA, Schaunburg, IL, USA, 1994
[6] AAMA 501.6-01, Recommended Dynamic Test Method for Determining The Seismic
Drift Causing Glass Fallout From A Wall System, AAMA, Schaumburg, IL, USA, 2001
[7] AAMA 501.4-00, Recommended Static Test Method for Evaluating Curtain Wall and
Storefront Systems Subjected to Seismic and Wind Induced Interstory Drifts, AAMA,
Schaumburg, IL, USA, 2001
[8] AAMA 501.1-05, Standard Test Method for Exterior Windows, Curtain Walls and Doors
for Water Penetration Using Dynamic Pressur, AAMA, 2005
[9] AAMA 501.5-98, Test Method for Thermal Cycling of Exterior Walls, AAMA, 1998
[10] JASS14, Japanese Architectural Standard Specification Curtain Wall, AIJ, Architectural
Institute of Japan, 1996
[11] ARNOLD, C. (2009). Seismic safety of the building envelope.
[12] ASCE 7-05, Minimum design loads for buildings and other structures, ASCE, Reston,
VA, USA, 2006
[13] C 1401-02, Standard guide for structural sealant glazing, ASTM, West Conshohocken,
PA, USA, 2002
[14] W 1300-04, Standard practice for determining load resistance of glass in buildings,
ASTM, West Conshohocken, PA, USA, 2004
[15] ASTM E 283-04 Test Method for Determining Rate of Air Leakage Through Exterior
Windows, Curtain Walls, and Doors under Specified Pressure Differences Across the
Specimen, ASTM, 2004

SEISMIC BEHAVIOUR OF CURTAIN WALL FACADES Umberto Galli
156
[16] ASTM E 330-02 Test Method for Structural Performance of Exterior Windows, Doors,
Skylights, and Curtain Walls, and Doors by Uniform Static Air Pressure Difference,
ASTM, 2002
[17] ASTM E 331-00 Test Method for Water Penetration of Exterior Windows, Skylights,
Doors, and Curtain Walls, by Uniform Static Air Pressure Difference, ASTM, 2000
[18] BEHR, R. A, Architectural Glass to Resist Seismic and Extreme Climatic Events,
Cambridge, UK, Woodhead Publishing Limited, , 2009.
[19] BEHR, R. A, Seismic Performance of architectural glass in mid-rise curtain wall,
"Journal of architecture engineering", 1998.
[20] BEHR, R. A., BERLABI, A. and CULP, I.B., Dynamic Racking Test of Curtain Walls
Elements with Inter-plane and Out-of-plane Motions, "Earthquake Engineering and
Structural Dynamics", vol. 24, pp. 1-14, 1995.
[21] BEHR, R. A., BERLABI, A., , Seismic Test Methods for Architectural Glazing Systems,
"Earthquake Spectra", vol. 12, pp. 129-143, 1996.
[22] EN 12153, Curtain Walling – Air Permeability – Test Method, CEN, 2000
[23] PrEN 14019, Curtain Walling – Impact Resistance – Performance Requirements, CEN,
2000
[24] EN 12179, Curtain Walling – Resistance to Wind Load, CEN, 2000
[25] ENV 13050, Curtain Walling – Watertightness – Laboratory Test under Dynamic
Condition of Air Pressure and Water Spray, CEN, 2002
[26] EN 12155, Curtain Walling – Watertightness – Laboratory Test Under Static Pressure,
CEN, 2000
[27] EN 12154, Curtain Walling – Watertightness – Performance Requirements and
Classification, CEN, 2000
[28] UNI EN 1998-1, Eurocode 8: Design of structures for earthquake resistance - Part 1:
General rules, seismic actions and rules for buildings., CEN, 2005
[29] PrEN 12600, Glass in Building – Pendulum Test – Impact Test Method and
Classification for Flat Glass, CEN, 2002
[30] CWCT : 2nd Edition, Standard for curtain walling: Testing, CWCT, 1996
[31] CWCT : 2nd Edition, Test methods for Curtain Walling, CWCT, 1996
[32] FEMA 273, NEHRP Guidelines for The Seismic Rehabilitation of Buildings, FEMA,
Washington, D.C., 1997

REFERENCES
157
[33] FEMA 450, Recommended provisions for seismic regulations for new buildings and
other structures, FEMA, 2003
[34] BS 755-2:1997 Aluminium and Aluminium Alloys. Extruded rod/bar, tube and profiles.
Mechanical Properties, Group, BSI, 1997
[35] HAYES, G., WALD, D.,The 03/11/2011 Mw9.0 Tohoku, Japan earthquake,2011,U.S.
geological survey, National Information Center
[36] LE BOURHIS, E., Glass: Mechanics and Technology, Germany, Wiley-VCH, 2008.
[37] Ltd, STRAND7 Pty, Straus7 Theoretical Manual: Theoretical Background to the Straus7
finite element analysis system, 3 ed., Sydney, Australia, Strand7 Pty Ltd, 2010.
[38] Ltd, STRAND7 Pty, Using Straus7: Introduction to the Straus7 Finite Element Analysis
System, 3 ed., Sydney, Australia, Strand7 Pty Ltd, 2010.
[39] MEMARI, A.M., BEHR, R.A., and KREMER, P.A., Seismic behavior of curtain walls
containing insulating glass units, "Journal of architectural engineering", 2003.
[40] MEMARI, A.M., BEHR,R.A. and KREMER, P.A., Dynamic Racking Crescendo Test on
Architectural Glass Fitted with Anchored “PET” Film, "Journal of Architectural
Engineering", 2004.
[41] MEMARI, A.M., KREMER, P.A., and BEHR, R.A, Architectural glass panels with
rounded corners to mitigate earthquake damage, Pennsylvania, PA, USA, 2002.
[42] Recommended Provisions for Seismic Regulations for New Buildings and Other
Structures, Part 1 – Provisions, NEHRP, Washington DC, 2000
[43] Recommended Provisions for Seismic Regulations for New Buildings and Other
Structures, Part 2 – Provisions, NEHRP, Washington DC, 2000
[44] P.G., JOHNSON, Performance of Exterior Building Walls, Bridgeport, USA, ASTM
International, 2003.
[45] PANTELIDES, C.P., and BEHR, R.A., Dynamics In-plane Racking Test of Curtain Wall
Glass Elements, "Earthquake Engineering and Structural Dynamics", vol. 23, pp. 211-
228, 1994.
[46] U.S. Geological Survey, Documentation for The Southeast Asia Seismic Hazard Maps,
Virginia2007.
[47] PRIESTLEY, M.J.N., CALVI, G.M., and KOWALSKY, M.J., Displacement-based
seismic design of structures, Pavia, Fondazione EUCENTRE, 2007.
[48] BS 6206, Specification for impact performance requirements for flat safety glass and
safety plastics for use in buildings, STANDARD, BRITISH, 1981
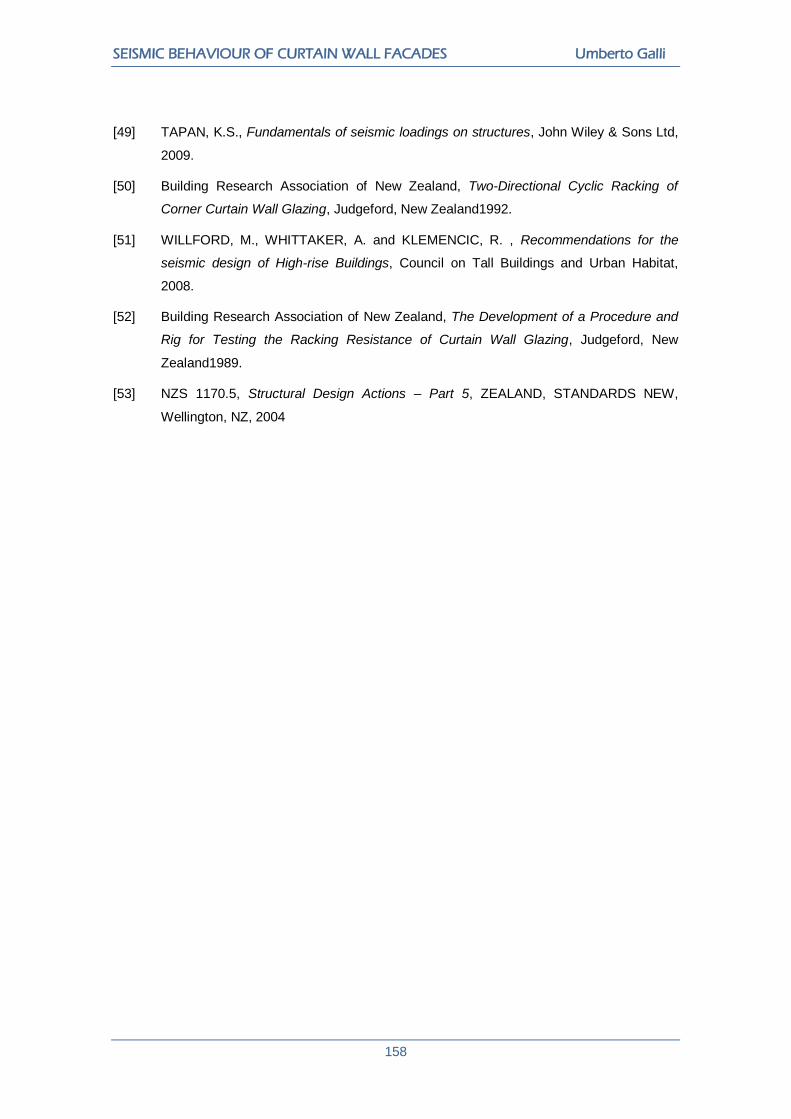
SEISMIC BEHAVIOUR OF CURTAIN WALL FACADES Umberto Galli
158
[49] TAPAN, K.S., Fundamentals of seismic loadings on structures, John Wiley & Sons Ltd,
2009.
[50] Building Research Association of New Zealand, Two-Directional Cyclic Racking of
Corner Curtain Wall Glazing, Judgeford, New Zealand1992.
[51] WILLFORD, M., WHITTAKER, A. and KLEMENCIC, R. , Recommendations for the
seismic design of High-rise Buildings, Council on Tall Buildings and Urban Habitat,
2008.
[52] Building Research Association of New Zealand, The Development of a Procedure and
Rig for Testing the Racking Resistance of Curtain Wall Glazing, Judgeford, New
Zealand1989.
[53] NZS 1170.5, Structural Design Actions – Part 5, ZEALAND, STANDARDS NEW,
Wellington, NZ, 2004
[3, 11-14, 19-21, 39-45, 47, 50, 52]

REFERENCES
159
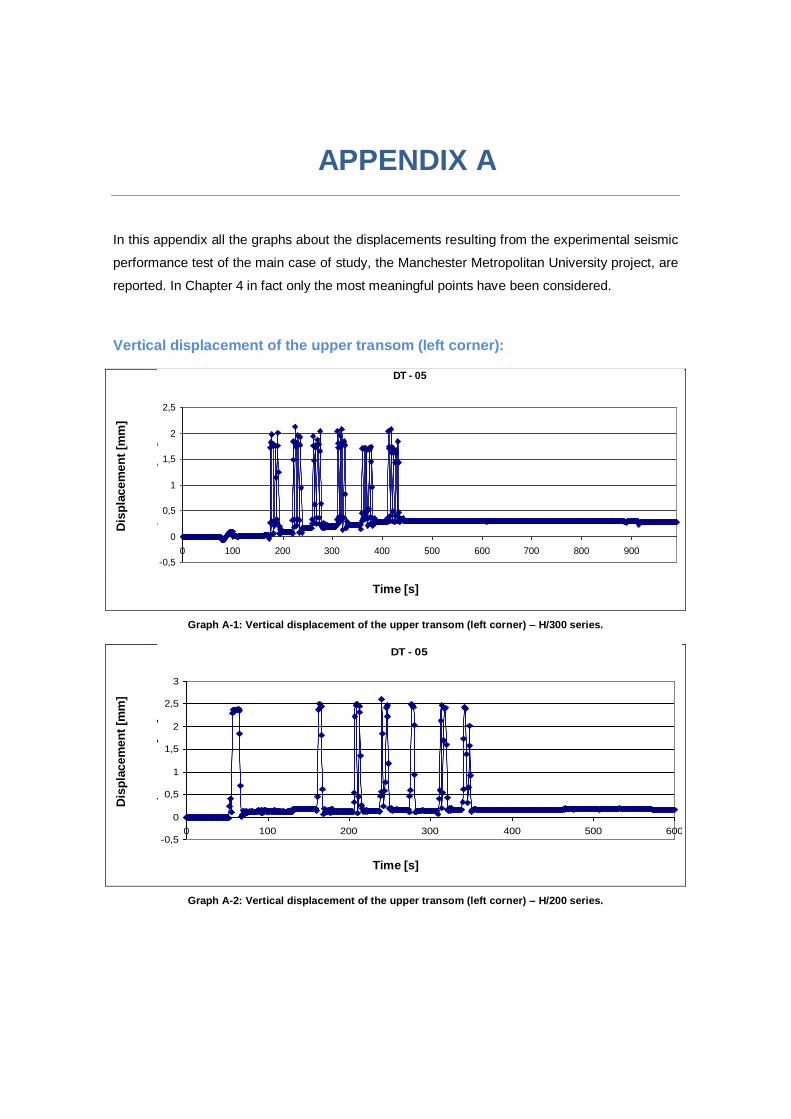
APPENDIX A
In this appendix all the graphs about the displacements resulting from the experimental seismic
performance test of the main case of study, the Manchester Metropolitan University project, are
reported. In Chapter 4 in fact only the most meaningful points have been considered.
Vertical displacement of the upper transom (left corner):
Dis
pla
cem
en
t [m
m]
Time [s]
Graph A-1: Vertical displacement of the upper transom (left corner) – H/300 series.
Dis
pla
cem
en
t [m
m]
Time [s]
Graph A-2: Vertical displacement of the upper transom (left corner) – H/200 series.
DT - 05
-0,5
0
0,5
1
1,5
2
2,5
0 100 200 300 400 500 600 700 800 900
Tempo [s]
Sp
osta
men
to [
mm
]
DT - 05
-0,5
0
0,5
1
1,5
2
2,5
3
0 100 200 300 400 500 600
Tempo [s]
Sp
osta
men
to [
mm
]

APPENDIX A
161
Dis
pla
cem
en
t [m
m]
Time [s]
Graph A-3: Vertical displacement of the upper transom (left corner) – H/100 series
Vertical displacement of the upper transom (right corner):
Dis
pla
cem
en
t [m
m]
Time [s]
Graph A-4: Vertical displacement of the upper transom (right corner) – H/300 series.
Dis
pla
cem
en
t [m
m]
Time [s]
Graph A-5: Vertical displacement of the upper transom (right corner) – H/200 series
DT - 05
-2
-1
0
1
2
3
4
5
6
7
8
0 200 400 600 800 1000
Tempo [s]
Sp
osta
men
to [
mm
]
DT - 04
-0,5
0
0,5
1
1,5
2
2,5
3
0 100 200 300 400 500 600 700 800 900
Tempo [s]
Sp
osta
men
to [
mm
]
DT - 04
-0,5
0
0,5
1
1,5
2
2,5
3
3,5
4
0 100 200 300 400 500 600
Tempo [s]
Sp
osta
men
to [
mm
]

SEISMIC BEHAVIOUR OF CURTAIN WALL FACADES Umberto Galli
162
Dis
pla
cem
en
t [m
m]
Time [s]
Graph A-6: Vertical displacement of the upper transom (right corner) – H/100 series
Vertical displacement of the lower transom (left corner):
Dis
pla
cem
en
t [m
m]
Time [s]
Graph A-7: Vertical displacement of the lower transom (left corner) – H/300 series.
Dis
pla
cem
en
t [m
m]
Time [s]
Graph A-8: Vertical displacement of the lower transom (left corner) – H/200 series.
DT - 04
-2
-1
0
1
2
3
4
5
6
7
8
0 200 400 600 800 1000
Tempo [s]
Sp
osta
men
to [
mm
]
DT - 02
-2,5
-2
-1,5
-1
-0,5
0
0,5
0 100 200 300 400 500 600 700 800 900
Tempo [s]
Sp
osta
men
to [
mm
]
DT - 02
-2,5
-2
-1,5
-1
-0,5
0
0,5
0 100 200 300 400 500 600
Tempo [s]
Sp
osta
men
to [
mm
]
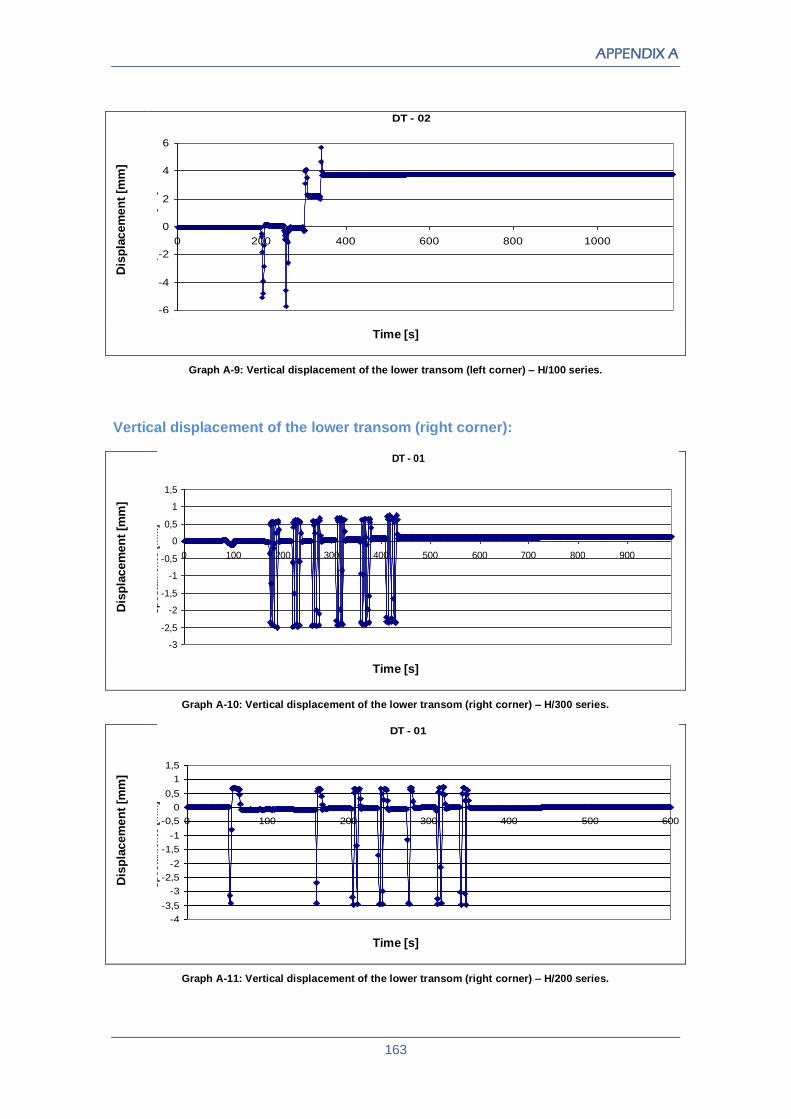
APPENDIX A
163
Dis
pla
cem
en
t [m
m]
Time [s]
Graph A-9: Vertical displacement of the lower transom (left corner) – H/100 series.
Vertical displacement of the lower transom (right corner):
Dis
pla
cem
en
t [m
m]
Time [s]
Graph A-10: Vertical displacement of the lower transom (right corner) – H/300 series.
Dis
pla
cem
en
t [m
m]
Time [s]
Graph A-11: Vertical displacement of the lower transom (right corner) – H/200 series.
DT - 02
-6
-4
-2
0
2
4
6
0 200 400 600 800 1000
Tempo [s]
Sp
osta
men
to [
mm
]
DT - 01
-3
-2,5
-2
-1,5
-1
-0,5
0
0,5
1
1,5
0 100 200 300 400 500 600 700 800 900
Tempo [s]
Sp
osta
men
to [
mm
]
DT - 01
-4
-3,5
-3
-2,5
-2
-1,5
-1
-0,5
0
0,5
1
1,5
0 100 200 300 400 500 600
Tempo [s]
Sp
osta
men
to [
mm
]

SEISMIC BEHAVIOUR OF CURTAIN WALL FACADES Umberto Galli
164
Dis
pla
cem
en
t [m
m]
Time [s]
Graph A-12: Vertical displacement of the lower transom (right corner) – H/100 series.
Horizontal displacement of the upper transom:
Dis
pla
cem
en
t [m
m]
Time [s]
Graph A-13: Horizontal displacement of the upper transom – H/300 series.
Dis
pla
cem
en
t [m
m]
Time [s]
Graph A-14: Horizontal displacement of the upper transom – H/200 series.
DT - 01
-8
-7
-6
-5
-4
-3
-2
-1
0
1
2
0 200 400 600 800 1000
Tempo [s]
Sp
osta
men
to [
mm
]
DT - 24
-20
-15
-10
-5
0
5
10
15
0 100 200 300 400 500 600 700 800 900
Tempo [s]
Sp
osta
men
to [
mm
]
DT - 24
-25
-20
-15
-10
-5
0
5
10
15
20
0 100 200 300 400 500 600
Tempo [s]
Sp
osta
men
to [
mm
]
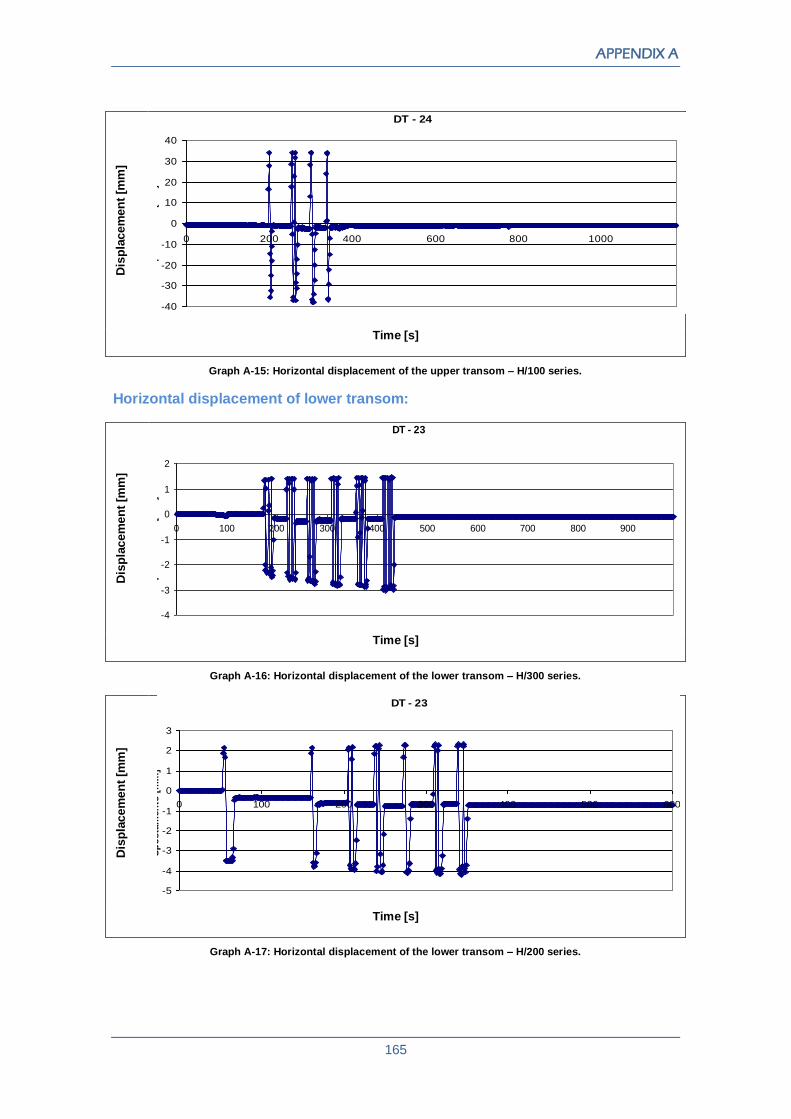
APPENDIX A
165
Dis
pla
cem
en
t [m
m]
Time [s]
Graph A-15: Horizontal displacement of the upper transom – H/100 series.
Horizontal displacement of lower transom:
Dis
pla
cem
en
t [m
m]
Time [s]
Graph A-16: Horizontal displacement of the lower transom – H/300 series.
Dis
pla
cem
en
t [m
m]
Time [s]
Graph A-17: Horizontal displacement of the lower transom – H/200 series.
DT - 24
-40
-30
-20
-10
0
10
20
30
40
0 200 400 600 800 1000
Tempo [s]
Sp
osta
men
to [
mm
]
DT - 23
-4
-3
-2
-1
0
1
2
0 100 200 300 400 500 600 700 800 900
Tempo [s]
Sp
osta
men
to [
mm
]
DT - 23
-5
-4
-3
-2
-1
0
1
2
3
0 100 200 300 400 500 600
Tempo [s]
Sp
osta
men
to [
mm
]
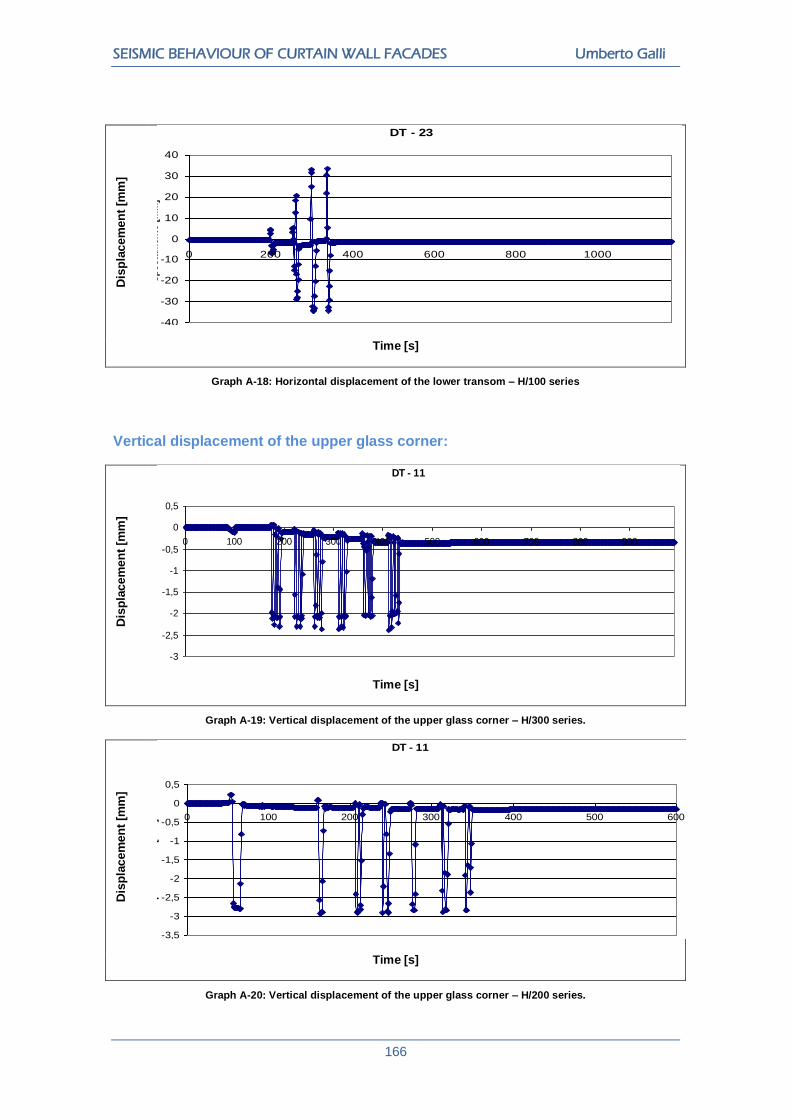
SEISMIC BEHAVIOUR OF CURTAIN WALL FACADES Umberto Galli
166
Dis
pla
cem
en
t [m
m]
Time [s]
Graph A-18: Horizontal displacement of the lower transom – H/100 series
Vertical displacement of the upper glass corner:
Dis
pla
cem
en
t [m
m]
Time [s]
Graph A-19: Vertical displacement of the upper glass corner – H/300 series.
Dis
pla
cem
en
t [m
m]
Time [s]
Graph A-20: Vertical displacement of the upper glass corner – H/200 series.
DT - 23
-40
-30
-20
-10
0
10
20
30
40
0 200 400 600 800 1000
Tempo [s]
Sp
ost
amen
to [
mm
]
DT - 11
-3
-2,5
-2
-1,5
-1
-0,5
0
0,5
0 100 200 300 400 500 600 700 800 900
Tempo [s]
Sp
osta
men
to [
mm
]
DT - 11
-3,5
-3
-2,5
-2
-1,5
-1
-0,5
0
0,5
0 100 200 300 400 500 600
Tempo [s]
Sp
osta
men
to [
mm
]

APPENDIX A
167
Dis
pla
cem
en
t [m
m]
Time [s]
Graph A-21: Vertical displacement of the upper glass corner – H/100 series.
Horizontal displacement of the upper glass corner:
Dis
pla
cem
en
t [m
m]
Time [s]
Graph A-22: Horizontal displacement of the upper glass corner – H/300 series.
Dis
pla
cem
en
t [m
m]
Time [s]
Graph A-23: Horizontal displacement of the upper glass corner – H/200 series.
DT - 11
-8
-7
-6
-5
-4
-3
-2
-1
0
1
2
0 200 400 600 800 1000
Tempo [s]
Sp
ost
amen
to [
mm
]
DT - 22
-15
-10
-5
0
5
10
15
0 100 200 300 400 500 600 700 800 900
Tempo [s]
Sp
osta
men
to [
mm
]
DT - 22
-20
-15
-10
-5
0
5
10
15
20
0 100 200 300 400 500 600
Tempo [s]
Sp
osta
men
to [
mm
]

SEISMIC BEHAVIOUR OF CURTAIN WALL FACADES Umberto Galli
168
Dis
pla
cem
en
t [m
m]
Time [s]
Graph A-24: Horizontal displacement of the upper glass corner – H/100 series.
Horizontal displacement of lower glass corner:
Dis
pla
cem
en
t [m
m]
Time [s]
Graph A-25: Horizontal displacement of the lower glass corner – H/300 series.
Dis
pla
cem
en
t [m
m]
Time [s]
Graph A-26: Horizontal displacement of the lower glass corner – H/200 series.
DT - 22
-40
-30
-20
-10
0
10
20
30
40
0 200 400 600 800 1000
Tempo [s]
Sp
osta
men
to [
mm
]
DT - 12
-3
-2
-1
0
1
2
3
4
0 100 200 300 400 500 600 700 800 900
Tempo [s]
Sp
osta
men
to [
mm
]
DT - 12
-4
-3
-2
-1
0
1
2
3
4
5
6
0 100 200 300 400 500 600
Tempo [s]
Sp
osta
men
to [
mm
]
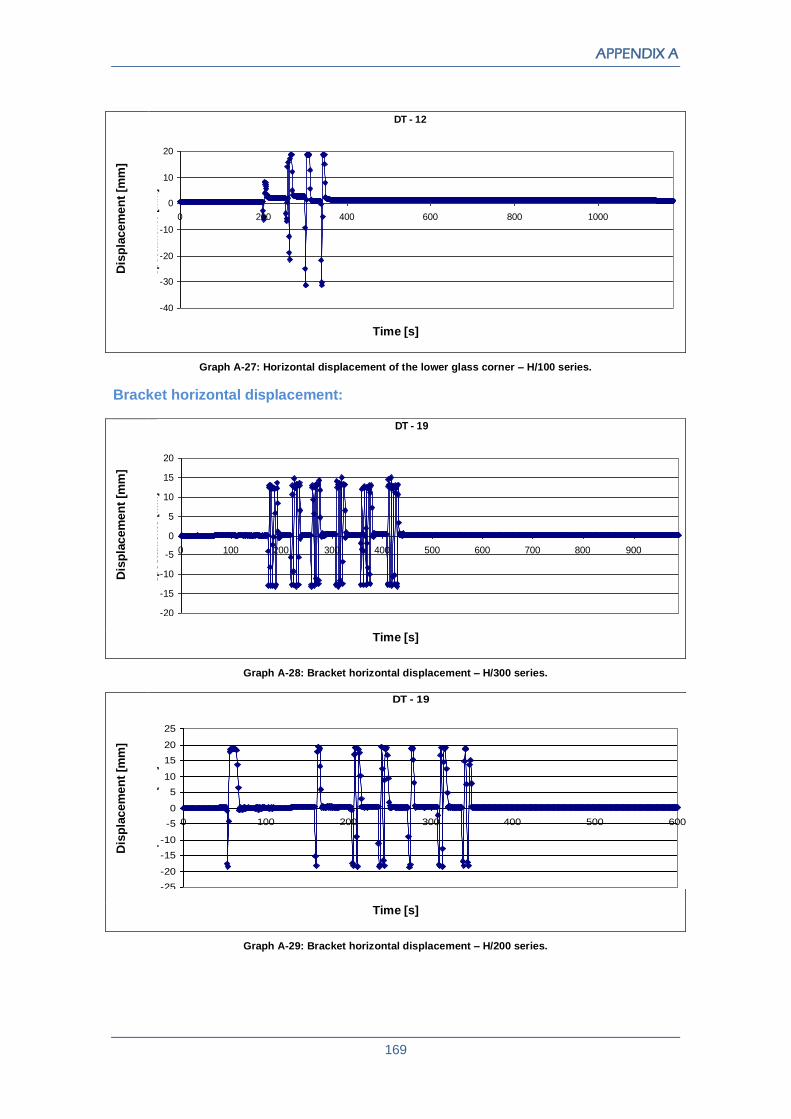
APPENDIX A
169
Dis
pla
cem
en
t [m
m]
Time [s]
Graph A-27: Horizontal displacement of the lower glass corner – H/100 series.
Bracket horizontal displacement:
Dis
pla
cem
en
t [m
m]
Time [s]
Graph A-28: Bracket horizontal displacement – H/300 series.
Dis
pla
cem
en
t [m
m]
Time [s]
Graph A-29: Bracket horizontal displacement – H/200 series.
DT - 12
-40
-30
-20
-10
0
10
20
0 200 400 600 800 1000
Tempo [s]
Sp
osta
men
to [
mm
]
DT - 19
-20
-15
-10
-5
0
5
10
15
20
0 100 200 300 400 500 600 700 800 900
Tempo [s]
Sp
osta
men
to [
mm
]
DT - 19
-25
-20
-15
-10
-5
0
5
10
15
20
25
0 100 200 300 400 500 600
Tempo [s]
Sp
osta
men
to [
mm
]
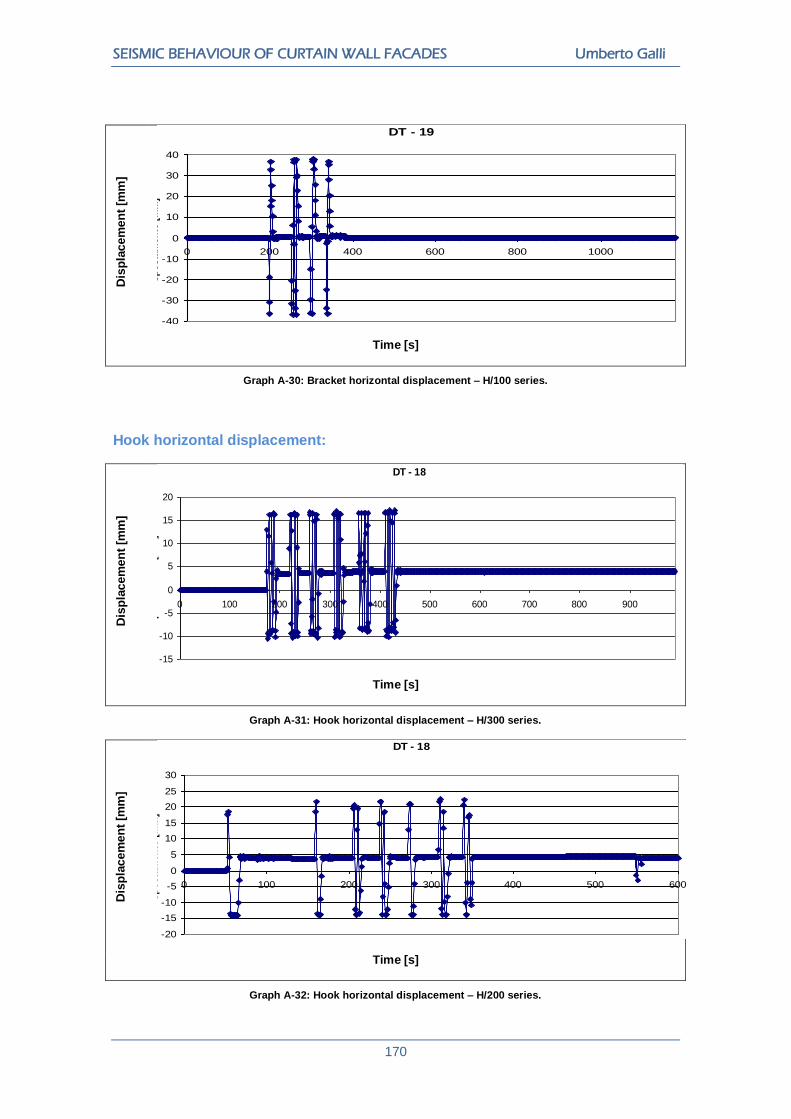
SEISMIC BEHAVIOUR OF CURTAIN WALL FACADES Umberto Galli
170
Dis
pla
cem
en
t [m
m]
Time [s]
Graph A-30: Bracket horizontal displacement – H/100 series.
Hook horizontal displacement:
Dis
pla
cem
en
t [m
m]
Time [s]
Graph A-31: Hook horizontal displacement – H/300 series.
Dis
pla
cem
en
t [m
m]
Time [s]
Graph A-32: Hook horizontal displacement – H/200 series.
DT - 19
-40
-30
-20
-10
0
10
20
30
40
0 200 400 600 800 1000
Tempo [s]
Sp
ost
amen
to [
mm
]
DT - 18
-15
-10
-5
0
5
10
15
20
0 100 200 300 400 500 600 700 800 900
Tempo [s]
Sp
osta
men
to [
mm
]
DT - 18
-20
-15
-10
-5
0
5
10
15
20
25
30
0 100 200 300 400 500 600
Tempo [s]
Sp
osta
men
to [
mm
]

APPENDIX A
171
Dis
pla
cem
en
t [m
m]
Time [s]
Graph A-33: Hook horizontal displacement – H/100 series.
Hook vertical displacement:
Dis
pla
cem
en
t [m
m]
Time [s]
Graph A-34: Hook vertical displacement – H/300 series.
Dis
pla
cem
en
t [m
m]
Time [s]
Graph A-35: Hook vertical displacement – H/200 series.
DT - 18
-40
-30
-20
-10
0
10
20
30
40
0 200 400 600 800 1000
Tempo [s]
Sp
osta
men
to [
mm
]
DT - 14
-1,6
-1,4
-1,2
-1
-0,8
-0,6
-0,4
-0,2
0
0,2
0 100 200 300 400 500 600 700 800 900
Tempo [s]
Sp
osta
men
to [
mm
]
DT - 14
-2,5
-2
-1,5
-1
-0,5
0
0,5
0 100 200 300 400 500 600
Tempo [s]
Sp
osta
men
to [
mm
]

SEISMIC BEHAVIOUR OF CURTAIN WALL FACADES Umberto Galli
172
Dis
pla
cem
en
t [m
m]
Time [s]
Graph A-36: Hook vertical displacement – H/100 series.
DT - 14
-6
-5
-4
-3
-2
-1
0
1
2
0 200 400 600 800 1000
Tempo [s]
Sp
osta
men
to [
mm
]
APPENDIX A
173
INDEX OF FIGURES
Figure 1-1: Aftermath of Tohoku earthquake (March 2011) ...................................................... 1
Figure 1-2: Aftermath tsunami of Tohoku earthquake (March 2011) .................................. 1
Figure 1-3: Aftermath of L'Aquila earthquake (April 2009) ......................................................... 2
Figure 1-4: Aftermath of Haiti earthquake (January 2010) ......................................................... 2
Figure 1-5: Schematic drawing representing a possible origin of an earthquake ........................ 3
Figure 1-6: Schematic drawing representing building induced behaviour during a seismic event.
................................................................................................................................................ 3
Figure 1-7: Schematic representation of possible benefits deriving from base isolation of the
building .................................................................................................................................... 4
Figure 1-8: Damage to non-structural exterior masonry walls (Christchurch, 2011) ................... 4
Figure 1-9: Damages to internal furnishing and ceilings collapse (Northridge, 1994) ................. 4
Figure 1-10: Collapse of non-structural masonry wall (Christchurch, 2011) ............................... 4
Figure 1-11: Stick system curtain walling: schematic drawing ................................................... 6
Figure 1-12: Unitized and panellized system curtain walling: schematic drawing ....................... 6
Figure 1-13: Structurally sealed system curtain walling: schematic drawing .............................. 7
Figure 1-14: Structural glazing system: schematic drawing ....................................................... 7
Figures 1-15 /1-16 /1-17: Several moments during the installation phase of a unitized curtain
walling system.......................................................................................................................... 8
Figure 1-18: Horizontal section of the façade in correspondence of the fastening system.......... 9
Figure 1-19: Vertical section of the façade in correspondence of the fastening system .............. 9
Figure 1-20: Schematic representation of the static scheme of a façade unit. ..........................10
Figure 1-21: Schematic representation of a building response to a seismic event ....................11
Figure 1-22: Schematic drawing representing building induced behaviour during a seismic event
...............................................................................................................................................13
Figure 1-23: Glass shards fallen from a curtain wall frame. (Northridge, 1994) .........................14
Figure 1-24: Maintenance operations after glass damage and fallout from the curtain wall frame.
(Northridge, 1994) ...................................................................................................................14
Figure 1-25: Aftermath of an earthquake on a structural glazing curtain walling system.
(Christchurch, 2011) ................................................................................................................15
Figure 1-26: Damage and glass shards fallout from facade frame. (Fukuoka, 2005) ................15
Figure 1-27: Typical example of fully-tempered (FT) glass breakage. ......................................16
Figure 1-28: Typical example of fully-tempered (FT) glass breakage. ......................................16
Figure 1-29: Laminated glass layers ........................................................................................17
Figure 1-30: Schematic representation of a laminated glass composition. ................................17
Figure 1-31: Glass shards fallout from a curtain wall. (Northridge, 1994) ..................................17
Figure 1-32: Aftermath of an earthquake to a stick curtain walling system. (Mexico City, 1985) 17
INDEX OF FIGURES
175
Figure 2-1: Tectonic Plate theory subdivision of the earth crust................................................21
Figure 2-2: California high-seismicity area ...............................................................................21
Figure 2-3: An aerial view of the great San Andreas fault, California. .......................................22
Figure 2-4: Southeast Asia region: in particular evidence the “Sunda subduction zone”. ..........23
Figure 2-5: Japan seismic area: main tectonic plate [2] ............................................................24
Figure 2-6: Representation of the epicenter localization of the Tohoku earthquake, March 2011
[2]. ..........................................................................................................................................24
2-7: Shakemap of Darfield Earthquake, New Zealand (3 September 2010) [32]. ......................25
Figure 2-8: Typical test specimen configuration [7]. .................................................................41
Figure 2-9: Dynamic racking test facility [6]. .............................................................................42
Figure 2-10: Drift time history in the crescendo test used for mid-rise architectural glass
specimens [6]. .........................................................................................................................43
Figure 3-1: Outside view of the Manchester Metropolitan University façade (Courtesy of
Permasteelisa S.p.a.). .............................................................................................................46
Figure 3-2: Outside view of the Manchester Metropolitan University façade (Courtesy of
Permasteelisa S.p.a.). .............................................................................................................46
Figure 3-3: Global view of the Manchester Metropolitan University building (Courtesy of
Permasteelisa S.p.a.). .............................................................................................................47
Figure 3-4: Detailed vertical section: fastening system components. ........................................48
Figure 3-5: Horizontal section of the façade in correspondence of the fastening system...........49
Figure 3-6: Vertical section of the façade in correspondence of the fastening system...............49
Figure 4-1: Watertightness static test.......................................................................................55
Figure 4-2: Water-tightness dynamic test.................................................................................56
Figure 4-3: Impact resistance mock-up test (Courtesy of Permasteelisa S.p.a.). ......................58
Figure 4-4: Impact resistance mock-up test (Courtesy of Permasteelisa S.p.a.). ......................58
Figure 4-5: Outside view of the Permasteelisa mock-up performance test facility (Courtesy of
Permasteelisa S.p.a.). .............................................................................................................59
Figure 4-6: Seismic performance test facility: in close-up the blue coloured “seismic beam”
(Courtesy of Permasteelisa S.p.a.). .........................................................................................60
Figure 4-7: Internal view of the seismic beam used for the performance seismic test (Courtesy
of Permasteelisa S.p.a.). .........................................................................................................61
Figure 4-8: Internal view: detail of the seismic beam and the fastening system of the facade unit
(Courtesy of Permasteelisa S.p.a.). .........................................................................................62
Figure 4-9: Installation scheme of the mock-up tested facade units..........................................63
Figure 4-10: Detailed drawings of the façade fastening system: vertical (left) and horizontal
(right) sections. .......................................................................................................................63
Figure 4-11: Detailed internal view of the façade fastening system and of the relative
displacement transducers applied (Courtesy of Permasteelisa S.p.a.). ....................................64
Figure 4-12: Detailed drawing of the bottom façade unit constraint point: vertical section .........64

SEISMIC BEHAVIOUR OF CURTAIN WALL FACADES Umberto Galli
176
Figure 4-13: Schematic drawing representing the forecasted façade unit behaviour with an
inter-storey horizontal displacement applied. ...........................................................................65
Figure 4-14: Displacement transducers placed on the external glass .......................................66
Figure 4-15: Displacement transducers placed on mullions (horizontal movements) and on
transoms (vertical movements) ................................................................................................66
Figure 4-16: Displacement transducers placement (horizontal and vertical displacements) on
the upper attachment point for SG550 unit. .............................................................................67
Figure 4-17: Displacement transducers placement (horizontal and vertical displacements) on
the upper attachment point for SG500 unit. .............................................................................67
Figure 4-18: Detail of DT-02 and DT-03 displacement transducers placement for the vertical
movement recording of the lower transom of the units (Courtesy of Permasteelisa S.p.a.). ......68
Figure 4-19: Detail of DT-16 Displacement transducer placement for the horizontal movement
recording at the lower corner of the unit (Courtesy of Permasteelisa S.p.a.). ............................69
Figure 4-20: Detail of the DT-11 displacement transducer placement for the vertical movement
recording at the lower corner of the glass (Courtesy of Permasteelisa S.p.a.). .........................69
Figure 4-21: Detail of the DT-19 displacement transducer placement for the horizontal
movement recording of the bracket (Courtesy of Permasteelisa S.p.a.). ..................................70
Figure 4-22: Detail of the DT-13 displacement transducer placement for the vertical movement
recording at the upper corner of the glass (Courtesy of Permasteelisa S.p.a.)..........................70
Figure 4-23: Bearing phenomena effects to the transom of the unit after seismic performance
tests (Courtesy of Permasteelisa S.p.a.). .................................................................................80
Figure 4-24: Alignment screw after seismic performance tests (Courtesy of Permasteelisa
S.p.a.). ....................................................................................................................................81
Figure 4-25: Rotational/translational movement and deformation of the facade unit. ................82
Figure 4-26: Rotational/translational movement of the glass plate. ...........................................83
Figure 5-1: Schematization of the finite element method process. ............................................90
Figure 5-2: Basic available elements utilized in the modelling process. ....................................91
Figure 5-3: FEM model of the internal bracket realized with tri-dimensional “brick” elements ....94
Figure 5-4: Example of a von Mises stress distribution, visualized with a colour contour, after
the solving of the bracket model. .............................................................................................94
Figure 5-5: FEM model of the hook (left) and of the channel (right) realized with tri-dimensional
“brick” elements. .....................................................................................................................95
Figure 5-6: Example of a von Mises stress distribution, visualized with a colour contour, after the
solving of the tri-dimensional model of hook (left) and channel (right) element. ........................95
Figure 5-7: Graphic convention utilized in Straus7 to indicate a fixed hinge point. ....................96
Figure 5-8:Schematic representation of possible constraints assignable to each point of the
FEM model. ............................................................................................................................96

INDEX OF FIGURES
177
Figure 5-9: Facade unit frame constituted by “beam” elements and details of the utilized static
scheme. ..................................................................................................................................97
Figure 5-10: Detailed view of the tri-axial modelling of the structural silicon joint. .....................99
Figure 5-11: Detail of the FEM model of the facade unit: “Rigid Link” elements. .....................101
Figure 5-12: Global view of the FEM model in the “line” visualization mode. ..........................102
Figure 5-13: Detailed view of the top-right corner of the FEM model ”line” visualization mode.
.............................................................................................................................................102
Figure 5-14: Global view of the FEM model in the “solid” visualization mode. .........................102
Figure 5-15: Detailed view of the top-right corner of the FEM model in the “line” visualization
mode. ...................................................................................................................................102
Figure 5-16: Scheme of displacement application to the experimental mock-up and to the FEM
model. ...................................................................................................................................103
Figure 5-17: After solving results of the H/300=12,50 mm displacement application in the
“positive” direction: stress distribution of the glass plate visualized through a coloured contour.
.............................................................................................................................................106
Figure 5-18: After solving results of the H/200=18,75 mm displacement application in the
“positive” direction: stress distribution of the glass plate visualized through a coloured contour.
.............................................................................................................................................106
Figure 5-19: After solving results of the H/100=37,50 mm displacement application in the
“positive” direction: stress distribution of the glass plate visualized through a coloured contour.
.............................................................................................................................................107
Figure 5-20: After solving results of the H/100=37,50 mm displacement application in the
“negative” direction: stress distribution of the glass plate visualized through a coloured contour.
.............................................................................................................................................108
Figure 5-21: Stress distribution in the bottom side of the glass plate for the H/100 “negative”
directed displacement. ..........................................................................................................108
Figure 5-22: Detailed view of the bottom left corner stress distribution: a peak compressive
stress value is identified. .......................................................................................................109
Figure 5-23: After solving results of the H/100=37,50 mm displacement application in the
“positive” direction: stress distribution of the unit frame profiles visualized through a coloured
contour in the “solid” mode. ...................................................................................................110
Figure 5-24: After solving results of the H/100=37,50 mm displacement application in the
“positive” direction: detailed view of the stress concentration in the top right corner (left) and in
the bottom right corner (right) of the frame. ............................................................................111
Figure 5-25: After solving results of the H/100=37,50 mm displacement application in the
“negative” direction: stress distribution of the unit frame profiles visualized through a coloured
contour in the “solid” mode. ...................................................................................................112

SEISMIC BEHAVIOUR OF CURTAIN WALL FACADES Umberto Galli
178
Figure 5-26: After solving results of the H/100=37,50 mm displacement application in the
“negative” direction: detailed view of the stress concentration in the top right corner (left) and in
the bottom right corner (right) of the frame. ............................................................................112
Figure 6-1: After solving results of the H/300=12,50 mm displacement application in the
“positive” direction: stress distribution of the glass plate visualized through a coloured contour.
.............................................................................................................................................121
Figure 6-2: After solving results of the H/200=18,75 mm displacement application in the
“positive” direction: stress distribution of the glass plate visualized through a coloured contour.
.............................................................................................................................................122
Figure 6-3: After solving results of the H/100=37,50 mm displacement application in the
“positive” direction: stress distribution of the glass plate visualized through a coloured contour.
.............................................................................................................................................122
Figure 6-4: After solving results of the H/100=37,50 mm displacement application in the
“positive” direction: stress distribution of the unit frame profiles visualized through a coloured
contour in the “solid” mode. ...................................................................................................124
Figure 7-1: Global view of the “Case 1” FEM model: “line” visualisation mode (left) and “solid”
visualisation mode (right). .....................................................................................................131
Figure 7-2: Global view of the “Case 2” FEM model: “line” visualisation mode (left) and “solid”
visualisation mode (right). .....................................................................................................131
Figure 7-3: Detailed view of the top right corner of the glass plate and the means of “rigid link”
elements, blue coloured, to link it to the frame (referred to Case 1). .......................................133
Figure 7-4: Detailed view of the means “rigid link” (blue), “spring-damper” (light-blue) and “zero-
gap” (red) elements for the retaining joint modelling (referred to Case 2). ..............................134
Figure 7-5: Detailed view of one of the two alternating retaining joint modelling solutions. This
picture represents the one with both “spring-damper” (out-of-plane) and “zero-gap” (in-plane)
elements provided (referred to Case 2). ................................................................................135
Figure 7-6: Detailed view of the other one retaining joint modelling solutions. This time the one,
consistent only of “zero-gap” (in-plane and out-of-plane) elements, is provided (referred to Case
2). .........................................................................................................................................135
Figure 7-7: After solving glass plate stress distribution for “positive” (left) and “negative” (right)
direction of the applied displacement H/100 to the Case 1 façade unit. ..................................137
Figure 7-8: Detailed view of the corner stress concentration of the Case 1 glass plate in the
“negative” H/100 condition.....................................................................................................138
Figure 7-9: After solving resulting stress distribution of the frame profiles for the “positive”
direction: global view of the frame (left) and detailed view of the joint between mullion and
transom (right). Referred to Case 1. ......................................................................................139

INDEX OF FIGURES
179
Figure 7-10: After solving resulting stress distribution of the frame profiles for the “negative”
direction: global view of the frame (left) and detailed view of the joint between mullion and
transom (right). Referred to Case 1. ......................................................................................140
Figure 7-11: After solving glass plate stress distribution for the “positive” direction of the applied
displacement H/100 to Case 2 façade unit. ............................................................................141
Figure 7-12: After solving glass plate stress distribution for the “negative” direction of the applied
displacement H/100 to Case 2 façade unit. ............................................................................142
Figure 7-13: After solving resulting stress distribution of the frame profiles for the “positive”
direction: global view of the frame. Referred to Case 2. .........................................................143
Figure 7-14: After solving resulting stress distribution of the frame profiles for the “positive”
direction: detailed view of the joint between mullion and transom. Referred to Case 2. ..........144
Figure 7-15: After solving resulting stress distribution of the frame profiles for the “negative”
direction: global view of the frame. Referred to Case 2. .........................................................145
Figure 7-16: After solving resulting stress distribution of the frame profiles for the “negative”
direction: detailed view of the joint between mullion and transom. Referred to Case 2. ..........145
INDEX OF TABLES
Table 2-1: Values of qa for non-structural elements..................................................................28
Table 2-2: Coefficients for Architectural Components [33]. .......................................................31
Table 2-3: Parts classification criteria [53]. ...............................................................................34
Table 2-4: Part response factors [53]. ......................................................................................36
Table 4-1: Rotational/translational movement and deformation of the facade unit. ...................82
Table 4-2: Rotational/translational movement of the glass plate. ..............................................83
Table 4-3: Air leakage test performance classification [22] .......................................................86
Table 4-4: Air leakage test results measured during the “Suction” and the “Pression” phases. .86

INDEX OF GRAPHS
Graph 4-1: Vertical displacement of the upper transom (right corner) – H/300 series. ..............73
Graph 4-2: Vertical displacement of the upper transom (right corner) – H/200 series. ..............73
Graph 4-3: Vertical displacement of the upper transom (right corner) – H/100 series. ..............73
Graph 4-4: Horizontal displacement of the lower transom – H/300 series. ................................74
Graph 4-5: Horizontal displacement of the lower transom – H/200 series. ................................74
Graph 4-6: Horizontal displacement of the lower transom – H/100 series. ................................74
Graph 4-7: Vertical displacement of the lower transom (right corner) – H/300 series. ...............75
Graph 4-8: Vertical displacement of the lower transom (right corner) – H/200 series. ...............75
Graph 4-9: Vertical displacement of the lower transom (right corner) – H/100 series. ...............75
Graph 4-10: Horizontal displacement of the upper glass corner – H/300 series. .......................76
Graph 4-11: Horizontal displacement of the upper glass corner – H/200 series. .......................76
Graph 4-12: Horizontal displacement of the upper glass corner – H/100 series. .......................76
Graph 4-13: Bracket horizontal displacement – H/300 series. ..................................................77
Graph 4-14: Bracket horizontal displacement – H/200 series. ..................................................77
Graph 4-15: Bracket horizontal displacement – H/100 series. ..................................................77
Graph 4-16: Hook vertical displacement – H/300 series. ..........................................................78
Graph 4-17: Hook vertical displacement – H/200 series. ..........................................................78
Graph 4-18: Hook vertical displacement – H/100 series. ..........................................................78
Graph 4-19: Frame rotation under the applied horizontal displacement. ...................................84
Graph 4-20: Glass plate rotation under the applied horizontal displacement. ...........................84
Graph 4-21: Air leakage test applied pressure increments. ......................................................86
Graph 4-22: Air leakage measured through the specimen during the “Suction” phase of test. ..87
Graph 4-23: Air leakage measured through the specimen during the “Pression” phase of test. 87
Graph 6-1: Comparison between FEM model and experimental test results of unit frame
rotational movements. ...........................................................................................................117
Graph 6-2: Comparison between FEM model and experimental test results of glass plate
rotational movements. ...........................................................................................................117
Graph 6-3: Influence of the spring element stiffness parameter “k” on the modelled frame
behaviour. .............................................................................................................................119
Graph 6-4: Influence of the spring element stiffness parameter “k” on the modelled glass plate
behaviour. .............................................................................................................................120
Graph A-1: Vertical displacement of the upper transom (left corner) – H/300 series. ..............160
Graph A-2: Vertical displacement of the upper transom (left corner) – H/200 series. ..............160
Graph A-3: Vertical displacement of the upper transom (left corner) – H/100 series ...............161
Graph A-4: Vertical displacement of the upper transom (right corner) – H/300 series. ............161
SEISMIC BEHAVIOUR OF CURTAIN WALL FACADES Umberto Galli
182
Graph A-5: Vertical displacement of the upper transom (right corner) – H/200 series .............161
Graph A-6: Vertical displacement of the upper transom (right corner) – H/100 series .............162
Graph A-7: Vertical displacement of the lower transom (left corner) – H/300 series. ...............162
Graph A-8: Vertical displacement of the lower transom (left corner) – H/200 series. ...............162
Graph A-9: Vertical displacement of the lower transom (left corner) – H/100 series. ...............163
Graph A-10: Vertical displacement of the lower transom (right corner) – H/300 series. ...........163
Graph A-11: Vertical displacement of the lower transom (right corner) – H/200 series. ...........163
Graph A-12: Vertical displacement of the lower transom (right corner) – H/100 series. ...........164
Graph A-13: Horizontal displacement of the upper transom – H/300 series. ...........................164
Graph A-14: Horizontal displacement of the upper transom – H/200 series. ...........................164
Graph A-15: Horizontal displacement of the upper transom – H/100 series. ...........................165
Graph A-16: Horizontal displacement of the lower transom – H/300 series. ...........................165
Graph A-17: Horizontal displacement of the lower transom – H/200 series. ...........................165
Graph A-18: Horizontal displacement of the lower transom – H/100 series ............................166
Graph A-19: Vertical displacement of the upper glass corner – H/300 series. ........................166
Graph A-20: Vertical displacement of the upper glass corner – H/200 series. ........................166
Graph A-21: Vertical displacement of the upper glass corner – H/100 series. ........................167
Graph A-22: Horizontal displacement of the upper glass corner – H/300 series. ....................167
Graph A-23: Horizontal displacement of the upper glass corner – H/200 series. ....................167
Graph A-24: Horizontal displacement of the upper glass corner – H/100 series. ....................168
Graph A-25: Horizontal displacement of the lower glass corner – H/300 series. .....................168
Graph A-26: Horizontal displacement of the lower glass corner – H/200 series. .....................168
Graph A-27: Horizontal displacement of the lower glass corner – H/100 series. .....................169
Graph A-28: Bracket horizontal displacement – H/300 series. ................................................169
Graph A-29: Bracket horizontal displacement – H/200 series. ................................................169
Graph A-30: Bracket horizontal displacement – H/100 series. ................................................170
Graph A-31: Hook horizontal displacement – H/300 series. ...................................................170
Graph A-32: Hook horizontal displacement – H/200 series. ...................................................170
Graph A-33: Hook horizontal displacement – H/100 series. ...................................................171
Graph A-34: Hook vertical displacement – H/300 series. .......................................................171
Graph A-35: Hook vertical displacement – H/200 series. .......................................................171
Graph A-36: Hook vertical displacement – H/100 series. .......................................................172