SYNTHESIS OF SEAWEED BASED CARBON ACID …eprints.utar.edu.my/2128/1/CL-2016-1104561-1.pdf ·...
126
SYNTHESIS OF SEAWEED BASED CARBON ACID CATALYST BY THERMAL DECOMPOSITION OF AMMONIUM SULFATE FOR BIODIESEL PRODUCTION TANG ZO EE A project report submitted in partial fulfilment of the requirements for the award of Bachelor of Engineering (Hons.) Chemical Engineering Faculty of Engineering and Science Universiti Tunku Abdul Rahman May 2016
-
Upload
nguyenkhue -
Category
Documents
-
view
214 -
download
0
Transcript of SYNTHESIS OF SEAWEED BASED CARBON ACID …eprints.utar.edu.my/2128/1/CL-2016-1104561-1.pdf ·...
SYNTHESIS OF SEAWEED BASED CARBON ACID CATALYST BY
THERMAL DECOMPOSITION OF AMMONIUM SULFATE FOR
BIODIESEL PRODUCTION
TANG ZO EE
A project report submitted in partial fulfilment of the
requirements for the award of Bachelor of Engineering
(Hons.) Chemical Engineering
Faculty of Engineering and Science
Universiti Tunku Abdul Rahman
May 2016

ii
DECLARATION
I hereby declare that this project report is based on my original work except for
citations and quotations which have been duly acknowledged. I also declare that it has
not been previously and concurrently submitted for any other degree or award at
UTAR or other institutions.
Signature :
Name : Tang Zo Ee
ID No. : 1104561
Date : 9th May 2016

iii
APPROVAL FOR SUBMISSION
I certify that this project report entitled “SYNTHESIS OF SEAWEED BASED
CARBON ACID CATALYST BY THERMAL DECOMPOSITION OF
AMMONIUM SULFATE FOR BIODIESEL PRODUCTION” was prepared by
TANG ZO EE has met the required standard for submission in partial fulfilment of
the requirements for the award of Bachelor of Engineering (Hons.) Chemical
Engineering at Universiti Tunku Abdul Rahman.
Approved by,
Signature :
Supervisor : Dr. Steven Lim
Date : 9th May 2016
iv
The copyright of this report belongs to the author under the terms of the
copyright Act 1987 as qualified by Intellectual Property Policy of Universiti Tunku
Abdul Rahman. Due acknowledgement shall always be made of the use of any
material contained in, or derived from, this report.
© 2016, Tang Zo Ee. All right reserved.

v
Specially dedicated to
my beloved mother, father,
relatives and friends

vi
ACKNOWLEDGEMENTS
I would like to thank everyone who had contributed to the successful completion of
this project. As the most important person, I would like to express my gratitude to my
research supervisor, Dr. Steven Lim for his invaluable advice, guidance and his
enormous patience throughout the development of the research.
Next, my deepest thanks to University Tunku Abdul Rahman (UTAR) for
providing the opportunity and platform to complete my final year project. In addition,
I sincerely thanks to all Assistant Laboratory Manager of Department of Chemical
Engineering in Lee Kong Chian Faculty of Engineering and Science who gave their
helping hand during my laboratory work.
Lastly, I would also like to express my gratitude to my loving parent for giving
me support and encouragement during my studies. Not to forget all my course mates
and friends who had helped and given me encouragement unconditionally.

vii
SYNTHESIS OF SEAWEED BASED CARBON ACID CATALYST BY
THERMAL DECOMPOSITION OF AMMONIUM SULFATE FOR
BIODIESEL PRODUCTION
ABSTRACT
Experiment was carried out to study the biomass solid acid catalyst synthesis method
for the production of biodiesel using high free fatty acid content feedstock (Palm Fatty
Acid Distillate). Seaweed was selected as the biomass to be carbonised into carbon
material as the catalyst support. The effect of carbonisation temperature at 200, 300,
400, 500 and 600 °C on the catalyst properties was studied. Sulfonation of seaweed
based carbon material was carried out by thermal decomposition of ammonium sulfate,
(NH4)2SO4. The effect of reaction parameters on the biodiesel yield was studied by
varying the concentration of ammonium sulfate (5, 10, 20, 30 and 40 w/v%) and
reaction time (15, 30, 60 and 90 minutes). Characterisations of catalyst were carried
out to study the catalyst surface morphology with Scanning Electron Microscope
(SEM), acid density with back titration, functional group attached with FT-IR and
thermal stability by Thermogravimetric Analysis (TGA). Production of biodiesel from
methanol and PFAD was optimised by varying catalyst loading (2.5, 5, 10 and 15wt. %)
and time (2, 4, 6 and 8 hours) at 100 °C oil bath with PFAD/methanol ratio of 1:20.
Results showed that when the catalyst sulfonated with 30 ml of 10 w/v% ammonium
sulfate solution, heated to 235 °C for 30 minutes was used, the optimum esterification
conditions achieved with the highest FAME yield was 48.87% at the reaction condition
of 15 wt% catalyst loading, esterification time of 8 hours, methanol to PFAD molar
ratio of 20:1 at 100 °C oil bath.

viii
TABLE OF CONTENTS
DECLARATION ii
APPROVAL FOR SUBMISSION iii
ACKNOWLEDGEMENTS vi
ABSTRACT vii
TABLE OF CONTENTS viii
LIST OF TABLES xi
LIST OF FIGURES xiii
LIST OF SYMBOLS / ABBREVIATIONS xvii
LIST OF APPENDICES xviii
CHAPTER
1 INTRODUCTION 1
1.1 Overview of World Energy Consumption 1
1.2 Biofuels 5
1.3 Biodiesel 8
1.4 Production Pathways of Biodiesel 9
1.5 Catalytic Transesterification of Biodiesel 10
1.6 Types of Heterogeneous Acid Catalyst 12
1.7 Biomass Heterogeneous Acid Catalyst Synthesis Method 14
1.8 Problem Statement 15
1.9 Scope of Study 16
1.10 Research Objective 16

ix
2 LITERATURE REVIEW 17
2.1 Reaction Mechanisms of Biodiesel Production 17
2.1.1 Transesterification Reaction Mechanism 17
2.1.2 Esterification Reaction Mechanism 20
2.2 Biomass Derived Carbon-based Solid Acid Catalyst 21
2.3 Carbonisation and Pre-treatment of Biomass 23
2.3.1 Effect of Carbonisation Variables 23
2.4 Catalyst Synthesis Methods 26
2.4.1 Effect of Synthesis Variables 32
2.5 Characterisation of Synthesised Catalyst 33
2.6 Characterisation of Feedstock and Products 36
2.7 Biodiesel Production Experiment 37
2.7.1 Stability and Regeneration Test 38
2.7.2 Optimisation Study 41
3 METHODOLOGY 44
3.1 List of Materials and Apparatus 44
3.1.1 Materials and Chemicals 44
3.1.2 Apparatus and Equipment 46
3.2 Overall Research Methodology 48
3.3 Synthesis of Catalyst 49
3.3.1 Carbonisation of Seaweed 49
3.3.2 Sulfonation of Carbon 50
3.4 Catalyst Characterisation 51
3.4.1 Surface Morphology 51
3.4.2 Brunauer-Emmet-Teller Methodology 52
3.4.3 Fourier Transform - Infrared Spectroscopy 52
3.4.4 Acid Density 53
3.4.5 Thermogravimetric Analysis 54
3.5 Feedstock Analysis 54
3.5.1 Acid Value Test 54
3.6 Biodiesel Production 55
3.7 Gas Chromatography Analysis 56

x
3.7.1 Determination of Acid Composition 57
3.7.2 Biodiesel Yield Analysis 57
4 RESULTS AND DISCUSSIONS 59
4.1 Preliminary Stage Observation 59
4.2 Characterisation of Catalyst 61
4.2.1 Scanning Electron Microscope 62
4.2.2 Brunauer-Emmet-Teller Analysis 66
4.2.3 Fourier Transform - Infrared Spectroscopy 66
4.2.4 Acid Density 70
4.2.5 Energy-Dispersive X-ray Spectroscopy 75
4.2.6 Thermogravimetric Analysis 77
4.3 Analysis of Feedstock 78
4.4 Analysis of Biodiesel Produced 79
4.4.1 Optimisation Study for Sulfonation Conditions 79
4.4.2 Optimisation Study for Esterification Conditions 86
5 CONCLUSION AND RECOMMENDATION 90
5.1 Conclusion 90
5.2 Recommendation 92
REFERENCES 94
APPENDICES 99

xi
LIST OF TABLES
TABLE TITLE PAGE
1.1 Estimated FFA Composition in Edible and Non-
edible Plant Oil/ Fats (Robles, et al., 2009) 11
1.2 Various Types of Heterogeneous Catalyst (Adam,
et al., 2014) 13
1.3 Examples of Sulfonation Methods 14
2.1 Raw Materials Selected and Carbonisation
Conditions of Several Literatures 25
2.2 Various Synthesis Method for Sulfonation of
Carbon Catalyst 30
2.3 Catalyst Characterisation 34
2.4 Effect of Catalyst Recycling on the Yield of FAME
(Folasegun, et al., 2014) 39
2.5 Summary of Optimum Reaction Conditions from
Several Literatures 43
3.1 List of Chemicals and Materials Required for the
Experiments 45
3.2 List of Apparatus and Equipment Used in
Preparation of Catalyst 46
3.3 List of Instrument and Apparatus Required for
Characterisation of Catalyst and Feedstock and
Product Analysis 47
4.1 Carbon Samples and the Preparation Conditions 59
4.2 Catalysts Samples and the Preparation Conditions 60
xii
4.3 Total Acid Density of Catalyst Samples at Different
Carbonisation Temperature 70
4.4 Total Acid Density of Catalyst Samples at Different
Sulfonation Conditions 72
4.5 Elemental Composition on Catalyst 75
4.6 Acid Value and FFA content of Feedstock 79
4.7 Free Fatty Acid Composition of Feedstock 79
4.8 FAME Yield Obtained from Using Different
Catalyst 82
4.9 FAME Yield Obtained from the Test Run Catalyst 86

xiii
LIST OF FIGURES
FIGURE TITLE PAGE
1.1 World Energy Consumption by Four Major Sectors
in 2014 (U.S. Energy Information Administration,
2015) 2
1.2 Primary Energy Supply in 1993, 2011 and
Prediction on 2020 (World Energy Council, 2013) 4
1.3 Global Production of Bioethanol, Biodiesel and
HVO from 2000 to 2014 (REN21, 2015) 7
1.4 U.S. Monthly Biodiesel Production from 2013 to
2015 (EIA, 2015) 8
1.5 Transesterification Process of Biodiesel Production 10
1.6 Saponification Reaction in the Presence of Base
Catalyst 11
1.7 Esterification of FFA in the Presence of Acid
Catalyst 12
2.1 Transesterification of Triglyceride and Methanol
(Edgar, et al., 2005) 18
2.2 Reaction Mechanism for Homogeneous Base
Catalysed Transesterification of TGs (Edgar, et al.,
2005) 18
2.3 Reaction Mechanism for Homogeneous Acid
Catalysed Transesterification of TGs (Edgar, et al.,
2005) 19
2.4 Reaction Mechanism for Solid Acid Catalysed
Esterification of FFA (Stoytcheva and Montero,
2011) 21

xiv
2.5 Summary for Synthesis Method of Brown Algae
Derived Carbon Solid Acid Catalyst 22
2.6 Morphology of Sulfonated Catalyst at Carbonised
Temperature 400 ℃ at Time 1 hour (Folasegun, et
al., 2014) 24
2.7 Effect of Carbonisation Time and Temperature on
Catalyst Acid Density and Ester Yield (Liu, et al.,
2013) 25
2.8 Effect of Weight Ratio of Sulfanilic Acid to AC on
PhSO3H Density (Malins, et al., 2015) 33
2.9 Effect of Reaction Temperature of Sulfanilic Acid
to AC on PhSO3H Density (Malins, et al., 2015) 33
2.10 Comparison between Catalytic Reaction Cycles
With and Without Regeneration of Catalyst (Malins,
et al., 2015) 39
2.11 Reusability of the Sulfonated MWCNT in the
Esterification of PFAD (Shuit and Tan, 2014) 40
2.12 Effect of (A) Molar ratio of methanol and oil (B)
Catalyst Concentration (C) Temperature and (D)
Time on the FAME Yield (Folasegun, et al., 2014) 42
3.1 Summary Procedures of the Experiment 48
3.2 (A) Washing of Collected Fresh Seaweed (B)
Drying of Seaweed (C) Grinding of Seaweed into
Powder Form (D) Activation of Seaweed in 30 v/v%
Phosphoric Acid (E) Pyrolysis of Seaweed in
Furnace (F) Grounding of Carbon 49
3.3 (A) Water bath Ultrasonication of Carbon and
Ammonium Sulfate Mixture (B) Heating to 235 °C
in Furnace (C) Washing and Filtration of Catalyst 50
3.4 FT-IR Spectroscopy Component (ChemWiki, 2013)
52
3.5 Derivation of Acid Density Formula 53
3.6 Esterification Reaction Set-up 56
3.7 Calibration Curves for (A) Methyl Palmitate (B)
Methyl Stearate (C) Methyl Oleate (D) Methyl
Linoleate 58

xv
4.1 (A) SWAC Samples and (B) Catalyst Samples 61
4.2 SEM Images of Seaweed Biomass Before
Carbonisation at Magnification (A) x500 and (B)
x2000 62
4.3 SEM Images of Seaweed After Carbonisation at (A)
200 °C ( B) 300 °C (C) 400 °C (D) 500 °C (E)
600 °C at 500x and 2000x Magnification 63
4.4 SEM Image of Cat-A7 65
4.5 FT-IR Spectra for Catalysts Sulfonated for 15
minutes in Different Ammonium Sulfate Solution
Concentration 67
4.6 FT-IR Spectra for Catalysts Sulfonated for 30
minutes in Different Ammonium Sulfate Solution
Concentration 68
4.7 FT-IR Spectra for Catalysts Sulfonated for 60
minutes in Different Ammonium Sulfate Solution
Concentration 69
4.8 FT-IR Spectra for Catalysts Sulfonated for 90
minutes in Different Ammonium Sulfate Solution
Concentration 69
4.9 Total Acid Density of Catalysts Synthesised from
Different Carbonisation Temperature, Sulfonated in
30 ml of 10 w/v% Ammonium Sulfat Solution for
30 Minutes at 235 °C 71
4.10 Graph of Total Acid Density of Catalysts
Synthesised from Different Sulfonation
Temperature 73
4.11 EDX Analysis for Catalyst Cat-A7 76
4.12 Temperature-Dependent Mass Loss (TG, green),
Mass Loss Rate (DTG, black) and DTA-Curve
(blue) for Cat-A7 78
4.13 Product of Esterification by Catalyst Sulfonated for
(A) 15minutes and (B) 30 minutes (C) 60 minutes
(D) 90 minutes with Different Concentration of
Ammonium Sulfate Solution 80
xvi
4.14 Effect of Sulfonation Duration and Ammonium
Sulfate Concentration on the FAME Yield
(Esterification Conditions: 100 °C Oil Bath, 4 hours,
5 wt% Catalyst Loading, Molar Ratio of Methanol
to PFAD 20:1) 83
4.15 EM Image of Catalyst with Microorganism
Attached at Magnification (A) 500x and (B) 2000x 85
4.16 Graph of Effect of Reaction Time on FAME Yield
at 100 °C Oil Bath, Methanol to PFAD Molar Ratio
of 20:1 and Catalyst Cat-7 Loading of 5 wt% 87
4.17 Graph of Effect of Catalyst Loading on FAME
Yield at 100 °C Oil Bath, Methanol to PFAD molar
ratio of 20:1 and 8 Hours Reaction Time 89

xvii
LIST OF SYMBOLS / ABBREVIATIONS
AC Activated Carbon
AV Acid Value
BET Brunauer-Emmet-Teller
EDX Energy Dispersive X-ray
FAME Fatty Acid Methyl Esters
FFA Free Fatty Acid
FT-IR Fourier-transform Infrared
GC-FID Gas Chromatography – Flame Ionisation Detector
MWCNT Multi Walled Carbon Nano Tubes
PFAD Palm Fatty Acid Distillate
SEM Scanning Electron Microscope
SWAC Seaweed Activated Carbon
TPD Temperature Programmed Desorption
TG Triglyceride
TGA Thermogravimetric Analysis
XRD X-ray Diffractometer

xviii
LIST OF APPENDICES
APPENDIX TITLE PAGE
A SEM Images 99
B EDX Report 104
C Gas Chromatography Report 105
D Gantt Chart 106
E Material Safety Data Sheet (MSDS) 108
CHAPTER 1
1 INTRODUCTION
1.1 Overview of World Energy Consumption
In the modern days now, energy has become the most fundamental requirement in
human life. It is the most basic necessity and essential to perform work. The global
energy consumption is increasing gradually over the years. World energy consumed
that is used to generate power has increased by 0.9% in 2014 (British Petroleum, 2015).
The increase of global energy consumption is due to the increase of world population
was just part of the reasons that contributes to the increase of energy consumption. The
main reason is due to the development of the countries. Developed countries like
United States is one of the highest energy consumption countries even though it does
not have the most population among other countries.
The energy consumption is divided into four major energy end-use sectors,
which are residential, commercial, transportation and industrial. Taking a developed
country as example, U.S had increased the consumption of energy every year. In year
2014, according to the statistic of U.S. total energy consumption, residential sector has
consumed total energy of 21,618 Trillion Btu, increased by about 400 Trillion Btu
from 2013. Commercial sector consumed about 18,394 Trillion Btu of total energy,
increased by about 300 Trillion Btu from 2013 as well. As for industrial, sector that
consumed the most energy at about 31,308 Trillion Btu, remained almost constant
from 2013. And lastly, the transportation sector consumed 27,142 Trillion Btu in year
2014 (U.S. Energy Information Administration, 2015). Figure 1.1 shows that in 2014,
industrial sector consumed the most energy with the reason mentioned above.

2
Figure 1.1: World Energy Consumption by Four Major Sectors in 2014 (U.S.
Energy Information Administration, 2015)
The sources of energy are divided into two major groups, renewable energy
and non-renewable energy. Non-renewable energy is generally defined as energy that
cannot be replenished in a short period of time once consumed. In contrast, renewable
energy is generally defined as the infinite energy source that can replenished rapidly
after consumed. The most common type of non-renewable energy is fossil fuels which
consist of petroleum, natural gas and coal. Nuclear energy is also one of the non-
renewable energy. Whereas renewable energy researches include hydro power, wind
energy technology, solar energy technology, geothermal energy, biomass conversion,
wave, tidal and ocean thermal energy and many more.
Non-renewable energy resource is currently the world main source of energy.
Fossil fuels contribute for about 80% of the total primary energy supply by resource
(World Energy Council, 2013). Fossil fuels are very important source of energy as a
large amount of energy can be produced by just simple combustion. Oil has become
much more important after the invention of combustion engine which require oil as
burning fuel. The invention of combustion engines then led to the creation of
combustion engine driven motor vehicles which consume high amount of oil on a daily
basis. Besides that, it has also become the main pillar of the industry sectors that are
very important in developing the economics of a country.
22%
19%
32%
27%Residential
Commercial
Industrial
Transportation

3
However, non-renewable energy is facing two major problems. One of the
major problems is that the usage of non-renewable energy like fossil fuels and nuclear
energy gives a large impact to the environment. The burning of fossil fuels like oil and
coal tends to produce abundance of greenhouse gas like carbon dioxide that will lead
to global warming. These gases will tend to trap heat radiation from the sun on the
earth surface causing the rise of global temperature. Global warming will bring
consequences like melting of ice glacial at north and south poles of the earth, flood
and submerged of low land city that cause by the rise of sea level. Besides that,
incomplete combustion of these fuels will produce carbon monoxide that is harmful to
human health once inhaled. Carbon particles will also produce from incomplete
combustion which will then cause air pollution due to the suspension of these
particulate matters in the air which will cause respiratory problem to human as well as
animals.
Besides environmental impact that is caused by burning of fossil fuels, nuclear
energy will also give a large impact to the environment, ecosystems and human beings
as a non-renewable source of energy. There are more than one hundred units of nuclear
power plants operating in United States. Approximately 20% of the energy source in
United States originates from nuclear energy (U.S. Energy Protection Agency, 2013).
Nuclear powered energy which involves the process from mining of uranium ore,
process of uranium to be enriched fuel, nuclear reactions to production of radioactive
by-product will cause all types of pollution to the environment. Moreover, uranium is
extracted from the earth crust through various mining techniques and cannot be
replenished in human time scale.
As mentioned, nuclear energy gives only finite supply of energy that will reach
the limit once the raw materials are used up. Same goes to fossil fuels, which can only
sustain for about 60 years based on the unproduced oil and gas in discovered reservoirs.
These fuels are also known as the reserves (Carbon Counted, 2015). Although the
undiscovered oil and gas are estimated to be able to sustain for more than 100 years,
but there are still uncertainties and might require more resources in terms of financial
and labour to be invested in the projects as the left over oil and gas are mostly trapped
in the area that require higher technology and equipment to be drilled into.

4
The introduction of renewable energy has become the alternative for non-
renewable energy and has a very big potential to replace the position of fossil fuel as
the main source of energy in power generation. As shown in Figure 1.2, the production
of renewable energy (other than hydro power) had increased from 10% at year 1993
to 11% in 2011 and it is estimated that is will increase to 16% in the year of 2020
(World Energy Council, 2013). The implement of renewable energy can act as a
solution for the two major problems that is faced by sourcing non-renewable energy.
Renewable energy harnesses the natural resource to convert them into energy. Natural
resources are able to reproduce infinitely within human time frame which is known as
the sustainable development. Renewable energy like solar, wind and wave energy
cause relatively little environmental pollution. Although the burning of biomass
produces carbon dioxide like how fossil fuel do, the amount of carbon dioxide
produced from combustion of biomass is same as the amount of carbon dioxide will
be consumed by the plants for photosynthesis reaction. This will ended up with the
zero net production of carbon dioxide from burning of biomass, known as the carbon
neutral materials.
Figure 1.2: Primary Energy Supply in 1993, 2011 and Prediction on 2020 (World
Energy Council, 2013)
Mtoe: Million Tonnes of Oil Equivalent

5
1.2 Biofuels
Biofuels can be defined as the biological materials derived fuels. Although the working
principle of biofuels is similar to fossil fuel, which is to generate energy through
combustion from fuel source, biofuels are categorized as renewable energy. Biofuels
are said to be renewable because it uses natural materials from plant and animal as the
source for combustion. These biological materials are able to be reproduced in a very
short time frame and are sustainable and renewable. Biofuels can be categorized into
3 types, which are solid biofuel (biomass), liquid biofuels and gaseous biofuel (Biogas).
The production methods and forms of appearance of these 3 types of biofuels are
different.
Solid biofuels are basically known as biofuel that appears in solid forms. Wood,
leaves, animal dung and energy crops are examples of solid biofuels. Solid biofuels is
the primary biofuel that require no production steps to be generated, it always appears
in convenient form that is readily to be used. Biomass is usually burnt directly to
generate heat without any prior conversion to any form. But sometimes, biomass like
wood will be processed into pellet form. In 2014, the production of wood pellets has
risen by 9%, at about 24 million tonnes (REN21, 2015). Energy crops like Switchgrass
(Parnicum virgatum) and elephant grass (Pennisetum purpuream) are planted
especially for bioenergy production by burning and conversion to other form of
biofuels, which will be discussed later sections.
On the other hand, gaseous biofuels or biogas is produced through the
anaerobic activity of bacteria in breaking down the animal dung, sewage and crops.
Europe has the highest production of biomethane worldwide at approximately 9.4
TWh per year with 154 production plants set-up in Germany, 54 in Sweden and 23
plants in Netherland (REN21, 2015). Biogases produced from fermentation by bacteria
are composed of several chemicals which include 50-75% of methane (main and
desired product) and the rest are carbon dioxide, oxygen, water, hydrogen and nitrogen.
These gases are then refined and purified into biomethane for use.
Next, biofuels are also available in liquid form. These liquid biofuels can be
used for transportation vehicles which made it different from the other types of biofuels.

6
Liquid biofuels is a potential source of energy that could replace the petroleum as
automotive fuel and has more advantages at the current high-oil-price-market. Liquid
biofuels is known as the secondary biofuel which is produced from processing of
biomass. Secondary biofuels are evolving day by day from the first generation to fourth
generation:
i. First Generation biofuel is mainly produced from food crops like wheat and
sugarcane. The feed stocks of first generation biofuel are edible crops which
were then lead to the fuel vs. food crisis. The usage of food crops in biofuel
production has increased the demand of food crops and became competitive
with the global food market. For some period the food price rose due to the
limitation of food supply. Besides that, first generation biofuel were also facing
problem like negative net energy produced by certain crops (Naik, et al., 2010).
ii. Second generation biofuel is improved to resolve the problem encountered by
the first generation biofuel. Instead of edible crops, non-edible biomass is used
in producing the biofuel. Examples of second generation biofuel feedstock are
crop waste, wood, straw, organic waste and many more. Life cycle assessment
of second generation has also been done and proven that the net energy gain
has also increased from the previous generation of biofuel (Sims, et al., 2010).
iii. Third generation biofuels is implemented based on the improvement in
producing biomass. Engineered energy crop like algae are being cultivated and
to be used as the feedstock for biofuel production. Algae are renewable source
and easily to be grown at any environment at very low cost. Biofuels derived
from engineered energy crops have the potential of producing larger amount of
energy when combusted than the conventional crops derived biofuels (Maity,
et al., 2015).
iv. Fourth generation biofuels focus not only in the sustainable energy but also
targeted to capture and store carbon dioxide from atmosphere. Carbon dioxide
are being captured and stored in all stages of biofuel production process. This
biofuel production is aim to be carbon negative rather than just carbon neutral
to reduce the amount of carbon dioxide in the atmosphere (Biopact, 2007).
7
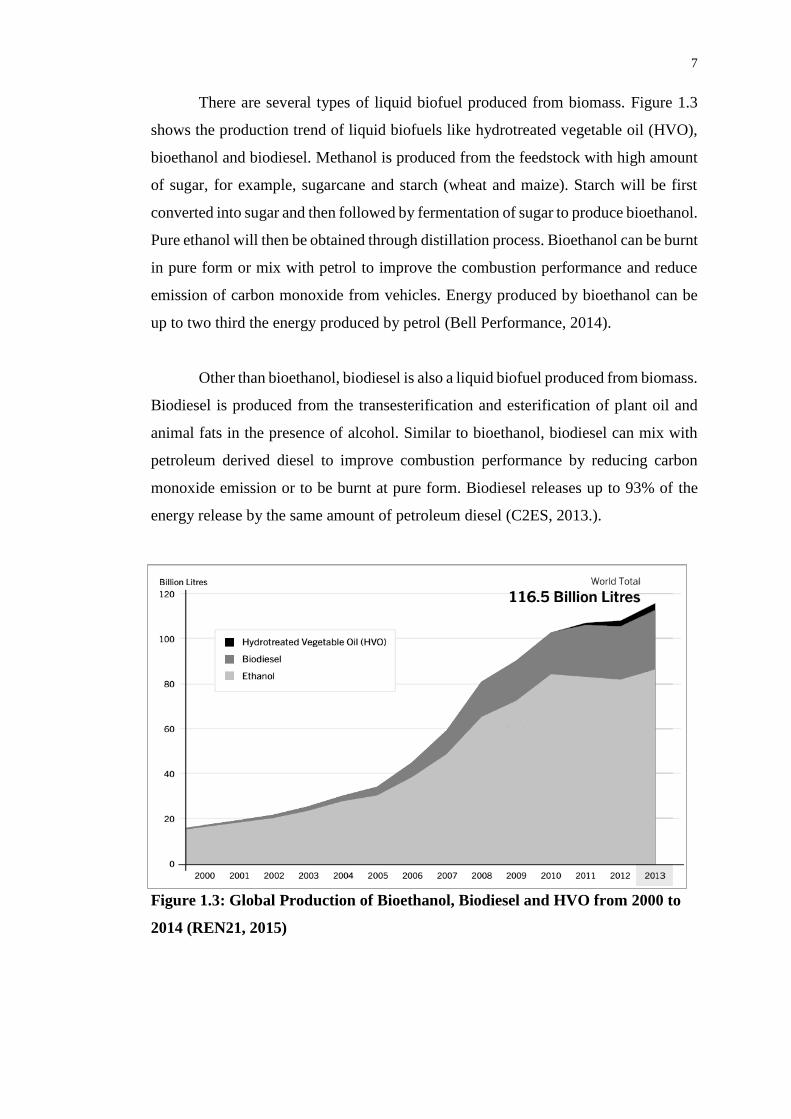
There are several types of liquid biofuel produced from biomass. Figure 1.3
shows the production trend of liquid biofuels like hydrotreated vegetable oil (HVO),
bioethanol and biodiesel. Methanol is produced from the feedstock with high amount
of sugar, for example, sugarcane and starch (wheat and maize). Starch will be first
converted into sugar and then followed by fermentation of sugar to produce bioethanol.
Pure ethanol will then be obtained through distillation process. Bioethanol can be burnt
in pure form or mix with petrol to improve the combustion performance and reduce
emission of carbon monoxide from vehicles. Energy produced by bioethanol can be
up to two third the energy produced by petrol (Bell Performance, 2014).
Other than bioethanol, biodiesel is also a liquid biofuel produced from biomass.
Biodiesel is produced from the transesterification and esterification of plant oil and
animal fats in the presence of alcohol. Similar to bioethanol, biodiesel can mix with
petroleum derived diesel to improve combustion performance by reducing carbon
monoxide emission or to be burnt at pure form. Biodiesel releases up to 93% of the
energy release by the same amount of petroleum diesel (C2ES, 2013.).
Figure 1.3: Global Production of Bioethanol, Biodiesel and HVO from 2000 to
2014 (REN21, 2015)

8
1.3 Biodiesel
The transesterification of vegetable and plant oil to produce biodiesel started at the
year of 1853 by scientists E. Duffy and J. Patrick (Ayhan, 2009). This process had
begun very long before the invention of diesel engine. In the year of 1893, Dr. Rudolf
Diesel, the German inventor had invented the diesel engine which was named after
him (Ayhan, 2009). The design of diesel engine was originally powered by biomass
fuel. The invention of biodiesel was before the available of petroleum. In the 20th
century, the discovery of petroleum has made oil companies to refine crude oil in large
quantity leaving surplus of distillate, which was then found to be excellent diesel fuel
at much lower cost. However, in 1921, Dr. Diesel confidently claimed that the use of
non-flammable biodiesel to power diesel engine will be the real future of his diesel
engine although biofuels seems to be insignificant during that time (Ayhan, 2009).
According to the monthly biodiesel production report from United States
Energy Information Administration, the production of biodiesel in United States has
gradually increased over the month. Production of biodiesel has increased for 10
million gallons from March to about 108 million gallons in April 2015 (EIA, 2015).
The increase of biodiesel production has shown that biodiesel is becoming more
important in the fuel market with a very high potential to take over petroleum-derived
diesel especially during high oil price period.
Figure 1.4: U.S. Monthly Biodiesel Production from 2013 to 2015 (EIA, 2015)
gallons
9
Biodiesel gives several advantages over the petroleum diesel including:
i. Biodiesel can be made from renewable resources that are non-toxic and
biodegradable (Bozbas, 2008).
ii. Biodiesel released far lesser amount of pollutants than petroleum based
diesel (Ayhan, 2007).
iii. Biodiesel has the potential to show higher efficiency than petroleum
biodiesel as a fuel to power compression-ignition engines (Ayhan, 2007).
iv. Biodiesel has lower sulfur and aromatic content (Dennis, Xuan and
Leung, 2010).
1.4 Production Pathways of Biodiesel
There are 4 methods available in the production of biodiesel which are all associated
with pros and cons (Dennis, Xuan and Leung, 2010).
i. Direct use and Blending. In this method, the extracted oils are mixed with
diesel fuel or to be used directly. However, when this type of biodiesel is used
in engines, several problems will occur like formation of coking and trumpet
deposits of carbon and gelling and thickening of lubricating oil.
ii. Micro-emulsions. When there are two immiscible liquids and ionic or non-
ionic amphiphiles, a colloidal equilibrium dispersion of optically isotropic
fluid with dimension of 1 -150 nm will occur. This will decrease the viscosity
level of the fuel but also release lower energy. When used in engines, the
viscosity of lubricant oil will rise and heavy carbon will be deposited.
iii. Thermal Cracking (Pyrolysis). Heat is applied to convert the long-chain
saturated substance derived from biomass into biodiesel. The biodiesel
produced from pyrolysis has the similar chemical properties with the petroleum
diesel.

10
iv. Transesterification. This is the most common method used in the production
of biodiesel. Biodiesel is formed by the catalytic transesterification process of
plant oil or animal fat with alcohol to form esters and glycerol. The biodiesel
formed by this method is found to have higher combustion efficiency.
1.5 Catalytic Transesterification of Biodiesel
As mentioned in Section 1.4.4, triglycerides will react with alcohol through
transesterification process to produce biodiesel and glycerol in the presence of catalyst.
The reaction can be written as shown in Figure 1.5.
Figure 1.5: Transesterification Process of Biodiesel Production
There are various types of catalyst that can be used in the biodiesel production
through transesterification process. Homogeneous base catalyst like NaOH, KOH and
NaOCH3 are commonly used as the catalyst due to the higher activity rate. However,
most of the oil and fat contain certain amount of free fatty acid (FFA) that act as a
barrier for the base-catalysed transesterification process. Plant oil or animal fats have
to contain no more than 0.5 wt% of FFA else formation of soap will occur in the
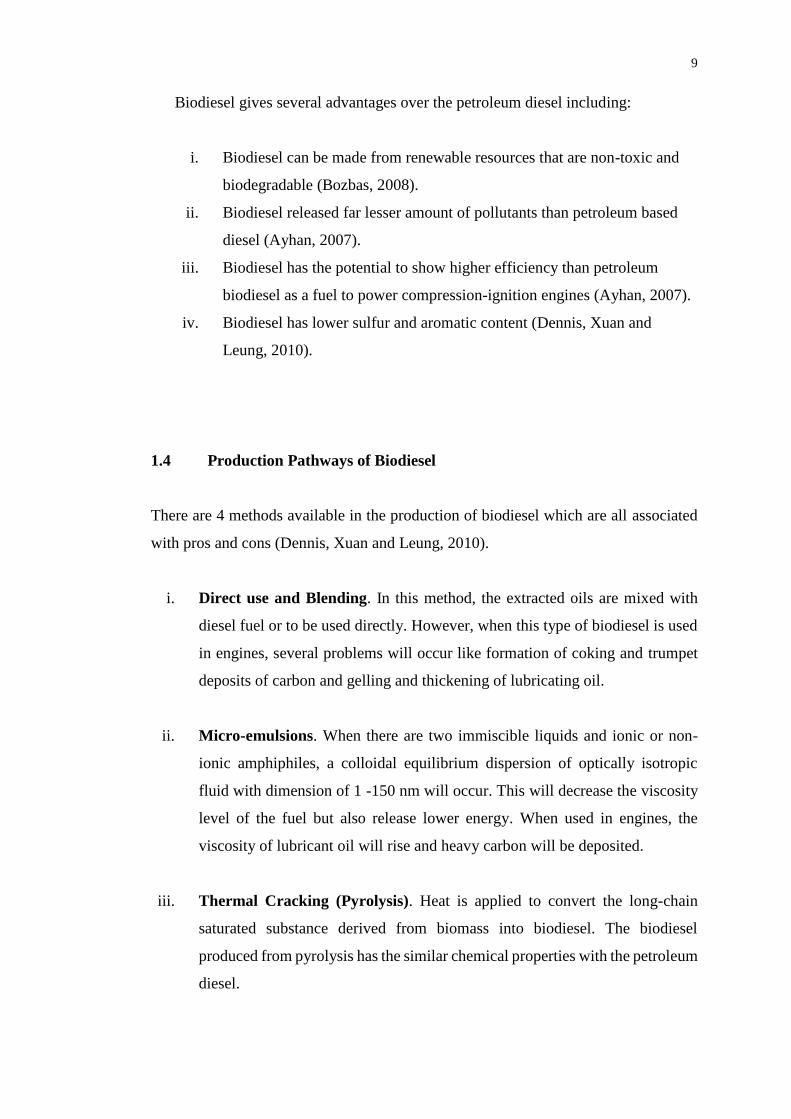
reaction (Shu, et al., 2010). Figure 1.6 shows that the base catalyst will react with the
FFA content in the oil to form soap and water. Table 1.1 shows estimated FFA
composition of edible and non-edible oil which contributes to the formation of soap.
11
OOH
R1
O
Na HO
O
R1
Na O
H H+ +
FFA Sodium Hydroxide
soap Water
Figure 1.6: Saponification Reaction in the Presence of Base Catalyst
Table 1.1: Estimated FFA Composition in Edible and Non-edible Plant Oil/ Fats
(Robles, et al., 2009)
Plant Oil
and Fats
Free Fatty Acid Composition, % by weight
Lauric
12:00
Myristic
14:00
Palmitic
16:00
Stearic
18:00
Oleic
18:1
Linoleic
18:2
Linolenic
18:3
Soybean 0.1 0.1 10.2 3.7 22.8 53.7 8.6
Cottonseed 0.1 0.7 20.1 2.6 19.2 55.2 0.6
Palm 0.1 1.0 42.8 4.5 40.5 10.1 0.2
Lard 0.1 1.4 23.6 14.2 44.2 10.7 0.4
Tallow 0.1 2.8 23.3 19.4 42.4 2.9 0.9
J. curcas 0.0 0.0 12.8 6.2 35.58 45.4 0.0
Saponification occurs as a side reaction that yields soap and water which give
plenty of drawbacks as below:
i. Yield of biodiesel decreases.
ii. Water hydrolyses triglyceride to diglyceride and forming more FFA.
iii. Binding of soap with catalyst increases the amount of catalyst required and
results in higher cost.
One of the reasons of biodiesel not being commercialized in the market is due
to the relatively high raw material cost (Antonio, et al., 2014). The usage of cheap
feedstock like waste cooking oil and non-edible oil are a very good way to mitigate

12
the problem associated with the high material cost. Nonetheless, the FFA contents in
the cheap feedstock are high and making base-catalyst not suitable to be use in the
production. Problems associated with based-catalyst may be overcome as below:
i. Pre-treatment of feedstock in removing FFA contained in the oil or fat.
ii. Used of alternative catalysts in the reaction.
In this case, homogeneous acid catalysts are proven to be a solution for the high
FFA content problem faced by base catalyst. At the presence of acid catalyst, the FFA
in feedstock will react with methanol to form fatty acid ester (FAME), which is the
biodiesel through esterification process as shown in Figure 1.7. Normally, sulfuric acid,
H2SO4 is used as the acid catalyst. Although homogeneous acid catalyst shows a better
performance than base catalyst, it has some limitation that denied it to be the best
choice of catalyst in biodiesel production. The usage of homogeneous acid catalyst
(H2SO4) will cause the corrosion of equipment in the production plant (Shu, et al.,
2010). Besides that, the catalyst is hard to be separated from the product to be
recovered and may consume high energy.
OOH
R1
O
R HO
H H+ +
FFA Alcohol Water
OO-R
R1
Fatty Acid Esters
Figure 1.7: Esterification of FFA in the Presence of Acid Catalyst
1.6 Types of Heterogeneous Acid Catalyst
By using heterogeneous acid catalyst, both transesterification of triglyceride and
esterification of FFA can undergo simultaneously, achieving the one step catalytic
conversion of low cost feedstock into biodiesel. Table 1.2 shows various types of solid
acid catalyst have been discovered by researchers obtaining from different materials.

13
Table 1.2: Various Types of Heterogeneous Catalyst (Adam, et al., 2014)
Types of
Heterogeneous
Catalyst
Description Examples
Mesoporous
Silica
Belongs to the Santa Barbara
Amorphous (SBA) family where
sulfonic groups or SO4/ZrO2 are
coated on the porous surface.
Phenyl SBA-15, Propyl
SBA-15
Heteropolyacids Large group of complex oxygen-
containing acid formed from
dehydration of two or more
inorganic acids containing flexible
structure.
H3PW12O40 supported
on magnetic iron oxide
Acidic Polymer
and Resins
Mesoporous organic polymer that
contains high absorption capacity
and are easily recovered.
Sulfonated Mesoporous
Polydivinylbenzene
(PDVB-SO3H)
Waste Carbon Biomass-derived catalyst through
sulfonation. Residue of biomass
after oil extraction is carbonized and
sulfonated.
Sulfonated
Carbonaceous algal
residues, crop waste.
Miscellaneous Other solid acid catalyst researched
by scientist.
Ferric Hydrogen Sulfate
[Fe(HSO4)3], Supported
Tungsten Oxides
(WO3/SnO2)
.

14
1.7 Biomass Heterogeneous Acid Catalyst Synthesis Method
Solid acid catalyst derived from carbonized biomass followed by sulfonation is
introduced by Toda and his research team from sugar (Folasegun, et al., 2014). From
there onwards, various types of organic waste material were then used as the raw
material for the synthesis of biomass acid catalyst for esterification of FFA to biodiesel.
Several synthesis methods are discovered and used to produce these catalysts. Some
examples of sulfonation are shown in Table 1.3.
Table 1.3: Examples of Sulfonation Methods
Literature Method Description
Du, Zhao and
Liang (2008)
Sulfonation by
Thermal
Decomposition of
Ammonium Sulfate
When heat is supplied, ammonium sulfate
(NH4)2SO4 decomposed to form sulfur
trioxide, SO3 which will then graft on the
mesoporous material.
Du, Zhao and
Liang (2008)
Sulfonation by in
situ polymerisation
of poly(sodium4-
styrenesulfonate)
This method is first started with vigorous
stirring of the deionised water,
poly(sodium4-styrenesulfonate) (PSS) and
the treated carbonised material and
followed by addition of ammonium
persulfate, (NH4)2SO8 and heat to initiate
polymerisation then added with large
amount of concentrated sulfuric acid.
Shuit and Tan
(2014)
Sulfonation by in
situ polymerisation
of acetic anhydride
and sulfuric acid
A mixture consists of treated carbonised
materials, concentrated sulfuric acid and
acetic anhydride, (CH3CO)2O is stirred and
heated for certain duration.
Shuit and Tan
(2014)
Direct Sulfonation
with concentrated
sulfuric acid,
H2SO4
In this method, carbonised biomass and
sulfuric acid is directly treated with heat for
a period of time to allow the sulfuric acid to
be attached onto the carbon pores.

15
1.8 Problem Statement
In order to amplify the potentials of the biodiesel as the alternative fuel to power
automotive engines, the yield of biodiesel should be improved without increasing the
production cost. There are several researches done on the factors affecting the biodiesel
production like alcohol quantity, reaction time, reaction temperature and catalyst
concentration. Nevertheless, the type of catalyst used in the production is also an
important element that should be taken into account. The creation of effective catalyst
enables the production of biodiesel to be more cost effective and viable.
However, not all types of catalyst are suitable to be used on all types of oil
feedstock. Base catalyst has the largest limitation dealing with the high FFA content
although it shows to have better activity rate in the biodiesel production than acid
catalyst. When homogeneous acid catalyst like sulfuric acid is used, the performance
was shown to be good. However, the usage of homogeneous acid catalyst asserts a
problem where the separation of liquid catalyst from the product is difficult and
required large amount of energy for separation.
In this case, heterogeneous acid catalyst seems to be a very potential catalyst
to be used in the biodiesel process. Researches are being done to obtain the optimum
conditions to synthesize the good quality and economic biomass catalyst by using
different biomass material, synthesizing method and parameters. Not all types of
biomass are suitable to be used as the precursor for catalyst and it is very depending
on the structure of the biomass. The synthesizing method should also be studied on
whether it is suitable to be used on the biomass selected as the carbon precursor from
all aspects, for example, whether the biomass can withstand the synthesising
temperature, the acidity of sulfonating agent used and so on.
16
1.9 Scope of Study
The research focus on the method used to synthesis the solid acid catalyst from the
biomass. There are plenty types of biomass available that the capability to be used as
catalyst support after carbonised can be studied. Thus, selection of biomass to be
carbonised to the precursor of catalyst is the earliest stage in this study. Carbonisation
of biomass was a process to form carbon material to be sulfonate to form acid catalyst.
Sulfonation of carbon material was the most important stage in the research.
Different sulfonation methods yield different production outcome. This study was to
investigate the results outcome of the selected synthesis method (sulfonation by
thermal decomposition of ammonium sulfate). During the sulfonation process, the
reaction parameters will be varied so that the optimum synthesis conditions can be
achieved.
Production of biodiesel by using the catalyst synthesised was done to study the
efficiency of catalyst based on the biodiesel yield. Production reaction conditions was
also varied to obtain the optimum reaction conditions that is when the synthesised
catalyst is used so that the performance of catalyst is optimised.
1.10 Research Objective
This research project focuses on discovering the better alternative of fuels for the next
generation by creating a simpler and feasible biodiesel production pathway. The
objectives of this study includes:
i. To study the feasibility of seaweed to be used for synthesis of solid catalyst by
using the method thermal decomposition of ammonium sulfate for biodiesel
production.
ii. To investigate the optimum ammonium sulfate concentration and time used in
the catalyst synthesis process.
iii. To study the optimum catalyst loading and the reaction time in esterification.
CHAPTER 2
2 LITERATURE REVIEW
2.1 Reaction Mechanisms of Biodiesel Production
Base-catalysed transesterification is the most common biodiesel synthesis method
used. However, there is limitation on using a base catalyst in the reaction which is the
formation of soap when oil with high free fatty acid (FFA) content is used as the
feedstock of the biodiesel production. Usually, low quality oil contains higher amount
of FFA but it is cheaper than the low FFA content oil.
Thus, acid catalyst is used to overcome the soap formation problem by
converting FFA to biodiesel through esterification reaction. Following shows the
mechanism of biodiesel production of both base and acid catalysed reaction.
2.1.1 Transesterification Reaction Mechanism
In this reaction, one mole of triglyceride (TG) will first react with one mole of alcohol
(methanol is usually used) and converted to one mole of diglyceride and one mole of
ester (biodiesel). Diglyceride will then be converted to monoglyceride and finally to
glycerol. During each conversion, one mole of ester will be formed. The chemical
pathway of the full reaction is shown in Figure 2.1.

18
Figure 2.1: Transesterification of Triglyceride and Methanol (Edgar, et al.,
2005)
The reaction mechanism of the base-catalysed transesterification reaction of
triglyceride is shown in Figure 2.2. At step (1), alkoxide ions, RO- are formed when
alcohol is reacted with hydroxyl ions from the base catalyst. Next, in step (2), the
alkoxide ions, which are the strong nucleophiles, attack the carbonyl group on the
triglyceride forming a tetrahedral intermediate. Then in step (3), the tetrahedral
intermediate breaks down and produce one mole of ester. And lastly in step (4), the
base catalyst will be regenerated and form diglyceride. This sequence will repeat twice
until 1 mole of glycerol and 3 moles of esters (biodiesel) is formed.
Figure 2.2: Reaction Mechanism for Homogeneous Base Catalysed
Transesterification of TGs (Edgar, et al., 2005)
B: base catalyst
R1, R2, R3: carbon chain of fatty acid
R: alkyl group of alcohol (normally CH3)
Methanol Ester
Methanol Ester
Methanol Ester
Glycerol
19
The usage of base catalyst is to promote the soap formation process in the
reaction. The chemical equation of the saponification process is shown in Figure 1.6.
The products of the saponification reaction include soap and water. The formation of
water has created another problem, which is the promotion of FFAs formation which
will then deactivate the catalyst and produce more soap (Edgar, et al., 2005). The usage
of acid catalyst in the biodiesel production is introduced to resolve the soap formation
problem. Thus, transesterification of TGs can also be done in the presence of acid
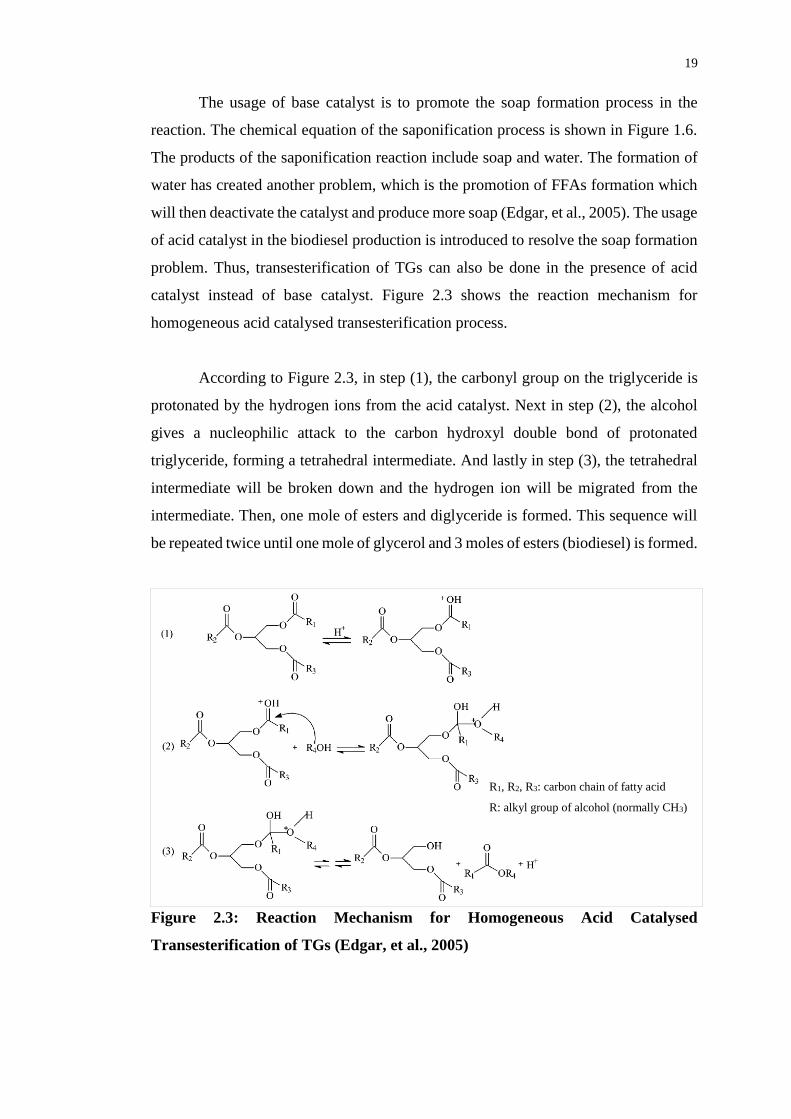
catalyst instead of base catalyst. Figure 2.3 shows the reaction mechanism for
homogeneous acid catalysed transesterification process.
According to Figure 2.3, in step (1), the carbonyl group on the triglyceride is
protonated by the hydrogen ions from the acid catalyst. Next in step (2), the alcohol
gives a nucleophilic attack to the carbon hydroxyl double bond of protonated
triglyceride, forming a tetrahedral intermediate. And lastly in step (3), the tetrahedral
intermediate will be broken down and the hydrogen ion will be migrated from the
intermediate. Then, one mole of esters and diglyceride is formed. This sequence will
be repeated twice until one mole of glycerol and 3 moles of esters (biodiesel) is formed.
Figure 2.3: Reaction Mechanism for Homogeneous Acid Catalysed
Transesterification of TGs (Edgar, et al., 2005)
R1, R2, R3: carbon chain of fatty acid
R: alkyl group of alcohol (normally CH3)
20
Both the reaction mechanism for base and acid catalysed transesterification of
triglycerides show the different chemical pathways for the formation of glycerol and
esters. For the base catalysed transesterification reaction, the reaction route is more
direct which forms alkoxides to act as strong nucleophiles. In contrast, the key step for
acid catalysed transesterification is the protonation of carbonyl oxygen which makes
the adjoining carbon atom to be more susceptible to nucleophilic attack by increasing
the electrophilicity of it. In short, base catalysed reaction forms a strong nucleophile
while acid catalysed reaction forms a more electrophilic species.
2.1.2 Esterification Reaction Mechanism
Vegetable oil or animal fats that contain more than 0.5 wt. % of FFAs is not suitable
to be used as feedstock for base catalysed reaction to produce biodiesel (Shu, et al.,
2010). When the FFAs content in the oil feedstock is high, acid catalyst is suitable to
be used in the biodiesel production reaction. The presence of acid catalyst will convert
the FFAs into useful biodiesel through esterification reaction. Thus, transesterification
of triglycerides and esterification of FFAs will occurs simultaneously when acid
catalyst is used.
Unlike transesterification reaction mentioned that uses homogeneous acid
catalyst, the esterification reaction that will be described at the following is a
heterogeneous solid acid catalysed esterification reaction. The difference between
homogeneous and heterogeneous acid catalysed reaction is that when homogeneous
acid is used, FFA will supply hydroxide ions whereas alcohol will supply proton in the
esterification without involving intermediate process. On the other hand,
heterogeneous acid catalysed esterification follows a carbonium ion mechanism which
involves intermediate process (Stoytcheva and Montero, 2011).
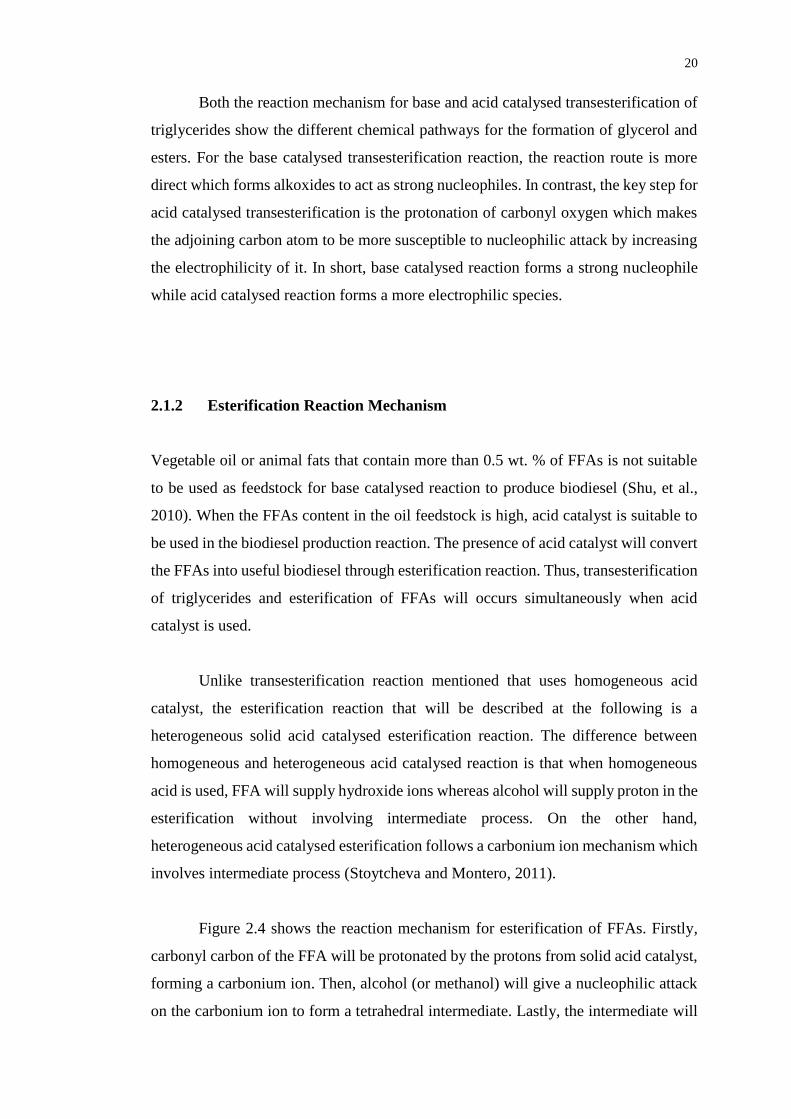
Figure 2.4 shows the reaction mechanism for esterification of FFAs. Firstly,
carbonyl carbon of the FFA will be protonated by the protons from solid acid catalyst,
forming a carbonium ion. Then, alcohol (or methanol) will give a nucleophilic attack
on the carbonium ion to form a tetrahedral intermediate. Lastly, the intermediate will

21
break down after the proton migrated resulted in water and fatty acid ester, FAME
(biodiesel). The proton is then reformed and ready to be used for next reaction.
Figure 2.4: Reaction Mechanism for Solid Acid Catalysed Esterification of FFA
(Stoytcheva and Montero, 2011)
2.2 Biomass Derived Carbon-based Solid Acid Catalyst
Biomass residues can be found in abundance after various kind of human activities
like agriculture, oil extraction and many more. In this study, brown algae (seaweed)
are selected to be used as the raw material for the derivation of carbon material for the
solid acid catalyst. Figure 2.5 shows the overall procedure for the synthesis of solid
acid catalyst from biomass.
Firstly, the collected biomass will be cut into smaller pieces and dried in the
oven at temperature around 100 °C. Then, dried biomass will be pyrolysed under high
temperature around 200-600 °C to turn into carbon materials. The surface morphology
of the produced carbon material will be studied to know the capability of this biomass
as a catalyst support. Carbon materials will then be sulfonated via different types of
synthesis methods to become sulfonated carbon catalyst. In Figure 2.5, the sulfonated
carbon contains functional groups like –SO3, –COOH and –OH. The functional group
–SO3 acts as the active site for the chemical reaction. –OH attached absorbs β-1, 4
glycosidic bonds and provides good access for the reactants towards the SO3H groups
in the carbon material (Stoytcheva and Montero, 2011).

22
Figure 2.5: Summary for Synthesis Method of Brown Algae Derived Carbon
Solid Acid Catalyst
Algin
(Widely distributed in cell walls of brown
algae)
Carbon Material
Pyrolysis
Sulfonated Carbon

23
2.3 Carbonisation and Pre-treatment of Biomass
As mentioned in Section 2.2, collected biomass is required to be treated before proceed
to sulfonation process. Biomass will be converted to carbon materials like amorphous
carbon, biochar or activated carbon through carbonisation process. Resulted carbon
materials will normally be grounded into powder form and the size of the powder can
be controlled with the usage of sieving equipment.
The biomass selected as raw material in this study was the brown algae
(seaweed). According to Janaun, Abang and Anwar (2013), the brown algae obtained
was cut into smaller size and dried in oven at 105 °C overnight. Dried seaweed was
pyrolysed in a tube furnace at 400 °C for 4 hours. Pyrolysis system was purged with
nitrogen prior to heating. The resulted black materials was then grounded with pestle
and mortar. Sulfonated carbon is noted with the term SBC (seaweed-based catalyst).
FT-IR analysis had investigated that SBC consisted of aromatic carbon sheets with
SO3H, COOH and OH groups attached along with inorganics and metals binding.
2.3.1 Effect of Carbonisation Variables
The parameters used in the carbonisation process are also important factors that would
affect the activity of the catalyst produced. When different reaction conditions are
employed in the carbonisation process, the resulted outcome will be different as well.
Several researches had studied for the effects of synthesis reaction conditions on the
catalyst by varying the reaction parameters like temperature and time.
Folasegun, et al. (2014) had selected glucose as the raw material for the
synthesising of catalyst. About 200 g of glucose had undergone incomplete
combustion in a tube furnace at 400 °C at constant nitrogen atmosphere. The
temperature was ramped up at 2 °C /min until 400 °C and kept constant for 1, 5 and 10
hours. Figure 2.6 shows the example of surface morphology of the sulfonated catalyst.
The black solid obtained was passed through a 0.5 mm sieving equipment and resulted

24
in regular size powder. Amorphous carbon composed of aromatic sheets having with
random orientation formed.
The highest acid content of the catalyst was achieved with 1 hour carbonisation
time at about 1.0 mmol/g of SO3H, followed by 0.8 mmol/g of SO3H by both 5 and 10
hours carbonisation time. Thus, the trend was that shorter carbonization time poses
higher number of smaller carbons sheets which in turn, having higher SO3H densities.
In the transesterification reaction at the conditions (C. inophyllum oil = 0.5 g, methanol
= 5.5 g, carbon material = 0.3 g, time = 5 hours, temperature = 150 °C), FAME yield
obtained was 64.4%.
Figure 2.6: Morphology of Sulfonated Catalyst at Carbonised Temperature 400
℃ at Time 1 hour (Folasegun, et al., 2014)
Liu, et al. (2013) had studied the effect on the carbonisation time and
temperature on the performance and characters of catalyst synthesised. 2 g of corn
straw was heated for 0.5, 1, 2 and 3 hour(s) at different temperatures of 250, 300, 350,
400, 450, 500 °C under the flow of nitrogen in a tube reactor. As shown in Figure 2.7,
carbonisation of corn straw at 300 °C (573 K) for 1 hour has the highest FAME yield
of 92% by esterification (temperature = 60 °C, time = 4 hours, molar ratio
methanol/oleic = 3:1 and 3 wt. % catalyst) and total acid density of 2.64 mmol/g. Table
2.1 summarised the carbonisation conditions of various biomass material.

25
Figure 2.7: Effect of Carbonisation Time and Temperature on Catalyst Acid
Density and Ester Yield (Liu, et al., 2013)
Table 2.1: Raw Materials Selected and Carbonisation Conditions of Several
Literatures
Literature Raw Material Conditions
Temperature (°C) Time (hours)
Ezebor, et al.
(2014)
Sugarcane Bagasse
and Oil Palm
Trunk
400 15
Folasegun, et al.
(2014)
C. inophyllum oil
seed cake 400 5
Janaun, Abang
and Anwar (2013)
Seaweed 400 4
Konwar, et al.
(2015)
Deoiled Waste
Cake (DOWC)
- J. curcas
- P. pinnata
500 1
Liu, et al. (2013) Corn Straw 300 1
Mar and Somsook
(2012)
Vermicelli made
from starch of
Mung Bean
300 1
Shu, et al. (2010) Vegetable oil
asphalt 500-700 1

26
2.4 Catalyst Synthesis Methods
The synthesis method of carbon acid catalyst is the main focus of the study in this
project. Carbon acid catalyst is usually synthesised by sulfonation of carbon materials.
Researches are investigating on different carbon sulfonation methods to achieve
optimum performance for the synthesised solid acid catalyst. The purpose of
sulfonation is to graft the –SO3 group on the carbon support. This can be done by
several pathways with different starting chemicals and operating procedures.
Folasegun, et al. (2014) has studied two types of sulfonation methods. These
two methods include the direct sulfonation with sulfuric acid, H2SO4 and sulfonation
by using p-toluenesulfonic acid (PTSA). In this study, glucose will be carbonised to
form carbon material. For direct sulfonation with H2SO4, 5 g of pyrolysed carbon and
50 cm3 of concentrated H2SO4 was heated with nitrogen flow at 150 °C for 10 hours.
Next, the mixture was cooled at room temperature and washed with distilled water
until no more impurities detected. Synthesised catalyst was then dried in vacuum oven
for 10 hours at 60 °C. On the other hand, for sulfonation with PTSA, 5 g of carbon
material, 2.5 g of PTSA and 20 cm3 of de-ionized water was mixed in Teflon-lined
autoclave at 150 °C for 5 hours. Catalyst produced was filtered, washed with distilled
water and dried in vacuum at 100 °C for 4 hours. Catalyst synthesised from H2SO4 and
PTSA will be noted as GBCSA and GBCPTSA respectively.
After sulfonation process, SO3H groups was attached on the polycyclic
aromatic carbon sheets of the carbon structure. Characterisation of catalyst showed
that the sulfur content and acid density of GBCSA was higher than GBCPTSA. The SO3H
density of GBCSA was about 1.0 mmol/g but GBCPTSA contained only 0.1 mmol/g of
SO3H. Since the SO3H density has direct relationship with the FAME yield, it is
obvious that using GBCSA has higher FAME yield (65-75%) than GBCPTSA of FAME
yield (8 – 11 % ) in esterification (reaction conditions: C. inophyllum oil = 0.5 g,
methanol = 5.5 g, carbon material = 0.3 g, reaction time = 5 hours, temperature =
150 °C). Both of these catalysts are thermally stable until 400 °C. By comparing these
two methods, direct sulfonation with sulfuric acid was proved to be a better sulfonation
method and can be employed in the future study.

27
Dehkhoda, West and Ellis (2010) had also studied the direct sulfonation
method by concentrated sulfuric acid. 20 g of hardwood biochar was mixed with 200
mL of concentrated H2SO4 and then heated to 150 °C for 24 hours. Heated mixture
was filtered and placed in cool distilled water. It was then washed with 80 °C distilled
water until it was neutralised and dried in the oven at 70 °C for 1 hour. Resulted
sulfonic group density was 0.65 mmol/g. Desorption of acid group occurred at around
650 °C which indicated a strong sulfonic acid sites on the catalyst.
Janaun, Abang and Anwar (2013) reported a sulfonation by fuming sulfuric
acid. Fuming sulfuric acid, or also known as Oleum is a chemical with different
composition of free sulfur trioxide dissolved in sulfuric acid. In this study, black
carbon carbonised from seaweed was heated with fuming sulfuric acid (20 wt. % free
SO3) at 210 °C for 4 hours. After sulfonation, mixture was washed with distilled water
until the washing water neutralised. Filtered sample was then dried in the oven at
110 °C. Total acidity of sample was measured to be 2.01 ± 0.03 mmol/g and SO3H
content of 0.28 mmol/g. The catalyst is thermal stable until the 240 °C.
Sulfonation by fuming sulfuric acid was also investigated by Liu, et al. (2013).
Sulfonation was done by mixing 0.8 g of carbonized mater (corn straw) and 10 mL of
fuming sulfuric acid (50 wt. % SO3) in a round bottom flask and heated in an oil bath
at 80 °C for 4 hours. Mixture was diluted with distilled water after cooled to room
temperature. Water-circulating pump was used to filter the sample and then washed
thoroughly with hot distilled water to remove impurities like sulfate ions. Sample was
then dried at the temperature 60 °C in vacuo for 4 hours. The total acid density of the
catalyst synthesised was 2.64 mmol/g. It had a FAME yield of 92% at reaction
temperature of 60 °C for 4 hours with methanol: oil molar ratio of 3 and catalyst of 3
wt. % (carbonised at 300 °C for 1 hour).
Malins, et al. (2015) and Konwar, et al. (2015) had reported the catalyst
synthesis method of sulfonation by arylation using 4-sulfobenzenediazonium salts.
According to Malins, et al. (2015), Activated carbon (AC) grains were first dried at
100 °C for 6 hours. Then, 1 g of AC, sulfanilic acid, NaOH and deionized water (50 -
200 mL), depending on the sulfanilic/AC ratio) was stirred and heated or cooled to
28
temperature from 20 – 85 °C. NaNO2, NaOH and HCl were added with molar ratio of
sulfanilic acid to NaNO2, NaOH and HCl of 1:05, 1:0 and 3:0 respectively. Various
amount of water were used to completely solubilised reagents depending on the
reaction temperature. NaOH was used to maintain pH of reaction mixture at 7 to 8.
Reaction time (10 minutes) of arylation of AC was measured. Activated carbon
attached with 4-sulfophenyl group (ACPhSO3H) was obtained and washed with DI
water to neutral pH and refluxed with acetone for 3 hours. ACPhSO3H was dried at
65 °C for 6 hours in vacuum oven after separation and purification. Varying of reaction
conditions had affected the character of the catalyst. The resulted characters of the
catalyst will be discussed in Section 2.4.1.
Konwar, et al. (2015) had also studied on the sulfonation of activated carbon
formed from de-oiled waste cake (DOWC) of Jatropha curcas (J), P. pinnata (P) and
M. ferrea L. (M) by using 4-benzenediazoniumsulfonate (4-BDS), which is also known
as the radical sulfonation process. Similarly, sulfonation occurred when there were
covalent attachment of aryl radicals generated from the reduction of 4-BDS in the
presence of hypophosphorus acid, H3PO2 as the reducing agent. In the sulfonating
reaction, 15.2 g of sulfanilic acid was dispersed in 300 mL of 1 M HCl aqueous
solution in a three necked flask. The flask was then placed into ice water bath which
the temperature was controlled at 3 – 5 °C and the mixture stirred continuously. Then,
90 mL of 10% excess of 1 M NaNO2 aqueous solution was added and resulted in a
clear solution. About 16 g white precipitate of 4-BDS was formed and filtered after
stirring for another 1 hour at the same temperature. The white precipitate was
transferred into a beaker that contained 200 mL of deionised water and 60 mL of
ethanol. 1.5 g of activated carbon (AC) was then added and the temperature was
maintained at 3 – 5 °C, followed by addition of 30 – 32 % H3PO2 aqueous solution
subsequently. After stirred for another 30 minutes, 50 mL of H3PO2 was added and
mixture was stood for another 1 hour with occasional stirring. Sulfonated carbons
obtained were wash with acetone and dried in the vacuum. The total density catalyst
derived from J. curcas seed was 3.24 mmol H+/g.
Shuit and Tan (2014) had compared four different catalyst synthesis methods.
The sulfonation methods employed were in situ polymerisation of poly(sodium4-
styrenesulfonate) (PSS), in situ polymerisation of acetic anhydride and sulfuric acid,
29
thermal decomposition of ammonium sulfate and thermal treatment with concentrated
sulfuric acid. In this studied, multi-walled carbon nanotubes (MWCNTs) were used as
the catalyst support where SO3H groups will be attached to. MWCNTs was ultrasonic
treated with HNO3 to purify the nanotubes.
For the sulfonation by in situ polymerisation of PSS, 0.4 g of purified
MWCNTs was stirred in a mixture of 0.8 g PSS and 100 mL of deionised water for 10
hours at room temperature. The mixture was added with 1.6 g of (NH4)2S2O8 and then
stirred and heated for 48 hours at 65 °C. The mixture was diluted with deionised water
after it was cooled to room temperature and followed by sonication for 1 hour. Next,
mixture was filtered and mixed with 50 mL of 4 M H2SO4 and stirred for 24 hours at
room temperature and finally, the mixture was then wash with deionised water and
dried for 12 hours at 120 °C. Density of SO3H was 0.061 mmol/g. Desorption occurred
at around 300 °C, which is stable at reaction temperature. Palm fatty acid distillate
(PFAD) was use as the feedstock of the esterification reaction. It has the FAME yield
of 93.4% at reaction temperature of 170 °C for 3 hours with methanol/ PFAD ratio of
20 and 2 wt. % catalyst.
As for sulfonation by in situ polymerisation of acetic anhydride and sulfuric
acid, 0.2 g of purified MWCNT was mixed with 300 mL of acetic anhydride and 20
mL of concentrated H2SO4. Then, the mixture was then stirred and heated to
temperature of 70 °C for 2 hours and then continued to stir until it reached room
temperature. Sample was then filtered, washed and dried for 12 hours at 120 °C.
Synthesised catalyst was undergone several characterisation. The SO3H density of the
catalyst is 0.03 mmol/g. Desorption occurred at around 250 °C, which was proven to
be stable at reaction temperature. FAME yield of 85.8% was achieved at reaction
temperature of 170 °C for 3 hours with methanol/PFAD ratio of 20 and 2 wt. % catalyst.
Another method reported by Shuit and Tan (2014) was sulfonation by thermal
decomposition of ammonium sulfate. 0.4 g of purified MWCNTs were mixed with 30
mL of 10% ammonium sulfate solution. The mixture was then sonicated for 10 minutes
and then followed with heating it to 235 °C for 30 minutes. Sample was then washed
with distilled water and dried for 12 hours at 120 °C. With this method, desorption
occurred at around 250 °C, which was considered stable at reaction temperature.

30
Catalyst synthesised by thermal decomposition of ammonium sulfate had the FAME
yield of 88.0 % at reaction temperature of 170 °C for 3 hours with methanol/PFAD
ratio of 20 and 2 wt. % catalyst.
The fourth method studied by Shuit and Tan (2014) was sulfonation by thermal
treatment with concentrated sulfuric acid, similar to those mentioned in earlier phase.
The outcomes of these four catalyst synthesis sulfonation methods were compared and
in situ polymerisation of PSS was shown to be the method that had the highest FAME
yield and with highest density of SO3H groups in the catalyst. However, the
sulfonation by this method involved a series of processing steps that used many types
of chemicals and also required a relatively long reaction time of about 4 days. Thus,
sulfonation by thermal decomposition may be a better solution due to less time
consuming as well as involving less acidic chemicals. And the most important thing is
that the catalyst activity does not has big different with the sulfonation in situ
polymerisation of PSS.
The characterisation results and catalytic activity of the catalysts from
synthesis methods discussed was summarised in Table 2.2.
Table 2.2: Various Synthesis Method for Sulfonation of Carbon Catalyst
Literature Synthesis Method Conditions
Acid Density of
Catalyst, SO3H
(mmol/g)
Folasegun et
al. (2014)
Direct sulfonation with
sulfuric acid, H2SO4
T: 150 °C
Time: 10 hours
1.0
Sulfonation by using p-
toluenesulfonic acid (PTSA)
T: 150 °C
Time: 5 hours
0.1
Dehkhoda,
West and
Ellis (2010)
Direct sulfonation with
sulfuric acid, H2SO4
T: 150 °C
Time: 24 hours
0.65

31
Table 2.2 (continued): Various Synthesis Method for Sulfonation of Carbon
Catalyst
Literature Synthesis Method Conditions
Acid Density of
Catalyst, SO3H
(mmol/g)
Janaun,
Abang and
Anwar
(2013)
Sulfonation by fuming sulfuric
acid (20 wt. % free SO3)
T: 210 °C
Time: 4 hours
0.28
Liu et al.
(2013)
Sulfonation by fuming sulfuric
acid (50 wt. % free SO3)
T: 80 °C
Time: 4 hours
Total acid: 2.64
mmol/g
S content: 7.81%
Kristap et
al. (2015)
sulfonation by arylation using
4-sulfobenzenediazonium salts
Without H3PO2
T: 70 °C
Time: 10
minutes
Total acid: 0.22
mmol/g
Konwar, et
al. (2015)
sulfonation by arylation using
4-benzenediazoniumsulfonate
(4-BDS)
With H3PO2
T: 3 - 5 °C
Time: 1 hour
Total acid: 3.24
mmol/g
S content and
SO3H density not
measured
Shuit et al.
(2014)
In situ polymerisation of
poly(sodium4-styrenesulfonate)
(PSS)
T: 65 °C
Step1: 10 hours
Step1: 48 hours
Step1: 24 hours
0.61
In situ polymerisation of acetic
anhydride and sulfuric acid
T: 70 °C
Time: 2 hours
0.03
Thermal decomposition of
ammonium sulfate
T: 235 °C
Time: 30
minutes
0.029
Thermal treatment with
concentrated sulfuric acid
T: 250 °C
Time: 12 hours
0.016

32
2.4.1 Effect of Synthesis Variables
For the synthesis method selected in one study, reaction conditions can be varied to
obtain the optimum conditions that are able to produce the catalyst with highest acid
density which correspond to the FAME yield. Synthesis variables like weight ratio of
acid to carbon, reaction temperature and reaction time can be studied.
As mentioned, Malins, et al. (2015) that employed arylation of activated carbon
grains (AC) with 4-sulfobenzenediazonium salt from sulfalinic acid to obtain
ACPhSO3H has varied the catalyst synthesis parameters to study the effect of these
parameters on the resulted catalyst synthesised. This study was also conducted in order
to optimise the synthesis conditions that are able to maximise the catalyst performance
and properties. Experiment parameters of weight ratio sulfanilic acid to AC and
reaction temperature were varied. This research acts as an example in varying the
synthesis parameters for the future researches.
Different weight ratio of sulfanilic acid to AC (0.14/1, 0.70/1, 1.4/1, 3.5/7, 7/1,
14/1) were used. The effect of these different ratios on the S content on ACPhSO3H
was investigated. As shown in Figure 2.8, weight ratio of sulfanilic acid to AC of 7/1
has achieved the maximum PhSO3H density attached (0.59 mmol H+/g). Section 2.4
had mentioned that the reaction was carried out from temperature of 20 to 85 °C. So,
temperature of 20, 30, 50, 70, 85 °C were employed when conducting the catalyst
synthesis reaction without the presence of H3PO2 as reducing agent. According to
Figure 2.9, the density of PhSO3H on AC increased with the increase of temperature
until 70 °C was reached. Further increase in temperature will reduce the efficiency.
Reaction temperature of 70 °C gave PhSO3H density of 0.72 mmol H+/g.
Weight ratio of chemical to carbon material and temperature were just some of
the examples of parameters can be varied. The effect of different molar ratio of
chemicals used in the synthesis, reaction time, concentration of chemicals and many
more other parameters can also be studied by preparing a number of samples
synthesised with varying parameters and compared the properties of catalyst and the
catalyst activity between these samples.

33
Figure 2.8: Effect of Weight Ratio of Sulfanilic Acid to AC on PhSO3H Density
(Malins, et al., 2015)
Figure 2.9: Effect of Reaction Temperature of Sulfanilic Acid to AC on PhSO3H
Density (Malins, et al., 2015)
2.5 Characterisation of Synthesised Catalyst
Characterisation of catalyst is done to study the properties of the catalyst
synthesised. Properties like surface morphology, thermal stability, acid density,
functional groups attached and many more are studied to verify whether or not the
synthesis method is suitable to be used to produce the catalyst. Characterisation of
catalyst can be carried out by using different types of instrument available in the
laboratory. Table 2.3 shows several examples of catalyst characterisation completed
by researches. The most common characterisation done includes Scanning Electron

34
Microscopy (SEM), FT-IR spectra analysis, back titration for acid density and Thermal
gravimetric analysis (TGA).
Table 2.3: Catalyst Characterisation
Literature Instrument/ Method Description
Folasegun,
et al. (2014)
Nitrogen adsorption/desorption
conducted at -196 ℃ by using
Automatic Surface Analyzer
and Porosity
To determine surface area of
carbon catalyst obtained
Scanning Electron Microscopy
(SEM) connected to Energy-
Dispersive X-ray Spectroscopy
(EDX)
To obtain structural information
and amount of sulfur on catalyst
X-ray Diffractometer (XRD)
with Cu Kα radiation
- λ = 0.1540 nm
- 40 kV and 40 mA
- Range = 2Ѳ of 10° to 90°
- Scanning Speed: 0.05°/min
To study the structure and
crystallinity of the carbon
catalyst
FT-IR with KBr pellets and
Raman spectroscopy
To determine the functional
groups attached
Differential Thermal Analysis/
Simultaneous
Thermogravimetric (DTA-TG)
- Temperature: 900 °C
- Rate: 10 °C/min
To determine the thermal
stability of catalyst
Janaun,
Abang and
Anwar
(2013)
Back titration method by first
mixing catalyst with 0.008 M
NaOH
- Titrant: 0.02 M HCl
To measure total acidity of the
catalyst
FT-IR equipped with
Attenuated Total Reflectance
(ATR)
To determine functional groups

35
Table 2.3 (continued): Catalyst Characterisation
Literature Instrument/ Method Description
Janaun,
Abang and
Anwar
(2013)
Scanning Electron Microscopy
(SEM) connected to EDX
To study the surface
morphology and percentage of
carbon, oxygen and sulfur in the
catalyst
Thermal gravimetric analysis
(TGA)
- Temperature range: 30 to
400 °C ramped at 10 °C/min
- Nitrogen flow: 100 mL/min
To study the thermal stability of
the catalyst
Shuit and
Tan (2014)
Zetasizer Nano-ZS To determine the zeta potential
of MWCNT
FT-IR spectra analysis To determine the presence of
SO3H group in sample
Konwar, et
al. (2015)
Transmission Electron
Micrograph (TEM)
- Voltage: 200 kV
- Resolution: 0.4 nm
To obtain the TEM of catalyst
Carlo Erba Sorptomatic 1990
- BET equation (P/Po = 0.05-
0.3)
- Barrett-Joyner-Halenda
(BJH) method
BET was used to determine the
specific area whereas BJH
method was used to determine
the pore size distribution of the
catalyst
Temperature-programmed
Adsorption-desorption of
Ammonia (TPD)
- Temperature: 100 to 500 °C
- Heating rate: 10 °C/min
To determine the strength and
acid sites of the catalyst

36
2.6 Characterisation of Feedstock and Products
Feedstock are vegetable oil or animal fats that will react with alcohol (normally
methanol) to form biodiesel. When free fatty acids (FFA) content of the oil is high, the
feedstock will undergo esterification to form fatty acid methyl ester (FAME). Acid
density of the oil feedstock and the composition of the acids in the feedstock will be
determine prior to or after the reaction to ensure that acid catalyst is used when FFA
content of feedstock is high.
The FFAs contained in the oil are the saturated and unsaturated fatty acid with
different carbon to double ratio (C: D). Palmitic acid (16: 0), stearic acid (18:0) and
lauric acid are some examples of saturated fatty acids. Oleic (18: 1), linoleic acid (18:
2) and linolenic acid (18: 3) are some example of free fatty acids present in the oil.
Composition (%) of these fatty acids are determined in the experiment.
Malins, et al. (2015) followed the standard ISO 5509 whereby the fatty acid
composition in the Rapeseed oil was determined by using rapeseed oil fatty acid
methyl ester with gas chromatography (GC) analysis equipped with FID and a
capillary column of dimension 30 m × 250 µm × 0.25 µm. Detector temperature was
programmed at 390 °C and column temperature of 200 °C for 25 minutes. Helium was
flow at the rate of 2 mL/min as the carrier gas where 1 µL of sample was injected.
Acid composition of the rapeseed oil fatty acid was also determined by GC analysis
according to the standard EN 14103.
The yield of FAME was determined by using gas chromatography equipped
with FID and polar capillary column (30 m × 0.25 mm i.d. × 0.25 µm) with methyl
heptadeconoate as internal standard according to (Ezebor, et at., 2014). European
regulation procedure EN 14103 was followed to analyse and calculate the FAME
content of the samples. FAME yield was calculated with equation 2.1.

37
FAME yield (%) = ∑ A− AIS
AIS ×
CIS × VIS
msample × 100% (2.1)
where
∑ 𝐴 = total peak area
AIS = methyl heptadeconoate peak
CIS = concentration of methyl heptadeconoate solution (mg/mL)
VIS = volume of methyl heptadeconoate solution used (mL)
msample = mass of sample used (mg)
Shu, et al. (2010) claimed that the FFA and FAME have very close molecular
size that may lead to overlapping of peak when these two material was detected by
high performance liquid chromatography (HPLC) and resulting in peak area
calculation error. Thus, the conversion of FFA in the feedstock can be determined by
calculating the acid value of both feedstock and products. According to ISO
1242:1999 the measurement of acid value (mg KOH/g) can be measured by using
titration method. Potassium hydroxide, KOH was used as the titrant and the amount of
KOH used to neutralise the feedstock and products was recorded. Then, conversion of
FFA was determined by calculating the difference of acid value between feedstock and
product.
2.7 Biodiesel Production Experiment
Liu, et al. (2013) had reported the catalytic reaction procedure. A 100 mL flask that
was equipped with magnetic stirrer was used for the esterification reaction. Reaction
temperature of 60 °C was maintained. Reaction mixture consisted of 10 g of oleic acid,
4.3 mL of methanol with 3 wt. % of catalyst. The reaction mixture was stirred at the
speed of 100 rpm for 4 hours. After completed reaction, the catalyst was filtered and
washed. Reaction products was transferred to three necked flask to remove water and
methanol by reduced pressure distillation.

38
Shu, et al. (2010) had carried out the reaction in an autoclave reactor equipped
with magnetic stirrer. Mixed oil (rapeseed, cottonseed and soybean acidified oils) and
synthesised catalyst were charged into the autoclave reactor by a pump. The reaction
mixture was stirred at the rotation speed of 240 rpm at 140 °C. When the reaction is
completed reduced pressure distillation was used to remove the FAME from the
reaction mixture. After the reaction mixture was cooled, it was reduced to pressure of
about 3 mm Hg and heated to 240 °C and maintained for 90 minutes. The reaction
mixture was cooled and filtered after 90 minutes. Filtrate was then allowed to settle
and it will be separated into two layers. The aqueous phase consisted of water,
methanol and glycerol whereas FAME is contained in the oil phase.
2.7.1 Stability and Regeneration Test
Stability test is important to be carried out for the catalyst synthesised. After each time
catalyst is used in the biodiesel production process, there is possibility that the SO3
grafted on catalyst will be leached during the reaction reducing the activity of the
catalyst in the next cycle of reaction. Thus, the activity of the catalyst after several
consecutive cycles with and without regeneration is studied.
Folasegun, et al. (2014) had studied on the stability of the catalyst synthesised
from C. inophyllum seed cake derived carbon with sulfonation by heat treatment with
concentrated H2SO4. Operation stability was compared between catalyst with 1 hour
(cat -1) and 5 hours (cat – 2) carbonization time. Catalyst with 1 hour carbonization
time has smaller carbon sheets and shows significant leaching. The yield of FAME at
5th cycle is 38.9% and 50.3% for 1 hour and 5 hours carbonization time respectively.
Regeneration of catalyst can be achieve by washing with tetrahydrofuran (THF). Table
2.4 showed the FAME yield after several recycling cycles of catalyst.

39
Table 2.4: Effect of Catalyst Recycling on the Yield of FAME (Folasegun, et al.,
2014)
Cycles Yield (%)
Cat – 1 a Cat – 2 b
Fresh 99.0 99.0
1 96.2 97.0
2 90.8 93.5
3 75.1 82.8
4 65.4 72.4
5 38.9 50.3
(Reaction condition: vegetable oil 5 g, methanol = 5.5 g, catalyst = 0.38 g, temperature
= 180 °C, reaction time a = 4 hours, reaction time b = 5 hours)
Malins, et al. (2015) claimed that leaching of PhSO3H group acts as the main
problem of the AC based catalyst. PhSO3H groups in the catalyst (ACPhSO3H catalyst
synthesised by Arylation of activated carbon grains (AC) with 4-
sulfobenzenediaonium salt from sulfalinic acid) had decreased by about 32% (0.49
mmol H+/ g) after seven reaction cycles (Reaction condition: molar ratio rapeseed
oil/methanol = 1/20, 10 wt. % catalyst, temperature = 65 °C, reaction time = 2 hours).
As shown in Figure 2.10, regeneration of catalyst enable it to achieve and increment
of PhSO3H groups to about 0.7 mmol H+/ g (close to freshly prepared catalyst).
Figure 2.10: Comparison between Catalytic Reaction Cycles With and Without
Regeneration of Catalyst (Malins, et al., 2015)

40
Shuit and Tan (2014) has compared the reusability of catalyst synthesised from
four different methods through five consecutive cycles of esterification. Catalyst
separated from reaction mixture was sonicated in methanol for 20 minutes and dried
at 120 °C for 12 hours. FAME yield after each cycles of reaction by catalysts
sulfonated with in situ polymerisation of poly(sodium4-styrenesulfonate), in situ
polymerisation of acetic anhydride and H2SO4, thermal decomposition of ammonium
sulfate and thermal treatment with concentrated sulfuric acid is shown in Figure 2.11
and compared. The results showed that after 5 cycles of catalytic reaction, the FAME
yield was not dropped significantly and resulted to be at the range to 70 to 80%.
Regeneration of catalyst could be employed to achieve higher yield of FAME.
Figure 2.11: Reusability of the Sulfonated MWCNT in the Esterification of
PFAD (Shuit and Tan, 2014)

41
2.7.2 Optimisation Study
Although the reaction conditions stated in Section 2.7 are feasible for the catalytic
reaction, determination of the optimum conditions is still important to ensure that the
performance of catalyst in esterification and transesterification process is optimised.
In this study, the optimum conditions for the reaction of biodiesel production are
obtained by varying the reaction conditions until the highest FAME yield is achieved.
Variables like molar ratio of oil to methanol, catalyst concentration, reaction time and
reaction temperature are investigated by researchers.
Folasegun, et al. (2014) had investigated on the effect of molar ratio of C.
inophyllum oil (15% FFA) to methanol (1:12 to 1:45), catalyst loading (1.5 – 7.5
wt. %), temperature (130 – 200 °C) and time (1 – 5 hour(s)) on the FAME yield. As
shown in Figure 2.12, the increase of molar ratio of C.inophyllum oil to methanol
showed positive response towards the yield of FAME until it reaches the ratio of 1:30.
Further increase of molar ratio after 1:30 give no significant effect to the FAME yield
and this is probably because the excess dilution that lead to the reduce of collision
frequency and flooding of small surface area of catalyst.
The FAME yield increases with the increase of catalyst wt. %. Optimum
catalyst concentration was achieved at about 7.5 wt. %. No significant increase of
FAME yield is observed at higher than 7.5 wt. % catalyst concentration. On the other
hand, increase of temperature increases the yield of FAME 99% yield of FAME was
achieved at the temperature of 180 °C. However, further increment of reaction energy
may cause reverse production according to Figure 2.12. Then, FAME yield increase
gradually with time. 99% yield of FAME was achieved with the reaction time of 5
hours.

42
Figure 2.12: Effect of (A) Molar ratio of methanol and oil (B) Catalyst
Concentration (C) Temperature and (D) Time on the FAME Yield (Folasegun,
et al., 2014)
Liu, et al. (2013) which reported the corn straw derived carbon based acid
catalyst sulfonated by fuming H2SO4 had studied on the effect of molar ratio of oleic
acid to methanol and catalyst concentration. Molar ratio of methanol to oleic acid at 4,
5, 6, 7 and 8 was tested. Highest FAME yield was obtained at molar ratio 7:1 of
methanol/oleic acid. Then, catalyst weight percentage of 3, 4, 5, 6, 7 and 8 wt. % was
studied and compared. Highest FAME yield was achieved when catalyst concentration
of 7 wt. % was used.
Table 2.5 summarised the optimum catalytic reaction conditions obtained
through the optimisation study from several literatures. This is very useful when
deciding the reaction conditions in the future to achieve the maximum FAME yield
and optimised the catalytic activity of the catalyst synthesised.

43
Table 2.5: Summary of Optimum Reaction Conditions from Several Literatures
Literature Feedstock
Used
Optimum Conditions
Feedstock/
Methanol Molar
Ratio
Catalyst
Loading
(wt. %)
Temperature
(°C)
Time
(hours)
Dehkhoda,
West and
Ellis (2010)
Canola Oil 1/18 5 60 3
Folasgun,
et al. (2014)
C. inophyllum
oil 1/30 7.5 180 5
Ezebor, et
al. (2014) Palmitic Acid 1/18 9 65 5
Liu, et al.
(2013) Oleic acid 1/7 7 60 4
Shu, et al.
(2010)
Mixed
vegetable Oil 1/17 0.2 220 4.5
Shu, et al.
(2009) Cottonseed oil 1/18 1.5 260 3
CHAPTER 3
3 METHODOLOGY
3.1 List of Materials and Apparatus
The following sections are the list of materials, apparatus and equipment required to
run the whole research. All of the things listed below were prepared prior to the start
of the experiments for further studies and investigation.
3.1.1 Materials and Chemicals
This research involves various types of chemicals and raw materials that have to be
prepared prior to the start of experiment. Seaweed (brown algae) is selected as the raw
material to synthesise biomass-based carbon acid catalyst. Sulfonation of carbon will
be done by thermal decomposition of ammonium sulfate. The types, sources, amount
and usage of materials and chemicals required throughout the whole experiment in the
study are listed in Table 3.1, 3.2 and 3.3.

45
Table 3.1: List of Chemicals and Materials Required for the Experiments
Chemicals/Materials Source Quantity Usage
Seaweed (brown algae) Beach at Labuan 5 kg
Raw material for
carbon support of the
catalyst
Palm Fatty Acid Distillate
(PFAD) Malaysia 1 L
Feedstock for the
synthesis of
biodiesel
10 %(w/v) Ammonium
Sulfate
Salt Crystal from
OmniPur 2 L
Chemical for
synthesis of catalyst
Methanol Fisher Scientific 2 L
Reactant for the
synthesis of
biodiesel
Potassium Hydroxide
Pellet form
Friendemann
Schmidt
1 kg
Titrant for
determination of
acid value
Phenolphthalein R & M Chemical 50 mL pH indicator
Hexane Synerlab 2 L To be used as a
solvent for FAME
0.1 M NaOH GENE Chemicals 2 L To determine acid
density of catalyst
0.2 M HCl Reagents
DUKSAN 2 L
To determine acid
density of catalyst
30 v/v% Phosphoric Acid Reagent
DUKSAN
To activate biomass
Distilled Water - -
To wash of excess
reactant from
catalyst after
reaction
Oil Saji Cooking Oil 500 mL To use as the oil bath
for heating
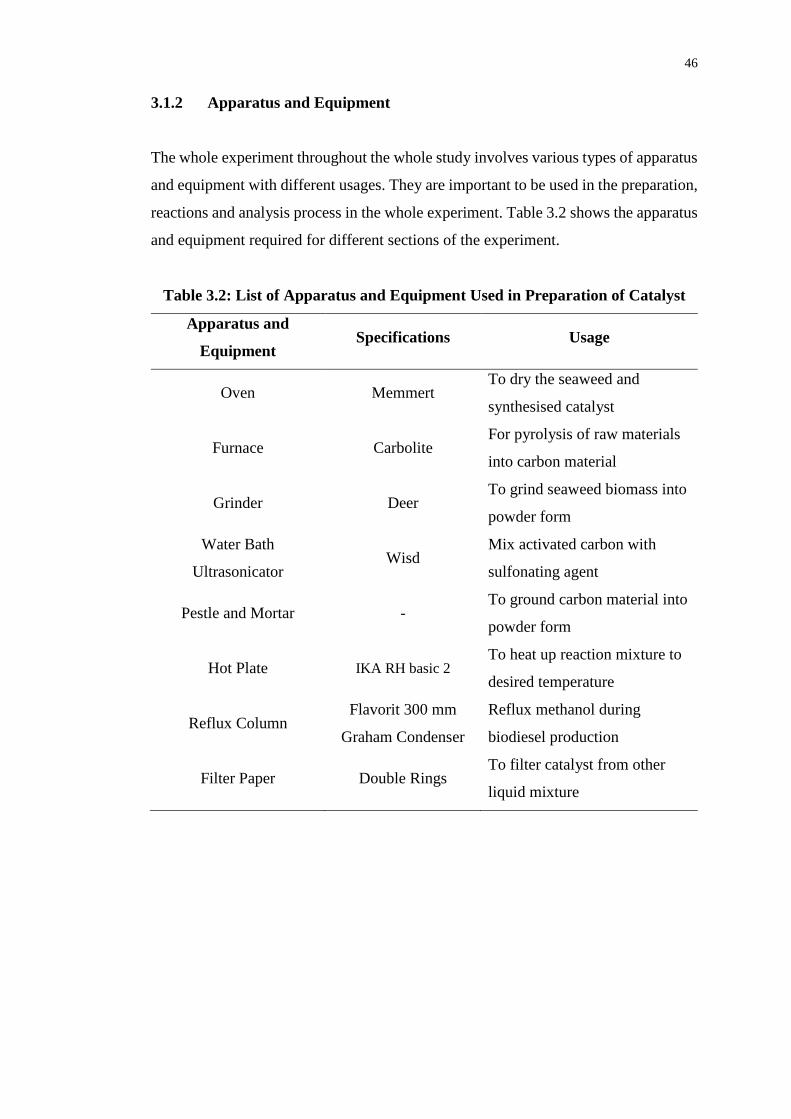
46
3.1.2 Apparatus and Equipment
The whole experiment throughout the whole study involves various types of apparatus
and equipment with different usages. They are important to be used in the preparation,
reactions and analysis process in the whole experiment. Table 3.2 shows the apparatus
and equipment required for different sections of the experiment.
Table 3.2: List of Apparatus and Equipment Used in Preparation of Catalyst
Apparatus and
Equipment Specifications Usage
Oven Memmert To dry the seaweed and
synthesised catalyst
Furnace Carbolite For pyrolysis of raw materials
into carbon material
Grinder Deer To grind seaweed biomass into
powder form
Water Bath
Ultrasonicator Wisd
Mix activated carbon with
sulfonating agent
Pestle and Mortar - To ground carbon material into
powder form
Hot Plate IKA RH basic 2 To heat up reaction mixture to
desired temperature
Reflux Column Flavorit 300 mm
Graham Condenser
Reflux methanol during
biodiesel production
Filter Paper Double Rings To filter catalyst from other
liquid mixture
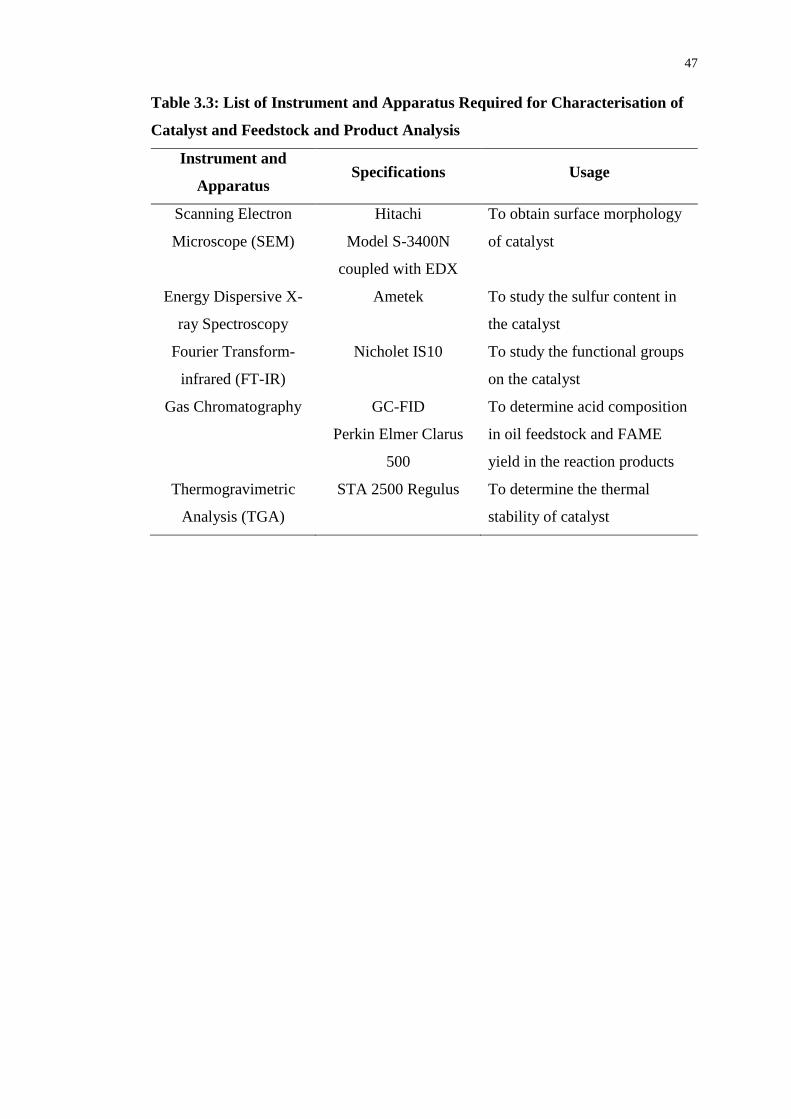
47
Table 3.3: List of Instrument and Apparatus Required for Characterisation of
Catalyst and Feedstock and Product Analysis
Instrument and
Apparatus Specifications Usage
Scanning Electron
Microscope (SEM)
Hitachi
Model S-3400N
coupled with EDX
To obtain surface morphology
of catalyst
Energy Dispersive X-
ray Spectroscopy
Ametek To study the sulfur content in
the catalyst
Fourier Transform-
infrared (FT-IR)
Nicholet IS10 To study the functional groups
on the catalyst
Gas Chromatography GC-FID
Perkin Elmer Clarus
500
To determine acid composition
in oil feedstock and FAME
yield in the reaction products
Thermogravimetric
Analysis (TGA)
STA 2500 Regulus To determine the thermal
stability of catalyst

48
3.2 Overall Research Methodology
This study involves a series of methodology steps throughout the whole experiment
with the synthesis of carbon based solid acid catalyst as the main focus of the research.
The research methodology can separated into several sections and summarised as show
in Figure 3.1 below.
Figure 3.1: Summary Procedures of the Experiment
Preparation of Raw Materials
• Drying of colleced seaweed
• Cutting dried seaweed into small pieces
Synthesis of Acid Cataylst
• Carbonisation of seaweed
• Sulfonation of carbon with Ammonium sulfate
• Sieve catalyst into desired size
Characterisation of Catalyst
• SEM-EDX
• BET Methodology
• FT-IR
• TGA
• Titration
Production of Biodiesel
• Reflux of methanol and oil with catalyst
Process Study
• Effect of ammonium sulfate solution concentration and reaction time of catalyst synthesis reaction on acid density and FAME yield
• Effect of catalyst loading, and reaction time during biodiesel production conditions on FAME yield
Product Analysis
• Gas Chromatography (GC) analysis for FAME

49
3.3 Synthesis of Catalyst
3.3.1 Carbonisation of Seaweed
The collected seaweed was washed and dried in the oven at 80 °C for overnight. Next,
the dried seaweed pieces was crushed into smaller piece and grinded into powder form
by using grinder. Then, the seaweed powder will be added with 30 v/v% phosphoric
acid solution with the ratio of 1 to 3 powder to solution ratio and left for overnight.
Activated seaweed powder was then be wash with distilled water and dried in the oven
at 80 °C for overnight. The activated seaweed was sent to tube furnace for pyrolysis
process. Pyrolysis of seaweed was done at the rate of 5 °C/min until the desired
temperature (200, 300, 400, 500 and 600 °C) is reached and kept constant for 2.5 hours.
The summary of the seaweed carbon preparation process are shown in Figure 3.2. The
resulted brown to black materials was then grounded into powder form by using pestle
and mortar. Carbon materials will then be analysed by using Brunauer-Emmett-Teller
method and Scanning Electron Microscopy (SEM) which the procedures will be
explained at the following sections.
Figure 3.2: (A) Washing of Collected Fresh Seaweed (B) Drying of Seaweed (C)
Grinding of Seaweed into Powder Form (D) Activation of Seaweed in 30 v/v%
Phosphoric Acid (E) Pyrolysis of Seaweed in Furnace (F) Grounding of Carbon
C
A
B
A A
B
D E
B
F
E

50
3.3.2 Sulfonation of Carbon
The sulfonation of carbon was done by the method thermal decomposition of
ammonium sulfate, (NH4)2SO4. In this experiment, different concentration of
(NH4)2SO4 (5, 10, 20, 30 and 40 w/v%) and carbon material was mixed and
ultrasonicated with water bath ultrasonicator for 10 minutes. The mixture was then
heated to the temperature of 235°C in a furnace and for various durations (15, 30, 60
and 90 minutes). After cooled, the sample was washed with distilled water to remove
excess (NH4)2SO4 and filtered. Filtered sample was then dried in an oven at 80 °C
overnight. Figure 3.3 shows the summarised procedure for sulfonation of seaweed
carbon.
Figure 3.3: (A) Water bath Ultrasonication of Carbon and Ammonium Sulfate
Mixture (B) Heating to 235 °C in Furnace (C) Washing and Filtration of
Catalyst
C
A
B
A
A
B
51
The variation of parameters was studied to obtain the optimum parameters so
that the synthesised solid acid catalyst is grafted with maximum acid density and thus,
the FAME yield is maximised. When experiment was done at different heating
duration, the condition was kept constant at 10 minutes ultrasonication, temperature of
235 °C by using 30 ml of different concentration of ammonium sulfate solution.
Experiment was repeated with the heating duration of 15, 30, 60 and 90 minutes and
each of the heating duration, 30 ml of (NH4)2SO4 solution with different concentration
at 5, 10, 20, 30 and 40 w/v% was used as the sulfonating agent with other conditions
remained constant at 10 minutes ultrasonication and heating temperature of 235 °C.
3.4 Catalyst Characterisation
Characterisation of catalyst was done on all the seaweed-based acid catalyst
synthesised previously at different synthesis parameters. Characterisation was carried
out to study the effect of various synthesis parameters on the chemical and physical
properties of the catalyst by using different equipment to study on different properties.
The catalyst with the best properties in overall will be selected to be used in the process
study on biodiesel production. Normally, the quality of the catalyst was determined
with the SO3H density attached as the main criteria.
3.4.1 Surface Morphology
The surface morphology of catalyst was observed under Scanning Electron
Microscopy (SEM) (Hitachi Model S-3400N). The sulfonated carbon catalysts were
scanned at the magnification of 500x, 2000x and 10,000x. When the scanning was
done, the diameter of the pore size can be estimated by measuring the length of pores
on the micrographs manually referring to the scale provided on the images. The SEM
connect to Energy Dispersive X-ray Spectroscopy (EDX) was used to obtain the sulfur
(S), carbon (C) and oxygen (O) content in the catalyst.

52
3.4.2 Brunauer-Emmet-Teller Methodology
Brunauer-Emmet-Teller (BET), surface area of catalyst was analysed with the
Sorptomatic 1990 by using inert Nitrogen liquid at temperature -196 °C as the coolant.
For this surface analysis, two types of analysis were carried out, which were the blank
analysis and the sample analysis. Blank analysis was carried out by using Helium gas
to determine the dead volume of the measurement cell. Then, sample analysis was
done by using Nitrogen gas as the adsorbate and it will be absorbed into the sample
for the measurement of surface area.
3.4.3 Fourier Transform - Infrared Spectroscopy
Fourier transform-infrared spectroscopy (FT-IR) (Nicholet IS10) was used to study the
functional groups attached in the catalyst. This study was done by putting the catalyst
on top of the diamond sample platform and fixed by the pressure tower and
compression tip. The component on the spectroscopy is shown in Figure 3.4. Scanning
by FT-IR spectroscopy was done in the range of 500 to 4000 cm-1. The FT-IR
absorbance spectra of the unsulfonated carbon and sulfonated carbon (catalyst) were
recorded.
Figure 3.4: FT-IR Spectroscopy Component (ChemWiki, 2013)
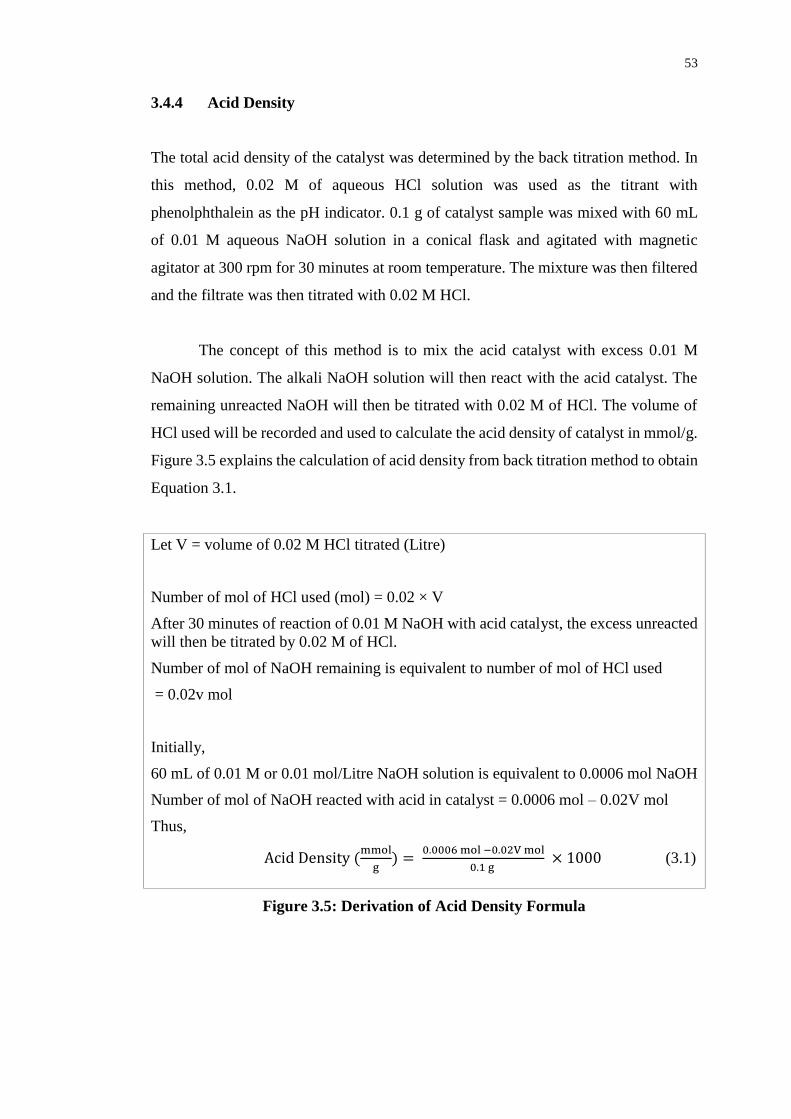
53
3.4.4 Acid Density
The total acid density of the catalyst was determined by the back titration method. In
this method, 0.02 M of aqueous HCl solution was used as the titrant with
phenolphthalein as the pH indicator. 0.1 g of catalyst sample was mixed with 60 mL
of 0.01 M aqueous NaOH solution in a conical flask and agitated with magnetic
agitator at 300 rpm for 30 minutes at room temperature. The mixture was then filtered
and the filtrate was then titrated with 0.02 M HCl.
The concept of this method is to mix the acid catalyst with excess 0.01 M
NaOH solution. The alkali NaOH solution will then react with the acid catalyst. The
remaining unreacted NaOH will then be titrated with 0.02 M of HCl. The volume of
HCl used will be recorded and used to calculate the acid density of catalyst in mmol/g.
Figure 3.5 explains the calculation of acid density from back titration method to obtain
Equation 3.1.
Let V = volume of 0.02 M HCl titrated (Litre)
Number of mol of HCl used (mol) = 0.02 × V
After 30 minutes of reaction of 0.01 M NaOH with acid catalyst, the excess unreacted
will then be titrated by 0.02 M of HCl.
Number of mol of NaOH remaining is equivalent to number of mol of HCl used
= 0.02v mol
Initially,
60 mL of 0.01 M or 0.01 mol/Litre NaOH solution is equivalent to 0.0006 mol NaOH
Number of mol of NaOH reacted with acid in catalyst = 0.0006 mol – 0.02V mol
Thus,
Acid Density (mmol
g) =
0.0006 mol −0.02V mol
0.1 g × 1000 (3.1)
Figure 3.5: Derivation of Acid Density Formula

54
3.4.5 Thermogravimetric Analysis
Thermogravimetric analysis (TGA) was done to study the thermal stability of catalyst.
The temperature of which the functional group will be detached from the carbon
support will be determined. This analysis was conducted by STA 2500 Regulus.
Sample of mass 5.308 g was placed in alumina crucible before transferring into the
thermal analyser and the temperature was ramped from room temperature to 100 °C at
the heating rate of 5 °C/min under nitrogen atmosphere at room temperature to 900 °C
and synthetic air atmosphere at temperature 900 °C to 1000 °C.
3.5 Feedstock Analysis
3.5.1 Acid Value Test
The acid value of the palm fatty acid distillate (PFAD) was determined by using
titration method. In this experiment, potassium hydroxide, KOH is used as the titrant
with propanol as solvent and phenolphthalein as pH indicator. 0.1 N of potassium
hydroxide solution was prepared by adding 1 L of water into 5.6 g of potassium
hydroxide pellet. Next, 1 g of biodiesel sample was added into the conical flask,
followed by 5 mL of propanol solvent and 1 mL of phenolphthalein. The mixture in
conical flask was titrated with KOH solution until a clear pink colour solution is
formed. The volume of KOH solution used in the titration was recorded. Acid value
was calculated by Equation 3.2:
Acid Value, AV (mg KOH/ g) = V ×N×MWKOH
Ws (3.2)
where
V = Volume of KOH solution used
N = Normality of KOH solution; 0.1 N
MWKOH = Molecular Weight of KOH; 56.11 g/mol
55
The FFA% can be converted from the acid value through Equation 3.3:
FFA% = Acid Value
1.99 (3.3)
3.6 Biodiesel Production
PFAD and methanol are used as the reactant in the reaction of producing biodiesel
(FAME). This experiment was set up as shown in Figure 3.6. 10 g of PFAD was mixed
with the amount of methanol equal to the methanol/oil molar ratio of 20:1 and then
added with 5 wt% of catalyst loading. The mixture was poured into a round bottom
flask and was immersed in an oil bath of 100 °C with methanol reflux for 4 hours at
rotation speed of 300 rpm by using magnetic stirring. When the reaction was
completed, the catalyst was then filtered out from the liquid product by using filter
paper and filter funnel.
The experiment was repeated with different esterification time of 2, 6 and 8
hours with catalyst loading of 5 wt%. Also, the effect of different catalyst loadings of
2.5, 10 and 15 wt% at 8 hours was studied. When experiment is repeated with different
catalyst loading and esterification time, other than the varying parameter, methanol to
oil molar ratio of 20:1 and oil bath temperature of 100 °C was remained constant for
all sets of experiment. The FAME yield was then recorded and compared between
different reaction conditions.

56
Figure 3.6: Esterification Reaction Set-up
3.7 Gas Chromatography Analysis
Gas chromatography Perkin Elmer Claurus 500) equipped with FID was used in the
study. In this GC analysis, Helium gas was used as the carrier gas with the flowrate of
2 ml/min at pressure 24.7 psi. The detector temperature was set to 220°C. Then, the
injector temperature and flame ionization temperature was set to 250 °C and 270 °C
respectively. ZB-FFAP GC biodiesel column (60 m × 0.25 mm × 0.25 µm) was used.
The analysis sample was prepared by diluting the oil sample with hexane as the solvent
according to the pre-determined dilution factor.

57
3.7.1 Determination of Acid Composition
The composition of acids in the PFAD like palmitic acid, stearic acid, oleic acid,
linoleic acid and other acids components were measured by using gas chromatography
(Perkin Elmer Claurus 500) equipped with FID. Homogeneous sulfuric acid was used
as the catalyst for the esterification reaction with methanol. The FAME yield obtained
was assumed to be 100% so that the concentration of methyl esters produced are
associated with the free fatty acid composition of the PFAD. For the GC analysis, 1.0
µL of FAME sample was injected into the ZB-FFAP GC biodiesel column to run the
analysis.
3.7.2 Biodiesel Yield Analysis
Biodiesel produced from esterification between methanol and PFAD in the presence
of synthesised catalyst was analysed with gas chromatography (GC) to determine the
yield of FAME produced in the product. 1.0 µL of oil sample was injected into the ZB-
FFAP GC biodiesel column to run the analysis. There are two types of analysis method
to determine the FAME yield, by using the internal standard or external standard. The
usage of external standard required the plot of external standard calibration curve in
order to determine the FAME yield.
To obtain the calibration curve for the methyl esters, methyl palmitate, methyl
stearate, methyl oleate and methyl linoleate was diluted with different amount of
hexane as the solvent to obtain the peak area on GC. Then, the graph of peak area of
different methyl esters concentration was plotted against the methyl esters
concentration as shown in Figure 3.7. An equation was obtained from each of the
plotted calibration curve and it was used to calculate the concentration of methyl esters
in the product. The total methyl esters that composed of methyl palmitate, methyl
stearate, methyl oleate and methyl linoleate of one sample will be used to calculate the
FAME yield by Equation 3.4.

58
Yield (%) = (∑ Concentration of each methyl esters)(
g
𝑔 𝑠𝑎𝑚𝑝𝑙𝑒) ×(mass of product produced)(g sample)
10 g PFAD (3.4)
Figure 3.7: Calibration Curves for (A) Methyl Palmitate (B) Methyl Stearate
(C) Methyl Oleate (D) Methyl Linoleate
A B
C D

CHAPTER 4
4 RESULTS AND DISCUSSIONS
4.1 Preliminary Stage Observation
Catalyst are prepared by different carbonisation temperatures, different sulfonation
durations and different concentrations of ammonium sulfate as sulfonating agent with
other conditions kept constant. Table 4.1 shows the preparation of seaweed based
activated carbon, SWAC at different temperatures. All carbonisation was done at the
duration of 2.5 hours with ramping rate of 5 °C/min. Figure 4.1(A) shows the
carbonised seaweed appeared as black powder. Table 4.2 shows the catalyst annotation
and the preparation conditions. Besides sulfonation duration and concentration of
ammonium sulfate, all sulfonation was done at 10 minutes sonication by using 30 ml
of ammonium sulfate as sulfonating agent at 235 °C. Figure 4.1(B) shows the
sulfonated catalyst and all catalyst present in black powder form.
Table 4.1: Carbon Samples and the Preparation Conditions
Carbon Sample Carbonisation Conditions
Duration (hours) Temperature (°C)
SWAC200 2.5 200
SWAC300 2.5 300
SWAC400 2.5 400
SWAC500 2.5 500
SWAC600 2.5 600

60
Table 4.2: Catalysts Samples and the Preparation Conditions
Carbonisation Conditions: Fixed at 2.5 hours at 5 °C/min
Sulfonation Conditions: 1.5 g of carbon, 10 minutes ultrasonication, 30 ml ammonium
sulfate solution at 235 °C
Catalyst
Sample
Carbonisation
Conditions Sulfonation Conditions Variables
Temperature
(°C)
Duration
(minutes)
Ammonium Sulfate
Solution Concentration
(w/v %)
Cat-A 200 30 10
Cat-B 300 30 10
Cat-C 400 30 10
Cat-D 500 30 10
Cat-E 600 30 10
Cat-A1 200 15 5
Cat-A2 200 15 10
Cat-A3 200 15 20
Cat-A4 200 15 30
Cat-A5 200 15 40
Cat-A6 200 30 5
Cat-A7 200 30 10
Cat-A8 200 30 20
Cat-A9 200 30 30
Cat-A10 200 30 40
Cat-A11 200 60 5
Cat-A12 200 60 10
Cat-A13 200 60 20
Cat-A14 200 60 30
Cat-A15 200 60 40
Cat-A16 200 90 5
Cat-A17 200 90 10
Cat-A18 200 90 20
Cat-A19 200 90 40

61
Figure 4.1: (A) SWAC Samples and (B) Catalyst Samples
4.2 Characterisation of Catalyst
In this study, catalysts that were synthesised through various sulfonation conditions.
Basically, catalysts were synthesised at different sulfonation duration with different
concentration of ammonium sulfate solution used as the sulfonating agent.
Characterisation of catalyst was done study the difference between the catalyst
produced from different sulfonation conditions. Characterisation of the catalyst was
done by 4 types of characterisation test, which are SEM, FT-IR, BET and TGA.
A
B

62
4.2.1 Scanning Electron Microscope
Scanning Electron Microscope was used to obtain the surface morphology of the
seaweed derived catalyst. Figure 4.2 has shown the SEM image of seaweed biomass
before carbonisation where Figure 4.3 shows the SEM images of seaweed carbon
carbonised at different temperature for 2.5 hours from seaweed biomass.
Figure 4.2: SEM Images of Seaweed Biomass Before Carbonisation at
Magnification (A) x500 and (B) x2000
A
B
A
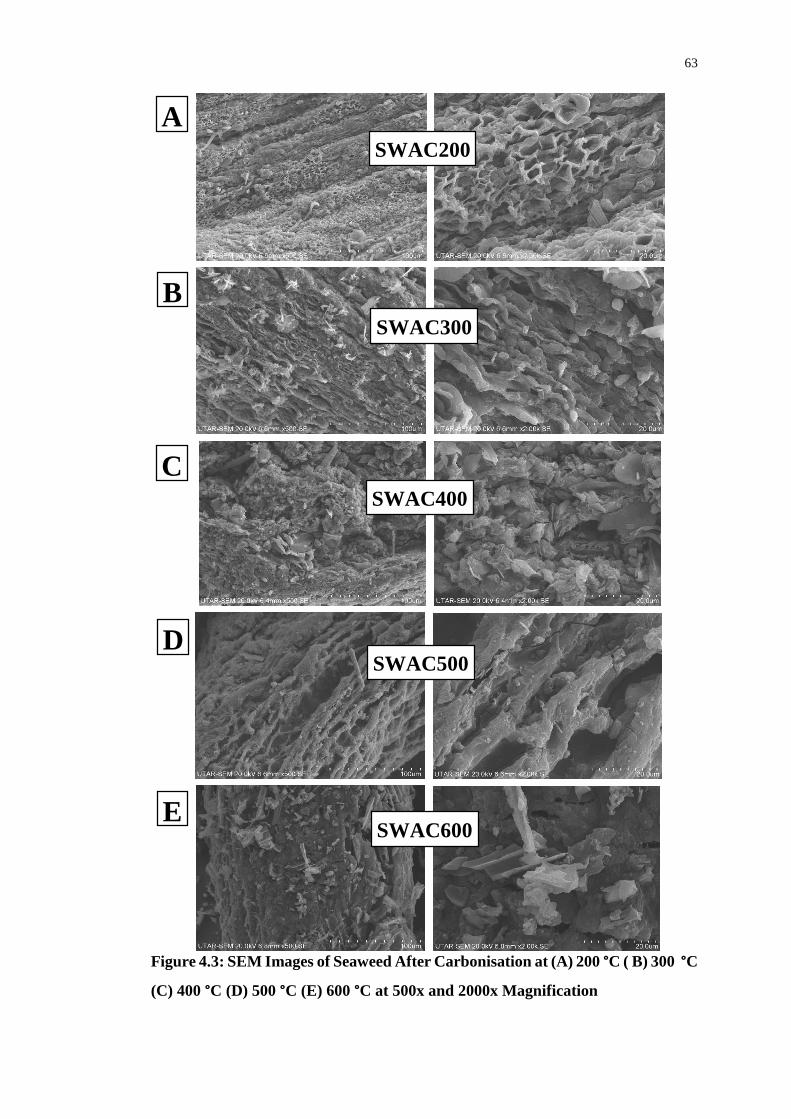
63
Figure 4.3: SEM Images of Seaweed After Carbonisation at (A) 200 °C ( B) 300 °C
(C) 400 °C (D) 500 °C (E) 600 °C at 500x and 2000x Magnification
SWAC200
SWAC300
SWAC400
SWAC500
SWAC600
B
A
E
C
D
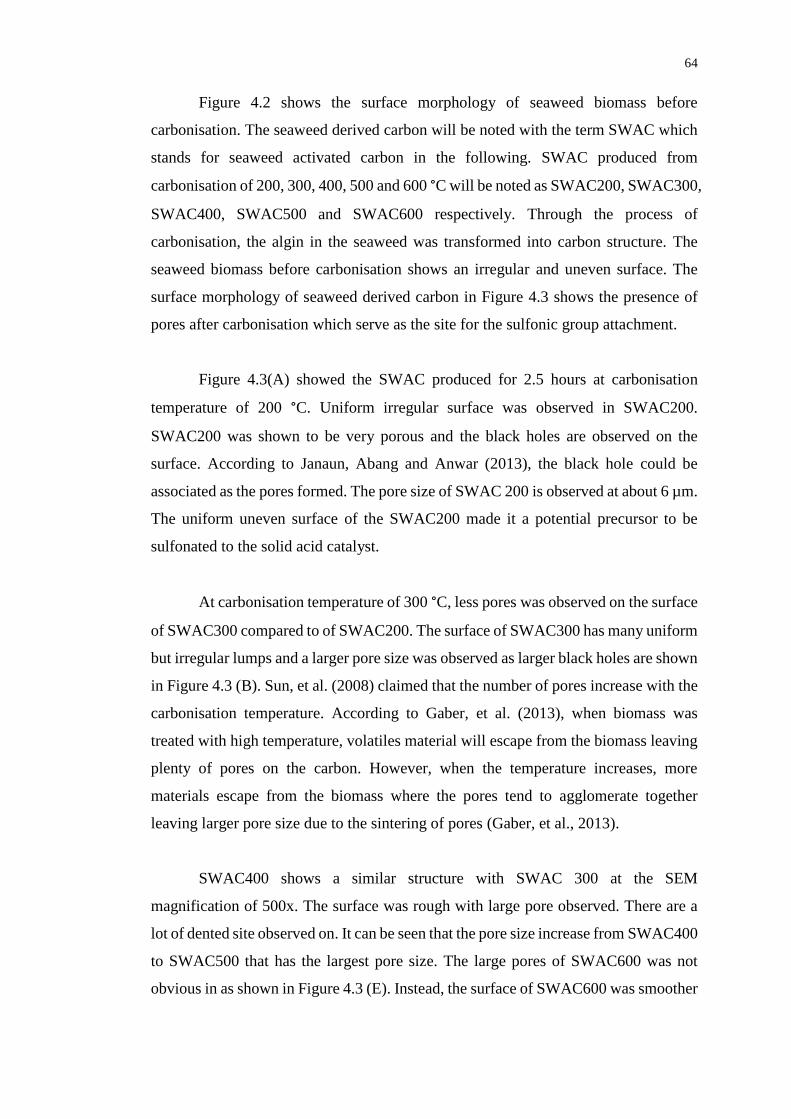
64
Figure 4.2 shows the surface morphology of seaweed biomass before
carbonisation. The seaweed derived carbon will be noted with the term SWAC which
stands for seaweed activated carbon in the following. SWAC produced from
carbonisation of 200, 300, 400, 500 and 600 °C will be noted as SWAC200, SWAC300,
SWAC400, SWAC500 and SWAC600 respectively. Through the process of
carbonisation, the algin in the seaweed was transformed into carbon structure. The
seaweed biomass before carbonisation shows an irregular and uneven surface. The
surface morphology of seaweed derived carbon in Figure 4.3 shows the presence of
pores after carbonisation which serve as the site for the sulfonic group attachment.
Figure 4.3(A) showed the SWAC produced for 2.5 hours at carbonisation
temperature of 200 °C. Uniform irregular surface was observed in SWAC200.
SWAC200 was shown to be very porous and the black holes are observed on the
surface. According to Janaun, Abang and Anwar (2013), the black hole could be
associated as the pores formed. The pore size of SWAC 200 is observed at about 6 µm.
The uniform uneven surface of the SWAC200 made it a potential precursor to be
sulfonated to the solid acid catalyst.
At carbonisation temperature of 300 °C, less pores was observed on the surface
of SWAC300 compared to of SWAC200. The surface of SWAC300 has many uniform
but irregular lumps and a larger pore size was observed as larger black holes are shown
in Figure 4.3 (B). Sun, et al. (2008) claimed that the number of pores increase with the
carbonisation temperature. According to Gaber, et al. (2013), when biomass was
treated with high temperature, volatiles material will escape from the biomass leaving
plenty of pores on the carbon. However, when the temperature increases, more
materials escape from the biomass where the pores tend to agglomerate together
leaving larger pore size due to the sintering of pores (Gaber, et al., 2013).
SWAC400 shows a similar structure with SWAC 300 at the SEM
magnification of 500x. The surface was rough with large pore observed. There are a
lot of dented site observed on. It can be seen that the pore size increase from SWAC400
to SWAC500 that has the largest pore size. The large pores of SWAC600 was not
obvious in as shown in Figure 4.3 (E). Instead, the surface of SWAC600 was smoother
65
than the others. Gaber, et al. (2013) reported that the increase of pore size will reduce
the surface area of the carbon. This will then result in lower active sites being attached
on the carbon surface and reducing the FAME yield.
Figure 4.4 shows the sulfonated SWAC200, by using 30 ml of 10w/v%
ammonium sulfate solution for 30 minutes at 235 °C (Cat-A7). It shows that there are
pieces of material covering on the surface of the catalyst. These materials may be the
ammonium sulfate solid that was still remained on the catalyst because the catalyst
was not washed properly after sulfonation. After all, the surface morphology of the
samples did not change much after sulfonation compared to the activated carbon in
Figure 4.3(A). According to Okamura, et al. (2006), the surface morphology has not
much difference on the carbon material after sulfonation. All SEM images of catalyst
synthesised at different conditions are attached in Appendix A.
Figure 4.4: SEM Image of Cat-A7
Remaining Ammoniumm
Sulfate deposit
Uncovered catalyst
surface
66
4.2.2 Brunauer-Emmet-Teller Analysis
Brunauer-Emmet-Teller (BET) was done to determine the surface area of pyrolysed
activated carbon. Since Cat-A synthesised from SWAC200 exhibits the highest acid
density, activated carbon SWAC200 was selected to study on the surface area. Result
showed that the surface area of SWAC200 is shown to be 5.1767 m2/g. Literature
Folasegun, et al., 2014 reported that activated carbon produced from glucose has 0.2
m2/g of surface area based on the BET analysis and was successfully produced
biodiesel at 99% FAME yield. It will be better if the activated carbon exhibits higher
surface area because the present of surface area enables the attachment of functional
group SO3H as active site for esterification on to the carbon. Thus, seaweed based
activated carbon is a suitable biomass was to be used as the precursor for solid acid
catalyst to be used in the production of biodiesel.
4.2.3 Fourier Transform - Infrared Spectroscopy
Fourier Transform – Infrared Spectroscopy analysis was done to determine the
functional group present on the catalyst. This test was performed to confirm the
presence of sulfonic group, SO3H- attaching on the catalyst because the sulfonic group
is the active site for the esterification reaction between PFAD and methanol to form
FAME. Most of the catalyst shows a peak at wavenumbers around 1040 cm-1, 1200
cm-1, 1600 and 1700 cm-1.
According to Lambert (1989), SO3H group in sulfonic acids is represented by
wavenumbers 1040 to 1080 cm-1 with SO3 symmetric stretch and wavelength 1155 to
1245 cm-1 with S=O stretch. Then, the wavenumber of 2400 to 3100 cm-1 is related to
the –OH in carboxylic acids of H bonded OH stretch. Ezebor, et al. (2014) reported
that wavenumber at around 1600 and 1700 cm-1 are indicating the C=C aromatic
stretching and C=O stretching vibrations respectively.
Figure 4.5 shows the results of FT-IR analysis of catalyst sulfonated with
difference concentrations of ammonium sulfate solution for 15 minutes. Peaks was
observed at wavenumber 1050 and 1190 cm-1 that are related to the SO3H group for

67
sulfonic acid of SO3H symmetric stretch and S=O stretching vibrations for catalyst
CAT-A1, CAT-A2, CAT-A3, CAT-A4 and CAT-A5 at different intensity. Also,
aromatic C=C stretching was observed with an obvious peak at 1600 cm-1, C=O
stretching at wavenumber about 1700 cm-1 and peak at 2930 cm-1 that is assigned to –
OH group for all catalysts in Figure 4.6 including the SWAC200. This explained that
the –OH and –COOH groups were present even before sulfonation was carried out.
Figure 4.5: FT-IR Spectra for Catalysts Sulfonated for 15 minutes in Different
Ammonium Sulfate Solution Concentration
Next, Figure 4.6 shows the FT-IR spectra for catalysts sulfonated for 30
minutes. These catalysts showed the highest intensity of SO3H group at wavenumber
1040 cm-1 and 1200 cm-1. SO3H is the significant functional group that have to be
present in the catalyst to act as the active site for esterification reaction to carry out to
produce biodiesel. High intensity of SO3H group observed through FT-IR meaning
that catalysts sulfonated for 30 minutes could provide the best performance among the
catalysts sulfonated for other durations. Similarly, CAT-A6, CAT-A7, CAT-A8, CAT-
A9 and CAT-A10 exhibited peak at 1620 and 2950 cm-1 for the C=C aromatic
stretching and –OH group vibrations showing that –OH and –COOH group that was
originally attached on the catalyst precursor was still present in the catalyst.
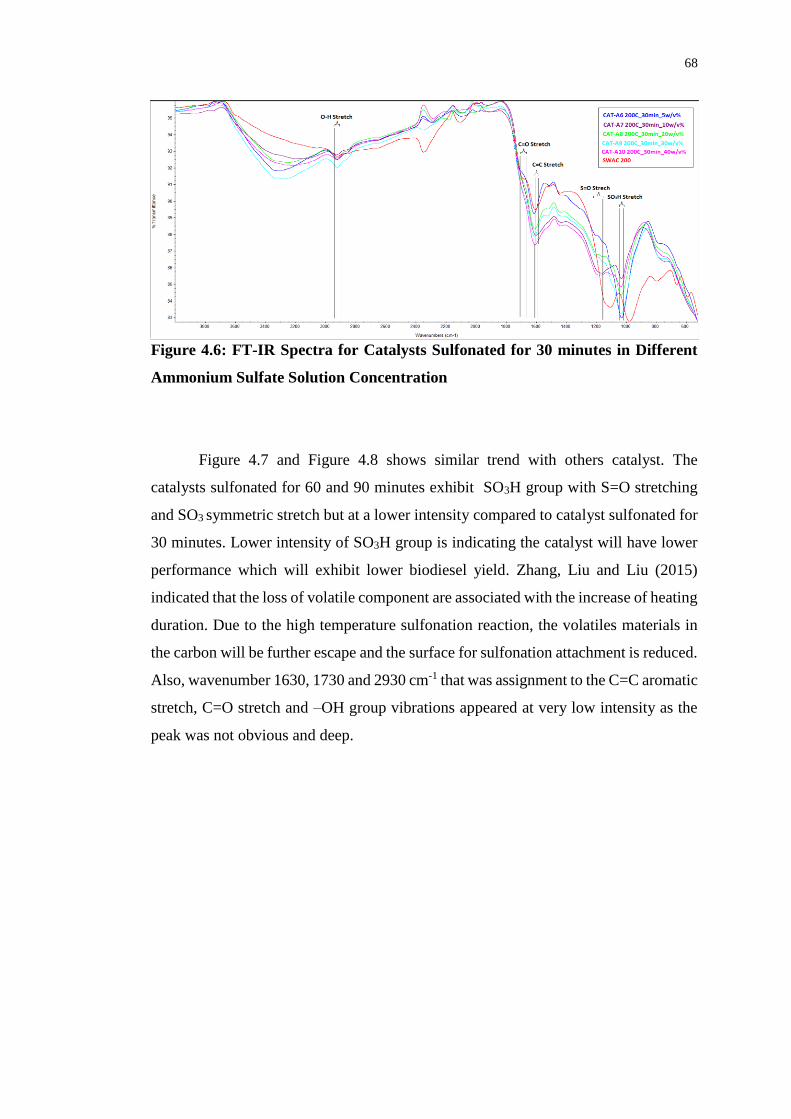
68
Figure 4.6: FT-IR Spectra for Catalysts Sulfonated for 30 minutes in Different
Ammonium Sulfate Solution Concentration
Figure 4.7 and Figure 4.8 shows similar trend with others catalyst. The
catalysts sulfonated for 60 and 90 minutes exhibit SO3H group with S=O stretching
and SO3 symmetric stretch but at a lower intensity compared to catalyst sulfonated for
30 minutes. Lower intensity of SO3H group is indicating the catalyst will have lower
performance which will exhibit lower biodiesel yield. Zhang, Liu and Liu (2015)
indicated that the loss of volatile component are associated with the increase of heating
duration. Due to the high temperature sulfonation reaction, the volatiles materials in
the carbon will be further escape and the surface for sulfonation attachment is reduced.
Also, wavenumber 1630, 1730 and 2930 cm-1 that was assignment to the C=C aromatic
stretch, C=O stretch and –OH group vibrations appeared at very low intensity as the
peak was not obvious and deep.

69
Figure 4.7: FT-IR Spectra for Catalysts Sulfonated for 60 minutes in Different
Ammonium Sulfate Solution Concentration
Figure 4.8: FT-IR Spectra for Catalysts Sulfonated for 90 minutes in Different
Ammonium Sulfate Solution Concentration

70
4.2.4 Acid Density
Acid density test was carried out to determine the total acid density of catalyst where
the acidity comes from –SO3H, -OH and –COOH group present in the catalyst. Janaun,
Abang and Anwar (2013) claimed that total acid density mainly came from the –SO3H
and this functional group is the only active site involved in the esterification reaction.
The total acid density of catalyst synthesised from different carbonisation conditions
was tabulated in Table 4.3.
Figure 4.9 shows the total acid density trend of catalyst sample Cat-A, Cat-B,
Cat-C, Cat-D and Cat-E. Carbonisation temperature of 200 °C poses the highest acid
density at 2.48 mmol/g among the catalyst synthesis from other carbonisation
temperatures. The total acid density decreases from 200 to 500 °C but slightly increase
at 600 °C carbonisation temperature. The decreasing of total acid density from 200 °C
to 500°C may be due to the increase of pore size that leads to the sintering effect. Gaber,
et al. (2013) claimed that increase of number of pores resulting in pores combining
together and reducing the surface area for the attachment of SO3H group. It was noted
that there were slight increase of total acid density from 500 to 600 °C which may be
due to the inconsistency of back titration done to determine the total acid density of
catalyst.
Table 4.3: Total Acid Density of Catalyst Samples at Different Carbonisation
Temperature
1 g of SWAC sulfonated in 30 ml of 10 w/v% Ammonium Sulfate solution for 30
minutes at 235 °C
Catalyst
Sample
Carbonisation Conditions
Total Acid Density (mmol/g) Duration
(hours)
Temperature
(°C)
Cat-A 2.5 200 2.48
Cat-B 2.5 300 1.32
Cat-C 2.5 400 1.24
Cat-D 2.5 500 0.88
Cat-E 2.5 600 1.4
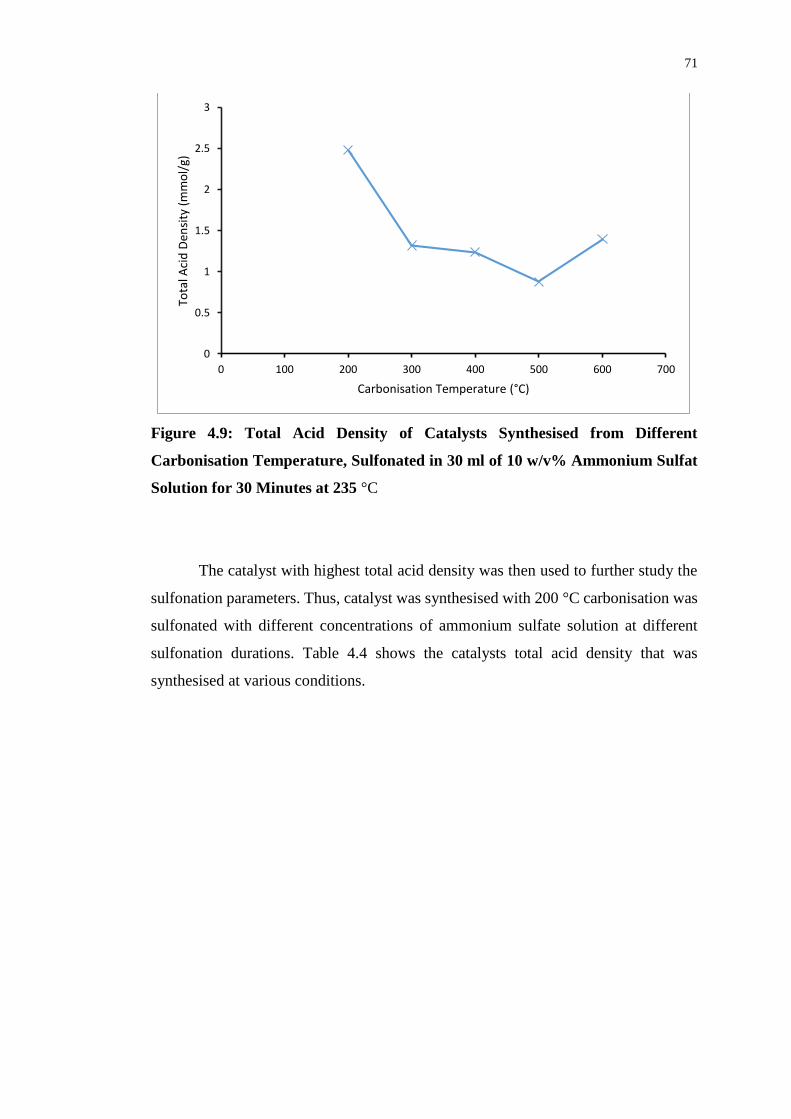
71
Figure 4.9: Total Acid Density of Catalysts Synthesised from Different
Carbonisation Temperature, Sulfonated in 30 ml of 10 w/v% Ammonium Sulfat
Solution for 30 Minutes at 235 °C
The catalyst with highest total acid density was then used to further study the
sulfonation parameters. Thus, catalyst was synthesised with 200 °C carbonisation was
sulfonated with different concentrations of ammonium sulfate solution at different
sulfonation durations. Table 4.4 shows the catalysts total acid density that was
synthesised at various conditions.
0
0.5
1
1.5
2
2.5
3
0 100 200 300 400 500 600 700
Tota
l Aci
d D
ensi
ty (
mm
ol/
g)
Carbonisation Temperature (°C)

72
Table 4.4: Total Acid Density of Catalyst Samples at Different Sulfonation
Conditions
Total Acid Density (mmol/g)
Concentration (w/v%) Duration (minutes)
15 30 60 90
5 1.64 1.84 1.28 1.12
10 1.68 3.32 1.52 1.24
20 1.76 3.2 1.8 1.52
30 1.84 2.6 1.4 -
40 1.4 2.2 1.12 1.12
1.5 g of SWAC200 sulfonated in 30 ml of Ammonium Sulfate solution at 235 °C
Figure 4.10 shows the graph of total acid density trend of catalyst sulfonated
from different conditions. By comparing the total acid density of catalyst synthesised
at different sulfonation durations, catalyst that was sulfonated for 30 minutes poses the
highest total acid density as an overall, followed by 15 minutes, then to 60 minutes
and sulfonation for 90 minutes gives the lowest overall total acid density. On the other
word, total acid density increases from sulfonation duration of 15 minutes to 30
minutes, then decreases after reaching the optimum sulfonation duration of 30 minutes.
The decrease of total acid density at longer sulfonation time may be due to the escape
of volatile substance in the catalyst as the sulfonation was carried out at high
temperature of 235 °C thus the catalyst surface area will be further decreased resulting
in less SO3H group grafted on the seaweed based carbon.

73
Figure 4.10: Graph of Total Acid Density of Catalysts Synthesised from Different
Sulfonation Temperature
In each of the sulfonation duration, different optimum ammonium sulfate
concentration was resulted according to the total acid density. For 15 minutes
sulfonation duration, 30 w/v% of ammonium sulfate solution gives the highest total
acid density at 1.84 mmol/g and the high total acid density of 3.32 mmol/g was
achieved for sulfonation duration of 30 minutes. As for 60 and 90 minutes sulfonation
duration, the highest total acid density was obtained at 1.8 and 1.52 mmol/g
respectively, when 20 w/v% of ammonium sulfate solution was used. Generally, high
concentration of ammonium sulfate solution will increase the acid density as the
amount SO3H will also be high. However, too high concentration of ammonium sulfate
solution may give adverse effect to the catalyst. Shuit, Ng and Tan (2015) reported
that at high concentration, the solution will appear in higher viscosity and this will
affect the dispersion of seaweed carbon in the solution. Therefore, seaweed carbon will
still remained in lump and not all of the carbon are being exposed to the solution.
0
0.5
1
1.5
2
2.5
3
3.5
0 10 20 30 40 50
Tota
l Aci
d D
ensi
ty (
mm
ol/
g)
Ammonium Sulfate Solution Concentration (w/v%)
15 minutes
30 minutes
60 minutes
90 minutes

74
Janaun, Abang and Anwar (2013) reported the total acid density of 2.01
mmol/g for the seaweed based catalyst that was sulfonated by using fuming sulfuric
acid (20 wt% free SO3). Compared to this research, a higher total acid density was
achieved in this research at 3.32mmol/g. within the range of parameters studied, the
sulfonation carried out by mixing 30ml of 10 w/v% ammonium sulfate solution with
1.5 g of SWAC200 that was ultrasonicated for 10 minutes and heated to 235 °C for 30
minutes will be the condition to achieve the optimum total acid density.
Yu, Dehkhoda and Ellis (2010) reported that the FAME yield is dependent on
the total acid density of catalyst. Thus, the catalyst with highest total acid density may
produce the highest FAME yield among other catalyst.

75
4.2.5 Energy-Dispersive X-ray Spectroscopy
EDX is an analytical method for surface elemental analysis. The elemental
composition of carbon, C, oxygen, O and sulfur of catalyst was tabulated in Table 4.5
Table 4.5: Elemental Composition on Catalyst
Catalyst
Sample
Elemental Composition (wt %)
C O S
Cat-A 53.22 25.03 9.36
Cat-B 52.94 12.89 4.58
Cat-C 36.82 36.36 0.81
Cat-D 32.32 25.21 00.00
Cat-E 22.89 25.45 0.70
Cat-A1 21.78 36.88 00.91
Cat-A2 31.71 31.55 2.94
Cat-A3 51.62 29.98 3.04
Cat-A4 64.27 28.87 2.92
Cat-A5 59.41 33.33 2.38
Cat-A6 47.03 42.48 2.59
Cat-A7 36.99 31.62 9.70
Cat-A8 49.46 35.89 3.08
Cat-A9 55.00 40.19 2.12
Cat-A10 27.93 45.60 1.35
Cat-A11 39.70 38.22 4.27
Cat-A12 42.95 32.87 9.02
Cat-A13 53.23 27.70 9.36
Cat-A14 40.05 35.65 6.52
Cat-A15 53.94 33.73 1.01
Cat-A16 41.40 32.41 5.29
Cat-A17 42.26 36.72 5.60
Cat-A18 54.96 31.50 8.66
Cat-A19 53.22 25.03 9.36
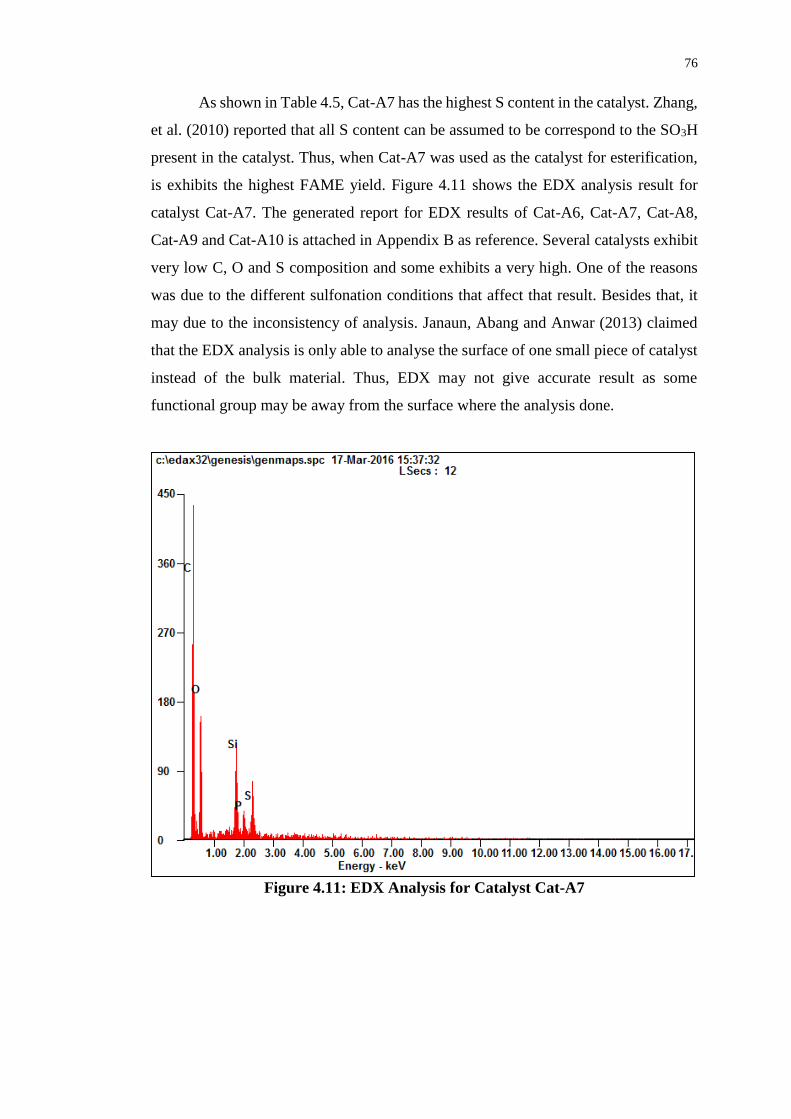
76
As shown in Table 4.5, Cat-A7 has the highest S content in the catalyst. Zhang,
et al. (2010) reported that all S content can be assumed to be correspond to the SO3H
present in the catalyst. Thus, when Cat-A7 was used as the catalyst for esterification,
is exhibits the highest FAME yield. Figure 4.11 shows the EDX analysis result for
catalyst Cat-A7. The generated report for EDX results of Cat-A6, Cat-A7, Cat-A8,
Cat-A9 and Cat-A10 is attached in Appendix B as reference. Several catalysts exhibit
very low C, O and S composition and some exhibits a very high. One of the reasons
was due to the different sulfonation conditions that affect that result. Besides that, it
may due to the inconsistency of analysis. Janaun, Abang and Anwar (2013) claimed
that the EDX analysis is only able to analyse the surface of one small piece of catalyst
instead of the bulk material. Thus, EDX may not give accurate result as some
functional group may be away from the surface where the analysis done.
Figure 4.11: EDX Analysis for Catalyst Cat-A7

77
4.2.6 Thermogravimetric Analysis
Sample Cat-A7 which was carbonised at temperature of 200 °C, sulfonated with 10
w/v% ammonium sulfate solution at 235 °C for 30 minutes was sent for the
thermogravimetric analysis (TGA). The result obtained was showed in Figure 4.12.
The green curve on the line shows the mass loss for the sample. It was observed that
there were two mass loss steps under inert condition (nitrogen atmosphere) and one
mass loss step under oxidative condition (synthetic air atmosphere).
The sample were relatively stable until the temperature of 70.8 °C, a significant
weight reduction was observed. The observed mass loss at this stage was mostly likely
due to the release of volatile materials or moisture content in the sample. Then, the
samples was slightly stable until the temperature of 537.9 °C which was associated
with the second mass loss step at inert atmosphere. The mass reduction observed at
this temperature can be related to the decomposition of functional group, which is the
SO3H group in the sample. The oxidative mass loss at 928.1 °C is associated as the
burn-up of the carbon component in the sample.
Lee (2013) reported the synthesis of acid catalyst from lignosulfonate with
concentrated sulfuric acid as the sulfonating agent. The results shows that the weight
loss was significant at around 230 °C due to the decomposition of SO3H group in the
catalyst. On the other hand, Kastner, et al. (2012) claimed that activated sulfonated by
using concentrated sulfuric acid has lower thermal stability where the SO3H group
decomposed at 250 to 300 °C compared to the activated carbon which was sulfonated
by using gaseous SO3 that was decomposed at 500 to 550 °C. This has indicated that
the seaweed based activated carbon that was sulfonated by thermal decomposition of
ammonium sulfate has a comparable thermal stability.
In addition, the DTA signal shows the characterization of the observed effects.
Mass loss was observed under the inert condition associated with the endothermic
effect while exothermic signal was observed under the oxidative condition.
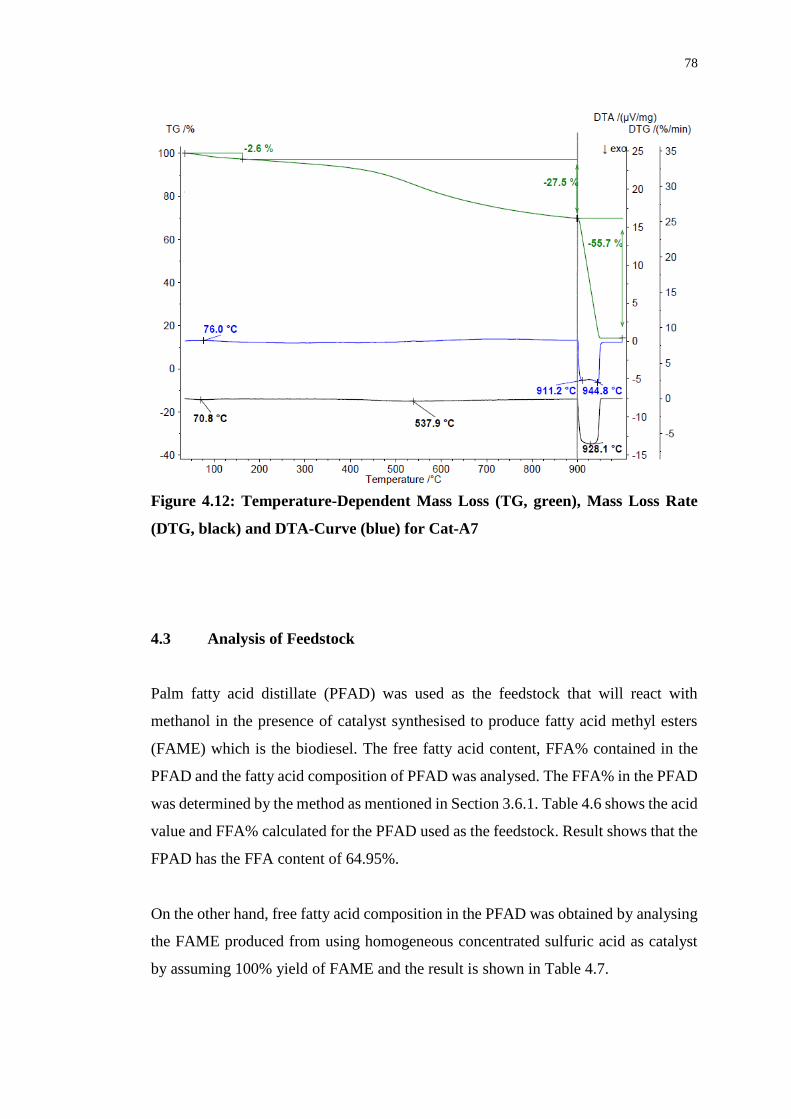
78
Figure 4.12: Temperature-Dependent Mass Loss (TG, green), Mass Loss Rate
(DTG, black) and DTA-Curve (blue) for Cat-A7
4.3 Analysis of Feedstock
Palm fatty acid distillate (PFAD) was used as the feedstock that will react with
methanol in the presence of catalyst synthesised to produce fatty acid methyl esters
(FAME) which is the biodiesel. The free fatty acid content, FFA% contained in the
PFAD and the fatty acid composition of PFAD was analysed. The FFA% in the PFAD
was determined by the method as mentioned in Section 3.6.1. Table 4.6 shows the acid
value and FFA% calculated for the PFAD used as the feedstock. Result shows that the
FPAD has the FFA content of 64.95%.
On the other hand, free fatty acid composition in the PFAD was obtained by analysing
the FAME produced from using homogeneous concentrated sulfuric acid as catalyst
by assuming 100% yield of FAME and the result is shown in Table 4.7.

79
Table 4.6: Acid Value and FFA content of Feedstock
Sample Sample
Mass (g)
Normality
of KOH
(N)
Volume of
KOH used
(ml)
Acid Value
FFA
content
(%)
PFAD 1 0.1 23 129.26 64.95
Table 4.7: Free Fatty Acid Composition of Feedstock
Sample
Free Fatty Acid Composition, % by weight
Palmitic
C16:00
Stearic
C18:00
Oleic
C18:1
Linoleic
C18:2 Others
PFAD 40.71 3.72 36.428 17.18 1.96
4.4 Analysis of Biodiesel Produced
4.4.1 Optimisation Study for Sulfonation Conditions
Sulfonation was carried out with the objective to graft the SO3H group onto the carbon
to serve as a catalyst for biodiesel production through esterification reaction between
PFAD and methanol. In this study, the sulfonation method employed was the thermal
decomposition of ammonium sulfate method. This method was conducted by Shuit
and Tan (2014) by using multi-walled carbon nanotube (MWCNT). 0.4 g MWCNT
was ultrasonicated with 30 ml of 10 w/v% ammonium sulfate solution for 10 minutes,
the ultrasonicated mixture was then heated to 235 °C for 30 minutes.
In this study, the concentration of ammonium sulfate solution and the
temperature holding time was varied to investigate the optimum condition for these 2
parameters. Thus, 1.5 g of SWAC200 was added with 30 ml of 5, 10, 20, 30 and 40
w/v% ammonium sulfate solution and ultrasonicated for 10 minutes. The
ultrasonicated mixture was then heated to 235 °C for 15, 30, 60 and 90 minutes. The

80
catalyst synthesised was then used in the esterification reaction to produce FAME. The
FAME yield (%) will then be used as a reference to determine the efficiency of the
catalyst and the condition that was used to synthesis catalyst that exhibits the highest
FAME yield will be recorded as the optimum condition. The product of the
esterification is as shown in Figure 4.13.
Figure 4.13: Product of Esterification by Catalyst Sulfonated for (A) 15minutes
and (B) 30 minutes (C) 60 minutes (D) 90 minutes with Different Concentration
of Ammonium Sulfate Solution
A
B
C
D
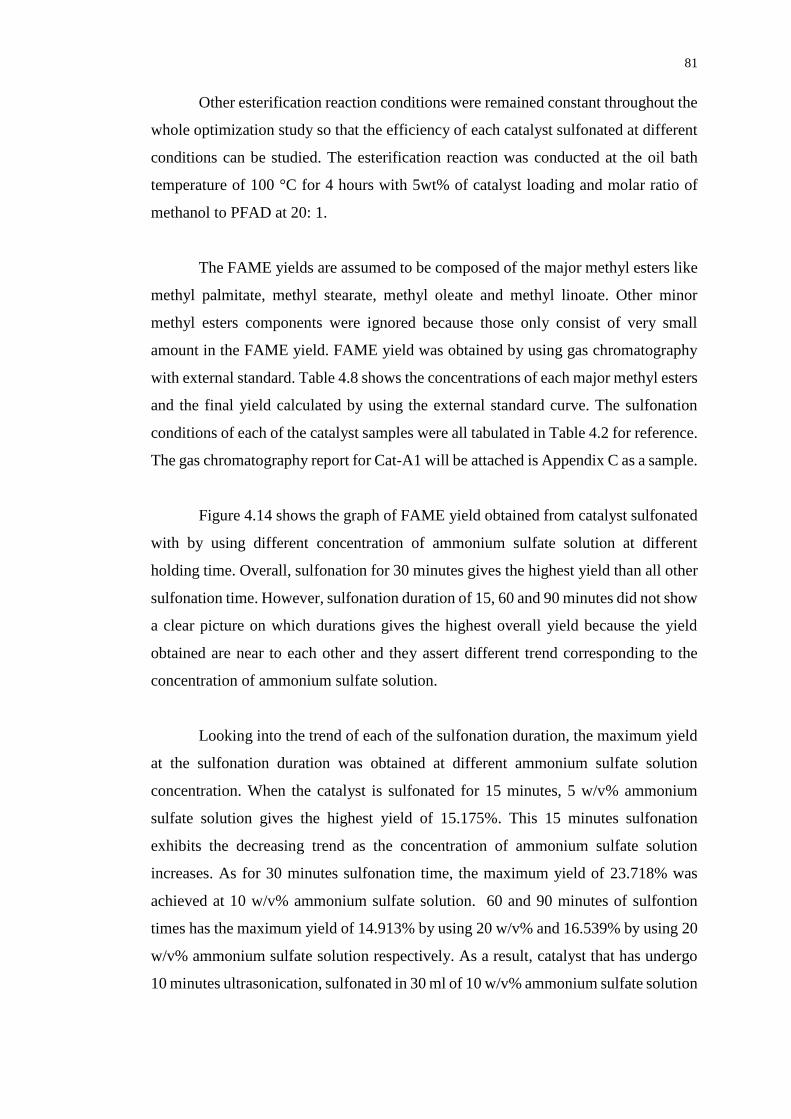
81
Other esterification reaction conditions were remained constant throughout the
whole optimization study so that the efficiency of each catalyst sulfonated at different
conditions can be studied. The esterification reaction was conducted at the oil bath
temperature of 100 °C for 4 hours with 5wt% of catalyst loading and molar ratio of
methanol to PFAD at 20: 1.
The FAME yields are assumed to be composed of the major methyl esters like
methyl palmitate, methyl stearate, methyl oleate and methyl linoate. Other minor
methyl esters components were ignored because those only consist of very small
amount in the FAME yield. FAME yield was obtained by using gas chromatography
with external standard. Table 4.8 shows the concentrations of each major methyl esters
and the final yield calculated by using the external standard curve. The sulfonation
conditions of each of the catalyst samples were all tabulated in Table 4.2 for reference.
The gas chromatography report for Cat-A1 will be attached is Appendix C as a sample.
Figure 4.14 shows the graph of FAME yield obtained from catalyst sulfonated
with by using different concentration of ammonium sulfate solution at different
holding time. Overall, sulfonation for 30 minutes gives the highest yield than all other
sulfonation time. However, sulfonation duration of 15, 60 and 90 minutes did not show
a clear picture on which durations gives the highest overall yield because the yield
obtained are near to each other and they assert different trend corresponding to the
concentration of ammonium sulfate solution.
Looking into the trend of each of the sulfonation duration, the maximum yield
at the sulfonation duration was obtained at different ammonium sulfate solution
concentration. When the catalyst is sulfonated for 15 minutes, 5 w/v% ammonium
sulfate solution gives the highest yield of 15.175%. This 15 minutes sulfonation
exhibits the decreasing trend as the concentration of ammonium sulfate solution
increases. As for 30 minutes sulfonation time, the maximum yield of 23.718% was
achieved at 10 w/v% ammonium sulfate solution. 60 and 90 minutes of sulfontion
times has the maximum yield of 14.913% by using 20 w/v% and 16.539% by using 20
w/v% ammonium sulfate solution respectively. As a result, catalyst that has undergo
10 minutes ultrasonication, sulfonated in 30 ml of 10 w/v% ammonium sulfate solution

82
for 30 minutes at 235 °C poses the highest yield when it was used in the esterification
reaction.
Table 4.8: FAME Yield Obtained from Using Different Catalyst
Catalyst
Methyl Esters Concentration (g/L sample solution) Yield
(%) Methyl
Palmitate
Methyl
Stearate
Methyl
Oleate
Methyl
Linoate Total
Cat-A1 2.231 0.316 2.916 2.364 7.685 15.175
Cat-A2 6.034 0.303 2.571 1.789 6.800 12.496
Cat-A3 2.425 0.257 1.299 2.784 6.160 12.160
Cat-A4 0.000 0.271 2.470 1.730 6.378 12.759
Cat-A5 0.000 0.247 2.103 1.417 5.541 10.299
Cat-A6 2.440 0.170 0.076 2.389 5.075 9.945
Cat-A7 3.868 0.564 4.940 3.071 12.442 23.718
Cat-A8 2.231 0.382 4.703 3.042 10.358 20.206
Cat-A9 3.590 0.533 4.632 2.907 11.662 20.039
Cat-A10 1.773 0.491 4.855 3.046 11.434 19.665
Cat-A11 1.238 1.141 0.9715 1.277 4.727 8.855
Cat-A12 1.337 0.264 2.369 1.508 6.121 11.224
Cat-A13 2.228 0.370 3.187 2.096 8.304 16.539
Cat-A14 1.808 0.592 5.1452 0.516 10.320 16.062
Cat-A15 2.811 0.369 3.1132 2.079 8.217 14.929
Cat-A16 3.590 0.147 1.510 0.910 3.805 7.572
Cat-A17 1.337 0.307 2.805 0.971 6.312 12.020
Cat-A18 3.868 0.050 2.442 2.505 7.808 14.913
Cat-A19 3.049 0.261 2.659 1.713 6.441 12.429
Esterification Conditions: 100 °C oil bath, 4 hours, 5 wt% catalyst loading, molar ratio of methanol to
PFAD 20:1

83
Figure 4.14: Effect of Sulfonation Duration and Ammonium Sulfate
Concentration on the FAME Yield (Esterification Conditions: 100 °C Oil Bath, 4
hours, 5 wt% Catalyst Loading, Molar Ratio of Methanol to PFAD 20:1)
From Figure 4.14, it was observed that the FAME yield with increase of the
ammonium sulfate solution concentration. Shuit, Ng and Tan (2015) reported that at
high concentration, the solution has a higher viscosity and this will affect the
dispersion of activated carbon in the solution. When the activated carbon are constraint
by the high concentration solution, the activated carbon will still remained in lump and
not all of the carbon are being exposed to the solution. This will result in only the outer
perimeter of the carbon lump are exposed to the ammonium sulfate solution to attach
SO3H group.
In addition, the sulfonic group attached on the carbon reached the optimum
density at 30 minutes and decreases when the sulfonation duration was longer than 30
minutes. As explained in Section 4.2.1, due to the high sulfonation temperature, the
volatile material on the carbon will escape from the carbon leaving lesser surface for
functional group attachment. Thus, the overall yield of FAME when catalysts
sulfonated for 90 minutes is lower than 30 and 60 minutes.
0.000
5.000
10.000
15.000
20.000
25.000
0 5 10 15 20 25 30 35 40 45
Yie
ld (
%)
Ammonium Sulfate Concentration (w/v%)
15 minutes
30 minutes
60 minutes
90 minutes

84
Comparing the biodiesel yield obtained with the characterisation of catalyst,
the FT-IR analysis showed that catalysts sulfonated for 30 minutes exhibit the highest
SO3H group intensity compared to other catalysts sulfonated at 15, 60 and 90 minutes.
Besides that, EDX analysis also showed that Cat-A7 has the highest S content attached
on the catalyst and explained that Cat-A7 produced the highest FAME yield among all
other catalysts.
The FAME yield from catalysts sulfonated from different conditions show a
similar trend to the acid density discussed in Section 4.2.3. Lokman, Rashid and
Taufiq-Yap (2015) stated that the catalyst with high total acid density will give higher
activity. Thus, Cat-A7 that has the highest total acid density at 3.32 mmol/g produced
the highest FAME yield at 23.718% among all other catalysts sulfonated by different
duration and concentration of ammonium sulfate.
Shuit and Tan (2014) has reported the yield of 88.0 % was obtained by using
carbon nanotubes as the catalyst precursor and sulfonated through thermal
decomposition of ammonium sulfate. The sulfonation conditions was the same, which
were by heating carbon material with 30 ml 10 w/v% ammonium sulfate for 30 minutes
at 235 °C. However, the result obtained by using seaweed derived activated carbon
was much lower compared to by using carbon nanotubes. Carbon nanotubes is a type
of conventional carbon material with very high surface area and this had made an
advantage over the carbonised carbon from biomass. The high surface area allows the
grafting of more SO3H group onto the catalyst and this had increased the active site
available for reaction. Thus, it was reasonable that the carbonised seaweed biomass
did not serve as a better precursor than the carbon nanotubes.
Besides that, there was other reasons that lead to the low FAME yield obtained
by using seaweed derived catalyst. Figure 4.15 shows the SEM image of catalyst at
magnification of 500x and 2000x. Large numbers of microorganism was found on the
surface of the catalyst. The present of these microorganism may be due to the long
term exposure of seaweed to the sea water that contains numerous microorganisms.
These microorganism appears in oval shape with regular texture on the body. They
were attaching on the seaweed as parasites and tends to cover up pores of the carbon.

85
The presence of these microorganisms had reduce the surface area available for the
grafting of SO3H group as the reaction active site.
Figure 4.15: SEM Image of Catalyst with Microorganism Attached at
Magnification (A) 500x and (B) 2000x
Furthermore, the reason of achieving low yield may be due to the incorrect way
of doing ultrasonication. Ultrasonication was done to the mixture of carbon with
ammonium solution prior to heating at high temperature during the sulfonation process.
According to the actual procedure done by Shuit and Tan (2014), ultrasonication was
done by using the probe-type ultrasonicator but a water bath ultrasonicator was used
in this experiment. The water bath ultrasonicator is less effective than the probe-type
ultrasonicator because the ultrasonic wave will hit the container first only will transfer
the ultrasonic wave into the mixture for the water bath ultrasonicator but for the probe-
type ultrasonicator, the ultrasonic wave will be directly emitted into the mixture.
Other than that, the type of container used in the water bath ultrasonicator was
also important. During the test run of the experiment, a conical flask was used as the
container to fill in the mixture. However, due to the lack of capability for conical flask
to withstand high temperature for a long time at the heating process during sulfonation,
a porcelain crucible was then used to replace the conical flask. The usage of crucible
as the container for the mixture in the water ultrasonicator was show to be not very
effective and thus, the carbon did not disperse well in the ammonium sulfate solution
resulting in the les exposure of carbon surface to the solution. In this case, an extra
study was conducted by using conical flask as the container for carbon and ammonium
A B Microorganism
Parasites
Microorganism
Parasites

86
sulfate solution during ultrasonication. Table 4.9 shows the FAME yield of 63.35%
was obtained when conical flask was tested to be used as the container during
ultrasonication. The FAME yield of this set of experiment is much higher than the
FAME yield obtained from using Cat-A7 (optimum condition catalyst) at 23.718%.
This also has proven that glass container is more effective to be used in the water bath
ultrasonicator compared to porcelain container.
Table 4.9: FAME Yield Obtained from the Test Run Catalyst
Catalyst
Methyl Esters Concentration (g/L sample solution) Yield
(%) Methyl
Palmitate
Methyl
Stearate
Methyl
Oleate
Methyl
Linoate Total
Cat-Test 108.111 40.406 60.253 44.627 253.398 63.35
Sulfonation Condition: 1.5 g SWAC200, 30 ml 10w/v% ammonium sulfate solution, 10 minutes
ultrasonication, 235 °C for 30 minutes
Esterification Conditions: 100 °C oil bath, 4 hours, 5 wt% catalyst loading, molar ratio of methanol to
PFAD 20:1
4.4.2 Optimisation Study for Esterification Conditions
Optimisation study for esterification conditions was done to determine the reaction
condition that best suit the raw materials employed like the catalyst synthesised and
the feedstock. The optimum condition may vary and dependant on the type of
feedstock used, for this case is PFAD and also the type of catalyst used. The type of
biomass used and the sulfonation method may also affect the optimum conditions for
esterification reaction. The catalyst used was derived from seaweed as the biomass and
undergo carbonisation to transform into carbon compound and sulfonated by thermal
decomposition of ammonium sulfate. The catalyst loading in wt% and the duration of
esterification was studied. In this study, Cat-A7 that was sulfonated by using 10 w/v%
ammonium sulfate solution for 30 minutes at 235 °C was used for all the esterification
to act as a fixed variable in the experiment.

87
4.4.2.1 Effect of Esterification Time on Biodiesel Yield
The effect of reaction time was studied from 2 hours to 8 hours of reaction time. Other
conditions was remain constant that the esterification reaction was done at 100 °C oil
bath, with methanol to PFAD molar ratio of 20:1 with catalyst loading of 5 wt% by
using Cat-A7 as the fixed catalyst.
As shown in Figure 4.16, the FAME yield shows an increasing trend when the
esterification time increases. At 2 hours of esterification time, the FAME yield
obtained was 13.13%. The yield increased to 23.72% when the reaction time is 4 hours
and the yield further increase to 27.37% when the reaction time was extended to 6
hours. At the esterification time of 8 hours, the biodiesel achieve the highest yield at
28.87% compared to the shorter esterification time. Lokman, Rashid and Taufiq-Yap
(2015) reported the optimum esterification time was achieve at the reaction time of 3
hours by using PFAD as the feedstock with sulfonated starch solid acid catalyst with
FAME yield of 94.6%. However, this study was only limited to 2 to 8 hours of reaction
time, a longer reaction time (higher than 3 hours) may be able to achieve higher yield
as the highest yield obtained in this study was still low.
Figure 4.16: Graph of Effect of Reaction Time on FAME Yield at 100 °C Oil Bath,
Methanol to PFAD Molar Ratio of 20:1 and Catalyst Cat-7 Loading of 5 wt%
0.000
5.000
10.000
15.000
20.000
25.000
30.000
35.000
0 1 2 3 4 5 6 7 8 9
Yie
ld (
%)
Time (hour)

88
4.4.2.2 Effect of Catalyst Loading on Biodiesel Yield
The catalyst loading for the esterification was chosen to study because it directly
related to the catalyst synthesised. The catalyst loading will be directly affected by the
efficiency of the catalyst. Catalyst loading of 2.5, 5, 10 and 15 wt% was studied for
their effect towards the biodiesel yield with all other condition kept constant. For this
experiment, the reaction temperature was fixed at 100 °C oil bath temperature,
methanol to PFAD molar ratio of 20:1 and 8 hours reaction time by using sample Cat-
A7 as the catalyst where Cat-A7 was sulfonated by using 30 ml of 10 w/v% ammonium
sulfate solution heated to 235 °C for 30 minutes.
Folasegun, et al. (2014) stated that increasing the amount of catalyst would
increase the production of the desired product in reaction system. The trend of yield
obtained from employing different catalyst loading is shown in Figure 4.17 below. It
was observed that the increase of catalyst loading asserts an increasing trend on the
FAME yield. The lower catalyst loading of 2.5 wt% produced the lowest FAME yield
at 19.9 %. It follows by catalyst loading of 5 wt% that poses 22.22% yield and when
10 wt% of catalyst loading was used, the FAME yield increased to 33.9 %. And lastly,
15 wt% catalyst loading gives the highest FAME yield at 47.87%. The FAME yield
may be able to further increase if the catalyst loading of more than 15 wt% is employed.
Lokman, Rashid and Taufiq-Yap (2015) stated that optimum catalyst loading
was achieve at 4 wt% with the FAME yield of 94.6%. The catalyst used was the
sulfonated starch reacting with methanol-to-PFAD molar ratio of 10 at 75 °C for 3
hours in the esterification reaction. Konwar, et al. (2015) had also reported that the
optimum catalyst loading by using catalyst derived from de-oiled waste cake is at 5 to
6.5 wt.% achieving FAME yield of 97% at condition 43:1 methanol –to-oil molar ratio
at 80 °C for 8 hours. As a result, the Cat-A7 exhibits a relatively low yield compared
to the other reported result and should be further improved to increase the catalyst
activity in esterification reaction.
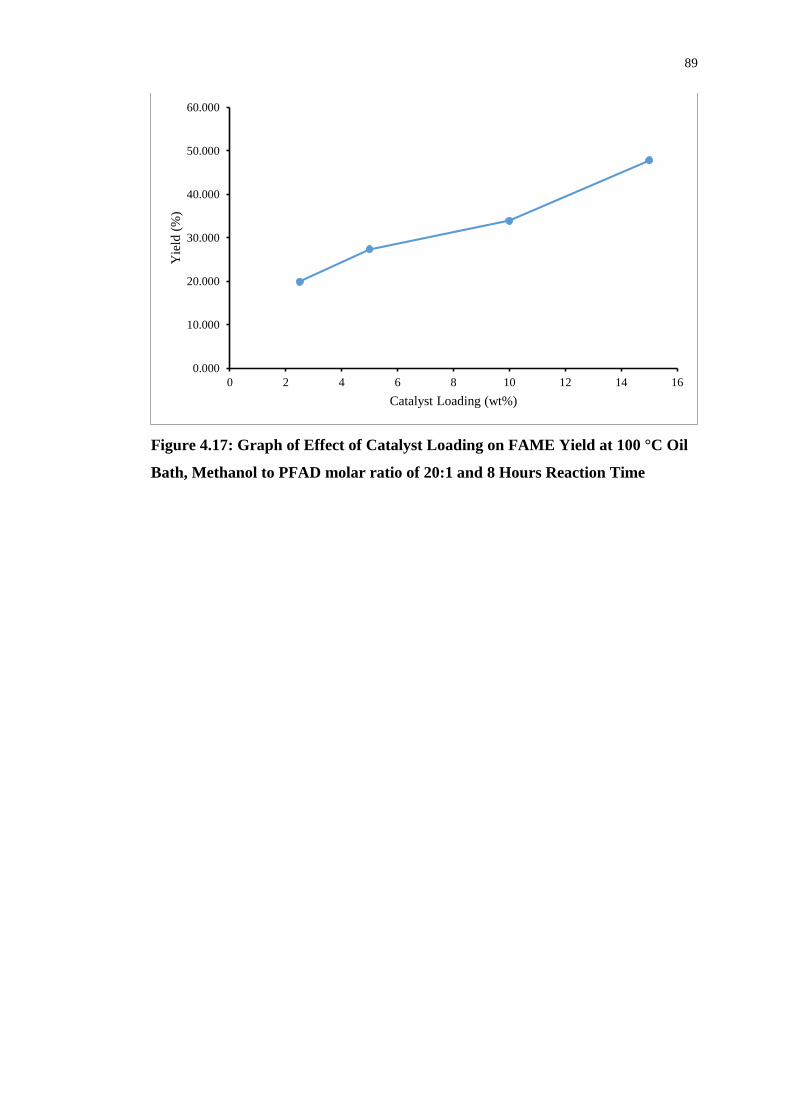
89
Figure 4.17: Graph of Effect of Catalyst Loading on FAME Yield at 100 °C Oil
Bath, Methanol to PFAD molar ratio of 20:1 and 8 Hours Reaction Time
0.000
10.000
20.000
30.000
40.000
50.000
60.000
0 2 4 6 8 10 12 14 16
Yie
ld (
%)
Catalyst Loading (wt%)

90
CHAPTER 5
5 CONCLUSION AND RECOMMENDATION
5.1 Conclusion
Seaweed biomass was successfully carbonised at the temperature of 200, 300, 400,
500 and 600 °C. The catalyst produced by seaweed carbon produced by 200 °C
exhibits the highest total acid density at 3.32 mmol/g compared to the catalyst
produced by other carbonisation temperature. Thus, seaweed carbon produced by
200 °C carbonisation that is noted by SWAC200 was used as the precursor for the
study of sulfonation parameters.
The synthesised catalyst was analysed with several catalyst characterisations.
SEM image shows that the seaweed carbon has irregular surface with large number of
pores on it. FT-IR analysis has proven the present of SO3H group in the catalyst
according to the S=O stretching and SO3 symmetric stretching vibrations. It was also
known that the catalyst contains –COOH and –OH from the present of C=C aromatic
stretch and also the C=O stretch. EDX was another type of analysis to prove the present
of SO3H as the functional group in the catalyst by analysing the elemental composition
of S, C and O on the catalyst. Catalyst synthesised shows the present of sulfur element,
S in EDX analysis. Thermogravimetric analysis had determined the functional group
decomposition temperature of the catalyst is at 537.9 °C and this shows that the catalyst
has a relative high thermal stability as the catalyst will not be used at temperature
higher than this.

91
The optimum sulfonation conditions obtained was by mixing 1.5 g of
SWAC200 with 30 ml of 10 w/v% ammonium sulfate solution, 10 minutes of
ultrasonication and heating time of 30 minutes at 235 °C. The catalyst sulfonated by
using the above mentioned condition poses the FAME yield of 23.718%. On the other
hand, the optimum esterification conditions obtained from the study was by heating
the PFAD and methanol with molar ratio of 20:1 at 100 °C oil bath temperature for 8
hours with 15 wt% catalyst loading. The FAME yield obtained from the esterification
process that employed the optimum condition was 47.87%.
However, the highest FAME yield obtained was relatively low. Several
problem was raised and suspected that those may be the reasons of the low FAME
yield. The presence of microorganism on the catalyst that covered up the pores
prevented SO3H from grafting onto the carbon surface. Another problem encountered
was the usage of porcelain container instead of glass container has limited the
dispersion of carbon into the sulfonating agent.
In conclusion, all the objectives of this final year project was fulfilled. Solid
acid catalyst was successfully synthesised from seaweed derived activated carbon by
thermal decomposition of ammonium sulfate. Some areas of the research conducted
have to be improved to obtain better result in the future.

92
5.2 Recommendation
Experiment was done accordingly to the scope of study. However, due to time
constrained, some abnormalities occurred in the experiment was ignored. The
deviation of results can be due to the human error as well as the limitation on the
equipment provided. In order to improve the accuracy and consistency of the
experimental result, some improvement should be made in all areas when more time
is given as well as in the future studies. Some recommendations on the study are listed
at the following:
i. The sample that required in large amount to be used for the further studies
should be mass produced. Sample should be produce in one big batch instead
of producing it separately as the properties of the catalyst may be vary from
one batch to another batch. Thus, the samples that are produced in the same
batch has the same properties and can be used for further parameters study by
remaining the samples as a constant variable.
ii. The equipment used should be consistent. Equipment used like hot plate, oil
bath, glass container and so on should be the same for every set of experiment
to ensure the consistency of the experiment environment.
iii. The number of parameters study should be increased. For example, besides the
carbonisation time, the carbonisation durations and the temperature ramping
time can also be studied on it effect to the biodiesel production. Besides that,
for the sulfonation reaction, other than ammonium sulfate concentration and
heating time, parameters like the ultrasound duration and ammonium sulfate
volume can also be studied.
iv. The number of set of experiment for each parameter could be increased. The
more set of experiment done, the more accurate optimum conditions. For ideal
case, a bell share curve should be obtained to indicate the position of the
optimum condition.

93
v. Analysis of catalyst samples and biodiesel samples should be conducted as
soon as they are produced to avoid any degradation occurs.
vi. If seaweed is used as the biomass to be ca carbonised in to the activated carbon,
pre-treatment is necessary to remove the microorganism attaching on the
surface of the seaweed. The seaweed should be wash thoroughly either with
water or with special chemical that could detach microorganism from the
seaweed.
vii. When ultrasound is required in the catalyst synthesis process, a glass container
should be used to maximise the ultrasound effect on the mixture in the
container.
viii. Biomass with low density could be selected as low density biomass is known
to be more porous and has higher surface area. Thus, the surface available for
the sulfonation is high poses a high efficiency catalyst.

94
REFERENCES
Adam, F.L., James, A.B., Jinesh C.M. and Karen, W., 2014. Heterogeneous catalysis
for sustainable biodiesel production via esterification and transesterification. Royal
Society of Chemistry. 43(22), pp. 7887-7916.
Antonio, D. P., Manoela, S. S., Omar, I. B. S. and Denis, B., 2014. Liquid Biofuels.
London: Springe-Verlag.
Ayhan, D., 2009. Progress and recent trends in biodiesel fuels. Energy Conversion and
Management, 50 (1), pp. 14-34.
Bell Performance, 2014. The Major Differences between Ethanol and Gasoline.
[online] Available at: <http://www.bellperformance.com/blog/the-major-
differences-between-ethanol-and-gasoline> [Accessed 4 July 2015]
Biopact, 2007. A quick look at fourth generation biofuels. [online]. Available at:
<http://global.mongabay.com/news/bioenergy/2007/10/quick-look-at-fourth-
generation.html> [Accessed 4 July 2015]
Bozbas, K., 2008. Biodiesel as an alternative motor fuel: Production and policies in
the European Union. Renewable and Sustainable Energy Reviews, 12 (2), pp. 542-
552.
British Petroleum, 2015. BP Statistical Review of World Energy. [pdf] London, UK:
BP. Available at <http://www.bp.com/content/dam/bp/pdf/Energy-
economics/statistical-review-2015/bp-statistical-review-of-world-energy-2015-
full-report.pdf> [Accessed 4 July 2015].
Carbon Counted, 2015. When Will Fossil Fuels Run Out? [online] Available at:
<http://www.carboncounted.co.uk/when-will-fossil-fuels-run-out.html> [Accessed
1 August 2015].
ChemWiki, 2013. 10C: UV/Vis and IR Spectroscopy [online] Available at: <
http://chemwiki.ucdavis.edu/Core/Analytical_Chemistry/Analytical_Chemistry_2.
0/10_Spectroscopic_Methods/10C%3A_UV%2F%2FVis_and_IR_Spectroscopy>
[Accessed 6 April 2016]

95
C2ES, 2013. Biodiesel. [online] Available at: <
http://www.c2es.org/energy/source/renewables/biofuels/biodiesel#_edn14>
[Accessed 4 July 2015]
Dehkhoda, A.M., West, A.H. and Ellis, N., 2010. Biochar based solid acid catalyst for
biodiesel production. Applied Catalysis A: General, 382(2), pp. 197-204.
Dennis, Y.C., Xuan, W. and Leung, M.K.H., 2010. A review on biodiesel production
using catalysed transesterification. Applied Energy, 87 (4), pp. 1083-1095.
Du, C.Y., Zhao, T.S., Liang, Z.X., 2007. Sulfonation of carbon-nanotube supported
platinum catalyst for polymer electrolyte fuel cells. Journal of Power Sources, 176
(1), pp. 9-15.
Edgar, L., Liu, Y., Lopez, D. E., Suwannakarn, K., Bruce, D.A. and Goodwin, J.G.,
2005. Synthesis of Biodiesel via Acid Catalysis. Industrial and Engineering
Chemistry Research, 44(14), pp. 5353-5363.
Ezebor, F., Khairuddean, M., Abdullah, A.Z. and Boey, P.L., 2014. Oil palm trunk and
sugarcane bagasse derived heterogeneous acid catalyst for production of fatty acid
methyl esters. Energy, 70(2014), pp. 493-503.
Folasegun, A.D., Olubunmi, A., Jiayu, X., Suojiang, Z. and Dongxia, Y., 2013.
Effective conversion of non-edible oil with high free fatty acid into biodiesel by
sulphonated carbon catalyst. Applied Energy, 114, pp. 819-826.
Gaber, A., Abdel-Rahim, M.A., Abdel-Latief, A.Y., Abdel-Salam and Mahmoud, N.,
2014. Influence of Calcination Temperature on the Structure and Porosity of
Nanocrystalline SnO2 Synthesized by a Conventional Precipitation method.
International Journal of Electrochemical Science, 9(1), pp. 81-95.
Jaichandar, S. and Annamalai, K., 2011. The Status of Biodiesel as an Alternative Fuel
or Diesel Engines – An Overview. Journal of Sustainable Energy and Environment,
[online] Available at:
<http://www.jseejournal.com/JSEE%202011/JSEE%20Vol%202%20Issue%202/
11.%20The%20status%20of%20biodiesel%20pp.%2071-75.pdf> [Accessed 20
August 2015].
Janaun, J., Abang, S., and Anwar, A.M., 2013. Synthesis and characterization of
carbon-based catalyst derived from seaweed. In: 2013 IEEE Conference on Clean
Energy and Technology. Langkawi, 18-20 November, 2013. Malaysia: IEEE.
Kastner, J.R., Miller, J., Geller, D.P., Locklin, J., Keith, L.H. and Johnson, T., 2012.
Catalytic esterification of fatty acids using solid acid catalysts generated from
biochar and activated carbon. Catalysis Today, 190 (1), pp. 122-132.

96
Konwar, L.J., Maki-Arvela, P., Salminen, E., Kumar, N., Thakur, A.J., Mikkola, J. and
Deka, D., 2015. Towards carbon efficient biorefining: Multifunctional mesoporous
solid acids obtained from biodiesel production wastes for biomass conversion.
Applied Catalyst B: Environmental, 176(2015), pp. 20-35.
Lambert, J. B., 1987. Introduction to Organic Spectroscopy. New York: Macmillan.
Lee, D., 2013. Preparation of a Sulfonated Carbonaceous Material from
Lignosulfonate and Its Usefulness as an Esterification Catalyst. Molecules, 18 (7),
pp. 8168-8180.
Lee, H.V., Yunus, R., Juan, J.C. and Taufiq-Yap, Y.H., (2011). Process optimization
design for jatropha-based biodiesel production using response surface methodology.
Fuel Processing Technology, 92 (12), pp. 2420-2428.
Lee, K.T., Lam, M.K. and Mohammed, A.R., 2010. Homogeneous, heterogeneous an
enzymatic catalysis for transesterification of high free fatty acid oil (waste cooking
oil) to biodiesel: A review. Biotechnology Advances, 28 (4), pp. 500-518.
Liu, T., Li, Z., Li, W., Shi, C. and Wang, Y., 2013. Preparation and characterization
of biomass carbon-based solid acid catalyst for the esterification of oleic acid with
methanol. Bioresource Technology, 133 (2013), pp. 618-621.
Lokman, L.M., Rashid,U. and Taufiq-Yap, Y.H., 2016. Meso- and macroporous
sulfonated starch solid acid catalyst for esterification of palm fatty acid distillate.
Arabian Journal of Chemistry, 9(2), pp. 179-189.
Maity, J.P., Bundschuh,J., Chen, C and Bhattacharya, P., 2014. Microalgae for third
generation biofuel production, mitigation of greenhouse gas emissions and
wastewater treatment: Present and future perspectives – A mini review. Energy,
78(2014), pp 355-360.
Malins, K., Kampars, V., Brinks, J., Neibolt, I. and Murnieks, R., 2015. Synthesis of
activated carbon based heterogeneous acid catalyst for biodiesel production.
Applied Catalysis B: Environmental, 176(2015), pp. 553-558.
Mar, W.W. and Somsook, E., 2012. Biomass-Based Sulfonic-Functionalized Carbon
Solid Acid for Esterification of Acetic Acid. Advanced Materials Research,
506(2012), pp. 70-73.
Naik, S.N., Goud, V.V., Rout, P.K. and Dalai, A.K., 2010. Production of first and
second generation biofuels: A comprehensive review. Renewable and Sustainable
Energy Reviews, 14(2), pp. 578-597.

97
Okamura, M., Takagaki, A., Toda, M., Konda, J.N., Domen, K., Tatsumi, T., Hara,
Michikazu and Hayashi, S., 2006. Acid-Catalyzed Reactions on Flexible Polycyclic
Aromatic Carbon in Amorphous Carbon, Chemistry of Materials, 18 (13), pp. 3039-
3045.
REN21, 2015. Renewables 2015 Global Status Report. [pdf] Available at <
http://www.ren21.net/wp-content/uploads/2015/06/REN12-
GSR2015_Onlinebook_low1.pdf> [Accessed 4 July 2015].
Robles, A., Gonzalez, P.A., Esteban, L and Molina, E., 2009. Biocatalysis: Towards
ever greener biodiesel production. Biotechnology Advances, 27 (4), pp. 398-408.
Shuit, S.H., Ng, E.P. and Tan, S.H., 2015. A facile and acid-free approach towards the
preparation of sulphonated multiwalled-carbon nanotubes as a strong protonic acid
catalyst for biodiesel production. Journal of Taiwan Institute of Chemical Engineers,
52(2015), pp. 100-108.
Shuit, S.H. and Tan, S.H., 2014. Feasibility study of various sulphonation methods for
transforming carbon nanotubes into catalyst for the esterification of palm fatty acid
distillate. Energy Conversion and Management, 88(2014), pp. 1283-1289.
Shu, Q., Zhang, Q., Xu, G., Nawaz, Z., Wang, D. and Wang, J., 2010. Synthesis of
biodiesel from cottonseed oil and methanol using a carbon-based solid acid catalyst.
Fuel Processing Technology, 90(7), pp. 1002-1008.
Shu, Q., Gao, J., Nawaz, Z., Liao, Y., Wang, D. and Wang, J., 2010. Synthesis of
biodiesel from waste vegetable oil with large amounts of free fatty acids using a
carbon-based solid acid catalyst. Applied Energy, 87 (8), pp. 2589-2596.
Sims, R.E.H., Mabee, W. Saddler, J.N. and Taylor, M., 2010. An overview of second
generation biofuel technology. Bioresource Technology, 101(6), pp. 1570-1580.
Stoytcheva, M. and Montero, G., 2011. Biodiesel – Feedstock and Processing
Technologies. Croatia: InTech.
Sun, Z.P., Zhang, X.G., Liang, Y.Y. and Li, H.L., 2009. A facile approach towards
sulfonate functionalization of multi-walled carbon nanotubes as Pd catalyst support
for ethylene glycol electro-oxidation. Journal of Power Sources, 191 (2), pp. 366-
370.
Sun, Z.X., Zheng, T.T., Bo, Q.B., Du, M. and Fosling, W., 2008. Effect of calcination
temperature on the pore size and wall crystalline structure of mesoporous alumina.
Journal of Colloid and Interface Science, 319(1), pp. 247-251.

98
U.S. Energy Information Administration, 2015. August 2015, Monthly Energy Review.
[pdf] Washington, DC: EIA. Available at
<http://www.eia.gov/totalenergy/data/monthly/pdf/mer.pdf> [Accessed 31 August
2015].
U.S. Energy Protection Agency, 2013. Nuclear Energy, Electricity from Nuclear
Energy. [online] Available at: <http://www.epa.gov/cleanenergy/energy-and-
you/affect/nuclear.html> [Accessed 4 July 2015].
World Energy Council, 2013. World Energy Resources 2013 Survey. [pdf] London,
England. Available at <https://www.worldenergy.org/wp-
content/uploads/2013/09/Complete_WER_2013_Survey.pdf> [Accessed 5 July
2015]
Yu, J. T., Dehkhoda, A. M. and Ellis, N., 2010. Development of Biochar-based
Catalyst for Transesterification of Canola Oil. Energy & Fuels, 25 (1), pp. 337-344.
Zhang, B., Ren, J., Liu, X., Yun, G., Guo Y., Lu, G. and Wang, Y., 2010. Novel
sulfonated carbonaceous materials from p-toluenesulfonic acid/glucose as a high-
performance solid-acid catalyst. Catalysis Communications, 11 (7), pp. 629-632.
Zhang, J., Liu, J. and Liu, R., 2015. Effect of pyrolysis temperature and heating time
on biochar obtained from the pyrolysis of straw and lignosulfonate. Bioresource
Technology, 176 (2015), pp.288-291.

99
APPENDICES
APPENDIX A: SEM Images
Cat-A1
Cat-A2
Cat-A3

100
Cat-A4
Cat-A5
Cat-A6
Cat-A8
Cat-A7

101
Cat-A9
Cat-A13
Cat-A12
Cat-A11
Cat-A10

102
Cat-A14
Cat-A15
Cat-A16
Cat-A17
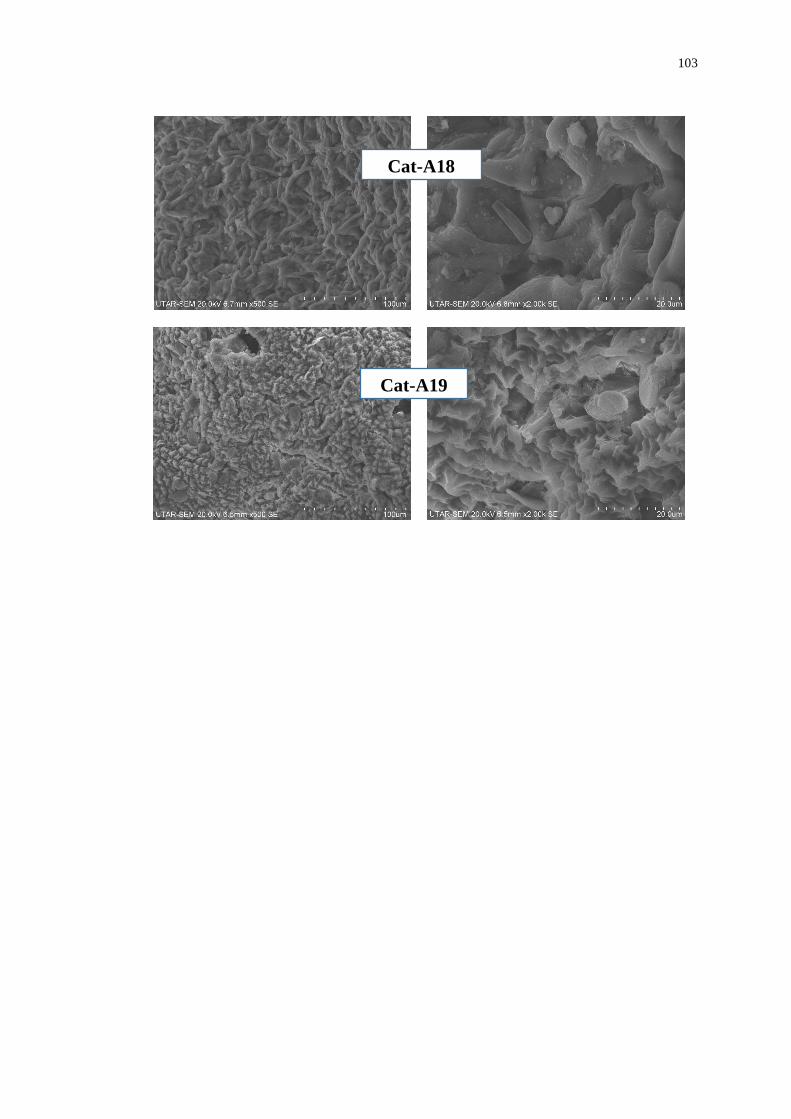
103
Cat-A18
Cat-A19

104
APPENDIX B: EDX Report

105
APPENDIX C: Gas Chromatography Report

106
APPENDIX D: Gantt Chart

107
Week 1 2 3 4 5 6 7 8 9 10 11 12 13 14
Carbonisation of Raw Material
Sulfonation of Carbon
Characterisation of Catalyst
Production of Biodiesel
Product Analysis
Results Analysis
Chapter 4 – Results and Discussion
Revision of Chapter 4
Full Report
Presentation Slides
Oral Presentation

108
APPENDIX E: Material Safety Data Sheet (MSDS)