SYNTHESIS AND LUMINESCENT PROPERTIES OF MULTIPHASE GREEN...
13
SYNTHESIS AND LUMINESCENT PROPERTIES OF MULTIPHASE GREEN PHOSPHOR BASED ON STRONTIUM THIOGALLATE M. Nazarov Department of Materials Science and Engineering, Gwangju Institute of Science and Technology, 1, Oryong-dong, Buk-gu, 500-712, Gwangju, Republic of Korea Institute of Electronic Engineering and Industrial Technologies, Academy of Sciences of Moldova, 3/3, Academiei str., MD-2028, Chisinau, Republic of Moldova Tel: +82-62-970-2355; Fax: +82-62-970-2304 E-mail: [email protected], [email protected] (Received 1 August 2008) Abstract The detailed XRD analysis, EDS, Raman spectroscopy and PL study were achieved in order to enlarge the understanding of the radiative processes in multiphase green phosphors, based on strontium thiogallate. These phosphors were synthesized by solid state reaction at 900 –1000°C with carbon as a reduction atmosphere. The crystal field splitting, Stokes shift, Red shift, and centroidal shift were estimated and they are in a good agreement with mathematical calculations. Our study confirms that proposed multiphase green phosphor based on strontium thiogallate is a good candidate for solid state lighting and display devices with higher intensity and better chromaticity coordinates in comparison with known commercial phosphors. 1. Introduction For the purpose of developing energy-efficient white light sources, we need to produce highly efficient yellow, green, and red phosphors, which can absorb excitation energy from blue LEDs and generate emissions. Many efforts have focused on improving the performance of thiogallate luminescent materials. Luminescent properties of Barium, Strontium, and Cal- cium thiogallates doped with Europium activator have been investigated since 1970 [1-7]. Recently a new wave of intensive study of these materials has begun because they are very attractive photoluminescent, electroluminescent, and cathodoluminescent materials for the visible spectral range [8-15]. Since the absorption of the 4f → 5d transitions of the doping ions extends to the visible spectrum, they are appropriate phosphors for excitation by near UV or blue emitting diodes for solid state lighting (SSL) applications [16]. While these practical applications have been successfully achieved, there are still several aspects regarding the gen- eral ways to provide advanced light-emitting materials with improved properties. Among them there are the searching of novel chemical composition and improving of the existing phosphors including the chemical synthesis. An atmosphere of synthesis plays an important role. Peters and Baglio synthesized thiogallate phosphors under H 2 S stream by CaCO 3 , Ga 2 O 3 , and Eu 2 O 3 [1]. In other works of preparing thiogallates this gas was also used [10, 11]. Since H 2 S is very toxic to human organism, some interesting results were achieved recently without toxic gas using a reduction atmosphere of 5% of H 2 and 95% of N 2 [12]. Some other attempts were launched to prepare thiogallates without H 2 S. For example, F. Aidaev made the synthe- sis at low temperature from NH 4 CNS, but this process has long reaction times and it is com- plicated [13]. Nevertheless, the development of synthesis methods to improve the luminescent properties of thiogallate materials remains actual.
Transcript of SYNTHESIS AND LUMINESCENT PROPERTIES OF MULTIPHASE GREEN...
SYNTHESIS AND LUMINESCENT PROPERTIES OF MULTIPHASE GREEN PHOSPHOR BASED ON STRONTIUM THIOGALLATE
M. Nazarov
Department of Materials Science and Engineering, Gwangju Institute of Science and Technology, 1, Oryong-dong, Buk-gu, 500-712, Gwangju, Republic of Korea
Institute of Electronic Engineering and Industrial Technologies, Academy of Sciences of Moldova, 3/3, Academiei str., MD-2028, Chisinau, Republic of Moldova
Tel: +82-62-970-2355; Fax: +82-62-970-2304 E-mail: [email protected], [email protected]
(Received 1 August 2008)
Abstract
The detailed XRD analysis, EDS, Raman spectroscopy and PL study were achieved in order to enlarge the understanding of the radiative processes in multiphase green phosphors, based on strontium thiogallate. These phosphors were synthesized by solid state reaction at 900 –1000°C with carbon as a reduction atmosphere. The crystal field splitting, Stokes shift, Red shift, and centroidal shift were estimated and they are in a good agreement with mathematical calculations. Our study confirms that proposed multiphase green phosphor based on strontium thiogallate is a good candidate for solid state lighting and display devices with higher intensity and better chromaticity coordinates in comparison with known commercial phosphors.
1. Introduction
For the purpose of developing energy-efficient white light sources, we need to produce highly efficient yellow, green, and red phosphors, which can absorb excitation energy from blue LEDs and generate emissions. Many efforts have focused on improving the performance of thiogallate luminescent materials. Luminescent properties of Barium, Strontium, and Cal-cium thiogallates doped with Europium activator have been investigated since 1970 [1-7]. Recently a new wave of intensive study of these materials has begun because they are very attractive photoluminescent, electroluminescent, and cathodoluminescent materials for the visible spectral range [8-15]. Since the absorption of the 4f → 5d transitions of the doping ions extends to the visible spectrum, they are appropriate phosphors for excitation by near UV or blue emitting diodes for solid state lighting (SSL) applications [16]. While these practical applications have been successfully achieved, there are still several aspects regarding the gen-eral ways to provide advanced light-emitting materials with improved properties. Among them there are the searching of novel chemical composition and improving of the existing phosphors including the chemical synthesis. An atmosphere of synthesis plays an important role. Peters and Baglio synthesized thiogallate phosphors under H2S stream by CaCO3, Ga2O3, and Eu2O3 [1]. In other works of preparing thiogallates this gas was also used [10, 11]. Since H2S is very toxic to human organism, some interesting results were achieved recently without toxic gas using a reduction atmosphere of 5% of H2 and 95% of N2 [12]. Some other attempts were launched to prepare thiogallates without H2S. For example, F. Aidaev made the synthe-sis at low temperature from NH4CNS, but this process has long reaction times and it is com-plicated [13]. Nevertheless, the development of synthesis methods to improve the luminescent properties of thiogallate materials remains actual.
M. Nazarov
421
In this paper the luminescence of the thiogallate phosphors is revisited. The results of producing a new green multiphase thiogallate phosphor {SrGa2S4 + MgGa2O4}:Eu2+ with im-proved luminescence properties are presented in this contribution. However, to our knowl-edge, only the transition metalion –doped magnesium gallate spinels were investigated. To date, Eu2+–doped magnesium gallate spinels were not reported. A systematic investigation at the same preparation and investigation conditions of single and multiphase gallates has been performed in this study using carbon as a reduction atmosphere. The radiative mechanisms of thiogallates are not completely understood and their fundamental knowledge needs to be enlarged. In this paper, excitation and emission photoluminescence spectra with Raman spec-troscopy and X-ray diffraction patterns were analyzed to estimate the nephelauxetic effect, crystal field splitting, and Stokes shift in dependence on activator surrounding in the different host lattices. These data will be useful to evaluate the quality of the powders prepared for dif-ferent electronic devices.
2. Samples and experimental procedure 2.1. Synthesis
Polycrystalline single phase SrGa2S4:Eu2+ phosphor and multiphase {SrGa2S4 + MgGa2O4}:Eu2+ samples were synthesized by solid-state reaction. For SrGa2S4 starting sulfide powders SrS and Ga2S3 mixed in stoichiometric composition and annealed at 900 -1000°C with a carbon reduction atmosphere for 4 h. For multiphase samples we used the same raw materials with addition amounts of MgS and Mg(NO3)2 at the same synthesis conditions. The doping ions in both cases were introduced in the form of EuS. This preparation method is a little different from that reported by Peters et al. [1] as well as above-mentioned [11-13], be-cause we did not use the toxic H2S stream in synthesis process. The method presented here provides powder samples with good crystalline properties as shown by X-ray diffraction measurements. Powder samples with 6 mol % Eu2+ concentration were prepared and studied. The thiogallate single and multiphase samples exhibit a deep green colors. Phosphor samples were characterized by crystalline structure and luminescence properties. 2.2. Sample characterization
2.2.1. X-ray diffraction measurement – The crystal structures of the prepared samples were determined by X-ray diffraction measurement using goniometer (PANalytical, X’Pert pro MPD with Cu- Kα (λ = 1.5418 Å) at 40 kV and 30 mA. The scan speed was 3 seconds per step (0.02° step – 2theta) and covered the range between 10° and 90°.
2.2.2. EDS (Energy Dispersive Spectroscopy) and EPMA (Electron probe micro analy-sis) – Qualitative and Quantitative non-destructive elemental analysis was performed with EPMA machine, model SX-100 (the electron acceleration was 20 kV, beam current 10 nA, and the diameter of electronic beam was 50 µm, DT:0.3 S). It is the most precise and accurate mi-cro-analysis technique available and all elements from Beryllium to Uranium can be analyzed.
2.2.3. Raman spectroscopy - Raman scattering spectra of SrGa2S4, and multiphase pre-pared phosphors were measured by a Renishaw 3000 spectrometer with a He-Ne laser (excita-tion wavelength of λ= 633 nm and λ= 785 nm) and a photomultiplier counter at room temperature in back scattering configuration. The spectral resolution of spectrometer is about 4 cm-1 at 633 nm and 1 cm-1 at 785 nm.
2.2.4. Photoluminescence (PL) measurement – Optical spectroscopy and PL characteris-tics were estimated on the basis of emission and excitation spectra registered at room tempera-

Moldavian Journal of the Physical Sciences, Vol.7, N4, 2008
422
ture (Xe 500 W lamp) with DARSA PRO 5100 PL System (Professional Scientific Instrument Co, Korea). Excitation spectra were corrected for the energy distribution of the Xe-lamp. The excitation was performed with a 460 nm radiation, which is usually used in blue LED.
2.2.5. Morphology and size measurement – Particle sizes and morphologies of the in-vestigated phosphors were determined by scanning electron microscope (SEM) Hitachi-S-3000N. To control the particle size and to find the size distribution the Laser diffraction was carried out using HELOS particle size analysis system.
3. Results and discussion 3.1. XRD
Figure 1 shows the X-ray diffraction patterns of the multiphase phosphor on the basis of Strontium thiogallate powder fired at 1000°C (1). Their positions are in a good agreement with fitting (2) and ICSD (ICSD: Inorganic Crystallographic Structure Database) data (3-6).
20 40 60 80
-2000
0
2000
4000
6000
8000
10000
12000
Inte
nsity
(cou
nts)
2 theta(degree)
Multiphase phosphor fit (calculation result) ICSD46019 SrGa2S4 ICSD82916 MgGa2O4 ICSD76753 Ga2S3 ICSD9863 MgO
123456
1,23456
Fig. 1. The X-ray diffraction patterns of multiphase phosphor on the basis of Strontium thio-
gallate and its fitting in comparison with reference ICSD data.
Solid black curve (1) in Fig. 1 is the measured data and red curve (2) means the calcula-tion result of Rietveld analysis which was developed by H. M. Rietveld in 1967 for structure profile refinement of X-ray powder diffraction data [17]. The Rietveld calculation uses the least squares method to get all these crystallographic information by comparing model profile and X-ray or neutron curves. The peak positions of X-ray diffraction curve are related to the unit cell lattice constants of the crystal structure and the peak intensities are affected by atomic position, atom species, atomic occupancy, and thermal parameters. The absence of peaks explains the crystallographic symmetry. In addition, crystalline size and strain induce peak broadening in XRD pattern. All these important information could be obtained from Rietveld analysis and, therefore, we applied this analysis for X-ray pattern. In case of multi-phase structures, quantitative phase analysis is available by using Rietveld method. The de-tailed crystallographic information from Rietveld analysis is listed in Tables 1-3.

M. Nazarov
423
Table 1. Crystallographic data for single phase SrGa2S4 and multiphase phosphor.
First of all, we did Rietveld refinement to check the crystallographic structure of the sam-
ples. Figure 1 shows that the structure of our synthesized samples is similar to the structure of SrGa2S4 orthorhombic phase ICSD-46019 pattern (3). Thereby, we could confirm that in real-ized synthesis conditions we obtained not only one single phase of SrGa2S4, but also some other different phases. The most important of them is MgGa2O4, because when we introduce an acti-vator Eu2+, it substitutes Sr and Mg in these two phases. The unit cell parameters of ICSD-46019 (SrGa2S4) are a=20.932Å, b=20.549Å, c=12.227Å and they are very similar to our sam-ple as it is seen from Table 1. A slight difference in a cell parameter can be explained by a slight difference in atomic positions. The positions of Sr atoms were the same to the reference, but the positions of Ga atoms and S atoms were a little different. The different atomic positions affected the unit cell parameter and the distance of Sr atoms and S atoms. Crystallographic data for syn-thesized SrGa2S4 and multiphase {SrGa2S4 + MgGa2O4} sample are given in Tables 2-4.
Table 2. Crystallographic data for different ion positions in synthesized SrGa2S4.
From the occupation factor F one can see that when F=1 or nearby, it means the site is
occupied by an atom. When F<1 (S2 position in synthesized phosphor) the site could be sub-stituted by a lighter atoms, in our case it maybe oxygen, for example.
The thiogallate compounds of the type SrIGa2S4 belong to the orthorhombic crystal class with the space group D24 2h (Fddd) [18] and MgGa2O4 to cubic structure with the space group O7
h Fd3m. There are 32 formula-mass units per unit cell (z = 32) and, therefore, 56 at-oms in a primitive cell: 8 Sr, 16 Ga, 32 S. According to B. Eisenmann et al. [18], the Sr atoms occupy square anti-prismatic sites formed by eight sulfur (symmetry group D4d) forming Sr(S)8 units with C2 and D2 symmetry. In the SrGa2S4:Eu2+ compound, the cation ions are substituted by the Eu2+ ions. From XRD data (Table 2) they are situated in three slightly dif-
Sample Phase Wt. % Structure Reference Calculated structure a (Ǻ) b(Ǻ) c(Ǻ)
SrGa2S4 SrGa2S4 100 orthorhombic ICSD46019 20.855 20.511 12.231
SrGa2S4 62.2 orthorhombic ICSD46019 20.860 20.488 12.219 MgGa2O4 27.8 Cubic Fd-3m ICSD82916 8.301
Ga2S3 6.9 Cubic F4-3m ICSD76753 5.195 Multiphase phosphor
MgO 2.3 Cubic Fm-3m ICSD9863 4.211
wRp=0.12 orthorhombic x y z F Multiplefactor
Rp=0.095 a=20.8558(19) Sr1 0.125 0.125 0.125 1 8 R(F^2)=0.174 b=20.5115(22) Sr2 0.125 0.125 0.625 1 8 ICSD-46019 c=12.2138(12) Sr3 0.8726 0.125 0.125 1 16
Ga1 -0.0033(8) 0.8040(4) 0.1633(7) 1.05(2) 32 α=90 Ga2 -0.0052(8) 0.2370(4) 0.3752(8) 1.16(2) 32 β=90 S1 0.1672(10) 0.2472(13) 0.997(2) 1.15(4) 32 γ=90 S2 0.1725(14) 0.5078(17) 0.262(3) 0.83(4) 32
S3 0.999(2) 0.3438(8) 0.0089(15) 1.00(4) 32
SrGa2S4 Single phase
F d d d S4 -0.006(3) 0.4204(10) 0.2701(16) 1.00(3) 32
Moldavian Journal of the Physical Sciences, Vol.7, N4, 2008
424
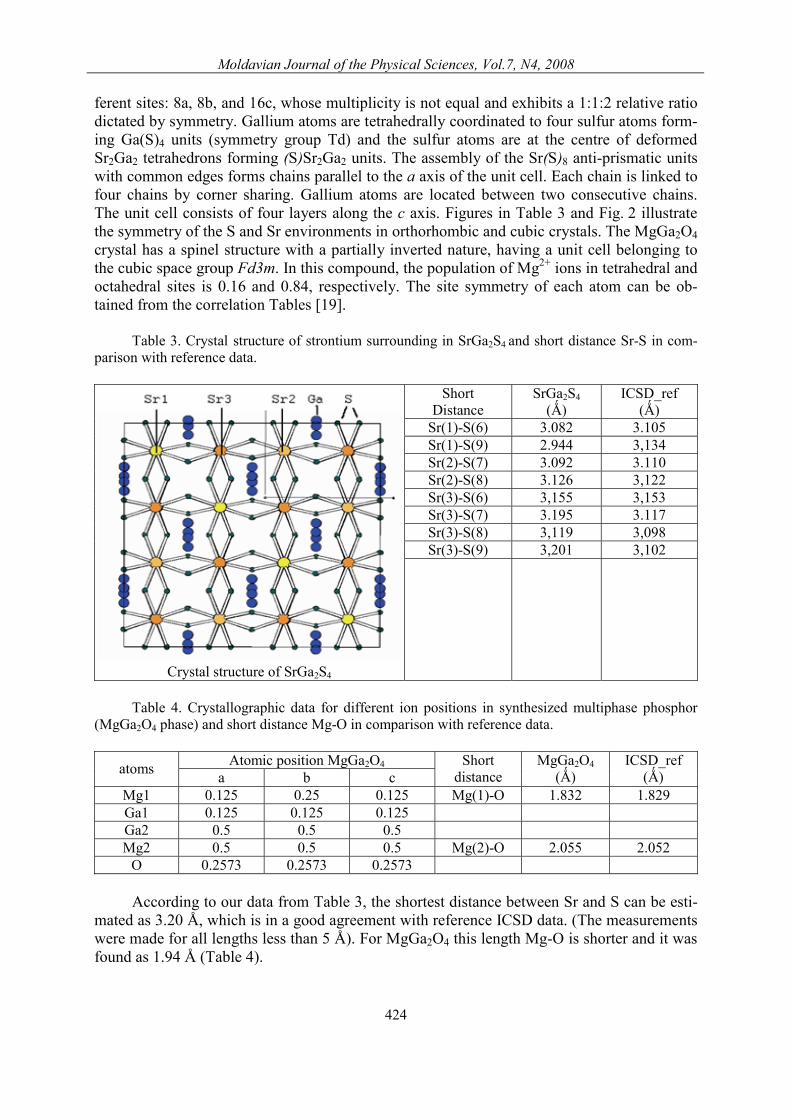
ferent sites: 8a, 8b, and 16c, whose multiplicity is not equal and exhibits a 1:1:2 relative ratio dictated by symmetry. Gallium atoms are tetrahedrally coordinated to four sulfur atoms form-ing Ga(S)4 units (symmetry group Td) and the sulfur atoms are at the centre of deformed Sr2Ga2 tetrahedrons forming (S)Sr2Ga2 units. The assembly of the Sr(S)8 anti-prismatic units with common edges forms chains parallel to the a axis of the unit cell. Each chain is linked to four chains by corner sharing. Gallium atoms are located between two consecutive chains. The unit cell consists of four layers along the c axis. Figures in Table 3 and Fig. 2 illustrate the symmetry of the S and Sr environments in orthorhombic and cubic crystals. The MgGa2O4 crystal has a spinel structure with a partially inverted nature, having a unit cell belonging to the cubic space group Fd3m. In this compound, the population of Mg2+ ions in tetrahedral and octahedral sites is 0.16 and 0.84, respectively. The site symmetry of each atom can be ob-tained from the correlation Tables [19].
Table 3. Crystal structure of strontium surrounding in SrGa2S4 and short distance Sr-S in com-parison with reference data.
Short Distance
SrGa2S4 (Ǻ)
ICSD_ref (Ǻ)
Sr(1)-S(6) 3.082 3.105 Sr(1)-S(9) 2.944 3,134 Sr(2)-S(7) 3.092 3.110 Sr(2)-S(8) 3.126 3,122 Sr(3)-S(6) 3,155 3,153 Sr(3)-S(7) 3.195 3.117 Sr(3)-S(8) 3,119 3,098 Sr(3)-S(9) 3,201 3,102
Crystal structure of SrGa2S4
Table 4. Crystallographic data for different ion positions in synthesized multiphase phosphor
(MgGa2O4 phase) and short distance Mg-O in comparison with reference data.
Atomic position MgGa2O4 atoms a b c Short
distance MgGa2O4
(Ǻ) ICSD_ref
(Ǻ) Mg1 0.125 0.25 0.125 Mg(1)-O 1.832 1.829 Ga1 0.125 0.125 0.125 Ga2 0.5 0.5 0.5 Mg2 0.5 0.5 0.5 Mg(2)-O 2.055 2.052
O 0.2573 0.2573 0.2573
According to our data from Table 3, the shortest distance between Sr and S can be esti-mated as 3.20 Å, which is in a good agreement with reference ICSD data. (The measurements were made for all lengths less than 5 Å). For MgGa2O4 this length Mg-O is shorter and it was found as 1.94 Å (Table 4).

M. Nazarov
425
Fig. 2. Crystal structure of SrGa2S4 (left) and MgGa2O4 (right) and different ion positions in these unit cells. 3.3. EDS and EPMA
We carried out compositional analysis by energy dispersive X-ray spectrometry (EDS) by means a JEOL 2010 CX electron microscope. Energy dispersive spectra from one single phase SrGa2S4 phosphor and multiphase {SrGa2S4+MgGa2O4} sample are shown in Fig. 3.
Fig. 3. EDS patterns corresponding to SrGa2S4 (a) and multiphase {SrGa2S4+MgGa2O4} sample (b).

Moldavian Journal of the Physical Sciences, Vol.7, N4, 2008
426
The distribution of elements could be analyzed from Table 5.
Table 5. Compositional EDS analysis.
It is clearly seen from Fig. 3 and Table 5 that at the initial 6 mol % Eu2+ concentration
in both samples the activator incorporation degree in two samples differs about 4 times. This parameter is very important because instead of initial activator concentration the activator incorporation degree is responsible for luminescence properties [20]. Unfortunately, EDS analysis could not detect the light elements like magnesium and oxygen, therefore, the com-positions of the samples were also examined by electron probe microanalysis.
The EPMA technique allowed us to use WDS (wavelength dispersive spectroscopy) and the sample composition can be easily identified. Magnesium and oxygen analyzed by electron probe microanalyses were detected in the multiphase phosphor and shown in Fig. 4. The quantitative data were found in a good agreement with EDS and XRD data.
Fig. 4. Fragment of EPMA analysis of light elements in {SrGa2S4+MgGa2O4}. 3.2. Raman spectroscopy
The Stokes spectra of the polycrystalline SrGa2S4 and {SrGa2S4 + MgGa2O4} are given from 50 cm-1 to 500 cm-1 in Fig. 5.
Atomic % Weight % Wt. % Error Element Single (a) Multi (b) Single (a) Multi (b) Single (a) Multi (b) Sr - La 6.79 2.29 9.89 2.95 0.16 0.10 S - K 29.85 11.96 15.90 5.64 0.11 0.07 Eu La 0.59 2.89 1.50 6.45 0.17 0.22 Ga - K 62.76 82.86 72.71 84.96 0.59 0.65 Total 100.00 100.00 100.00 100.00

M. Nazarov
427
0 100 200 300 400 500
0 100 200 300 400 50015
5,6
357,
2
401,
240
6,1
305
279,
3
190
202,
7
119,
791
,3a
Raman shift (cm-1)
b
Fig. 5. Raman spectra of SrGa2S4 (a) and {SrGa2S4 + MgGa2O4}(b), excited with the 785 nm la-
ser line.
Stokes spectra for both samples are very similar and consist of 19 vibration lines posi-tioned between 68 cm-1 and 408 cm-1. The factor-group method predicts that the total number of Raman-active phonons is 84 for this structure [21]. The reduced numbers of modes in the Raman spectra are in favour of a molecular model to describe the vibrations of these com-pounds [22, 23]. Two dominant peaks at 279 cm-1 (34.5 meV) and at 357 cm-1 (44.2 meV) for SrGa2S4 and {SrGa2S4 + MgGa2O4} are registered. One can see only one distinction from our data and Fig. 5. The ratio of these peaks is 1.88 for SrGa2S4 and 1.5 for {SrGa2S4 + MgGa2O4}. All other peak intensities and peak positions coincide very well. These Raman spectra are in a good agreement with those reported in the literature for SrGa2S4 [24, 25] and could be used for the fitting of emission bands. 3.4. Excitation and emission spectra
The emission and excitation spectra of investigated compounds doped with 6 mol % of Eu2+ at 300 K are presented in Fig. 6. For both samples the emission spectra under excitation at 460 nm consist of a broad band in the visible range. The maximum wavelength of the band for multiphase phosphor (2) is shifted to 539 nm in comparison with 535 nm for SrGa2S4 (1). Full Widths at Half Maximum (FWHM) are equal, correspondingly, to 44 nm (2) and 49 nm (1). No additional bands due to the emission of Eu2+ in investigated samples are observed.
The emission is ascribed to the dipole-allowed transition from the lower 4f6(7F)5d state to the 4f7(8S7/2) fundamental state of the Eu2+ ions [1]. The single configuration coordinate model was used to fit the emission band of considered phosphors.
In first approximation, it is supposed that only the fundamental vibration level (m=0) of the excited electronic state is occupied. Using this hypothesis, the intensity of the vibronic transition from the fundamental vibration level of the emitting electronic state to the n vibra-tion level of the ground electronic state, i.e., the m=0→n transition, is proportional to the ex-pression [26]
I~exp(-S)·Sn/n! where S is the Huang-Rhys parameter and measures the interaction between the luminescent centre and the vibrating lattice. The energy gap between two vibronic peaks is equal to the

Moldavian Journal of the Physical Sciences, Vol.7, N4, 2008
428
quantity hνg, the mean lattice phonon energy for the 4f7(8S7/2) ground electronic state. The best fits of the emission band for {SrGa2S4 + MgGa2O4}:Eu2+ were obtained with S=4 and hνg=34.5 meV (Fig. 7).
200 250 300 350 400 450 500 5500.0
0.2
0.4
0.6
0.8
1.0
PL In
tens
ity (n
orm
aliz
ed)
Wavelength (nm)
1 2
450 500 550 600 6500
2000
4000
6000
8000
10000
12000
PL in
tens
ity (a
.u.)
Wavelength (nm)
2
1
Fig. 6a. Excitation spectra of SrGa2S4:Eu2+
(1) and {SrGa2S4 + MgGa2O4}:Eu2+(2).
Fig. 6b. Emission spectra of SrGa2S4:Eu2+
(1) and {SrGa2S4 + MgGa2O4}:Eu2+(2) excited by 460 nm.
460 480 500 520 540 560 580 600 620 6400.0
0.2
0.4
0.6
0.8
1.0
S=4hv=34.5 meV
Calculation---- Experiment
Inte
nsity
(a.u
)
Wavelength (nm)
Fig. 7. Experimental (broken curve) and calculated (circles) emission spectrum of the {SrGa2S4 + MgGa2O4}:Eu2+ (6 mol %) at 300 K under excitation at 460 nm.
The values of Huang-Rhys parameter correspond to a strong electron–phonon coupling and can be linked to the high symmetry of the emission bands for both samples. These values are in a good agreement with those presented in literature for strontium thiogallates [11].
By supposing that the ground state parabola of the configuration coordinate model pre-sents the same curvature as the excited state parabola, i.e., the phonon energy is the same for the 4f7(8S7/2) ground state as for the 4f6(7F)5d excited state (hνg =hνe =hν), we can determinate the Stokes shift (ΔS). ΔS is related to the offset of the parabolas in the configuration coordinate dia-gram and ΔS is equal to (2S-1)hν. Calculated Stokes shift for multiphase {SrGa2S4 + MgGa2O4} powder is ΔS=0.24 eV (1935 cm-1) and these data are similar to single phase SrGa2S4.

M. Nazarov
429
The excitation and emission spectra of multiphase phosphor {SrGa2S4 + MgGa2O4}:Eu2+, as well as its detailed analysis for 539 nm wavelength, are presented in Fig. 8.
200 250 300 350 400 450 500 550 600 6500.0
0.2
0.4
0.6
0.8
1.0
Eu2+
4f7-4f65d1(a
1)
λem=539 nmλabs=490 nm
E o=514
nm
PL In
tens
ity (n
orm
aliz
ed)
Wavelength (nm)
Stokes shift
1
2A
B
C
4f7-4f65d1(e2)Eu2+
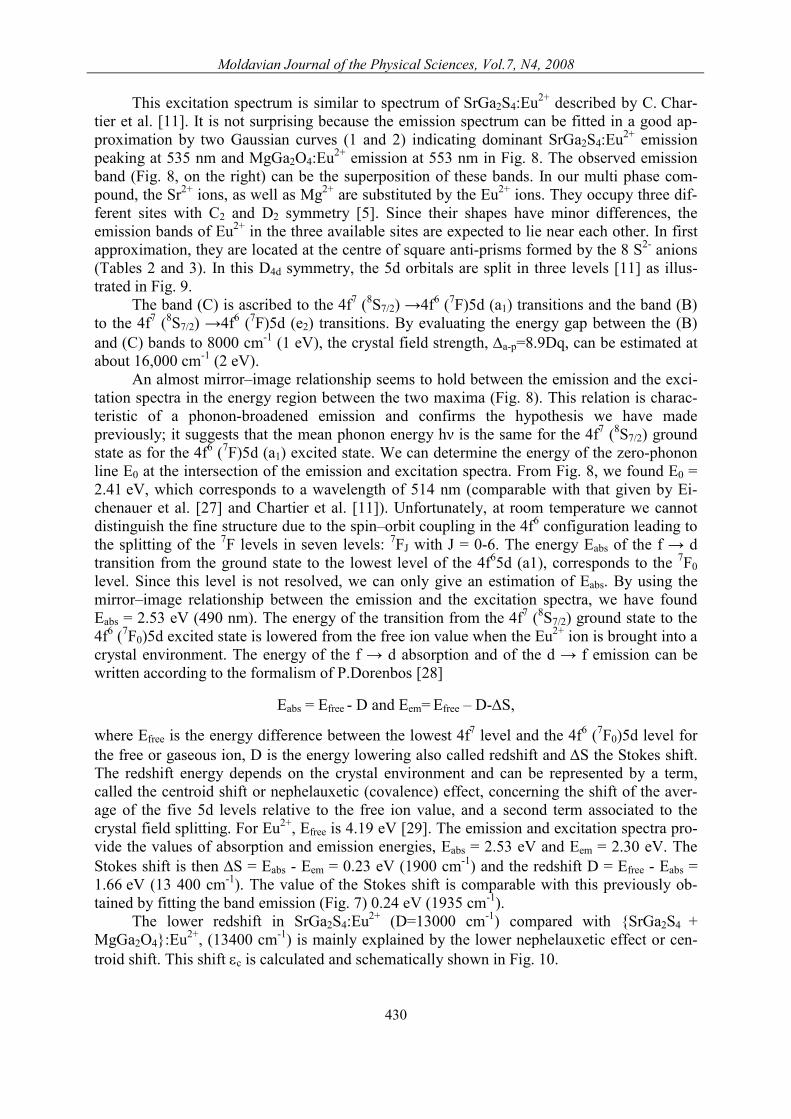
Fig. 8. Excitation and emission spectra of multiphase phosphor {SrGa2S4 + MgGa2O4}:Eu2+ at 300 K.
Fig. 9. Splitting of the five 5d orbitals in a square antiprismatic (D4d) symmetry.
Figure 8 shows that the excitation spectrum is composed of three large bands in the
UV–visible range: Feebly marked at room temperature excitation band (A) is ascribed to the transitions be-
tween the valence band and the conduction band of the host matrix. The two excitation bands (B) and (C) are ascribed to the 4f7(8S7/2)-4f6 (7F)5d transitions
in Eu2+ electronic levels.
Moldavian Journal of the Physical Sciences, Vol.7, N4, 2008
430
This excitation spectrum is similar to spectrum of SrGa2S4:Eu2+ described by C. Char-tier et al. [11]. It is not surprising because the emission spectrum can be fitted in a good ap-proximation by two Gaussian curves (1 and 2) indicating dominant SrGa2S4:Eu2+ emission peaking at 535 nm and MgGa2O4:Eu2+ emission at 553 nm in Fig. 8. The observed emission band (Fig. 8, on the right) can be the superposition of these bands. In our multi phase com-pound, the Sr2+ ions, as well as Mg2+ are substituted by the Eu2+ ions. They occupy three dif-ferent sites with C2 and D2 symmetry [5]. Since their shapes have minor differences, the emission bands of Eu2+ in the three available sites are expected to lie near each other. In first approximation, they are located at the centre of square anti-prisms formed by the 8 S2- anions (Tables 2 and 3). In this D4d symmetry, the 5d orbitals are split in three levels [11] as illus-trated in Fig. 9.
The band (C) is ascribed to the 4f7 (8S7/2) →4f6 (7F)5d (a1) transitions and the band (B) to the 4f7 (8S7/2) →4f6 (7F)5d (e2) transitions. By evaluating the energy gap between the (B) and (C) bands to 8000 cm-1 (1 eV), the crystal field strength, Δa-p=8.9Dq, can be estimated at about 16,000 cm-1 (2 eV).
An almost mirror–image relationship seems to hold between the emission and the exci-tation spectra in the energy region between the two maxima (Fig. 8). This relation is charac-teristic of a phonon-broadened emission and confirms the hypothesis we have made previously; it suggests that the mean phonon energy hν is the same for the 4f7 (8S7/2) ground state as for the 4f6 (7F)5d (a1) excited state. We can determine the energy of the zero-phonon line E0 at the intersection of the emission and excitation spectra. From Fig. 8, we found E0 = 2.41 eV, which corresponds to a wavelength of 514 nm (comparable with that given by Ei-chenauer et al. [27] and Chartier et al. [11]). Unfortunately, at room temperature we cannot distinguish the fine structure due to the spin–orbit coupling in the 4f6 configuration leading to the splitting of the 7F levels in seven levels: 7FJ with J = 0-6. The energy Eabs of the f → d transition from the ground state to the lowest level of the 4f65d (a1), corresponds to the 7F0 level. Since this level is not resolved, we can only give an estimation of Eabs. By using the mirror–image relationship between the emission and the excitation spectra, we have found Eabs = 2.53 eV (490 nm). The energy of the transition from the 4f7 (8S7/2) ground state to the 4f6 (7F0)5d excited state is lowered from the free ion value when the Eu2+ ion is brought into a crystal environment. The energy of the f → d absorption and of the d → f emission can be written according to the formalism of P.Dorenbos [28]
Eabs = Efree - D and Eem= Efree – D-ΔS,
where Efree is the energy difference between the lowest 4f7 level and the 4f6 (7F0)5d level for the free or gaseous ion, D is the energy lowering also called redshift and ΔS the Stokes shift. The redshift energy depends on the crystal environment and can be represented by a term, called the centroid shift or nephelauxetic (covalence) effect, concerning the shift of the aver-age of the five 5d levels relative to the free ion value, and a second term associated to the crystal field splitting. For Eu2+, Efree is 4.19 eV [29]. The emission and excitation spectra pro-vide the values of absorption and emission energies, Eabs = 2.53 eV and Eem = 2.30 eV. The Stokes shift is then ΔS = Eabs - Eem = 0.23 eV (1900 cm-1) and the redshift D = Efree - Eabs = 1.66 eV (13 400 cm-1). The value of the Stokes shift is comparable with this previously ob-tained by fitting the band emission (Fig. 7) 0.24 eV (1935 cm-1).
The lower redshift in SrGa2S4:Eu2+ (D=13000 cm-1) compared with {SrGa2S4 + MgGa2O4}:Eu2+, (13400 cm-1) is mainly explained by the lower nephelauxetic effect or cen-troid shift. This shift εc is calculated and schematically shown in Fig. 10.

M. Nazarov
431
Fig. 10. Nephelauxetic effect in polycrystalline single phase SrGa2S4:Eu2+ phosphor and multi-phase {SrGa2S4 + MgGa2O4}:Eu2+ sample.
The Sr element is less electronegative than the Mg element and the cation-anion lengths Sr-S in strontium thiogallate are larger (3.21 Å) than Mg-O in magnesium digallium oxide (2.05 Å). The Sr-S bonds are then less covalent than the Mg-O ones and the nephaulexetic effect is weaker in SrGa2S4 than in MgGa2O4. Stronger nephaulexetic effect (or centroid shift) replaces the peak wavelength from 535 nm to 539 nm that is very important for improvement the color rendering index.
Considering the proposed mechanism of Eu2+ luminescence from multiphase phosphor (superposition of two bands from SrGa2S4:Eu2+ and MgGa2O4:Eu2+), there are two near situ-ated lines with energies 2.32 eV (535 nm) and 2.24 eV (553 nm), corresponding to different Eu sites in the two different phases (Fig. 10).
One of the important problems for practical application of thiogallates in LED, displays, and other devices is radiant efficiency and stability. Usually these materials are very bright and have very high efficiency, but sometimes their stability toward hydrolysis and tempera-ture is not sufficient. Therefore, we propose to use the multiphase ternary compounds with oxide phase because they are much more stable than ternary sulfides.
Summarized luminescence and crystallographic data for investigated thiogallates, doped with 6 mol % Eu2+ concentration are given in Table 7.
Table 7. Luminescence data for SrGa2S4 and {SrGa2S4+MgGa2O4} doped with 6 mol % Eu2+.
4. Conclusions
A new green multiphase phosphor {SrGa2S4+MgGa2O4}: Eu2+ with improved lumines-cence properties was synthesized.
Our experiments and detailed analysis show that the luminescence intensity in a new compound increases and it is about 15% higher than in the best commercial strontium thio-gallate. The FWHM is narrower and general luminescence is shifted from 535 nm to 539 nm.
Formula
λ(abs) nm/ (eV)
Eo nm/ (eV)
λ(em) nm/ (eV)
FWHM (nm) S hν
(meV)
ΔS cm-1/ (eV)
D cm-1/ (eV)
ε (cfs) cm-1/ (eV)
ε(centr) cm-1/ (eV)
SrGa2S4 482 2.57
508 2.44
535 2.31 49 4 34.5 2000
0.26 13000 1.62
16000 2.0
3400 0.42
{SrGa2S4+ MgGa2O4}
490 2.53
514 2.41
539 2.30 44 4 35.5 1900
0.23 13400 1.66
16000 2.00
3700 0.46
εc=0.42 eV (3400 cm-1)
εcf s=2.0 eV (16000 cm-1)
ΔS=0.26 eV a1
e2
e3
4.19 eV
SrGa2S4 SrGa2S4 +MgGa2O4 2.3 eV (535 nm)
2.2 eV (553 nm)
εc=0.46 eV (3700 cm-1)
ΔS=0.23 eV
εcf s=2.0 eV (16000 cm-1)
e3
a1
e2
2.3 eV (535 nm)

Moldavian Journal of the Physical Sciences, Vol.7, N4, 2008
432
The luminescence and crystallographic data are summarized and listed in Tables 1 and 7. These data will be useful to evaluate the quality of the powders prepared for different elec-tronic devices. Our study confirms that proposed multiphase green phosphor based on stron-tium thiogallate is a good candidate for solid state lighting, LED, and display devices.
Acknowledgements
This work was supported by BK21 Program funded by the Ministry of Science and Technology of Korean government.
References
[1] T.E. Peters and J.A. Baglio, J. Electrochem. Soc., 119, 230, (1972). [2] T.E. Peters, J. Electrochem. Soc., 119, 1720, (1972). [3] P.C. Donohue and J.E. Hanlon, J. Electrochem. Soc., 121, 137, (1974). [4] A.M. Lozac’h, M. Guittard and J. Flahaut, Mat. Res. Bull., 8, 75, (1973). [5] B. Eisenmann, M. Jakowski, and H. Schafer, Mat.Res.Bull.,17, 1169, (1982). [6] Garcia, C. Fouassier, and P. Dougier, J. Electrochem. Soc., 129, 2063, (1982). [7] M.R. Davolos, A. Garcia, C. Fouassier, and P. Haggenmuller, J. Solid State Chem., 83, 316, (1989). [8] A.N. Georgobiani, V.V. Sturov, V.I. Tyutyunnikov, B.G. Tagiev, O.B. Tagiev, and
R.B. Djabbarov, J. Phys. Chem. Solids, 64, 1519, (2003). [9] P. Benalloul, C. Barthou, C. Fouassier, A. Georgobiani, L. Lepnev, Y. Emirov, A. Gruzint-
sev, B. Tagiev, O. Tagiev, and R. Djabbarov, J. Electrochem. Soc., 150, 1, G62, (2003). [10] R.B. Jabbarov, C. Chartier, B.G. Tagiev, O.B. Tagiev, N.N. Musayeva, C. Barthou, and
P. Benalloul, J. Phys. Chem. Solids, 66, 1049, (2005). [11] C. Chartier, C. Barthou, P. Benalloul, and J. Frigerio, J. Lumin., 111, 147, (2005). [12] J.M. Kim, K.N. Kim, J.K. Park, C.H. Kim, and H.G. Jang, J. Korean Chem. Soc., 48, 371, (2004). [13] F.Sh. Aidaev, Inorg. Mater., 39, 96, (2003). [14] C. Barthou, R. Jabbarov, P. Benalloul, C. Chartier, M. Musayeva, B. Tagiev, and
O. Tagiev, J. Electrochem. Soc., 153, 3, G253, (2006). [15] C. Guo, Q. Tang, D. Huang, C. Zhang, and Q. Su, J. Phys. Chem. Solids, 68, 217, (2007). [16] G.O. Mueller and R. Mueller-Mach, Proc. of International Display Workshop IDW’2000,
Kobe, Japan, 821, (2000). [17] H.M. Rietveld, Acta Cryst., 22, 151, (1967). [18] B. Eisenmann, M. Jakowski, W. Klee, and H. Schaefer, Rev. Chim. Miner., 20, 255, (1983). [19] W.G. Fateley, N.T. McDewitt, and F.F. Bentley, Appl. Spectrosc., 25, 155, (1970). [20] M.V. Nazarov, J.H. Kang, D.Y. Jeon, E.-J. Popovici, L. Muresan, and B.S. Tsukerblat,
Solid State Commun., 133, 183, (2005). [21] R. Halford, J. Chem. Phys., 14, 8, (1946). [22] N. Mamedov, S. Iida, T. Aoki-Matsumoto, A. Kato, M. Yamazaki, N. Yamamoto,
T. Shishido, and K. Iwai, Japan. J. Appl. Phys., 39, 307, (2000). [23] S. Iida, N. Mamedov, A. Aoki-Matsumoto, N. Yamamoto, M. Yamakasi, A. Kato, and
K. Iwai, Japan. J. Appl. Phys., 39, 315, (2000). [24] C. Chartier, R. Jabbarov, M. Jouanne, J. Morhange, P. Benalloul, C. Barthou, J. Frigerio,
and B. Tagiev, Proc. of EL-2002, Ghent, 49, (2002). [25] C. Chartier, R. Jabbarov, M. Jouanne, J.F. Morhange, P. Benalloul, C. Barthou,
J.M. Frigerio, B. Tagiev, and E. Gambarov, J. Phys.: Condens. Matter, 14, 13693, (2002). [26] S. Shionoya and W.M. Yen (Eds.), Phosphor Handbook, CRC Press, New York, 41, 1998. [27] L. Eichenauer, B. Jarofke, H.-C. Mertins, J. Dreyhsig, W. Busse, H.-E. Gumlich, P. Benalloul,
C. Barthou, J. Venoit, C. Fouassier, and A. Garcia, Phys. Stat. Sol. A, 153, 515, (1996). [28] P. Dorenbos, J. Lumin., 104, 239, (2003). [29] J. Sugar and N. Spector, J. Opt. Soc. Am., 64, 11, 1484, (1974).