Syneron Medical Ltd. Investor Presentation - Amazon S3 · 1997 2014 Invasive Procedures Non-...
53
Syneron Medical Ltd. Investor Presentation August 2015
-
Upload
duongxuyen -
Category
Documents
-
view
214 -
download
0
Transcript of Syneron Medical Ltd. Investor Presentation - Amazon S3 · 1997 2014 Invasive Procedures Non-...

Syneron Medical Ltd.Investor Presentation
August 2015

Safe Harbor For Forward Looking StatementsAny statements contained in this presentation regarding future expectations, beliefs, goals, plans orprospects constitute forward-looking statements within the meaning of the Private SecuritiesLitigation Reform Act of 1995. Further, any statements that are not statements of historical fact(including statements containing "believes," "anticipates," "plans," "expects," "may," "will," "would,""intends," "estimates" and similar expressions) should also be considered to be forward-lookingstatements. There are a number of important risks and factors that could cause actual results orevents to differ materially from those indicated by forward-looking statements in this presentation,including the risks set forth in Syneron Medical Ltd.'s most recent Annual Report on Form 20-F, andthe other factors described in the filings that Syneron Medical Ltd. makes with the SEC from time totime. If one or more of these risks or factors materialize, or if any underlying assumptions proveincorrect, Syneron Medical Ltd.'s actual results, performance or achievements may vary materiallyfrom any future results, performance or achievements expressed or implied by the forward-lookingstatements in this presentation.
Non-GAAP Financial MeasuresThe following presentation includes certain "non-GAAP financial measures" as defined inRegulation G under the Securities Exchange Act of 1934. A schedule is included in the company’sQ2 2015 press release, which reconciles our results as reported under General AcceptedAccounting Principles and the non-GAAP financial measures included in the following presentation.
2

Syneron at a Glance• A global leader in medical
aesthetic devices
• Growing aesthetic market and consumer demand for energy based non-invasive procedures
• Largest worldwide presence in sales, distribution, service network and installed based
3

1. Superior technology for non invasive Fat Destruction (UltraShape) and Body Shaping (VelaShape – 7,000 units sold WW)
2. Focus on high margin recurring revenues3. Significant expansion and optimization of NA
sales force, focused on selling high margin products
4. PicoWay breakthrough technology for tattoo removal and treatment of pigmented lesions
5. Profound RF micro-needle technology addresses growing demand for high-end facial treatments
1 Based on US publicly traded companies listed here (CYNO, CUTR, ZLTQ, LMNS); Professional Aesthetic Device Sector
2 Trailing twelve month revenue 3 Based on FY2014 results 4 June 30, 2015 Balance Sheet
~$271M Revenue² (30% Recurring³)
~$92M in Cash4; No Debt
~30,000 Customers
27% Worldwide Market Share¹
Drivers of Profitable Growth
4
Why is Non-Invasive Aesthetic Medicine Growing?
The doctor can take a patient from
To thisThis
WITH NO SURGERY, MINIMAL DOWN-TIMEAND A HIGH DEGREE OF PREDICTABILITYProcedure performed with Syneron’s Profound™ device
Photos: Macrene Alexiades, MD
5

Why is Non-Invasive Aesthetic Medicine Growing?
The doctor can take a patient from
To thisThis
WITH NO SURGERY, MINIMAL DOWN-TIMEAND A HIGH DEGREE OF PREDICTABILITYProcedure performed with Syneron’s UltraShape™ device
Photos: Wendy Tink, MD
6

0.0
4.0
8.0
12.0
6.0
10.0
2.0.901M .741M
1.76M
8.9M
1997 2014
Non- Invasive ProceduresInvasive Procedures
0.0
4.0
8.0
12.0
(Procedures in millions)
6.0
10.0
2.0
1997 2014
CAGR= 15.75%
Source: The American Society for Aesthetic Plastic Surgery 2015
Non-invasive procedures account for 83% and majority of growth
Strong Shift Toward Non-Invasive Procedures
(Procedures in millions)
CAGR= 4.02%
7

Superior Technology to AddressFat Destruction and Body Shaping
Market Opportunity
8

Potential Market for Body Shaping Procedures
¹ 2013 American Heart Association, Inc.
154.7M Americans over the age of 20 are overweight or obese(1)
KEY (Based on BMI(1)) | BMI of 30 or above is obese | BMI of 25-30 is overweight | BMI of 18.5-25 is normalweight | BMI of 18.5 or lower is underweight
Target Population
33.5%Obese
32.6%Overweight
33.8%Normal or Underweight
Total Potential US Patient Market Approximately 100M Patients
9

Potential Market for Fat Destruction Procedures
32.6%Overweight
33.8%Normal or Underweight
Total Addressable Market in the US: 19.5M Patients2
In a survey of 1,045 women in NA 1
56%indicated interest in non-invasive fat destruction
procedures
1 Syneron proprietary consumer research, 2012
22013 Census estimates the US population 20 years and older to be 233M; and that 34.9% of the adult population has personal income of $35,000 or above. 10

Women Are Interested in Treating Multiple Body Areas*
49% of woman are not satisfied with their back/bra fat
51% of women are not satisfied with
their thighs
58% of women are not satisfied with
their flanks
54% of women are not satisfied with their buttocks
72% of women are not satisfied with their stomach
A proprietary Syneron research study of 1045 women, aged 25 and above in NA concluded that:
Source: Syneron proprietary consumer survey 2012.*In the US, UltraShape is currently indicated for treatment of the abdomen. 11

Rapid Growth of Non-Invasive Body Shaping Procedures¹
(1) American Society of Aesthetic Plastic Surgery 2014
364
342
2013 2014
Liposuction(# of Procedures in Thousands, US)
95
135
2013 2014
Non-Invasive Fat Reduction(# of Procedures in Thousands, US)
Growth Rate-5.9%
Growth Rate42.6%

Physician Qualitative Research Reveals Importance ofPain-Free Advantage
• Research Takeaway• Pain Free represents advancement over existing technologies +
opportunity to tap into growth of body shaping category.
• Supporting Quotes• “Over 75% of patients come in to my office and immediately ask
“How much is it going to hurt?" "100% of patients ask about downtime."
• “Pain-free with no downtime, it’s effective and totally believable.”• “Pain-free permanent fat removal…BOTTOM LINE!”
13

Market Learnings• More than half of the women (56%) are interested in non-invasive fat destruction• A pain free procedure is the #1 consideration for patients• Almost three quarters (72%) of the women are unhappy with their abdomen and
want to remove fat from their stomach• Almost half of the doctors (44%) are looking to buy non-invasive body shaping
equipment
14
Syneron is ideally positioned to serve these patient and doctor market needs
What do women look for in a non-invasive fat destruction treatment?

Holistic Approach to Body Shaping Treatments: Fat Cell Destruction, Skin Tightening and Cellulite
Targeting connective tissue
Targeting and destroying fat
Broad Body Shaping Portfolio
15

UltraShape® Pulsed Focused Ultrasound (PFU)
Focused ultrasound energy Mechanical acoustic effects
breaks fat cell membranes Immediate and permanent fat
cell destruction Comfortable – No Pain Selective: Skin, vessels,
nerves and connective tissue remain unharmed
16

X 40X 40
UltraShape Technology, In-Vivo Porcine Model: Acute Micro EffectsBrown SA, Greenbaum L, Shtukmaster S, Zadok Y, Ben-Ezra S, Kushkuley L. Characterization of nonthermal focused ultrasound for noninvasive selective fat cell disruption (lysis): technical and preclinical assessment. Plast Reconstr Surg. 2009 Jul;124(1):92-101
Superior Technology for Non Invasive Fat DestructionImmediate Fat Cell Destruction!
Control Immediately post single tx
17

Intact Nerves
X100
Intact Blood Vessel
Fat Cell Destruction
Highly Selective!
UltraShape Technology, In-Vivo Porcine Model: Acute Micro EffectsBrown SA, Greenbaum L, Shtukmaster S, Zadok Y, Ben-Ezra S, Kushkuley L. Characterization of nonthermal focused ultrasound for noninvasive selective fat cell disruption (lysis): technical and preclinical assessment. Plast Reconstr Surg. 2009 Jul;124(1):92-101
Superior Technology for Non Invasive, Immediate Fat Destruction
18

Treated Area: AbdomenFat Layer Thickness: 4.9 cm
Treated Area: AbdomenFat Layer Thickness: 3.8 cm
Fat Thickness Reduction: 1.1 cm Circumference Reduction: 4.5 cm
Leal H. et al, Procedures in Cosmetic Dermatology (book); Focused Ultrasound for Fat Reduction: Ultralipotripsy. pp 107-121 (2010)
UltraShape MRI Measurement of Fat Thickness
Baseline Post 3 Tx
Superior Technology for Non Invasive, Immediate Fat DestructionExceptional Efficacy!
19

1Published in peer-reviewed journal 2Presented in scientific conference 3Data on file
13 published clinical studies with more than 900 subjects treated!
Investigator PublicationYear
Patient Population
Avg. Circumference Reduction Results
Teitelbaum S. et al1 US, UK, Japan 2007 164 2.0 cm (1 Tx) 82% > 0.5 cm circumference reduction
Leal H.2,3 Monterrey, Mexico 2009 24 3.0-3.4 cm (1 combo Tx) 96% > 1.5 cm circumference reduction 100% patient satisfaction
Moreno-Moraga J1 Madrid, Spain 2007 30 3.95 cm (3 tx) 100% measurable and visual improvement
Leal H.2,3 Monterrey, Mexico 2008 36 5.0 cm (3 tx) 100% measureable reduction 94% patient satisfaction
Ad El D.2,3 Beilinson Med, Israel 2008 26 3.96 cm (3 tx) 90% > 2.0 cm circumference reductionMulholland S.2 Toronto, Canada 2008 21 3.48 cm (3 tx) 86% patient satisfaction
Inglefield C.2 London, UK 2007 148 6.3 cm (3 tx) 93% patient satisfaction
de Almeida G.2 Sao Paulo, Brazil 2007 20 5.4 cm (3 tx) 100% measurable reduction 86% patient satisfaction
Benchetrit A.2 Montreal, Canada 2010 109 4.5 cm (3 tx) 96% measurable reduction 86% patient satisfaction
Niwa A. 1 São Paulo, Brazil. 2010 120 4.95 cm (3 tx) 92% measurable reduction94% reported comfortable treatment
Ascher B.1 Paris, France 2010 25 3.58 cm (3 tx) 90% reported no pain
S.-L. Chang1,2 Taiwan 2013 32 3.91 cm (3 tx) 21.4% and 25% reduction in fat thickness measured by MRI
Weiss, Coleman, Kenkel, Ad-El3 US, Israel 2013 32 3.34cm (3 tx) 100% reported very low pain levels
Superior Technology for Non Invasive, Immediate Fat Destruction
Average circumference reduction ranges from 3.3 to 6.3 cm (one to three pant size reduction)Average response rate ranged from 83% to 100%
20

UltraShape® Three Treatment Results
Reduction -4.7 cm upper, -5.4 cm lower abdomen
Weight change -2.2Kg
Pre-Treatment 4 Weeks Post Treatment
Upper/ Lower Abdomen
Courtesy of Dr. Arie Benchetrit, Montreal, Quebec
Reduction -5 cmWeight change -2.2Kg
Pre-Treatment 4 Weeks Post Treatment
2121

Courtesy of Dr. Wendy Tink, Vive Clinic – Calgary, Alberta
Reduction -14 cmsWeight change -3.2Kg
Pre-Treatment 2 Months Post Treatment
Reduction -10 cmsWeight change -3.2Kg
Pre-Treatment 2 weeks Post Treatment
22
UltraShape® Three Treatment Results
Flanks
22

Control Regular protocol
Immediate Fat Destruction
VDF Multi-Focus
In-vivo Porcine Model: Acute Macro Effects
More Fat Volume Destruction Per Pulse
New FDA cleared: 25% power increase and VDF protocol
23
U.S. Launch in Q2 2015

UltraShape Non-Invasive Fat Destruction
Tracking&GuidanceCamera
Tracking&GuidanceCamera
Tracking&GuidanceMonitor
Tracking&GuidanceMonitor
• Computer Guided treatment • Intuitive graphic guidance monitor • Fast learning curve• Treatment can be delegated to staff • Fast, full abdomen in less than 1 hour • Supports applicator and software
upgrades
24
• Effective - 1 to 3 pant size reductions • Comfortable – No pain, Excellent Safety
Record• Results seen as early as 2 weeks post
treatment • Flexible - Any shape and size of fat pocket
can be treated with the VDF and U-Sculpt applicators
• Quick - enables enhanced patient throughput – Less than 1 hour needed for full abdominal treatment
UltraShape Treatments
UltraShape System

High Margin Recurring Revenue Business Model
UltraShape GM Over 70%
Revenues from Capital Equipment
System List Price $109,000*
• Consumables will be sold in the form of Focal Treatment Zones (FTZ)
• Average abdominal treatment requires 10 FTZ’s
• Practice purchases FTZ’s based on patient volumes
• Cost of FTZs represents 25%-33% of treatment revenue charged by physician
Revenues from Consumables
FTZ List Price: $25
UltraShape Consumer Business Model
25* List price as of August 2015
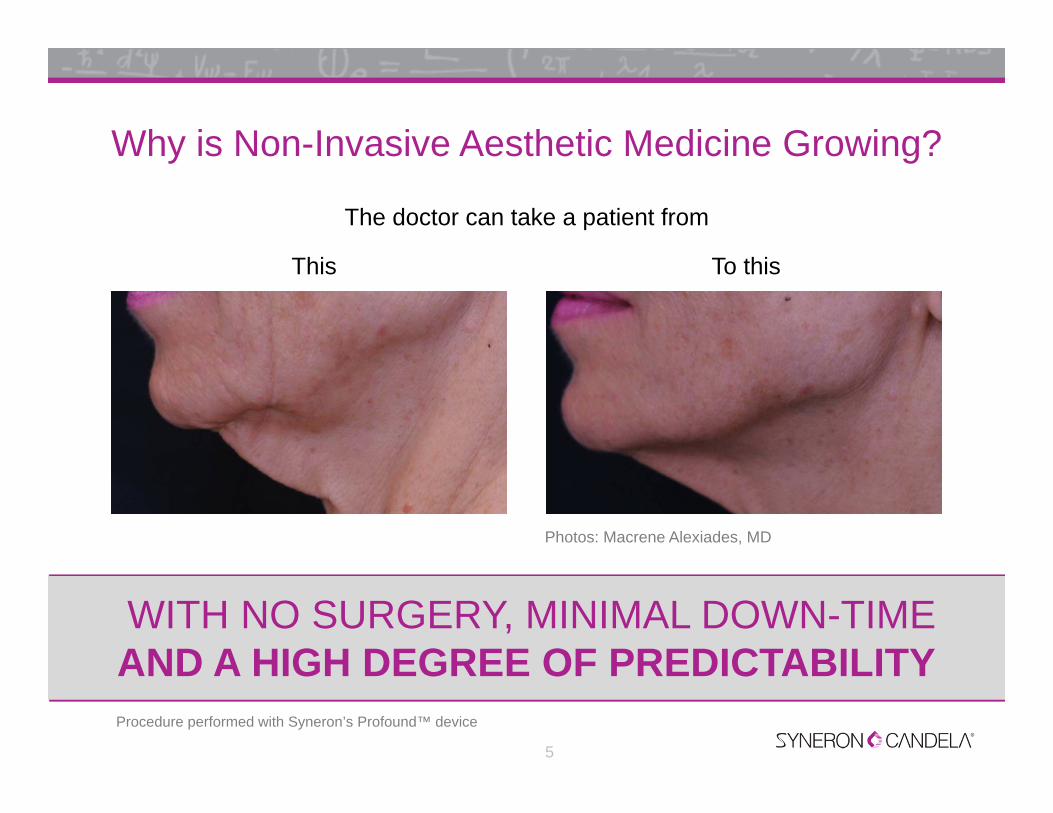
UltraShape® Practice Value Proposition• New technology provides clinic
differentiation – attracts new patients• Cross selling opportunities with other
offerings – attracts new patients• Practice Development Partner (PDP)
marketing and clinical support for practice
• Computer guided treatment - Easy to learn & use- High staff acceptance
• 10 new patients per month (20 treatments per month) =$220,000 - $250,000 in annual revenue
26

Ultrashape Launch – Marketing Campaign
Consumer Campaign• Collateral materials
• Digital campaign (banners, text)
• PDP program
• Marketing Incentive program
• Print campaign
• Consumer website
• PR campaign
• Digital campaign
• Search Engine Marketing
• Print campaign
Practice Campaign
Raise consumer awareness and Interest in Ultrashape as a breakthrough body shaping solution
Establish Ultrashape’s competitive edge to become the category leader
Support Ultrashape’s practices with consumer demand building tools via Co-op program
27
UltraShape Brand Ambassador Larisa Pippen

UltraShape® 2015 Target Customers
• Differentiate practice
• Painless; low side effect profile
• New marketing program
• Offer latest Immediate Fat Destruction technology
• Alternative for “pain-sensitive” patients
• Correcting unevenness from Lipo/other devices
• Can treat any size and shape of fat pocket
• Differentiate practice
• Complementary to VelaShape
• New marketing program
28

UltraShape®: A Game Changer for Syneron Candela
• 2015 year-to-date U.S. – 94 systems sold
• Planned 2015 revenue: $20M
• $65M-$100M in UltraShape revenues within 3 years
• Above 70% gross margin on UltraShape business
• 50% capital equipment and 50% recurrent revenues within 3 years
• Achieving a long term win-win partnership with our customers
• International re-launch in 2016, expanding recurring revenue business model
29

Holistic Approach to Body Shaping Treatments: Fat Cell Destruction, Skin Tightening and Cellulite
Targeting connective tissue
Targeting and destroying fat
Broad Body Shaping Portfolio
30

VelaShape III
• FDA cleared for the treatment of cellulite and circumferential reduction (abdomen and thighs)
• Increased RF Power by a factor of 2.5 to 150W
• Single treatment with an average abdominal circumferential reduction of 2.5cm and 100% patient responders
Cellulite, Skin Laxity, Circumferential Reduction
31

After
Treatment of Skin Laxity with VelaShape Technology
Photos: Regine Bousquet, MD
Before
32

0
0.8
1.8
2.6
0
0.5
1
1.5
2
2.5
3
3.5
Baseline 4 weeks 7 weeks 10 weeks
[cm
]
Mean abdomen circumference reduction
VelaShape III - Single Treatment Protocol42 patient trial
0%
36%
71%
100%
0%
36%
67%
100%
0%
27%
55%
80%
0%
20%
40%
60%
80%
100%
Baseline 4 weeks 7 weeks 10 weeks
[%]
1 cm 1.5 cm 2 cm
Average Abdominal Circumference Reduction % of Patients with CR of at least 1cm, 1.5cm and 2cm
33

Body Shaping as a Growth Driver - Leveraging Our Strengths
• Installed base of close to 15,000 systems in NA out of which 2,000 are body shaping systems
• Superior technology platforms
• Ability to offer comprehensive body shaping solutions for all major indications (Non-Invasive Fat Destruction, Skin Laxity, Cellulite, Circumference)
• Cross selling opportunities with other devices
34

Body Division
Creating Bifurcated Body Shaping Business Group (team of 50-60 reps by end of 2015)
Territory Managers For Capital Sales
• Initial Focus on Installations
• Expansion of installed base
• Ensure healthy pipeline
Practice Development Partners (PDP’s)
• Focus on educating practices
• Provide marketing support
• Drive utilization of Focal
Treatment Zones (FTZs)
• Targeting 2,000 VelaShape NA installed base and users of competitive systems• Potential for bundling with VelaShape
35

PicoWay Breakthrough Technology for Tattoo Removal and Treatment of Pigmented Lesions
36
Dual wavelength PicoWay - Shortest Picosecond Pulse, Highest Peak Power

Dual wavelength picosecond laser to treat tattoos of all types and colors, and pigmented lesions on any skin type
PicoWay – Shortest Picosecond Pulse, Highest Peak Power
• FDA Clearance in late Oct. 2014 for removal of tattoos of all colors; April 2015 for pigmented lesions
• Investing in sales & marketing to support launch• US potential market for tattoo removal procedures: $11.4B - $22.7B1
• Received CE Mark in July 2014 for removal of tattoos of all colors and pigmented lesions
• Received Korean regulatory clearance in July 2015
• $260K list price and 15-20% higher gross margin on top of current gross margin levels
• Growth driver with $7.3M in revenue in 1H 2015
Candela global installed base of ~1,400 dedicated tattoo removal & pigmented lesion lasers and >11,000 platforms that include pigmented lesion indications
¹ 2013 Census; 21% of adults in America have at least one tattoo; The Harris Poll, 2012 Harris Interactive; 14% of those with a tattoo regret their tattoo; The Harris Poll, 2012 Harris Interactive; Estimated average tattoo removal procedure fee is $400; 4-8 treatments required
37

• Treat widest range of tattoos & pigmented lesions 2 wavelengths + ultra-short 450 picosecond pulses enable treatment of more patients than single wavelength picosecond units
• Compared to other picosecond or Q-switched lasers PicoWay’s ultra-short pulses optimizes the photoacousticpressure on the target better than any device, shattering the ink with the least amount of heat transferred into the skin
• Pulse-on-demandLower cost of ownership than other picosecond laser systems which run continuously throughout the day
• Compact system Fast and easy to use
• Upgradability Additional applications and upgrades
PicoWay – Shortest Picosecond Pulse, Highest Peak Power
38

PicoWay Treatment Results
Tattoo Removal and Pigmented Lesion
39

Facial Aesthetics Treatments
Growing Demand for High-End Facial Treatments
** Syneron Candela proprietary online consumer survey 2015Assuming household income of >$50,000, US Census Bureau June 2014Assuming treatment price of $5,000

Comprehensive Solution for Most In-Demand Facial Concerns
* Syneron Candela proprietary online consumer survey 2015
Facial concerns for women over the age of 35*:

Profound ™ Facial Aesthetics Treatments
• Minimally invasive microneedle electrode array with unique real-time temperature controlled RF
• Creates dermal volume, naturally, to answer a big challenge physicians doing aesthetic treatments have: how to replace lost volume in aging skin
• One treatment. One hour. 100% response. 2.6 years younger skin• Long lasting and Predicatible results due to complete control over
temperature endpoints and duration of treatment
Recurring revenue model ($400 disposable tip) Dedicated U.S. sales force under the Aesthetics
Division
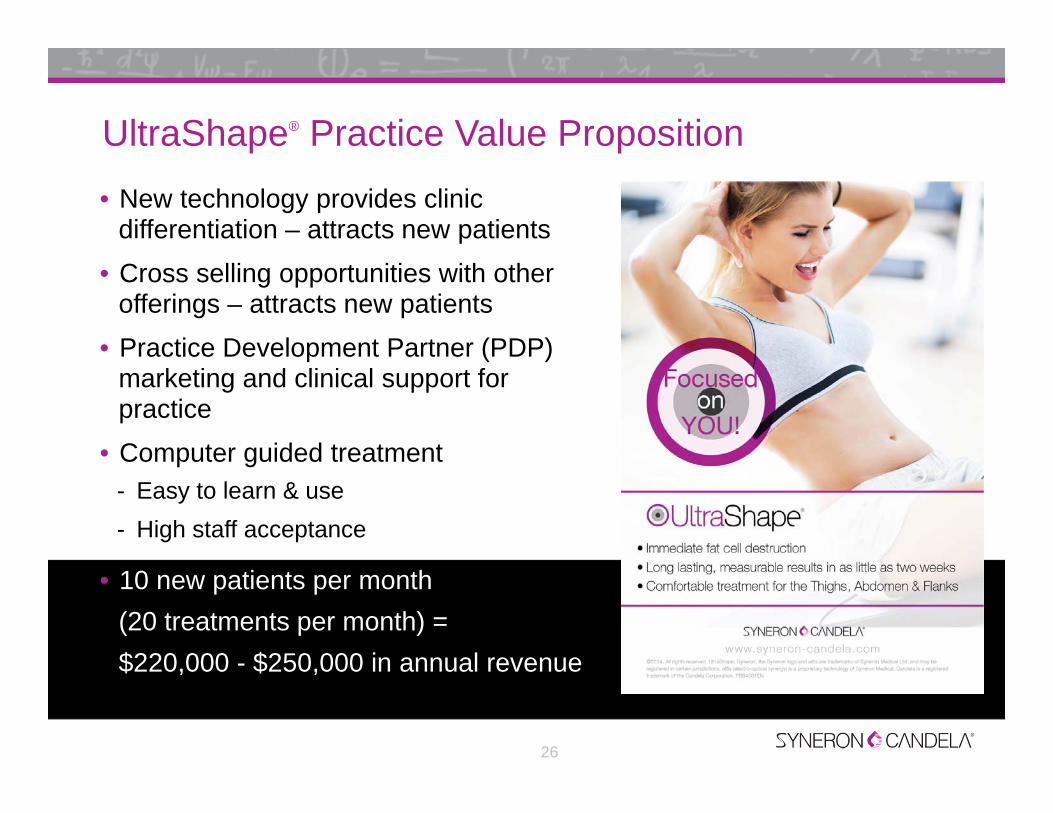
Clinically Proof: New Elastin, Collagen & Hyaluronic Acid
Histological studies confirm that Profound yields neoelastogenesis and neocollagenesis

Profound Results in a Single Treatment

Iluminage Beauty - Unilever Syneron Joint Venture
Structure Strategic Rationale• Build on investments in Syneron Beauty to
create focused home beauty device business with enhanced growth and profitability profile
• Unilever participation provides additional validation of Syneron Beauty and robust home-use beauty device market
• Eliminate impact of Syneron Beauty on consolidated financials and cash flow while retaining upside potential
• Allows Syneron Medical to focus on the significant opportunities in the professional business
• Improves core business margins and profitability
• Agreement closed December 8, 2013• Global joint venture with Unilever to include:
- Syneron Beauty- Iluminage (Unilever subsidiary)- $25 million Unilever investment
• Ownership: Unilever 60% / Syneron 40% (Based on: Unilever preferred shares, Syneron ordinary shares)
• Management / Board of Directors- Shimon Eckhouse – Chairman- Syneron 2 seats / Unilever 2 seats / 1
independent director/ Unilever entitled to add 2 directors
• Valuation based on the Fair Value of the JV, $20.8M as of July 2015
45
July 2015 – Iluminage Beauty sold teeth whitening technology to Colgate-Palmolive • Received ~$10 million dollars and a mid-single digit percent earn-out on product sales• Entered into a Supply Agreement with Colgate-Palmolive for the teeth whitening product

Addresses growing skin lightening market, especially in Asia
• Signed a distribution agreement in Korea
• Signed a distribution agreement in China – In discussion with large chains, commercial as of Q1 2015
• Japan – in discussions with strong local potential partners
Additional Potential Business Opportunities
elure™ opportunityStrengthens recurring revenue strategy; Entry into new markets
• Integration on track
• FDA clearance received October 31, 2014 for our OEM -30-Watt Holmium Laser for breaking of kidney stones andsoft tissue urological work
• Addressing the lucrative vein treatment market with highrecurring revenue component
• 6 dedicated sales reps in U.S. are on board
CoolTouch™ opportunity

Revenue Highlights for Q2 2015• Constant currency revenue growth of 19%
– Revenue negatively impacted by $3.1 million due to changes in foreign currency exchange rates
– Primarily devaluation of the Euro and Japanese Yen against the U.S. dollar
• Total revenue was $73.5 million, up 13.8% y/y
• Recurring revenue was $19.3 million, down (1.8%) y/y, sequentially up $1.5M
47
Total RevenuesRevenue ($M)
Reported Growth
Constant Currency Growth
North America 27.6 26% 26%International 45.9 8% 15%Total 73.5 14% 19%
NA Product 19.6 45% 32%EMEA Product 18.0 9% 14%APAC Product 15.4 16% 25%LATAM Product 1.2 (21%) (21%)Total Product Revenues 54.2 21% 25%
60
62
64
66
68
70
72
74
76
Q2 14 Q2 15
Y/Y Revenues ($M)
14% (19% cc)

Financial Highlights 5Q Trend (Non-GAAP)$ Thousands (except per margins)
48
(*) Y2014 year-over-year comparison to Y2013 is on a pro-forma basis, excluding Syneron Beauty from Y2013 results following its de-consolidation as of December 8, 2013
Q2 14 Q3 14 Q4 14 Q1 15 Q2 15 Y2013 Y2014
Revenues 64,618 60,257 74,062 63,399 73,507 232,129 255,750YOY change, % 6.1% 8.3% 23.7% 11.6% 13.8% (3.8%) 10.2%Cost Of Revenue 29,609 26,775 32,810 29,654 33,904 105,187 115,592Gross Profit 35,009 33,482 41,252 33,746 39,603 126,943 140,158
GM % 54.2% 55.6% 55.7% 53.2% 53.9% 54.7% 54.8%Total OPEX 31,851 30,858 36,050 32,631 36,663 115,170 127,283% OPEX 49.3% 51.2% 48.7% 51.5% 49.9% 49.6% 49.8%EBIT 3,158 2,624 5,202 1,115 2,940 11,773 12,875 Operating Margin 4.9% 4.4% 7.0% 1.8% 4.0% 5.1% 5.0%
Financial Income (expenses), net 228 (764) (316) (243) 409 221 (688)Pre Tax Income 3,386 1,860 4,886 872 3,349 11,994 12,187Taxes on Income (tax benefit) 900 920 1,696 262 900 -1,431 4,243Tax rate 27% 49% 35% 30% 27%Net Income 2,486 940 3,190 610 2,449 13,525 7,944
Avg Shares 37,237 37,228 37,128 37,328 37,283 36,254 37,160EPS ($) 0.07 0.03 0.09 0.02 0.07 0.37 0.21
ActAct

Q2 2015 HighlightsY/Y Revenues ($M)
64.673.514%
26%
8%
Product Revenue ($M)
45.054.2
25%
9%
45%
49
19% const curr
26% const curr
15% const curr
16% const curr
14% const curr
45% const curr
42.7 45.9
21.9 27.6
-
10.0
20.0
30.0
40.0
50.0
60.0
70.0
80.0
Q2 14 Q2 15
International North America
62%
38%
Revenue by Geography
International North America
13.5 19.6
16.6 18.1
13.4
15.4
-
10.0
20.0
30.0
40.0
50.0
60.0
Q2 14 Q2 15
Total NA Total EMEA Total APAC Total LATAM
74%
26%
Revenue Mix
Product Recurring

Select Financial (Non-GAAP) Items as of Q2 15*• Gross margin of 53.9% vs. 54.2% in Q2
2014• 1.7% negative impact from changes in
foreign currency exchange rates• Constant currency GM of 55.6%
• Operating margin of 4.0% vs. 4.9% in Q2 2014• Includes net negative impact of ~$1.5
million related to changes in foreign currency exchange rates
• Constant currency OM of 5.7%
• EPS of $0.07 vs. $0.07 in Q2 2014• Q2 2015 EPS would have been $0.09
excluding changes in foreign currency exchange rates
50
0.09 (cc)
55.6% (cc)
5.7% (cc)
54.2%
53.2%
53.9%
52.5%
53.0%
53.5%
54.0%
54.5%
Q2-2014 Q1-2015 Q2-2015
Gross Margin %
4.9%
1.8%
4.0%
0.0%
2.0%
4.0%
6.0%
Q2-2014 Q1-2015 Q2-2015
Operating Margin %
0.07
0.02
0.07
-
0.05
0.10
Q2-2014 Q1-2015 Q2-2015
EPS ($)
• Expecting to add $3-4M S&M in 2H15 vs 1H15
• Expecting OM 4.5% for the full year 2015, or 5.5%-6% in constant currency for 2015

Select Balance Sheet Items as of June 30, 2015
• $92.3 million in cash and cash equivalents at June 30, 2015
• Used $5.4 million in cash from operations in Q2 2015• Reflects investments in inventory to
support anticipated growth in 2015 and increased working capital related to the Company’s increasing volumes
• $20M share repurchase program:• Q2 2015 - repurchased 55,025 shares at
avg. price of $10.94 for $0.6 million • Since inception (Dec 2014), repurchased
431,677 shares at an avg. price of $11.1 for $5.0 million
• DSO of 76 vs. 81 days in Q2 2014
• Expecting to drive further improvements in DSO, which combined with more normalized inventory levels and spending, will put Company back on track to generate positive cash flow from operations
51
92.6 96.4 100.4 110.4
99.9 92.3
-
20.0
40.0
60.0
80.0
100.0
120.0
Q1 14 Q2 14 Q3 14 Q4 14 Q1 15 Q2 15
Cash Position ($M)
(6.5)(4.0) (4.9)
3.7 4.9
13.3
(5.8) (5.5) (10.0)
(5.0)
-
5.0
10.0
15.0
Q3 13 Q4 13 Q1 14 Q2 14 Q3 14 Q4 14 Q1 15 Q2 15
Cash Flow from Operations ($M)

2014 Highlights*
52
152.5 163.9
79.691.8
0.0
50.0
100.0
150.0
200.0
250.0
300.0
2013 2014
International North America
*The full year 2014 year-over-year comparisons to the full year 2013 are on a pro-forma basis, excluding Syneron Beauty from the full year 2013 results following its de-consolidation as of December 8, 2013
Y/Y Revenues ($M)
232.1255.810.2%
15.3%
7.4%
-23
-10
17
-30
-20
-10
0
10
20
30
2013 2013 (ex-SyneronBeauty)
2014
Cash Flow from Operations ($M)
53.0% 54.7% 54.8%
2.1%5.1% 5.0%
0.19
0.37
0.21
$0.00$0.05$0.10$0.15$0.20$0.25$0.30$0.35$0.40$0.45$0.50
0.0%
10.0%
20.0%
30.0%
40.0%
50.0%
60.0%
2013 2013 (ex-SyneronBeauty)
2014
Gross Margin % Operating Margin % EPS ($)
^0.28
^ 2013 EPS would have been $0.28 excluding one-time tax settlement
108.5110.4
100
105
110
115
2013 2014
Cash Position ($M)

Thank you!