
Synergistic Interactions in Multispecies Biofilms Ren.pdf · · 2014-07-18Submitted to The ISME...
126
FACULTY OF SCIENCE UNIVERSITY OF COPENHAGEN Academic advisor: Søren Johannes Sørensen & Mette Burmølle Submitted: 07/02/2014 PhD thesis Dawei Ren Synergistic Interactions in Multispecies Biofilms
Transcript of Synergistic Interactions in Multispecies Biofilms Ren.pdf · · 2014-07-18Submitted to The ISME...

F A C U L T Y O F S C I E N C E
U N I V E R S I T Y O F C O P E N H A G E N
Academic advisor: Søren Johannes Sørensen & Mette Burmølle
Submitted: 07/02/2014
PhD thesis
Dawei Ren
Synergistic Interactions in Multispecies Biofilms

1
2
Synergistic Interactions in Multispecies Biofilms
Ph.D. Thesis
Dawei Ren
Supervisors:
Professor: Søren Johannes Sørensen
Associate professor: Mette Burmølle
Section for Microbiology, Department of Biology
Faculty of Science
University of Copenhagen
Denmark
February, 2014
This thesis has been submitted to the PhD School of The Faculty of Science,
University of Copenhagen

3
Cover picture
Illustration of interspecific interactions in multispecies biofilms (Burmølle et al., 2013).
Top left: co-metabolism or niche generation
Bottom left: coaggregation
Top right: horizontal gene transfer (HGT; conjugation)
Bottom right: quorum sensing (QS)
Burmølle M, Ren D, Bjarnsholt T, Sørensen SJ (2013) Interactions in multispecies biofilms: do they actually
matter? Trends in microbiology. doi: 10.1016/j.tim.2013.12.004
4
Preface
This thesis embraces all the efforts that I have put into exploring synergistic interactions in
multispecies biofilms during the last three years as a PhD student in Molecular Microbial Ecology
(MME) group, Department of Biology, University of Copenhagen. This study was funded by
Danish Council for Independent Research and China Scholarship Council.
First and foremost, I would like to express my deepest appreciation to my supervisors Prof. Søren J.
Sørensen and Associate Prof. Mette Burmølle. They always give me invaluable guidance, priceless
advice and generous support. Thank you, Søren, for your optimism to create a highly motivated
group, for your humor to make us feel relaxed and passionate in work and for your encouragement
to boost my confidence in the face of difficulties. Thank you, Mette, for your patience when guiding
my work, for your thoughtfulness when making an outline for my clear understanding and for your
concern when helping me arrange journey and accommodation in Britain. I also wish to thank Karin
Vestberg. She is the most professional, hardworking and helpful technician I have ever met. Her
white hair, affable smile and enthusiasm have left a deep impression on me. Thank you, Karin, for
your promptness in helping me to find the protocols and reagents for the experiment, for your
carefulness in assisting me to use the new instruments and for your kindness in correcting the
occasional improprieties in my lab work.
I am especially grateful for the biofilm group members, including Jonas Madsen, Henriette Røder,
Lea Hansen, Jakob Herschend, Wenzheng Liu and Jakob Russel. Thank you, Jonas, for your
constructive comments on my manuscripts. Thank you, Lea, for your excellent work on
transcriptomic analysis. Thanks to all of you for your active contribution in the biofilm group
meeting that truly inspired me in work. I also want to give thanks sincerely to, Lasse Bergmark, for
your great help in primers design and quantitative PCR work; Waleed Abu Al-Soud and Lars
Behrendt, for your valuable suggestions in RNA extraction from biofilms; Sten Struwe and
Annelise Kjøller, for your incredible kindness to Chinese students that have warmed my heart so
much! Dr Jeremy S. Webb, Dr Robert P. Howlin and Caroline Duignan are appreciated for giving
me the opportunity to have a wonderful experience in Southampton, Britain. I would like to
especially mention Caroline Duignan for her generosity in donating time and sharing resource to
guide me in the lab and take care of my life. Her genuine friendship is a precious gift to me!
A big thank you to all the other MME group members: Lars Hansen, Bo Jensen, Anders Prieme,
Tim Evison, Leise Riber, Stefan, Anette, Gisle, Martin Hansen, Zhuofei, Trine, Samuel, Witold,
Tue, Jonas Stenbæk, Luo, Martin Mortensen, Peter, Tom, Claudia, Michael, Ines and the members
who have left: Barbara, Luisa, Shanshan, Lili and Analia. You are so lovely, amazing and make my
life in Denmark so enjoyable. Special thanks to all my Chinese friends, especially to Lili for her
care throughout my first few months in Denmark, to Shanshan and Luo for being my listeners and
sharing the joy and pain in my life here.
Finally, I would like to extend my sincerest thanks to my parents. Without your unconditional
support and love, these past three years have been impossible. As my best friends, you always
timely enlighten me in spite of thousands of miles between us. This thesis is also dedicated to my

5
dear grandfather who passed away when I struggled with my work here. Your instruction and
encouragement will never be forgotten.
I appreciate the past three years spent in this beautiful country, full of laughter and tears and this
will be precious treasure in my future life and engraved in my memory forever.
Dawei Ren
January 2014 in Copenhagen

6
Publications list
1. Ren D, Madsen JS, de la Cruz-Perera CI, Bergmark L, Sørensen SJ, Burmølle M (2013)
High-Throughput Screening of Multispecies Biofilm Formation and Quantitative PCR-
Based Assessment of Individual Species Proportions, Useful for Exploring Interspecific
Bacterial Interactions. Microbial ecology. doi: 10.1007/s00248-013-0315-z Manuscript 1
2. Ren D, Madsen JS, Sørensen SJ, Burmølle M (2013) High prevalence of biofilm synergy
among bacterial soil isolates in co-cultures indicates bacterial interspecific cooperation.
Submitted to The ISME journal. Manuscript 2
3. Hansen LBS+, Ren D
+, Sørensen SJ, Burmølle M (2014) Metatranscriptome analysis of
multispecies biofilms indicates strain- and community- dependent changes in gene
expression. In preparation. Manuscript 3
+Shared first authorship
4. Ren D, Ekelund F, Sørensen SJ, Burmølle M (2013) Effects of grazing by flagellate
Neocercomonas jutlandica on mono- and multi-species biofilms. In preparation.
Manuscript 4
5. de la Cruz-Perera CI, Ren D, Blanchet M, Dendooven L, Marsch R, Sørensen SJ, Burmølle
M (2013) The ability of soil bacteria to receive the conjugative IncP1 plasmid, pKJK10, is
different in a mixed community compared to single strains. FEMS Microbiol Lett
338(1):95–100. Manuscript 5
6. Burmølle M, Ren D, Bjarnsholt T, Sørensen SJ (2013) Interactions in multispecies biofilms:
do they actually matter? Trends in microbiology. doi: 10.1016/j.tim.2013.12.004
7
English summary
The coexistence of hugely diverse microbes in most environments highlights the intricate
interactions in microbial communities, which are central to their properties, such as productivity,
stability and the resilience to disturbance. Biofilm, in environmental habitats, is such a spatially
structured aggregation consisting of multiple species of bacteria whose function relies on a complex
web of cooperative and/or competitive interactions between community members, indicating that
research in “whole-entity” should not be based on the assembled results from “mono pieces”. As
one of the best multispecies biofilm models, oral microbial community, also known as “dental
plaque” is thoroughly investigated as a focal point to describe the interspecies interactions [1].
However, owing to the lack of a reliable high throughput and quantitative approach for exploring
the interplay between multiple bacterial species, the study to elucidate the impact of interaction
networks on the multispecies biofilms in natural ecosystems, especially in soil, is still at an early
stage. The diverse patterns of interactions within the mixed communities as well as the predator-
prey relationship between protozoa and biofilm are summarized in Sections 1, 2 and 3 of this thesis,
where the state-of-the-art techniques developed to exploit such interactions, including precisely
quantifying the numbers of individual species by quantitative PCR (qPCR) and monitoring gene
expression changes during interactions by transcriptomic analysis are also presented.
Due to the poor reproducibility of most biofilm quantification assays, the first part of my work is to
develop a rapid, reproducible and sensitive approach for quantitative screening of biofilm formation
by bacteria when cultivated as mono- and multispecies biofilms, followed by species specific qPCR
based on SYBR Green I fluorescence to measure the relative proportion of individual species in
mixed-species biofilms. The reported approach was described in Manuscript 1 which can be used
as a standard procedure for evaluating interspecies interactions in defined microbial communities.
By use of this valuable tool, a more than 3-fold increase in biofilm formation and dominance of
Xanthomonas retroflexus and Paenibacillus amylolyticus over the other two species
Stenotrophomonas rhizophila and Microbacterium oxydans were demonstrated, indicating the
strong synergistic interactions in this four-species biofilm model community.
Manuscript 2 presents the further application of this developed approach on evaluating the
synergistic/antagonistic interactions in multispecies biofilms composed of seven soil isolates. 63%
of the four-species biofilms were found to interact synergistically, indicating a prevalence of
synergistic interaction in biofilm formation among these strains. Hereafter, the population dynamics
in a multispecies biofilm composed of Stenotrophomonas rhizophila, Xanthomonas retroflexus,
Microbacterium oxydans and Paenibacillus amylolyticus, was assessed using qPCRs with species
specific primers. Despite of the high prevalence of X. retroflexus (> 97% of total biofilm cell
number), the presence of the three other strains was indispensable for the strong synergism that
occurs in this mixed-species biofilm. The dramatically increased cell numbers of each strain at 24 h
proved all the individual strains gained benefits in the multispecies biofilms compared with in
monospecies biofilms, that is, they would rather cooperate than compete with each other.
8
The significant synergistic interaction observed in the biofilm consisting of four soil bacteria make
this consortium a powerful model to study development and interactions in multispecies biofilms.
In Manuscript 3, the gene expression profile of Xanthomonas retroflexus in a single-species
biofilm was compared to its expression profiles in dual-species biofilms with Stenotrophomonas
rhizophila, Microbacterium oxydans or Paenibacillus amylolyticus as well as in a four-species
biofilm. The strongest change in expression profile was observed in the dual-species biofilms of X.
retroflexus and P. amylolyticus, while a distinct expression pattern (non-linear response) was
detected in the four-species biofilm, indicating the significant effect of interspecies interactions on
gene expression. This is consistent with the results presented in manuscript 2 where each species
was demonstrated to be indispensable for the synergistic interactions in the biofilm formation. 70
genes were found differentially expressed when co-culturing X. retroflexus with other species,
which include genes involved in membrane bound efflux system and MazE/MazF toxin-antitoxin
system, suggesting the enhanced resistance of multispecies biofilms.
Despite of the widespread existence of biofilms and protozoa in nature, the predator-prey relation
between biofilms and protozoa is still poorly studied. Moreover, this relationship could be affected
by interspecies interactions within multispecies biofilms. The study presented by Manuscript 4 was
to test whether these interactions in the developed multispecies biofilm model are involved in the
defense mechanism of bacterial biofilms against protozoan grazing. The presence of the flagellate
Neocercomonas jutlandica was shown to increase or reduce the bacterial abundance in biofilms,
depending on the co-cultured bacterial prey, which suggests the grazing ability is closely related
with the predator-prey interactions, whereas, the synergistic interactions in the multispecies biofilm
model did not confer more protection against predation compared with single-species X. retroflexus
biofilm. The same ratio of cell numbers between three species regardless of protozoan grazing
suggests they were spatially arranged in integrated communities in multispecies biofilm. However,
these conclusions are based on the assumption that this flagellate predator prefers surface attached
cells which needs to be confirmed by further studies.
Horizontal gene transfer by conjugation occurs more efficiently in biofilms. The connection
between plasmid host range and composition of the recipient community was investigated in
Manuscript 5 by comparing plasmid permissiveness in single populations and in a microbial
community composed of 15 soil strains. By use of flow cytometry (FCM) and 16S rRNA gene
sequencing, the IncP1 plasmid, pKJK10, was found only to transfer from Pseudomonas putida to
Stenotrophomonas rhizophila in a diparental mating. However, when hosted by Escherichia coli,
transfer of this plasmid occurred only in the mixed community, with Ochrobactrum rhizosphaerae
as the dominating plasmid recipient. This study demonstrates that the plasmid host range can be
greatly affected by the surrounding bacterial community. This needs to be taken into account as
many antibiotic resistance and virulence determinants are plasmid-encoded, which can spread
further and raise antibiotic-resistant bacteria in soil.
9
Dansk resumé
I de meget diverse mikrobielle samfund i naturen er der nogle yderst komplekse interaktioner, som
er meget centrale med hensyn til både produktivitet, stabilitet og modstandsdygtighed overfor
forandringer i miljøet. Biofilm i naturlige habitater er en rumlig samling af bakterier bestående af
flere arter, hvis funktion er afhængig af et indviklet net af kooperative og / eller
konkurrencemæssige relationer mellem dem, hvilket indikerer, at forskning i en biofilm ikke bør
være baseret på resultater fra enkelt bakterier. Som en af de bedste biofilm modeller med flere arter
er det orale mikrobielle samfund, også kendt som " plak ," der er grundigt undersøgt med fokus på
at beskrive interspecies interaktioner. Men manglen på nyere forskning med kvantitativ tilgang til at
udforske samspillet mellem flere bakteriearter for at belyse konsekvenserne af interaktionen på
mange arts biofilm i naturlige økosystemer, især i jord, gør at forskningen stadig er på et tidligt
stadium. Forskellige mønstre af interaktioner i de blandede samfund såvel som predator-prey
forhold mellem protozoer og biofilm er sammenfattet i afsnit 1, 2 og 3 i denne afhandling, hvor
state-of- the- art teknikker udviklet til at udnytte sådanne interaktioner, herunder præcist at
kvantificere antallet af enkelte arter ved kvantitativ PCR (qPCR) og overvågning af genekspression
ændringer i interaktioner med transkriptomic analysis, også er præsenteret.
På grund af den ringe reproducerbarhed af de fleste biofilm kvantificerings analyser er den første
del af mit arbejde gået ud på at udvikle en hurtig, reproducerbar og følsom metode til kvantitativ
screening af biofilm dannelse af bakterier, når de dyrkes som mono-og flere arts biofilm, efterfulgt
af artsspecifikke qPCR baseret på SYBR Green I fluorescens til at måle den relative andel af de
enkelte arter i blandede arts biofilm. Resultaterne er beskrevet i Manuscript 1, og kan bruges som
standard procedure for evaluering af interspecies interaktioner i definerede mikrobielle samfund.
Ved brug af dette værdifulde værktøj, blev der påvist en mere end 3-fold stigning i biofilm dannelse
og dominans af Xanthomonas retroflexus og Paenibacillus amylolyticus over de to andre arter
Stenotrophomonas rhizophila og Microbacterium oxydans, med angivelse af de stærke
synergistiske interaktioner i dette fire-arts biofilm model samfund.
Manuskript 2 præsenterer den videre anvendelse af den ovenfor beskrevne metode til at evaluere de
synergistiske / antagonistiske interaktioner i flere arts biofilm bestående af syv jord isolater. 63% af
de fire arts biofilm interagerede synergistisk , hvilket indikerer en prævalens for synergistisk
interaktion i biofilmdannelse blandt disse stammer . Populationsdynamik i en flere arts biofilm
bestående af Stenotrophomonas rhizophila, Xanthomonas retroflexus , Microbacterium oxydans og
Paenibacillus amylolyticus blev estimeret ved hjælp qPCR med artsspecifikke primere. På trods af
den høje forekomst af X. retroflexus (> 97% af det samlede antal biofilm bakterier) , var
tilstedeværelsen af de tre andre stammer essentiel for den kraftige synergi, der opstår i denne
blandede arts biofilm . De dramatisk øgede celletal for hver stamme efter 24 timer viste, at alle de
individuelle stammer opnåede fordele i flere arts biofilm sammenlignet med i monospecies biofilm,
det vil sige at de hellere ville samarbejde end konkurrere med hinanden .
Den signifikante synergistiske interaktion, der blev observeret i en biofilm bestående af fire
jordbakterier gør dette konsortium til en vigtig model til at studere udviklingen og interaktioner i
10
flere arts biofilm. I Manuscript 3 blev genekspression profilen for Xanthomonas retroflexus i en
enkelt arts biofilm sammenlignet med dens ekspressions profil i dual- arts biofilm med
Stenotrophomonas rhizophila , Microbacterium oxydans eller Paenibacillus amylolyticus såvel som
i en fire- arts biofilm . Den største ændring i ekspressions profilen blev observeret i dual- arts
biofilm med X. retroflexus og P. amylolyticus , mens et klart ekspressionsmønster ( ikke-lineær
respons) blev detekteret i fire arts biofilm , hvilket indikerer en signifikant effekt af interspecies
interaktioner på genekspression . Dette er i overensstemmelse med de resultater, der præsenteres i
manuskript 2, hvor hver art viste sig at være essentiel for de synergistiske interaktioner i
biofilmdannelse. Der blev fundet 70 gener, som blev udtrykt når X. retroflexus blev dyrket med
andre arter, der omfatter gener involveret i et membranbundet efflukssystem og i Maze / MazF
toksin - antitoxin systemet, hvilket tyder på forbedret resistens i flere arts biofilm .
På trods af den udbredte forekomst af biofilm og protozoer i naturen er predator-.prey relationen
mellem biofilm og protozoer stadig dårligt undersøgt. Endvidere kan dette forhold blive påvirket af
interspecies interaktioner indenfor flere arts biofilm. Undersøgelsen præsenteret i Manuscript 4 var
at teste, om disse interaktioner i den udviklede flere arts biofilm model er involveret i en
forsvarsmekanisme hos den bakterielle biofilm mod protozo græsning. Tilstedeværelsen af
flagellaten Neocercomonas jutlandica viste sig at øge eller reducere den bakterielle forekomst i
biofilm, afhængig af bakterien, hvilket tyder på, at græsningsevnen er nært beslægtet med predator-
prey interaktioner; de synergiske interaktioner i flere arts biofilm giver ikke mere beskyttelse mod
prædation end enkelt - arts X. retroflexus biofilm. Det samme forhold af antal celler mellem de tre
arter uanset protozo græsning antyder, at de var rumligt placeret i et integreret samfund i flere arts
biofilm. Men disse konklusioner er baseret på den antagelse, at den benyttede flagellat foretrækker
overflade vedhæftede celler; dette forhold skal bekræftes af yderligere undersøgelser.
Horisontal genoverførsel ved konjugering forekommer mere effektivt i biofilm. Forbindelsen
mellem plasmid host range og sammensætningen af recipient samfundet blev undersøgt i
Manuscript 5 ved at sammenligne plasmid tolerance i populationer af en enkelt art og i et mikrobielt
samfund bestående af 15 jord-stammer. Ved brug af flowcytometri (FCM) og 16S rRNA-gen
sekventering, blev IncP1 plasmidet pKJK10 kun vist at blive overført fra Pseudomonas putida til
Stenotrophomonas rhizophila i en diparental mating. Når Escherichia coli var vært skete overførsel
af dette plasmid kun i det blandede samfund, med Ochrobactrum rhizosphaerae som dominerende
plasmid recipient. Denne undersøgelse viser, at plasmidets værtsspektrum kan blive kraftigt
påvirket af den omgivende bakterielle samfund. Dette skal der tages hensyn til, da mange
antibiotikaresistens og virulensdeterminanter er plasmidkodede, og kan sprede sig yderligere og øge
antibiotikaresistente bakterier i jord.

11

12
Table of Contents
1 Interactions in multispecies biofilms .......................................................................................... 14
1.1 Biofilm................................................................................................................................. 14
1.2 Multispecies biofilms in soil ............................................................................................... 14
1.3 Interactions in multispecies biofilms ................................................................................... 16
1.3.1 Coaggregation, cross-species protection and co-metabolism ...................................... 17
1.3.2 Chemical signaling systems ......................................................................................... 18
1.3.3 Lateral gene transfer ..................................................................................................... 20
1.3.4 Synergism or antagonism/Cooperation or competition ............................................... 20
2 How to study multispecies biofilms? .......................................................................................... 24
2.1 In vitro biofilm models ........................................................................................................ 24
2.2 Quantitative PCR ................................................................................................................. 25
2.3 Transcriptomics ................................................................................................................... 27
3 Biofilms and protozoa ................................................................................................................. 31
3.1 Protozoa ............................................................................................................................... 31
3.2 Biofilms- the response of cell consortia to protozoan grazing ............................................ 31
3.3 Protozoa and biofilms- reservoirs of pathogenic bacteria ................................................... 34
4 Where are we going with biofilms? - In the context of microbial ecology ................................ 35
5 References .................................................................................................................................. 38
6 Manuscripts ................................................................................................................................. 50
Manuscript 1
Manuscript 2
Manuscript 3
Manuscript 4
Manuscript 5

13
14
1 Interactions in multispecies biofilms
1.1 Biofilm Already in the late 1600s, van Leeuwenhoek had observed biofilm in the plaque on his own teeth.
The first appearance of “biofilm” theory can be traced to 1987 when Costerton et al. described
biofilm as adherent population consisting of single cells and microcolonies of sister cells all
embedded in a highly hydrated, predominantly anionic matrix of bacterial exopolymers and trapped
extraneous macromolecules [2]. Over the course of the past 25 years, this concept has evolved to
include not only the irreversible cell attachment but also physiological attributes including altered
growth rate and gene transcription [3].
Biofilms, prevalent on the most inert or living surfaces [4], are the dominant communities on planet
earth. It is estimated that 99% of bacteria in nature exist in biofilms, while biofilms account for
more than 65% of hospital infections [5, 6]. And the same kind of bacteria are known to show
profoundly different characteristics when they are in a biofilm compared with in planktonic cultures.
The high resistance to harsh conditions, including pollutants [7] , desiccation [8], protozoan grazing
[9], antimicrobial agents [10] in nature and host defenses [11] in chronic infections, is some/one of
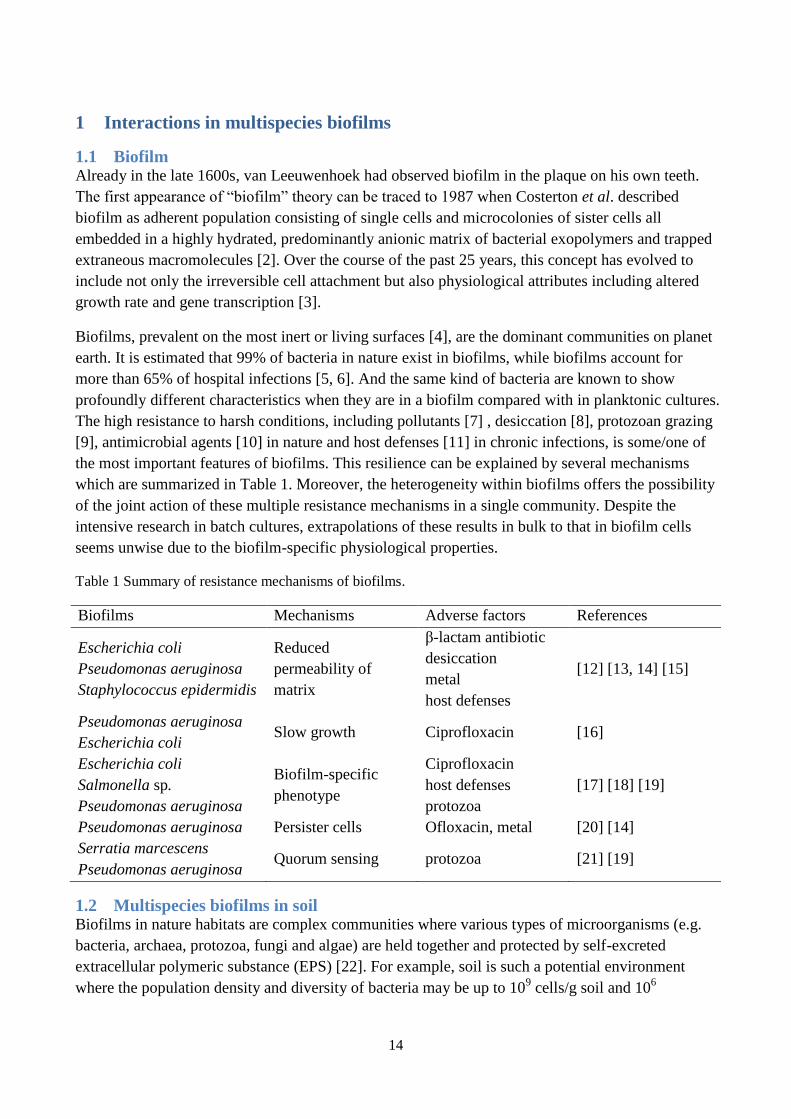
the most important features of biofilms. This resilience can be explained by several mechanisms
which are summarized in Table 1. Moreover, the heterogeneity within biofilms offers the possibility
of the joint action of these multiple resistance mechanisms in a single community. Despite the
intensive research in batch cultures, extrapolations of these results in bulk to that in biofilm cells
seems unwise due to the biofilm-specific physiological properties.
Table 1 Summary of resistance mechanisms of biofilms.
Biofilms Mechanisms Adverse factors References
Escherichia coli
Pseudomonas aeruginosa
Staphylococcus epidermidis
Reduced
permeability of
matrix
β-lactam antibiotic
desiccation
metal
host defenses
[12] [13, 14] [15]
Pseudomonas aeruginosa
Escherichia coli Slow growth Ciprofloxacin [16]
Escherichia coli
Salmonella sp.
Pseudomonas aeruginosa
Biofilm-specific
phenotype
Ciprofloxacin
host defenses
protozoa
[17] [18] [19]
Pseudomonas aeruginosa Persister cells Ofloxacin, metal [20] [14]
Serratia marcescens
Pseudomonas aeruginosa Quorum sensing protozoa [21] [19]
1.2 Multispecies biofilms in soil Biofilms in nature habitats are complex communities where various types of microorganisms (e.g.
bacteria, archaea, protozoa, fungi and algae) are held together and protected by self-excreted
extracellular polymeric substance (EPS) [22]. For example, soil is such a potential environment
where the population density and diversity of bacteria may be up to 109 cells/g soil and 10
6

15
species/g soil, respectively [23, 24]. Because of the spatial variability in nutrient concentration,
microbial cells are not uniformly distributed through the soil [25]. Bacteria living close to the
nutrient sources i.e., plant roots or decaying organic matter, are prone to attach various available
surfaces (e.g. roots, litter or soil particles) and develop into multispecies biofilms.
By organizing into a biofilm community, bacteria could gain highly resilience to adverse soil
conditions. Water is by far the largest component of the biofilm matrix which can account up to
97%, whereas the remaining are 2-5% microbial cells, 3-6% EPS (polysaccharides, proteins, nucleic
acids and lipids) and ions [26]. The highly hydrated matrix could therefore buffer the biofilm cells
against desiccation stress which is an important challenge met by soil bacteria. Chang et al.
provided the direct evidence that alginate production by Pseudomonas putida contributed to a
hydrated microenvironment which protected residents from water-limiting stresses [27]. Moreover,
biofilm has a great capacity for heavy metal biosorption and toxic compound degradation which has
a significant impact on bioremediation [28, 29]. Additionally, the widespread exposure to
antibiotics makes biofilm formation more favorable in soil. The results from Walker et al. suggested
that upon root colonization, Pseudomonas aeruginosa gained resistance against root-secreted
antibiotics by forming a biofilm [30]. Apart from these advantages, biofilms can also function as
protective barriers against protozoan grazing which is a major mortality factor faced by bacteria in
the soil environment [31]. Section 3 (Biofilms and protozoa) will be devoted to a coherent
introduction of the relationship between biofilms and protozoa.
These improved biofilm-associated fitnesses mentioned above suggest that the preferred mode of
bacterial growth is in a biofilm. By being encased in the recalcitrant matrix, the bacteria grow in a
relatively stable environment called microbial homeostasis [32], reflected not by the characteristics
of resident individuals but by the balance imposed by the numerous microbial interactions,
including examples of quorum sensing (QS) and horizontal gene transfer (HGT). By means of
quorum sensing, the sessile cells in the biofilms can “talk” to each other. Due to the increased
population density and constrained diffusion, the quorum sensing molecules are concentrated. Once
reaching a threshold level, these quorum sensing molecules modulate the transcription of certain
genes and trigger phenotypic changes, including swarming motility, biofilm formation and the
production of virulence factors [33-35]. This issue will be elaborated further in the next part of
Section 1.The dramatically increased horizontal transfer of plasmid-borne antibiotic resistance
determinants was observed by Savage et al. in the Staphylococcus aureus biofilm [36]. Since many
antibiotic resistance determinants are plasmid-encoded, this further spread of antibiotic resistance
genes among bacteria allows us to conclude that soil represents a reservoir of antibiotic resistance
genes [37] which probably increases the current arsenal of antibiotic resistance mechanisms in
pathogens when gene transfer occurring from soil bacteria to pathogenic bacteria. This was
confirmed by Forsberg et al. [38] with the finding that multidrug-resistant soil bacteria, containing
resistance cassettes against five classes of antibiotics, have perfect nucleotide identity to genes from
diverse human pathogens. Therefore, the enhanced efficiency of gene transfer in biofilms has a
profound impact on the pathogenesis, persistence and hence the treatment of human disease.
16
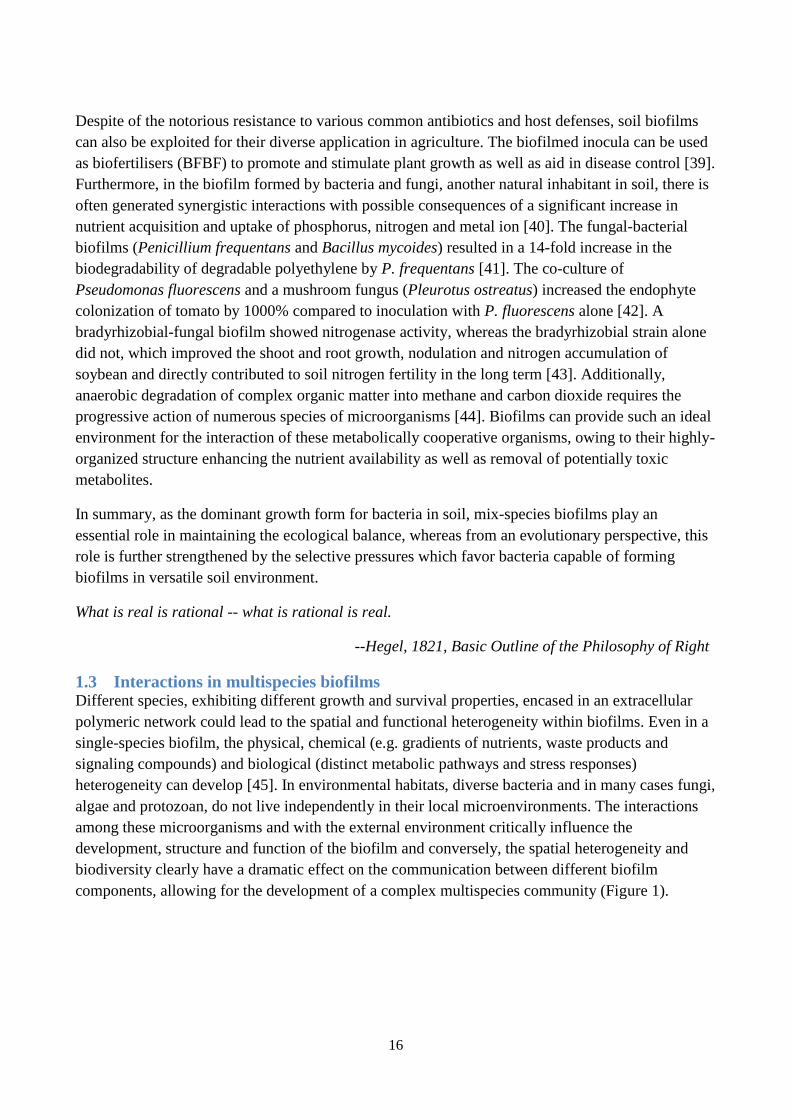
Despite of the notorious resistance to various common antibiotics and host defenses, soil biofilms
can also be exploited for their diverse application in agriculture. The biofilmed inocula can be used
as biofertilisers (BFBF) to promote and stimulate plant growth as well as aid in disease control [39].
Furthermore, in the biofilm formed by bacteria and fungi, another natural inhabitant in soil, there is
often generated synergistic interactions with possible consequences of a significant increase in
nutrient acquisition and uptake of phosphorus, nitrogen and metal ion [40]. The fungal-bacterial
biofilms (Penicillium frequentans and Bacillus mycoides) resulted in a 14-fold increase in the
biodegradability of degradable polyethylene by P. frequentans [41]. The co-culture of
Pseudomonas fluorescens and a mushroom fungus (Pleurotus ostreatus) increased the endophyte
colonization of tomato by 1000% compared to inoculation with P. fluorescens alone [42]. A
bradyrhizobial-fungal biofilm showed nitrogenase activity, whereas the bradyrhizobial strain alone
did not, which improved the shoot and root growth, nodulation and nitrogen accumulation of
soybean and directly contributed to soil nitrogen fertility in the long term [43]. Additionally,
anaerobic degradation of complex organic matter into methane and carbon dioxide requires the
progressive action of numerous species of microorganisms [44]. Biofilms can provide such an ideal
environment for the interaction of these metabolically cooperative organisms, owing to their highly-
organized structure enhancing the nutrient availability as well as removal of potentially toxic
metabolites.
In summary, as the dominant growth form for bacteria in soil, mix-species biofilms play an
essential role in maintaining the ecological balance, whereas from an evolutionary perspective, this
role is further strengthened by the selective pressures which favor bacteria capable of forming
biofilms in versatile soil environment.
What is real is rational -- what is rational is real.
--Hegel, 1821, Basic Outline of the Philosophy of Right
1.3 Interactions in multispecies biofilms Different species, exhibiting different growth and survival properties, encased in an extracellular
polymeric network could lead to the spatial and functional heterogeneity within biofilms. Even in a
single-species biofilm, the physical, chemical (e.g. gradients of nutrients, waste products and
signaling compounds) and biological (distinct metabolic pathways and stress responses)
heterogeneity can develop [45]. In environmental habitats, diverse bacteria and in many cases fungi,
algae and protozoan, do not live independently in their local microenvironments. The interactions
among these microorganisms and with the external environment critically influence the
development, structure and function of the biofilm and conversely, the spatial heterogeneity and
biodiversity clearly have a dramatic effect on the communication between different biofilm
components, allowing for the development of a complex multispecies community (Figure 1).
17
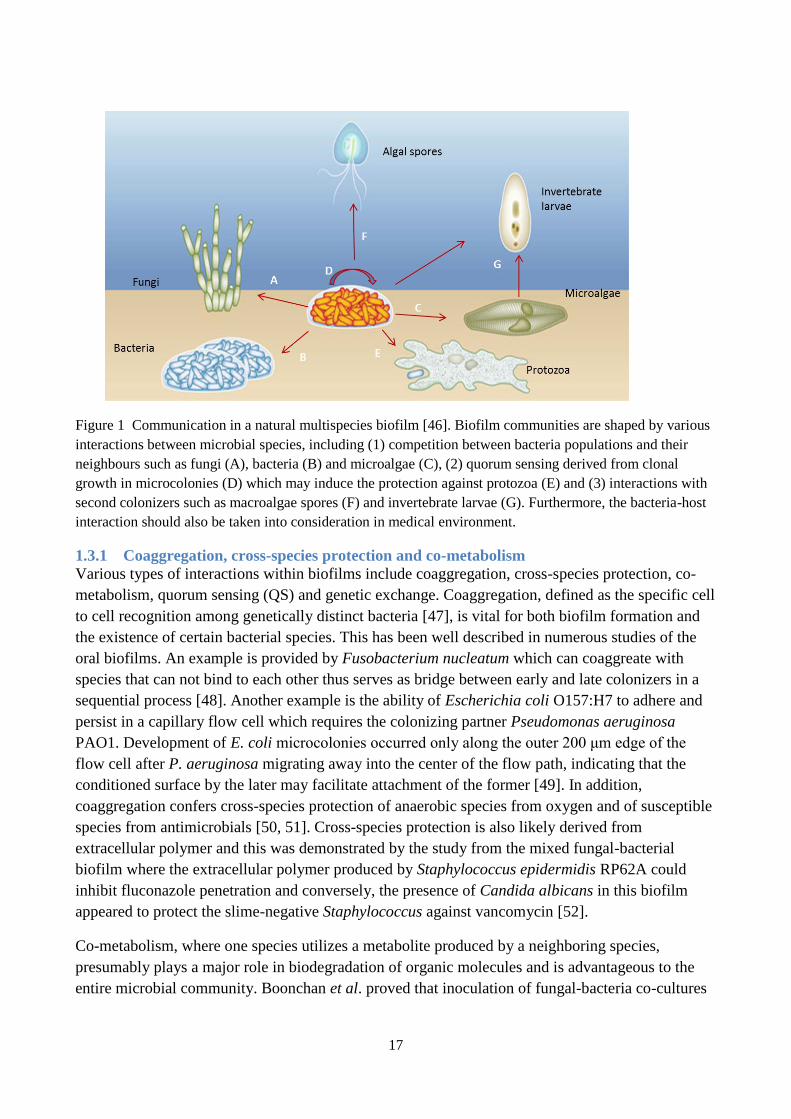
Figure 1 Communication in a natural multispecies biofilm [46]. Biofilm communities are shaped by various
interactions between microbial species, including (1) competition between bacteria populations and their
neighbours such as fungi (A), bacteria (B) and microalgae (C), (2) quorum sensing derived from clonal
growth in microcolonies (D) which may induce the protection against protozoa (E) and (3) interactions with
second colonizers such as macroalgae spores (F) and invertebrate larvae (G). Furthermore, the bacteria-host
interaction should also be taken into consideration in medical environment.
1.3.1 Coaggregation, cross-species protection and co-metabolism
Various types of interactions within biofilms include coaggregation, cross-species protection, co-
metabolism, quorum sensing (QS) and genetic exchange. Coaggregation, defined as the specific cell
to cell recognition among genetically distinct bacteria [47], is vital for both biofilm formation and
the existence of certain bacterial species. This has been well described in numerous studies of the
oral biofilms. An example is provided by Fusobacterium nucleatum which can coaggreate with
species that can not bind to each other thus serves as bridge between early and late colonizers in a
sequential process [48]. Another example is the ability of Escherichia coli O157:H7 to adhere and
persist in a capillary flow cell which requires the colonizing partner Pseudomonas aeruginosa
PAO1. Development of E. coli microcolonies occurred only along the outer 200 μm edge of the
flow cell after P. aeruginosa migrating away into the center of the flow path, indicating that the
conditioned surface by the later may facilitate attachment of the former [49]. In addition,
coaggregation confers cross-species protection of anaerobic species from oxygen and of susceptible
species from antimicrobials [50, 51]. Cross-species protection is also likely derived from
extracellular polymer and this was demonstrated by the study from the mixed fungal-bacterial
biofilm where the extracellular polymer produced by Staphylococcus epidermidis RP62A could
inhibit fluconazole penetration and conversely, the presence of Candida albicans in this biofilm
appeared to protect the slime-negative Staphylococcus against vancomycin [52].
Co-metabolism, where one species utilizes a metabolite produced by a neighboring species,
presumably plays a major role in biodegradation of organic molecules and is advantageous to the
entire microbial community. Boonchan et al. proved that inoculation of fungal-bacteria co-cultures
18
resulted in significantly improved co-metabolic degradation of polycyclic aromatic hydrocarbons
(PAHs) in soil [53]. It has also been demonstrated that the acceleration of the remediation of
chlorophenol- and phenol-contaminated groundwater by a sequencing batch biofilm reactor was
probably due to the co-metabolism [54]. The efficient degradation when multiple species are
present can be derived from the optimized substrate availability when growing attached to a surface
and the close proximity of enzymes involved in degradation that may be retained in the biofilm
matrix [55, 56]. Additionally, metabolic communications were also reported between bacteria
within the oral cavity. One of them is the metabolic interaction through arginine between two oral
bacteria Actinomyces naeslundii and Streptococcus gordonii, where S. gordonii genes involved in
arginine biosynthesis and transport were induced when coaggregated with A. naeslundii, otherwise
S. gordonii could not grow without sufficient arginine [57].
1.3.2 Chemical signaling systems
A cell-to-cell signaling mechanism known as quorum sensing (QS) has been shown in many studies
to play crucial roles in biofilm development as mentioned in Section 1.2. And due to the social
behaviors of bacteria, the term “sociomicrobiology” was introduced by Parsek MR et al. in 2005 to
vividly describe the inextricable link between biofilms and quorum sensing [58]. It has been shown
that QS can be induced by a few thousand bacteria, which size is analogous to the number of
bacteria found in biofilm microcolonies [59]. Many bacterial behaviors are regulated by chemical
autoinducer molecules that are produced and used by bacteria to sense one another. Bacteria can
communicate both intraspecifically and interspecifically via autoinducers which alter gene
expression and allow bacteria to respond coordinately to their environments, in a manner that is
comparable to behavior and signaling in higher organisms. In gram-negative bacteria, acylated
homoserine lactones (AHLs) are the most intensively investigated signal molecules and have been
well described in Pseudomonas aeruginosa. There is also report that two different chemical
languages: N-acyl homoserine lactones (AHLs) and cis-2-unsaturated fatty acids were utilized to
control biofilm formation and virulence in Burkholderia cepacia complex (Bcc) [33]. Despite of the
species specificity of AHL systems, the cross-species talk was reported in a biofilm composed of
cystic fibrosis-associated P. aeruginosa and B. cepacia [60, 61]. In addition, Bacillus sp. and
Variovorax paradoxus were reported to degrade AHLs and interfere with quorum sensing of other
species [62, 63]. In gram-positive bacteria, such as Staphylococcus aureus, peptides operate
generally by binding to receptors on the cell surface rather than diffusing back into the cell like
AHLs [64, 65]. The signaling communication in multispecies biofilms are mainly mediated by
autoinducer 2 (AI-2), which is synthesized by the enzyme LuxS and found in both gram-negative
and –positive bacteria [1, 66]. AI-2 has been shown to promote the biofilm formation of two oral
bacteria Actinomyces naeslundii T14V and Streptococcus oralis 34. Whereas, AI-2 of
Fusobacterium nucleatum was reported to differentially regulate biofilm growth of two oral
streptococci by producing a stimulatory effect on Streptococcus gordonii and an inhibitory effect on
S. oralis [67]. Two redundant quorum sensing systems were verified in Vibrio harveyi, with AHL
for intraspecies communication and AI-2 for interspecies cell–cell signaling [68]. In spite of the
apparent universality of luxS (present in more than 40 bacterial species), the difficulties of obtaining
purified AI-2 from species expressing AI-2 activity raise the doubts that whether AI-2 is a universal
19
signal or just may be a byproduct of the activated methyl cycle (AMC) [69]. Recently, Santiago‐
Rodriguez et al. reported luxS sequences in 25- to 40-million-year-old bacteria, such as Bacillus
schakletonii and B. aryabhattai, two extant bacterial species that had not been previously reported
as carrying luxS [21]. This in turn raises new questions on the specific role of luxS in ancient
microorganisms and whether it is involved in the regulation of metabolism in amber bacteria.
Another quorum sensing signal-diffusible signal factor (DSF), identified in Burkholderia
cenocepacia [70] and Pseudomonas aeruginosa [71], was reported recently to be involved in
interspecies communications by altering biofilm formation, architecture and resistance to antibiotic
[72-74]. Although the underlying mechanism of DSF in mixed communities remains to be
elucidated, this signal may play a crucial role in mediating cell-to-cell interactions in parallel with
AI-2 and AHL signals, owing to its widespread existence in various species and niches. Despite the
significant advances regarding to bacterial quorum sensing and group behaviors mentioned here,
expounding the functional consequences of QS in multispecies biofilms is still a challenge.
Although quorum sensing (QS) can be considered as diffusion sensing (DS) as QS induction or
repression is based on the interaction between the diffused signal and the cognate receptor [75], QS
enables bacteria to coordinate their behaviors for group benefit while DS depends on individual
fitness benefits [76]. These conflicting concepts are unified by an alternate hypothesis efficiency
sensing (ES), which suggests the role of autoinducers relies on both cell density and spatial
distribution and thus is favored by both group and individual benefits [77]. Future research towards
uncovering the genetic network induced by QS that deterministically controls biofilm adaption will
undoubtedly provide new insights into biofilm manipulation.
Another chemical signaling system 3', 5'-cyclic diguanylic acid (c-di-GMP), as a ubiquitous
secondary messenger, is found in diverse bacteria. The levels of c-di-GMP are mediated in the cell
by diguanylate cyclase (DGC) activity involved in c-di-GMP synthesis and phosphodiesterases
(PDE) activity involved in c-di-GMP degradation. The well characterized example is in Vibrio
cholera where 62 genes are predicated to encode proteins capable of producing or degrading c-di-
GMP and influence many phenotypes including motility, biofilm formation and virulence [78, 79].
Moreover, c-di-GMP was reported to reciprocally control biofilm formation and virulence with
quorum sensing in V. cholera. These two signaling function antagonistically to regulate biofilms
and synergistically to repress virulence factor expression, which are fundamental for V. cholerae
survival ex vivo and in vivo, respectively [80]. The increased production of c-di-GMP could
enhance biofilm formation and decrease swarming motility were also observed in Pseudomonas
aeruginosa [81]. George O’Toole elaborated upon how c-di-GMP influenced biofilm formation via
sensing environmental input, phosphate levels, in Pseudomonas fluorescens. This involved two
proteins, LapA and LapD. Whereas LapA was required for stable surface attachment and biofilm
formation, LapD served as a unique c-di-GMP effector protein that utilized an inside-out signaling
to regulate LapA localization and thus surface commitment [82]. Despite the diverse components
and molecular processes involved in biofilm formation throughout the bacterial kingdom, c-di-GMP
signaling seems to represent a common principle, which suggests that the enzymes that controlling
cellular c-di-GMP levels may be promising targets for anti-biofilm drugs.
20
1.3.3 Lateral gene transfer
Lateral gene transfer (LGT), also termed horizontal gene transfer (HGT), refers to the gene
exchange among bacteria cells in a manner other than traditional reproduction, which can occur
among conspecific strains [83] and strains in different species in biofilms [84]. There are two LGT
mechanisms: transformation and conjugation. Transformation - the uptake of free DNA from the
environment by a bacterial cell- requires exogenous DNA which can be easy to meet as a result of
the large amount of extracellular DNA in biofilms. The other mechanism, conjugation, occurs when
there is direct cell-to-cell contact or a bridge-like connection and transfers small pieces of DNA,
usually plasmids which often carry virulence and antimicrobial resistance genes. Efficient
transformation and conjugation in microbial consortium have been found in both natural and
artificial environments. For example, lateral gene transfer of AHL synthase gene could facilitate
cross talk between Burkholderia spp. and Pseudomonas spp. [85], whereas lateral gene transfer of
ring-hydroxylating-dioxygenase (RHD) gene may improve aromatics’degradation by spreading
the gene among different species [86]. Burmølle et al. reported a conjugative plasmid pOLA52,
which confers resistance to olaquindox and other antimicrobial agents through a multidrug efflux
pump, can also promote biofilm formation in Escherichia coli [87]. Also, there is example that
transfer efficiency of plasmids in Pseudomonas putida biofilm depended on the type of antibiotics,
suggesting biofilm bacteria may “sense” antibiotics to which they are resistant and enhance the
spread of that resistance [88]. Overall, efficient gene transfer is both the cause and consequence of
biofilm development. On the one hand, LGT is facilitated within biofilms as a result of the presence
of extracellular DNA, close spatial juxtaposition of bacterial cells and stable habitat provided by
EPS matrices [89]. On the other hand, both DNA transfer processes seem to have positive effects on
biofilms, such as enhanced resistance against predators, toxins and antibiotic factors and the
stabilization of biofilm structure mediated by conjugative pili which may act as cell adhesins in
hydrodynamic biofilm systems [90].
1.3.4 Synergism or antagonism / Cooperation or competition
The interactions responsible for synergism in biofilms as exemplified above, often operate in
concert and have been demonstrated to strengthen the protective effects of biofilms when multiple
species are present compared with single species communities. This was verified by a substantial
increase in the chlorine tolerance of a multispecies biofilm from drinking water, regarding to the
planktonic cultures and monospecies biofilms [91]. Likewise, it was recently reported that a
reproducible mixed-species biofilm comprising Pseudomonas aeruginosa, Pseudomonas protegens
and Klebsiella pneumonia was more resistant to the antimicrobials sodium dodecyl sulfate and
tobramycin than the single-species biofilms. Moreover, such community level resilience was found
to come from the protection offered by the resistant species rather than selection for the resistant
species, suggesting that the community-level interactions, such as the sharing of public goods, are
unique to the structured biofilm community [92]. Nevertheless, some antagonistic interactions
between bacteria also have been documented in the dental biofilm [93] as well as in marine [94] and
soil environments [95]. Microbial antagonism can be caused by inhibition of microbial growth by
diffusible antibiotics, toxins or biosurfactants [96], competition for colonization sites and nutrients
[97] and degradation of quorum sensing molecules [98]. Diverse physical interactions between
21
bacteria and fungi have been associated with reduced fungal viability due to the antifungal
molecules secreted by bacteria into the local environment. An example is Acinetobacter baumannii-
Candida albicans in chronic infections. It was shown that A. baumannii could inhibit several
important virulence determinants of C. albicans, including hyphae and biofilm formation via
polymicrobial infection and conversely, the viability of A. baumannii is reduced when C. albicans
cells adopt the quorum mode in a biofilm environment [99]. Thus, exploiting the mechanisms used
by competing microorganisms could potentially contribute to combating detrimental biofilms in
medical, industrial and natural environments.
According to West et al. [100], interactions can be roughly classified into cooperation or
competition, based on the effect of the microbial social behavior on each population in a binary
system (actor and recipient). When recipient benefits from the presence of actor, the interaction is
termed cooperation, which can be further subcategorized into mutualism (beneficial for both actor
and recipient) and altruism (beneficial for recipient but costly to actor). On the contrary, when
recipient is negatively affected, the interaction is identified as competition which is grouped into
selfishness (beneficial for actor) or spite (negative effect on both recipient and actor). In addition,
two other closely related terms are also frequently used to describe the social behavior in biofilms,
i.e. synergism and antagonism. Synergism has been defined as the cooperative action of two or
more organisms where the effect of their collective effort is greater than it would be by their
individual effect [101]. In contrast, antagonism is the relationship in which one species of an
organism is inhibited or adversely affected by another species in the same environment. When these
definitions are applied to soil microorganisms, synergism, also known as protocooperation, is
described as a facultative phenomenon that both populations can survive on their own but the
association provides some mutual benefits [102]. In this thesis, we use “synergism” to refer to the
enhanced overall productivity (biomass) and fitness (resistance against protozoa grazing) of the
multispecies community as a whole compared with the individual species. Competition often
indicates the active competition for nutrients and space. Thus, in a narrower sense, competition can
also be defined as “the injurious effect of one organism on another because of the removal of some
resource of the environment” [103]. While, antagonism may be used broadly to include the
competition for limited substrate, the inhibition by antibiotics or metabolites produced by another
organism, or exploitation which is either predation or direct parasitism [104]. When used practically,
however, these definitions are not clearly defined and may vary somewhat. For example, Foster et
al. applied the evolutionarily stringent definition of cooperation [97] when analyzing the
productivity of two-species mixtures grown in aquatic microcosms, that is, only the interactions that
can cause the increased productivity of both species in co-cultures, can be termed as cooperation.
Moreover, in spite of the usefulness of this binary system mentioned above in defining interaction,
the natural communities are far more complex than expected where more than one type of
interactions probably simultaneously occurs and more than two species are involved. Hence, it may
seem trivial to place the interaction within a biofilm in one category while exclude others [105]. A
typical example described by Hansen et al. [106] showed that the increased biomass of the dual-
species biofilm in total and of one member (Pseudomonas putida) is at the expense of another
member (Acinetobacter sp.) due to intensified competition for oxygen. Therefore, both the biomass
22
and/or function of the integrated multispecies community and each individual member need to be
evaluated to define whether the cooperative or competitive interactions shape the community. This
is what we have done in manuscript 1 and 2 [107]. The quantitative PCR developed in our study
was applied to measure the absolute cell numbers of each species in a four-species biofilm and
hence identified the dominance of cooperation interaction as each member could benefit, with
respect to biomass, in this multispecies biofilm compared with when they grow alone.
What we know from the research focusing on the link between genetic population structure and
social behavior are still very limited. And most studies support the idea that while cooperation will
occur within the same genotype, competition should prevail between different genotypes [108-110].
However, this prediction is drew with the implicit assumption that there is competition for resources
among these interacting genotypes which may not always be the case in nature environment,
exemplified by efficient biodegradation through co-metabolism in multispecies communities
mentioned above. Zhang et al. demonstrated that the switch between synergy and competition is
closely related to the flow conditions. Limited resource replenishment favors competition under
low-flow conditions while high flow favoring synergy by providing greater resource and making
biofilm easier to shear from the surface [111]. Moreover, cooperation between different species also
may prone to emerge in communities with low niche overlap and high relatedness within each
member. From the social evolution point of view, cooperation is challenging to explain as
cooperative phenotypes are susceptible to exploitation by rapidly growing, non-cooperative cells.
However, Nadell et al. reported that this condition can be reversed if cooperative cells are
segregated in space and preferentially interact with each other, indicating the cooperation may
evolve readily than naively expected [112]. The proposition that biofilm promotes altruism was
evidenced by an individual-based model simulations which showed the often-observed structural
organization into microcolonies and shedding of single cells in biofilms are necessary for the origin
and maintenance of the altruistic strategy [113]. Moreover, a recent report by [114] pointed that
intraspecies variation, despite the enhanced individual fitness of the generated morphotypic variants
compared with their parental strains, was reduced in the mixed species biofilms, suggesting this
sacrifice of self-produced diversity in the presence of other species probably represents altruism in
multispecies biofilms [115]. The “Black Queen Hypothesis (BQH)” was put forward recently to
better explain how and why cooperation in a multispecies community can evolve [115]. It presents a
scenario whereby a division of labor in microbial communities is likely to occur by receivers
deleting costly pathways that are provided by the surrounding bacteria which unavoidably produce
public resources, thus bacteria might often develop interdependent cooperative interactions. This is
opposite to the “Red Queen Hypothesis” which states the evolutionary conflict between co-
inhabitant organisms. Therefore, BQH provides a new framework for looking at interactions in the
ecological context where these organisms are evolving, which needs to be carefully considered
when applying social evolution theory to microbial communities. Viewed in this way, the conflict
between group-level selection and individual-level selection, which favor cooperation and
competition respectively, should be assessed on a case-by-case basis. Instead of discerning which is
the ‘right’ model, it should be noted, however, that different types of selection are likely involved in
shaping the evolutionary adaption of biofilm, leading to different types of molecular strategies
23
involved in regulating surface associated communities according to various environmental cues
[116].
Since the majority of microorganisms present in the environment remain unculturable, the diversity
of complex bacterial communities is inevitably underestimated. We can not exclude that other
bacteria out there might depend to a great extent on cooperation with partners, and perhaps just this
is one of the reasons why we failed so far to isolate them in the laboratory [117]. This also
highlights the importance of the in situ studies of microbial interactions, which is a prerequisite for
deeper understanding of social behavior in multispecies biofilms and hence provide better treatment
for biofilm-associated infections and exploit biofilms for beneficial applications, such as waste
water treatment, N2 fixation, pollutant degradation and so on.
24
2 How to study multispecies biofilms? The study of biofilms has proliferated in the past 15 years. And it is widely acknowledged that
biofilm formation has a close correlation with the species and/or intra-/interspecies communication
that is present, as well as the environmental conditions involved.
2.1 In vitro biofilm models In vitro biofilm experiments were brought into being in the mid-1980s [118, 119], followed by the
development of several biofilm-forming devices, including Modified robbins device [120],
Microtiter plates [121], Calgary device [122], Flow cell [123] and BioFilm ring test [124], which
allow to explore the adhesion ability of different microorganisms and the effect of various
environmental conditions on biofilm development with tightly controlled parameters. Using 96-well
microtiter plates, the effects of coaggregation and quorum sensing molecules on biofilm formation
were assessed respectively [125, 126]. Although in vitro studies have the advantages in evaluating
the influence of pre-determined environmental, physiological and genetic variables on biofilm
formation, large amounts of reproducible data under different conditions are still missing as the
insufficient versatility and the difficulty to control all the complex variables especially when a
heterotrophic consortium, such as a multispecies biofilm, is studied. Considering the lack of
reproducibility, possibly due to the researcher’s dependent variable, the comparison of results
obtained when using different protocols and biofilm growth systems, particularly between different
research groups, is problematic. This is what we hopefully are contributing to in manuscript 1 [107].
A standard procedure was developed for evaluating interspecies interactions in defined microbial
communities by comparing the reproducibilities of 96 Well Cell Culture Plate and Nunc-TSP lid
system (also referred to Calgary methods)-based biofilm formation. The Calgary Biofilm Device
(CBD) was first described and applied by Ceri et al. [127] for high-throughput determination of
antibiotic susceptibilities of bacterial biofilms. The biofilm is formed on the pegs of a modified
microtiter lid in this device instead of at the bottom of a well which can avoid non-specific bacterial
sedimentation that may not accurately relate to biofilm, though the difference between this “upside-
down” biofilm and the biofilm formed at the bottom has not been addressed. Apart from the broad
and robust applicability for many microorganisms, CBD, moreover, seems to be more amenable for
combination with microscopy, e.g. epifluorescence microscopy or confocal laser scanning
microscopy (CLSM), which makes it possible to analyze the structural heterogeneity of biofilms
under diverse exposure conditions [128]. Thus, by introducing microscopy into biofilm studies,
many parameters such as biofilm biomass, total and active number of cells as well as associated
physiological activity, extracellular matrix and overall structure can be assessed. Especially for
multispecies biofilms, the spatial organization of different species is very important which plays a
vital role in determining biofilm function, including antimicrobial resistance [92] and driving
metabolic reactions [129].
In order to gain a more comprehensive and in-depth understanding of complex interactions that
drive biofilm development, the multispecies consortia should be investigated nondestructively, in
real time and in situ which also enable studies of the species that are unculturable in the laboratory.
However, it is still challenging until now to mimic the microenvironment as much as possible
where microorganisms live in close proximity and interact with each other, especially for soil
25
biofilms, owing to the complex structure of soil environment and the strikingly high bacterial
numbers. Therefore, the use of in vitro and in vivo biofilm model systems under controlled
conditions is indispensable for the study of the complex communities. For instance, biofilms
exposed to shear stress are studied in flow cells, and when combined with Fluorescence in situ
hybridization (FISH) and CLSM, both quantitative data and interactions information can be
provided [130]. FISH allows the detection not only of cultivable microorganisms but also of
fastidious or uncultured species. However, the main target molecules, 16S rRNAs, could somewhat
cause perplexity when measure viability and metabolic activity, as ribosomes can remain intact
even in recently nonviable and/or non-metabolically active cells. This can be surmounted by
targeting the short-lived intergenic space region (ISR) between the 16S and 23S rRNA segments,
called Spacer-FISH [59]. The recent combination of Raman-FISH and secondary ion mass
spectrometry can be applied for functional studies of biofilm microbes on a single-cell level by
using stable isotopes as labels [131]. Nevertheless, the widely used FISH technique also has
limitations, such as laboriousness and unsuitability for high-throughput screening. An alternative
device, BioFlux, was presented recently which comprises disposable microplates with embedded
microfluidic channels and a distributed pneumatic pump providing rate-controlled fluid flow [132].
BioFlux 1000, which integrates a high performance microscopy workstation, allows real-time,
automated image capture. In combination with strain specific markers such as reporter genes,
fluorescence-labeled antibodies and probes, flow cells and BioFlux are capable of exploring the
structural organization and dynamics of biofilms.
Despite the direct visualization of biofilm structures using microscopy techniques, this technique
can only provide high quality but semi-quantitative results. Other molecular techniques, such as
quantitative PCR and transcriptomic analysis using next-generation sequencing, are promising tools
in quantitative assessment and have led to a clearer depiction of the patterns of transcriptional
regulation of biofilm-specific genes and the signaling network employed by biofilms at various
stages in their growth.
2.2 Quantitative PCR Quantitative PCR (qPCR) has been widely used to quantify microorganisms and measure functional
gene markers in complex communities due to its accuracy, high sensitivity, specificity and speed.
In contrast to the traditional end-point PCR, the amplification of the PCR products are recorded in
“real-time” via a corresponding increase in fluorescent signals. By detecting the accumulation of
amplicons during the early exponential phase of the PCR, gene/transcript numbers are quantified
when these are proportional to the starting amount of nucleic acid, while the levels of expressed
genes are measured when combined with a preceding reverse transcription reaction (RT-qPCR).
There are two commonly used reporter systems, namely, SYBR Green assay and TaqMan probe
assay. Since SYBR Green binds to all double-stranded DNA by intercalating between adjacent base
pairs, including nonspecific PCR products, the target may be overestimated if the primers are not
highly specific to their target sequence. Hence, a post-PCR melting (dissociation) curve analysis is
needed to verify that the fluorescence signal only comes from target templates. However, the
introduction of the reporter probe can significantly increase specificity of the detection. TaqMan
26
probes are dual labeled hydrolysis probes, incorporating a fluorescent reporter molecule at the 5'
end and a quencher molecule at the 3' end [133]. During template extension, the reporter-quencher
proximity is broken by the 5' to 3' exonuclease activity of the Taq polymerase, thereafter
unquenched emission of fluorescence is detected after excitation with a laser. By using multiple
TaqMan probes and primer sets, highly similar sequences can be differentiated in different qPCR
assays [134]. Furthermore, TaqMan probes labeled with different fluorophores enable that different
targets are amplified and quantified within a single reaction which is called multiplex qPCR [135].
In spite of the additional specificity afforded by Taqman probe, the relatively high cost of labeled
probe limits its use to some extent. In addition, TaqMan amplicons need to be longer as additional
conserved sites are required for designing probes, whereas identification of three conserved regions
for primer set and probe within the short amplicon may not be always possible, especially for
divergent gene sequences. But this dilemma can be alleviated to a certain extent by using TaqMan
MGB probe as the DNA probes with conjugated minor groove binder (MGB) groups form
extremely stable duplexes with single-stranded DNA targets, allowing to design shorter probes
[136]. However, using MGB probes will further increase the running cost. Maeda et al. reported
that both TaqMan and SYBR Green assays showed sufficient sensitivity and specificity for
quantification of bacteria species in dental plaque [137]. Taking into account the lower running cost,
ease in primer design and assay set-up, SYBR Green assay may be suitable for routine clinical
examinations.
As a powerful, convenient tool, quantitative PCR assay has been increasingly employed in the past
few years to detect and quantify target bacteria in biofilms, or to perform gene expression analysis
during biofilm development. By using SYBR Green based qPCR, the population dynamics of
pathogenic salmonellas during 4-week period in both water and biofilm samples had been followed
[138]. Zhang et al. identified three genes involved in Pseudomonas aeruginosa biofilm-specific
resistance to antibiotics by performing mRNA-based qPCR to compare the expression of these
genes in planktonic- and biofilm-grown cells [139]. The data from differential transcript levels
coupled with quantification of DNA release and cell densities in mixed cultures of three
streptococci provided new insights into ecological factors that influence the competition between
pioneer colonizing oral species in oral biofilm. In addition, in combination with propidum
monoazide (PMA), qPCR assay can overcome its main limitation of the inability to discriminate
between live and dead cells [140, 141]. This is achieved through PMA penetrating the membranes
that have lost their integrity and then binding to the dsDNA which prevents the use of dsDNA-PMA
complex as a template for PCR reaction. The first research using qPCR-PMA technique together
with TaqMan probe for analyzing the live and dead cells present in a multispecies oral biofilms was
reported recently [142]. Moreover, by use of laser capture microdissection microscopy (LCMM), a
small group of cells can be harvested at spatially resolved sites within biofilms, thus reflect
heterogeneity inherent to biofilms. Combined LCMM with multiplex RT-qPCR, Franklin presented
a stratified biofilm which showed the high amount of housing keeping, acpP, in the top 30 μm of
the biofilm, with little or no mRNA at the base of the biofilms, suggesting that the transcription of
individual genes varies dramatically in different regions of the biofilms [143].

27
In order to make valid comparisons between different samples, there are a number of factors that
should be taken into account before performing the qPCR assay. One of the important factors is the
choice of method used for nucleic acid extraction which is a major determinant on the final
quantification. As the extraction efficiencies vary significantly between different methods as well as
different types of environmental samples [144], it is problematic to make direct comparison of
absolute cell numbers between studies without ensuring that the same extraction procedure is used
for each sample. The DNA extraction protocol optimized in our study, which allows DNA
extraction from both the gram-negative and -positive cells in the multispecies biofilm with the same
efficiency [107], is likely to have a wide application in DNA-based biofilm research. Additionally,
PCR inhibitors are often found in environmental samples and interfere with the following qPCR
performance. Hence, the equivalent amplification efficiencies between the environmental templates
and external standard curves are necessary for absolute quantification. Other potential variables in
qPCR assays include preparation and quantification of the standard curve, the subsequent qPCR
efficiency, as well as different qPCR reagents and analysis software that are used [145, 146].
Therefore, only the ‘absolute’ numbers generated from the same single qPCR assay can be
compared when using the same standard curve [147].
Despite of the unparalleled specificity and sensitivity provided by qPCR-based approaches to target
the sequences from a mixed community sample, one noteworthy limitation is that qPCR-based
approaches require prior knowledge of the specific target gene of interest. This inevitably results in
the fact that any qPCR-based method can not be used to analyze the sequences of unknown species
which are likely to account for the vast majority of the world's millions of species. The development
of “omic” approaches in recent years, however, can circumvent this problem by providing a PCR-
independent assessment of microbial diversity. Hence, combing qPCR technique with other
approaches, such as metagenomic and metatranscriptomic analysis, can enable researchers to gain a
more comprehensive and in-depth understanding of complex microbial communities.
2.3 Transcriptomics The development of next-generation sequencing techniques, allowing for the analysis of microbial
population at a large-scale, has brought forth novel applications, such as metatranscriptomics and
metaproteomics which revolutionize the study of complex microbial communities, such as biofilms.
The transcriptome is the complete collection of transcribed elements of the genome present in a cell
or tissue at a specific development stage or physiological condition. The difference in gene
expression patterns between biofilm and planktonic bacteria modes of growth has been well
established [148, 149]. Moreover, it is not surprising that the intricate interactions between species
in multispecies biofilms can also bring about major changes in gene expression compared to single
species biofilms.
All existing technologies that have been developed to deduce and quantify the transcriptome can be
attributed to either hybridization- or sequencing-based approaches. Hybridization-based approaches
are typically based on the custom-made microarrays or commercial high-density oligo microarrays
that are incubated with fluorescently labeled cDNA. Although microarray techniques are high
throughput and relatively inexpensive, these methods have several limitations, such as high
28
background levels caused by cross-hybridization, difficulty in detecting and quantifying low-
abundance species owing to the analog nature of the signal and challenges with comparing
expression levels between laboratories and across platforms. Furthermore, microarray analyses rely
on existing knowledge about genome sequence [150]. These limitations, however, have been
surmounted by sequencing-based approaches since the remarkable sequencing technology have
exploded onto the scene, offering dramatically lower per-base costs. Especially, the recently
developed next-generation sequencing techniques have opened new doors in the field of
transcriptomic analysis, prompting rapid emergence of RNA sequencing, termed RNA-Seq, which
directly determines the cDNA sequence from an organism of interest. The major steps involved in
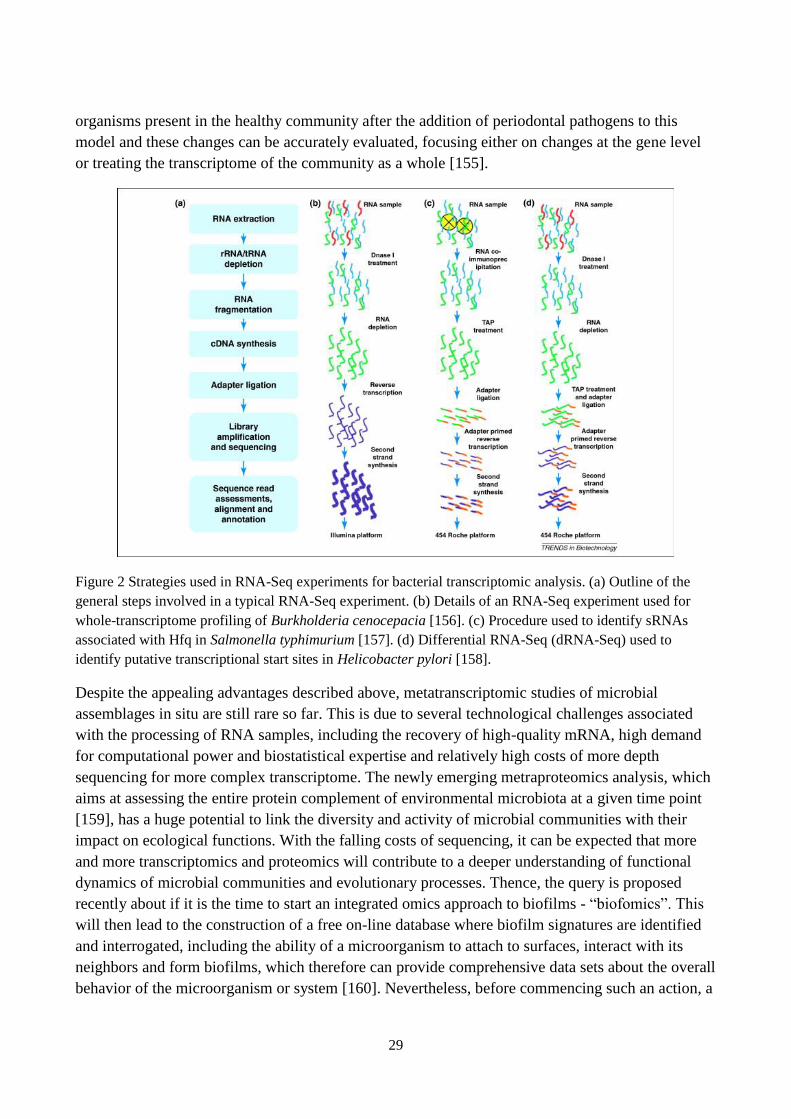
bacterial transcriptome sequencing are depicted in Figure 2 [151]. In general, a population of RNA
is converted to cDNA library and then sequenced in a high-throughput manner to obtain short reads.
Thereafter, the resulting reads are assembled using either de novo or genome-guided approach to
produce a genome-scale transcription map that consists of both the transcriptional structure and/or
level of expression for each gene [152]. The output length of sequence reads and depth of coverage
vary depend on the different DNA sequencing platform used. Three major commercial next-
generation sequencing platforms: Roche's 454, Illumina's Solexa and Applied Biosystems' SOLiD
are commonly used worldwide.
Although RNA-Seq, as a novel field of research, is still under active development, it has clear
advantages over existing technologies. First, it allows the detection of transcripts in non-model
organisms with unknown genomic information. Given the tremendous diversity of uncultivated
microorganisms, future transcriptomic studies have the potential to identify new non-coding RNA
families. Second, it has a much larger dynamic range (spanning five orders of magnitude) compared
with DNA microarrays, and its high accuracy for quantifying expression levels has been verified by
quantitative PCR [153]. Third, it can reveal the precise location of transcription boundaries and
identify single-nucleotide polymorphism (SNPs) in the transcribed regions which make RNA-Seq
useful in complex transcriptomic studies. Overall, RNA-Seq is such a powerful and promising tool
that it enables the entire transcriptome to be analyzed in a very high-throughput and quantitative
manner and offers single-base resolution while concurrently, profiling gene expression levels at a
genome scale. By the use of RNA-Seq technology, the difference of gene expression between
mature P. aeruginosa biofilms and planktonic cells was firstly evaluated recently [154]. A set of
genes that were specifically regulated in biofilms were identified, including genes involved in type
three secretion, adaptation to microaerophilic growth and the production of extracellular matrix
components, indicating that biofilms are not just surface attached cells in stationary phase.
Moreover, the qualitative analysis of the RNA-Seq data revealed the enrichment of the 5'-ends of
the original transcripts, enabling an accurate prediction of transcriptional start sites (TSS). In spite
of many studies on expression profile of monospecies biofilms, metatranscriptomic analysis of
multispecies biofilm opens up the possibilities for assessing gene expression profiles of whole
microbial communities, facilitating the identification of genes of importance under different
environmental conditions. Such a study was conducted recently to study patterns of community
gene expression in a multispecies biofilm model composed of oral bacteria and periodontal
pathogens. The metatranscriptomic data demonstrated the changes in gene expression profiles of the
29
organisms present in the healthy community after the addition of periodontal pathogens to this
model and these changes can be accurately evaluated, focusing either on changes at the gene level
or treating the transcriptome of the community as a whole [155].
Figure 2 Strategies used in RNA-Seq experiments for bacterial transcriptomic analysis. (a) Outline of the
general steps involved in a typical RNA-Seq experiment. (b) Details of an RNA-Seq experiment used for
whole-transcriptome profiling of Burkholderia cenocepacia [156]. (c) Procedure used to identify sRNAs
associated with Hfq in Salmonella typhimurium [157]. (d) Differential RNA-Seq (dRNA-Seq) used to
identify putative transcriptional start sites in Helicobacter pylori [158].
Despite the appealing advantages described above, metatranscriptomic studies of microbial
assemblages in situ are still rare so far. This is due to several technological challenges associated
with the processing of RNA samples, including the recovery of high-quality mRNA, high demand
for computational power and biostatistical expertise and relatively high costs of more depth
sequencing for more complex transcriptome. The newly emerging metraproteomics analysis, which
aims at assessing the entire protein complement of environmental microbiota at a given time point
[159], has a huge potential to link the diversity and activity of microbial communities with their
impact on ecological functions. With the falling costs of sequencing, it can be expected that more
and more transcriptomics and proteomics will contribute to a deeper understanding of functional
dynamics of microbial communities and evolutionary processes. Thence, the query is proposed
recently about if it is the time to start an integrated omics approach to biofilms - “biofomics”. This
will then lead to the construction of a free on-line database where biofilm signatures are identified
and interrogated, including the ability of a microorganism to attach to surfaces, interact with its
neighbors and form biofilms, which therefore can provide comprehensive data sets about the overall
behavior of the microorganism or system [160]. Nevertheless, before commencing such an action, a

30
versatile, reliable and high-throughput biofilm growing device and appropriate methods for biofilm
analysis should be selected with the purpose of minimizing variations and the consequent need of
taking a higher number of replicates. However, whether such a device and analytical methods are
already fully developed, especially for multispecies biofilms, remains open to question.
31
3 Biofilms and protozoa
3.1 Protozoa Protozoa are unicellular, ubiquitous and colorless eukaryotes with size varying from a few to
hundreds of micrometers. Most protozoa are heterotrophic and generally feed on bacteria and other
smaller microorganisms, e.g. fungi and algae. A typical predator-prey interaction exhibits three
stages of feeding process: contact, capture and ingestion (phagocytosis). Motility plays an important
role for protozoa in capturing food and avoiding unfavorable environmental conditions. Based on
the types of locomotion, protozoa can be divided into three major groups: amoebae, flagellates and
ciliates. Amoebae produce pseudopodia for both locomotion and food-acquiring, while flagellates
possess one or more flagella and ciliates use numerous small cilia.
In agricultural soil, heterotrophic flagellates and naked amoebae predominate, with numbers
ranging from l0,000 to 1,00,000 per gram of arable soil and by forming cysts in their life cycle, they
can persist through adverse soil conditions, such as drought stress [31]. Protozoa are important for
soil nutrient cycling by feeding on bacteria and releasing excess nitrogen into the soil environment
which make them valuable in maintaining microbial equilibrium in the soil. Moreover, protozoa
graze different bacteria to different degrees depending on the characteristics of bacteria, including
cell size [161], cell surface properties [162], rate of motion [163], extent of biofilm formation [164]
as well as the nutritional and biochemical status [165]. There is also cumulative evidence that
secondary metabolites produced by bacteria may make them less susceptible to grazing [166-168].
Although amoebae grazing appears to be non-size-selective, flagellates and ciliates have preference
for medium-size bacterial cells [169, 170]. By altering bacterial size distribution, grazing is likely to
affect the bacterial community structure. In addition, another mechanism involved in the effect of
protozoa has on the bacterial community structure is the lower edibility of gram-positive bacteria
[171] due to the lower rate of digestion of cell wall [172]. However, this is not always the case as
many gram-negative bacteria are inedible while many gram-positive bacteria are adequate food
sources for protozoa [173, 174]. For instance, both Bacillus licheniformis and Pseudomonas
aeruginosa were found to produce toxic substance to the amoebae [175] and some other features of
bacterial cells like size, cell morphology and motility, are not related to gram status but have been
shown to influence feeding selectivity. Additionally, the bacterial community structure may also be
affected by non-selective grazing. For example, growth rates have been demonstrated to affect the
survival of bacteria in environments with intense protozoan predation [176, 177], as a fast-growing
species may survive at higher densities than the slow-growing organisms by compensating for cell
loss faster. Moreover, by decreasing bacterial numbers and releasing nutrient immobilized by soil
microorganisms, protozoa grazing may reduce interspecies competition for substrates [178]. There
is also report that shifts in bacterial community composition resulted from the enhancement of
grazing which disturbed the established balance between population-specific growth and mortality
rates of bacteria by stimulating viral activity [179].
3.2 Biofilms - the response of cell consortia to protozoan grazing Environmental bacteria, as an integral part of microbial food chain, are frequently confronted with
consuming protozoa, which is considered to be a major cause of bacterial death in most freshwater,
32
marine and moist soil habitats [180]. Given their pronounced effects on prey fitness, such as
reduced bacterial biomass and changes in both the composition and morphological structure,
bacteria have developed diverse strategies against protozoa predation. One of the remarkably
effective ways is the formation of cell clusters, e.g., biofilms, although it is not clear up to now that
whether enhanced microcolony formation under grazing pressure is a direct defense strategy or an
indirect stimulation as a result of nutrient recycling and/or chemical cues [181].
Generally, in natural environment, protozoan colonization of bacterial biofilms has three succession
stages. First, early surface colonizers, heterotrophic flagellates, colonize the surface within minutes
after exposure due to their high mobility and abundance in the environment. This is followed by
ciliates and then the later amoebae. The efficient grazing protection provided by microcolony
formation depends on the stage of biofilm development and the feeding mode of the grazer [181,
182], that is early biofilms are colonized mainly by generalists which feed on suspended and
attached bacteria, while later biofilm stages are colonized by more permanently attached specialists
feeding on surface-associated bacteria [183]. Clearly, biofilms provide a dramatically different
feeding environment for protozoa in contrast to planktonic cells. For example, introducing ciliate
grazers to biofilms formed by the yeast, Cryptococcus spp., could result in the 1.75 higher levels of
biofilm metabolism compared with non-grazed controls. Furthermore, the preferential grazing on
the noncellular biofilm matrix over cells embedding in the biofilm demonstrated that EPS could
serve as source of nutrients and energy for protists which benefits the biofilm not only from
physical protection against ingestion but also from the enhanced nutrient recycling [184]. In
addition, the close proximity of bacteria within biofilms can result in enhanced opportunities for
interactions such as horizontal gene transfer and quorum sensing (QS), which may induce multiple
anti-predator mechanisms that are expressed at different stages of biofilm development. Evidences
that QS is involved in regulating anti-predator biofilms have been reported in various
microorganisms. Matz and colleagues proved the key roles of microcolonies formation (Figure 3)
and inhibitor production induced by quorum sensing in the resistance of Pseudomonas aeruginosa
biofilms to protozoan grazing [19]. And the further study showed that inhibitor production of
mature P. aeruginosa biofilms is effective against a wider range of biofilm-feeding predators while
microcolony-mediated protection is only beneficial in the early stages of biofilm formation [182].
A recent study suggested that protozoan resistance of pathogen P. aeruginosa did not result from
activation of QS-regulated public goods, but from the larger and stronger biofilms and thus,
concluded that protist predation can favor cooperation within bacterial species [185]. While in
Serratia marcescens, QS-controlled, biofilm-specific differentiation of filaments and cell chains in
biofilms provides an efficient mechanism against protozoan grazing [21], Vibrio cholera can resist a
range of predators by QS-induced production of an unknown toxin [186], which has been proved to
be more important in grazing resistance of late biofilms compared with the protection provided by
EPS. In early river biofilms under semi-natural conditions, it was shown that the presence of
heterotrophic flagellates significantly reduced the abundance of single bacterial cells, but stimulated
the formation of bacterial microcolonies [187]. There is also report indicating that protozoa from
healthy activated sludge could initially disturb the biofilm development in flow cells but later
stimulate its growth [188]. This stimulation could be caused by release of nutrients or non-selective
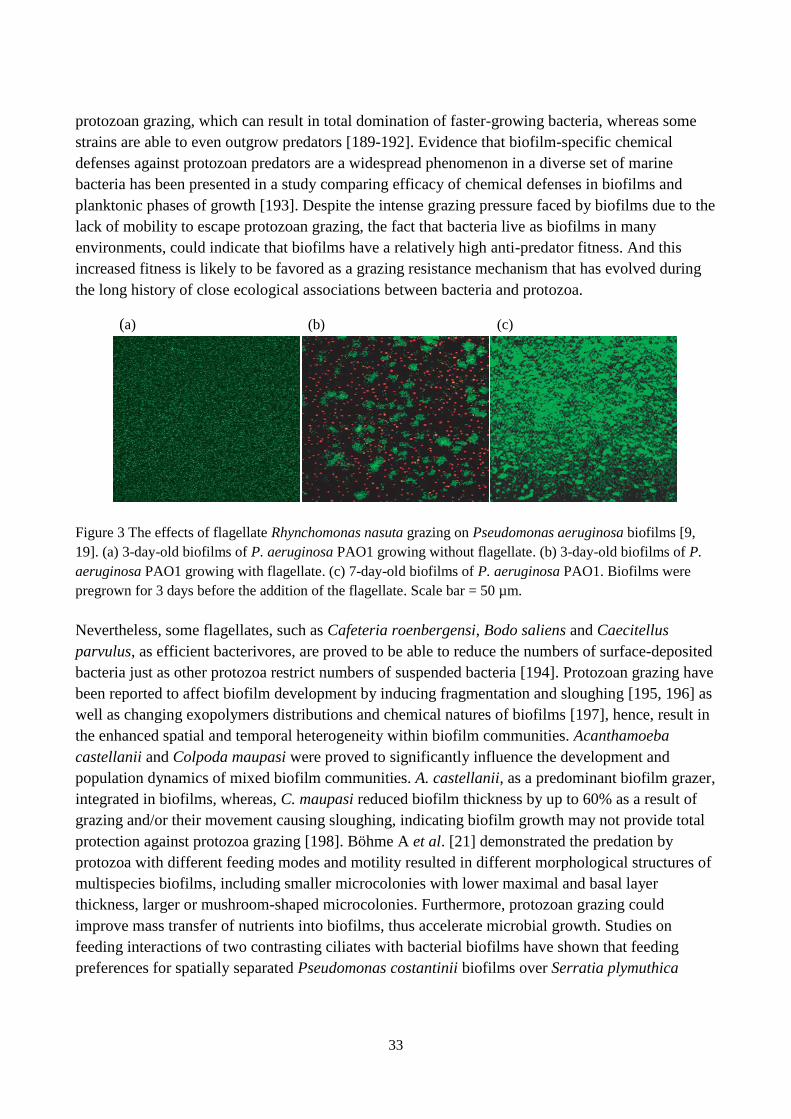
33
protozoan grazing, which can result in total domination of faster-growing bacteria, whereas some
strains are able to even outgrow predators [189-192]. Evidence that biofilm-specific chemical
defenses against protozoan predators are a widespread phenomenon in a diverse set of marine
bacteria has been presented in a study comparing efficacy of chemical defenses in biofilms and
planktonic phases of growth [193]. Despite the intense grazing pressure faced by biofilms due to the
lack of mobility to escape protozoan grazing, the fact that bacteria live as biofilms in many
environments, could indicate that biofilms have a relatively high anti-predator fitness. And this
increased fitness is likely to be favored as a grazing resistance mechanism that has evolved during
the long history of close ecological associations between bacteria and protozoa.
(a) (b) (c)
Figure 3 The effects of flagellate Rhynchomonas nasuta grazing on Pseudomonas aeruginosa biofilms [9,
19]. (a) 3-day-old biofilms of P. aeruginosa PAO1 growing without flagellate. (b) 3-day-old biofilms of P.
aeruginosa PAO1 growing with flagellate. (c) 7-day-old biofilms of P. aeruginosa PAO1. Biofilms were
pregrown for 3 days before the addition of the flagellate. Scale bar = 50 µm.
Nevertheless, some flagellates, such as Cafeteria roenbergensi, Bodo saliens and Caecitellus
parvulus, as efficient bacterivores, are proved to be able to reduce the numbers of surface-deposited
bacteria just as other protozoa restrict numbers of suspended bacteria [194]. Protozoan grazing have
been reported to affect biofilm development by inducing fragmentation and sloughing [195, 196] as
well as changing exopolymers distributions and chemical natures of biofilms [197], hence, result in
the enhanced spatial and temporal heterogeneity within biofilm communities. Acanthamoeba
castellanii and Colpoda maupasi were proved to significantly influence the development and
population dynamics of mixed biofilm communities. A. castellanii, as a predominant biofilm grazer,
integrated in biofilms, whereas, C. maupasi reduced biofilm thickness by up to 60% as a result of
grazing and/or their movement causing sloughing, indicating biofilm growth may not provide total
protection against protozoa grazing [198]. Böhme A et al. [21] demonstrated the predation by
protozoa with different feeding modes and motility resulted in different morphological structures of
multispecies biofilms, including smaller microcolonies with lower maximal and basal layer
thickness, larger or mushroom-shaped microcolonies. Furthermore, protozoan grazing could
improve mass transfer of nutrients into biofilms, thus accelerate microbial growth. Studies on
feeding interactions of two contrasting ciliates with bacterial biofilms have shown that feeding
preferences for spatially separated Pseudomonas costantinii biofilms over Serratia plymuthica

34
biofilms can be initiated by the detection of dissolved chemical cues or contact-based detection of
bacterial attributes [199].
3.3 Protozoa and biofilms - reservoirs of pathogenic bacteria The response of bacteria living in a biofilm to the protozoa can change from defensive to
exploitative, making protozoa an environmental reservoir for bacterial pathogens. For instance, the
growth/survival of bacteria inside the amoebae could give rise to several facultative and obligate
pathogens, e.g. Listeria, Mycobacterium and Legionella [200]. What's more, intracellular bacterial
growth in protozoa or as a biofilm in soil could lead to distinct phenotypes. Legionella pneumophila
and Mycobacterium avium grown in amoebae were reported to be more invasive for macrophages
and/or epithelial cells than those grown in vitro [201, 202], moreover, L. pneumophila, replication
in amoebae could cause large morphological and biochemical changes and induce an antibiotic -
and biocide-resistant phenotype [203]. The fact that Legionellosis, in some cases, results from
inhalation of aerosols of biofilm- and amoebae-containing L. pneumophila, suggests that protozoa
probably have a crucial role in the maintenance and dissemination of human pathogenic bacteria in
the environment. Similar to the resistance mechanisms of Pseudomonas aeruginosa biofilms
against protozoan grazing, the resistance of biofilm infections to phagocyte-mediated host defense
also results from the presence of matrix-enclosed aggregates and the quorum sensing-induced
secretion of virulence factors [204, 205]. From a population dynamic-ecological perspective, the
control of the replication of the pathogens at the stage of nonspecific, constitutive host defenses is
analogous to that of a predator-prey system, with the pathogens being the prey and the phagocytic
cells the predators [206]. Future studies directed at unraveling the role of protozoan grazing in the
structural and functional stability of biofilms could contribute to a better understanding of the
environmental persistence and continuous evolution of bacterial pathogens.

35
4 Where are we going with biofilms? - In the context of microbial ecology Since ecological interaction is one of the main drivers for shaping microbial community, it is
obvious that understanding the mechanisms underlying microbial ecology of biofilm is the core of
research. As a scientific discipline, microbial ecology examines three aspects of a community [207]:
Structure – Which microorganisms are present?
Function – Which metabolic capabilities are available/expressed that can support adaptation of this
community to environmental conditions?
Interaction – How microorganisms interact with one another and with the surrounding environment?
These questions can be answered by the more recent and exciting application of the molecular-
biology tools, which have marked a major breakthrough in transition from reductionism to holism,
that is to elucidating the microbial community as an integral, coevolving system instead of
identifying independent individuals. Transcriptomics and proteomics have come on the scene after
genomics to allow a comprehensive study of the community function at the transcription and
translation levels. Furthermore, metabolomics, described as the comprehensive analysis of the
complete set of metabolites (metabolome) produced within each bacterial species and the entire
microflora [208], can potentially provide a more accurate snapshot of the actual physiological state
of the microorganisms [209, 210] and thus complement transcriptomics and proteomics to assess
genetic function as metabolic pathway fluxs [211]. Since one factor affecting the dynamics of
microbial community in an environmental niche is the metabolic activity from each member,
metabolomics play a crucial role in exploring the biofilm dynamics and interactions within the
microbial ecosystems. A good illustration of linking metabolomics with proteomics to assess
functional differentiation and interactions was provided by studying a dual-species biofilm
composed of Leptospirillum groups II and III. The findings demonstrated that strong metabolomic
segregation exhibited organism-specific correlation patterns which reflected the functional
differentiation of these two species, indicating that the evolutionary divergence had lessened
competition between co-existing microorganisms and allowed them to occupy distinct niches [212].
Moreover, from reconstruction of near-complete or partial recovery of genomes, metabolic network
could be deduced in a natural acidophilic biofilm which provided insights into community
interactions and functions [213]. Besides, metabolic cooperation that is achieved by synergistic
relationship between microorganisms or mutual exchange of metabolites within a community, can
be inferred by analyzing metabolomic data [214].
The emergence of various high-throughput technologies now allows more “meta-omics”, e.g.
metagenomics, metatranscriptomics and metametabolomics that aim to characterize complete
microbial ecosystems. Thus, eco-systems biology was proposed by combining these
microbiolomics to interrogate the diversity, function and ecology of the microbial community [214].
Biofilms, as the dominate lifestyle of microorganisms in nature, are undoubtedly ideal for
conducting these studies which will provide a more complete picture of biofilm community
behavior in the face of environmental stresses. However, the complementary utilization of different
“omics” methods also put forward the challenge in meta-data analysis as well as technical
challenges, including nucleic acids and protein extraction from environmental samples, mRNA
36
instability and low abundance of certain gene transcripts in total RNA. Especially, compared with
genomic, transcriptomic and proteomic analysis, the simultaneous determination of metabolome at
a given physiological state is extremely difficult due to the more variable products generated from
metabolic reactions [215]. Besides, this may be further complicated when confronted with
multispecies biofilms in the environment as a result of the structural and physiological complexity
and unevenness of the microbial community. Although the “meta-omics” technologies are expected
to revolutionize our understanding of the microbial community, due to the heterogeneity of
microniches within a biofilm, particular attention should also be paid to transcriptomic analysis at
single cell resolution in order to identify cell-to-cell spatiotemporal variations. Furthermore, prior to
sequencing, hypothesis-driven research should be taken into consideration as it may allow more
efficient identification and verification of predictions generated by the large-scale data [216].
In parallel, the high-resolution microscopic approaches also continue to shed light on the physical
and structural properties of biofilms which enable the in situ investigation of cell attachment,
organization and succession within microbial communities. Nevertheless, the three-dimensional,
computer-based visualization and quantification of microbial communities in natural ecosystems are
still challenges because of the insufficient discrimination of different species and the limited
oligonucleotide probes available for various species. When reporter genes are applied, genetic
manipulation is also involved for the microorganism being studied which appears to be practically
infeasible for unknown species in nature, resulting in the restricted application of these methods to
only single species or simple mixed-species population. This, thus, calls for combining multiple
technologies or even combining interdisciplinary research efforts in biofilm science. Moreover, the
need to standardize experimental approaches, which would allow for more reliable and comparable
results, is also increasingly appreciated.
More attention is being given to multispecies biofilms than ever before, as evidenced by a surge of
publications in this field since 2003. While some molecular mechanisms underlying intra- and inter-
species interactions between individual strains have been clarified, mostly are only applicable to
dual-species biofilms, which is notably in contrast to the composition of biofilms in environmental
habitats. The biofilms in natural environment are much more complex entities than what we have
examined in the laboratory owing to the structural and physiological heterogeneity as well as the
extensive and striking interrelations between their components. And the coordinated behaviors of
biofilm have led to the idea that biofilm acts more like an orchestrated multicellular organism than a
collection of organisms. This view has been supported by the observation that the altruistic self-
sacrifice of the majority of the population when exposed to adverse conditions, such as programmed
cell death [217], could ultimately enhance the survival of the whole community [113], which
violates the principles of Darwinian evolution. This can be explained by the statement that Darwin’s
evolutionary theory focused intensely on one level of existence (organic species) while failing to
conceive the existence of multispecies communities and their potential role in the origin of species
[21]. However, objections are also raised to this fascinating analogy, mainly because upon their
decay, the biofilm cells can turn back to planktonic form in response to environmental signals in
contrast to the irreversible differentiation of the cells in a multicellular organism. Additionally,
whether the biofilm-specific genes that hierarchically regulate transition through specific stages in
37
biofilm formation have been identified successfully, is still be questioned [116]. Hence, the term
“biofilm phenotype” is commonly used rather than “biofilm genotype”. From another point of view,
[218]“city of microbes” was put forward to describe the association of microorganisms in biofilms,
where inhabitants select location, limit settlements of too many bacteria, store energy in
exopolysaccharide, transfer genetic material horizontally and communicate with their neighbors.
When conditions in the “city” are less comfortable, inhabitants migration occurs [218, 219]. In the
ecological context, the perception of biofilms as microbial landscapes has been proposed by Battin
TJ et al. [220] to emphasize the spatially explicit dimension and unify numerous facets of biofilms,
such as biodiversity, dynamics and ecosystem function.
In summary, multispecies biofilm provides a valuable model for testing ecological and evolutionary
theories relating to interspecies interactions. By integrating ecological and evolutionary frameworks
with the promising molecular technologies mentioned in this thesis, a genetic and biochemical
understanding of the interactions between biofilm landscape components and the operating
ecological process is supposed to be achieved, and thus helps us to manage biofilms to provide
services to society.

38
5 References 1. Kolenbrander PE, Palmer RJ, Periasamy S, Jakubovics NS (2010) Oral multispecies biofilm
development and the key role of cell–cell distance. Nature Reviews Microbiology 8: 471-480.
2. Costerton JW, Cheng K, Geesey GG, Ladd TI, Nickel JC, Dasgupta M, Marrie TJ (1987) Bacterial
biofilms in nature and disease. Annual Reviews in Microbiology 41: 435-464.
3. Donlan RM, Costerton JW (2002) Biofilms: survival mechanisms of clinically relevant
microorganisms. Clinical microbiology reviews 15: 167-193.
4. Costerton J, Stewart PS, Greenberg E (1999) Bacterial biofilms: a common cause of persistent
infections. Science 284: 1318-1322.
5. Potera C (1996) Biofilms invade microbiology. Science 273: 1795-1797.
6. Davey ME, O'toole GA (2000) Microbial biofilms: from ecology to molecular genetics.
Microbiology and molecular biology reviews 64: 847-867.
7. Almås ÅR, Mulder J, Bakken LR (2005) Trace metal exposure of soil bacteria depends on their
position in the soil matrix. Environmental science & technology 39: 5927-5932.
8. McKew BA, Taylor JD, McGenity TJ, Underwood GJ (2010) Resistance and resilience of benthic
biofilm communities from a temperate saltmarsh to desiccation and rewetting. The ISME journal 5:
30-41.
9. Matz C, Kjelleberg S (2005) Off the hook–how bacteria survive protozoan grazing. Trends in
microbiology 13: 302-307.
10. Stewart PS, William Costerton J (2001) Antibiotic resistance of bacteria in biofilms. The Lancet 358:
135-138.
11. Jesaitis AJ, Franklin MJ, Berglund D, Sasaki M, Lord CI, Bleazard JB, Duffy JE, Beyenal H,
Lewandowski Z (2003) Compromised host defense on Pseudomonas aeruginosa biofilms:
characterization of neutrophil and biofilm interactions. The Journal of Immunology 171: 4329-4339.
12. Jaffe A, Chabbert YA, Semonin O (1982) Role of porin proteins OmpF and OmpC in the permeation
of beta-lactams. Antimicrobial agents and chemotherapy 22: 942-948.
13. Roberson EB, Firestone MK (1992) Relationship between desiccation and exopolysaccharide
production in a soil Pseudomonas sp. Applied and Environmental Microbiology 58: 1284-1291.
14. Harrison JJ, Turner RJ, Ceri H (2005) Persister cells, the biofilm matrix and tolerance to metal
cations in biofilm and planktonic Pseudomonas aeruginosa. Environmental Microbiology 7: 981-
994.
15. Vuong C, Voyich JM, Fischer ER, Braughton KR, Whitney AR, DeLeo FR, Otto M (2004)
Polysaccharide intercellular adhesin (PIA) protects Staphylococcus epidermidis against major
components of the human innate immune system. Cellular microbiology 6: 269-275.
16. Evans D, Allison D, Brown M, Gilbert P (1991) Susceptibility of Pseudomonas aeruginosa and
Escherichia coli biofilms towards ciprofloxacin: effect of specific growth rate. Journal of
Antimicrobial Chemotherapy 27: 177-184.
17. Hengge-Aronis R (1996) Regulation of gene expression during entry into stationary phase.
Escherichia coli and Salmonella: cellular and molecular biology, 2nd ed ASM Press, Washington,
DC: 1497-1512.
18. Bagge N, Hentzer M, Andersen JB, Ciofu O, Givskov M, Høiby N (2004) Dynamics and spatial
distribution of β-lactamase expression in Pseudomonas aeruginosa biofilms. Antimicrobial agents
and chemotherapy 48: 1168-1174.
19. Matz C, Bergfeld T, Rice SA, Kjelleberg S (2004) Microcolonies, quorum sensing and cytotoxicity
determine the survival of Pseudomonas aeruginosa biofilms exposed to protozoan grazing.
Environmental microbiology 6: 218-226.
20. Lewis K (2001) Riddle of biofilm resistance. Antimicrobial agents and chemotherapy 45: 999-1007.
21. Queck SY, Weitere M, Moreno AM, Rice SA, Kjelleberg S (2006) The role of quorum sensing
mediated developmental traits in the resistance of Serratia marcescens biofilms against protozoan
grazing. Environmental microbiology 8: 1017-1025.
22. Hall-Stoodley L, Costerton JW, Stoodley P (2004) Bacterial biofilms: from the natural environment
to infectious diseases. Nature Reviews Microbiology 2: 95-108.
39
23. Torsvik V, Goksøyr J, Daae FL (1990) High diversity in DNA of soil bacteria. Applied and
environmental microbiology 56: 782-787.
24. Gans J, Wolinsky M, Dunbar J (2005) Computational improvements reveal great bacterial diversity
and high metal toxicity in soil. Science 309: 1387-1390.
25. Nunan N, Wu K, Young IM, Crawford JW, Ritz K (2003) Spatial distribution of bacterial
communities and their relationships with the micro-architecture of soil. FEMS Microbiology
Ecology 44: 203-215.
26. Sutherland IW (2001) The biofilm matrix–an immobilized but dynamic microbial environment.
Trends in microbiology 9: 222-227.
27. Chang W-S, van de Mortel M, Nielsen L, de Guzman GN, Li X, Halverson LJ (2007) Alginate
production by Pseudomonas putida creates a hydrated microenvironment and contributes to biofilm
architecture and stress tolerance under water-limiting conditions. Journal of bacteriology 189: 8290-
8299.
28. Lee S-E, Kim S-H, Lee J-U, Chon H-T (2013) Technical development of geomicrobiological
fixation of heavy metals in soils and sediments by biosorption and bioreduction-case histories in
Korea. EGU General Assembly Conference Abstracts, vol. 15, pp. 2702.
29. Sandoval-Carrasco CA, Ahuatzi-Chacón D, Galíndez-Mayer J, Ruiz-Ordaz N, Juárez-Ramírez C,
Martínez-Jerónimo F (2013) Biodegradation of a mixture of the herbicides ametryn, and 2, 4-
dichlorophenoxyacetic acid (2, 4-D) in a compartmentalized biofilm reactor. Bioresource technology
145: 33-36.
30. Walker TS, Bais HP, Déziel E, Schweizer HP, Rahme LG, Fall R, Vivanco JM (2004) Pseudomonas
aeruginosa-plant root interactions. Pathogenicity, biofilm formation, and root exudation. Plant
physiology 134: 320-331.
31. Ekelund F, Rønn R (1994) Notes on protozoa in agricultural soil with emphasis on heterotrophic
flagellates and naked amoebae and their ecology. FEMS Microbiology Reviews 15: 321-353.
32. Marsh PD (2006) Dental plaque as a biofilm and a microbial community–implications for health and
disease. BMC Oral Health 6: S14.
33. Suppiger A, Schmid N, Aguilar C, Pessi G, Eberl L (2013) Two quorum sensing systems control
biofilm formation and virulence in members of the Burkholderia cepacia complex. Virulence 4: 19-
18.
34. Huber B, Riedel K, Hentzer M, Heydorn A, Gotschlich A, Givskov M, Molin S, Eberl L (2001) The
cep quorum-sensing system of Burkholderia cepacia H111 controls biofilm formation and swarming
motility. Microbiology 147: 2517-2528.
35. Schmid N, Pessi G, Deng Y, Aguilar C, Carlier AL, Grunau A, Omasits U, Zhang L-H, Ahrens CH,
Eberl L (2012) The AHL-and BDSF-dependent Quorum sensing systems control specific and
overlapping sets of genes in Burkholderia cenocepacia H111. PloS one 7: e49966.
36. Savage VJ, Chopra I, O'Neill AJ (2013) Staphylococcus aureus biofilms promote horizontal transfer
of antibiotic resistance. Antimicrobial agents and chemotherapy 57: 1968-1970.
37. Martínez JL (2008) Antibiotics and antibiotic resistance genes in natural environments. Science 321:
365-367.
38. Forsberg KJ, Reyes A, Wang B, Selleck EM, Sommer MO, Dantas G (2012) The shared antibiotic
resistome of soil bacteria and human pathogens. Science 337: 1107-1111.
39. Seneviratne G, Kecskés ML, Kennedy IR (2008) Biofilmed biofertilisers: novel inoculants for
efficient nutrient use in plants. In: Kennedy, I.R., Choudhury, A.T.M.A., Kecskés, M.L., Rose, M.T.
(Eds.), Efficient Nutrient Use in Rice Production in Vietnam Achieved Using Inoculant Biofertilisers.
Proceedings of a Project (SMCN/2002/073) Workshop Held in Hanoi, Vietnam, 12e13 October 2007.
ACIAR Proceedings No. 130, Canberra, pp. 126e130.
40. Bianciotto V, Bonfante P (2002) Arbuscular mycorrhizal fungi: a specialised niche for rhizospheric
and endocellular bacteria. Antonie van Leeuwenhoek 81: 365-371.
41. Seneviratne G, Zavahir J, Bandara W, Weerasekara M (2008) Fungal-bacterial biofilms: their
development for novel biotechnological applications. World Journal of Microbiology and
Biotechnology 24: 739-743.

40
42. Jayasinghearachchi H, Seneviratae G (2010) A Mushroom-fungus helps improve endophytic
colonization of tomato by Pseudomonas fluorescens through biofilm formation. Research Journal of
Microbiology 5: 689-695.
43. Jayasinghearachchi H, Seneviratne G (2004) A bradyrhizobial-Penicillium spp. biofilm with
nitrogenase activity improves N2 fixing symbiosis of soybean. Biology and fertility of soils 40: 432-
434.
44. LoVLEY DR, Klug MJ (1986) Model for the distribution of sulfate reduction and methanogenesis in
freshwater sediments. Geochimica et Cosmochimica Acta 50: 11-18.
45. Stewart PS, Franklin MJ (2008) Physiological heterogeneity in biofilms. Nature Reviews
Microbiology 6: 199-210.
46. Matz C (2011) Competition, Communication, Cooperation: Molecular Crosstalk in Multi-species
BiofilmsBiofilm Highlights. In: Flemming, H.-C., Wingender, J., Szewzyk, U. (Eds.), Biofilm
Highlight. Springer Series on Biofilms, vol. 5. Springer-Verlag Berlin, Heidelberg, pp. 29-40.
47. Rickard AH, Gilbert P, High NJ, Kolenbrander PE, Handley PS (2003) Bacterial coaggregation: an
integral process in the development of multi-species biofilms. Trends in microbiology 11: 94-100.
48. Kolenbrander PE, Andersen RN, Blehert DS, Egland PG, Foster JS, Palmer RJ (2002)
Communication among oral bacteria. Microbiology and molecular biology reviews 66: 486-505.
49. Klayman BJ, Volden PA, Stewart PS, Camper AK (2009) Escherichia coli O157: H7 requires
colonizing partner to adhere and persist in a capillary flow cell. Environmental science & technology
43: 2105-2111.
50. Bradshaw DJ, Marsh PD, Watson GK, Allison C (1998) Role of Fusobacterium nucleatum and
coaggregation in anaerobe survival in planktonic and biofilm oral microbial communities during
aeration. Infection and immunity 66: 4729-4732.
51. Gilbert P, Maira-Litran T, McBain AJ, Rickard AH, Whyte FW (2002) The physiology and
collective recalcitrance of microbial biofilm communities. Advances in microbial physiology 46:
203-256.
52. Adam B, Baillie GS, DOUGLAS LJ (2002) Mixed species biofilms of Candida albicans and
Staphylococcus epidermidis. Journal of medical microbiology 51: 344-349.
53. Boonchan S, Britz ML, Stanley GA (2000) Degradation and mineralization of high-molecular-
weight polycyclic aromatic hydrocarbons by defined fungal-bacterial cocultures. Applied and
Environmental Microbiology 66: 1007-1019.
54. Farabegoli G, Chiavola A, Rolle E (2008) Remediation of chlorophenol-and phenol-contaminated
groundwater by a sequencing batch biofilm reactor. Water Science and Technology 58: 295–301.
55. Flemming H-C, Wingender J (2010) The biofilm matrix. Nature Reviews Microbiology 8: 623-633.
56. Richard G, Burns, Richard P. Dick (2002) Microbes and Enzymes in Biofilms. Enzymes in the
Environment: Activity, Ecology, and Applications 86: 307.
57. Jakubovics NS, Gill SR, Iobst SE, Vickerman M, Kolenbrander PE (2008) Regulation of gene
expression in a mixed-genus community: stabilized arginine biosynthesis in Streptococcus gordonii
by coaggregation with Actinomyces naeslundii. Journal of bacteriology 190: 3646-3657.
58. Parsek MR, Greenberg E (2005) Sociomicrobiology: the connections between quorum sensing and
biofilms. Trends in microbiology 13: 27-33.
59. Häussler S, Parsek MR (2010) Biofilms 2009: new perspectives at the heart of surface-associated
microbial communities. Journal of bacteriology 192: 2941-2949.
60. Riedel K, Hentzer M, Geisenberger O, Huber B, Steidle A, Wu H, Høiby N, Givskov M, Molin S,
Eberl L (2001) N-acylhomoserine-lactone-mediated communication between Pseudomonas
aeruginosa and Burkholderia cepacia in mixed biofilms. Microbiology 147: 3249-3262.
61. Eberl L, Tümmler B (2004) Pseudomonas aeruginosa and Burkholderia cepacia in cystic fibrosis:
genome evolution, interactions and adaptation. International journal of medical microbiology 294:
123-131.
62. Leadbetter JR, Greenberg E (2000) Metabolism of acyl-homoserine lactone quorum-sensing signals
by Variovorax paradoxus. Journal of Bacteriology 182: 6921-6926.
41
63. Liu X, Jia J, Popat R, Ortori CA, Li J, Diggle SP, Gao K, Cámara M (2011) Characterisation of two
quorum sensing systems in the endophytic Serratia plymuthica strain G3: differential control of
motility and biofilm formation according to life-style. BMC microbiology 11: 26.
64. De Kievit T (2009) Quorum sensing in Pseudomonas aeruginosa biofilms. Environmental
microbiology 11: 279-288.
65. Suntharalingam P, Cvitkovitch DG (2005) Quorum sensing in streptococcal biofilm formation.
Trends in microbiology 13: 3-6.
66. Saito Y, Fujii R, Nakagawa KI, Kuramitsu H, Okuda K, Ishihara K (2008) Stimulation of
Fusobacterium nucleatum biofilm formation by Porphyromonas gingivalis. Oral microbiology and
immunology 23: 1-6.
67. Jang Y-J, Sim J, Jun H-K, Choi B-K (2013) Differential effect of autoinducer 2 of Fusobacterium
nucleatum on oral streptococci. Archives of oral biology 58: 1594-1602.
68. Schauder S, Bassler BL (2001) The languages of bacteria. Genes & Development 15: 1468-1480.
69. Reading NC, Sperandio V (2006) Quorum sensing: the many languages of bacteria. FEMS
microbiology letters 254: 1-11.
70. Deng Y, Wu Je, Eberl L, Zhang L-H (2010) Structural and functional characterization of diffusible
signal factor family quorum-sensing signals produced by members of the Burkholderia cepacia
complex. Applied and environmental microbiology 76: 4675-4683.
71. Davies DG, Marques CN (2009) A fatty acid messenger is responsible for inducing dispersion in
microbial biofilms. Journal of bacteriology 191: 1393-1403.
72. Ryan RP, Dow JM (2011) Communication with a growing family: diffusible signal factor (DSF)
signaling in bacteria. Trends in microbiology 19: 145-152.
73. Boon C, Deng Y, Wang L-H, He Y, Xu J-L, Fan Y, Pan SQ, Zhang L-H (2007) A novel DSF-like
signal from Burkholderia cenocepacia interferes with Candida albicans morphological transition.
The ISME journal 2: 27-36.
74. Ryan RP, Fouhy Y, Garcia BF, Watt SA, Niehaus K, Yang L, Tolker‐Nielsen T, Dow JM (2008)
Interspecies signalling via the Stenotrophomonas maltophilia diffusible signal factor influences
biofilm formation and polymyxin tolerance in Pseudomonas aeruginosa. Molecular microbiology 68:
75-86.
75. Keller L, Surette MG (2006) Communication in bacteria: an ecological and evolutionary perspective.
Nature Reviews Microbiology 4: 249-258.
76. West SA, Winzer K, Gardner A, Diggle SP (2012) Quorum sensing and the confusion about
diffusion. Trends in microbiology 20: 586-594.
77. Hense BA, Kuttler C, Müller J, Rothballer M, Hartmann A, Kreft J-U (2007) Does efficiency
sensing unify diffusion and quorum sensing? Nature Reviews Microbiology 5: 230-239.
78. Tischler AD, Camilli A (2004) Cyclic diguanylate (c‐di‐GMP) regulates Vibrio cholerae biofilm
formation. Molecular microbiology 53: 857-869.
79. Beyhan S, Odell LS, Yildiz FH (2008) Identification and characterization of cyclic diguanylate
signaling systems controlling rugosity in Vibrio cholerae. Journal of bacteriology 190: 7392-7405.
80. Waters CM, Lu W, Rabinowitz JD, Bassler BL (2008) Quorum sensing controls biofilm formation in
Vibrio cholerae through modulation of cyclic di-GMP levels and repression of vpsT. Journal of
bacteriology 190: 2527-2536.
81. Caiazza NC, Merritt JH, Brothers KM, O'Toole GA (2007) Inverse regulation of biofilm formation
and swarming motility by Pseudomonas aeruginosa PA14. Journal of bacteriology 189: 3603-3612.
82. Newell PD, Monds RD, O'Toole GA (2009) LapD is a bis-(3′, 5′)-cyclic dimeric GMP-binding
protein that regulates surface attachment by Pseudomonas fluorescens Pf0–1. Proceedings of the
National Academy of Sciences 106: 3461-3466.
83. Tribble GD, Rigney TW, Dao D-HV, Wong CT, Kerr JE, Taylor BE, Pacha S, Kaplan HB (2012)
Natural competence is a major mechanism for horizontal DNA transfer in the oral pathogen
Porphyromonas gingivalis. MBio 3.
84. Wang B, Chi B, Kuramitsu H (2002) Genetic exchange between Treponema denticola and
Streptococcus gordonii in biofilms. Oral microbiology and immunology 17: 108-112.
42
85. Case RJ, Labbate M, Kjelleberg S (2008) AHL-driven quorum-sensing circuits: their frequency and
function among the Proteobacteria. The ISME journal 2: 345-349.
86. Huang Y, Zeng Y, Yu Z, Zhang J, Feng H, Lin X (2013) In silico and experimental methods
revealed highly diverse bacteria with quorum sensing and aromatics biodegradation systems-a
potential broad application on bioremediation. Bioresource technology 148: 311-316.
87. Burmølle M, Bahl MI, Jensen LB, Sørensen SJ, Hansen LH (2008) Type 3 fimbriae, encoded by the
conjugative plasmid pOLA52, enhance biofilm formation and transfer frequencies in
Enterobacteriaceae strains. Microbiology 154: 187-195.
88. Ma H, Bryers JD (2013) Non-invasive determination of conjugative transfer of plasmids bearing
antibiotic-resistance genes in biofilm-bound bacteria: effects of substrate loading and antibiotic
selection. Applied microbiology and biotechnology 97: 317-328.
89. Ehrlich GD, Ahmed A, Earl J, Hiller NL, Costerton JW, Stoodley P, Post JC, DeMeo P, Hu FZ
(2010) The distributed genome hypothesis as a rubric for understanding evolution in situ during
chronic bacterial biofilm infectious processes. FEMS Immunology & Medical Microbiology 59:
269-279.
90. Ghigo J-M (2001) Natural conjugative plasmids induce bacterial biofilm development. Nature 412:
442-445.
91. Schwering M, Song J, Louie M, Turner RJ, Ceri H (2013) Multi-species biofilms defined from
drinking water microorganisms provide increased protection against chlorine disinfection.
Biofouling 29: 917-928.
92. Lee KWK, Periasamy S, Mukherjee M, Xie C, Kjelleberg S, Rice SA (2013) Biofilm development
and enhanced stress resistance of a model, mixed-species community biofilm. The ISME Journal 1-
14.
93. Kreth J, Merritt J, Shi W, Qi F (2005) Competition and coexistence between Streptococcus mutans
and Streptococcus sanguinis in the dental biofilm. Journal of bacteriology 187: 7193-7203.
94. Rao D, Webb JS, Kjelleberg S (2005) Competitive interactions in mixed-species biofilms containing
the marine bacterium Pseudoalteromonas tunicata. Applied and environmental microbiology 71:
1729-1736.
95. Costa R, Gomes N, Krögerrecklenfort E, Opelt K, Berg G, Smalla K (2007) Pseudomonas
community structure and antagonistic potential in the rhizosphere: insights gained by combining
phylogenetic and functional gene‐based analyses. Environmental microbiology 9: 2260-2273.
96. Tait K, Sutherland I (2002) Antagonistic interactions amongst bacteriocin‐producing enteric bacteria
in dual species biofilms. Journal of applied microbiology 93: 345-352.
97. Foster KR, Bell T (2012) Competition, not cooperation, dominates interactions among culturable
microbial species. Current Biology 22: 1845-1850.
98. Molina L, Constantinescu F, Michel L, Reimmann C, Duffy B, Défago G (2003) Degradation of
pathogen quorum‐sensing molecules by soil bacteria: a preventive and curative biological control
mechanism. FEMS Microbiology Ecology 45: 71-81.
99. Peleg AY, Tampakakis E, Fuchs BB, Eliopoulos GM, Moellering RC, Mylonakis E (2008)
Prokaryote–eukaryote interactions identified by using Caenorhabditis elegans. Proceedings of the
National Academy of Sciences 105: 14585-14590.
100. West SA, Diggle SP, Buckling A, Gardner A, Griffin AS (2007) The social lives of microbes. Annu
Rev Ecol Evol Syst 38: 53-77.
101. Jass J, Surman S, Walker JT (2003) Medical biofilms. In: J. Jass, S. Surman, J. Walker (Eds.), pp.
51–72.
102. Kuenen J, Robertson LA, van Gemerden H (1985) Microbial interactions among aerobic and
anaerobic sulfur-oxidizing bacteria. Adv Microb Ecol 8: 1-59.
103. Clark F (1969) Ecological associations among soil micro-organisms. In Soil Biology 125-161.
104. Park D (1960) Antagonism—the background to soil fungi. The ecology of soil fungi: 148-159.
105. Burmølle M, Ren D, Bjarnsholt T, Sørensen SJ (2013) Interactions in multispecies biofilms: do they
actually matter? Trends in microbiology. doi: 10.1016/j.tim.2013.12.004
106. Hansen SK, Rainey PB, Haagensen JA, Molin S (2007) Evolution of species interactions in a biofilm
community. Nature 445: 533-536.

43
107. Ren D, Madsen JS, de la Cruz-Perera CI, Bergmark L, Sørensen SJ, Burmølle M (2013) High-
Throughput Screening of Multispecies Biofilm Formation and Quantitative PCR-Based Assessment
of Individual Species Proportions, Useful for Exploring Interspecific Bacterial Interactions.
Microbial ecology. doi: 10.1007/s00248-013-0315-z
108. Mitri S, Foster K (2013) A Genotypic View of Social Interactions in Microbial Communities.
Annual review of genetics 47: 247-273.
109. Nadell CD, Xavier JB, Foster KR (2009) The sociobiology of biofilms. FEMS microbiology reviews
33: 206-224.
110. West SA, Griffin AS, Gardner A, Diggle SP (2006) Social evolution theory for microorganisms.
Nature Reviews Microbiology 4: 597-607.
111. Zhang W, Sileika T, Packman AI (2013) Effects of fluid flow conditions on interactions between
species in biofilms. FEMS microbiology ecology 2: 344-354.
112. Nadell CD, Foster KR, Xavier JB (2010) Emergence of spatial structure in cell groups and the
evolution of cooperation. PLoS computational biology 6: e1000716.
113. Kreft J-U (2004) Biofilms promote altruism. Microbiology 150: 2751-2760.
114. Kelvin LKW (2013) Role of cell-cell signaling, differentiation and fitness in multi-species biofilms.
Dissertation, Nanyang Technologial University.
115. Morris JJ, Lenski RE, Zinser ER (2012) The Black Queen Hypothesis: evolution of dependencies
through adaptive gene loss. MBio 3 doi: 10.1128/mBio.00036–12
116. Monds RD, O’Toole GA (2009) The developmental model of microbial biofilms: ten years of a
paradigm up for review. Trends in microbiology 17: 73-87.
117. Schink B (2002) Synergistic interactions in the microbial world. Antonie Van Leeuwenhoek 81:
257-261.
118. Bakke R, Trulear M, Robinson J, Characklis W (1984) Activity of Pseudomonas aeruginosa in
biofilms: steady state. Biotechnology and bioengineering 26: 1418-1424.
119. Nickel J, Wright J, Ruseska I, Marrie T, Whitfield C, Costerton J (1985) Antibiotic resistance of
Pseudomonas aeruginosa colonizing a urinary catheter in vitro. European journal of clinical
microbiology 4: 213-218.
120. Kharazmi A, Giwercman B, Høiby N (1999) Robbins device in biofilm research. Methods in
enzymology 310: 207-215.
121. Stepanović S, Vuković D, Dakić I, Savić B, Švabić-Vlahović M (2000) A modified microtiter-plate
test for quantification of staphylococcal biofilm formation. Journal of Microbiological Methods 40:
175-179.
122. Harrison J, Turner R, Ceri H (2005) High-throughput metal susceptibility testing of microbial
biofilms. BMC microbiology 5: 53.
123. Bragança S, Azevedo N, Simões LC, Keevil C, Vieira M (2006) Use of fluorescent in situ
hybridization for the visualization of Helicobacter pylori in real drinking water biofilms. Water
Science and Technology 55:387–393.
124. Chavant P, Gaillard-Martinie B, Talon R, Hébraud M, Bernardi T (2007) A new device for rapid
evaluation of biofilm formation potential by bacteria. Journal of microbiological methods 68: 605-
612.
125. Silagyi K, Kim S-H, Martin Lo Y, Wei C-i (2009) Production of biofilm and quorum sensing by
Escherichia coli O157: H7 and its transfer from contact surfaces to meat, poultry, ready-to-eat deli,
and produce products. Food microbiology 26: 514-519.
126. Min K, Rickard A (2009) Coaggregation by the freshwater bacterium Sphingomonas natatoria alters
dual-species biofilm formation. Applied and environmental microbiology 75: 3987-3997.
127. Ceri H, Olson M, Stremick C, Read R, Morck D, Buret A (1999) The Calgary Biofilm Device: new
technology for rapid determination of antibiotic susceptibilities of bacterial biofilms. Journal of
clinical microbiology 37: 1771-1776.
128. Harrison JJ, Ceri H, Yerly J, Stremick CA, Hu Y, Martinuzzi R, Turner RJ (2006) The use of
microscopy and three-dimensional visualization to evaluate the structure of microbial biofilms
cultivated in the Calgary Biofilm Device. Biological procedures online 8: 194-215.
44
129. Schubotz F, Meyer‐Dombard D, Bradley A, Fredricks H, Hinrichs KU, Shock E, Summons R (2013)
Spatial and temporal variability of biomarkers and microbial diversity reveal metabolic and
community flexibility in Streamer Biofilm Communities in the Lower Geyser Basin, Yellowstone
National Park. Geobiology 11: 549-569.
130. Zhu Y, Dashper SG, Chen Y-Y, Crawford S, Slakeski N, Reynolds EC (2013) Porphyromonas
gingivalis and Treponema denticola Synergistic Polymicrobial Biofilm Development. PloS one 8:
e71727.
131. Wagner M (2009) Single-cell ecophysiology of microbes as revealed by Raman microspectroscopy
or secondary ion mass spectrometry imaging. Annual review of microbiology 63: 411-429.
132. Benoit MR, Conant CG, Ionescu-Zanetti C, Schwartz M, Matin A (2010) New device for high-
throughput viability screening of flow biofilms. Applied and environmental microbiology 76: 4136-
4142.
133. Livak KJ, Flood S, Marmaro J, Giusti W, Deetz K (1995) Oligonucleotides with fluorescent dyes at
opposite ends provide a quenched probe system useful for detecting PCR product and nucleic acid
hybridization. Genome Research 4: 357-362.
134. Smith CJ, Nedwell DB, Dong LF, Osborn AM (2007) Diversity and abundance of nitrate reductase
genes (narG and napA), nitrite reductase genes (nirS and nrfA), and their transcripts in estuarine
sediments. Applied and environmental microbiology 73: 3612-3622.
135. Baldwin BR, Nakatsu CH, Nies L (2003) Detection and enumeration of aromatic oxygenase genes
by multiplex and real-time PCR. Applied and Environmental Microbiology 69: 3350-3358.
136. Kutyavin IV, Afonina IA, Mills A, Gorn VV, Lukhtanov EA, Belousov ES, Singer MJ, Walburger
DK, Lokhov SG, Gall AA (2000) 3′-minor groove binder-DNA probes increase sequence specificity
at PCR extension temperatures. Nucleic Acids Research 28: 655-661.
137. Maeda H, Fujimoto C, Haruki Y, Maeda T, Kokeguchi S, Petelin M, Arai H, Tanimoto I, Nishimura
F, Takashiba S (2003) Quantitative real‐time PCR using TaqMan and SYBR Green for
Actinobacillus actinomycetemcomitans, Porphyromonas gingivalis, Prevotella intermedia, tetQ gene
and total bacteria. FEMS Immunology & Medical Microbiology 39: 81-86.
138. Sha Q, Vattem DA, Forstner MR, Hahn D (2013) Quantifying Salmonella population dynamics in
water and biofilms. Microbial ecology 65: 60-67.
139. Zhang L, Fritsch M, Hammond L, Landreville R, Slatculescu C, Colavita A, Mah T-F (2013)
Identification of Genes Involved in Pseudomonas aeruginosa Biofilm-Specific Resistance to
Antibiotics. PloS one 8: e61625.
140. Pan Y, Breidt F (2007) Enumeration of viable Listeria monocytogenes cells by real-time PCR with
propidium monoazide and ethidium monoazide in the presence of dead cells. Applied and
environmental microbiology 73: 8028-8031.
141. Chen NT, Chang CW (2010) Rapid quantification of viable legionellae in water and biofilm using
ethidium monoazide coupled with real‐time quantitative PCR. Journal of applied microbiology 109:
623-634.
142. Àlvarez G, González M, Isabal S, Blanc V, León R (2013) Method to quantify live and dead cells in
multi-species oral biofilm by real-time PCR with propidium monoazide. AMB Express 3: 1-8.
143. Lenz AP, Williamson KS, Pitts B, Stewart PS, Franklin MJ (2008) Localized gene expression in
Pseudomonas aeruginosa biofilms. Applied and environmental microbiology 74: 4463-4471.
144. Martin-Laurent F, Philippot L, Hallet S, Chaussod R, Germon J, Soulas G, Catroux G (2001) DNA
extraction from soils: old bias for new microbial diversity analysis methods. Applied and
environmental microbiology 67: 2354-2359.
145. Love JL, Scholes P, Gilpin B, Savill M, Lin S, Samuel L (2006) Evaluation of uncertainty in
quantitative real-time PCR. Journal of microbiological methods 67: 349-356.
146. Smith CJ, Osborn AM (2009) Advantages and limitations of quantitative PCR (Q‐PCR)‐based
approaches in microbial ecology. FEMS microbiology ecology 67: 6-20.
147. Smith CJ, Nedwell DB, Dong LF, Osborn AM (2006) Evaluation of quantitative polymerase chain
reaction‐based approaches for determining gene copy and gene transcript numbers in environmental
samples. Environmental Microbiology 8: 804-815.
45
148. Lo A, Seers C, Boyce J, Dashper S, Slakeski N, Lissel JP, Reynolds E (2009) Comparative
transcriptomic analysis of Porphyromonas gingivalis biofilm and planktonic cells. BMC
microbiology 9: 18.
149. Shemesh M, Tam A, Steinberg D (2007) Differential gene expression profiling of Streptococcus
mutans cultured under biofilm and planktonic conditions. Microbiology 153: 1307-1317.
150. Shendure J (2008) The beginning of the end for microarrays? Nature Methods 5: 585-587.
151. Febrer M, McLay K, Caccamo M, Twomey KB, Ryan RP (2011) Advances in bacterial
transcriptome and transposon insertion-site profiling using second-generation sequencing. Trends in
biotechnology 29: 586-594.
152. Wang Z, Gerstein M, Snyder M (2009) RNA-Seq: a revolutionary tool for transcriptomics. Nature
Reviews Genetics 10: 57-63.
153. Nagalakshmi U, Wang Z, Waern K, Shou C, Raha D, Gerstein M, Snyder M (2008) The
transcriptional landscape of the yeast genome defined by RNA sequencing. Science 320: 1344-1349.
154. Dötsch A, Eckweiler D, Schniederjans M, Zimmermann A, Jensen V, Scharfe M, Geffers R,
Häussler S (2012) The Pseudomonas aeruginosa transcriptome in planktonic cultures and static
biofilms using RNA sequencing. PloS one 7: e31092.
155. Frias-Lopez J, Duran-Pinedo A (2012) Effect of periodontal pathogens on the metatranscriptome of
a healthy multispecies biofilm model. Journal of bacteriology 194: 2082-2095.
156. Yoder-Himes D, Chain P, Zhu Y, Wurtzel O, Rubin E, Tiedje JM, Sorek R (2009) Mapping the
Burkholderia cenocepacia niche response via high-throughput sequencing. Proceedings of the
National Academy of Sciences 106: 3976-3981.
157. Sittka A, Lucchini S, Papenfort K, Sharma CM, Rolle K, Binnewies TT, Hinton JC, Vogel J (2008)
Deep sequencing analysis of small noncoding RNA and mRNA targets of the global post-
transcriptional regulator, Hfq. PLoS genetics 4: e1000163.
158. Sharma CM, Hoffmann S, Darfeuille F, Reignier J, Findeiß S, Sittka A, Chabas S, Reiche K,
Hackermüller J, Reinhardt R (2010) The primary transcriptome of the major human pathogen
Helicobacter pylori. Nature 464: 250-255.
159. Wilmes P, Bond PL (2004) The application of two‐dimensional polyacrylamide gel electrophoresis
and downstream analyses to a mixed community of prokaryotic microorganisms. Environmental
Microbiology 6: 911-920.
160. Azevedo NF, Lopes SP, Keevil CW, Pereira MO, Vieira MJ (2009) Time to “go large” on biofilm
research: advantages of an omics approach. Biotechnology letters 31: 477-485.
161. Posch T, Jezbera J, Vrba J, Šimek K, Pernthaler J, Andreatta S, Sonntag B (2001) Size selective
feeding in Cyclidium glaucoma (Ciliophora, Scuticociliatida) and its effects on bacterial community
structure: a study from a continuous cultivation system. Microbial ecology 42: 217-227.
162. Monger BC, Landry MR, Brown SL (1999) Feeding selection of heterotrophic marine
nanoflagellates based on the surface hydrophobicity of their picoplankton prey. Limnology and
oceanography 44: 1917-1927.
163. Matz C, Jürgens K (2005) High motility reduces grazing mortality of planktonic bacteria. Applied
and environmental microbiology 71: 921-929.
164. Hahn M, Moore E, Höfle M (2000) Role of microcolony formation in the protistan grazing defense
of the aquatic bacterium Pseudomonas sp. MWH1. Microbial ecology 39: 175-185.
165. Shannon SP, Chrzanowski TH, Grover JP (2007) Prey food quality affects flagellate ingestion rates.
Microbial ecology 53: 66-73.
166. Pedersen AL, Nybroe O, Winding A, Ekelund F, Bjørnlund L (2009) Bacterial feeders, the nematode
Caenorhabditis elegans and the flagellate Cercomonas longicauda, have different effects on
outcome of competition among the Pseudomonas biocontrol strains CHA0 and DSS73. Microbial
ecology 57: 501-509.
167. Jousset A, Lara E, Wall LG, Valverde C (2006) Secondary metabolites help biocontrol strain
Pseudomonas fluorescens CHA0 to escape protozoan grazing. Applied and environmental
microbiology 72: 7083-7090.

46
168. Matz C, Deines P, Boenigk J, Arndt H, Eberl L, Kjelleberg S, Jürgens K (2004) Impact of violacein-
producing bacteria on survival and feeding of bacterivorous nanoflagellates. Applied and
environmental microbiology 70: 1593-1599.
169. Hahn MW, Höfle MG (2001) Grazing of protozoa and its effect on populations of aquatic bacteria.
FEMS Microbiology Ecology 35: 113-121.
170. Jürgens K, Güde H (1994) The potential importance of grazing-resistant bacteria in planktonic
systems. Marine ecology progress series Oldendorf 112: 169-188.
171. Rønn R, McCaig AE, Griffiths BS, Prosser JI (2002) Impact of protozoan grazing on bacterial
community structure in soil microcosms. Applied and Environmental Microbiology 68: 6094-6105.
172. Iriberri J, Azua I, Labirua‐Iturburu A, Artolozaga I, Barcina I (1994) Differential elimination of
enteric bacteria by protists in a freshwater system. Journal of Applied Microbiology 77: 476-483.
173. Weekers PH, Bodelier PL, Wijen JP, Vogels GD (1993) Effects of grazing by the free-living soil
amoebae Acanthamoeba castellanii, Acanthamoeba polyphaga, and Hartmannella vermiformis on
various bacteria. Applied and environmental microbiology 59: 2317-2319.
174. Singh B (1941) Selectivity in bacterial food by soil amoebae in pure mixed culture and in sterilized
soil. Annals of Applied Biology 28: 52-64.
175. Groscop JA, Brent MM (1964) The effects of selected strains of pigmented microorganisms on small
free-living amoebae. Canadian journal of microbiology 10: 579-584.
176. Gurijala KR, Alexander M (1990) Effect of growth rate and hydrophobicity on bacteria surviving
protozoan grazing. Applied and environmental microbiology 56: 1631-1635.
177. Sinclair JL, Alexander M (1989) Effect of protozoan predation on relative abundance of fast-and
slow-growing bacteria. Canadian Journal of microbiology 35: 578-582.
178. Petropoulos P, Gilbride KA (2005) Nitrification in activated sludge batch reactors is linked to
protozoan grazing of the bacterial population. Canadian journal of microbiology 51: 791-799.
179. Šimek K, Pernthaler J, Weinbauer MG, Horn k K, Dolan JR, Nedoma J, Ma n M, Amann R (2001)
Changes in bacterial community composition and dynamics and viral mortality rates associated with
enhanced flagellate grazing in a mesoeutrophic reservoir. Applied and environmental microbiology
67: 2723-2733.
180. Fenchel T (1987) Ecology of protozoa: the biology of free-living phagotrophic protists. . In: Brock
TD (ed) Brock/Springer series in contemporary bioscience. Science and Technology, Madison, WI.
181. Erken M, Farrenschon N, Speckmann S, Arndt H, Weitere M (2012) Quantification of individual
flagellate-bacteria interactions within semi-natural biofilms. Protist 163: 632-642.
182. Weitere M, Bergfeld T, Rice SA, Matz C, Kjelleberg S (2005) Grazing resistance of Pseudomonas
aeruginosa biofilms depends on type of protective mechanism, developmental stage and protozoan
feeding mode. Environmental microbiology 7: 1593-1601.
183. Arndt H, Schmidt-Denter K, Auer B, Weitere M (2003) Protozoans and biofilms. In Fossil and
Recent Biofilms. Krumbein, W.E., Paterson, D.M., and Zavarzin, G.A., (eds). Dordrecht: Kluwer
Academic Publishers, in press.
184. Joubert L-M, Wolfaardt G, Botha A (2006) Microbial exopolymers link predator and prey in a model
yeast biofilm system. Microbial ecology 52: 187-197.
185. Friman V-P, Diggle SP, Buckling A (2013) Protist predation can favour cooperation within bacterial
species. Biology letters 9: 20130548.
186. Sun S, Kjelleberg S, McDougald D (2013) Relative contributions of Vibrio polysaccharide and
quorum sensing to the resistance of Vibrio cholerae to predation by heterotrophic protists. PloS one
8: e56338.
187. Wey JK, Scherwass A, Norf H, Arndt H, Weitere M (2008) Effects of protozoan grazing within river
biofilms under semi-natural conditions. Aquatic Microbial Ecology 52: 283.
188. Rychert K, Neu TR (2010) Protozoan impact on bacterial biofilm formation. Biological Letters 47:
3-10.
189. Cole JJ (1999) Aquatic microbiology for ecosystem scientists: new and recycled paradigms in
ecological microbiology. Ecosystems 2: 215-225.
47
190. Pernthaler J, Posch T, Simek K, Vrba J, Amann R, Psenner R (1997) Contrasting bacterial strategies
to coexist with a flagellate predator in an experimental microbial assemblage. Applied and
Environmental Microbiology 63: 596-601.
191. Sieburth J, Davis P (1982) The role of heterotrophic nanoplankton in the grazing and nurturing of
planktonic bacteria in the Sargasso and Caribbean Seas. Ann Inst Oceanogr 58: 285-296.
192. Sherr BF, Sherr EB, Andrew TL, Fallon RD, Newell SY (1986) Trophic interactions between
heterotrophic protozoa and bacterioplankton in estuarine water analyzed with selective metabolic
inhibitors. Marine Ecology-Progress Series 32: 169-179.
193. Matz C, Webb JS, Schupp PJ, Phang SY, Penesyan A, Egan S, Steinberg P, Kjelleberg S (2008)
Marine biofilm bacteria evade eukaryotic predation by targeted chemical defense. PloS one 3: e2744.
194. Zubkov MV, Sleigh MA (2000) Comparison of growth efficiencies of protozoa growing on bacteria
deposited on surfaces and in suspension. Journal of Eukaryotic Microbiology 47: 62-69.
195. Jackson S, Jones E (1991) Interactions within biofilms: the disruption of biofilm structure by
protozoa. Kieler Meeresforsch 8: 264-268.
196. Pedersen K (1982) Factors regulating microbial biofilm development in a system with slowly
flowing seawater. Applied and environmental microbiology 44: 1196-1204.
197. Wolfaardt G, Lawrence J, Headley J, Robarts R, Caldwell D (1994) Microbial exopolymers provide
a mechanism for bioaccumulation of contaminants. Microbial ecology 27: 279-291.
198. Huws S, McBain A, Gilbert P (2005) Protozoan grazing and its impact upon population dynamics in
biofilm communities. Journal of applied microbiology 98: 238-244.
199. Dopheide A, Lear G, Stott R, Lewis G (2011) Preferential feeding by the ciliates Chilodonella and
Tetrahymena spp. and effects of these protozoa on bacterial biofilm structure and composition.
Applied and environmental microbiology 77: 4564-4572.
200. Brown MR, Barker J (1999) Unexplored reservoirs of pathogenic bacteria: protozoa and biofilms.
Trends in microbiology 7: 46-50.
201. Cirillo JD, Falkow S, Tompkins LS (1994) Growth of Legionella pneumophila in Acanthamoeba
castellanii enhances invasion. Infection and immunity 62: 3254-3261.
202. Cirillo JD, Falkow S, Tompkins LS, Bermudez LE (1997) Interaction of Mycobacterium avium with
environmental amoebae enhances virulence. Infection and Immunity 65: 3759-3767.
203. Barker J, Scaife H, Brown M (1995) Intraphagocytic growth induces an antibiotic-resistant
phenotype of Legionella pneumophila. Antimicrobial agents and chemotherapy 39: 2684-2688.
204. Singh PK, Schaefer AL, Parsek MR, Moninger TO, Welsh MJ, Greenberg E (2000) Quorum-sensing
signals indicate that cystic fibrosis lungs are infected with bacterial biofilms. Nature 407: 762-764.
205. Høiby N, Krogh Johansen H, Moser C, Song Z, Ciofu O, Kharazmi A (2001) Pseudomonas
aeruginosa and the in vitro and in vivo biofilm mode of growth. Microbes and Infection 3: 23-35.
206. Levin BR, Antia R (2001) Why we don't get sick: the within-host population dynamics of bacterial
infections. Science 292: 1112-1115.
207. Rittmann BE (2007) Where are we with biofilms now? Where are we going? Water science and
technology 55: 1-8.
208. Washio J, Mayanagi G, Takahashi N (2010) Challenge to Metabolomics of Oral Biofilm:—From
“What Are They?” to “What Are They Doing?”—. Journal of Oral Biosciences 52: 225-232.
209. Nicholson JK, Lindon JC (2008) Systems biology: metabonomics. Nature 455: 1054-1056.
210. Garcia DE, Baidoo EE, Benke PI, Pingitore F, Tang YJ, Villa S, Keasling JD (2008) Separation and
mass spectrometry in microbial metabolomics. Current opinion in microbiology 11: 233-239.
211. Hollywood K, Brison DR, Goodacre R (2006) Metabolomics: current technologies and future trends.
Proteomics 6: 4716-4723.
212. Wilmes P, Bowen BP, Thomas BC, Mueller RS, Denef VJ, VerBerkmoes NC, Hettich RL, Northen
TR, Banfield JF (2010) Metabolome-proteome differentiation coupled to microbial divergence.
MBio 1.
213. Tyson GW, Chapman J, Hugenholtz P, Allen EE, Ram RJ, Richardson PM, Solovyev VV, Rubin
EM, Rokhsar DS, Banfield JF (2004) Community structure and metabolism through reconstruction
of microbial genomes from the environment. Nature 428: 37-43.
48
214. Raes J, Bork P (2008) Molecular eco-systems biology: towards an understanding of community
function. Nature Reviews Microbiology 6: 693-699.
215. Ohashi Y, Hirayama A, Ishikawa T, Nakamura S, Shimizu K, Ueno Y, Tomita M, Soga T (2008)
Depiction of metabolome changes in histidine-starved Escherichia coli by CE-TOFMS. Molecular
BioSystems 4: 135-147.
216. Jansson JK, Prosser JI (2013) Microbiology: The life beneath our feet. Nature 494: 40-41.
217. Rice KC, Bayles KW (2003) Death's toolbox: examining the molecular components of bacterial
programmed cell death. Molecular microbiology 50: 729-738.
218. Watnick P, Kolter R (2000) Biofilm, city of microbes. Journal of Bacteriology 182: 2675-2679.
219. Nikolaev YA, Plakunov V (2007) Biofilm—“City of microbes” or an analogue of multicellular
organisms? Microbiology 76: 125-138.
220. Battin TJ, Sloan WT, Kjelleberg S, Daims H, Head IM, Curtis TP, Eberl L (2007) Microbial
landscapes: new paths to biofilm research. Nature Reviews Microbiology 5: 76-81.

49
50
6 Manuscripts
Manuscript 1
High-Throughput Screening of Multispecies Biofilm Formation and Quantitative
PCR-Based Assessment of Individual Species Proportions, Useful for Exploring
Interspecific Bacterial Interactions.

51

METHODS
High-Throughput Screening of Multispecies BiofilmFormation and Quantitative PCR-Based Assessmentof Individual Species Proportions, Useful for ExploringInterspecific Bacterial Interactions
Dawei Ren & Jonas Stenløkke Madsen &
Claudia I de la Cruz-Perera & Lasse Bergmark &
Søren J. Sørensen & Mette Burmølle
Received: 26 April 2013 /Accepted: 14 October 2013# Springer Science+Business Media New York 2013
Abstract Multispecies biofilms are predominant in almost allnatural environments, where myriads of resident microorgan-isms interact with each other in both synergistic and antago-nistic manners. The interspecies interactions among differentbacteria are, despite the ubiquity of these communities, stillpoorly understood. Here, we report a rapid, reproducible andsensitive approach for quantitative screening of biofilm for-mation by bacteria when cultivated as mono- and multispeciesbiofilms, based on the Nunc-TSP lid system and crystal violetstaining. The relative proportion of the individual species in afour-species biofilm was assessed using quantitative PCRbased on SYBR Green I fluorescence with specific primers.The results indicated strong synergistic interactions in a four-species biofilm model community with a more than 3-foldincrease in biofilm formation and demonstrated the strongdominance of two strains, Xanthomonas retroflexus andPaenibacillus amylolyticus . The developed approach can beused as a standard procedure for evaluating interspecies inter-actions in defined microbial communities. This will be ofsignificant value in the quantitative study of the microbialcomposition of multispecies biofilms both in natural
environments and infectious diseases to increase our under-standing of the mechanisms that underlie cooperation, com-petition and fitness of individual species in mixed-speciesbiofilms.
Introduction
Biofilms are defined as polymeric matrix-enclosed bacterialcommunities associated with surfaces or interfaces [1]. Theyare considered the dominant lifestyle of bacteria both in envi-ronmental ecosystems and human hosts, and typically com-prise a large number of different bacteria living together [2].Soil is an example of an environment that contains a largenumber of very diverse bacteria and numerous available sur-faces for multispecies biofilm formation [3].
Coresidence of diverse bacteria in multispecies biofilms islikely to catalyse complex interactions, resulting in increased ordecreased biofilm biomass [4–7], which may in turn affect theoverall function of the biofilm community. As example, Pseu-domonas aeruginosa PAO1 and Burkholderia sp . NK8 showedenhanced biofilm formation in a dual-species biofilm, directlybenefitting bioremediation potential, as chlorobenzoates weremore efficiently degraded [8] and similar biofilm synergies wereobserved in drinking water systems [7]. Despite an increase inbiofilm-related studies over the past decades, most of these havefocused on monospecies biofilms or specific ecological nichessuch as mixed-species oral biofilms. Our current knowledgeregarding the prevalence, physiology and complexity of multi-species biofilm is still incomplete, partly due to the lack ofreproducible screening methods.
Two measurements are of particular importance when ex-ploring interactions in biofilms; namely, the biomass (or
Electronic supplementary material The online version of this article(doi:10.1007/s00248-013-0315-z) contains supplementary material,which is available to authorized users.
D. Ren : J. S. Madsen : C. I. de la Cruz-Perera : L. Bergmark :S. J. Sørensen :M. BurmølleSection of Microbiology, Department of Biology,University of Copenhagen, Copenhagen, Denmark
M. Burmølle (*)Section of Microbiology, University of Copenhagen,Universitetsparken 15, bygn 1, 2100 Copenhagen Ø, Denmarke-mail: [email protected]
Microb EcolDOI 10.1007/s00248-013-0315-z

productivity) of the total biofilm and of the individual strains.Measurements of the overall biomass can, when comparedwith the amount that each of the residing species are able toproduce as monospecies biofilms, be used to distinguish theeffect of interactions on the extent of biofilm that is formed, asto whether this is synergistic, neutral or antagonistic. Beingable to differentiate the success of each different bacterialmember of the biofilm can furthermore resolve interactionsas being mutual, commensal or parasitic, which is fundamen-tal for exploring and understanding the selective forces oper-ating in and shaping multispecies communities.
Several methods and protocols have been developed forstudying biofilms. Flow cells combined with confocal scan-ning laser microscopy [9] is the most favoured tool and has theadvantage of enabling one to obtain quantitative informationon both the overall biomass and of the individual strains ifcombined with correct labelling techniques (e.g. fluorescencein situ hybridization, FISH) but is unfortunately not suited forhigh-throughput comparative screening studies. Furthermore,identification of specific strains in multispecies biofilms bythis approach is highly labour-intensive and requires experthandling in order to avoid pitfalls such as uneven staining dueto the limited probe penetration into biofilms, artefacts causedby hybridization and dehydration procedures in FISH [10, 11].Microtiter plates are suitable for performing biofilm quantifi-cation, usually based on crystal violet retention, owing to theirhigh-throughput screening capability and the simplicity ofprotocols [12]. However, the reproducibility of this assay isproblematic, especially when multispecies consortia areanalysed. In addition, molecular analysis of biofilm cellsrequires efficient and complete disruption of the cells followedby extraction of the target molecules, which still needs to beimproved in multispecies biofilms.
In this study, we report an easily applicable and reproduc-ible approach for consistently quantifying multispecies bio-film formation and to evaluate interactions, in regard to theoverall biofilm formation and relative proportions of individ-ual species.We present an optimized DNA extraction protocoland SYBR Green-based quantitative PCR (qPCR) assay forthe selective, rapid and sensitive detection of four species inmultispecies biofilm. The reproducibility and broad applica-bility of this specific detection procedure makes this methoduseful for most types of defined biofilms, not limited to thesoil isolates used in this study.
Materials and Methods
Soil Isolates and Culture Conditions
The bacterial strains used in this study (Table 1) were obtainedfrom agricultural soil as described previously [13]. From thetotal strain pool isolated by de la Cruz-Perera et al. [13], we
selected seven strains based on growth compatibility (seebelow). Two of the selected strains (6 and 7) were not de-scribed by de la Cruz-Perera et al., but these were isolated andidentified by procedures identical to those referred to above.
Optimization of Growth Media
To determine the optimal growth conditions and evaluate thebiofilm-forming capabilities of the seven selected soil isolates,each strain was grown individually inMinimal Medium (basalmedium 500 mL: NaH2PO4·H2O 0.5 g, K2HPO4·3H2O2.125 g, NH4Cl 1.0 g, pH 7.2; trace metals 500 mL:nitrilotriacetic acid 0.0615 g, MgSO4·7H2O 0.1 g, FeSO4·7H2O 0.006 g, ZnSO4 ·7H2O 0.0015 g, MnSO4 ·H2O0.0015 g, pH 7.0) supplemented with 0.2 % D(+)-Glucose,nutrient-low R2B medium (yeast extract 0.5 g, proteose pep-tone 0.5 g, casamino acids 0.5 g, glucose 0.5 g, soluble starch0.5 g, sodium pyruvate 0.3 g, K2HPO4 0.3 g, MgSO4·7H2O0.05 g, in 1 L distilled water) and nutrient-rich TSB medium(tryptic soy broth, Merck KgaA, Germany). When solidmedium was needed, 1.5 % (wt/vol) agar was added.
The strains were subcultured from frozen glycerol stocksonto tryptic soy agar (TSA) plates for 48 h at 24 °C, and thencolonies were transferred onto Minimal Medium agar platescontaining 0.2 % glucose, R2B agar plates or TSA plates.Colonies from solid type media were inoculated into 5 mLliquid media of the same type and incubated with shaking(250 rpm) at 24 °C overnight.
Cultivation of Biofilms
Both 96-well cell culture plates (cat. no. 655 180, Greiner Bio-One, Germany) and Nunc-TSP lid system (cat. no. 445497,Thermo Scientific, Denmark), which comprises a 96-wellplate lid with pegs that extend into each well, were used tocultivate biofilms. The seven selected strains were screened
Table 1 Identification of the seven soil isolates by 16S rRNA analysis
Strain no.a GenBank accession no. Closest relativeb
1 JQ890536 Pseudomonas lutea
2 JQ890538 Stenotrophomonas rhizophila
3 JQ890537 Xanthomonas retroflexus
4 JQ890542 Ochrobactrum rhizosphaerae
5 JQ890539 Microbacterium oxydans
6 JQ890541 Arthrobacter nitroguajacolicus
7 JQ890540 Paenibacillus amylolyticus
a The numbers 1 to 7 were designated to the seven strains forsimplificationb The sequences had 98 to 100 % base identity to the closest relative inGenBank
D. Ren et al.
for biofilm formation as single species and in four-speciescombinations as described below.
The colonies (grown on agar plates for 24 h) were inocu-lated into 5 mL of TSB medium and incubated overnight at24 °C with shaking (250 rpm). One hundred to 600 μL ofthese stationary phase bacterial cultures were transferred tofresh TSB medium and grown until an optical density at600 nm (OD600) of ~1.0 was reached. The cell suspensionswere then adjusted to an OD600 of 0.15 by dilution in TSBmedium. A total of 160 μL of monospecies or four mixedspecies (40 μL of each species) exponentially growing cul-tures were added to each well. To some wells, the samevolume of fresh TSB medium was added to obtain a back-ground value, which was subtracted from values obtainedfrom the wells containing cells. The plates were sealed withParafilm and incubated with shaking (200 rpm) at 24 °C for24 h. The biofilm assays were performed three times ondifferent days (biological replicates) with four technical repli-cates every time.
Quantification of Biofilm Formation by Use of CVand TTC
A modified version of the crystal violet (CV) method fordetection of biofilms using 96-well cell culture plate [12]was applied as previously described. Additionally, the assaywas further modified for quantifying biofilms formed on pegsof the Nunc-TSP lid system, previously referred to as theCalgary method [14]. After 24 h incubation, in order to washoff planktonic cells, the peg lid was transferred successively tothree microtiter plates containing 200 μL phosphate bufferedsaline per well, followed by staining of the biofilms formed onthe pegs with 180 μL of an aqueous 1 % (w /v ) CV solution.After 20 min of staining, the lid was rinsed again three timesand then placed into a new microtiter plate with 200 μL of96 % ethanol in each well. After allowing 30 min for the stainto dissolve into the ethanol, the absorbance of CV at 590 nmwas determined by using an EL 340 BioKinetics reader(BioTek Instruments,Winooski, Vt.). The CV-ethanol suspen-sion was diluted with 96 % ethanol when the OD590 wasabove 1.1.
Parallel with the CV-based biofilm assays described above,an alternative method, based on 2, 3, 5-triphenyltetreazoliumchloride (TTC) reduction, was also implemented and evaluat-ed. After 24-h incubation, the pegs with attached cells wererinsed three times as described above. Thereafter, the peg lidwas mounted on a new microtiter plate with 200 μL freshmedium containing 0.01 % TTC. The plate was then sealedwith Parafilm, wrapped in foil and incubated with shaking(200 rpm) for another 24 h. In order to resuspend the formedformazan, the peg lid was transferred to a new microtiter platecontaining 200 μL of 96 % ethanol per well. Finally, theabsorbance was measured at 490 nm.
The statistical analyses were conducted using ANOVA test(SPSS version 17.0 for Windows). A p value of ≤0.05 wasregarded as a statistically significant difference.
DNA Extraction from Four-Species Biofilms
The 24-h biofilms formed on peg lids were rinsed three timeswith PBS to remove non-adherent bacteria as described above.Then pegs were broken from the lid from the back (i.e. withoutdirect contact to the biofilm-covered part of the peg) usingsterile forceps and transferred into Lysing Matrix E tubes(provided by the FastDNA™ SPIN Kit for soil). Each pegwas placed in one tube. Aliquots of 882 µl of sodium phosphatebuffer was added to each tube and biofilms were disruptedfrom pegs by bead beating using the Savant FastPrepFP120 for 40s at setting 6.0. The pegs were removed andstained with crystal violet to verify that after bead beating,all the cells were detached from the pegs. Ninety-eightmicrolitres of lysozyme solution (20 mg/ml), dissolved insodium phosphate buffer was added, and the samples wereincubated for 1 h at 37 °C. Next, 122 μL of MT buffer wasadded to each sample, followed by bead beating twice for40s at setting 6.0 with cooling on ice during the short timeinterval. The complete cell lysis was visually confirmed withan optical microscope. Genomic DNA was then extractedusing FastDNA™ SPIN Kit for soil (Qbiogene, Illkirch,France) according to the manufacturer's instructions and quan-tified with a Qubit fluorometer (Invitrogen, Carlsbad, CA,USA).
DNA Sequence Analysis and Design of the Species-SpecificPrimers
Multiple alignment of sequences from the four strains 2, 3, 5and 7 was done using the DNAMAN software (version 7,Lynnon corporation). The species-specific primer pairs forSYBR Green qPCR were designed manually based on thevariable regions of 16S rRNA genes (Table 2) according to theguidelines set by Primer Express (version 3.0) from AppliedBiosystems with an approximate maximum amplicon size of300 bp. The obtained best fitting primers were checked byDNAMAN to avoid hairpins or primer–dimer formations. Thespecificity of each pair of primers was checked against theother three, non-target strains using conventional PCRs asfollows. Reaction mixtures of 25 μL contained 16 μL H2O,1 μL genomic DNA, 5 μL 5× Phusion HF Buffer, 0.5 μL10 mM dNTPs, 1 μL 10 μM of each primer, and 0.5 μLPhusion DNA polymerase (Phusion high-fidelity PCR kit;Finnzymes, Espoo, Finland). Amplifications were performedwith the following cycling protocol: 5 min at 95 °C, followedby 30 cycles of 30s at 94 °C, 30s at 61 °C/62 °C, 20s at 72 °Cand a final elongation step of 5 min at 72 °C in DNA EngineDyad Peltier Thermal Cycler (MJ Research Inc.). The
High-Throughput Screening and Species Abundance Analysis in Multispecies Biofilms

amplified products were separated by 1.0 % agarose gelelectrophoresis, stained with ethidium bromide andphotographed under UV illumination.
Plasmid Standards Used for Absolute Quantification
A plasmid standard containing the target region was preparedfor each primer pair as follows. The 16S rRNA gene fragmentswere amplified by conventional PCR using the correspondingprimers as mentioned above. The products were cloned usingthe TOPO TA cloning kit (Invitrogen, Carlsbad, CA, USA).Plasmids were isolated with QIAprep Spin Miniprep Kit(Qiagen Gmbh, Hilden, Germany). The qualities were evaluat-ed by agarose gel electrophoresis and concentrations weremeasured by Qubit Fluorometer (Invitrogen, Carlsbad, CA,USA). 16S rRNA gene copy numbers were calculated assum-ing that the average molecular mass of a double-stranded DNAmolecule is 660 g/mol. Four standard curves were generatedusing triplicate 5-fold dilutions of plasmid DNAs, and thecorresponding slope was used to calculate PCR amplificationefficiency (E) according to the equation of E =10(−1 slope). 16SrRNA gene copy numbers in unknown samples were thendetermined by interpolation from the standard curve using theirrespective threshold cycle (Ct) values. The Ct value representsthe number of PCR amplification cycles needed to producefluorescence intensity above a pre-defined threshold.
Quantitative PCR Based on SYBR Green I Fluorescence
For each sample, four separate qPCR reactions were per-formed with the Mx3000PTM Real-time PCR System (Strata-gene, USA) using each pair of species-specific primers. Eachof the reaction components per 20 μL were 7 μL H2O, 10 μL2× Brilliant III Ultra-Fast SYBR® Green QPCR Master Mix(Agilent Technologies), 1 μL 10 μM of each primer and 1 μLgenomic DNA (either standard or sample). The PCRprogrammes were carried out as follows: 95 °C for 10 min,40 cycles of 95 °C for 30s, 59–62 °C for 30s and 72 °C for
20s/30s, followed by a standard melting/dissociation curvesegment. Each sample was run in triplicates and a negativecontrol was included in every run.
Results
Isolates and Media Optimization
The seven selected strains, representing common soil bacteria,were all able to grow on Minimal Medium supplemented with0.2 % D(+)-Glucose (data not shown). These strains wereselected for further media optimization and multispecies bio-film formation. The strain identities and the accession numbersof the 16S rRNA gene sequences, used in this study for design-ing specific primers (strain 2, 3, 5 and 7), are shown in Table 1.
All seven strains showed slower growth on Minimal Me-dium+Glucose (0.2 %) and R2A plates than on TSA platesand took much more time to reach exponential growth phasein liquid media at 24 °C (data not shown). Since all sevenstrains grew well on TSA/TSB, this medium was chosen forfurther cultivation of mono- and four-species biofilms.
Assay for Biofilm Formation
Monospecies biofilm formation was assayed both with andwithout the peg lid system using both the CVretention and theTTC reduction assays (Fig. 1a–c). To evaluate the reproduc-ibility within technical replicates and between individual ex-perimental series (biological replicates), all biofilm assayswere performed in four replicates and conducted three indi-vidual times on different days under the same conditions.
Compared with the 96-well cell culture plate, the Nunc-TSP lid system gave less variation between replicates andbetween individual days, which were directly reflected in thebiofilm formation of strains 1, 2 and 4. These three strains,which were identified as poor biofilm formers in the Nunc-TSP lid system (Fig. 1b), showed significantly different
Table 2 Species-specific primers based on 16S rRNA gene sequences
Strain no. Identity Primer position Sequence (5′–3′) Length (bp) Product size (bp)
2 S . rhizophila FP 159 GCCTTGCGCGGATAGATG 18 240
RP 399 CGGGTATTAGCCGACTGCTT 20
3 X . retroflexus FP 135 GCCTTGCGCGATTGAATG 18 252
RP 387 CCGTCATCCCAACCAGGTATT 21
5 M . oxydans FP 935 TCAACTCTTTGGACACTCGTAAACA 25 213
RP 1148 CATGCGTGAAGCCCAAGAC 19
7 P. amylolyticus FP 800 GATACCCTTGGTGCCGAAGTT 21 145
RP 945 CGGTCAGAGGGATGTCAAGAC 21
The numbers in the primer position show the positions of the target sites of each species
FP Forward primer, RP Reverse primer
D. Ren et al.
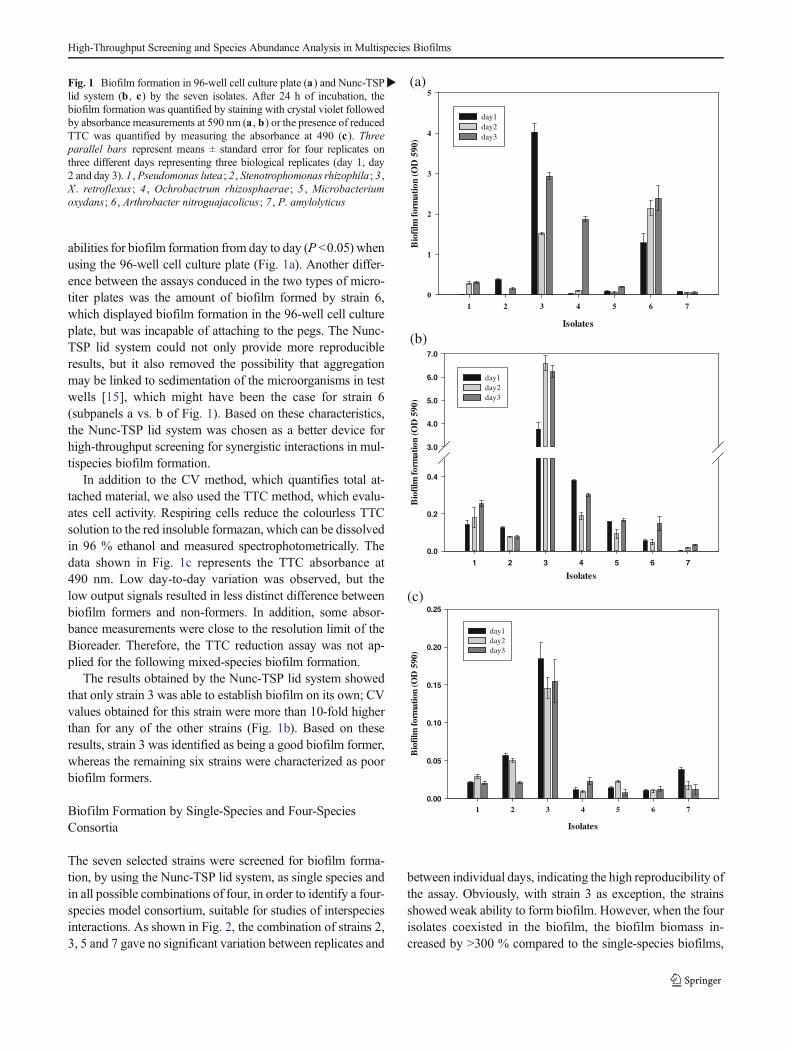
abilities for biofilm formation from day to day (P <0.05) whenusing the 96-well cell culture plate (Fig. 1a). Another differ-ence between the assays conduced in the two types of micro-titer plates was the amount of biofilm formed by strain 6,which displayed biofilm formation in the 96-well cell cultureplate, but was incapable of attaching to the pegs. The Nunc-TSP lid system could not only provide more reproducibleresults, but it also removed the possibility that aggregationmay be linked to sedimentation of the microorganisms in testwells [15], which might have been the case for strain 6(subpanels a vs. b of Fig. 1). Based on these characteristics,the Nunc-TSP lid system was chosen as a better device forhigh-throughput screening for synergistic interactions in mul-tispecies biofilm formation.
In addition to the CV method, which quantifies total at-tached material, we also used the TTC method, which evalu-ates cell activity. Respiring cells reduce the colourless TTCsolution to the red insoluble formazan, which can be dissolvedin 96 % ethanol and measured spectrophotometrically. Thedata shown in Fig. 1c represents the TTC absorbance at490 nm. Low day-to-day variation was observed, but thelow output signals resulted in less distinct difference betweenbiofilm formers and non-formers. In addition, some absor-bance measurements were close to the resolution limit of theBioreader. Therefore, the TTC reduction assay was not ap-plied for the following mixed-species biofilm formation.
The results obtained by the Nunc-TSP lid system showedthat only strain 3 was able to establish biofilm on its own; CVvalues obtained for this strain were more than 10-fold higherthan for any of the other strains (Fig. 1b). Based on theseresults, strain 3 was identified as being a good biofilm former,whereas the remaining six strains were characterized as poorbiofilm formers.
Biofilm Formation by Single-Species and Four-SpeciesConsortia
The seven selected strains were screened for biofilm forma-tion, by using the Nunc-TSP lid system, as single species andin all possible combinations of four, in order to identify a four-species model consortium, suitable for studies of interspeciesinteractions. As shown in Fig. 2, the combination of strains 2,3, 5 and 7 gave no significant variation between replicates and
between individual days, indicating the high reproducibility ofthe assay. Obviously, with strain 3 as exception, the strainsshowed weak ability to form biofilm. However, when the fourisolates coexisted in the biofilm, the biofilm biomass in-creased by >300 % compared to the single-species biofilms,
(a)
Isolates
1 2 3 4 5 6 7
Bio
film
form
atio
n (O
D 5
90)
0
1
2
3
4
5
day1 day2 day3
(b)
Isolates1 2 3 4 5 6 7
Bio
film
form
atio
n (O
D 5
90)
0.2
3.0
5.0
7.0
0.0
0.4
4.0
6.0 day1 day2 day3
(c)
Isolates
1 2 3 4 5 6 7
Bio
film
form
atio
n (O
D 5
90)
0.00
0.05
0.10
0.15
0.20
0.25
day1 day2 day3
�Fig. 1 Biofilm formation in 96-well cell culture plate (a) and Nunc-TSPlid system (b , c) by the seven isolates. After 24 h of incubation, thebiofilm formation was quantified by staining with crystal violet followedby absorbance measurements at 590 nm (a , b) or the presence of reducedTTC was quantified by measuring the absorbance at 490 (c). Threeparallel bars represent means ± standard error for four replicates onthree different days representing three biological replicates (day 1, day2 and day 3). 1 , Pseudomonas lutea; 2 , Stenotrophomonas rhizophila ; 3 ,X . retroflexus ; 4 , Ochrobactrum rhizosphaerae ; 5 , Microbacteriumoxydans; 6 , Arthrobacter nitroguajacolicus ; 7 , P. amylolyticus
High-Throughput Screening and Species Abundance Analysis in Multispecies Biofilms
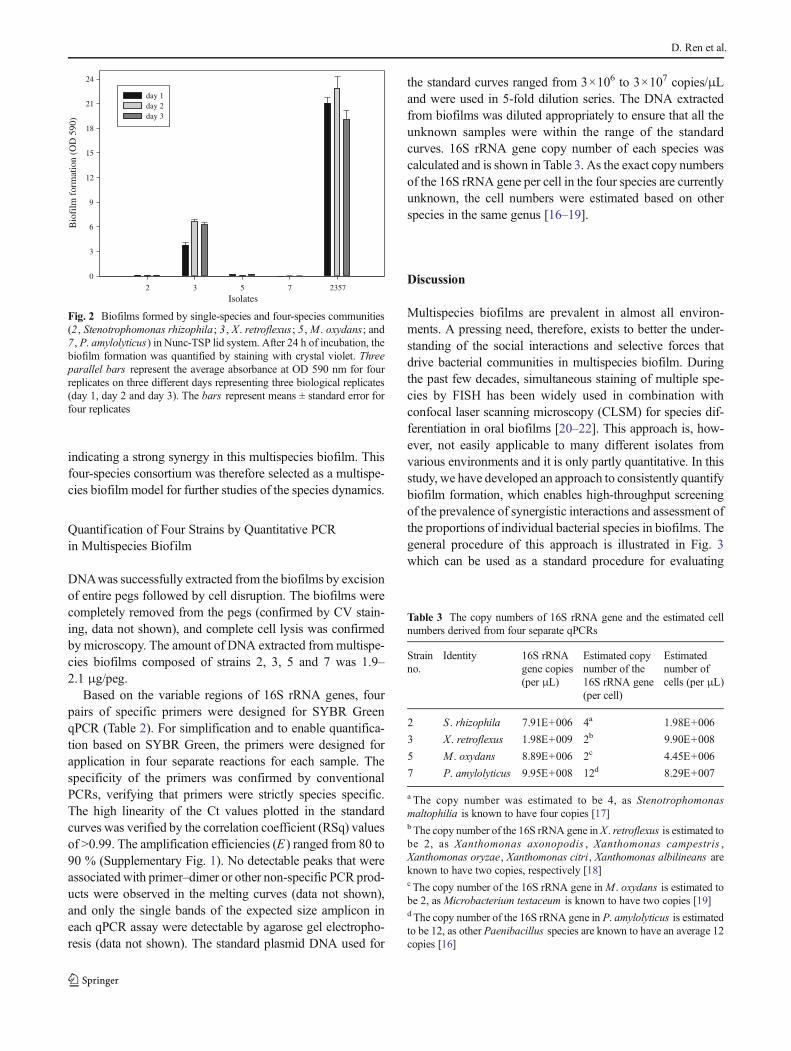
indicating a strong synergy in this multispecies biofilm. Thisfour-species consortium was therefore selected as a multispe-cies biofilm model for further studies of the species dynamics.
Quantification of Four Strains by Quantitative PCRin Multispecies Biofilm
DNAwas successfully extracted from the biofilms by excisionof entire pegs followed by cell disruption. The biofilms werecompletely removed from the pegs (confirmed by CV stain-ing, data not shown), and complete cell lysis was confirmedby microscopy. The amount of DNA extracted frommultispe-cies biofilms composed of strains 2, 3, 5 and 7 was 1.9–2.1 μg/peg.
Based on the variable regions of 16S rRNA genes, fourpairs of specific primers were designed for SYBR GreenqPCR (Table 2). For simplification and to enable quantifica-tion based on SYBR Green, the primers were designed forapplication in four separate reactions for each sample. Thespecificity of the primers was confirmed by conventionalPCRs, verifying that primers were strictly species specific.The high linearity of the Ct values plotted in the standardcurves was verified by the correlation coefficient (RSq) valuesof >0.99. The amplification efficiencies (E) ranged from 80 to90 % (Supplementary Fig. 1). No detectable peaks that wereassociated with primer–dimer or other non-specific PCR prod-ucts were observed in the melting curves (data not shown),and only the single bands of the expected size amplicon ineach qPCR assay were detectable by agarose gel electropho-resis (data not shown). The standard plasmid DNA used for
the standard curves ranged from 3×10⁶ to 3×10⁷ copies/μLand were used in 5-fold dilution series. The DNA extractedfrom biofilms was diluted appropriately to ensure that all theunknown samples were within the range of the standardcurves. 16S rRNA gene copy number of each species wascalculated and is shown in Table 3. As the exact copy numbersof the 16S rRNA gene per cell in the four species are currentlyunknown, the cell numbers were estimated based on otherspecies in the same genus [16–19].
Discussion
Multispecies biofilms are prevalent in almost all environ-ments. A pressing need, therefore, exists to better the under-standing of the social interactions and selective forces thatdrive bacterial communities in multispecies biofilm. Duringthe past few decades, simultaneous staining of multiple spe-cies by FISH has been widely used in combination withconfocal laser scanning microscopy (CLSM) for species dif-ferentiation in oral biofilms [20–22]. This approach is, how-ever, not easily applicable to many different isolates fromvarious environments and it is only partly quantitative. In thisstudy, we have developed an approach to consistently quantifybiofilm formation, which enables high-throughput screeningof the prevalence of synergistic interactions and assessment ofthe proportions of individual bacterial species in biofilms. Thegeneral procedure of this approach is illustrated in Fig. 3which can be used as a standard procedure for evaluating
Isolates2 3 5 7 2357
Bio
film
for
mat
ion
(OD
590
)
0
3
6
9
12
15
18
21
24
day 1day 2day 3
Fig. 2 Biofilms formed by single-species and four-species communities(2 , Stenotrophomonas rhizophila; 3 , X . retroflexus; 5 ,M . oxydans ; and7 , P. amylolyticus) in Nunc-TSP lid system. After 24 h of incubation, thebiofilm formation was quantified by staining with crystal violet. Threeparallel bars represent the average absorbance at OD 590 nm for fourreplicates on three different days representing three biological replicates(day 1, day 2 and day 3). The bars represent means ± standard error forfour replicates
Table 3 The copy numbers of 16S rRNA gene and the estimated cellnumbers derived from four separate qPCRs
Strainno.
Identity 16S rRNAgene copies(per μL)
Estimated copynumber of the16S rRNA gene(per cell)
Estimatednumber ofcells (per μL)
2 S . rhizophila 7.91E+006 4a 1.98E+006
3 X . retroflexus 1.98E+009 2b 9.90E+008
5 M . oxydans 8.89E+006 2c 4.45E+006
7 P. amylolyticus 9.95E+008 12d 8.29E+007
a The copy number was estimated to be 4, as Stenotrophomonasmaltophilia is known to have four copies [17]b The copy number of the 16S rRNA gene in X . retroflexus is estimated tobe 2, as Xanthomonas axonopodis , Xanthomonas campestris ,Xanthomonas oryzae, Xanthomonas citri, Xanthomonas albilineans areknown to have two copies, respectively [18]c The copy number of the 16S rRNA gene in M . oxydans is estimated tobe 2, as Microbacterium testaceum is known to have two copies [19]d The copy number of the 16S rRNA gene in P. amylolyticus is estimatedto be 12, as other Paenibacillus species are known to have an average 12copies [16]
D. Ren et al.

interspecies interaction in multispecies biofilms. The right-hand part of this figure illustrates the parallel strain identifica-tion and primer design. Clearly, this protocol is applicable formultispecies biofilms composed of a defined number ofknown species. Other approaches, including metagenomicanalysis, are more suitable when interactions in more complexcommunities are explored. However, the standard methodpresented in this study could be much useful in some naturalsettings where species diversity is more restricted e.g. chronicinfections or when limited key species are the research focus.
Multispecies Biofilm Assay
Mixed species may facilitate synergistic or antagonistic inter-actions between consortia members in biofilms. The co-culturing of four strains in this study provided an easy wayto detect changes in biofilm formation from mono- to multi-species biofilms and allowed high-throughput screening ofmany isolates with high reproducibility. Biofilms have beenproposed to exist in a fine balance between competition andcooperation [23], which can be tipped by various types ofinfluences such as surrounding environmental factors andquorum sensing-dependent gene regulation. Inconsistent re-sults in biofilm formation assays have previous been reported[24–27] due to different substrates, media, inoculum size andculture conditions, and the inconsistency is most likely to beworsened by the highly heterogeneous nature of multispeciesbiofilms. In this study, the three independent repetitive runs
and four technical replicates per run were performed to assessthe reproducibility of the quantitative analysis.
Poor reproducibility of the microtiter plate assay (reflectedby higher standard errors (Fig. 1a)) can be caused by pipet-ting uncertainties, pieces of biofilm detaching, etc. In theNunc-TSP lid system, the number of pipetting steps is dra-matically reduced, which decreases the handling-inducedvariability. This was best reflected by the lower standarderrors, indicative of relatively uniform biofilms throughoutthe four replicate wells (Fig.1b, c and Fig. 2).
TTC reduction, as a simple colorimetric method, has beenwidely used to evaluate the cell activity in plant tissue [28],fungal spores, yeast and bacteria cultures [29]. The low TTCvalues observed in this study were probably due to therelatively low metabolic activities of cells and the enhancedlevels of non-biological material within mature biofilm com-pared to the CV assay where the extracellular matrix and allbacterial cells are stained. The combined use of CV and therespiratory indicator CTC (5-cyano-2,3-ditolyl tetrazo-lium chloride) in high-throughput biofilm assays was pre-viously reported by Pitts et al., who also found cells that hadlost metabolic activity could still contribute to the totalamount of biomass [30]. Therefore, in this study, TTC wasless suitable for quantitative biofilm measurements of micro-bial biomass.
DNA Extraction and qPCR Analysis of Species Distribution
Comparative studies of gene and protein expression ofbiofilm-associated cells have proven that these are significant-ly different from planktonically grown cells [31, 32]. Theprotocol optimized in the present study successfully detachedand lysed both the Gram-negative and Gram-positive cells andis likely to become useful in many applications of DNA-basedbiofilm research. With the appropriate modification, the pro-tocol is additionally suitable for RNA and protein extractions.
qPCR has been successfully applied for quantifying bacterialabundance in plaque biofilm [33], faucet biofilm [34] andbiofilms in wounds [35] due to its speed, sensitivity and spec-ificity. The targets of qPCR can be species-specific genes or16S ribosome RNA genes [36, 37]. 16S rRNA gene proved tobe an excellent target for both quantitative broad-range PCR[38] and group-/species-specific PCR [39, 40] in complexcommunities. The qPCR assay offers several advantages overFISH: low risk of contamination by amplified products, thesimplicity and rapidity of data analysis and low detection limit.Using the real-time TaqMan assay, Price et al. [41] were able toexamine specific bacterial populations in biofilms grown fromhuman saliva and their susceptibility to chlorhexidine. Ren et al.reported a consistent function-related bacterial distribution inanode biofilms using both FISH and qPCR analyses [42].
In the present study, we describe a specific qPCR assay toexamine the population dynamics in multispecies biofilms.
Strain isolation
Media optimization
Mono- and multi-species biofilm cultivation
Target selection
DNA extraction
Quantitative PCR
DNA extraction
16S rRNA gene sequencing
Species-specific primer design
Fig. 3 General procedure for high-throughput screening and evaluationof interactions in multispecies biofilms. The right-hand part illustratesthe parallel strain identification and primer design for use in qPCR
High-Throughput Screening and Species Abundance Analysis in Multispecies Biofilms
The significant synergistic interaction observed in a biofilmconsisting of four soil bacteria make this consortium a pow-erful model to study development and interactions in multi-species biofilms. For this work, 16S rRNA gene was targetedfor SYBR Green assay profiling of the four strains run inseparate reactions. The hypervariable regions interspersedwith the conserved regions make 16S rRNA gene an attractivetarget for both universal and specific primers. In addition, thepublic databases of 16S rRNA gene sequences are easilyaccessible, including GenBank, Greengenes and RibosomalDatabase Project, which are valuable for bacterial identifica-tion and investigation in microbial ecology and evolution.TaqMan and SYBR Green qPCR are two frequently usedassays. Despite of the significantly high specificity of the detec-tion with TaqMan probe, SYBRGreen qPCR is widely used dueto the low cost and the ease in designing primers and optimizingassays. Maeda et al. [43] have reported that there are no signif-icant differences between the TaqMan and SYBR Green chem-istry in their specificity and sensitivity. However, the effect ofSYBR Green qPCR is also limited in terms of the number ofspecies it is practical to analyse. In such cases, the use of TaqManwould be preferred in a complex community to enable morespecies to be analysed, as it opens up for multiplex qPCR, whichonly requires one specific probe per target (instead of two spe-cific primers) and reduces the amount of samples being run.
Concluding Remarks
Overall, we present a sensitive and reliable high-throughputmethod to investigate the interspecific interactions betweenbacterial isolates with the static co-culture assay followed by aqPCR assay that uses species-specific primers to measure the16S rRNA gene numbers of each species in multispeciesbiofilms. By quantification and comparisons of the biomassof each species when grown alone and in the multispeciesbiofilm, understanding of the interspecific interactions (coop-erative, mutualistic, competitive) that operate in the multispe-cies biofilm, is obtainable. To our knowledge, this presentedapproach applied in screenings for overall synergism andantagonism within multispecies biofilms composed of soilisolates is firstly reported in this study. As the ubiquity ofbiofilm formation is receiving increasingly more attentionamong scientists, this developed method will be a valuabletool for studying the social interactions and selective forcesthat drive complex bacterial communities in natural environ-ments as well as infectious diseases.
Acknowledgments This research was supported by funding to MetteBurmølle by The Danish Council for Independent Research, Technologyand Production, ref no: 09-090701, to Søren Sørensen by The DanishCouncil for Independent Research, Natural Sciences and the Danish Inno-vation Consortium, SiB, ref no: 11804520 to Jonas Stenløkke Madsen.
References
1. Costerton JW, Lewandowski Z, Caldwell DE, Korber DR, Lappin-Scott HM (1995) Microbial biofilms. Annual Reviews inMicrobiology 49(1):711–745
2. Hall-Stoodley L, Costerton JW, Stoodley P (2004) Bacterial biofilms:from the natural environment to infectious diseases. Nat RevMicrobiol 2(2):95–108
3. Burmølle M, Kjøller A, Sørensen SJ (2012) An invisible workforce:biofilms in the soil. In: Lear G, Lewis G (eds) Microbial biofilms:current research and applications. Caister Academic press, Norfolk, UK
4. Burmølle M, Webb JS, Rao D, Hansen LH, Sørensen SJ, KjellebergS (2006) Enhanced biofilm formation and increased resistance toantimicrobial agents and bacterial invasion are caused by synergisticinteractions in multispecies biofilms. Appl Environ Microb 72(6):3916–3923
5. Pathak AK, Sharma S, Shrivastva P (2012) Multi-species biofilm ofCandida albicans and non-Candida albicans Candida species onacrylic substrate. Journal of Applied Oral Science 20(1):70–75
6. Wen ZT, Yates D, Ahn SJ, Burne RA (2010) Biofilm formation andvirulence expression by Streptococcus mutans are altered whengrown in dual-species model. BMC microbiology 10(1):111
7. Schwering M, Song J, Louie M, Turner RJ, Ceri H (2013) Multi-species biofilms defined from drinking water microorganisms pro-vide increased protection against chlorine disinfection. Biofouling(ahead-of-print):1-12
8. Yoshida S, Ogawa N, Fujii T, Tsushima S (2009) Enhanced biofilmformation and 3-chlorobenzoate degrading activity by the bacterialconsortium of Burkholderia sp. NK8 and Pseudomonas aeruginosaPAO1. J Appl Microbiol 106(3):790–800
9. Tolker-Nielsen T, Brinch UC, Ragas PC, Andersen JB, Jacobsen CS,Molin S (2000) Development and dynamics of pseudomonas sp.Biofilms. J Bacteriol 182(22):6482–6489
10. Evans RP, Nelson CL, Bowen WR, Kleve MG, Hickmon SG (1998)Visualization of bacterial glycocalyx with a scanning electron micro-scope. Clin Orthop Relat Res 347:243
11. Morck D, Raybould T, Acres S, Babiuk L, Nelligan J, Costerton J(1987) Electron microscopic description of glycocalyx and fimbriaeon the surface of Pasteurella haemolytica-A1. Can J Vet Res 51(1):83
12. O'Toole GA, Kolter R (1998) Initiation of biofilm formation inPseudomonas fluorescens WCS365 proceeds via multiple, conver-gent signalling pathways: a genetic analysis. Mol Microbiol 28(3):449–461
13. de la Cruz-Perera CI, Ren D, Blanchet M, Dendooven L, Marsch R,Sørensen SJ, Burmølle M (2013) The ability of soil bacteria toreceive the conjugative IncP1 plasmid, pKJK10, is different in amixed community compared to single strains. FEMS MicrobiolLett 338(1):95–100
14. Ceri H, OlsonM, Stremick C, Read R,Morck D, Buret A (1999) TheCalgary biofilm device: new technology for rapid determination ofantibiotic susceptibilities of bacterial biofilms. J Clin Microbiol37(6):1771–1776
15. Harrison JJ, Stremick CA, Turner RJ, Allan ND, Olson ME, Ceri H(2010) Microtiter susceptibility testing of microbes growing on peglids: a miniaturized biofilm model for high-throughput screening.Nature protocols 5(7):1236–1254
16. Shin SH, Kim S, Kim JY, Song HY, Cho SJ, Lee K-I, Lim HK, ParkN-J, Hwang IT, Yang K-S (2012) Genome sequence of Paenibacillusterrae HPL-003, a xylanase-producing bacterium isolated from soilfound in forest residue. J Bacteriol 194(5):1266–1266
17. Lira F, Hernández A, Belda E, Sánchez MB, Moya A, Silva FJ,Martínez JL (2012) Whole-genome sequence of Stenotrophomonasmaltophilia D457, a clinical isolate and a model strain. J Bacteriol194(13):3563–3564
D. Ren et al.

18. da Silva AR, Ferro JA, Reinach F, Farah C, Furlan L, Quaggio R,Monteiro-Vitorello C, Van Sluys M, Almeida N, Alves L (2002)Comparison of the genomes of two Xanthomonas pathogens withdiffering host specificities. Nature 417(6887):459–463
19. Morohoshi T, Wang W-Z, Someya N, Ikeda T (2011) Genomesequence of Microbacterium testaceum StLB037, an N -acylhomoserine lactone-degrading bacterium isolated from potatoleaves. J Bacteriol 193(8):2072–2073
20. Al-Ahmad A, Wunder A, Auschill TM, Follo M, Braun G, HellwigE, Arweiler NB (2007) The in vivo dynamics of Streptococcus spp.,Actinomyces naeslundii , Fusobacterium nucleatum and Veillonellaspp. in dental plaque biofilm as analysed by five-colour multiplexfluorescence in situ hybridization. J Med Microbiol 56(5):681–687
21. Dige I, Nilsson H, Kilian M, Nyvad B (2007) In situ identification ofstreptococci and other bacteria in initial dental biofilm by confocallaser scanningmicroscopy and fluorescence in situ hybridization. EurJ Oral Sci 115(6):459–467
22. Thurnheer T, Gmür R, Guggenheim B (2004) Multiplex FISH anal-ysis of a six-species bacterial biofilm. J Microbiol Meth 56(1):37–47
23. Nadell CD, Xavier JB, Foster KR (2009) The sociobiology ofbiofilms. FEMS Microbiol Rev 33(1):206–224
24. Bechet M, Blondeau R (2003) Factors associated with the adherenceand biofilm formation byAeromonas caviae on glass surfaces. J ApplMicrobiol 94(6):1072–1078
25. Dag I, Kiraz N, Yasemin O (2010) Evaluation of different detectionmethods of biofilm formation in clinical Candida isolates. Afr JMicrobiol Res 4(24):2763–2768
26. Nett JE, Cain MT, Crawford K, Andes DR (2011) Optimizing aCandida biofilm microtiter plate model for measurement of antifun-gal susceptibility by tetrazolium salt assay. J Clin Microbiol 49(4):1426–1433
27. Zara S, Gross MK, Zara G, Budroni M, Bakalinsky AT (2010)Ethanol-independent biofilm formation by a flor wine yeast strainof Saccharomyces cerevisiae . Appl Environ Microb 76(12):4089–4091
28. Gupta S, Kaur S, Sehgal S, Sharma A, Chhuneja P, Bains NS (2010)Genotypic variation for cellular thermotolerance in Aegilops tauschiiCoss., the D genome progenitor of wheat. Euphytica 175(3):373–381
29. Savaroglu F, Filik I, Oztopcu V, Kabadere S, Ilhan S, Uyar R (2011)Determination of antimicrobial and antiproliferative activities of theaquatic moss Fontinalis antipyretica Hedw. Turk J Biol 35:361–369
30. Pitts B, Hamilton MA, Zelver N, Stewart PS (2003) A microtiter-plate screening method for biofilm disinfection and removal. JMicrobiol Meth 54(2):269–276
31. Moreno-Paz M, Gómez MJ, Arcas A, Parro V (2010) Environmentaltranscriptome analysis reveals physiological differences betweenbiofilm and planktonic modes of life of the iron oxidizing bacteria
Leptospirillum spp. in their natural microbial community. BMCgenomics 11(1):404
32. Resch A, Leicht S, Saric M, Pásztor L, Jakob A, Götz F, Nordheim A(2006) Comparative proteome analysis of Staphylococcus aureusbiofilm and planktonic cells and correlation with transcriptome pro-filing. Proteomics 6(6):1867–1877
33. Kirakodu S, Govindaswami M, Novak M, Ebersole J, Novak K(2008) Optimizing qPCR for the quantification of periodontal path-ogens in a complex plaque biofilm. The open dentistry journal 2:49
34. Beumer A, King D, Donohue M, Mistry J, Covert T, Pfaller S (2010)Detection of Mycobacterium avium subsp. paratuberculosis indrinking water and biofilms by quantitative PCR. Appl EnvironMicrob 76(21):7367–7370
35. Dalton T, Dowd SE, Wolcott RD, Sun Y, Watters C, Griswold JA,Rumbaugh KP (2011) An in vivo polymicrobial biofilm woundinfection model to study interspecies interactions. PloS one 6(11):e27317
36. Suzuki N, Nakano Y, Yoshida A, Yamashita Y, Kiyoura Y (2004)Real-time TaqMan PCR for quantifying oral bacteria during biofilmformation. J Clin Microbiol 42(8):3827–3830
37. Tsushima I, Kindaichi T, Okabe S (2007) Quantification of anaerobicammonium-oxidizing bacteria in enrichment cultures by real-timePCR. Water Res 41(4):785–794
38. Nadkarni MA, Martin FE, Jacques NA, Hunter N (2002)Determination of bacterial load by real-time PCR using a broad-range (universal) probe and primers set. Microbiology 148(1):257–266
39. Matsuki T, Watanabe K, Tanaka R, Fukuda M, Oyaizu H (1999)Distribution of bifidobacterial species in human intestinal microfloraexamined with 16S rRNA-gene-targeted species-specific primers.Appl Environ Microb 65(10):4506–4512
40. Matsuki T, Watanabe K, Fujimoto J, Takada T, Tanaka R (2004) Useof 16S rRNA gene-targeted group-specific primers for real-time PCRanalysis of predominant bacteria in human feces. Appl EnvironMicrobiol 70(12):7220–7228
41. Price R, Viscount H, Stanley M, Leung KP (2007) Targeted profilingof oral bacteria in human saliva and in vitro biofilms with quantitativereal-time PCR. Biofouling 23(3):203–213
42. Ren Z, Steinberg L, Regan J (2008) Electricity production andmicrobial biofilm characterization in cellulose-fed microbial fuelcells. Water Sci Technol 58(3):617
43. Maeda H, Fujimoto C, Haruki Y, Maeda T, Kokeguchi S, Petelin M,Arai H, Tanimoto I, Nishimura F, Takashiba S (2006) Quantitativereal-time PCR using TaqMan and SYBR Green for Actinobacillusactinomycetemcomitans , Porphyromonas gingivalis , Prevotellaintermedia , tetQ gene and total bacteria. FEMS Immunology &Medical Microbiology 39(1):81–86
High-Throughput Screening and Species Abundance Analysis in Multispecies Biofilms

Manuscript 2
High prevalence of biofilm synergy among bacterial soil isolates in co-cultures
indicates bacterial interspecific cooperation.

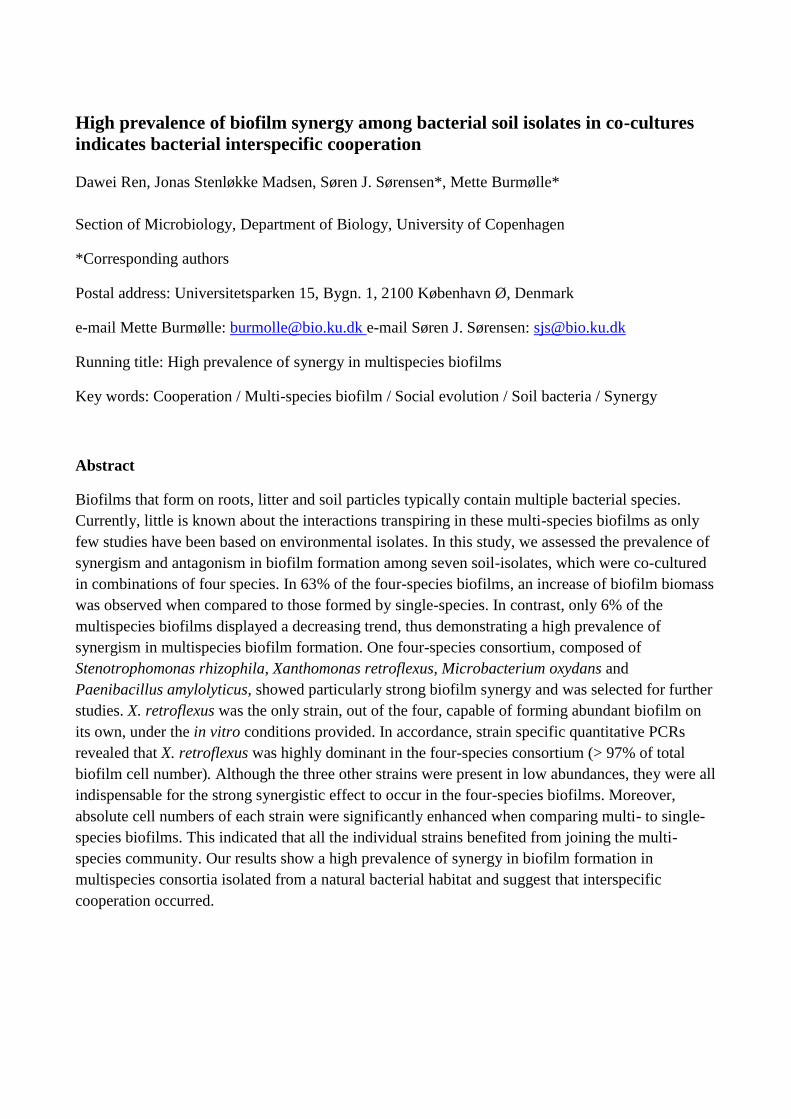
High prevalence of biofilm synergy among bacterial soil isolates in co-cultures
indicates bacterial interspecific cooperation
Dawei Ren, Jonas Stenløkke Madsen, Søren J. Sørensen*, Mette Burmølle*
Section of Microbiology, Department of Biology, University of Copenhagen
*Corresponding authors
Postal address: Universitetsparken 15, Bygn. 1, 2100 København Ø, Denmark
e-mail Mette Burmølle: [email protected] e-mail Søren J. Sørensen: [email protected]
Running title: High prevalence of synergy in multispecies biofilms
Key words: Cooperation / Multi-species biofilm / Social evolution / Soil bacteria / Synergy
Abstract
Biofilms that form on roots, litter and soil particles typically contain multiple bacterial species.
Currently, little is known about the interactions transpiring in these multi-species biofilms as only
few studies have been based on environmental isolates. In this study, we assessed the prevalence of
synergism and antagonism in biofilm formation among seven soil-isolates, which were co-cultured
in combinations of four species. In 63% of the four-species biofilms, an increase of biofilm biomass
was observed when compared to those formed by single-species. In contrast, only 6% of the
multispecies biofilms displayed a decreasing trend, thus demonstrating a high prevalence of
synergism in multispecies biofilm formation. One four-species consortium, composed of
Stenotrophomonas rhizophila, Xanthomonas retroflexus, Microbacterium oxydans and
Paenibacillus amylolyticus, showed particularly strong biofilm synergy and was selected for further
studies. X. retroflexus was the only strain, out of the four, capable of forming abundant biofilm on
its own, under the in vitro conditions provided. In accordance, strain specific quantitative PCRs
revealed that X. retroflexus was highly dominant in the four-species consortium (> 97% of total
biofilm cell number). Although the three other strains were present in low abundances, they were all
indispensable for the strong synergistic effect to occur in the four-species biofilms. Moreover,
absolute cell numbers of each strain were significantly enhanced when comparing multi- to single-
species biofilms. This indicated that all the individual strains benefited from joining the multi-
species community. Our results show a high prevalence of synergy in biofilm formation in
multispecies consortia isolated from a natural bacterial habitat and suggest that interspecific
cooperation occurred.

Introduction
Biofilms in environmental systems are comprised of
a large number of different bacteria living together
(Hall-Stoodley et al., 2004). Soil, for example, are
systems that typically are high in bacterial numbers,
diversity and readily available surfaces, which
suggest a good setting for multispecies biofilm
formation (Burmølle et al., 2012). The members of
multispecies biofilms may influence each other
antagonistically; e.g. through resource competition
or production of inhibitory compounds (Rao et al.,
2005), or synergistically; via mechanisms such as
syntrophy, biofilm induction or improved resistance
in biofilms (Burmølle et al., 2013).
We have previously observed strong synergy
among four epiphytic isolates from a marine
environment. When comparing single species
biofilms with four-species biofilms, enhanced
biofilm biomass was observed in the latter, in
addition to higher resistance to antibacterial agents
and better protection from bacterial invasion
(Burmølle et al., 2006). Diaz et al., likewise,
revealed a synergistic partnership between Candida
albicans and streptococci where C. albicans
promoted the ability of streptococci to form
biofilms on abiotic surfaces or on the surface of an
oral mucosa analogue (Diaz et al., 2012).
Additionally, several studies have shown that some
species, which were unable to form a biofilm alone,
could promote the biomass of mixed-species
biofilms (Filoche et al., 2004, Klayman et al., 2009,
Sharma et al., 2005, Yamada et al., 2005). In a
recent study, Lee et al., (2013) addressed the
protective effect of the resistant species in a three-
species biofilm. These resistant species protected
the more sensitive ones from inhibitory compounds
and the overall species ratio remained constant,
implying that resistance mechanisms may serve as
public goods in multispecies biofilms (Lee et al.,
2013).
Multi-species biofilms play an essential role in
maintaining the ecological balance in soil
(Burmølle et al., 2012) and when compared with
single-species biofilms and planktonic counterparts,
multispecies biofilm formation seem to promote
certain advantages, including increased resistance to
antibacterial compounds, enhanced protection from
desiccation and protozoan predation as well as high
rate of horizontal gene transfer (Davey and O'toole
2000, Jefferson 2004, Sørensen et al., 2005).
Therefore a pressing need exists for more research
directed towards understanding of the social
interactions and selective forces that drive bacterial
biofilm communities. Specifically, the net effects
and gains/losses regarding biofilm biomass and
protection level of each strain in a mixed
community must be evaluated in order to
characterize the underlying interactions as being
either cooperative or competitive.
In this study we assessed the prevalence of
synergism in four-species biofilm formation of
different soil isolates. Using quantitative PCR
(qPCR), we determined the presence and
progression dynamics of the individual strains at
different stages of biofilm development in a
selected four-species biofilm community. We
demonstrate a high prevalence of synergistic effects
in multispecies biofilm, indicative of cooperative
forces shaping these communities.
Materials and methods
Bacterial strains used in this study
Seven agricultural, bacterial isolates, previously
identified and characterized, were used in this study:
1) Pseudomonas lutea, 2) Stenotrophomonas
rhizophila, 3) Xanthomonas retroflexus, 4)
Ochrobactrum rhizosphaerae, 5) Microbacterium
oxydans, 6) Arthrobacter nitroguajacolicus and 7)
Paenibacillus amylolyticus (de la Cruz Perera et al.,
2013, Ren et al., 2013).
Biofilm quantification by use of crystal violet
assay
Biofilm formation was assayed and quantified as
previously described (Ren et al., 2013). Briefly,
exponential phase cultures of the seven selected
strains were adjusted to an OD 600 of 0.15 in TSB
(Tryptic Soy Broth, Merck KgaA, Germany)
medium and then inoculated into Nunc-TSP plate
(Cat. No. 445497, Thermo Scientific, Denmark).
The inoculum volumes were 160 μL for
monospecies biofilms and 40 μL for each species in
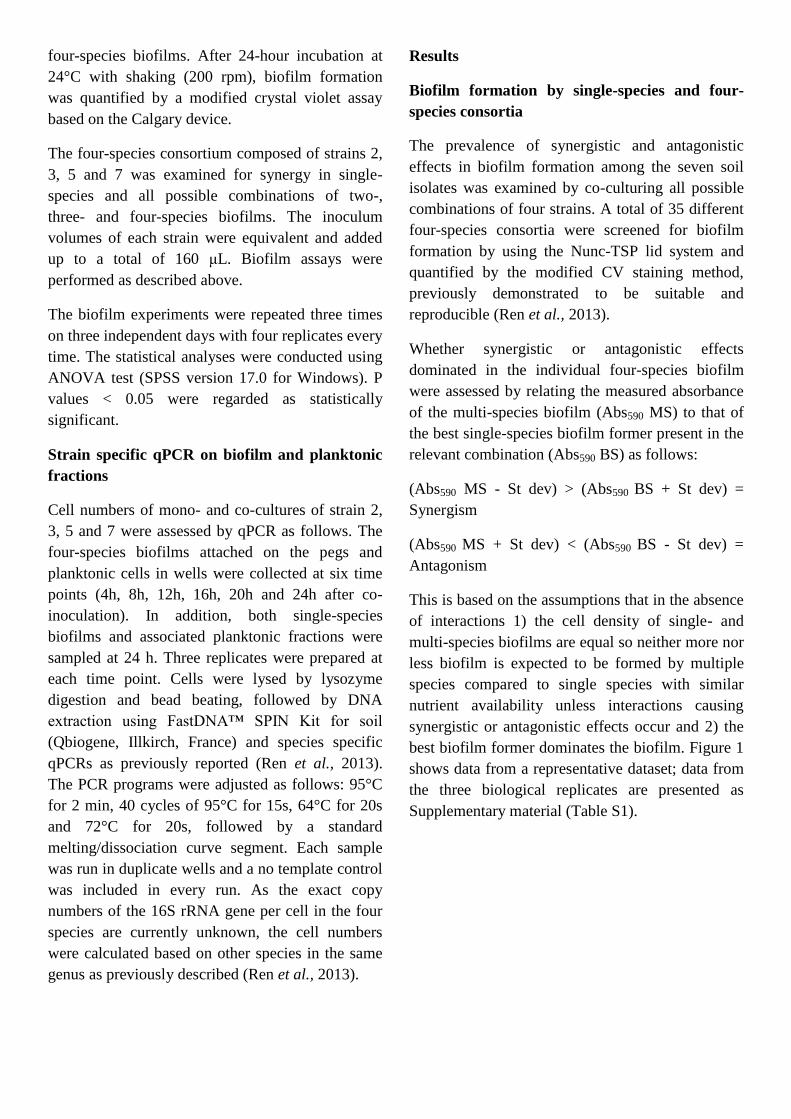
four-species biofilms. After 24-hour incubation at
24°C with shaking (200 rpm), biofilm formation
was quantified by a modified crystal violet assay
based on the Calgary device.
The four-species consortium composed of strains 2,
3, 5 and 7 was examined for synergy in single-
species and all possible combinations of two-,
three- and four-species biofilms. The inoculum
volumes of each strain were equivalent and added
up to a total of 160 μL. Biofilm assays were
performed as described above.
The biofilm experiments were repeated three times
on three independent days with four replicates every
time. The statistical analyses were conducted using
ANOVA test (SPSS version 17.0 for Windows). P
values < 0.05 were regarded as statistically
significant.
Strain specific qPCR on biofilm and planktonic
fractions
Cell numbers of mono- and co-cultures of strain 2,
3, 5 and 7 were assessed by qPCR as follows. The
four-species biofilms attached on the pegs and
planktonic cells in wells were collected at six time
points (4h, 8h, 12h, 16h, 20h and 24h after co-
inoculation). In addition, both single-species
biofilms and associated planktonic fractions were
sampled at 24 h. Three replicates were prepared at
each time point. Cells were lysed by lysozyme
digestion and bead beating, followed by DNA
extraction using FastDNA™ SPIN Kit for soil
(Qbiogene, Illkirch, France) and species specific
qPCRs as previously reported (Ren et al., 2013).
The PCR programs were adjusted as follows: 95°C
for 2 min, 40 cycles of 95°C for 15s, 64°C for 20s
and 72°C for 20s, followed by a standard
melting/dissociation curve segment. Each sample
was run in duplicate wells and a no template control
was included in every run. As the exact copy
numbers of the 16S rRNA gene per cell in the four
species are currently unknown, the cell numbers
were calculated based on other species in the same
genus as previously described (Ren et al., 2013).
Results
Biofilm formation by single-species and four-
species consortia
The prevalence of synergistic and antagonistic
effects in biofilm formation among the seven soil
isolates was examined by co-culturing all possible
combinations of four strains. A total of 35 different
four-species consortia were screened for biofilm
formation by using the Nunc-TSP lid system and
quantified by the modified CV staining method,
previously demonstrated to be suitable and
reproducible (Ren et al., 2013).
Whether synergistic or antagonistic effects
dominated in the individual four-species biofilm
were assessed by relating the measured absorbance
of the multi-species biofilm (Abs590 MS) to that of
the best single-species biofilm former present in the
relevant combination (Abs590 BS) as follows:
(Abs590 MS - St dev) > (Abs590 BS + St dev) =
Synergism
(Abs590 MS + St dev) < (Abs590 BS - St dev) =
Antagonism
This is based on the assumptions that in the absence
of interactions 1) the cell density of single- and
multi-species biofilms are equal so neither more nor
less biofilm is expected to be formed by multiple
species compared to single species with similar
nutrient availability unless interactions causing
synergistic or antagonistic effects occur and 2) the
best biofilm former dominates the biofilm. Figure 1
shows data from a representative dataset; data from
the three biological replicates are presented as
Supplementary material (Table S1).
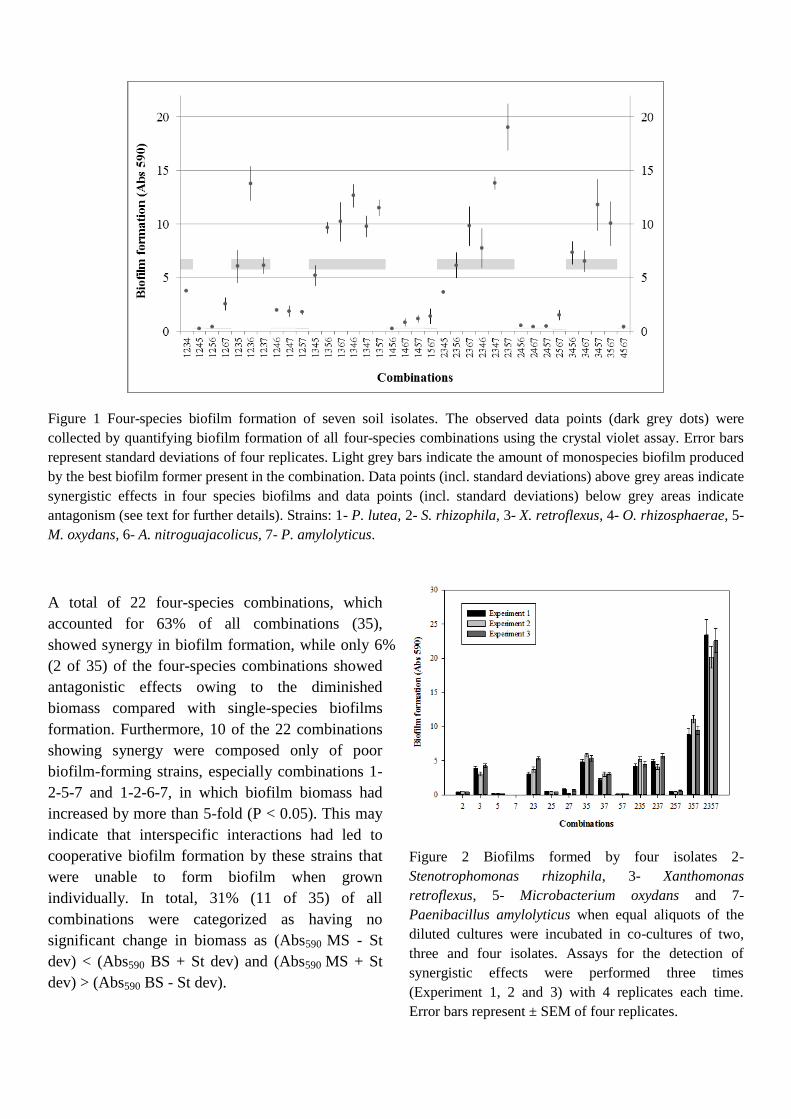
Figure 1 Four-species biofilm formation of seven soil isolates. The observed data points (dark grey dots) were
collected by quantifying biofilm formation of all four-species combinations using the crystal violet assay. Error bars
represent standard deviations of four replicates. Light grey bars indicate the amount of monospecies biofilm produced
by the best biofilm former present in the combination. Data points (incl. standard deviations) above grey areas indicate
synergistic effects in four species biofilms and data points (incl. standard deviations) below grey areas indicate
antagonism (see text for further details). Strains: 1- P. lutea, 2- S. rhizophila, 3- X. retroflexus, 4- O. rhizosphaerae, 5-
M. oxydans, 6- A. nitroguajacolicus, 7- P. amylolyticus.
A total of 22 four-species combinations, which
accounted for 63% of all combinations (35),
showed synergy in biofilm formation, while only 6%
(2 of 35) of the four-species combinations showed
antagonistic effects owing to the diminished
biomass compared with single-species biofilms
formation. Furthermore, 10 of the 22 combinations
showing synergy were composed only of poor
biofilm-forming strains, especially combinations 1-
2-5-7 and 1-2-6-7, in which biofilm biomass had
increased by more than 5-fold (P < 0.05). This may
indicate that interspecific interactions had led to
cooperative biofilm formation by these strains that
were unable to form biofilm when grown
individually. In total, 31% (11 of 35) of all
combinations were categorized as having no
significant change in biomass as (Abs590 MS - St
dev) < (Abs590 BS + St dev) and (Abs590 MS + St
dev) > (Abs590 BS - St dev).
Figure 2 Biofilms formed by four isolates 2-
Stenotrophomonas rhizophila, 3- Xanthomonas
retroflexus, 5- Microbacterium oxydans and 7-
Paenibacillus amylolyticus when equal aliquots of the
diluted cultures were incubated in co-cultures of two,
three and four isolates. Assays for the detection of
synergistic effects were performed three times
(Experiment 1, 2 and 3) with 4 replicates each time.
Error bars represent ± SEM of four replicates.
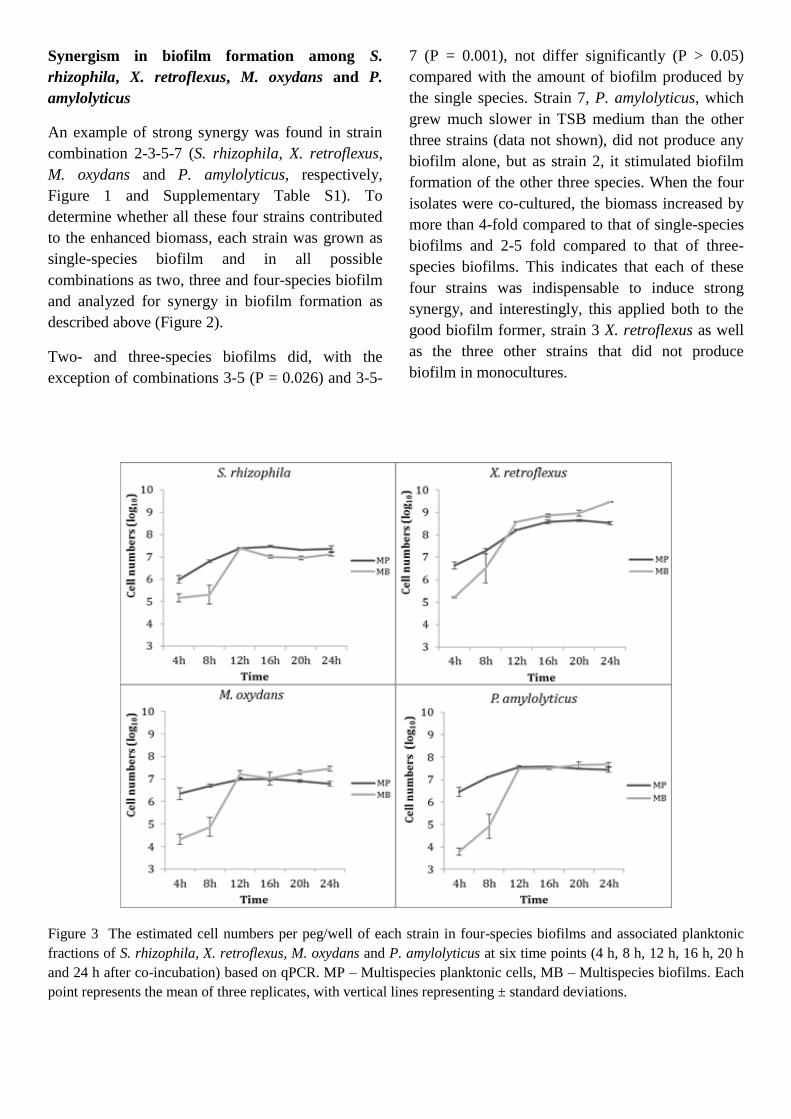
Synergism in biofilm formation among S.
rhizophila, X. retroflexus, M. oxydans and P.
amylolyticus
An example of strong synergy was found in strain
combination 2-3-5-7 (S. rhizophila, X. retroflexus,
M. oxydans and P. amylolyticus, respectively,
Figure 1 and Supplementary Table S1). To
determine whether all these four strains contributed
to the enhanced biomass, each strain was grown as
single-species biofilm and in all possible
combinations as two, three and four-species biofilm
and analyzed for synergy in biofilm formation as
described above (Figure 2).
Two- and three-species biofilms did, with the
exception of combinations 3-5 (P = 0.026) and 3-5-
7 (P = 0.001), not differ significantly (P > 0.05)
compared with the amount of biofilm produced by
the single species. Strain 7, P. amylolyticus, which
grew much slower in TSB medium than the other
three strains (data not shown), did not produce any
biofilm alone, but as strain 2, it stimulated biofilm
formation of the other three species. When the four
isolates were co-cultured, the biomass increased by
more than 4-fold compared to that of single-species
biofilms and 2-5 fold compared to that of three-
species biofilms. This indicates that each of these
four strains was indispensable to induce strong
synergy, and interestingly, this applied both to the
good biofilm former, strain 3 X. retroflexus as well
as the three other strains that did not produce
biofilm in monocultures.
Figure 3 The estimated cell numbers per peg/well of each strain in four-species biofilms and associated planktonic
fractions of S. rhizophila, X. retroflexus, M. oxydans and P. amylolyticus at six time points (4 h, 8 h, 12 h, 16 h, 20 h
and 24 h after co-incubation) based on qPCR. MP – Multispecies planktonic cells, MB – Multispecies biofilms. Each
point represents the mean of three replicates, with vertical lines representing ± standard deviations.

Cell numbers in mono- and co-cultures
Specific qPCRs were performed in order to evaluate
the total cell numbers of each strain in both biofilms
and planktonic communities at different stages of
multi-species biofilm development. Additionally,
the cell numbers in single-species biofilms and
planktonic cells at 24 h were measured. The DNA
samples from different time points were diluted
appropriately in order to yield results within the
dynamic range of the standard curves, which were
generated using duplicate 10-fold dilutions of
plasmid DNAs (Ren et al., 2013). R-Square (RSq)
values, based on threshold cycles of the standard
curves, ranged from 0.988 to 1 and application
efficiencies (E) ranged from 84.7 - 98.0 %
(Supplementary material, Table S2).
The cell numbers of each species in the
multispecies biofilm (peg) and in the associated
planktonic fraction (well) are shown in Figure 3. In
general, a marked increase in cell numbers was
observed from 4h to 12h for all of the four strains in
the biofilm fraction. After 12 hours, only the cell
numbers of strain 3 increased continuously, whereas
those of the other three species in the multi-species
biofilm remained constant or decreased. Cell
numbers of all four species in the planktonic
fraction increased during the first 12-16 hours,
hereafter planktonic growth leveled off, indicating
nutrient depletion and transition to a steady state
condition.
Strains
S. rhizophila X. retroflexus M. oxydans P. amylolyticus
Cell
num
bers
(lo
g1
0)
0
2
4
6
8
10
Multispecies biofilms
Single-species biofilms
Figure 4 The estimated cell numbers for each strain (S. rhizophila, X. retroflexus, M. oxydans and P. amylolyticus) in
four-species and single-species biofilms at 24h. Bars represent means ± standard deviation for three replicates.

The cell numbers of each strain in the multi-
species biofilm and in the single-species biofilms
at 24h are shown in Figure 4. For all of the four
species, cell numbers were significantly higher
(P < 0.05) in four-species biofilms compared to
single-species biofilms, indicative of individual
fitness gains when joining the multispecies
biofilm, when interpreting enhanced cell
numbers in biofilms as fitness gain.
The ratio of total cell numbers at 24h of the four
strains S. rhizophila, X. retroflexus, M. oxydans
and P. amylolyticus was 4:900:9:15 in
multispecies biofilms (Table 1). Thus, there is a
strong dominance of X. retroflexus in the four-
species biofilm, as this strain constitutes > 97%
of the total cell number. It is worth noticing that,
in contrast to biofilms (Figure 4), planktonic cell
numbers of the four species, except for P.
amylolyticus, are lower in the four-species co-
culture compared to single-species planktonic
biomass (Table 1). The summarized cell
numbers from the biofilm and the planktonic
fraction from a specific well are not
representative of the cell number of that well
because there are other surfaces available for
bacterial attachment in the wells besides the pegs.
Discussion
High prevalence of synergism in biofilm
formation
Single-species biofilms are rare in natural
environments, especially in agricultural soil where
micro-communities exposed to plenty of organic
matter have the potential to develop into
multispecies biofilms with high bacterial density
and diversity (Burmølle et al., 2010, Narisawa et al.,
2008, Rodríguez and Bishop 2007). Such conditions
in bacterial habitats are likely to facilitate the
development of intricate relationships between
different species. While many previous studies have
focused on interspecies interactions within oral
microbial communities (Kuramitsu et al., 2007,
Palmer Jr et al., 2001, Saito et al., 2008, Sharma et
al., 2005, Wang and Kuramitsu 2005), research on
multispecies biofilms composed of soil bacteria is
still in its infancy. In this study, seven soil bacteria,
isolated from one micro-habitat, were screened in
order to assess the prevalence of interactions
leading to synergism in biofilm formation of four-
species co-cultures.
Table 1 Absolute cell numbers per peg/well measured by quantitative PCRs at 24h in multispecies planktonic cells,
single-species planktonic cells, multispecies biofilms and single-species biofilms. Each value is the mean of three
replicates.
Strains Multispecies
planktonic cells
Single-species
planktonic cells
Multispecies
biofilms
Single-species
biofilms
S. rhizophila 2.33E+07 5.79E+07 1.35E+07 9.14E+03
X. retroflexus 3.38E+08 5.46E+08 2.97E+09 4.92E+07
M. oxydans 6.42E+06 1.58E+08 2.93E+07 4.73E+04
P. amylolyticus 2.81E+07 1.33E+07 4.78E+07 2.10E+03

In total, 63% of four-species biofilms showed
synergistic effects in biofilm formation while only 6%
displayed antagonistic activity. This is in agreement
with the assumption that the driving force in
bacterial community development is the self-
organization and cooperation rather than
competition of individual microorganisms (Daniels
et al., 2004, Davies et al., 1998, Parsek and
Greenberg 2005). The recently presented “Black
Queen Hypothesis”, explains how multispecies
cooperation can evolve (Morris et al., 2012). This
hypothesis considers cooperation in complex
bacterial communities as being a consequence of
species adapting to the presence of each other. In
order to enhance own fitness, species delete vital
functions or pathways that are provided by the
surrounding bacteria. This leads to a dependency
and is therefore an irreversible commitment to
living in close association with other species, which
may often require development of more complex
systems to ensure that the coexistence is maintained.
When applying the Black Queen Hypothesis on the
results of the present study, the strains may prefer
living in the multispecies biofilm in order to keep
vital partners in close contact, or the ability of
biofilm formation could be the function that is lost
by some of the species.
The synergistic interactions were also observed
when four poor biofilm formers were co-cultured
(Figure 1), which verified the previous findings
wherein the biofilm forming ability of individual
bacteria is not necessarily an indicator of their
potential in multispecies biofilms (Bharathi et al.,
2011, Burmølle et al., 2006). This shifting of
biofilm pattern from weak to moderate or strong
can be the result of metabolic interactions (Møller
et al., 1998), enhanced coaggregation (Rickard et
al., 2003), organized spatial distribution (Skillman
et al., 1998) and/or facilitated initial surface
attachment (Klayman et al., 2009, Simões et al.,
2008), e.g. bridging bacteria may facilitate the
association of other species that do not coaggregate
directly with each other. Thus, species that do not
form biofilms as single strains may benefit from the
advantages associated to biofilm formation,
including enhanced protection from outside stress
and expanded niche availability, by engaging in
multispecies communities.
In contrast to our results, Foster et al., recently
showed that the great majority of interactions in
pairwise species combinations of bacterial isolates
from tree-hole rainwater pools were net negative
and very few strong higher-order positive effects
arose from combinations composed of more than
two species (Foster and Bell 2012). The two studies
differ with respect to bacterial habitats targeted for
isolation (soil vs. tree-holes), productivity
parameter assessed (biofilm formation vs. CO2
production) and different definitions of
synergism/cooperation, which may explain the
observed differences. The tree-hole species tend to
use similar resources which may be the key factor
that lead to competition among microbes (Lawrence
et al., 2012), while in nutrient rich agricultural soil,
bacteria are likely to be tightly associated and by
their collective metabolic activities, individual
bacterial consortia stabilize their environment and
fertilize the soil. The key to whether bacterial
species compete or cooperate may lie in their
possibility of long-term co-adaptation and degree of
niche overlap. We are currently investigating the
significance of these parameters for the net
interactions of bacterial communities.
Enhanced biofilm formation in co-cultures
When exploring strain dynamics of the selected
four-species community, the strongest synergy was
induced only when all the four strains S. rhizophila,
X. retroflexus, M. oxydans and P. amylolyticus were
co-cultivated (Figure 2). This demonstrates that
each strain played an important role in the enhanced
biofilm formation, regardless of the capability of
single-species biofilm formation. Divergence in
resource use may be one of the reasons that lead to
increased productivity of the entire community. By
adapting to consume different resources, and to
metabolize waste products produced by other
species, the consortium collectively decompose
substrates in the medium more effectively. In the
present study, the synergistic enhancement of
biomass of the four co-cultured species was only
observed when grown as a biofilm; Planktonic co-
culturing did not lead to changes in overall biomass
(data not shown). This indicates that a structured
environment is highly important for the synergy to
occur. Thus co-metabolism (syntrophy) may
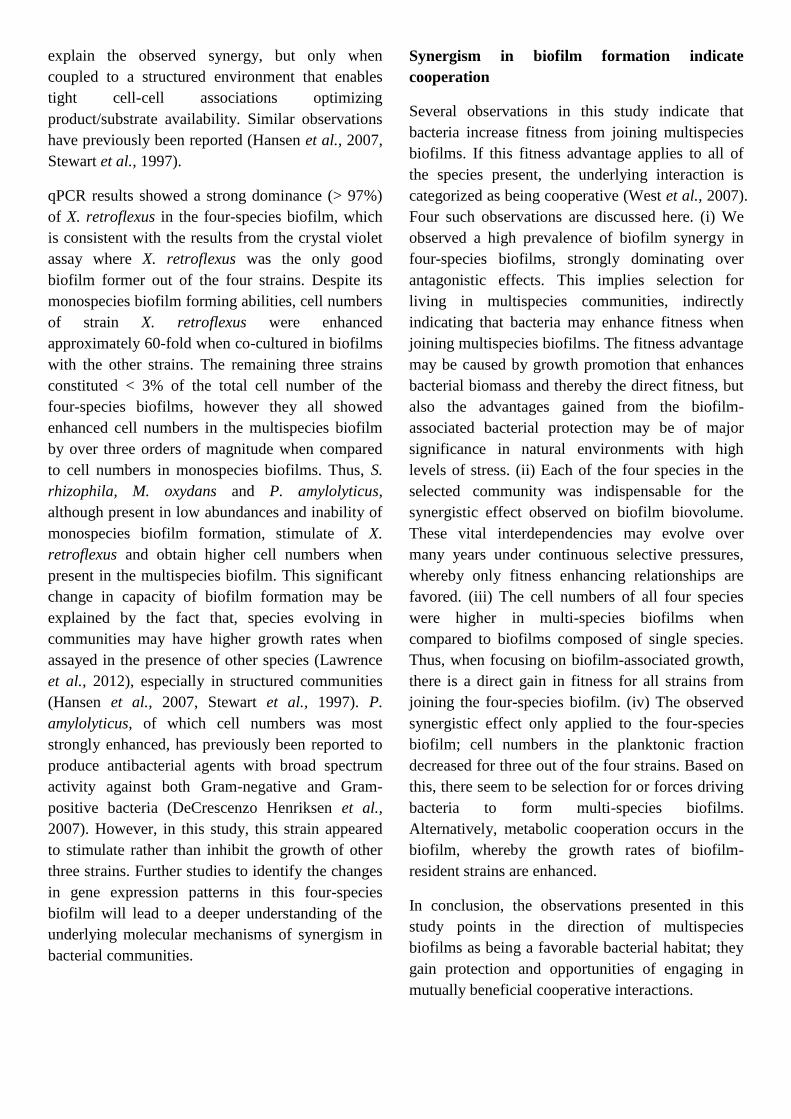
explain the observed synergy, but only when
coupled to a structured environment that enables
tight cell-cell associations optimizing
product/substrate availability. Similar observations
have previously been reported (Hansen et al., 2007,
Stewart et al., 1997).
qPCR results showed a strong dominance (> 97%)
of X. retroflexus in the four-species biofilm, which
is consistent with the results from the crystal violet
assay where X. retroflexus was the only good
biofilm former out of the four strains. Despite its
monospecies biofilm forming abilities, cell numbers
of strain X. retroflexus were enhanced
approximately 60-fold when co-cultured in biofilms
with the other strains. The remaining three strains
constituted < 3% of the total cell number of the
four-species biofilms, however they all showed
enhanced cell numbers in the multispecies biofilm
by over three orders of magnitude when compared
to cell numbers in monospecies biofilms. Thus, S.
rhizophila, M. oxydans and P. amylolyticus,
although present in low abundances and inability of
monospecies biofilm formation, stimulate of X.
retroflexus and obtain higher cell numbers when
present in the multispecies biofilm. This significant
change in capacity of biofilm formation may be
explained by the fact that, species evolving in
communities may have higher growth rates when
assayed in the presence of other species (Lawrence
et al., 2012), especially in structured communities
(Hansen et al., 2007, Stewart et al., 1997). P.
amylolyticus, of which cell numbers was most
strongly enhanced, has previously been reported to
produce antibacterial agents with broad spectrum
activity against both Gram-negative and Gram-
positive bacteria (DeCrescenzo Henriksen et al.,
2007). However, in this study, this strain appeared
to stimulate rather than inhibit the growth of other
three strains. Further studies to identify the changes
in gene expression patterns in this four-species
biofilm will lead to a deeper understanding of the
underlying molecular mechanisms of synergism in
bacterial communities.
Synergism in biofilm formation indicate
cooperation
Several observations in this study indicate that
bacteria increase fitness from joining multispecies
biofilms. If this fitness advantage applies to all of
the species present, the underlying interaction is
categorized as being cooperative (West et al., 2007).
Four such observations are discussed here. (i) We
observed a high prevalence of biofilm synergy in
four-species biofilms, strongly dominating over
antagonistic effects. This implies selection for
living in multispecies communities, indirectly
indicating that bacteria may enhance fitness when
joining multispecies biofilms. The fitness advantage
may be caused by growth promotion that enhances
bacterial biomass and thereby the direct fitness, but
also the advantages gained from the biofilm-
associated bacterial protection may be of major
significance in natural environments with high
levels of stress. (ii) Each of the four species in the
selected community was indispensable for the
synergistic effect observed on biofilm biovolume.
These vital interdependencies may evolve over
many years under continuous selective pressures,
whereby only fitness enhancing relationships are
favored. (iii) The cell numbers of all four species
were higher in multi-species biofilms when
compared to biofilms composed of single species.
Thus, when focusing on biofilm-associated growth,
there is a direct gain in fitness for all strains from
joining the four-species biofilm. (iv) The observed
synergistic effect only applied to the four-species
biofilm; cell numbers in the planktonic fraction
decreased for three out of the four strains. Based on
this, there seem to be selection for or forces driving
bacteria to form multi-species biofilms.
Alternatively, metabolic cooperation occurs in the
biofilm, whereby the growth rates of biofilm-
resident strains are enhanced.
In conclusion, the observations presented in this
study points in the direction of multispecies
biofilms as being a favorable bacterial habitat; they
gain protection and opportunities of engaging in
mutually beneficial cooperative interactions.
Acknowledgements
This study was partly funded by grants to SJS and MB
from the Danish Innovation Consortium SiB, ref no:
11804520, and The Danish Council for Independent
Research; ref no: DFF-1335- 00071 and ref no: DFF-
1323-00235 (SIMICOM).
References
Bharathi P, Bhowmick P, Shekar M, Karunasagar I
(2011). Biofilm formation by pure and mixed culture of
Lactobacillus isolates on polystyrene surface in varying
nutrient conditions. Biotechnol. Bioinf. Bioeng. 1: 93-98.
Burmølle M, Webb JS, Rao D, Hansen LH, Sørensen SJ,
Kjelleberg S (2006). Enhanced biofilm formation and
increased resistance to antimicrobial agents and bacterial
invasion are caused by synergistic interactions in
multispecies biofilms. Applied and environmental
microbiology 72: 3916-3923.
Burmølle M, Thomsen TR, Fazli M, Dige I, Christensen
L, Homøe P et al., (2010). Biofilms in chronic infections
– a matter of opportunity–monospecies biofilms in
multispecies infections. FEMS Immunology & Medical
Microbiology 59: 324-336.
Burmølle M, Kjøller A, Sørensen SJ (2012). An
Invisible Workforce: Biofilms in the Soil. Microbial
Biofilms: Current Research and Applications: 61.
Burmølle M, Ren D, Bjarnsholt T, Sørensen SJ (2013).
Interactions in multispecies biofilms: do they actually
matter? Trends in Microbiology, In Press: DOI:
10.1016/j.tim.2013.12.004
Daniels R, Vanderleyden J, Michiels J (2004). Quorum
sensing and swarming migration in bacteria. FEMS
microbiology reviews 28: 261-289.
Davey ME, O'toole GA (2000). Microbial biofilms: from
ecology to molecular genetics. Microbiology and
molecular biology reviews 64: 847-867.
Davies DG, Parsek MR, Pearson JP, Iglewski BH,
Costerton J, Greenberg E (1998). The involvement of
cell-to-cell signals in the development of a bacterial
biofilm. Science 280: 295-298.
de la Cruz Perera CI, Ren D, Blanchet M, Dendooven L,
Marsch R, Sørensen SJ et al., (2013). The ability of soil
bacteria to receive the conjugative IncP1 plasmid,
pKJK10, is different in a mixed community compared to
single strains. FEMS Microbiology Letters 338: 95-100.
DeCrescenzo Henriksen E, Phillips D, Peterson J (2007).
Polymyxin E production by P. amylolyticus. Letters in
applied microbiology 45: 491-496.
Diaz PI, Xie Z, Sobue T, Thompson A, Biyikoglu B,
Ricker A et al., (2012). Synergistic interaction between
Candida albicans and commensal oral streptococci in a
novel in vitro mucosal model. Infection and immunity 80:
620-632.
Filoche S, Anderson S, Sissons C (2004). Biofilm
growth of Lactobacillus species is promoted by
Actinomyces species and Streptococcus mutans. Oral
microbiology and immunology 19: 322-326.
Foster KR, Bell T (2012). Competition, not cooperation,
dominates interactions among culturable microbial
species. Current Biology 22: 1845-1850.
Hall-Stoodley L, Costerton JW, Stoodley P (2004).
Bacterial biofilms: from the natural environment to
infectious diseases. Nature Reviews Microbiology 2: 95-
108.
Hansen SK, Rainey PB, Haagensen JA, Molin S (2007).
Evolution of species interactions in a biofilm community.
Nature 445: 533-536.
Jefferson KK (2004). What drives bacteria to produce a
biofilm? FEMS microbiology letters 236: 163-173.
Klayman BJ, Volden PA, Stewart PS, Camper AK
(2009). Escherichia coli O157: H7 requires colonizing
partner to adhere and persist in a capillary flow cell.
Environmental science & technology 43: 2105-2111.
Kuramitsu HK, He X, Lux R, Anderson MH, Shi W
(2007). Interspecies interactions within oral microbial
communities. Microbiology and molecular biology
reviews 71: 653-670.
Lawrence D, Fiegna F, Behrends V, Bundy JG,
Phillimore AB, Bell T et al., (2012). Species interactions
alter evolutionary responses to a novel environment.
PLoS biology 10: e1001330.
Lee KWK, Periasamy S, Mukherjee M, Xie C,
Kjelleberg S, Rice SA (2013). Biofilm development and
enhanced stress resistance of a model, mixed-species
community biofilm. The ISME journal 1-14.
Morris JJ, Lenski RE, Zinser ER (2012). The Black
Queen Hypothesis: evolution of dependencies through
adaptive gene loss. MBio 3: DOI: 10.1128/mBio.00036–
12
Møller S, Sternberg C, Andersen JB, Christensen BB,
Ramos JL, Givskov M et al., (1998). In situ gene
expression in mixed-culture biofilms: evidence of
metabolic interactions between community members.
Applied and environmental microbiology 64: 721-732.
Narisawa N, Haruta S, Arai H, Ishii M, Igarashi Y
(2008). Coexistence of antibiotic producing and
antibiotic-sensitive bacteria in biofilms is mediated by
resistant bacteria. Applied and environmental
microbiology 74: 3887-3894.
Palmer Jr RJ, Kazmerzak K, Hansen MC, Kolenbrander
PE (2001). Mutualism versus independence: strategies of
mixed-species oral biofilms in vitro using saliva as the
sole nutrient source. Infection and immunity 69: 5794-
5804.
Parsek MR, Greenberg E (2005). Sociomicrobiology:
the connections between quorum sensing and biofilms.
Trends in microbiology 13: 27-33.
Rao D, Webb JS, Kjelleberg S (2005). Competitive
interactions in mixed-species biofilms containing the
marine bacterium Pseudoalteromonas tunicata. Applied
and environmental microbiology 71: 1729-1736.
Ren D, Madsen J, Cruz-Perera C, Bergmark L, Sørensen
S, Burmølle M (2013). High-Throughput Screening of
Multispecies Biofilm Formation and Quantitative PCR-
Based Assessment of Individual Species Proportions,
Useful for Exploring Interspecific Bacterial Interactions.
Microbial ecology: DOI: 10.1007/s00248-013-0315-z
Rickard AH, Gilbert P, High NJ, Kolenbrander PE,
Handley PS (2003). Bacterial coaggregation: an integral
process in the development of multi-species biofilms.
Trends in microbiology 11: 94-100.
Rodríguez SJ, Bishop PL (2007). Three-dimensional
quantification of soil biofilms using image analysis.
Environmental Engineering Science 24: 96-103.
Saito Y, Fujii R, Nakagawa KI, Kuramitsu H, Okuda K,
Ishihara K (2008). Stimulation of Fusobacterium
nucleatum biofilm formation by Porphyromonas
gingivalis. Oral microbiology and immunology 23: 1-6.
Sharma 420 A, Inagaki S, Sigurdson W, Kuramitsu H
(2005). Synergy between Tannerella forsythia and
Fusobacterium nucleatum in biofilm formation. Oral
microbiology and immunology 20: 39-42.
Simões LC, Simoes M, Vieira MJ (2008). Intergeneric
coaggregation among drinking water bacteria: evidence
of a role for Acinetobacter calcoaceticus as a bridging
bacterium. Applied and environmental microbiology 74:
1259-1263.
Skillman LC, Sutherland IW, Jones MV, Goulsbra A
(1998). Green fluorescent protein as a novel species-
specific marker in enteric dual-species biofilms.
Microbiology 144: 2095-2101.
Stewart PS, Camper AK, Handran S, Huang C-T,
Warnecke M (1997). Spatial distribution and coexistence
of Klebsiella pneumoniae and Pseudomonas aeruginosa
in biofilms. Microbial ecology 33: 2-10.
Sørensen SJ, Bailey M, Hansen LH, Kroer N, Wuertz S
(2005). Studying plasmid horizontal transfer in situ: a
critical review. Nature Reviews Microbiology 3: 700-
710.
Wang BY, Kuramitsu HK (2005). Interactions between
oral bacteria: inhibition of Streptococcus mutans
bacteriocin production by Streptococcus gordonii.
Applied and environmental microbiology 71: 354-362.
West SA, Diggle SP, Buckling A, Gardner A, Griffin AS
(2007). The social lives of microbes. Annual Review of
Ecology, Evolution, and Systematics 38: 53-77.
Yamada M, Ikegami A, Kuramitsu HK (2005).
Synergistic biofilm formation by Treponema denticola
and Porphyromonas gingivalis. FEMS microbiology
letters 250: 271-277.

Supplementary Table 1
Biofilms formed by single species and combinations (four strains). 40μL of each of the four diluted cultures
was inoculated in each well. The plate was incubated for 24 h followed by crystal violet staining and
absorbance measurements at 590 nm. The ratio of (Abs 590 multispecies biofilm – St dev) / (Abs 590 best
strain + St dev) or (Abs 590 multispecies biofilm + St dev) / (Abs 590 best strain - St dev) was calculated
and the average value from three experiments is presented as the “Fold change”.
Strains Biofilm formation (Abs 590)
a
Fold change Experiment-1 Experiment-2 Experiment-3
1 c 0.143 ± 0.038
b 0.180 ± 0.106 0.256 ± 0.036 -
2 0.126 ± 0.011 0.077 ± 0.004 0.077 ± 0.016 -
3 3.769 ± 0.589 6.606 ± 1.171 6.245 ± 0.502 -
4 0.381 ± 0.009 0.190 ± 0.037 0.302 ± 0.011 -
5 0.157 ± 0.009 0.094 ± 0.048 0.166 ± 0.018 -
6 0.055 ± 0.014 0.049 ± 0.028 0.149 ± 0.073 -
7 0.004 ± 0.003 0.017 ± 0.004 0.033 ± 0.010 -
1234 3.763 ± 0.289 4.649 ± 0.435 3.777 ± 0.144 0.910
1245 0.245 ± 0.021 0.281 ± 0.037 0.247 ± 0.030 Nd
1256 0.593 ± 0.084 0.992 ± 0.490 0.390 ± 0.061 1.767
1267 0.668 ± 0.176 1.895 ± 0.320 2.564 ± 0.589 5.325
1235 4.642 ± 0.689 10.889 ± 0.905 6.050 ± 1.544 N
1236 13.734 ± 0.433 12.697 ± 2.195 13.790 ± 1.572 1.910
1237 6.290 ± 1.043 6.937 ± 1.727 6.142 ± 0.742 N
1246 0.633 ± 0.241 1.972 ± 0.621 1.978 ± 0.093 3.001
1247 0.882 ± 0.049 0.987 ± 0.253 1.840 ± 0.511 3.113
1257 1.146 ± 0.207 1.947 ± 0.464 1.782 ± 0.187 5.292
1345 5.246 ± 0.806 10.877 ± 2.125 5.198 ± 0.961 N
1356 8.454 ± 1.014 11.587 ± 0.575 9.646 ± 0.526 1.460
1367 9.950 ± 1.818 11.033 ± 0.339 10.226 ± 1.822 1.442
1346 10.528 ± 0.676 12.201 ± 1.132 12.650 ± 1.069 1.721
1347 13.542 ± 0.905 12.526 ± 1.317 9.806 ± 0.983 1.730
1357 13.078 ± 1.068 13.601 ± 0.622 11.502 ± 0.738 1.893
1456 0.168 ± 0.049 0.103 ± 0.013 0.268 ± 0.005 0.741
1467 1.053 ± 0.298 0.707 ± 0.175 0.839 ± 0.394 1.862
1457 1.257 ± 0.155 0.676 ± 0.173 1.169 ± 0.334 2.624
1567 0.876 ± 0.143 0.498 ± 0.220 1.375 ± 0.694 2.229
2345 3.452 ± 0.655 6.246 ± 0.559 3.674 ± 0.091 N
2356 7.292 ± 1.099 7.646 ± 1.411 6.153 ± 1.172 N
2367 9.224 ± 0.588 9.102 ± 1.934 9.813 ± 1.833 1.260
2346 7.436 ± 1.394 6.762 ± 0.894 7.757 ± 1.833 N
2347 14.468 ± 1.888 15.250 ± 0.894 13.813 ± 0.588 2.127
2357 21.067 ± 1.335 22.885 ± 2.816 19.045 ± 2.158 3.002
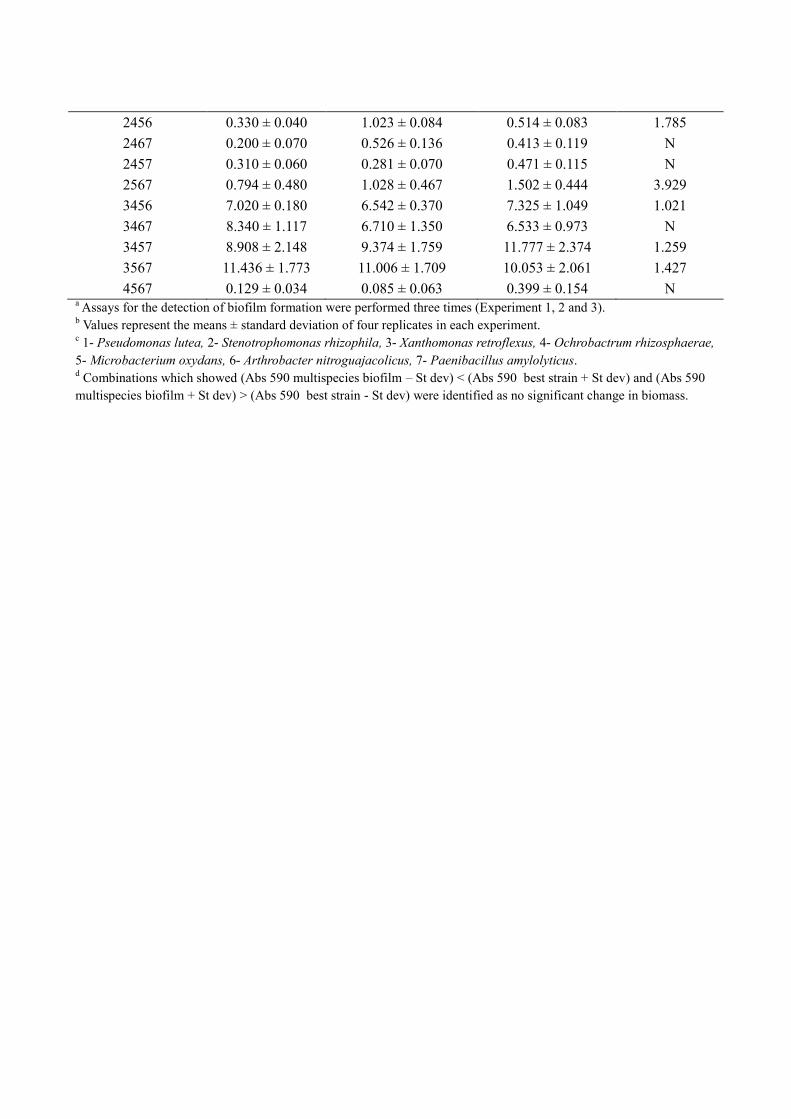
2456 0.330 ± 0.040 1.023 ± 0.084 0.514 ± 0.083 1.785
2467 0.200 ± 0.070 0.526 ± 0.136 0.413 ± 0.119 N
2457 0.310 ± 0.060 0.281 ± 0.070 0.471 ± 0.115 N
2567 0.794 ± 0.480 1.028 ± 0.467 1.502 ± 0.444 3.929
3456 7.020 ± 0.180 6.542 ± 0.370 7.325 ± 1.049 1.021
3467 8.340 ± 1.117 6.710 ± 1.350 6.533 ± 0.973 N
3457 8.908 ± 2.148 9.374 ± 1.759 11.777 ± 2.374 1.259
3567 11.436 ± 1.773 11.006 ± 1.709 10.053 ± 2.061 1.427
4567 0.129 ± 0.034 0.085 ± 0.063 0.399 ± 0.154 N a Assays for the detection of biofilm formation were performed three times (Experiment 1, 2 and 3).
b Values represent the means ± standard deviation of four replicates in each experiment.
c 1- Pseudomonas lutea, 2- Stenotrophomonas rhizophila, 3- Xanthomonas retroflexus, 4- Ochrobactrum rhizosphaerae,
5- Microbacterium oxydans, 6- Arthrobacter nitroguajacolicus, 7- Paenibacillus amylolyticus. d Combinations which showed (Abs 590 multispecies biofilm – St dev) < (Abs 590 best strain + St dev) and (Abs 590
multispecies biofilm + St dev) > (Abs 590 best strain - St dev) were identified as no significant change in biomass.
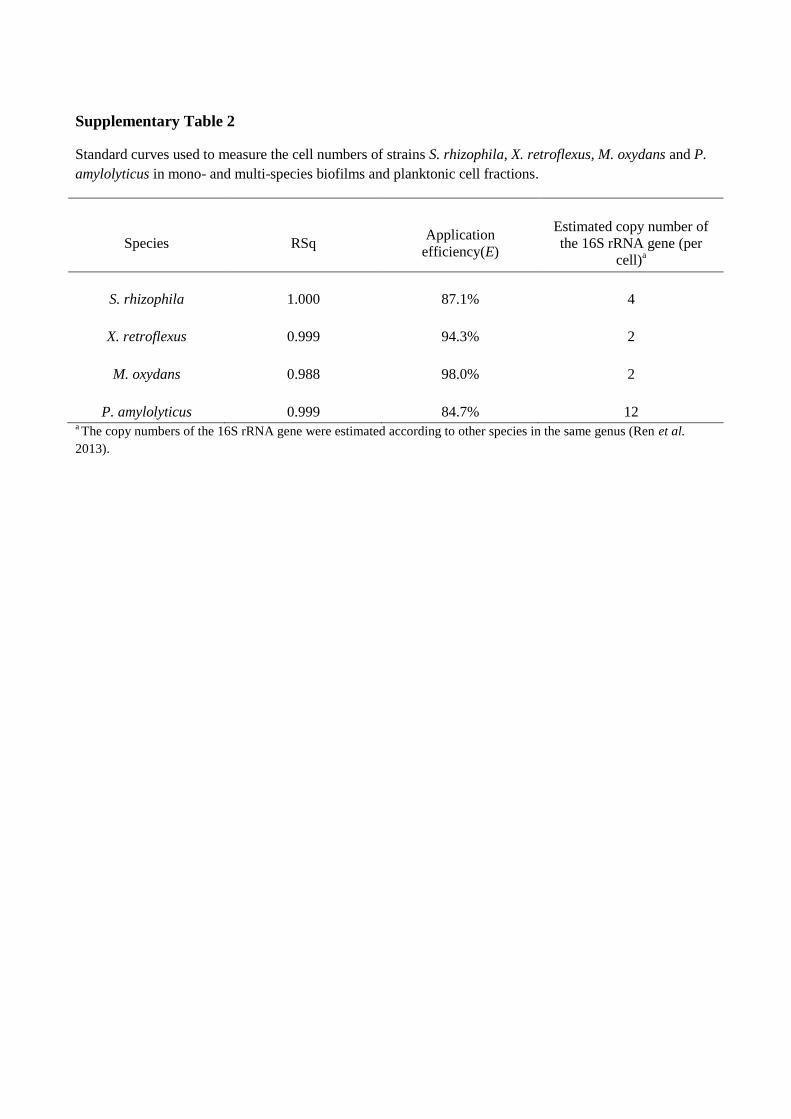
Supplementary Table 2
Standard curves used to measure the cell numbers of strains S. rhizophila, X. retroflexus, M. oxydans and P.
amylolyticus in mono- and multi-species biofilms and planktonic cell fractions.
Species RSq Application
efficiency(E)
Estimated copy number of
the 16S rRNA gene (per
cell)a
S. rhizophila 1.000 87.1% 4
X. retroflexus 0.999 94.3% 2
M. oxydans 0.988 98.0% 2
P. amylolyticus 0.999 84.7% 12 a The copy numbers of the 16S rRNA gene were estimated according to other species in the same genus (Ren et al.
2013).
Manuscript 3
Metatranscriptome analysis of multispecies biofilms indicates strain- and community-
dependent changes in gene expression

Metatranscriptome analysis of multispecies biofilms indicates strain- and
community- dependent changes in gene expression
Lea Benedicte Skov Hansen+, Dawei Ren
+, Søren J. Sørensen*, Mette Burmølle*
+Shared first authorship
Section of Microbiology, Department of Biology, University of Copenhagen
*Corresponding authors
Postal address: Universitetsparken 15, Bygn. 1, 2100 København Ø, Denmark
e-mail Mette Burmølle: [email protected] e-mail Søren J. Sørensen: [email protected]
Key words: Metatranscriptome / Multispecies biofilm / Soil bacteria / Synergistic interactions
Abstract
It has gradually become more apparent that bacteria often exist in naturally formed multispecies
biofilms. Within these biofilms interspecies interaction seems to play an important role in shaping
the function and activities of these dynamic communities. However, little is known about the effect
of interspecies interaction on a gene expression level in these multispecies biofilms. This study
represents a comparative gene expression analysis of the Xanthomonas retroflexus transcriptomes
when grown in a single-species biofilm and in dual- and four-species biofilms with
Stenotrophomonas rhizophila, Microbacterium oxydans and Paenibacillus amylolyticus. The result
revealed a species specific response to coexistence in the dual-species biofilm, where the overall
strongest change in expression profile was observed in the dual-species biofilms of X. retroflexus
and P. amylolyticus. Furthermore, a distinct expression pattern was detected in the four-species
biofilm including changes in expression of genes, which were not observed differentially expressed
in any of the dual-species biofilms. This non-linear response in the four-species biofilm indicates a
complex interaction pattern at the gene regulation level when increasing the number of species in
the co-cultures. This is in correspondence with the previously described emergent behaviour of
enhanced biofilm formation by this specific four-species consortia isolated from soil [1]. 70 genes
were found differentially expressed when co-culturing X. retroflexus with other species, which
include genes involved in amino acid metabolism, membrane bound efflux system and MazE/MazF
toxin-antitoxin system, suggesting the enhanced resistance of multispecies biofilms.

Introduction
It is now acknowledged that biofilms, as the
dominant microbial lifestyle in nature, are
composed of multiple species, where extensive
interactions between different species are
bound to play a crucial role in shaping these
dynamic communities [2]. In general,
interspecies interactions, either synergistic or
antagonistic, involve physical contact,
metabolic communication, quorum sensing and
genetic exchange [3]. The synergistic effect of
living as a mixed community, which often
exhibits enhanced biomass compared with
either single species grown alone, is implicated
in the development of several beneficial
phenotypes, including promoted cell attachment
due to coaggregation [4], co-metabolism where
one species takes advantage of the metabolite
produced by a neighbouring species [5], and
cross-species protection against antimicrobials
or host immune responses [6, 7]. The
synergistic interactions in multispecies biofilms
are considered to be an effective strategy in
degrading organic matter [8, 9] in nature and
evading host clearance in chronic infections
[10], indicating the profound impact
interactions have both on major ecological
processes and on clinical settings.
While the reductionist approach has advanced
biofilm research by analysing single-species
biofilms or individual species in a complex
microbial community, interactions between
different organisms within multispecies
biofilms as a key area for providing insight into
evolutionary ecology and developing new
therapeutics, is still in its infancy. The rise of
metatranscriptomic analysis to study the global
gene expression profiling of the whole
microbial communities, has been greatly
accelerated by RNA-Seq in the past few years,
and thus opens new possibilities for clarifying
the functional interaction networks within
multispecies microbial communities. This new
technology has been recently applied to an oral
biofilm model [11], where cell-cell interactions
are believed to play integral roles in the
development of biofilm architecture and
pathogenicity. The dramatic changes in gene
expression profiles of this multispecies biofilm
model in the presence of periodontal pathogens
were accurately assessed. Moreover, small
noncoding RNAs with important gene
regulatory roles were identified, showing
promise of metatranscriptomic analysis in
complex microbial communities [11].
The synergism in a four-species biofilm
composed of Stenotrophomonas rhizophila,
Xanthomonas retroflexus, Microbacterium
oxydans and Paenibacillus amylolyticus, was
presented in our previous studies with increased
biofilm formation over 3-fold relative to single-
species biofilms [1]. As the only good biofilm
former, the prevalence (> 97% of total biofilm
cell number) of strain X. retroflexus was
demonstrated by species specific quantitative
PCR [12]. Moreover, despite of the low
abundance of three other strains, they were all
indispensable for the strong synergy that
occurred in the four-species biofilm which
make this consortium a powerful model to
study intricate interactions in multispecies
biofilms.
In the present study, the gene expression profile
of X. retroflexus in a single-species biofilm was
compared to its expression profiles in dual-
species biofilms with S. rhizophila, M.oxydans
or P. amylolyticus as well as in a four-species
biofilm. This represents, to our knowledge, the
first evaluation of gene expression changes due
to the interspecies interactions in a multispecies
biofilm model composed of soil isolates. We
utilized an RNA-Seq-based metatranscriptomic

approach, and found a significant effect of the
interspecies interactions on the gene expression.
Materials and methods
Bacterial strains and growth conditions
The four species used in this study were
Stenotrophomonas rhizophila (JQ890538),
Xanthomonas retroflexus (JQ890537),
Microbacterium oxydans (JQ890539), and
Paenibacillus amylolyticus (JQ890540) [1].
Strains were streaked from frozen glycerol
stocks onto TSA (Tryptic Soy Agar) plates and
incubated for 48h at 24°C. Hereafter, the
freshly isolated colonies were transferred into 5
mL of TSB (Tryptic Soy Broth) and incubated
with shaking (250 rpm) at 24°C overnight.
Biofilm cultivation
Biofilms for gene expression analysis by RNA-
sequencing were grown in six-well polystyrene
plates (Greiner Bio-One, Germany). Overnight
cultures of each strain were subcultured to
exponential phase and adjusted to an OD600nm
of 0.15 in fresh TSB, as described by Ren et al.
2013 [1]. A total of 4 mL of single-species,
dual-species or four-species diluted cultures
(admixtures of each species at equal cell
density) were inoculated in each well and
allowed to grow for 24h at 24°C. Single- and
dual-species biofilms were prepared in
triplicate wells, while four-species biofilm were
prepared in five replicate wells.
DNA and RNA extraction
Isolation of genomic DNA from overnight
cultures of four bacteria was performed as
previously described using FastDNA™ SPIN
Kit for soil (Qbiogene, Illkirch, France) [1].
For RNA extraction, planktonic cells from
biofilm-containing wells were gently removed,
wells were rinsed three times using phosphate
buffer solution (PBS) and then the biofilms
were scraped with sterile pipette tips into 1 mL
of PBS. The biofilm suspensions were
immediately centrifuged and resuspended in
100 μL of PBS followed by addition of 500 μL
of RNAlater® (Ambion). The RNAlater-
preserved samples were kept at 4 °C overnight,
after which RNAlater was removed by adding
600 μL cold PBS and centrifuging at 8000 rpm
for 5 min at 4 °C. The pellet was resuspended
in 200 μL of lysozyme solution (20 μg/mL) and
incubated at room temperature for 10 min, with
vortexing for 10s every 2 min. After 700 μL of
buffer RLT was added and vortexed for 10s, the
obtained solution was transferred into bead-
beating tube (provided by the FastDNA™
SPIN Kit for soil) and bead beaten using the
Savant FastPrep FP120 for 30s at setting 5.0,
followed by centrifugation at 13000 rpm for 8
min at 4 °C. 0.85 mL of supernatant was
transferred to new microcentrifuge tube. 0.47
mL of 100% ethanol was added and mixed by
pipetting. 0.7mL of lysate was transferred on to
RNeasy mini spin column. Total RNA was then
further purified from each biofilm sample using
the RNeasy mini kit (Qiagen) according to
manufacturer’s instructions.
Genomic DNA removal was conducted
according to the instructions in DNAfree™ Kit
(Ambion), except the incubation time was
extended to 1 hour. The complete removal of
DNA was confirmed by RT-qPCR using 20 µL
SYBR Green reactions on Mx 3000 (Stratagene,
Cedar Creek, Texas). The qPCR targeted the
16S rRNA gene by the eubacterial primers
EUB338 and EUB518 [13]. All qPCR reactions
were run in technical duplicates and contained
10 µL of Brilliant III SYBR Green QPCR
Master Mix (Stratagene, Cedar Creek, Texas), 1
µL forward primer (final concentration 385
nM), 1 µL reverse primer (final concentration
385 nM), 1 µL template DNA (100-fold diluted
to avoid PCR inhibitors in accordance to Bustin
SA et al. [14], and 7 µL ddH2O. The program
was modified from Bergmark L et al. [15],
combining the annealing and extension step:
95 °C for 3 min followed by 40 cycles of 95 °C
for 10 s, 60 °C for 20 s, and a final dissociation
curve. The standard curve for bacteria was
made from a pure culture of Pseudomonas
putida kt2440 [16, 17]. mRNA was
subsequently isolated using the MicroExpress
Bacterial mRNA Purification Kit (Ambion)
following the manufacturer’s instructions.
Sequencing
The genomic DNA was prepared for
sequencing using the NEBNext Quick DNA
Sample Prep. Master Mix 2 (New England
BioLabs Inc., Ipswitch, MA, USA). DNA was
amplified by PCR and sequenced as 250 bp
paired end libraries on an Illumina MiSeq
(Illumina, San Diego, CA, USA). The RNA
transcripts were prepared using ScriptSeq™ v2
RNA-Seq Library Preparation Kit (Epicentre
Biotechnologies, Madison, WI, USA) and
sequenced as 50 bp single reads on an Illumina
HiSeq 2000 (Illumina, San Diego, CA, USA).
Data analysis
The quality filtering of the genomic and
metatranscriptomic libraries was carried out in
similar ways. Only reads approved by the
CASAVA v1.8.2 (Illumina, San Diego, CA,
USA) were included and adaptor remnants
were removed. End nucleotides with a quality
Phred score below 20 were filtered. After the
end trim process, sequences shorter than 50
nucleotides (nt) or 45 nt were removed for the
genomic and metatranscriptome libraries,
respectively. Reads were discarded if they
displayed a mean Phred score below 15 or a
mean Phred score below 10 in a sliding window
of 10 nt for the genomic libraries and a mean
Phred score below 15 across a sliding window
of 5 nt for the metatranscriptomes. The quality
filtering was carried out using Biopieces.
Velvet v.1.2.07 was used to assemble the
genomic data [18] and Prodigal v2.50 was used
for gene calling [19]. A gene catalogue was
created including the genes from all four
genomes.
All metatranscriptome libraries were mapped to
the four genomes using Bowtie2 v.2.0.5 [20]
and number nt mapping to genes in the gene
catalogue was calculated, which yielded an
expression matrix. The 1000 most expressed
genes from X. retroflexus were extracted from
the matrix and the Bray-Curtis dissimilarity
metric was calculated between samples and
visualized in a NMDS plot. EdgeR was utilized
to infer any statistical significant differential
expression of the top 1000 genes [21]. The
average number of nt mapping to a gene within
biofilm types was calculated and the logarithm
to base 2 fold changes (log FC) was calculated
between single-species biofilm and the four
different multispecies biofilms. Genes showing
log FCs between -3 and 3 were excluded and
infinite values were treated according to the
expression levels of the gene in the single-
species biofilm. The remaining genes were
annotated using protein Blast and the non-
redundant protein database maintained by
National Center for Biotechnology Information
(NCBI - 2014-01-09), furthermore, conserved
Pfam domains were located using the Pfam web
based batch search tool and signal peptides
were identified using the signalP 4.1 server [22-
24].

Results
Sequencing statistics
In order to conduct a comparative gene
expression analysis of X. retroflexus (Xr) grown
in single-species, dual-species and four-species
biofilms with S. rhizophila (Sr), M. oxydans
(Mo) and P. amylolyticus (Pa), the genomes of
these four species were sequenced to create a
mapping template for the RNA-Seq transcripts.
The raw output from the 250 bp paired end
Illumina MiSeq DNA sequencing were quality
filtered and between 53.47% and 68.83% nt
remained, which yielded between 210 Mb and
1,475 Mb for assembly. The largest estimated
genome size of 6.3 Mb and the highest number
of coding sequence (CDS) belonged to Pa
(Table S1). The smallest genome size of 2.5
Mb and lowest number of CDS belonged to Sr,
however the assembly statistics for Sr indicated
a poor assembly of the genome with a low N50
and high number of contigs (Table S1).
The transcriptome and metatranscriptome
libraries were sequenced, quality filtered and
mapped against the genome templates. After
quality filtering the RNA transcripts, 75.82% nt
remained (Table S2). The filtered reads were
mapped against all four genomes and 92.39%
nt could be remapped, however only 2.46%
mapped against CDSs (Table S2). The
remaining 97.54% nt were mainly from rRNAs
and few mapped to intergenic regions. In
general, a higher percentage of the RNA
transcripts mapped to CDSs from biofilms
containing Pa (2.32% to 4.86%) (Table S2).
Expression activity
The proportion of transcripts from the four
genomes was estimated to assess the relative
species specific expression activity in each of
the metatranscriptomes from the dual- and four-
species biofilms (Figure 1). A noise level of
2.20% was detected, which represents the
average percentage of transcripts that mapped
unspecifically to conserved regions in the
genomes. The abundances of Sr and Mo were
close to the detection limit, making their true
expression activities difficult to assess. Pa
transcripts dominated the transcriptomes with
more than 50% and showed the highest
percentage in the dual-species biofilms (Xr+Pa).
A decrease in abundance could be observed for
Pa in the four-species biofilm while Xr showed
a relative increase compared to their
abundances in the dual-species biofilms,
however this was not statistically significant
(Student’s t-test, p-values > 0.05).
Comparative expression analysis of the
single-, dual-, and four-species biofilms
In order to investigate gene expression changes
in Xr induced by interspecies interactions, Xr
expression profiles of dual- and four-species
biofilms were compared to that of the Xr
single-species biofilm. For this purpose, all
transcripts from Xr were extracted from the
metatranscriptomes and expression profiles of
Xr in each sample were obtained. To infer the
correlation between the sample replicates, a
pearson correlation matrix was created
including all 17 samples and the replicates
showed good correlations with values between
0.85 and 0.98 (Table S3). The high rRNA
content in the samples resulted in low sequence
coverage of the CDSs and higher deviation for
low abundant transcripts. Hence, only the 1000
highest expressed genes in Xr were used for
further analysis, in order to minimize errors
caused by the low genome coverage and low
abundant transcripts (Table S1).

Figure 1 The species specific transcript abundance
in dual- and four-species biofilms. The broken line
represents the average percentage of transcript that
map unspecifically to conserved regions in the
genome and represents the detection limit (2.20%).
A) The relative abundance of transcripts that
mapped against the Xr genome, in the Xr+Sr,
Xr+Mo, Xr+Pa and Xr+Sr+Mo+Pa biofilms. B) The
relative abundance of transcripts that mapped
against the Sr genome in the Xr+Sr and
Xr+Sr+Mo+Pa biofilms. C) The relative abundance
of transcripts that mapped against the Mo genome
in the Xr+Mo and Xr+Sr+Mo+Pa biofilms. D) The
relative abundance of transcripts that mapped
against the Pa genome in the Xr+Pa and
Xr+Sr+Mo+Pa biofilms.
After the samples were normalized to the Xr
transcript library sizes and transformed using
the natural logarithm, a similarity analysis of
the biofilms was conducted based on the
expression of the top 1000 genes. The Bray-
Curtis dissimilarity metric was applied and the
results are reflected in an NMDS plot (Figure
2). Three clusters appeared in the plot. The first
cluster consisted of the single-species biofilms
of Xr and the dual-species biofilms of Xr+Sr
and Xr+Mo. Within this cluster the Xr and
Xr+Mo replicates created separate sub-clusters,
however the replicates of Xr+Sr showed larger
deviation and did not cluster together. The
second cluster consisted of the three replicates
of Xr+Pa in close proximity of each other and
the third tight cluster consisted of the five
replicates of the four-species biofilms,
Xr+Sr+Mo+Pa.
The 1000 highest expressed genes in Xr were
tested for significantly different expression
across the five sample groups using statistics
based on empirical Bayes methods [25]. This
analysis resulted in 587 differentially expressed
genes (p-values < 0.05 with a Benjamini and
Hochberg correction). To detect the active
genes in the transition from growing in a
single-species biofilm to dual- and four-species
biofilms, the ratio of the average number of nt
mapping to a specific gene in the single-species
biofilms vs. each of the four different
multispecies biofilms was calculated. A total of
70 genes had an logarithm to base 2 fold
change (log FC) above 3 or below -3, which
correspond to a 8 times up- or down-regulation.
The log FCs of the 70 genes are displayed in a
heatmap (Figure 3) and the result correlated
well with the observations from the NMDS plot.
Many expression ratios for Xr+Sr and Xr+Mo
were close to zero, which indicated a closer
relation to the single-species biofilms. However,
two genes (Xr21 and Xr22) showed an up-
regulation in both dual-species biofilms (Xr+Sr
and Xr+Mo) and four genes (Xr23, Xr24, Xr25
and Xr26) were down-regulated in the Xr+Sr
biofilms. The Xr+Pa and Xr+Sr+Mo+Pa
biofilms clustered together and most genes
seemed to be up- and down-regulated in both
biofilm types. However, a substantial number
of genes were regulated in the four-species
biofilms only. However, 3 genes (Xr3, Xr4 and
Xr27) displayed unique regulation in the Xr+Pa
biofilms.
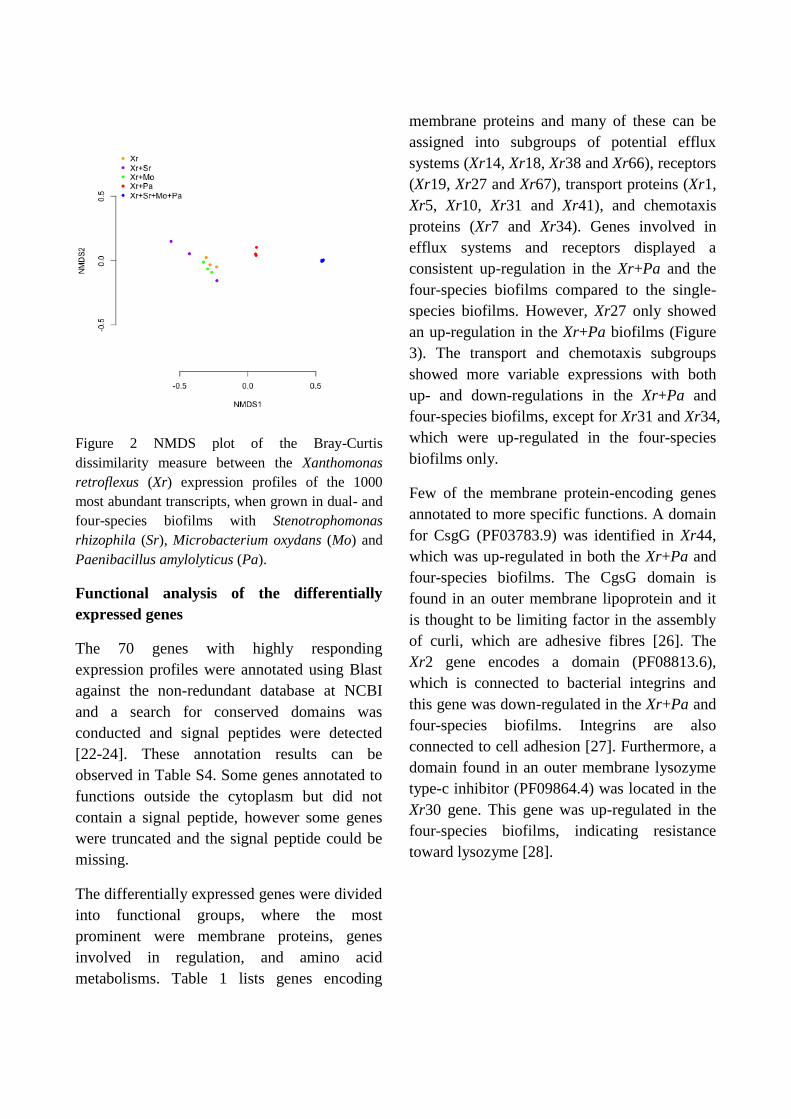
Figure 2 NMDS plot of the Bray-Curtis
dissimilarity measure between the Xanthomonas
retroflexus (Xr) expression profiles of the 1000
most abundant transcripts, when grown in dual- and
four-species biofilms with Stenotrophomonas
rhizophila (Sr), Microbacterium oxydans (Mo) and
Paenibacillus amylolyticus (Pa).
Functional analysis of the differentially
expressed genes
The 70 genes with highly responding
expression profiles were annotated using Blast
against the non-redundant database at NCBI
and a search for conserved domains was
conducted and signal peptides were detected
[22-24]. These annotation results can be
observed in Table S4. Some genes annotated to
functions outside the cytoplasm but did not
contain a signal peptide, however some genes
were truncated and the signal peptide could be
missing.
The differentially expressed genes were divided
into functional groups, where the most
prominent were membrane proteins, genes
involved in regulation, and amino acid
metabolisms. Table 1 lists genes encoding
membrane proteins and many of these can be
assigned into subgroups of potential efflux
systems (Xr14, Xr18, Xr38 and Xr66), receptors
(Xr19, Xr27 and Xr67), transport proteins (Xr1,
Xr5, Xr10, Xr31 and Xr41), and chemotaxis
proteins (Xr7 and Xr34). Genes involved in
efflux systems and receptors displayed a
consistent up-regulation in the Xr+Pa and the
four-species biofilms compared to the single-
species biofilms. However, Xr27 only showed
an up-regulation in the Xr+Pa biofilms (Figure
3). The transport and chemotaxis subgroups
showed more variable expressions with both
up- and down-regulations in the Xr+Pa and
four-species biofilms, except for Xr31 and Xr34,
which were up-regulated in the four-species
biofilms only.
Few of the membrane protein-encoding genes
annotated to more specific functions. A domain
for CsgG (PF03783.9) was identified in Xr44,
which was up-regulated in both the Xr+Pa and
four-species biofilms. The CgsG domain is
found in an outer membrane lipoprotein and it
is thought to be limiting factor in the assembly
of curli, which are adhesive fibres [26]. The
Xr2 gene encodes a domain (PF08813.6),
which is connected to bacterial integrins and
this gene was down-regulated in the Xr+Pa and
four-species biofilms. Integrins are also
connected to cell adhesion [27]. Furthermore, a
domain found in an outer membrane lysozyme
type-c inhibitor (PF09864.4) was located in the
Xr30 gene. This gene was up-regulated in the
four-species biofilms, indicating resistance
toward lysozyme [28].

Table 1 Differential expressed genes of Xanthomonas retroflexus (Xr) encoding for membrane proteins
ID name e-val Pfam e-val sig-
Pa
Xr+Sr Xr+Mo Xr+Pa Xr+Sr+
Mo+Pa
Xr1 major facilitator superfamily
transmembrane nitrite
extrusion
0 PF07690.11 4.7E-13 N -1.33 -0.90 -3.35 -4.11
Xr 2 hypothetical protein
SMD_0239
2.00E-151 PF08813.6 5.4E-42 Y -1.05 -1.43 -3.30 -2.81
Xr5 transport-associated protein 1.00E-66 PF04972.12 5.1E-17 Y -0.19 -0.02 -3.57 -3.14
Xr7 methyl-accepting
chemotaxis protein
3.00E-99 PF13426.1 2.5E-16 N -0.45 -0.63 -8.60 -5.31
Xr10 membrane protein 7.00E-112 PF08212.7 3.7E-47 N 1.10 0.50 -3.14 -5.82
Xr14 membrane protein 0 PF02321.13 3.9E-35 Y 0.76 1.80 2.63 3.41
Xr18 RND family efflux
transporter MFP subunit
0 PF00529.15 1.6E-59 Y 0.84 2.29 4.76 4.92
Xr 19 TonB-dependent receptor 0 PF00593.19 1.6E-24 Y 1.88 2.10 4.21 4.83
Xr 27 TonB-dependent
siderophore receptor
0 PF00593.19 4.4E-23 Y 1.10 0.34 3.07 0.30
Xr30 hypothetical protein 1.00E-131 PF09864.4 3.9E-13 Y 0.24 -0.07 0.18 3.28
Xr31 TolA protein 0 PF13103.1 1.6E-10 N 0.04 -2.01 1.08 3.56
Xr32 membrane protein 9.00E-41 - - N 0.00 -2.22 1.72 3.36
Xr34 methyl-accepting
chemotaxis protein
0 PF00015.16,
PF00672.20
2.6E-55,
7.2E-11
N -1.16 -1.62 1.71 3.24
Xr38 efflux transporter, RND
family, MFP subunit
0 PF12700.2 1.7E-30 N -1.50 0.19 3.33 4.99
Xr41 Vitamin B12 transporter
btuB
0 PF00593.19 2.2E-28 N -0.45 2.08 2.67 4.24
Xr44 hypothetical protein, partial 0 PF03783.9 1.9E-13 N 0.38 1.51 3.05 3.90
Xr66 multidrug transporter 1.00E-68 PF00893.14 9.3E-21 N -0.66 -0.03 2.96 3.52
Xr67 TonB-denpendent receptor 0 PF00593.19 1.8E-27 Y -1.19 -0.91 2.12 3.60
aIdentified signal peptides in the gene: yes (Y) or no (N).
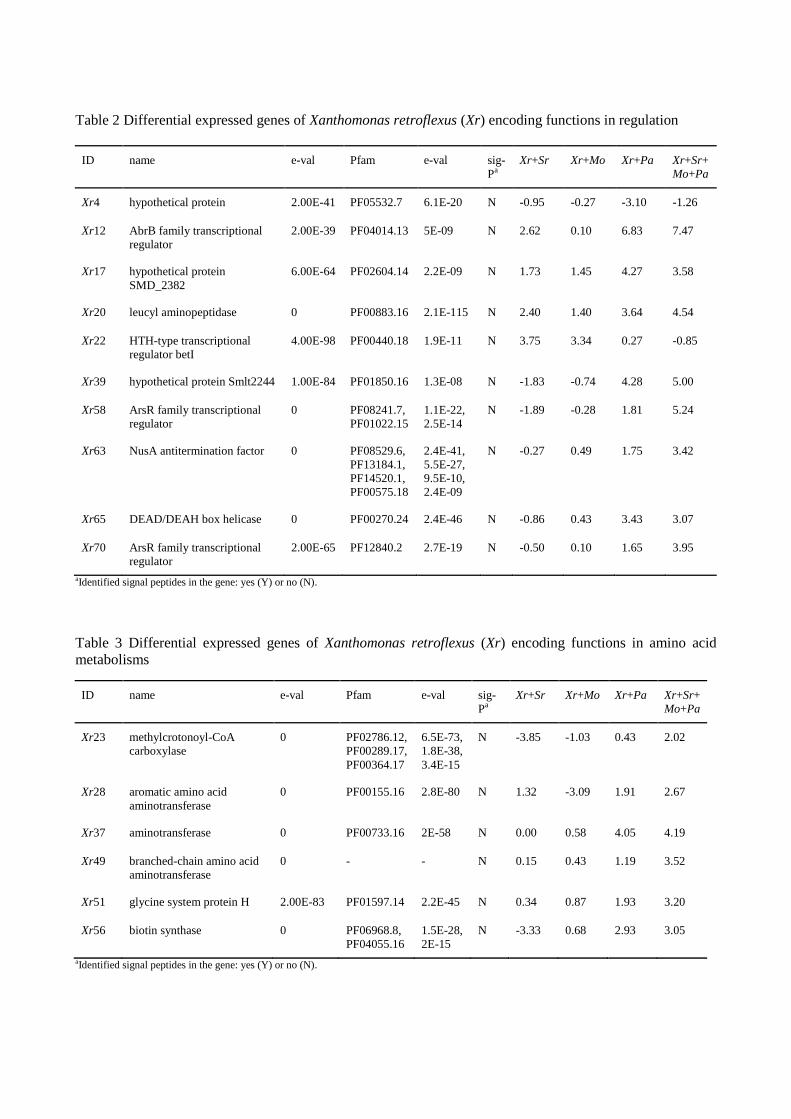
Table 2 Differential expressed genes of Xanthomonas retroflexus (Xr) encoding functions in regulation
ID name e-val Pfam e-val sig-
Pa
Xr+Sr Xr+Mo Xr+Pa Xr+Sr+
Mo+Pa
Xr4 hypothetical protein 2.00E-41 PF05532.7 6.1E-20 N -0.95 -0.27 -3.10 -1.26
Xr12 AbrB family transcriptional
regulator
2.00E-39 PF04014.13 5E-09 N 2.62 0.10 6.83 7.47
Xr17 hypothetical protein
SMD_2382
6.00E-64 PF02604.14 2.2E-09 N 1.73 1.45 4.27 3.58
Xr20 leucyl aminopeptidase 0 PF00883.16 2.1E-115 N 2.40 1.40 3.64 4.54
Xr22 HTH-type transcriptional
regulator betI
4.00E-98 PF00440.18 1.9E-11 N 3.75 3.34 0.27 -0.85
Xr39 hypothetical protein Smlt2244 1.00E-84 PF01850.16 1.3E-08 N -1.83 -0.74 4.28 5.00
Xr58 ArsR family transcriptional
regulator
0 PF08241.7,
PF01022.15
1.1E-22,
2.5E-14
N -1.89 -0.28 1.81 5.24
Xr63 NusA antitermination factor 0 PF08529.6,
PF13184.1,
PF14520.1,
PF00575.18
2.4E-41,
5.5E-27,
9.5E-10,
2.4E-09
N -0.27 0.49 1.75 3.42
Xr65 DEAD/DEAH box helicase 0 PF00270.24 2.4E-46 N -0.86 0.43 3.43 3.07
Xr70 ArsR family transcriptional
regulator
2.00E-65 PF12840.2 2.7E-19 N -0.50 0.10 1.65 3.95
aIdentified signal peptides in the gene: yes (Y) or no (N).
Table 3 Differential expressed genes of Xanthomonas retroflexus (Xr) encoding functions in amino acid
metabolisms
ID name e-val Pfam e-val sig-
Pa
Xr+Sr Xr+Mo Xr+Pa Xr+Sr+
Mo+Pa
Xr23 methylcrotonoyl-CoA
carboxylase
0 PF02786.12,
PF00289.17,
PF00364.17
6.5E-73,
1.8E-38,
3.4E-15
N -3.85 -1.03 0.43 2.02
Xr28 aromatic amino acid
aminotransferase
0 PF00155.16 2.8E-80 N 1.32 -3.09 1.91 2.67
Xr37 aminotransferase 0 PF00733.16 2E-58 N 0.00 0.58 4.05 4.19
Xr49 branched-chain amino acid
aminotransferase
0 - -
N 0.15 0.43 1.19 3.52
Xr51 glycine system protein H 2.00E-83 PF01597.14 2.2E-45 N 0.34 0.87 1.93 3.20
Xr56 biotin synthase 0 PF06968.8,
PF04055.16
1.5E-28,
2E-15
N -3.33 0.68 2.93 3.05
aIdentified signal peptides in the gene: yes (Y) or no (N).
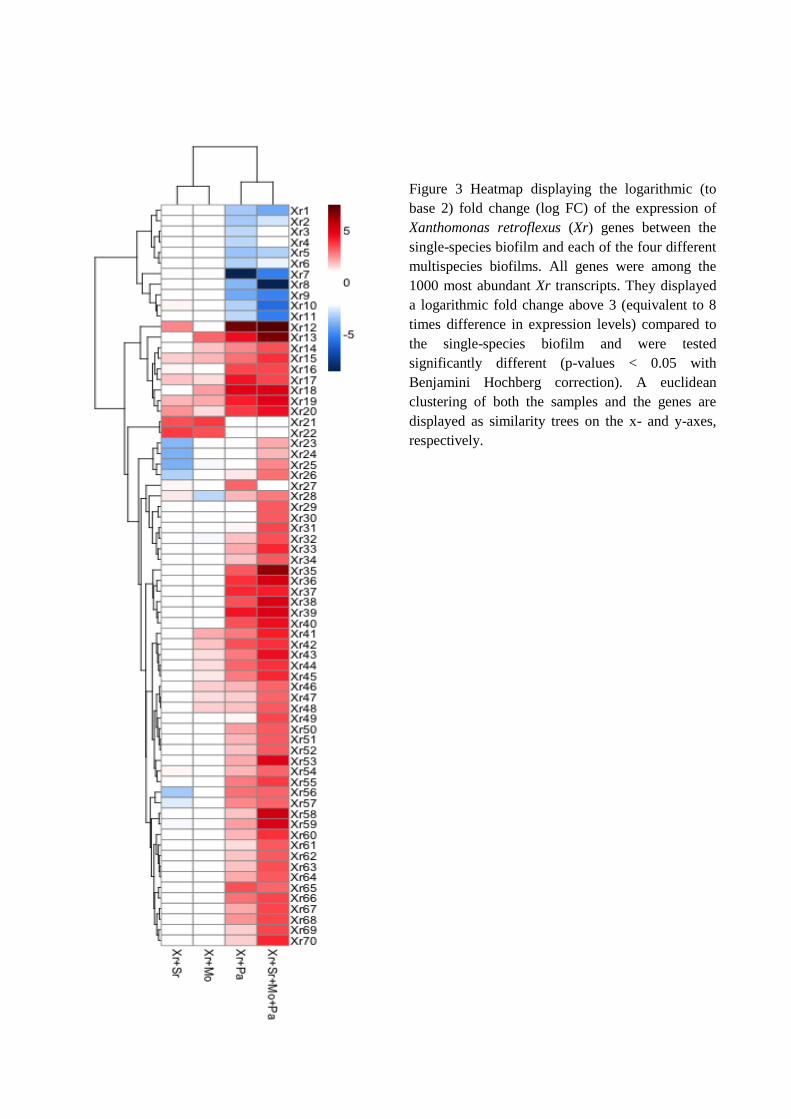
Figure 3 Heatmap displaying the logarithmic (to
base 2) fold change (log FC) of the expression of
Xanthomonas retroflexus (Xr) genes between the
single-species biofilm and each of the four different
multispecies biofilms. All genes were among the
1000 most abundant Xr transcripts. They displayed
a logarithmic fold change above 3 (equivalent to 8
times difference in expression levels) compared to
the single-species biofilm and were tested
significantly different (p-values < 0.05 with
Benjamini Hochberg correction). A euclidean
clustering of both the samples and the genes are
displayed as similarity trees on the x- and y-axes,
respectively.
Table 2 summarizes all differentially expressed
genes that encode regulatory functions. Five
genes are involved in transcription regulation
(Xr22, Xr58, Xr63, Xr65 and Xr70) and these
genes were mainly up-regulated in the four-
species biofilms compared to the single-species
biofilm. An exception was Xr65, which was
also up-regulated in the Xr+Po biofilms and
Xr22, which was one of the two genes up-
regulated in the Xr+Sr and Xr+Mo biofilms
(Figure 3). Toxin-antitoxin systems were also
present among the differentially expressed
genes and these systems have been shown to
play a role in regulation [29]. An antitoxin
domain (PF02604.14) was identified in Xr17.
Furthermore, Xr12 encodes the AbrB/MazE
antitoxin and Xr39 contains a PIN domain
(PF01850.16) that is often present in toxins
[29]. Xr12 and Xr39 are consecutive genes in
the genome of Xr, and this indicates the
presence of a complete toxin-antitoxin system
in the differentially expressed genes [29]. All
three genes seemed to be up-regulated in both
the Xr+Pa and four-species biofilms and
particular Xr12 showed a high shift in
regulation level (Figure 3).
Genes participating in other regulation
mechanisms were also identified (Table 2). Xr4
was down-regulated only in the Xr+Pa biofilms;
this gene encodes a hypothetical protein with a
CsbD domain that has been connected to stress
response [30]. Leucyl aminopeptidase, involved
in the Glutathione metabolism, is encoded by
Xr20 and up-regulation both in the Xr+Pa and
the four-species biofilms was observed [31].
Glutathione is known to participate in
responses to environmental factors [32].
Table 3 lists genes involved in amino acid
metabolism. Branched chain amino acid
aminotransferase and methylcrotonoyl-CoA
carboxylase (Xr49 and Xr23) are both known
for their participation in Leucine, Valine and
Isoleucine metabolisms and were up-regulated
in the four-species biofilms. Furthermore, X23
displayed a down-regulation in the Xr+Sr
biofilm. Biotin synthase, encoded by Xr56,
participates in the production of biotin; a
cofactor for methylcrotonoyl-CoA and limiting
to amino acid decomposition [33]. This gene
was up-regulated in both the Xr+Pa and four-
species biofilms. Additionally, Xr28 encodes an
aromatic amino acid aminotransferase, which
catalyses the last step in Tyrosine and
Phenylalanine synthesis. Xr28 was slightly
down-regulated in the Xr+Mo biofilms and up-
regulated in both the Xr+Pa and four-species
biofilms. The aminotransferase (Xr37) contains
an AsnB domain, representing an alternative
pathway for Asparagine synthesis from
Aspartate in the absence of AsnA and this gene
was up-regulated in both the Xr+Pa and four-
species biofilms. Xr51 encodes a glycine
cleavage system protein H, which participates
in the catabolism of Glycine and was up-
regulated in the four-species biofilms.
Besides genes coding for membrane proteins or
participating in regulation and amino acid
metabolisms, four differentially expressed
genes were annotated to peptidoglycan systems.
Three of these genes (Xr24, Xr60 and Xr64)
were up-regulated in the four-species biofilm,
indicating an increased peptidoglycan
production, furthermore, Xr24 was down-
regulated in the Xr+Sr biofilms. The fourth
gene (Xr8), which was down-regulated in the
Xr+Pa and four-species biofilms, encodes a
domain (PF03734.9) often found in an L,D-
transpeptidase that has been shown to provide
an alternative pathway for peptidoglycan
synthesis [34]. Furthermore, the gene (Xr15)
encoding a cell division protein (FtsK), which
plays an important role in cell division, seemed
to be up-regulated in both the Xr+Pa and four-
species biofilm.
In general, many genes involved in cell defense
systems have been identified as being
differentially expressed, including the
membrane bound efflux systems involved in
multidrug exclusion and the lysozyme type-c
inhibition (Table 1). In connection to this, a
beta-lactamase domain was identified in Xr52,
which was up-regulated in the four-species
biofilm. Additionally, an up-regulation of Xr29
in the four-species biofilm was observed, which
encodes a DNA processing protein (DprA) that
is involved in DNA recombination.
Discussion
This study demonstrates the effect of
interspecies interactions in multispecies
biofilms on the gene expression in X.
retroflexus (Xr). Comparisons of the expression
profiles of X. retroflexus grown in single- and
dual-species biofilms with S. rhizophila (Sr), M.
oxydans (Mo) and P. amylolyticus (Pa),
revealed shifts in gene expression, however,
these changes seemed to be species dependent.
Through further investigations of the four-
species biofilms, indication of a non-linear
response to multiple species was identified,
suggesting complex and dependent interaction
patterns. This is in good correspondence with
the previously described emergent behaviour of
enhanced biofilm formation by this four-species
consortium [12]. The genes identified in the
differential expression analysis revealed
changes in expression of regulatory elements,
membrane proteins and genes involved in
amino acid metabolism. Only few studies exist
that investigated the effect of coexistence in
multispecies biofilms on a gene expression
level and the results presented here contributes
to further understanding of the interaction
mechanisms in multispecies biofilms [11, 35,
36].
Pa displayed high gene expression activity
when coexisting with Xr in biofilms. Over 50%
of the mRNA transcripts in the
metatranscriptomes of the Xr+Pa and four-
species biofilms annotated back to the genome
of Pa, indicating high activity levels. Our
previous study showed that Pa did not display
good biofilm production abilities [1] and the
biofilm production decreased in the dual-
species biofilm Xr+Pa compared to the single-
species biofilm of Xr according to Ren et al., in
review [12]. However, the cell abundance of Pa
showed a significantly increase in four-species
biofilm which is consistent with the high
activity level of Pa in the present study. But,
we should note that the relative abundance of
mRNA can vary between 1-5% of the total
cellular RNA and the percentage of transcripts
mapping to CDSs increased in samples
containing Pa, which indicated a higher
mRNA/rRNA ratio in Pa compared to Xr, Sr
and Mo [37]. An increased mRNA/rRNA ratio
would yield more mRNAs per cell and this
could introduce a bias in the assessment of the
relative activity. Furthermore, Pa displayed the
largest estimated genome size and this could
also affect the proportion of transcripts from Pa.
The proportion of transcripts annotating back to
Sr and Mo was close to the detection limit and
indicated a low activity level. The low activity
level in the four-species biofilms correlated
with the low cell copy numbers found by the
qPCR analysis in our previous study [12].
Coexistence of different species in biofilms
seemed to alter the gene expression, however,
the response was species specific [11, 35]. The
presence of Pa clearly induced a change in the
gene expression profiles of Xr, compared to the
profiles observed in the single-species biofilm
and was responsible for the induced regulation
of the majority of the 70 highly differentially
expressed genes. It did show high activity
levels in the biofilms and this could be causing
the response observed in the Xr expression. The
induced gene regulation in the dual-species
biofilm of Xr+Sr and Xr+Mo was less evident.
However, the Xr+Mo replicates did create a
cluster, which separated from the single-species
biofilm and some genes were differently
regulated in their presence. This was consistent
with the biofilm formation of Xr+Mo which
significantly increased compared with the
single-species biofilm of Xr, while the Xr+Sr
biofilms did not show any significantly increase
in biomass [12]. Transcripts from Sr and Mo
constituted a smaller proportion of the
metatranscriptomes and showed low abundance
in the previous study of the four-species biofilm
composition [12]. The relative low abundance
and activity could explain the low effect of the
presence of Sr and Mo on the Xr gene
expression.
Interestingly, when inferring the four-species
biofilms, a unique expression pattern for Xr
emerged, with regulations uniquely observed
for this combination. The five biological
replicates of the four-species biofilms created a
tight cluster that separated from the other
biofilm samples (Figure 2) and several genes
displayed expression shifts, which were not
observed in any of the dual-species biofilms
(Figure 3). Hence, the co-occurrence of Sr, Mo
and Pa induced a different expression pattern in
Xr, compared to the gene expression in the
dual-species biofilms, which is consistent with
our previous results that each strain is
indispensable for the synergistic interactions in
this four-species biofilm [12]. This observation
was not evident in a gene expression study of
Saccharomyces cerevisiae exposed to multiple
physiological transitions [38]. They showed
that when exposed to different simultaneous
stresses, the cellular response approximated the
sum of the responses for each individual stress
and indicated a linear response to multiple
physiological changes [38]. The current result
differs from these observations and suggests a
non-linear response to multiple species,
indicating that gene expression is regulated by a
complex interspecies interaction network.
The functional annotation of the 70
significantly differentially expressed genes
revealed expression changes of regulatory
elements in the presence of Pa [11]. Genes
coding for transcription factors and toxin-
antitoxin system displayed an increase in
expression in Xr. Especially the potential
MazE/MazF toxin-antitoxin system was up-
regulated and has been reported to be a general
regulatory element and involved in biofilm
formation [39]. Also, the MazE/MazF system
has been connected with programmed cell
death and lysis, which was widely reported in
Xanthomonas [40, 41]. Furthermore, genes
encoding transcriptional regulators show
unique expression levels in the four-species
biofilm only. These changes in expression of
regulatory elements possibly control the
phenotypic adaptation of the cells to the
community composition in the biofilms [42].
The regulation of genes encoding membrane
proteins with roles in transport, efflux systems,
receptors and chemotaxis indicated that many
of the phenotypic changes induced by
coexistence in biofilm were in relation to the
surrounding microenvironment [11]. Some of
the identified transporters could potentially play
a role in secreting extracellular polymeric
substances (EPS). Furthermore, the up-
regulation of the potential cell division protein,

the potential participant in curli production and
chemotaxis systems in the presence of Pa could
also indicate higher growth rate, adhesion and
specific growth direction. An increase in EPS
excretion and directional growth could be a
competitive response to coexistence and an
advance for Xr [43]. A further indication of
enhanced growth was the observed up-
regulation of peptidoglycan production in the
four-species biofilm only. All these
observations are correlated with previous
quantitative PCR (qPCR) measurements which
demonstrated the increase in cell number of Xr
when co-cultured with other three species [12].
Up-regulation of potential defense system like
efflux pump was evident in the presence of Pa
and a potential lysozyme type-c inhibitor
together with a potential beta-lactamase were
up-regulated in the four-species biofilm. The
up-regulation of these genes indicates an
upgrade in defense mechanisms against toxins
in this multispecies biofilm [44], which could
positively affect the total resistance of the
biofilm. One of the main emergent behaviour
of bacterial biofilm is enhanced antibiotic
resistance. This is usually thought to be due to
lack of diffusion and low growth rate [45, 46].
However our results may indicate that this is
also due to specific induction of resistance trait.
The expression changes in amino acid
metabolisms represented a potential
interspecies cooperation in the multispecies
biofilms [36]. The aromatic amino acid
aminotransferase displayed an up-regulation in
the presence of Pa. Through further inspection,
the function of this gene is not immediately
present in the genome of Pa, hence, an
enhanced production and export of tyrosine and
phenylalanine could constitute an example of
interspecies cooperation. Furthermore, the
catabolism of valine, leucine, isoleucine and
glycine seemed to be up-regulated in the four-
species biofilm and this could indicate an
increased exchange of amino acids or
polypeptides. The interspecies interaction could
be further investigated by investigating the
expression profiles of Sr, Mo and Pa.
The current comparative gene expression study
of X. retroflexus (Xr) grown in single-, dual-
and four-species biofilms with S. rhizophila
(Sr), M. oxydans (Mo) and P. amylolyticus (Pa)
displayed phenotypic adaptation according to
the species composition in the biofilms. By
inferring the differentially expressed genes, the
adaptations seemed to respond to both positive
and negative relations. It can be hypothesized
that interspecies interactions in biofilms are
balances between cooperation and competition.
To further investigate the effects of interspecies
interactions, the phenotypic changes in
knockout mutants of candidate genes identified
in the comparative gene expression analysis
might further elucidate their functional effect
on interspecies interaction in multispecies
biofilms.
References
1. Ren D, Madsen JS, de la Cruz-Perera CI,
Bergmark L, Sørensen SJ, Burmølle M (2013)
High-Throughput Screening of Multispecies
Biofilm Formation and Quantitative PCR-Based
Assessment of Individual Species Proportions,
Useful for Exploring Interspecific Bacterial
Interactions. Microbial ecology: 1-9.
2. Hall-Stoodley L, Costerton JW, Stoodley P
(2004) Bacterial biofilms: from the natural
environment to infectious diseases. Nature
Reviews Microbiology 2: 95-108.
3. Burmølle M, Ren D, Bjarnsholt T, Sørensen SJ
(2014) Interactions in multispecies biofilms: do
they actually matter? Trends in microbiology.
doi: 10.1016/j.tim.2013.12.004
4. Vornhagen J, Stevens M, McCormick DW,
Dowd SE, Eisenberg JN, Boles BR, Rickard AH
(2013) Coaggregation occurs amongst bacteria
within and between biofilms in domestic
showerheads. Biofouling 29: 53-68.
5. Farabegoli G, Chiavola A, Rolle E (2008)
Remediation of chlorophenol-and phenol-
contaminated groundwater by a sequencing
batch biofilm reactor.
6. Schwering M, Song J, Louie M, Turner RJ, Ceri
H (2013) Multi-species biofilms defined from
drinking water microorganisms provide
increased protection against chlorine
disinfection. Biofouling 29: 917-928.
7. Høiby N, Bjarnsholt T, Givskov M, Molin S,
Ciofu O (2010) Antibiotic resistance of bacterial
biofilms. International journal of antimicrobial
agents 35: 322-332.
8. Seneviratne G, Zavahir J, Bandara W,
Weerasekara M (2008) Fungal-bacterial
biofilms: their development for novel
biotechnological applications. World Journal of
Microbiology and Biotechnology 24: 739-743.
9. LoVLEY DR, Klug MJ (1986) Model for the
distribution of sulfate reduction and
methanogenesis in freshwater sediments.
Geochimica et Cosmochimica Acta 50: 11-18.
10. Harrison F (2007) Microbial ecology of the
cystic fibrosis lung. Microbiology 153: 917-923.
11. Frias-Lopez J, Duran-Pinedo A (2012) Effect of
periodontal pathogens on the metatranscriptome
of a healthy multispecies biofilm model. Journal
of bacteriology 194: 2082-2095.
12. Ren D, Madsen JS, Sørensen SJ, Burmølle M
(2013) High prevalence of biofilm synergy
among bacterial soil isolates in co-cultures
indicates bacterial interspecific cooperation.
The ISME journal. Under review.
13. Fierer N, Jackson JA, Vilgalys R, Jackson RB
(2005) Assessment of soil microbial community
structure by use of taxon-specific quantitative
PCR assays. Applied and Environmental
Microbiology 71: 4117-4120.
14. Bustin SA, Benes V, Garson JA, Hellemans J,
Huggett J, Kubista M, Mueller R, Nolan T,
Pfaffl MW, Shipley GL (2009) The MIQE
guidelines: minimum information for
publication of quantitative real-time PCR
experiments. Clinical chemistry 55: 611-622.
15. Bergmark L, Poulsen PHB, Al‐Soud WA,
Norman A, Hansen LH, Sørensen SJ (2012)
Assessment of the specificity of Burkholderia
and Pseudomonas qPCR assays for detection of
these genera in soil using 454 pyrosequencing.
FEMS microbiology letters 333: 77-84.
16. Park J-W, Crowley DE (2005) Normalization of
soil DNA extraction for accurate quantification
of target genes by real-time PCR and DGGE.
BioTechniques 38: 579-586.
17. VanGuilder HD, Vrana KE, Freeman WM
(2008) Twenty-five years of quantitative PCR
for gene expression analysis. Biotechniques 44:
619.
18. Zerbino DR, Birney E (2008) Velvet:
algorithms for de novo short read assembly
using de Bruijn graphs. Genome research 18:
821-829.
19. Hyatt D, Chen G-L, Locascio PF, Land ML,
Larimer FW, Hauser LJ (2010) Prodigal:
prokaryotic gene recognition and translation
initiation site identification. BMC
bioinformatics 11: 119-119.
20. Langmead B, Salzberg SL (2012) Fast gapped-
read alignment with Bowtie 2. Nature methods
9: 357-359.
21. Robinson MD, McCarthy DJ, Smyth GK (2010)
edgeR: a Bioconductor package for differential
expression analysis of digital gene expression
data. Bioinformatics (Oxford, England) 26: 139-
140.
22. Altschup SF, Gish W, Pennsylvania T, Park U
(1990) Basic Local Alignment Search Tool. J
mol biol 215: 403-410.
23. Punta M, Coggill PC, Eberhardt RY, Mistry J,
Tate J, Boursnell C, Pang N, Forslund K, Ceric
G, Clements J, Heger A, Holm L, Sonnhammer
ELL, Eddy SR, Bateman A, Finn RD (2012)
The Pfam protein families database. Nucleic
acids research 40: D290-301.
24. Petersen TN, Brunak S, von Heijne G, Nielsen
H (2011) SignalP 4.0: discriminating signal
peptides from transmembrane regions. Nat Meth
8: 785-786.
25. McCarthy DJ, Chen Y, Smyth GK (2012)
Differential expression analysis of multifactor
RNA-Seq experiments with respect to
biological variation. Nucleic acids research 40:
4288-4297.
26. Loferer H, Hammar M, Normark S (1997)
Availability of the fibre subunit CsgA and the
nucleator protein CsgB during assembly of
fibronectin-binding curli is limited by the
intracellular concentration of the novel
lipoprotein CsgG. Molecular microbiology 26:
11-23.
27. Kelly G, Prasannan S, Daniell S, Fleming K,
Frankel G, Dougan G, Connerton I, Matthews S
(1999) Structure of the cell-adhesion fragment
of intimin from enteropathogenic Escherichia
coli. Nature structural biology 6: 313-318.
28. Callewaert L, Aertsen A, Deckers D,
Vanoirbeek KGa, Vanderkelen L, Van
Herreweghe JM, Masschalck B, Nakimbugwe D,
Robben J, Michiels CW (2008) A new family of
lysozyme inhibitors contributing to lysozyme
tolerance in gram-negative bacteria. PLoS
pathogens 4: e1000019-e1000019.
29. Anantharaman V, Aravind L (2003) New
connections in the prokaryotic toxin-antitoxin
network: relationship with the eukaryotic
nonsense-mediated RNA decay system.
Genome biology 4: R81-R81.
30. Prágai Z, Harwood CR (2002) Regulatory
interactions between the Pho and sigma σB-
dependent general stress regulons of Bacillus
subtilis. Microbiology (Reading, England) 148:
1593-1602.
31. Cappiello M, Lazzarotti A, Buono F, Scaloni A,
D'Ambrosio C, Amodeo P, Méndez BL, Pelosi
P, Del Corso A, Mura U (2004) New role for
leucyl aminopeptidase in glutathione turnover.
The Biochemical journal 378: 35-44.
32. Riccillo PM, Muglia CI, Bruijn FJD, Roe AJ,
Booth IR, Aguilar OM, Bruijn FJDE, Booth
IANR (2000) Glutathione Is Involved in
Environmental Stress Responses in Rhizobium
tropici, Including Acid Tolerance Glutathione Is
Involved in Environmental Stress Responses in
Rhizobium tropici, Including Acid Tolerance.
doi: 10.1128/JB.182.6.1748-1753.2000.
33. Wood HG, Barden RE (1977) Biotin enzymes.
Ann. Rev. Bioehem. 46: 385-413.
34. Biarrotte-Sorin S, Hugonnet J-E, Delfosse V,
Mainardi J-L, Gutmann L, Arthur M, Mayer C
(2006) Crystal structure of a novel beta-lactam-
insensitive peptidoglycan transpeptidase.
Journal of molecular biology 359: 533-538.
35. Wen ZT, Yates D, Ahn S-J, Burne Ra (2010)
Biofilm formation and virulence expression by
Streptococcus mutans are altered when grown in
dual-species model. BMC microbiology 10:
111-111.
36. Jakubovics NS, Gill SR, Iobst SE, Vickerman
MM, Kolenbrander PE (2008) Regulation of
gene expression in a mixed-genus community:
stabilized arginine biosynthesis in Streptococcus
gordonii by coaggregation with Actinomyces
naeslundii. Journal of bacteriology 190: 3646-
3657.
37. Niedhardt FC, Umbarger HE (1996) Chemical
composition of Escherichia coli. In: Curtiss, R,
III, Ingraham, JL, Lin, ECC, Low, KB,
Magasanik, B, Regnikoff, WS (eds.). American
Society of Microbiology, Washington D. C., pp.
13-16.
38. Gasch aP, Spellman PT, Kao CM, Carmel-Harel
O, Eisen MB, Storz G, Botstein D, Brown PO
(2000) Genomic expression programs in the
response of yeast cells to environmental
changes. Molecular biology of the cell 11:
4241-4257.
39. Wang X, Wood TK (2011) Toxin-antitoxin
systems influence biofilm and persister cell
formation and the general stress response.
Applied and environmental microbiology 77:
5577-5583.
40. Engelberg-Kulka H, Hazan R, Amitai S (2005)
mazEF: a chromosomal toxin-antitoxin module
that triggers programmed cell death in bacteria.
Journal of cell science 118: 4327-4332.
41. Rice KC, Bayles KW (2008) Molecular control
of bacterial death and lysis. Microbiology and
molecular biology reviews: MMBR 72: 85-109,
table of contents
42. López-Maury L, Marguerat S, Bähler J (2008)
Tuning gene expression to changing
environments: from rapid responses to
evolutionary adaptation. Nature reviews
Genetics 9: 583-593.
43. Xavier JB, Foster KR (2007) Cooperation and
conflict in microbial biofilms. Proceedings of
the National Academy of Sciences of the United
States of America 104: 876-881.
44. Yang L, Liu Y, Wu H, Hóiby N, Molin S, Song
Z-j (2011) Current understanding of multi-
species biofilms. International journal of oral
science 3: 74-81.
45. Harrison JJ, Turner RJ, Ceri H (2005) Persister
cells, the biofilm matrix and tolerance to metal
cations in biofilm and planktonic Pseudomonas
aeruginosa. Environmental Microbiology 7:
981-994.
46. Evans D, Allison D, Brown M, Gilbert P (1991)
Susceptibility of Pseudomonas aeruginosa and
Escherichia coli biofilms towards ciprofloxacin:
effect of specific growth rate. Journal of
Antimicrobial Chemotherapy 27: 177-184.
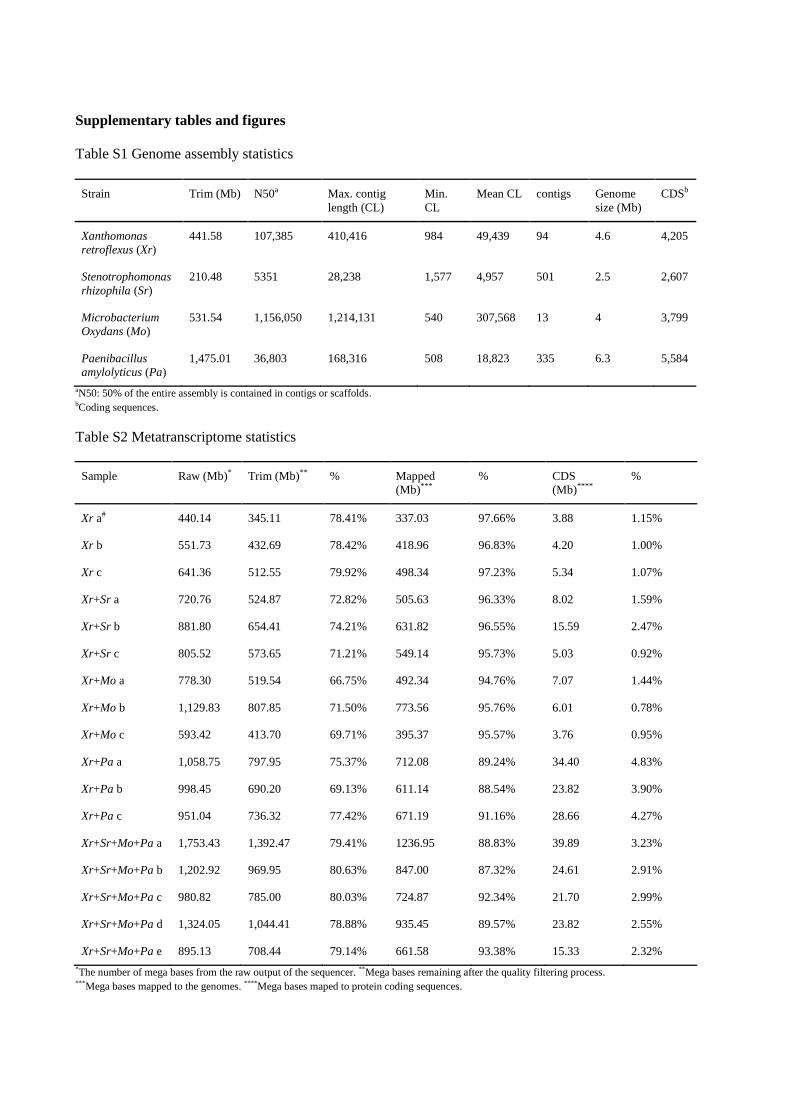
Supplementary tables and figures
Table S1 Genome assembly statistics
Strain Trim (Mb) N50a Max. contig
length (CL)
Min.
CL
Mean CL contigs Genome
size (Mb)
CDSb
Xanthomonas
retroflexus (Xr)
441.58 107,385 410,416 984 49,439 94 4.6 4,205
Stenotrophomonas
rhizophila (Sr)
210.48 5351 28,238 1,577 4,957 501 2.5 2,607
Microbacterium
Oxydans (Mo)
531.54 1,156,050 1,214,131 540 307,568 13 4 3,799
Paenibacillus
amylolyticus (Pa)
1,475.01 36,803 168,316 508 18,823 335 6.3 5,584
aN50: 50% of the entire assembly is contained in contigs or scaffolds. bCoding sequences.
Table S2 Metatranscriptome statistics
Sample Raw (Mb)* Trim (Mb)** % Mapped
(Mb)***
% CDS
(Mb)****
%
Xr a# 440.14 345.11 78.41% 337.03 97.66% 3.88 1.15%
Xr b 551.73 432.69 78.42% 418.96 96.83% 4.20 1.00%
Xr c 641.36 512.55 79.92% 498.34 97.23% 5.34 1.07%
Xr+Sr a 720.76 524.87 72.82% 505.63 96.33% 8.02 1.59%
Xr+Sr b 881.80 654.41 74.21% 631.82 96.55% 15.59 2.47%
Xr+Sr c 805.52 573.65 71.21% 549.14 95.73% 5.03 0.92%
Xr+Mo a 778.30 519.54 66.75% 492.34 94.76% 7.07 1.44%
Xr+Mo b 1,129.83 807.85 71.50% 773.56 95.76% 6.01 0.78%
Xr+Mo c 593.42 413.70 69.71% 395.37 95.57% 3.76 0.95%
Xr+Pa a 1,058.75 797.95 75.37% 712.08 89.24% 34.40 4.83%
Xr+Pa b 998.45 690.20 69.13% 611.14 88.54% 23.82 3.90%
Xr+Pa c 951.04 736.32 77.42% 671.19 91.16% 28.66 4.27%
Xr+Sr+Mo+Pa a 1,753.43 1,392.47 79.41% 1236.95 88.83% 39.89 3.23%
Xr+Sr+Mo+Pa b 1,202.92 969.95 80.63% 847.00 87.32% 24.61 2.91%
Xr+Sr+Mo+Pa c 980.82 785.00 80.03% 724.87 92.34% 21.70 2.99%
Xr+Sr+Mo+Pa d 1,324.05 1,044.41 78.88% 935.45 89.57% 23.82 2.55%
Xr+Sr+Mo+Pa e 895.13 708.44 79.14% 661.58 93.38% 15.33 2.32%
*The number of mega bases from the raw output of the sequencer. **Mega bases remaining after the quality filtering process. ***Mega bases mapped to the genomes. ****Mega bases maped to protein coding sequences.
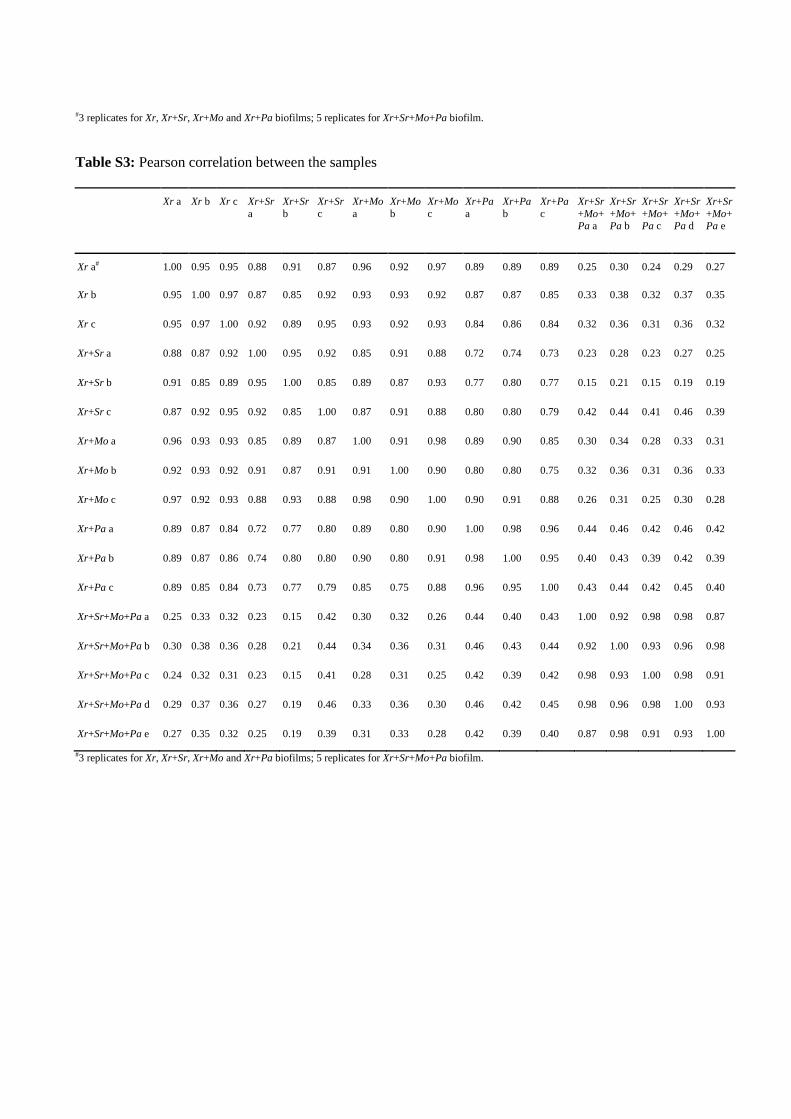
#3 replicates for Xr, Xr+Sr, Xr+Mo and Xr+Pa biofilms; 5 replicates for Xr+Sr+Mo+Pa biofilm.
Table S3: Pearson correlation between the samples
Xr a Xr b Xr c Xr+Sr
a
Xr+Sr
b
Xr+Sr
c
Xr+Mo
a
Xr+Mo
b
Xr+Mo
c
Xr+Pa
a
Xr+Pa
b
Xr+Pa
c
Xr+Sr
+Mo+Pa a
Xr+Sr
+Mo+Pa b
Xr+Sr
+Mo+Pa c
Xr+Sr
+Mo+Pa d
Xr+Sr
+Mo+Pa e
Xr a# 1.00 0.95 0.95 0.88 0.91 0.87 0.96 0.92 0.97 0.89 0.89 0.89 0.25 0.30 0.24 0.29 0.27
Xr b 0.95 1.00 0.97 0.87 0.85 0.92 0.93 0.93 0.92 0.87 0.87 0.85 0.33 0.38 0.32 0.37 0.35
Xr c 0.95 0.97 1.00 0.92 0.89 0.95 0.93 0.92 0.93 0.84 0.86 0.84 0.32 0.36 0.31 0.36 0.32
Xr+Sr a 0.88 0.87 0.92 1.00 0.95 0.92 0.85 0.91 0.88 0.72 0.74 0.73 0.23 0.28 0.23 0.27 0.25
Xr+Sr b 0.91 0.85 0.89 0.95 1.00 0.85 0.89 0.87 0.93 0.77 0.80 0.77 0.15 0.21 0.15 0.19 0.19
Xr+Sr c 0.87 0.92 0.95 0.92 0.85 1.00 0.87 0.91 0.88 0.80 0.80 0.79 0.42 0.44 0.41 0.46 0.39
Xr+Mo a 0.96 0.93 0.93 0.85 0.89 0.87 1.00 0.91 0.98 0.89 0.90 0.85 0.30 0.34 0.28 0.33 0.31
Xr+Mo b 0.92 0.93 0.92 0.91 0.87 0.91 0.91 1.00 0.90 0.80 0.80 0.75 0.32 0.36 0.31 0.36 0.33
Xr+Mo c 0.97 0.92 0.93 0.88 0.93 0.88 0.98 0.90 1.00 0.90 0.91 0.88 0.26 0.31 0.25 0.30 0.28
Xr+Pa a 0.89 0.87 0.84 0.72 0.77 0.80 0.89 0.80 0.90 1.00 0.98 0.96 0.44 0.46 0.42 0.46 0.42
Xr+Pa b 0.89 0.87 0.86 0.74 0.80 0.80 0.90 0.80 0.91 0.98 1.00 0.95 0.40 0.43 0.39 0.42 0.39
Xr+Pa c 0.89 0.85 0.84 0.73 0.77 0.79 0.85 0.75 0.88 0.96 0.95 1.00 0.43 0.44 0.42 0.45 0.40
Xr+Sr+Mo+Pa a 0.25 0.33 0.32 0.23 0.15 0.42 0.30 0.32 0.26 0.44 0.40 0.43 1.00 0.92 0.98 0.98 0.87
Xr+Sr+Mo+Pa b 0.30 0.38 0.36 0.28 0.21 0.44 0.34 0.36 0.31 0.46 0.43 0.44 0.92 1.00 0.93 0.96 0.98
Xr+Sr+Mo+Pa c 0.24 0.32 0.31 0.23 0.15 0.41 0.28 0.31 0.25 0.42 0.39 0.42 0.98 0.93 1.00 0.98 0.91
Xr+Sr+Mo+Pa d 0.29 0.37 0.36 0.27 0.19 0.46 0.33 0.36 0.30 0.46 0.42 0.45 0.98 0.96 0.98 1.00 0.93
Xr+Sr+Mo+Pa e 0.27 0.35 0.32 0.25 0.19 0.39 0.31 0.33 0.28 0.42 0.39 0.40 0.87 0.98 0.91 0.93 1.00
#3 replicates for Xr, Xr+Sr, Xr+Mo and Xr+Pa biofilms; 5 replicates for Xr+Sr+Mo+Pa biofilm.
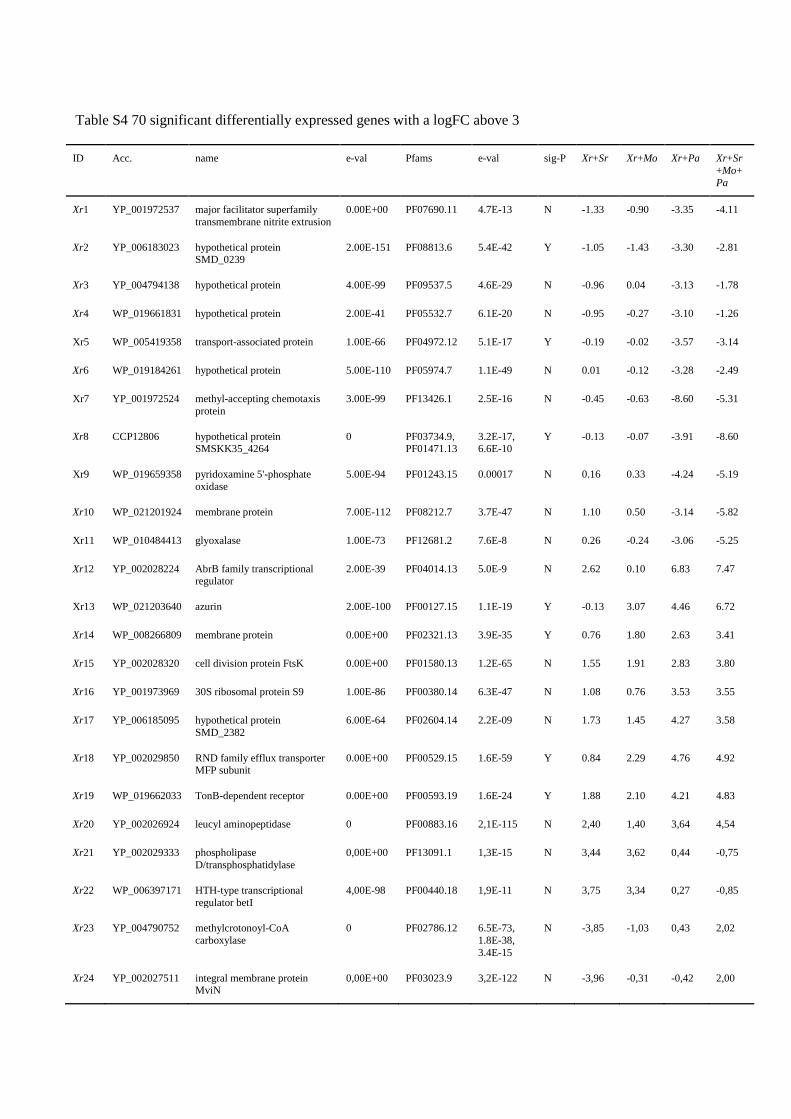
Table S4 70 significant differentially expressed genes with a logFC above 3
ID Acc. name e-val Pfams e-val sig-P Xr+Sr Xr+Mo Xr+Pa Xr+Sr
+Mo+
Pa
Xr1 YP_001972537 major facilitator superfamily
transmembrane nitrite extrusion
0.00E+00 PF07690.11 4.7E-13 N -1.33 -0.90 -3.35 -4.11
Xr2 YP_006183023 hypothetical protein SMD_0239
2.00E-151 PF08813.6 5.4E-42 Y -1.05 -1.43 -3.30 -2.81
Xr3 YP_004794138 hypothetical protein 4.00E-99 PF09537.5 4.6E-29 N -0.96 0.04 -3.13 -1.78
Xr4 WP_019661831 hypothetical protein 2.00E-41 PF05532.7 6.1E-20 N -0.95 -0.27 -3.10 -1.26
Xr5 WP_005419358 transport-associated protein 1.00E-66 PF04972.12 5.1E-17 Y -0.19 -0.02 -3.57 -3.14
Xr6 WP_019184261 hypothetical protein 5.00E-110 PF05974.7 1.1E-49 N 0.01 -0.12 -3.28 -2.49
Xr7 YP_001972524 methyl-accepting chemotaxis
protein
3.00E-99 PF13426.1 2.5E-16 N -0.45 -0.63 -8.60 -5.31
Xr8 CCP12806 hypothetical protein SMSKK35_4264
0 PF03734.9, PF01471.13
3.2E-17, 6.6E-10
Y -0.13 -0.07 -3.91 -8.60
Xr9 WP_019659358 pyridoxamine 5'-phosphate
oxidase
5.00E-94 PF01243.15 0.00017 N 0.16 0.33 -4.24 -5.19
Xr10 WP_021201924 membrane protein 7.00E-112 PF08212.7 3.7E-47 N 1.10 0.50 -3.14 -5.82
Xr11 WP_010484413 glyoxalase 1.00E-73 PF12681.2 7.6E-8 N 0.26 -0.24 -3.06 -5.25
Xr12 YP_002028224 AbrB family transcriptional regulator
2.00E-39 PF04014.13 5.0E-9 N 2.62 0.10 6.83 7.47
Xr13 WP_021203640 azurin 2.00E-100 PF00127.15 1.1E-19 Y -0.13 3.07 4.46 6.72
Xr14 WP_008266809 membrane protein 0.00E+00 PF02321.13 3.9E-35 Y 0.76 1.80 2.63 3.41
Xr15 YP_002028320 cell division protein FtsK 0.00E+00 PF01580.13 1.2E-65 N 1.55 1.91 2.83 3.80
Xr16 YP_001973969 30S ribosomal protein S9 1.00E-86 PF00380.14 6.3E-47 N 1.08 0.76 3.53 3.55
Xr17 YP_006185095 hypothetical protein
SMD_2382
6.00E-64 PF02604.14 2.2E-09 N 1.73 1.45 4.27 3.58
Xr18 YP_002029850 RND family efflux transporter MFP subunit
0.00E+00 PF00529.15 1.6E-59 Y 0.84 2.29 4.76 4.92
Xr19 WP_019662033 TonB-dependent receptor 0.00E+00 PF00593.19 1.6E-24 Y 1.88 2.10 4.21 4.83
Xr20 YP_002026924 leucyl aminopeptidase 0 PF00883.16 2,1E-115 N 2,40 1,40 3,64 4,54
Xr21 YP_002029333 phospholipase
D/transphosphatidylase
0,00E+00 PF13091.1 1,3E-15 N 3,44 3,62 0,44 -0,75
Xr22 WP_006397171 HTH-type transcriptional
regulator betI
4,00E-98 PF00440.18 1,9E-11 N 3,75 3,34 0,27 -0,85
Xr23 YP_004790752 methylcrotonoyl-CoA
carboxylase
0 PF02786.12 6.5E-73,
1.8E-38,
3.4E-15
N -3,85 -1,03 0,43 2,02
Xr24 YP_002027511 integral membrane protein MviN
0,00E+00 PF03023.9 3,2E-122 N -3,96 -0,31 -0,42 2,00
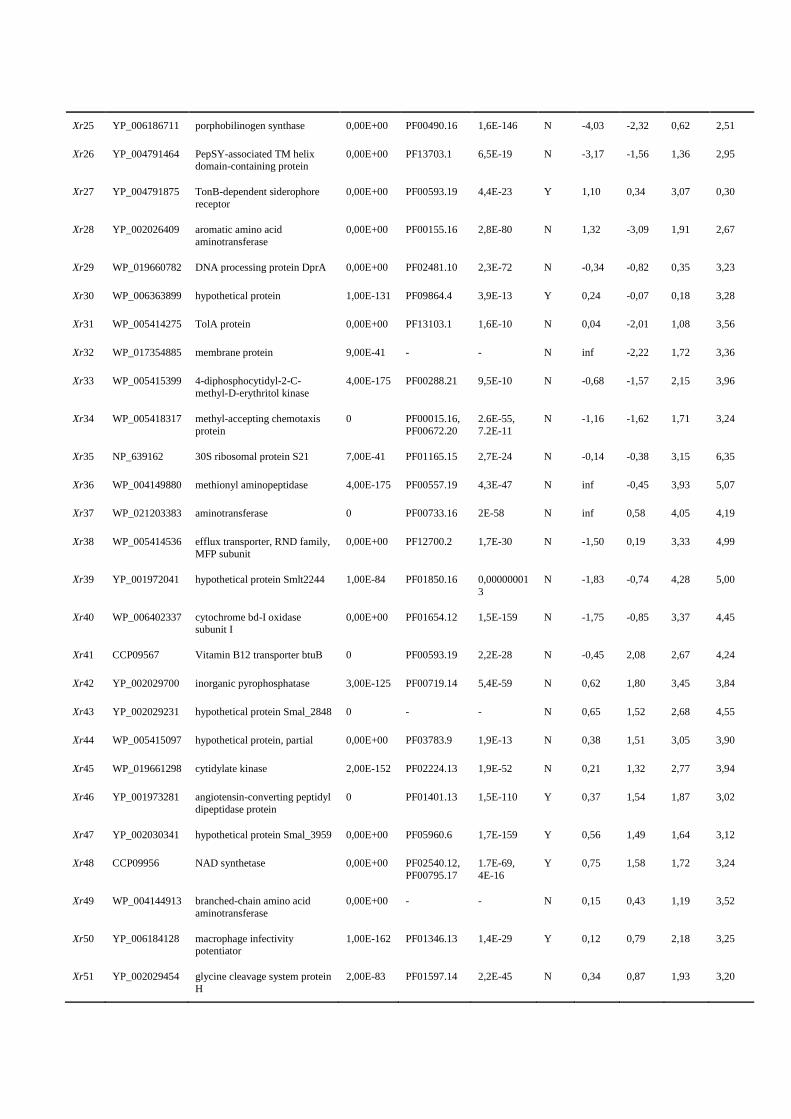
Xr25 YP_006186711 porphobilinogen synthase 0,00E+00 PF00490.16 1,6E-146 N -4,03 -2,32 0,62 2,51
Xr26 YP_004791464 PepSY-associated TM helix domain-containing protein
0,00E+00 PF13703.1 6,5E-19 N -3,17 -1,56 1,36 2,95
Xr27 YP_004791875 TonB-dependent siderophore
receptor
0,00E+00 PF00593.19 4,4E-23 Y 1,10 0,34 3,07 0,30
Xr28 YP_002026409 aromatic amino acid
aminotransferase
0,00E+00 PF00155.16 2,8E-80 N 1,32 -3,09 1,91 2,67
Xr29 WP_019660782 DNA processing protein DprA 0,00E+00 PF02481.10 2,3E-72 N -0,34 -0,82 0,35 3,23
Xr30 WP_006363899 hypothetical protein 1,00E-131 PF09864.4 3,9E-13 Y 0,24 -0,07 0,18 3,28
Xr31 WP_005414275 TolA protein 0,00E+00 PF13103.1 1,6E-10 N 0,04 -2,01 1,08 3,56
Xr32 WP_017354885 membrane protein 9,00E-41 - - N inf -2,22 1,72 3,36
Xr33 WP_005415399 4-diphosphocytidyl-2-C-
methyl-D-erythritol kinase
4,00E-175 PF00288.21 9,5E-10 N -0,68 -1,57 2,15 3,96
Xr34 WP_005418317 methyl-accepting chemotaxis
protein
0 PF00015.16,
PF00672.20
2.6E-55,
7.2E-11
N -1,16 -1,62 1,71 3,24
Xr35 NP_639162 30S ribosomal protein S21 7,00E-41 PF01165.15 2,7E-24 N -0,14 -0,38 3,15 6,35
Xr36 WP_004149880 methionyl aminopeptidase 4,00E-175 PF00557.19 4,3E-47 N inf -0,45 3,93 5,07
Xr37 WP_021203383 aminotransferase 0 PF00733.16 2E-58 N inf 0,58 4,05 4,19
Xr38 WP_005414536 efflux transporter, RND family,
MFP subunit
0,00E+00 PF12700.2 1,7E-30 N -1,50 0,19 3,33 4,99
Xr39 YP_001972041 hypothetical protein Smlt2244 1,00E-84 PF01850.16 0,00000001
3
N -1,83 -0,74 4,28 5,00
Xr40 WP_006402337 cytochrome bd-I oxidase subunit I
0,00E+00 PF01654.12 1,5E-159 N -1,75 -0,85 3,37 4,45
Xr41 CCP09567 Vitamin B12 transporter btuB 0 PF00593.19 2,2E-28 N -0,45 2,08 2,67 4,24
Xr42 YP_002029700 inorganic pyrophosphatase 3,00E-125 PF00719.14 5,4E-59 N 0,62 1,80 3,45 3,84
Xr43 YP_002029231 hypothetical protein Smal_2848 0 - - N 0,65 1,52 2,68 4,55
Xr44 WP_005415097 hypothetical protein, partial 0,00E+00 PF03783.9 1,9E-13 N 0,38 1,51 3,05 3,90
Xr45 WP_019661298 cytidylate kinase 2,00E-152 PF02224.13 1,9E-52 N 0,21 1,32 2,77 3,94
Xr46 YP_001973281 angiotensin-converting peptidyl
dipeptidase protein
0 PF01401.13 1,5E-110 Y 0,37 1,54 1,87 3,02
Xr47 YP_002030341 hypothetical protein Smal_3959 0,00E+00 PF05960.6 1,7E-159 Y 0,56 1,49 1,64 3,12
Xr48 CCP09956 NAD synthetase 0,00E+00 PF02540.12,
PF00795.17
1.7E-69,
4E-16
Y 0,75 1,58 1,72 3,24
Xr49 WP_004144913 branched-chain amino acid
aminotransferase
0,00E+00 - - N 0,15 0,43 1,19 3,52
Xr50 YP_006184128 macrophage infectivity potentiator
1,00E-162 PF01346.13 1,4E-29 Y 0,12 0,79 2,18 3,25
Xr51 YP_002029454 glycine cleavage system protein
H
2,00E-83 PF01597.14 2,2E-45 N 0,34 0,87 1,93 3,20
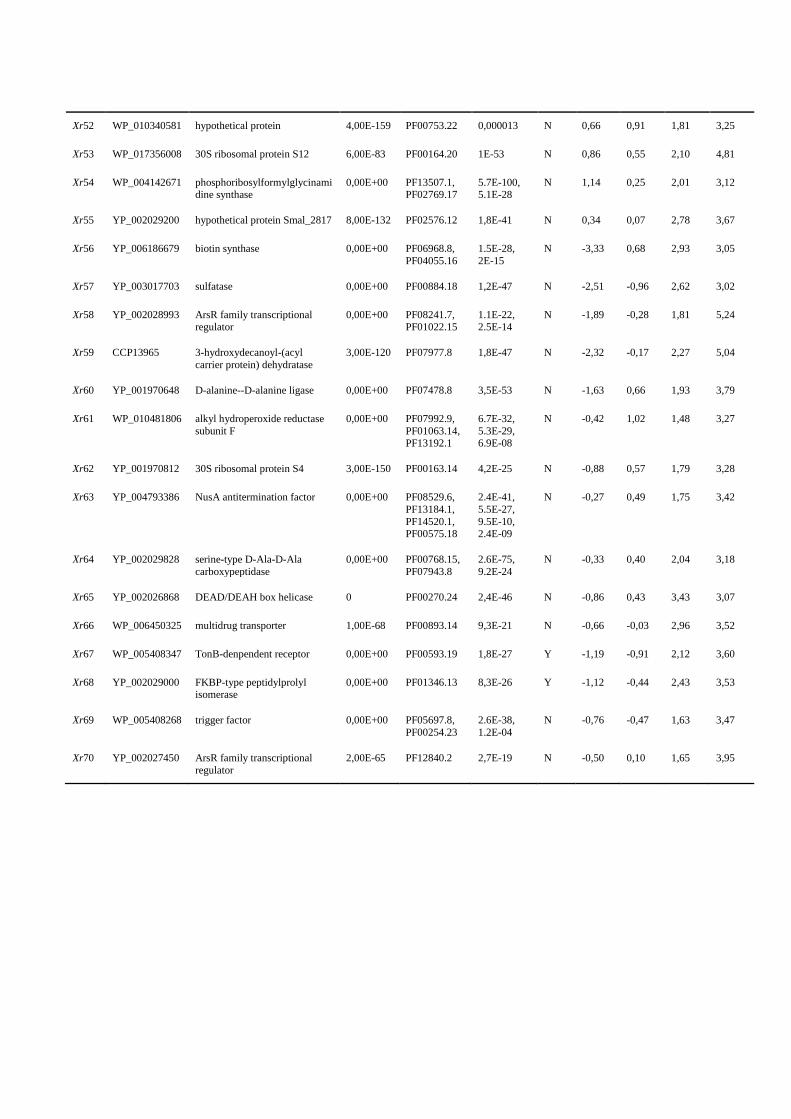
Xr52 WP_010340581 hypothetical protein 4,00E-159 PF00753.22 0,000013 N 0,66 0,91 1,81 3,25
Xr53 WP_017356008 30S ribosomal protein S12 6,00E-83 PF00164.20 1E-53 N 0,86 0,55 2,10 4,81
Xr54 WP_004142671 phosphoribosylformylglycinamidine synthase
0,00E+00 PF13507.1, PF02769.17
5.7E-100, 5.1E-28
N 1,14 0,25 2,01 3,12
Xr55 YP_002029200 hypothetical protein Smal_2817 8,00E-132 PF02576.12 1,8E-41 N 0,34 0,07 2,78 3,67
Xr56 YP_006186679 biotin synthase 0,00E+00 PF06968.8,
PF04055.16
1.5E-28,
2E-15
N -3,33 0,68 2,93 3,05
Xr57 YP_003017703 sulfatase 0,00E+00 PF00884.18 1,2E-47 N -2,51 -0,96 2,62 3,02
Xr58 YP_002028993 ArsR family transcriptional
regulator
0,00E+00 PF08241.7,
PF01022.15
1.1E-22,
2.5E-14
N -1,89 -0,28 1,81 5,24
Xr59 CCP13965 3-hydroxydecanoyl-(acyl
carrier protein) dehydratase
3,00E-120 PF07977.8 1,8E-47 N -2,32 -0,17 2,27 5,04
Xr60 YP_001970648 D-alanine--D-alanine ligase 0,00E+00 PF07478.8 3,5E-53 N -1,63 0,66 1,93 3,79
Xr61 WP_010481806 alkyl hydroperoxide reductase
subunit F
0,00E+00 PF07992.9,
PF01063.14, PF13192.1
6.7E-32,
5.3E-29, 6.9E-08
N -0,42 1,02 1,48 3,27
Xr62 YP_001970812 30S ribosomal protein S4 3,00E-150 PF00163.14 4,2E-25 N -0,88 0,57 1,79 3,28
Xr63 YP_004793386 NusA antitermination factor 0,00E+00 PF08529.6,
PF13184.1,
PF14520.1, PF00575.18
2.4E-41,
5.5E-27,
9.5E-10, 2.4E-09
N -0,27 0,49 1,75 3,42
Xr64 YP_002029828 serine-type D-Ala-D-Ala
carboxypeptidase
0,00E+00 PF00768.15,
PF07943.8
2.6E-75,
9.2E-24
N -0,33 0,40 2,04 3,18
Xr65 YP_002026868 DEAD/DEAH box helicase 0 PF00270.24 2,4E-46 N -0,86 0,43 3,43 3,07
Xr66 WP_006450325 multidrug transporter 1,00E-68 PF00893.14 9,3E-21 N -0,66 -0,03 2,96 3,52
Xr67 WP_005408347 TonB-denpendent receptor 0,00E+00 PF00593.19 1,8E-27 Y -1,19 -0,91 2,12 3,60
Xr68 YP_002029000 FKBP-type peptidylprolyl isomerase
0,00E+00 PF01346.13 8,3E-26 Y -1,12 -0,44 2,43 3,53
Xr69 WP_005408268 trigger factor 0,00E+00 PF05697.8,
PF00254.23
2.6E-38,
1.2E-04
N -0,76 -0,47 1,63 3,47
Xr70 YP_002027450 ArsR family transcriptional
regulator
2,00E-65 PF12840.2 2,7E-19 N -0,50 0,10 1,65 3,95
Manuscript 4
Effects of grazing by flagellate Neocercomonas jutlandica on mono- and multi-
species biofilms

Effects of grazing by flagellate Neocercomonas jutlandica on mono- and multi-
species biofilms
Dawei Rena, Flemming Ekelund
b, Søren J. Sørensen
a,*, Mette Burmølle
a,*
aSection of Microbiology, Department of Biology, University of Copenhagen
bSection of Terrestrial Ecology, Department of Biology, University of Copenhagen
*Corresponding authors
Postal address: Universitetsparken 15, Bygn. 1, 2100 København Ø, Denmark
e-mail Mette Burmølle: [email protected] e-mail Søren J. Sørensen: [email protected]
Key words: Biofilm / protozoan grazing / synergism / predator-prey interaction
Abstract
Protozoan grazing is considered to be a major regulating factor for bacterial populations in
agricultural soil. However, many soil inhabiting bacteria form biofilms and little is known about the
impact of predation as well as predator-bacterial prey interactions on biofilm dynamics. Here, we
used species specific quantitative PCR, to test effects of the heterotrophic flagellate Neocercomonas
jutlandica on biofilm formation. We worked with both a monospecies biofilm formed by
Xanthomonas retroflexus and a multispecies biofilm formed by soil isolates Stenotrophomonas
rhizophila, Xanthomonas retroflexus, Microbacterium oxydans and Paenibacillus amylolyticus. The
presence of N. jutlandica co-cultured with X. retroflexus increased the abundances of X. retroflexus
in both mono- and multi-species biofilms. While, N. jutlandica co-cultured with the mixture of four
bacteria could reduce the abundance of each species significantly in the four-species biofilm. These
conflicting observations indicate that the performance of protozoan grazing greatly relies on
predator-prey interactions, which probably induces protozoa with different grazing abilities.
Additionally, the synergistic interactions in this multispecies biofilm did not afford more protection
against predation compared with X. retroflexus biofilm. The constant ratio of cell numbers among X.
retroflexus, M. oxydans and P. amylolyticus was observed regardless of protozoan grazing,
suggesting these three species were spatially arranged in integrated communities rather than
individual microcolonies. However, these conclusions are based on the assumption that this
flagellate predator prefers surface attached cells. The experimental design needs to be optimized
and further studies should be conducted to verify these preliminary results. Furthermore, by
incorporating other types of protozoa, a more comprehensive assessment of protozoa-biofilm
interactions can be achieved.

Introduction
Biofilms, i.e. microbial aggregates associated
with surfaces, are ubiquitous in nature [1].
Typically, they contain multiple species of
bacteria, as well as archaea, fungi, algae and
protozoa. Protozoa occur ubiquitously and are
an important regulating factor for bacteria
growth and survival in nature [2]. The
dominant groups of protozoa in soil are
normally naked amoebae and heterotrophic
flagellates (HF) [3]. Heterotrophic flagellates
which utilize long flagella for propulsion are
the pioneer colonizer of the surfaces and
bacterial biofilms due to their high mobility and
abundance [4]. In agricultural soil,
heterotrophic flagellates are able to graze
bacteria in small pores because of their small
size and flexible cells and thus, play an
important role in the control of bacterial
communities as well as mineralization and
nutrient cycling by releasing the nitrogen taken
by bacteria [2].
The evidences that protozoan grazing could
shape biofilm morphology and spatial
arrangement of bacterial cells, such as
stimulating microcolonies formation, reducing
maximal and basal layer thickness and altering
mass transfer of nutrients, have been widely
reported [5, 6]. A generally held opinion is that
by growing in biofilms, bacteria can be offered
a protective niche against protozoan grazing,
owing to the physical protection by secreted
polymeric matrix [7] and enhanced
coordination by horizontal gene transfer and
quorum sensing [6, 8]. However, the counter
argument is also presented by the reports that
some protozoa showed marked preferences for
attached and aggregated bacteria, such as the
naked amoebae and many of the common
heterotrophic flagellates, as demonstrated for
Rhyncomonas nasuta and species of the genus
Bodo [9, 10]. Moreover, some pathogens, such
as Legionella, could multiply and become more
virulent and resistant after ingested by protozoa
in biofilms [11, 12], indicating the crucial role
of protozoa and biofilms in the evolution of
virulence factors in pathogenic bacteria.
Despite the feeding interactions between
protozoa and planktonic bacteria are well
understood [13-15], only a handful of studies
have attempted to assess the grazing impact on
biofilms, especially multispecies biofilms,
where interspecies interactions play an
important role in determining the structure,
function and dynamics of biofilms and
probably are involved in the defense
mechanism of bacterial biofilms against
protozoan grazing [16, 17].
Here, we combine species specific quantitative
PCR and a multispecies biofilm model, which
consists of four soil isolates and shows
synergism in biofilm formation. Then, the
effects of grazing by a flagellate on the
population dynamics of this multispecies
biofilm and a single-species biofilm were
quantified and compared, which could provide
valuable information about the impact of
interspecies interactions on the biofilm
resilience to grazing pressure in soil.
Materials and methods
Organisms and growth conditions
The bacterial strains Stenotrophomonas
rhizophila (JQ890538), Xanthomonas
retroflexus (JQ890537), Microbacterium
oxydans (JQ890539), and Paenibacillus
amylolyticus (JQ890540) were isolated from
agricultural soil as described previously [18].
Bacteria were routinely grown from frozen
glycerol stocks on Tryptic Soy Agar plates for
48h at 24°C. Thereafter, colonies were
transferred into full strength TSB (Tryptic Soy
Broth), incubated with shaking (250 rpm) at
24°C overnight for biofilm growth assay, or
into one-tenth strength TSB, incubated with
shaking (250 rpm) at 24°C for 48 h and then
used as bacterial prey for protozoan predators.
Neocercomonas jutlandica was originally
isolated from soil sampled at Research Center
Foulum (Jutland, Denmark), where it was the
most abundant flagellate species occurring in
microtiter plates used for enumeration of soil
protozoa [19]. Since then it has been kept in the
culture collection at Section for Terrestrial
Ecology, and has been used in several
experiments. Its growth kinetics was
determined in [20], and its susceptibility to the
fungicide propiconazole was assessed in [21]
where it was named Cercomonas crassicauda.
Ekelund F et al. [22] sequenced it and analysed
it phylogenetically, and hence gave it the name
Neocercomonas jutlandica. Finally, Pedersen
AL et al. [23, 24] showed that N. jutlandica
was among the more tolerant protozoa when
exposed to potentially toxic Pseudomonas spp.
We notice that N. jutlandica is synonymous
with Cercomonas jutlandica [25].
The derived protozoan cultures growing on
specific strains were prepared as follows. The
pure bacterial 48 h-cultures and the equal-
volume mixed culture of these four strains were
diluted 20-fold in weak phosphate buffer
(Neff ’s modified amoeba saline) [26], then the
stepwise dilution technique [27, 28] was
performed to provide protozoan cultures on
each strain separately and on the mixed bacteria.
In short, 100 μL protozoan cultures were
repeatedly transferred to 10 mL bacterial
cultures in cell culture flasks (Nunc A/S,
Roskilde, Denmark, # 156367, 25 cm3)
produced as described above and incubated in
darkness, at 9 °C, until late exponential phase.
More reproducible results could be obtained
from this approach than using a fixed cell
number as food source for protozoa when
making a standard comparison between cultures
according to Pedersen AL et al. [24].
Flagellate growth on bacterial cultures
We determined growth rates and peak
abundance of N. jutlandica on the four bacteria
separately and as a mixture (equal-volume
mixed) in 96-well microtiter plates (Cat. No.
655 180, Greiner Bio-One, Germany). For each
of the four bacteria and a mixture, 125 μL of
the 20-fold bacterial dilution and 25 μL
protozoan cultures (prepared as mentioned
above) were mixed and inoculated into each
well. Each particular combination of bacteria
and protozoa was set up in four replicates. The
wells containing only 150 μL bacteria were
blank controls. The batch cultures were then
left at 9 °C in darkness.
We used an inverted microscope (Olympus
CK30, 200 × magnification, phase contrast) to
quantify the protozoa. For each of the five
bacterial treatments, we counted the protozoa in
the four replicate wells every day from day 0 to
day 8, and on days 10, 12, 14, 16, 19 and 21,
where the cultures had approached the
stationary phase. At each counting, protozoa
spread five microscopic fields were counted in
each well. The protozoan numbers in each well
were calculated and plotted against times (day)
in SigmaPlot 12.5. The nonlinear regression
analyses were performed to fit these points to a
Sigmoidal, 3 Parameter equation f = a/(1+exp(-
(x-x0)/b)), where a, b and x0 are constants that
are determined by the nonlinear regression. The
intrinsic growth rate (r) defined as slope of the
sigmoid curve in the point of inflexion (r =
a/4b), and peak abundance (p) defined as the
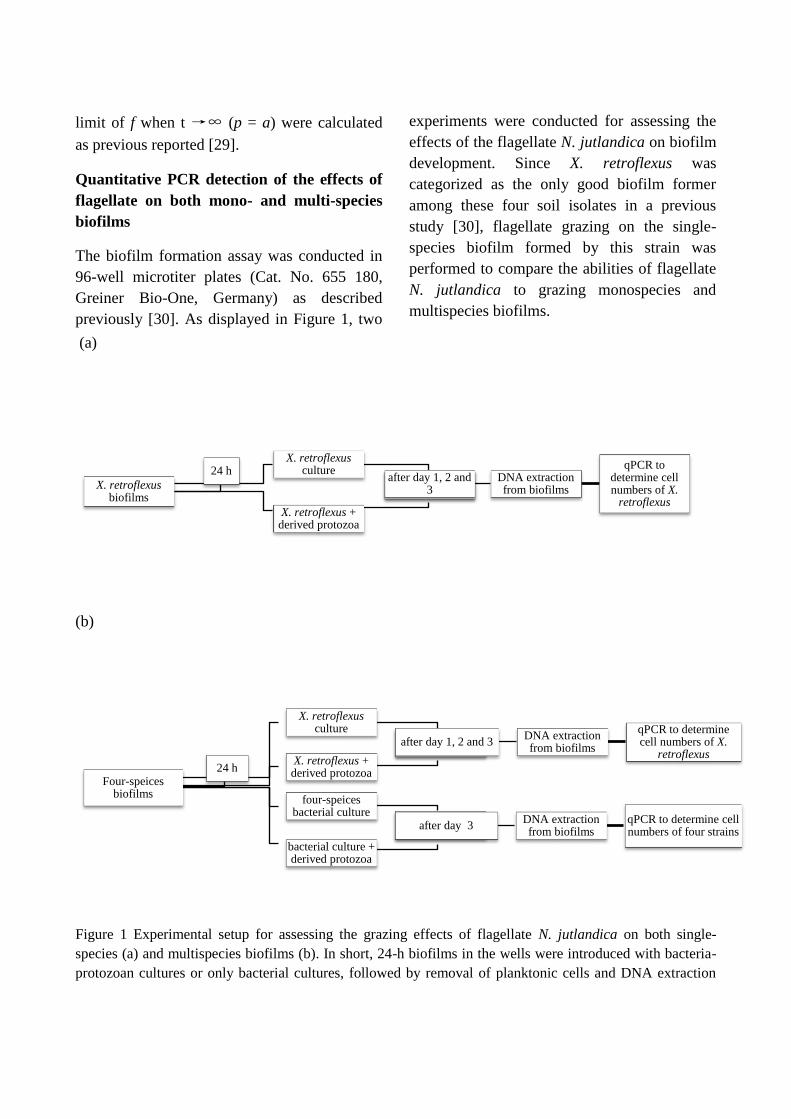
limit of f when t →∞ (p = a) were calculated
as previous reported [29].
Quantitative PCR detection of the effects of
flagellate on both mono- and multi-species
biofilms
The biofilm formation assay was conducted in
96-well microtiter plates (Cat. No. 655 180,
Greiner Bio-One, Germany) as described
previously [30]. As displayed in Figure 1, two
experiments were conducted for assessing the
effects of the flagellate N. jutlandica on biofilm
development. Since X. retroflexus was
categorized as the only good biofilm former
among these four soil isolates in a previous
study [30], flagellate grazing on the single-
species biofilm formed by this strain was
performed to compare the abilities of flagellate
N. jutlandica to grazing monospecies and
multispecies biofilms.
(a)
(b)
Figure 1 Experimental setup for assessing the grazing effects of flagellate N. jutlandica on both single-
species (a) and multispecies biofilms (b). In short, 24-h biofilms in the wells were introduced with bacteria-
protozoan cultures or only bacterial cultures, followed by removal of planktonic cells and DNA extraction
X. retroflexus biofilms
X. retroflexus culture
after day-1, 2 and 3
X. retroflexus + derived protozoa
after day 1, 2 and 3
DNA extraction from biofilms
qPCR to determine cell numbers of X.
retroflexus
24 h
Four-speices biofilms
X. retroflexus culture
X. retroflexus + derived protozoa
after day 1, 2 and 3 DNA extraction from biofilms
qPCR to determine cell numbers of X.
retroflexus
four-speices bacterial culture
after day-3
bacterial culture + derived protozoa
after day 3 DNA extraction from biofilms
qPCR to determine cell numbers of four strains
24 h
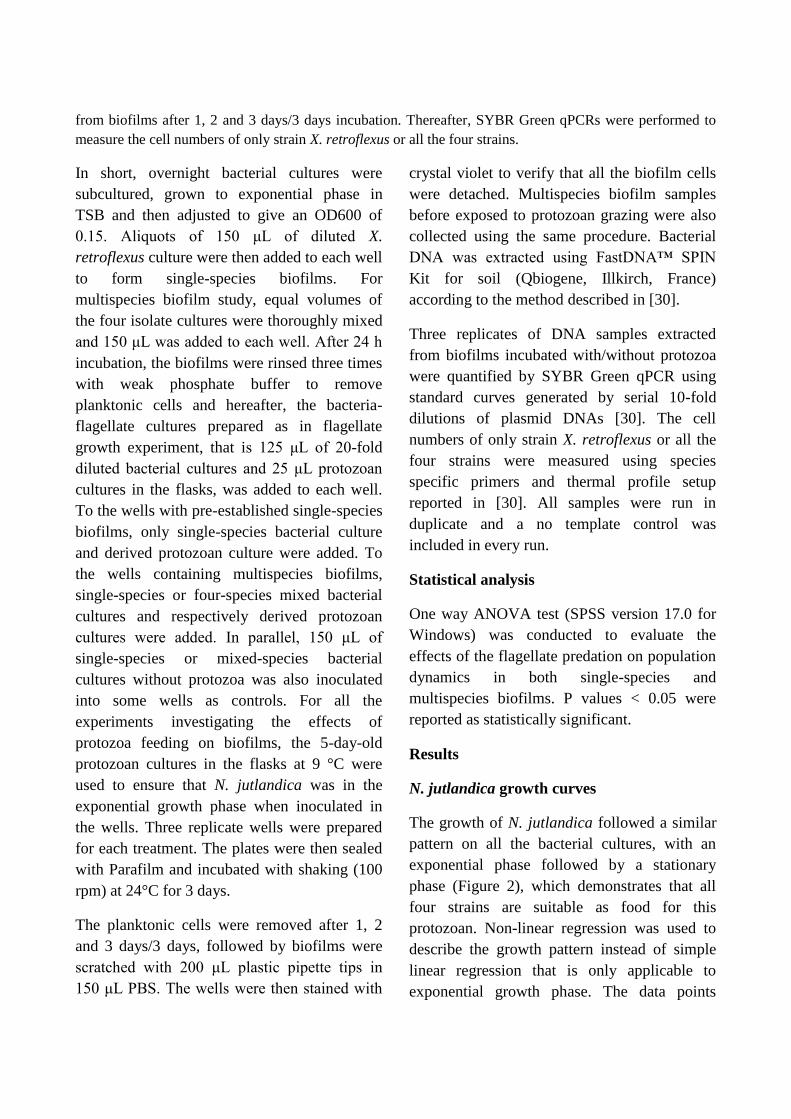
from biofilms after 1, 2 and 3 days/3 days incubation. Thereafter, SYBR Green qPCRs were performed to
measure the cell numbers of only strain X. retroflexus or all the four strains.
In short, overnight bacterial cultures were
subcultured, grown to exponential phase in
TSB and then adjusted to give an OD600 of
0.15. Aliquots of 150 μL of diluted X.
retroflexus culture were then added to each well
to form single-species biofilms. For
multispecies biofilm study, equal volumes of
the four isolate cultures were thoroughly mixed
and 150 μL was added to each well. After 24 h
incubation, the biofilms were rinsed three times
with weak phosphate buffer to remove
planktonic cells and hereafter, the bacteria-
flagellate cultures prepared as in flagellate
growth experiment, that is 125 μL of 20-fold
diluted bacterial cultures and 25 μL protozoan
cultures in the flasks, was added to each well.
To the wells with pre-established single-species
biofilms, only single-species bacterial culture
and derived protozoan culture were added. To
the wells containing multispecies biofilms,
single-species or four-species mixed bacterial
cultures and respectively derived protozoan
cultures were added. In parallel, 150 μL of
single-species or mixed-species bacterial
cultures without protozoa was also inoculated
into some wells as controls. For all the
experiments investigating the effects of
protozoa feeding on biofilms, the 5-day-old
protozoan cultures in the flasks at 9 °C were
used to ensure that N. jutlandica was in the
exponential growth phase when inoculated in
the wells. Three replicate wells were prepared
for each treatment. The plates were then sealed
with Parafilm and incubated with shaking (100
rpm) at 24°C for 3 days.
The planktonic cells were removed after 1, 2
and 3 days/3 days, followed by biofilms were
scratched with 200 μL plastic pipette tips in
150 μL PBS. The wells were then stained with
crystal violet to verify that all the biofilm cells
were detached. Multispecies biofilm samples
before exposed to protozoan grazing were also
collected using the same procedure. Bacterial
DNA was extracted using FastDNA™ SPIN
Kit for soil (Qbiogene, Illkirch, France)
according to the method described in [30].
Three replicates of DNA samples extracted
from biofilms incubated with/without protozoa
were quantified by SYBR Green qPCR using
standard curves generated by serial 10-fold
dilutions of plasmid DNAs [30]. The cell
numbers of only strain X. retroflexus or all the
four strains were measured using species
specific primers and thermal profile setup
reported in [30]. All samples were run in
duplicate and a no template control was
included in every run.
Statistical analysis
One way ANOVA test (SPSS version 17.0 for
Windows) was conducted to evaluate the
effects of the flagellate predation on population
dynamics in both single-species and
multispecies biofilms. P values < 0.05 were
reported as statistically significant.
Results
N. jutlandica growth curves
The growth of N. jutlandica followed a similar
pattern on all the bacterial cultures, with an
exponential phase followed by a stationary
phase (Figure 2), which demonstrates that all
four strains are suitable as food for this
protozoan. Non-linear regression was used to
describe the growth pattern instead of simple
linear regression that is only applicable to
exponential growth phase. The data points
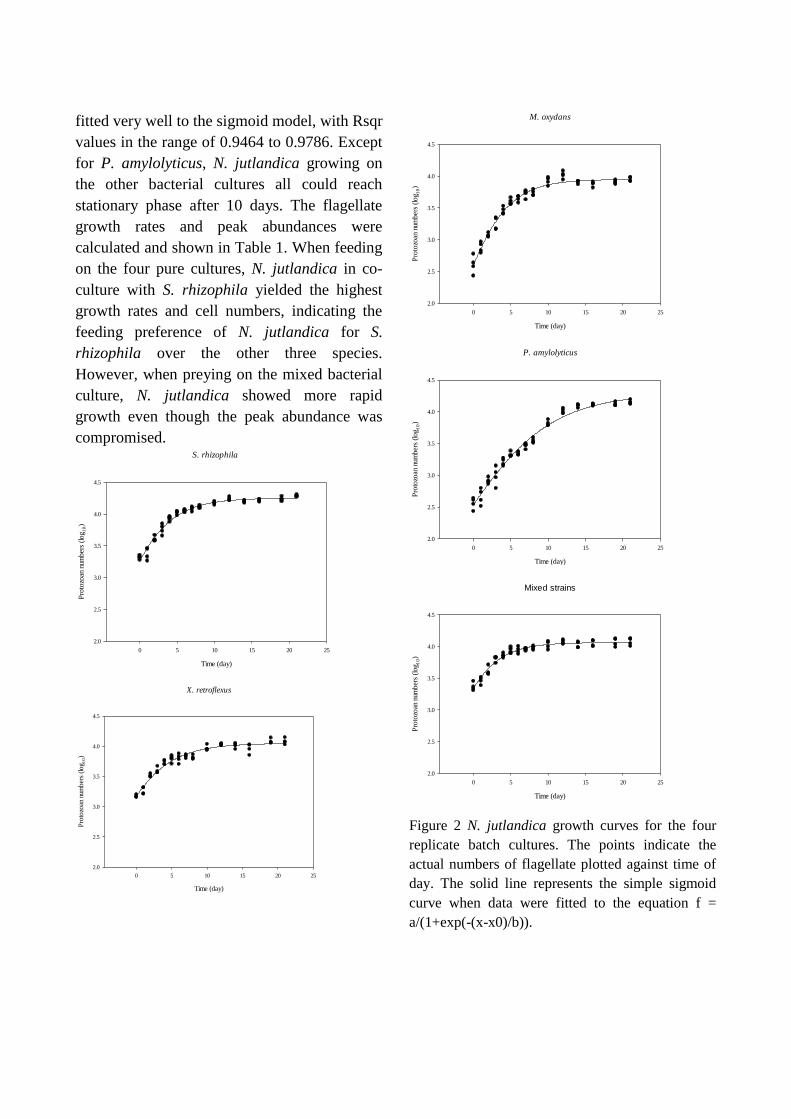
fitted very well to the sigmoid model, with Rsqr
values in the range of 0.9464 to 0.9786. Except
for P. amylolyticus, N. jutlandica growing on
the other bacterial cultures all could reach
stationary phase after 10 days. The flagellate
growth rates and peak abundances were
calculated and shown in Table 1. When feeding
on the four pure cultures, N. jutlandica in co-
culture with S. rhizophila yielded the highest
growth rates and cell numbers, indicating the
feeding preference of N. jutlandica for S.
rhizophila over the other three species.
However, when preying on the mixed bacterial
culture, N. jutlandica showed more rapid
growth even though the peak abundance was
compromised.S. rhizophila
Time (day)
0 5 10 15 20 25
Pro
tozo
an n
umber
s (log
10)
2.0
2.5
3.0
3.5
4.0
4.5
X. retroflexus
Time (day)
0 5 10 15 20 25
Pro
tozo
an n
umber
s (log
10)
2.0
2.5
3.0
3.5
4.0
4.5
M. oxydans
Time (day)
0 5 10 15 20 25
Pro
tozo
an n
umber
s (log 1
0)
2.0
2.5
3.0
3.5
4.0
4.5
P. amylolyticus
Time (day)
0 5 10 15 20 25
Pro
tozo
an n
umber
s (log 1
0)
2.0
2.5
3.0
3.5
4.0
4.5
Mixed strains
Time (day)
0 5 10 15 20 25
Pro
tozo
an n
umber
s (log
10)
2.0
2.5
3.0
3.5
4.0
4.5
Figure 2 N. jutlandica growth curves for the four
replicate batch cultures. The points indicate the
actual numbers of flagellate plotted against time of
day. The solid line represents the simple sigmoid
curve when data were fitted to the equation f =
a/(1+exp(-(x-x0)/b)).
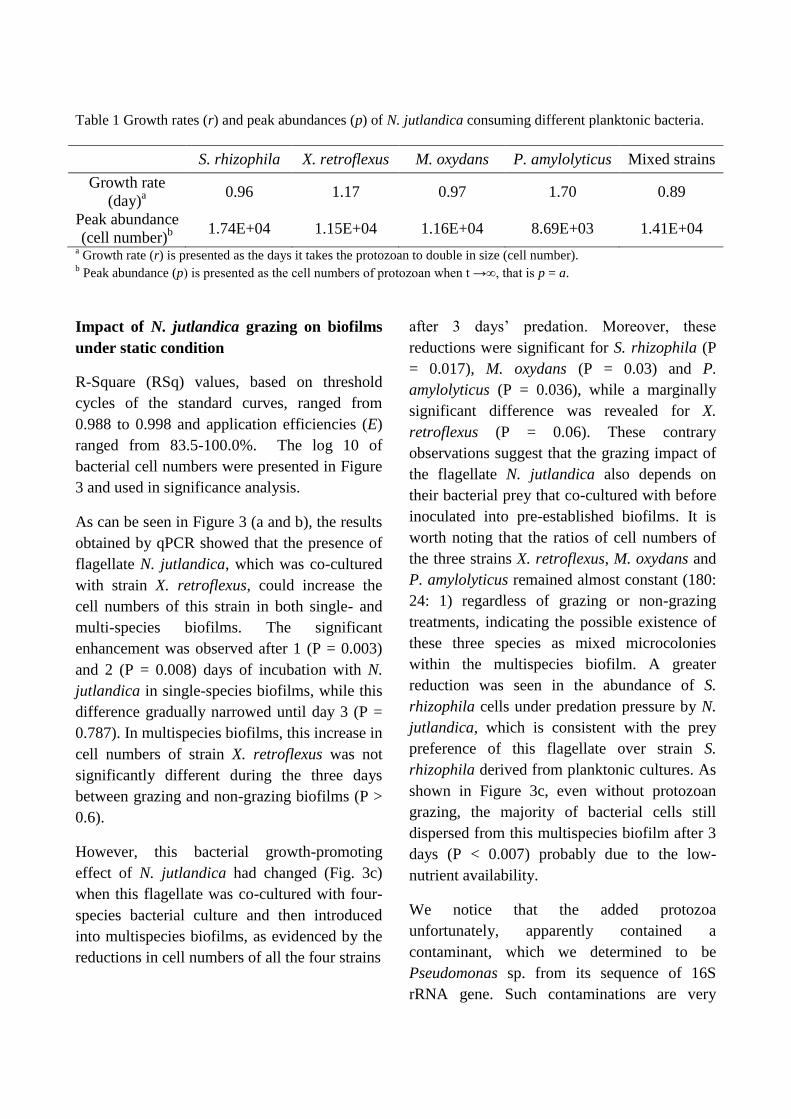
Table 1 Growth rates (r) and peak abundances (p) of N. jutlandica consuming different planktonic bacteria.
S. rhizophila X. retroflexus M. oxydans P. amylolyticus Mixed strains
Growth rate
(day)a
0.96 1.17 0.97 1.70 0.89
Peak abundance
(cell number)b
1.74E+04 1.15E+04 1.16E+04 8.69E+03 1.41E+04
a Growth rate (r) is presented as the days it takes the protozoan to double in size (cell number).
b Peak abundance (p) is presented as the cell numbers of protozoan when t →∞, that is p = a.
Impact of N. jutlandica grazing on biofilms
under static condition
R-Square (RSq) values, based on threshold
cycles of the standard curves, ranged from
0.988 to 0.998 and application efficiencies (E)
ranged from 83.5-100.0%. The log 10 of
bacterial cell numbers were presented in Figure
3 and used in significance analysis.
As can be seen in Figure 3 (a and b), the results
obtained by qPCR showed that the presence of
flagellate N. jutlandica, which was co-cultured
with strain X. retroflexus, could increase the
cell numbers of this strain in both single- and
multi-species biofilms. The significant
enhancement was observed after 1 (P = 0.003)
and 2 (P = 0.008) days of incubation with N.
jutlandica in single-species biofilms, while this
difference gradually narrowed until day 3 (P =
0.787). In multispecies biofilms, this increase in
cell numbers of strain X. retroflexus was not
significantly different during the three days
between grazing and non-grazing biofilms (P >
0.6).
However, this bacterial growth-promoting
effect of N. jutlandica had changed (Fig. 3c)
when this flagellate was co-cultured with four-
species bacterial culture and then introduced
into multispecies biofilms, as evidenced by the
reductions in cell numbers of all the four strains
after 3 days’ predation. Moreover, these
reductions were significant for S. rhizophila (P
= 0.017), M. oxydans (P = 0.03) and P.
amylolyticus (P = 0.036), while a marginally
significant difference was revealed for X.
retroflexus (P = 0.06). These contrary
observations suggest that the grazing impact of
the flagellate N. jutlandica also depends on
their bacterial prey that co-cultured with before
inoculated into pre-established biofilms. It is
worth noting that the ratios of cell numbers of
the three strains X. retroflexus, M. oxydans and
P. amylolyticus remained almost constant (180:
24: 1) regardless of grazing or non-grazing
treatments, indicating the possible existence of
these three species as mixed microcolonies
within the multispecies biofilm. A greater
reduction was seen in the abundance of S.
rhizophila cells under predation pressure by N.
jutlandica, which is consistent with the prey
preference of this flagellate over strain S.
rhizophila derived from planktonic cultures. As
shown in Figure 3c, even without protozoan
grazing, the majority of bacterial cells still
dispersed from this multispecies biofilm after 3
days (P < 0.007) probably due to the low-
nutrient availability.
We notice that the added protozoa
unfortunately, apparently contained a
contaminant, which we determined to be
Pseudomonas sp. from its sequence of 16S
rRNA gene. Such contaminations are very
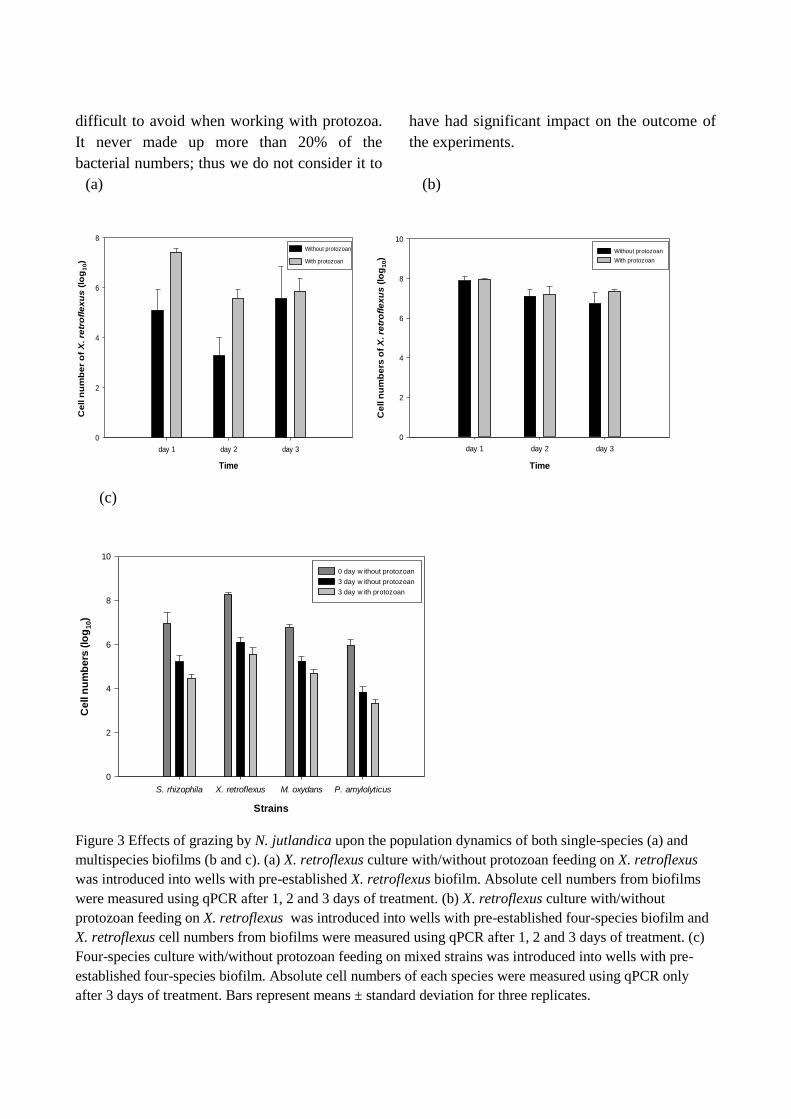
difficult to avoid when working with protozoa.
It never made up more than 20% of the
bacterial numbers; thus we do not consider it to
have had significant impact on the outcome of
the experiments.
(a) (b)
Time
day 1 day 2 day 3
Ce
ll n
um
be
rs o
f X
. re
tro
fle
xu
s (
log
10)
0
2
4
6
8
10
Without protozoan
With protozoan
(c)
Strains
S. rhizophila X. retroflexus M. oxydans P. amylolyticus
Ce
ll n
um
be
rs (
log
10)
0
2
4
6
8
10
0 day w ithout protozoan
3 day w ithout protozoan
3 day w ith protozoan
Figure 3 Effects of grazing by N. jutlandica upon the population dynamics of both single-species (a) and
multispecies biofilms (b and c). (a) X. retroflexus culture with/without protozoan feeding on X. retroflexus
was introduced into wells with pre-established X. retroflexus biofilm. Absolute cell numbers from biofilms
were measured using qPCR after 1, 2 and 3 days of treatment. (b) X. retroflexus culture with/without
protozoan feeding on X. retroflexus was introduced into wells with pre-established four-species biofilm and
X. retroflexus cell numbers from biofilms were measured using qPCR after 1, 2 and 3 days of treatment. (c)
Four-species culture with/without protozoan feeding on mixed strains was introduced into wells with pre-
established four-species biofilm. Absolute cell numbers of each species were measured using qPCR only
after 3 days of treatment. Bars represent means ± standard deviation for three replicates.
Time
day 1 day 2 day 3
Ce
ll n
um
be
r o
f X
. re
tro
fle
xu
s (
log
10)
0
2
4
6
8
Without protozoan
With protozoan
Discussion
Bacterial biofilms and protozoa are prevalent in
natural environments. Protozoa shape the
microbial communities, influence nutrient
availability and act as reservisors and vectors of
pathogenic bacteria [7, 31, 32]. Although, the
underlying mechanisms have been partly
elucidated from limited researches focusing on
single-species models [6, 33, 34], there is still a
deficiency of studies regarding the shaping
impact of protozoa on mixed-species biofilms,
which represent the predominate lifestyle in
most ecosystems. In a previous study, a strong
synergy was observed in a biofilm composed of
four soil isolates, which could contribute to
three-fold more biofilm biomass than the
single-species biofilms. Moreover, by
employing quantitative PCR, interspecific
cooperation and the dominance of X.
retroflexus in this microbial community had
been further demonstrated [30], indicating the
usefulness of qPCR assay in monitoring the
population dynamics. Here we combined this
powerful tool with the developed multispecies
biofilm model to evaluate the role of synergistic
interactions played in the impact of protozoan
grazing on the mixed-species biofilms.
Bacterial features, including cell size, surface
properties, speed of movement and ability of
biofilm formation [14, 35-37] could affect their
vulnerability towards grazers. Additionally,
some gram-positive bacteria showed lower
edibility than gram-negative bacteria due to
their thick and rigid cell walls [38].The larger
size (0.7 to 0.9 by 3.0 to 5.0 μm) compared
with other three species, motility by flagella
and gram status of strain P. amylolyticus [39]
may presumably explain the lower growth rate
and abundance of N. jutlandica when feeding
on this strain grown in planktonic culture.
Although high biofilm-forming capacities were
demonstrated in X. retroflexus and in co-culture
of the four species previously [30], these were
not observed under the oligotrophic condition
in the present study (data not shown), which
could be largely responsible for their
vulnerability towards N. jutlandica. The highest
growth rate of flagellate was found in mixed
culture of these four species which may result
from the enhanced prey density due to the
synergistic growth effect among these bacteria.
This synergistic interaction was observed in
biofilm formation with higher nutrient
concentration previously [30], thus, it requires
further validation as bacterial cultures were
diluted 20-fold in non-nutritious buffer (Neff ’s
modified amoeba saline) in the present study.
In order to maintain the vitality of N. jutlandica,
diluted bacterial cultures were inoculated
together with protozoan into the pre-established
biofilms. Even so, the added bacteria were
unlikely to result in the additional biofilm
formation, as confirmed by their inability to
produce any single- or multi-species biofilm in
the low-nutrient medium with or without the
presence of N. jutlandica (data not shown).
Hence, the changes in biofilm biomass after
addition of protozoa compared with addition of
diluted bacteria cultures only should result
solely from the influence of protozoan grazing
on biofilms.
A recent study has shown that while early-stage
biofilms are mainly regulated by random
attachment, mature biofilms seem to be largely
regulated by interactions within the bacterial
communities and with the abiotic environment,
whereas grazing by heterotrophic flagellates
may only has a detectable but limited effect
[17]. However, in this study, we demonstrate
that biofilm dynamics could be greatly affected
by both the abiotic condition (e.g. nutrient
starvation) and flagellate grazing. Previous
studies from Wey JK et al. [17] have shown
that within semi-natural river biofilms, while
some bacterial species were especially
susceptible to grazing by HF, others could
benefit from the resulting decreased
competition. This was not observed in the
present study, as the cell numbers of all species
in the presence of grazer decreased
significantly (Figure 3c). Interestingly,
although the cell number of strain S. rhizophila
showed reduction to a greater extent, an
approximate 3-fold reduction in cell numbers
was shown in all other three species, indicating
that these three species probably exist as
integrated communities rather than form
individual microcolonies.
The evidences that grazing pressure is
positively correlated with the formation of cell
clusters have been supported by the results
obtained both from monospecies laboratory
biofilms [6, 40] and from natural/semi-natural
multispecies biofilms [32, 41]. This could result
from an active defense mechanism [42] or a
passive process that the movement of HF and
their flagella drive the bacterial cells to the
substratum [17]. On the contrary, the
conclusion that total protection against
predation could not be fully met by growing as
a biofilm was also widely reported, as
exemplified by enhanced sloughing [43] and/or
markedly altered population dynamics [44] in
the presence of grazers. In this study, we aimed
to test the hypothesis that multispecies biofilms
should be more grazing-resistant compared
with monospecies biofilms owing to the
synergisitc interactions between community
members. However, conflicting results were
found. The increased bacterial abundance in the
presence of protozoa co-cultured with X.
retroflexus was reflected in both mono- and
multi-species biofilms. However, when used
the same flagellate but co-cultured with the
mixed bacteria, the significant reductions of
cell numbers were observed for all the four
bacteria. This can be explained by the higher
growth rate of N. jutlandica when feeding on
mixed bacteria compared with feeding on a
pure culture of X. retroflexus. These different
prey preferences suggest that this flagellate
probably has evolved better adaption to the
mixed bacteria which results in higher density
and vitality and thus higher ‘offensiveness’.
When co-cultured only with strain X.
retroflexus, this flagellate might become less
active grazer or the synergistic interactions
between biofilm members could enhance the
resistance of this multispecies biofilms against
protozoan grazing. However, the former
explanation seems more reasonable as in
single-species biofilms absent of interspecies
interactions, the decrease in cell numbers of X.
retroflexus was not observed either.
It is very important to note that we only have
been looking at the surface attached bacterial
cells. The conclusions obtained in this study are
based on the assumption that the chosen
flagellate have a preferencial grazing on surface
attached cells. However if this assumption is
wrong then we may have a situation where
majority of cells in planktonic phase will be
grazed and only surface attached cells will be
protected. In this situation we expect that the
monospecies cultures of the three bacteria
unable to produce biofilm by themselves will
be heavily reduced by grazing and that they
actually benefit greatly by being together in the
four-species consortium where biofilms
formation will provide them protections against
protozoan grazing. In order to test this we need
to conduct further experiments where we also
count bacterial cells in planktonic phase both in
mono cultures +/- protozoan grazing and in

four-species co-cultures. Thus, from the present
results, we can not support or reject this
hypothesis, and further experiments are needed
before it can be concluded which of the above
listed scenarios is supported.
Besides, it is not within the scope of this study
to predict whether the flagellate-prey
interactions obtained here, namely, the effects
of flagellate N. jutlandica on biofilms, could be
extrapolated to other protozoa. In future studies,
incorporation of other protozoa would certainly
be interesting; moreover, experimental
approach and axenizing procedure need
optimization to make this setup a valuable tool
for research on protozoa-biofilm interactions.
References
1. Donlan RM, Costerton JW (2002) Biofilms:
survival mechanisms of clinically relevant
microorganisms. Clinical microbiology reviews
15: 167-193.
2. Ekelund F, Rønn R (1994) Notes on protozoa in
agricultural soil with emphasis on heterotrophic
flagellates and naked amoebae and their ecology.
FEMS Microbiology Reviews 15: 321-353.
3. Ekelund F, Rønn R, Griffiths BS (2001)
Quantitative estimation of flagellate community
structure and diversity in soil samples. Protist
152: 301-314.
4. Arndt H, Schmidt-Denter K, Auer B, Weitere M
(2003) Protozoans and biofilms. Fossil and
recent biofilms 1: 161-179.
5. Böhme A, Risse‐Buhl U, Küsel K (2009)
Protists with different feeding modes change
biofilm morphology. FEMS microbiology
ecology 69: 158-169.
6. Matz C, Bergfeld T, Rice SA, Kjelleberg S
(2004) Microcolonies, quorum sensing and
cytotoxicity determine the survival of
Pseudomonas aeruginosa biofilms exposed to
protozoan grazing. Environmental microbiology
6: 218-226.
7. Joubert L-M, Wolfaardt G, Botha A (2006)
Microbial exopolymers link predator and prey
in a model yeast biofilm system. Microbial
ecology 52: 187-197.
8. Queck SY, Weitere M, Moreno AM, Rice SA,
Kjelleberg S (2006) The role of quorum sensing
mediated developmental traits in the resistance
of Serratia marcescens biofilms against
protozoan grazing. Environmental microbiology
8: 1017-1025.
9. Caron DA (1987) Grazing of attached bacteria
by heterotrophic microflagellates. Microbial
Ecology 13: 203-218.
10. Sibbald MJ, Albright LJ (1988) Aggregated
and free bacteria as food sources for
heterotrophic microflagellates. Applied and
environmental microbiology 54: 613-616.
11. Taylor M, Ross K, Bentham R (2009)
Legionella, protozoa, and biofilms: interactions
within complex microbial systems. Microbial
ecology 58: 538-547.
12. Rowe M, Grant I (2006) Mycobacterium avium
ssp. paratuberculosis and its potential survival
tactics. Letters in applied microbiology 42: 305-
311.
13. Jürgens K, Matz C (2002) Predation as a
shaping force for the phenotypic and genotypic
composition of planktonic bacteria. Antonie van
Leeuwenhoek 81: 413-434.
14. Matz C, Jürgens K (2005) High motility reduces
grazing mortality of planktonic bacteria.
Applied and environmental microbiology 71:
921-929.
15. Roberts EC, Legrand C, Steinke M, Wootton
EC (2011) Mechanisms underlying chemical
interactions between predatory planktonic
protists and their prey. Journal of plankton
research 33: 833-841.
16. Matz C (2011) Competition, Communication,
Cooperation: Molecular Crosstalk in Multi-
species Biofilms. Biofilm Highlights. Springer,
pp. 29-40.
17. Wey JK, Jürgens K, Weitere M (2012) Seasonal
and successional influences on bacterial
community composition exceed that of
protozoan grazing in river biofilms. Applied and
environmental microbiology 78: 2013-2024.
18. de la Cruz‐Perera CI, Ren D, Blanchet M,
Dendooven L, Marsch R, Sørensen SJ,
Burmølle M (2013) The ability of soil bacteria
to receive the conjugative IncP1 plasmid,
pKJK10, is different in a mixed community
compared to single strains. FEMS microbiology
letters 338: 95-100.
19. Rønn R, Ekelund F, Christensen S (1995)
Optimizing soil extract and broth media for
MPN enumeration of naked amoebae and
heterotrophic flagellates in soil. Pedobiologia 39:
10-19.
20. Ekelund F (1996) Growth kinetics of five
common heterotrophic soil flagellates.
European journal of soil biology 32: 15-24.
21. Ekelund F, Westergaard K, Søe D (2000) The
toxicity of the fungicide propiconazole to soil
flagellates. Biology and fertility of soils 31: 70-
77.
22. Ekelund F, Daugbjerg N, Fredslund L (2004)
Phylogeny of Heteromita, Cercomonas and
Thaumatomonas based on SSU rDNA
sequences, including the description of
Neocercomonas jutlandica sp. nov., gen. nov.
European journal of protistology 40: 119-135.
23. Pedersen AL, Ekelund F, Johansen A, Winding
A (2010) Interaction of bacteria-feeding soil
flagellates and Pseudomonas spp. Biology and
Fertility of Soils 46: 151-158.
24. Pedersen AL, Winding A, Altenburger A,
Ekelund F (2011) Protozoan growth rates on
secondary‐metabolite‐producing Pseudomonas
spp. correlate with high‐level protozoan
taxonomy. FEMS Microbiology Letters 316:
16-22.
25. Karpov SA, Bass D, Mylnikov AP, Cavalier-
Smith T (2006) Molecular Phylogeny of
Cercomonadidae and Kinetid Patterns of
Cercomonas and Eocercomonas gen. nov.
(Cercomonadida, Cercozoa). Protist 157: 125-
158.
26. Page FC (1988) A New Key to Freshwater and
Soil Gymnamoebae: With Instructions for
Culture pp. 91-97. Freshwater Biological
Association Cumbria
27. Pelegri S, Christaki U, Dolan J, Rassoulzadegan
F (1999) Particulate and dissolved organic
carbon production by the heterotrophic
nanoflagellate Pteridomonas danica Patterson
and Fenchel. Microbial ecology 37: 276-284.
28. Mohapatra B, Fukami K (2004) Comparison of
the numerical grazing response of two marine
heterotrophic nanoflagellates fed with different
bacteria. Journal of Sea Research 52: 99-107.
29. Koch TA, Ekelund F (2005) Strains of the
Heterotrophic Flagellate Bodo designis from
Different Environments Vary Considerably with
Respect to Salinity Preference and SSU rRNA
Gene Composition. Protist 156: 97-112.
30. Ren D, Madsen JS, de la Cruz-Perera CI,
Bergmark L, Sørensen SJ, Burmølle M (2013)
High-Throughput Screening of Multispecies
Biofilm Formation and Quantitative PCR-Based
Assessment of Individual Species Proportions,
Useful for Exploring Interspecific Bacterial
Interactions. Microbial ecology. doi:
10.1007/s00248-013-0315-z
31. Brown MR, Barker J (1999) Unexplored
reservoirs of pathogenic bacteria: protozoa and
biofilms. Trends in microbiology 7: 46-50.

32. Wey JK, Scherwass A, Norf H, Arndt H,
Weitere M (2008) Effects of protozoan grazing
within river biofilms under semi-natural
conditions. Aquatic Microbial Ecology 52: 283.
33. Dopheide A, Lear G, Stott R, Lewis G (2011)
Preferential feeding by the ciliates Chilodonella
and Tetrahymena spp. and effects of these
protozoa on bacterial biofilm structure and
composition. Applied and environmental
microbiology 77: 4564-4572.
34. Friman V-P, Diggle SP, Buckling A (2013)
Protist predation can favour cooperation within
bacterial species. Biology letters 9: 20130548.
35. Posch T, Jezbera J, Vrba J, Šimek K, Pernthaler
J, Andreatta S, Sonntag B (2001) Size selective
feeding in Cyclidium glaucoma (Ciliophora,
Scuticociliatida) and its effects on bacterial
community structure: a study from a continuous
cultivation system. Microbial ecology 42: 217-
227.
36. Monger BC, Landry MR, Brown SL (1999)
Feeding selection of heterotrophic marine
nanoflagellates based on the surface
hydrophobicity of their picoplankton prey.
Limnology and oceanography 44: 1917-1927.
37. Hahn M, Moore E, Höfle M (2000) Role of
microcolony formation in the protistan grazing
defense of the aquatic bacterium Pseudomonas
sp. MWH1. Microbial ecology 39: 175-185.
38. Rønn R, McCaig AE, Griffiths BS, Prosser JI
(2002) Impact of protozoan grazing on bacterial
community structure in soil microcosms.
Applied and Environmental Microbiology 68:
6094-6105.
39. Shida O, Takagi H, Kadowaki K, Nakamura LK,
Komagata K (1997) Emended Description of
Paenibacillus amylolyticus and Description of
Paenibacillus illinoisensis sp. nov. and
Paenibacillus chibensis sp. nov. International
journal of systematic bacteriology 47: 299-306.
40. Matz C, McDougald D, Moreno AM, Yung PY,
Yildiz FH, Kjelleberg S (2005) Biofilm
formation and phenotypic variation enhance
predation-driven persistence of Vibrio cholerae.
Proceedings of the National Academy of
Sciences of the United States of America 102:
16819-16824.
41. Rychert K, Neu TR (2010) Protozoan impact on
bacterial biofilm formation. Biological Letters
47: 3-10.
42. Matz C, Kjelleberg S (2005) Off the hook–how
bacteria survive protozoan grazing. Trends in
microbiology 13: 302-307.
43. Jackson S, Jones E (1991) Interactions within
biofilms: the disruption of biofilm structure by
protozoa. Kieler Meeresforsch 8: 264-268.
44. Huws S, McBain A, Gilbert P (2005) Protozoan
grazing and its impact upon population
dynamics in biofilm communities. Journal of
applied microbiology 98: 238-244.

Manuscript 5
The ability of soil bacteria to receive the conjugative IncP1 plasmid, pKJK10, is
different in a mixed community compared to single strains

R E S EA RCH L E T T E R
The ability of soil bacteria to receive the conjugative IncP1plasmid, pKJK10, is different in a mixed community compared
to single strains
Claudia I. de la Cruz-Perera1,2, Dawei Ren1, Marine Blanchet1,3, Luc Dendooven2, Rodolfo Marsch2,Søren J. Sørensen1 & Mette Burmølle1
1Department of Biology, University of Copenhagen, Copenhagen, Denmark; 2Laboratory of Soil Ecology, Department of Biotechnology and
Bioengineering, Cinvestav, Mexico City, Mexico; and 3Laboratoire d’Oc�eanographie Microbienne, Observatoire Oc�eanologique de Banyuls,
Banyuls-sur-mer, France
Correspondence: Mette Burmølle, Section
of Microbiology, University of Copenhagen,
Universitetsparken 15, bygn 1,
2100 Copenhagen Ø, Denmark.
Tel.: +45 40220069;
e-mail: [email protected]
Received 18 October 2012; accepted 25
October 2012. Final version published online
22 November 2012.
DOI: 10.1111/1574-6968.12036
Editor: Paolina Garbeva
Keywords
horizontal gene transfer; bacterial
community; conjugation; host range;
soil bacteria.
Abstract
Horizontal gene transfer by conjugation is common among bacterial popula-
tions in soil. It is well known that the host range of plasmids depends on
several factors, including the identity of the plasmid host cell. In the present
study, however, we demonstrate that the composition of the recipient commu-
nity is also determining for the dissemination of a conjugative plasmid. We
isolated 15 different bacterial strains from soil and assessed the conjugation
frequencies of the IncP1 plasmid, pKJK10, by flow cytometry, from two differ-
ent donors, Escherichia coli and Pseudomonas putida, to either 15 different bac-
terial strains or to the mixed community composed of all the 15 strains. We
detected transfer of pKJK10 from P. putida to Stenotrophomonas rhizophila in a
diparental mating, but no transfer was observed to the mixed community. In
contrast, for E. coli, transfer was observed only to the mixed community, where
Ochrobactrum rhizosphaerae was identified as the dominating plasmid recipient.
Our results indicate that the presence of a bacterial community impacts the
plasmid permissiveness by affecting the ability of strains to receive the conjuga-
tive plasmid.
Introduction
Horizontal gene transfer (HTG) is a driving force in
bacterial evolution as it allows bacteria to rapidly acquire
complex new traits. Plasmids are one of the key vectors of
HTG, enabling genetic exchange between bacterial cells
across species and domain barriers (Poole, 2009; Boto,
2010), and they very often encode genes that confer adap-
tive traits to their host, such as antibiotic resistance, bio-
degradation pathways and virulence (de la Cruz & Davies,
2000). Transfer of these traits by conjugation requires the
donor and the recipient cells to be in direct contact.
Different abiotic and biotic factors affect the range of
conjugal exchange of genetic material between environ-
mental bacteria, such as nutrient availability, spatial archi-
tecture of the bacterial community, plasmid donor and
recipient relatedness and plasmid host type (van Elsas &
Bailey, 2002; De Gelder et al., 2005; Sørensen et al., 2005;
Seoane et al., 2011). The fraction of the cells in a com-
munity capable of receiving and maintaining conjugative
plasmids is highly dependent on several of these factors
and has been described as the plasmid permissiveness
(Musovic, 2010).
It has been shown that conjugative plasmids express
factors that favor the establishment of planktonic bacteria
in biofilm communities, thereby increasing the chances
for horizontal gene transmission (Ghigo, 2001; Reisner
et al., 2006; Madsen et al., 2012). Complex interspecies
communities facilitate synergistic interactions between
populations, affecting the function, stability and flexibility
of the community (James et al., 1995; Burmølle et al.,
2006).
In the present work, HTG by conjugation between sin-
gle populations and microbial communities isolated from
soil were investigated. The plasmid transfer frequencies
and the identities of the recipients of the plasmid, when
FEMS Microbiol Lett 338 (2013) 95–100 ª 2012 Federation of European Microbiological SocietiesPublished by Blackwell Publishing Ltd. All rights reserved
MIC
ROBI
OLO
GY
LET
TER
S
hosted by different donors, were compared. The bacterial
population was analyzed based on fluorescence properties
and sorted by flow cytometry (FCM) to detect and quan-
tify the plasmid transfer to the individual isolates and the
mixed community (Muller & Nebe-von-Caron, 2010).
Sequencing of the 16S rRNA gene from sorted transcon-
jugant cells was used to evaluate the host range of the
plasmid when a mixed microbial community was used as
recipient.
Materials and methods
Soil and leaf sampling
Soil samples were collected from an agricultural field in
T�astrup, Denmark, in the late summer of 2009. Soil was
sampled from the 5- to 10-cm layer. The soil water con-
tent upon sampling was 14.2%, and the water holding
capacity (WHC) was 60%. The soil was classified as sandy
loam with pH 7.2. Leaves of baby maize seedlings were
used for bacterial isolation. The seedlings were grown for
2 weeks in T�astrup soil before harvesting.
Bacterial strains, plasmids, and growth media
Escherichia coli CSH26::lacIq and Pseudomonas putida
KT2440::lacIq1, carrying pKJK10, a conjugative, green
fluorescent protein (GFP) tagged IncP1 plasmid, origi-
nally isolated from soil (Sengeløv et al., 2001; Bahl et al.,
2007) were used as donor strains. These strains were cul-
tured in Luria Bertani (LB) broth supplemented with
kanamycin monosulfate (50 mg mL�1); 1.5% (w/v) agar
was added when solid medium was needed. The recipient
strains (see below) were cultured in Tryptic Soy Broth
medium (TSB; 17 g peptone from casein, 3 g peptone
from soymeal, 2.5 g D(+)-Glucose, 5 g NaCl, 2.5 g
K2HPO4 in 1 L distilled water, pH 7.3).
Isolation and identification of recipient strains
from leaves incubated in soil
A 15 mg sample of a baby maize leaf was placed in 5 g
T�astrup soil adjusted to 40% WHC and incubated in tripli-
cate at room temperature for 17 days. After 7, 12, and
17 days, the leaves were picked up from the soil, washed
with PBS (8 g NaCl, 0.2 g KCl, 1.44 g Na2HPO4, and
KH2PO4, adjusted to 1 L distilled water and pH 7.4),
placed in a microfuge tube, added 1 mL PBS and vortexed
for 1 min. DNA was extracted from the cell suspension as
described below. Dilutions to 10�6 were made and 100 lLwere plated in triplicate onto Tryptic Soy Agar (TSA; Dif-
co) 10% supplemented with cycloheximide (50 mg mL�1)
and incubated at 25 °C for 2–5 days. Sixteen colonies from
each triplicate looking phenotypically different were
isolated and purified for DNA extraction. A denaturation
gradient gel electrophoresis (DGGE) analysis was
performed with 16S rRNA gene PCR fragments.
From the total of 48 strains from day 7, 15 morpholog-
ically different strains were selected for the use as recipi-
ents. The strains were grown overnight (ON) in 5 mL
TSB, the DNA was extracted using ‘Genomic Mini for
Universal Genomic DNA Isolation Kit’ (A&A Biotechnol-
ogy) and the 16S rRNA gene sequences were amplified
with primers 27F and 1492R (Lane, 1991) for identifica-
tion. The PCR mixture contained 0.5 lL DNA, 1XPhusion
GC buffer, 0.2 mM dNTP mixture, 1 U Phusion Hot
Start DNA Polymerase (FinnzymesOy, Espoo, Finland)
and 0.5 lM of each primer (TAG Copenhagen A/S,
Denmark). The final volume was adjusted with DNA-free
water to 50 lL. Amplification was as follow: initial dena-
turation at 98 °C for 30 s, followed by 35 cycles at 98 °Cfor 10 s, at 55 °C for 30 s and at 72 °C for 45 s. A final
primer extension reaction was performed at 72 °C for
6 min. The resulting sequence (1480 bp) was compared
with reference sequences by BLAST search (Altschul et al.,
1997) and aligned with them using CLUSTALX 1.7 program
(Thompson et al., 1997). Maximum-likelihood analyses
were performed using PhyML (Guindon & Gascuel,
2003). MODELTEST 3.06 (Posada, 2008) was used to select
appropriate models of sequence evolution by the Akaike
Information Criterion. The confidence at each node was
assessed by 500 bootstrap replicates. Similarities among
sequences were calculated using the MatGAT v.2.01 soft-
ware (Campanella et al., 2003). Taxonomic assignment
was carried out based on the Rosell�o-Mora and Aman
criteria (Rossell�o-Mora & Amann, 2001).
DGGE
The cells from the leaves-PBS solution and from the 48- to
15-strain pools were lysed by bead beating followed by
DNA extraction as specified above. The DNA was used for
a 16S rRNA gene PCR as described above and 1 lL of the
product was used as a template for a new PCR using inter-
nal primers with a GC clamp 341F and 518R (Muyzer
et al., 1993) and a polymerization step at 72 °C for 20 s.
This PCR product was loaded onto the DGGE gel, contain-
ing a denaturation gradient of 30–70% acrylamide, and
an electrophoresis was run in a Dcode system (Biorad) at
60 °C and 70 V for 17 h. The gel was stained with SYBR-
Gold (Invitrogene) in the dark for 45 min.
Filter mating assays
Prior to filter matings, the donor strains were grown in
5 mL LB broth at 250 r.p.m. at 30 °C (P. putida) and
ª 2012 Federation of European Microbiological Societies FEMS Microbiol Lett 338 (2013) 95–100Published by Blackwell Publishing Ltd. All rights reserved
96 C.I. de la Cruz-Perera et al.

37 °C (E. coli) for 18 h. These ON cell cultures were then
diluted 1 : 10 in fresh LB medium and grown under sim-
ilar conditions for three more hours to reach exponential
growth phase (OD600 � 0.6). The cells were then recol-
lected, washed twice, and resuspended in sterile PBS. The
recipient strains were cultured similarly in TSB at 25 °C.The lack of background fluorescence of the donor and
recipient strains was verified in the flow cytometer (see
specifications below) prior to their use in the filter mating
assay.
For the single-strain mating experiments, 10 lL of
donor and recipient, respectively, were spotted onto
0.2 lm nitrocellulose filters in triplicate, mixed, placed on
TSA and R2A (yeast extract 0.5 g, proteose peptone 0.5 g,
casamino acids 0.5 g, glucose 0.5 g, soluble starch 0.5 g,
sodium pyruvate 0.3 g, K2HPO4 0.3 g, MgSO4�7H2O
0.05 g, agar 15 g in 1 L distilled water) plates and incu-
bated at 25 °C for 20 h. The cells were then harvested from
the filter followed by resuspension in 1 mL PBS, and FCM
analysis as specified below. For the microbial community,
we spotted 5 lL of each isolate (OD600 � 0.3–0.7) and
75 lL of donor strain (either P. putida or E. coli, prepared
as described above) onto the filter, incubated and analyzed
by FCM at the same conditions as for the single-strain
matings. Controls with only donors or recipients were
included.
Quantification and sorting by FCM
Flow cytometric enumeration of cells was carried out
with a FACScalibur flow cytometer (Becton Dickinson,
San Jose, CA) equipped with a 15 mW argon laser
(488 nm). The following settings and voltages were used
during analysis: forward scatter = E01, side scatter
(SSC) = 350, and the fluorescent detectors FL1 (530/
30 nm), FL2 (585/42 nm), FL3 (650/30 nm) were set at
510 V. A threshold was set on the SSC, and no compen-
sation was used. All parameters were on logarithmic
mode. Samples were run at the ‘low’ flow rate setting for
1 min.
All the samples were diluted in PBS before flow
enumeration to assure optimal bacterial counts to
2000 events s�1. In part of the sample (100 lL), gfp-
expression was induced by incubation in LB with 1 mM
of isopropyl-b-D-1-thiogalactopyranoside (IPTG, SIGMA)
for 3 h at 30 °C (P. putida) and 37 °C (E. coli) to deter-
mine the number of donor cells (Musovic et al., 2006).
To isolate and identify recipients from the E. coli-com-
munity mating, one subsample of each replicate of the
cell extract was diluted to 1000 events s�1 to flow-sorted
(MoFlo; DAKO) at a flow rate of 400–1000 events s�1,
with an optimal setting of the sheath pressure of ca.
60 psi and drop drive frequency to ca. 95 kHz, using a
70-lm CytoNozzle tip on an enrichment sort option of
single-mode per single drop envelope. Dilutions up to
10�3 were made from approximately 70 000 cells of each
replicate, and 100 lL of each dilution were plated on
TSA plates supplemented with kanamycin, streptomycin
(100 mg mL�1) and tetracycline (20 mg mL�1) and incu-
bated at 25 °C for 2–5 days. Four green colonies of each
replicate were selected for DNA extraction and identified
by sequencing after the amplification of the 16S rRNA
gene as described above.
Data analysis was carried out with the CELLQUEST soft-
ware package. Two polygonal gates were defined in bivar-
iate FL1 vs. FL2 to count for green cells and in bivariate
SSC vs. FL2 density plot as a double check.
Statistical analysis
All microcosmic experiments were carried out in tripli-
cate. Standard deviations were calculated with Excel
(Microsoft®). A Student’s t-test was applied and probabil-
ities less than 0.05 were considered significant.
Results and discussion
Isolation of the bacterial community
Bacterial strains established on the leaves embedded in
soil were isolated to obtain a highly diverse bacterial
community with the capability of attachment. We used
maize leaves as the plants grow fast with no specific
requirements. The diversity of the established community
over time was followed by DGGE analysis. DGGE is a
simple and fast method to screen and compare the diver-
sity of a bacterial community, well suited for this study.
The number of bands in a DGGE lane reflects the degree
of bacterial diversity and lanes from the same gels can be
compared to explore changes in diversity (Muyzer et al.,
1993). Based on the number of bands associated to the
sampling days 7, 12, and 17 (Fig. 1, lane 1, 4, and 7,
respectively), a highly diverse community was observed
from day 7 and onwards. This was confirmed by compar-
ing colony morphology of the 48 isolated strains from the
different sampling points (data not shown). Due to this,
and the fact that the leaves were at this time point highly
decomposed (data not shown), the day 7-samples were
chosen for strain isolation.
To select a manageable, yet still diverse, subcommunity
from all of the isolated strains of the day 7 sampling, the
colony morphology of all the 48 isolates (from the three
replicates) was visually compared. Fifteen isolates appear-
ing morphologically different were chosen, and their
DGGE profile was compared with that of the 48 isolates
(Fig. 1, lane 2, and 3). Based on the number of bands, a
FEMS Microbiol Lett 338 (2013) 95–100 ª 2012 Federation of European Microbiological SocietiesPublished by Blackwell Publishing Ltd. All rights reserved
Gene transfer in mixed and single species communities 97

low number of strains were lost when the subcommunity
was selected, but most of the initial diversity was repre-
sented in the selected community (lane 3). From the 16S
rRNA gene sequencing analysis (Table 1), the isolates
were identified as typical soil bacteria, mostly gram nega-
tives, with the Pseudomonas and Chryseobacterium genera
as the most abundant. Based on this, the strains of the
selected subcommunity were considered as well-suited
potential recipients of the pKJK10 plasmid.
Transfer of pKJK10 to the individual soil
isolates and the mixed community
The donor strains used in this study encode the lacIq1
repressor gene from the chromosome, repressing GFP
expression from pKJK10 when present in these donor
strains, as the lac promoter regulates GFP expression in
this plasmid. Due to the lack of the lacIq1 repressor in the
soil isolates, GFP will be expressed if the plasmid is trans-
ferred into these cells. This system thus allows enumera-
tion of transconjugants and donors by direct sample
analysis and after IPTG induction, respectively (Sørensen
et al., 2003). Detection by FCM has several advantages in
such approaches because enumeration of transconjugant
cells is based solely on fluorescence markers. There is
therefore no need for only including strains with specific
antibiotic resistance profiles in the recipient community,
and the strains do not need to be capable of expressing
the resistance traits encoded by the plasmid to be charac-
terized as transconjugants.
The transfer frequency of the conjugative plasmid from
the two different donors to the soil isolates was calculated
as a transconjugant/donor ratio. No green cells were
observed in the negative controls with only the recipient
strains present (data not shown), indicating that none of
the soil isolates produced auto-fluorescence and that
green cells represented plasmid transfer events.
When E. coli was used as donor, no transfer of pKJK10
was detected to any of the individual 15 soil isolates, but
P. putida was observed to transfer pKJK10 to Stenotropho-
monas rhizophila. The plasmid transfer frequency from
P. putida to S. rhizophila was higher when the filters were
placed on TSA medium (1.07 � 3.05 9 10�1) compared
with R2A medium (0.33 � 2.32 9 10�2, Table 2), sup-
porting the fact that the metabolic state of the cells may
in some cases influence conjugation frequencies (van
Elsas & Bailey, 2002). These results reflect the fact that
the host range of plasmids depends on the identity of the
donor strain (De Gelder et al., 2005).
Day 7 12 17
Lane 1 2 3 4 5 6 7 8 9
Fig. 1. Denaturing gradient gel electrophoresis (DGGE) analysis of
the diversity of the bacterial communities isolated from maize leaves
after 7, 12, and 17 days of incubation in soil. The DGGE gel shows
the PCR amplified products of the 16S rRNA genes of the total
bacterial consortia present on the leaves on the sampling days 7, 12,
and 17 (lane 1, 4, and 7, respectively). The 16S rRNA gene profiles of
a total of 48 cultured strains from each day are presented in lane 2
(day 7), lane 5 (day 12), and lane 8 (day 17). Of these 48, 15
morphologically different strains were selected to constitute
representative communities (lanes 3, 6, and 9) of sampling days 7,
12, and 17, respectively. The DGGE analysis indicated that most
bacterial diversity was preserved when reducing the community from
48 to 15 strains (by comparing lane 2–3, 5–6, and 8–9). The 15-strain
community from sampling day 7 was used for gene transfer analysis.
Table 1. Identification of the isolated strains by 16S rRNA gene
analysis
Strain name Similarity (%)*
Flavobacterium psychrolimnae 97.8
Pseudomonas lutea 98.1
Pseudomonas brassicacearum 99.6
Pseudomonas fluorescens 99.7
Ochrobactrum rhizosphaerae 100
Chryseobacterium soldanellicol 98.2
Chryseobacterium letacus 98.5
Sphingobacteriaceae 93.7
Xanthomonas retroflexus 99.6
Micrococcaceae 94.2
Chryseobacterium ginsengisoli 99.2
Stenotrophomonas rhizophila 99.6
Microbacterium oxydans 100
Ensifer adherens 98.9
Janthinobacterium lividum 99.7
*Similarity from sequenced 16S rRNA genes calculated with the
MATGAT v.2.01 software (see text for more details).
ª 2012 Federation of European Microbiological Societies FEMS Microbiol Lett 338 (2013) 95–100Published by Blackwell Publishing Ltd. All rights reserved
98 C.I. de la Cruz-Perera et al.

In contrast to the results observed when transferring
pKJK10 to individual isolates, no plasmid transfer events
were observed from P. putida to the mixed community
consisting of the same 15 strains applied individually
above. Transconjugants were, however, obtained when
applying E. coli as donor of pKJK10. The green fluores-
cent transconjugant cells were sorted by FACS and
cultured on TSA agar plates. By sequence analysis of the
16S rRNA gene from four colonies from each replicate,
the selected transconjugants were shown all to be identi-
cal and identified as Ochrobactrum rhizosphaerae. This
does not exclude the possibility that other isolates may
also have received the plasmid, but it does show that
O. rhizosphaerae in fact did so and that it was the most
dominant strain among the plasmid recipients. Interest-
ingly, O. rhizosphaerae was not able to receive the plas-
mid in the individual mating experiment, indicating that
the plasmid permissibility does not only depend on the
abilities of the plasmid, host and recipient strains, but
also on the surrounding microbial community, which
may reduce or enhance plasmid transfer. Both of these
scenarios were observed in this study; transfer of pKJK10
from P. putida to S. rhizophila was observed in diparental
mating experiments, but not in a mixed community, pos-
sibly caused by reduced survival/competition ability of
the strains or by the fact that the donor and this specific
recipient populations had less opportunity for interaction
in the mixed community. In contrast, the presence of a
mixed community induced pKJK10 transfer from E. coli
to O. rhizosphaerae, which may be due to altered physical
cell–cell interaction or the presence of one or several
intermediate plasmid host(s). These ‘plasmid step-stones’
may facilitate plasmid transfer from E. coli to O. rhizosp-
haerae, but are unable to establish and stabilize the plas-
mid in their own population. Because it was not possible
to isolate the strains individually after growth in the com-
munity, the fraction of O. rhizosphaerae herein could not
be determined; It is possible that O. rhizosphaerae is the
dominating strain in the consortium or the most meta-
bolically active, explaining its enhanced abilities as plas-
mid recipient. Regardless of this strain being dominant or
representing a minor population of the community, it is
still intriguing that no plasmid transfer was observed in
the dual-strains mating from E. coli to O. rhizosphaerae.
The results of this study indicate that the surrounding
bacterial community strongly impacts the plasmid host
range, which needs to be considered when analyzing
potential plasmid dissemination in natural environments
in association to risk assessment. Plasmid mediated traits,
including antibiotic resistance and virulence, may spread
to natural bacterial populations in situ, in spite of
an apparent narrow host range detected in simple,
dual-strain-mating experiments.
Acknowledgements
This research was supported by funding to Søren Sørensen
by The Danish Council for Independent Research (Natural
Sciences), The Danish Council for Independent Research
(Technology and Production) (ref no: 09-090701, Mette
Burmølle) and the Department of Biotechnology and
Bioengineering (Cinvestav, Mexico). Claudia I. de La
Cruz-Perera received grant-aided support from ‘Consejo-
Nacional de Ciencia y Tecnologia’ (CONACyT, Mexico)
scholarship 166878.
References
Altschul SF, Madden TL, Schaffer AA, Zhang J, Zhang Z,
Miller W & Lipman DJ (1997) Gapped BLAST and
PSI-BLAST: a new generation of protein database search
programs. Nucleic Acids Res 25: 3389–3402.Bahl MI, Hansen LH, Goesmann A & Sørensen SJ (2007) The
multiple antibiotic resistance IncP-1 plasmid pKJK5 isolated
from a soil environment is phylogenetically divergent from
members of the previously established alpha, beta and delta
sub-groups. Plasmid 58: 31–43.Boto L (2010) Horizontal gene transfer in evolution: facts and
challenges. Proc Biol Sci 277: 819–827.Burmølle M, Webb JS, Rao D, Hansen LH, Sørensen SJ &
Kjelleberg S (2006) Enhanced biofilm formation and
increased resistance towards antimicrobial agents and
bacterial invasion are caused by synergistic interactions in
multispecies biofilms. Appl Environ Microbiol 72:
3916–3923.Campanella JJ, Bitincka L & Smalley J (2003) MatGAT: an
application that generates similarity/identity matrices using
protein or DNA sequences. BMC Bioinformatics 4: 29.
De Gelder L, Vandecasteele FP, Brown CJ, Forney LJ & Top
EM (2005) Plasmid donor affects host range of promiscuous
IncP-1beta plasmid pB10 in an activated-sludge microbial
community. Appl Environ Microbiol 71: 5309–5317.
Table 2. Transfer frequencies of pKJK10 by different donors to
individual recipients and mixed communities*
Donor Recipient Frequency
E. coli CSH26::lacIq S. rhizophila –†
Mixed community 1.56 � 3.43 9 10�1
P. putida KT2440::lacIq S. rhizophila 1.07 � 3.05 9 10�1
0.33 � 2.32 9 10�2‡
Mixed community –†
*All values are transconjugants/donor ratios � standard deviation of
triplicate experiments.†No transconjugants were obtained on the filter (below detection
limit).‡Number of transconjugants obtained when placing the filters on R2A
plates.
FEMS Microbiol Lett 338 (2013) 95–100 ª 2012 Federation of European Microbiological SocietiesPublished by Blackwell Publishing Ltd. All rights reserved
Gene transfer in mixed and single species communities 99
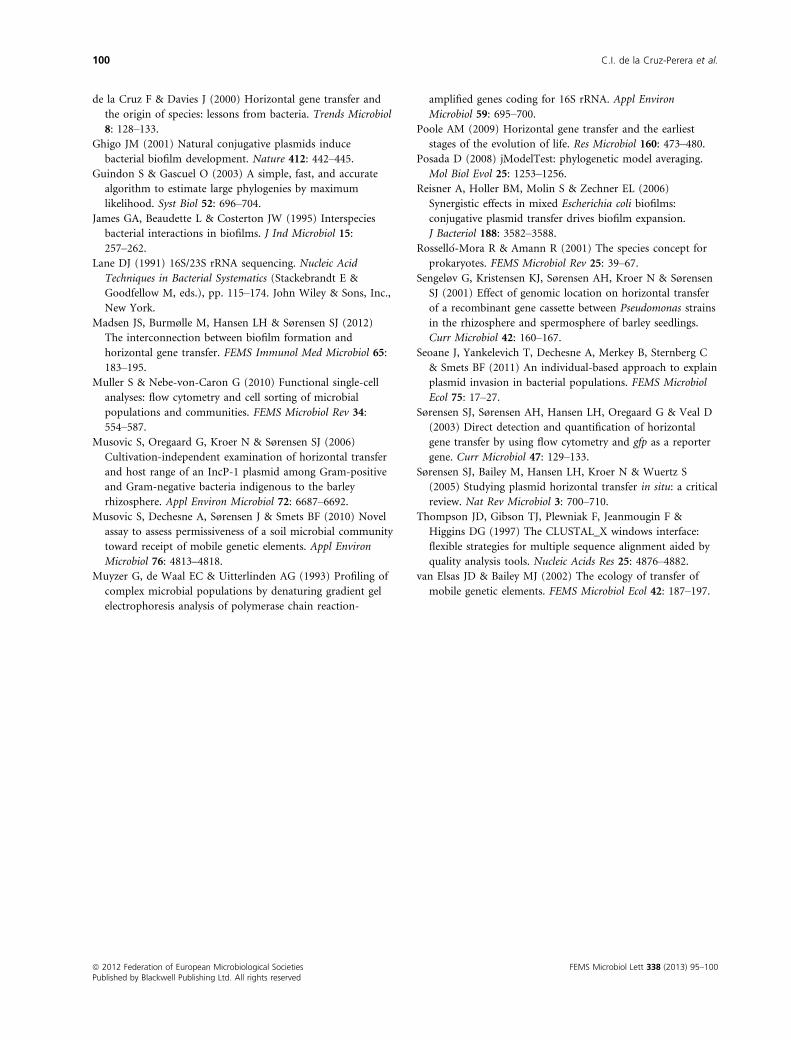
de la Cruz F & Davies J (2000) Horizontal gene transfer and
the origin of species: lessons from bacteria. Trends Microbiol
8: 128–133.Ghigo JM (2001) Natural conjugative plasmids induce
bacterial biofilm development. Nature 412: 442–445.Guindon S & Gascuel O (2003) A simple, fast, and accurate
algorithm to estimate large phylogenies by maximum
likelihood. Syst Biol 52: 696–704.James GA, Beaudette L & Costerton JW (1995) Interspecies
bacterial interactions in biofilms. J Ind Microbiol 15:
257–262.Lane DJ (1991) 16S/23S rRNA sequencing. Nucleic Acid
Techniques in Bacterial Systematics (Stackebrandt E &
Goodfellow M, eds.), pp. 115–174. John Wiley & Sons, Inc.,
New York.
Madsen JS, Burmølle M, Hansen LH & Sørensen SJ (2012)
The interconnection between biofilm formation and
horizontal gene transfer. FEMS Immunol Med Microbiol 65:
183–195.Muller S & Nebe-von-Caron G (2010) Functional single-cell
analyses: flow cytometry and cell sorting of microbial
populations and communities. FEMS Microbiol Rev 34:
554–587.Musovic S, Oregaard G, Kroer N & Sørensen SJ (2006)
Cultivation-independent examination of horizontal transfer
and host range of an IncP-1 plasmid among Gram-positive
and Gram-negative bacteria indigenous to the barley
rhizosphere. Appl Environ Microbiol 72: 6687–6692.Musovic S, Dechesne A, Sørensen J & Smets BF (2010) Novel
assay to assess permissiveness of a soil microbial community
toward receipt of mobile genetic elements. Appl Environ
Microbiol 76: 4813–4818.
Muyzer G, de Waal EC & Uitterlinden AG (1993) Profiling of
complex microbial populations by denaturing gradient gel
electrophoresis analysis of polymerase chain reaction-
amplified genes coding for 16S rRNA. Appl Environ
Microbiol 59: 695–700.Poole AM (2009) Horizontal gene transfer and the earliest
stages of the evolution of life. Res Microbiol 160: 473–480.Posada D (2008) jModelTest: phylogenetic model averaging.
Mol Biol Evol 25: 1253–1256.Reisner A, Holler BM, Molin S & Zechner EL (2006)
Synergistic effects in mixed Escherichia coli biofilms:
conjugative plasmid transfer drives biofilm expansion.
J Bacteriol 188: 3582–3588.Rossell�o-Mora R & Amann R (2001) The species concept for
prokaryotes. FEMS Microbiol Rev 25: 39–67.Sengeløv G, Kristensen KJ, Sørensen AH, Kroer N & Sørensen
SJ (2001) Effect of genomic location on horizontal transfer
of a recombinant gene cassette between Pseudomonas strains
in the rhizosphere and spermosphere of barley seedlings.
Curr Microbiol 42: 160–167.Seoane J, Yankelevich T, Dechesne A, Merkey B, Sternberg C
& Smets BF (2011) An individual-based approach to explain
plasmid invasion in bacterial populations. FEMS Microbiol
Ecol 75: 17–27.Sørensen SJ, Sørensen AH, Hansen LH, Oregaard G & Veal D
(2003) Direct detection and quantification of horizontal
gene transfer by using flow cytometry and gfp as a reporter
gene. Curr Microbiol 47: 129–133.Sørensen SJ, Bailey M, Hansen LH, Kroer N & Wuertz S
(2005) Studying plasmid horizontal transfer in situ: a critical
review. Nat Rev Microbiol 3: 700–710.Thompson JD, Gibson TJ, Plewniak F, Jeanmougin F &
Higgins DG (1997) The CLUSTAL_X windows interface:
flexible strategies for multiple sequence alignment aided by
quality analysis tools. Nucleic Acids Res 25: 4876–4882.van Elsas JD & Bailey MJ (2002) The ecology of transfer of
mobile genetic elements. FEMS Microbiol Ecol 42: 187–197.
ª 2012 Federation of European Microbiological Societies FEMS Microbiol Lett 338 (2013) 95–100Published by Blackwell Publishing Ltd. All rights reserved
100 C.I. de la Cruz-Perera et al.


![Handbook (iSME)[1]](https://static.fdocuments.net/doc/165x107/557200a349795991699fcab3/handbook-isme1.jpg)


