SYMBOLOGY - National Conservation Training...
27
SYMBOLOGY
Transcript of SYMBOLOGY - National Conservation Training...

S Y M B O L O G Y
Symbology
Session Objectives: At the conclusion of this session, you will be able to:
• Develop symbols that aid users in visualizing the “real world”
• Identify and apply the 4 levels of measurement used to describe real world phenomena.
Features of the real world are symbolized on maps as points,
lines, and polygons.
Cartographic Symbology

Visualizing the “Real World”Google Street View
Summit View Elementary School (1992)Waukesha, WisconsinSummit View Elementary School (1992)Waukesha, Wisconsin
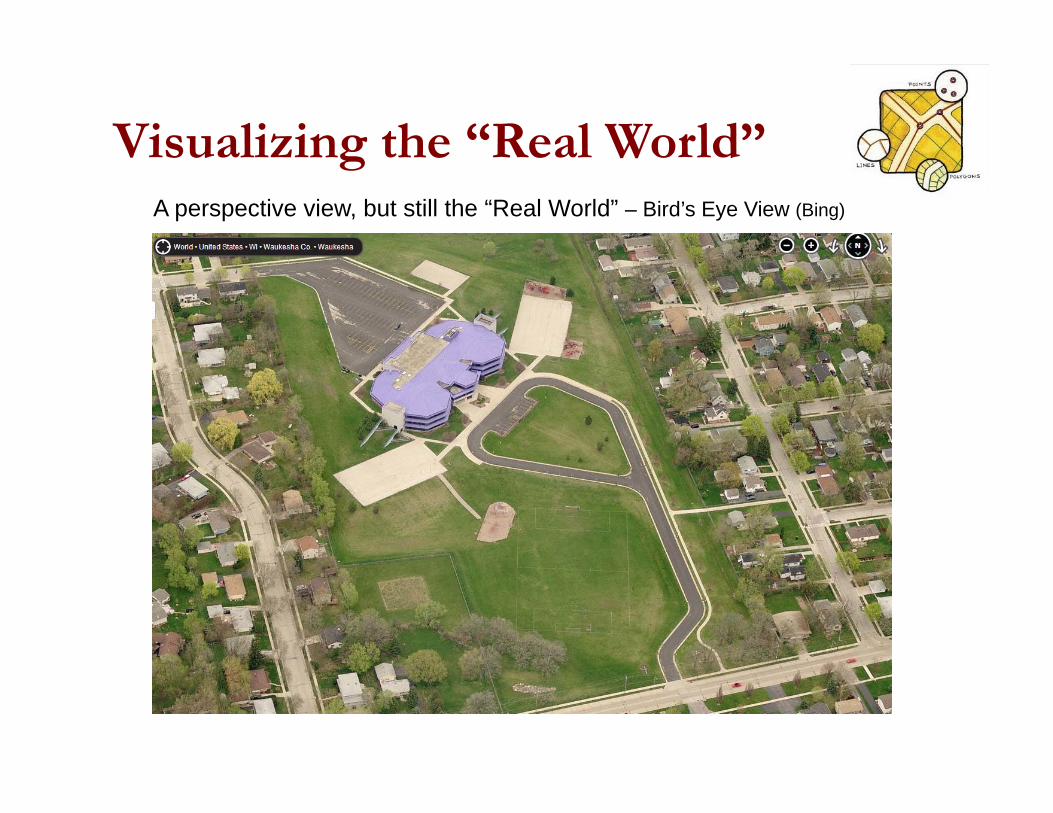
Visualizing the “Real World”A perspective view, but still the “Real World” – Bird’s Eye View (Bing)
Visualizing the “Real World”
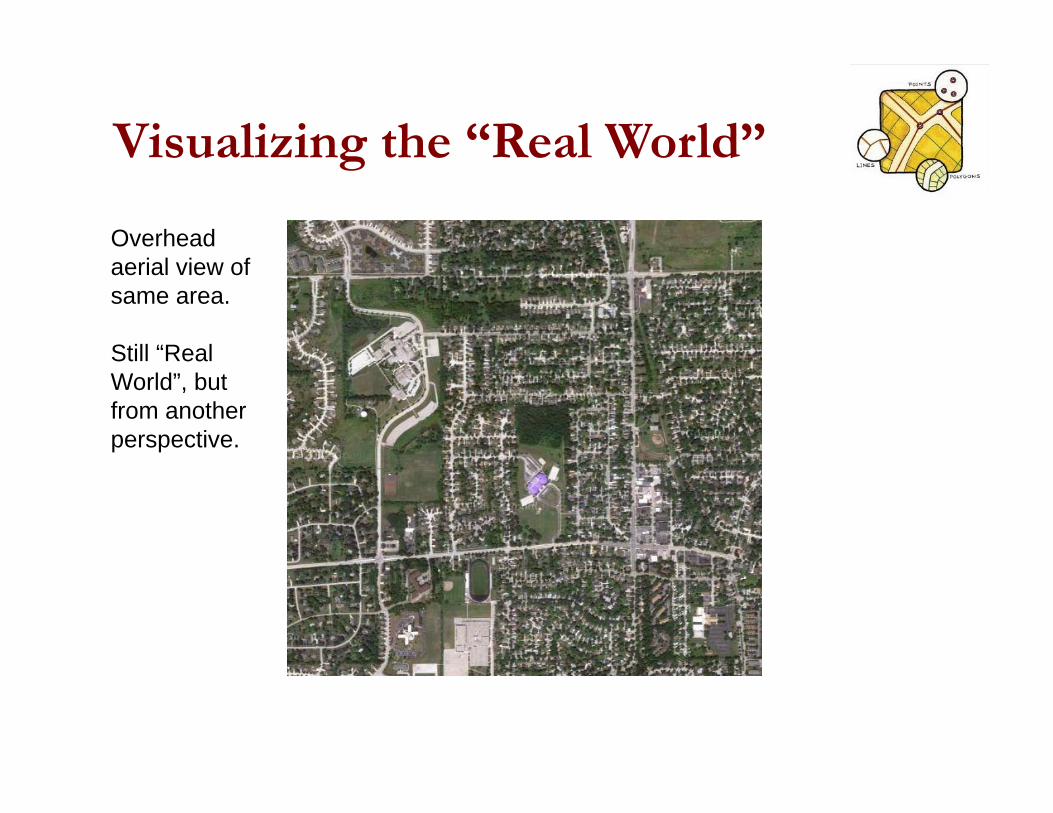
Overhead aerial view of same area.
Still “Real World”, but from another perspective.
Visualizing the “Real World”
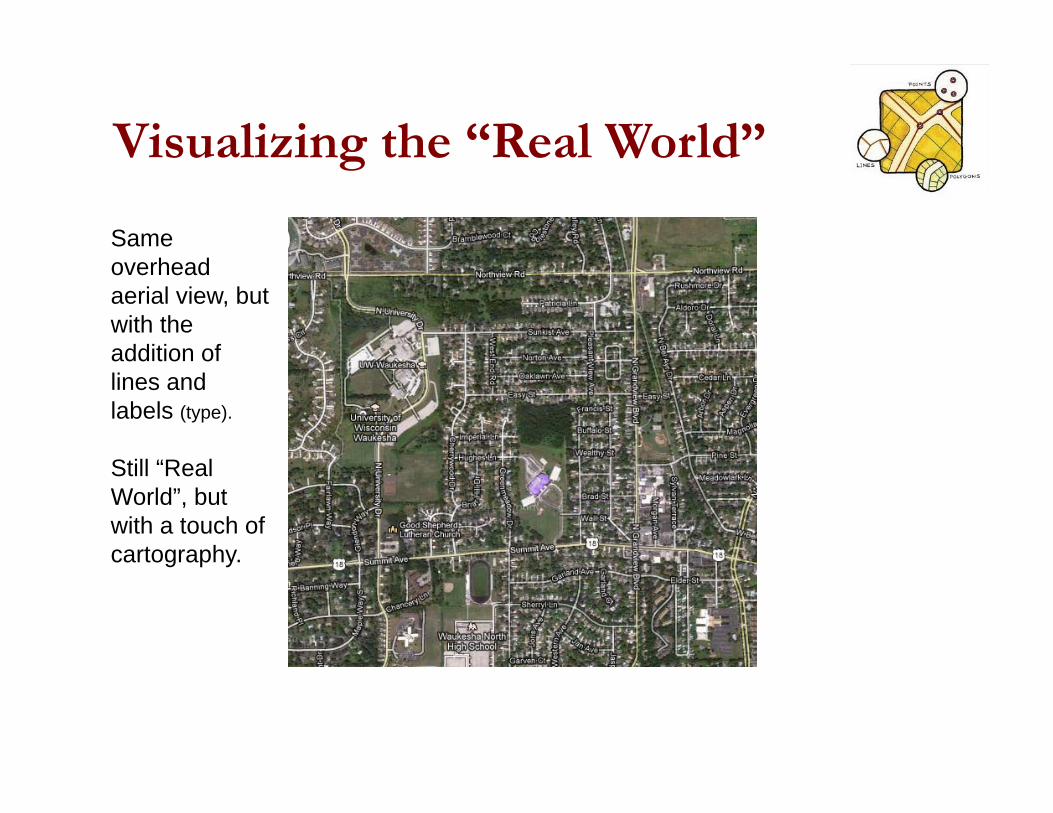
Same overhead aerial view, but with the addition of lines and labels (type).
Still “Real World”, but with a touch of cartography.
Visualizing the “Real World”
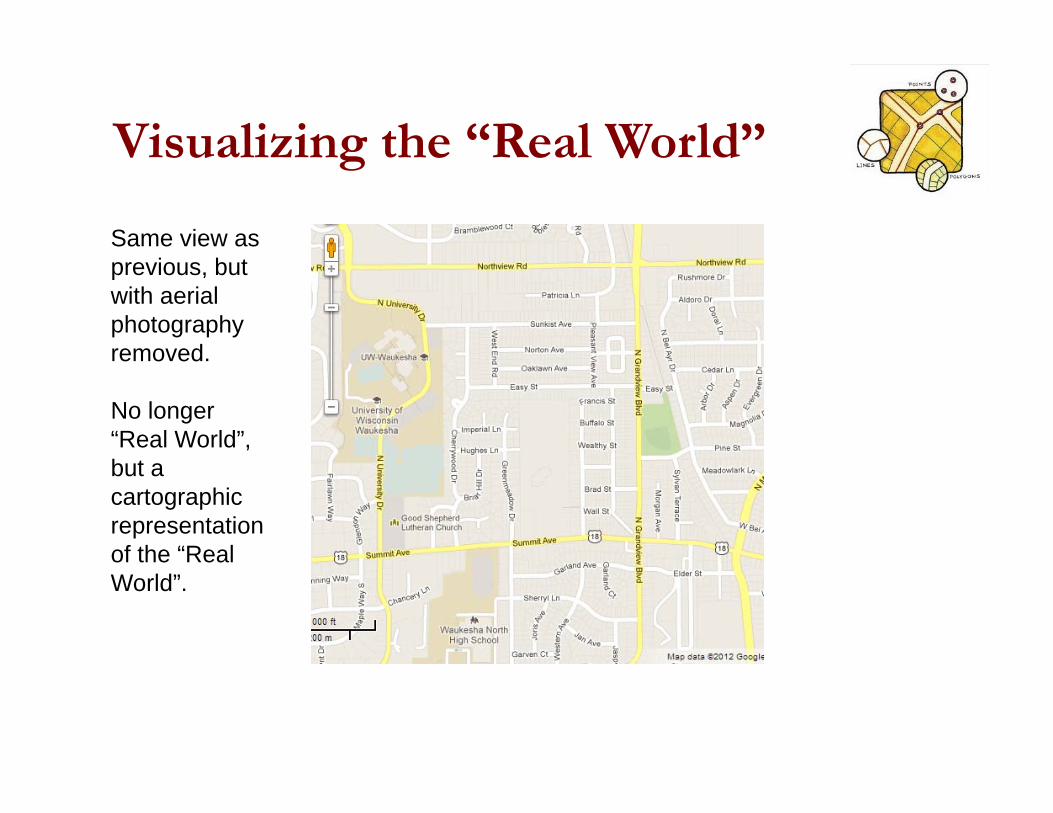
Same view as previous, but with aerial photography removed.
No longer “Real World”, but a cartographic representation of the “Real World”.
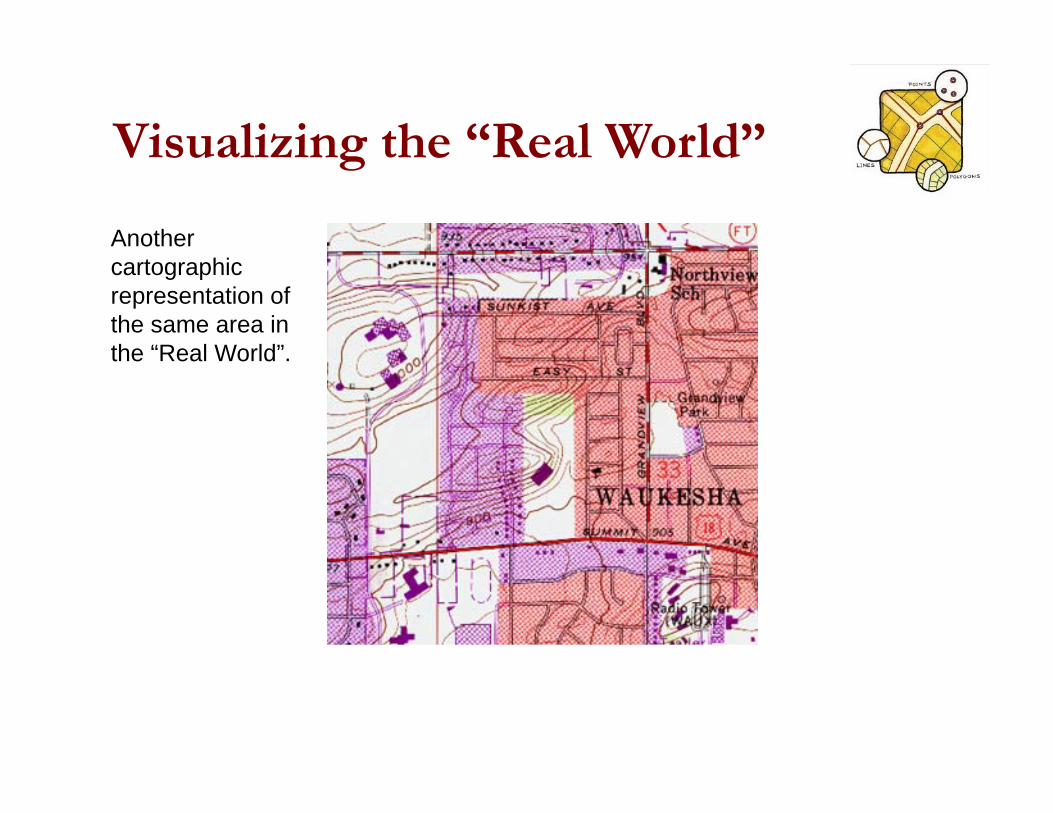
Visualizing the “Real World”
Another cartographic representation of the same area in the “Real World”.
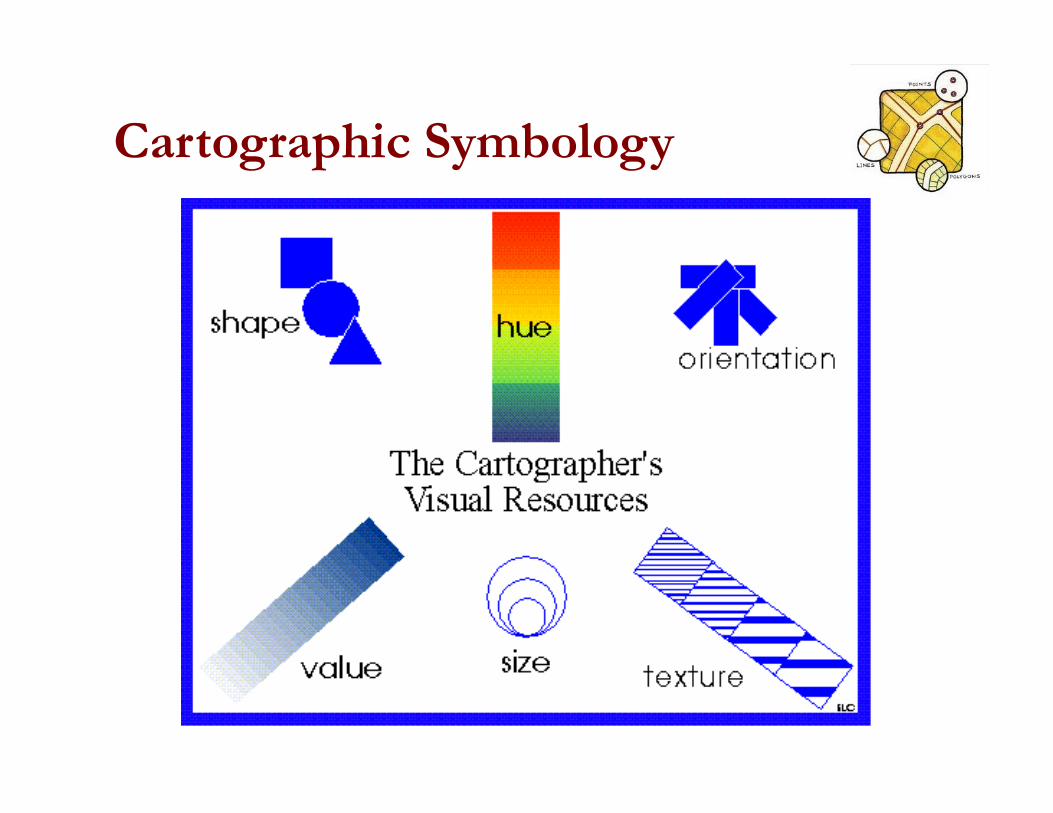
As cartographers reduce the world to points, lines, and polygons, they use a variety of visual
resources that will best convey the message they want to relate to the map user.
Cartographic Symbology
Cartographic Symbology
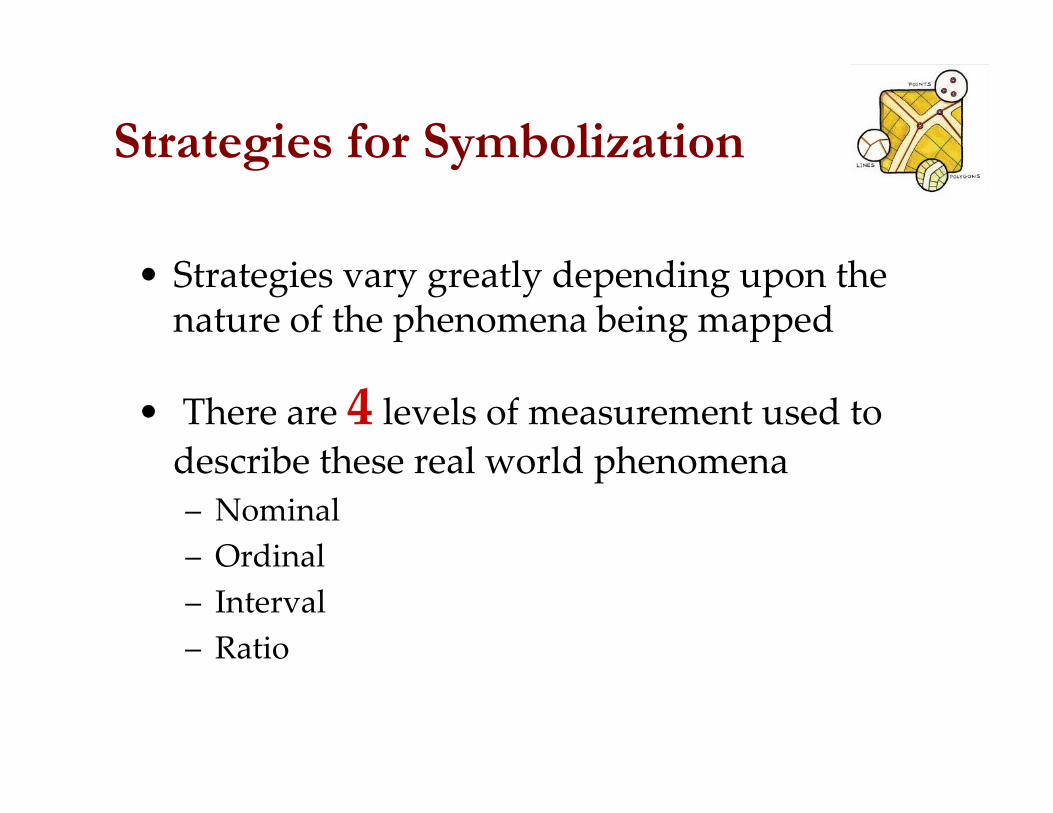
• Strategies vary greatly depending upon the nature of the phenomena being mapped
• There are 4 levels of measurement used to describe these real world phenomena– Nominal– Ordinal– Interval– Ratio
Strategies for Symbolization
Grouped into a category based upon a qualitative consideration; do not imply rank (a road distinguished from a river, a forest from a field, etc.)
Nominal data
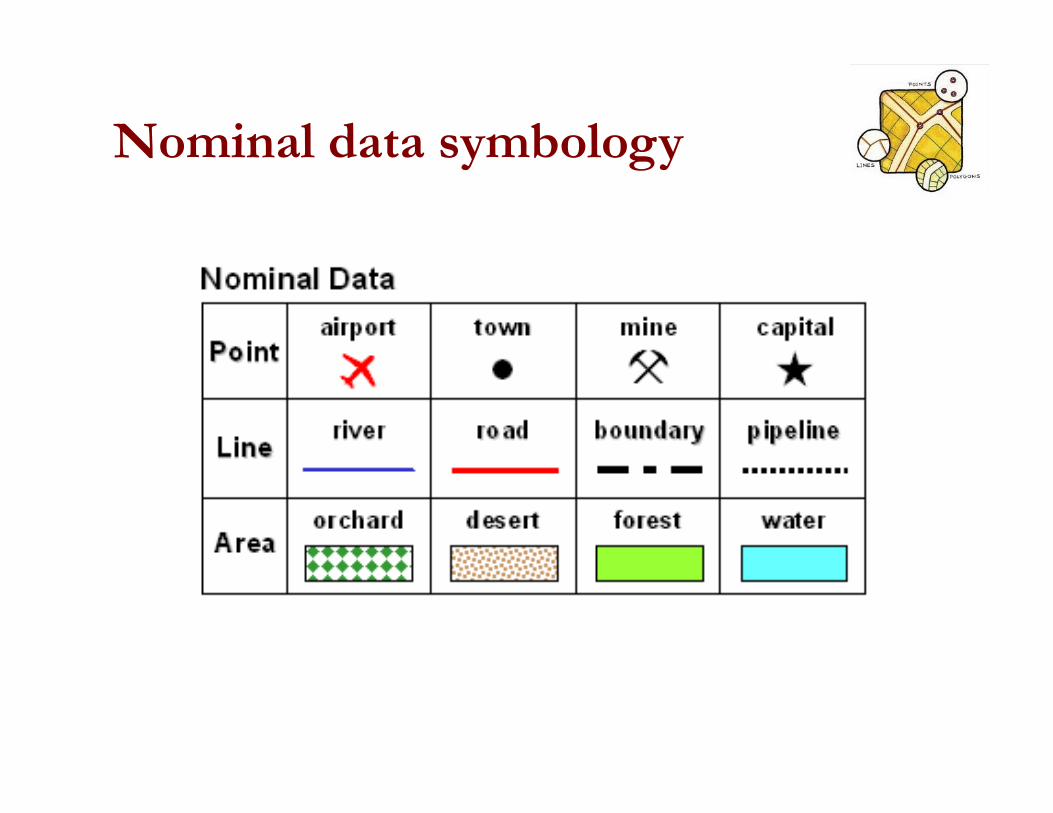
Nominal data symbology
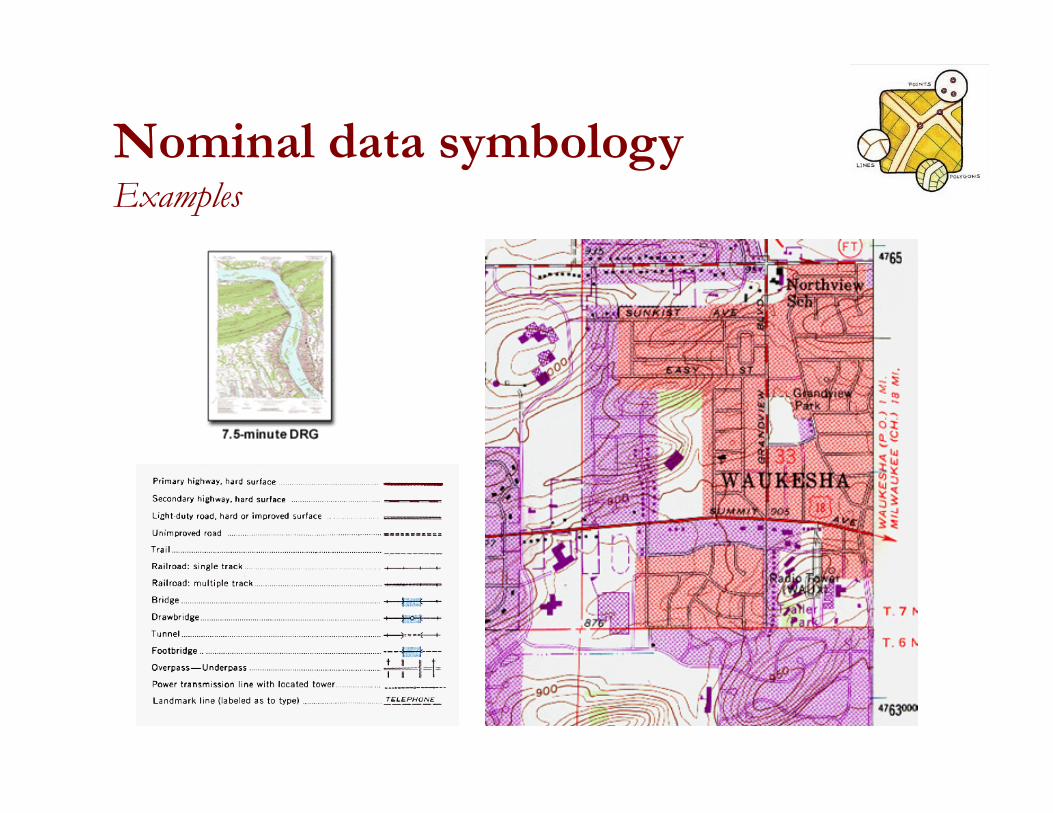
Nominal data symbologyExamples
Provide information about rank or hierarchy using a quantitative (relative) measure (small, medium, large city; low, medium, high‐quality); do not have specific numerical values.
Ordinal data
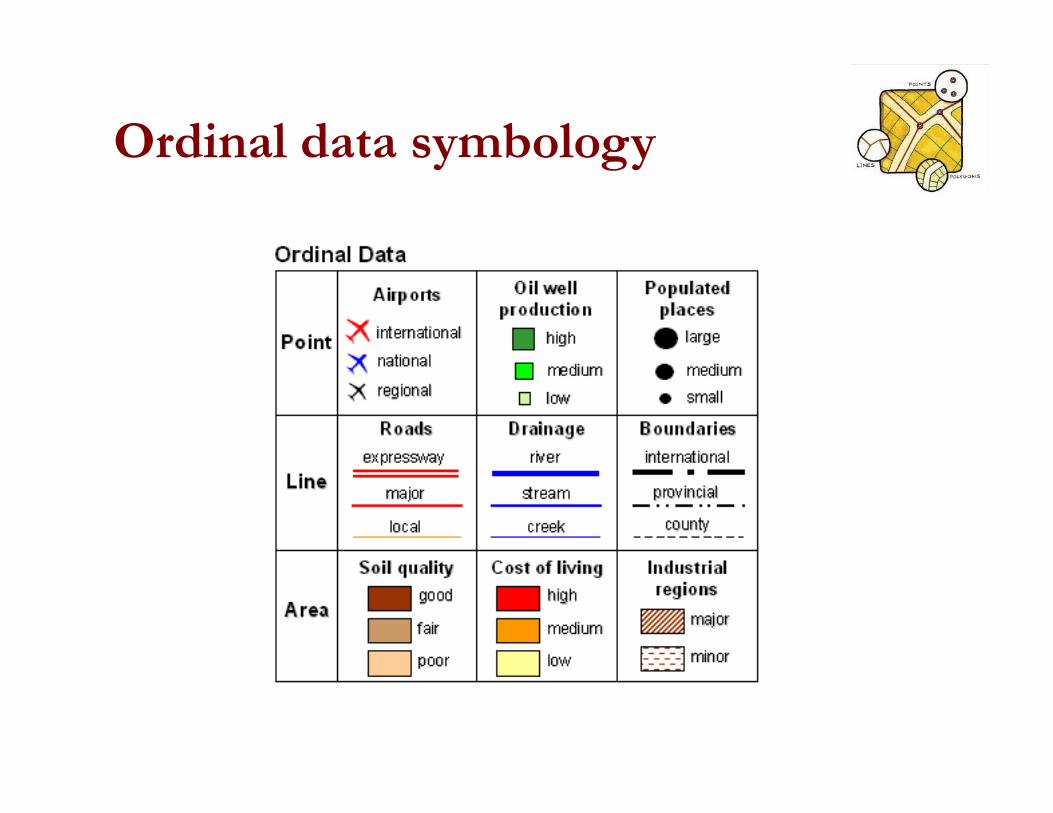
Ordinal data symbology
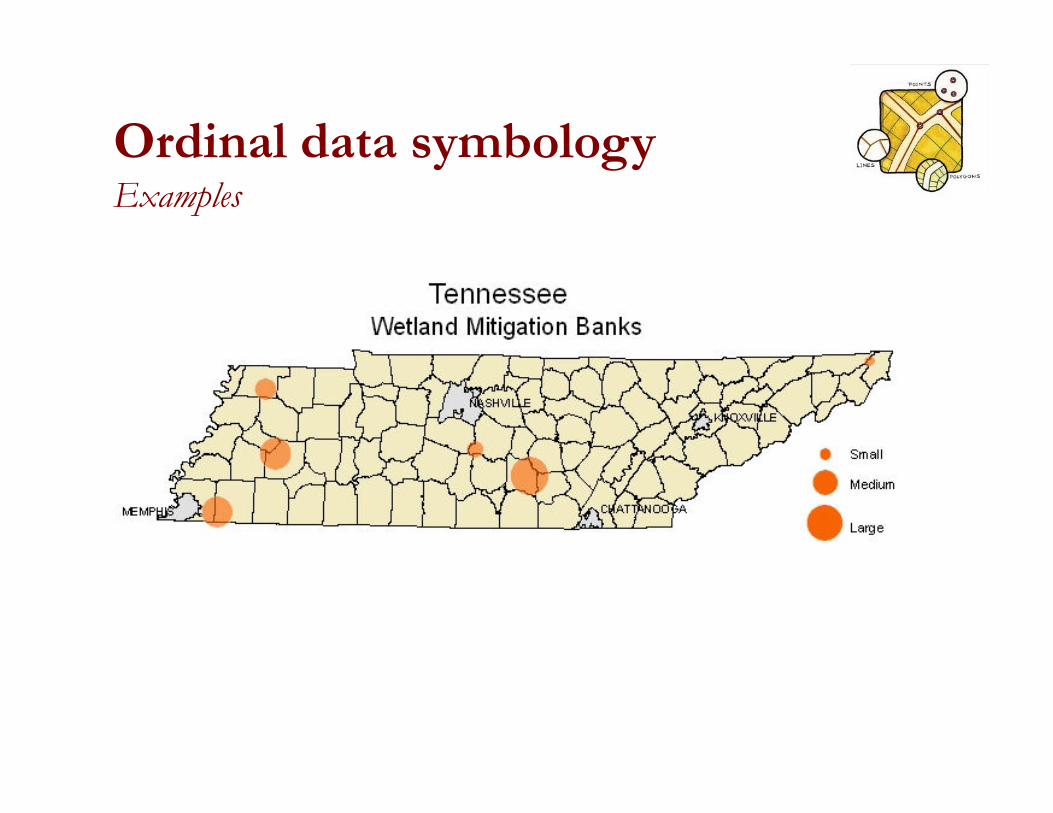
Ordinal data symbologyExamples
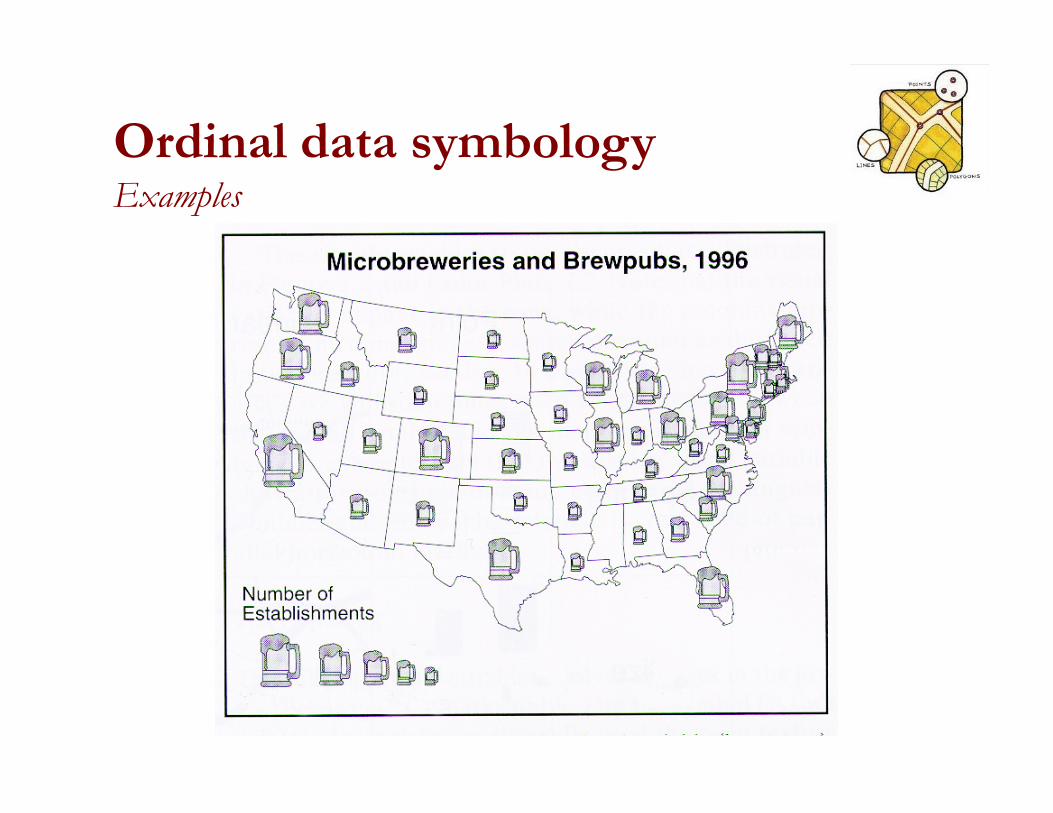
Ordinal data symbologyExamples
Interval data, in addition to being ranked, include numerical values; possible to calculate the difference between ranks expressed in a standard unit (temperature).
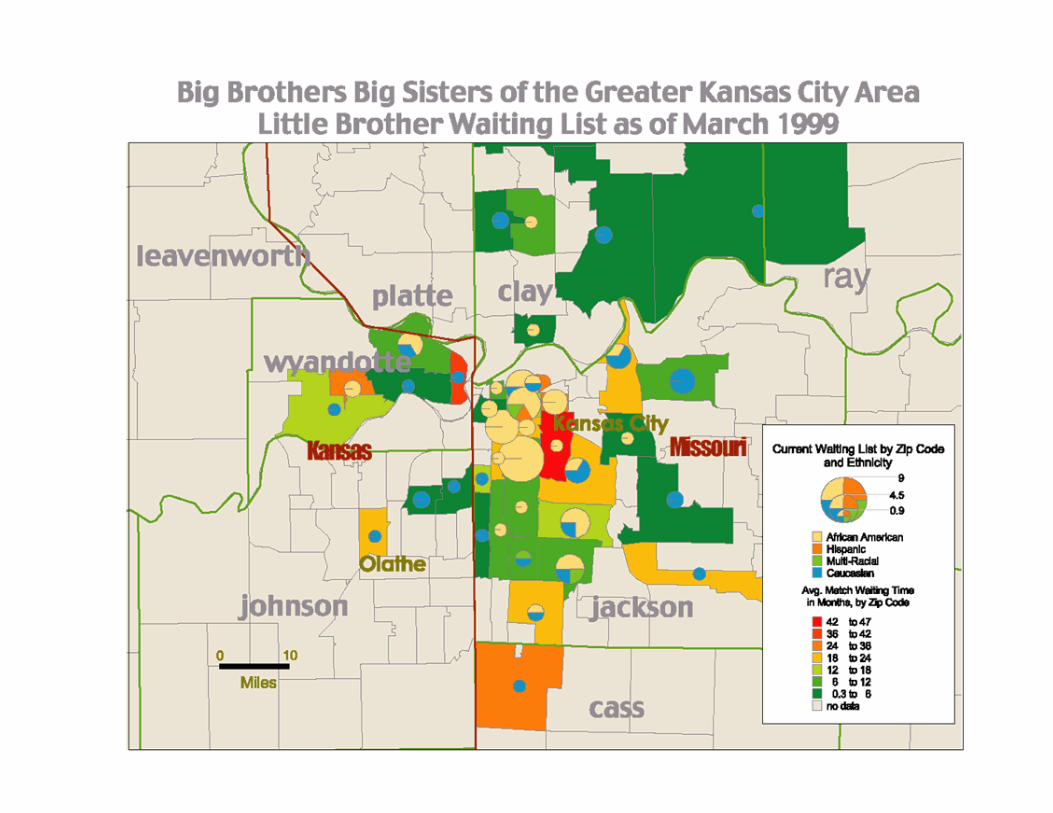
Like interval data, ratio data can be arranged along a scale, but is has a non‐arbitrary zero‐point (population, elevation above sea level, precipitation).
Interval / Ratio (continuous) data
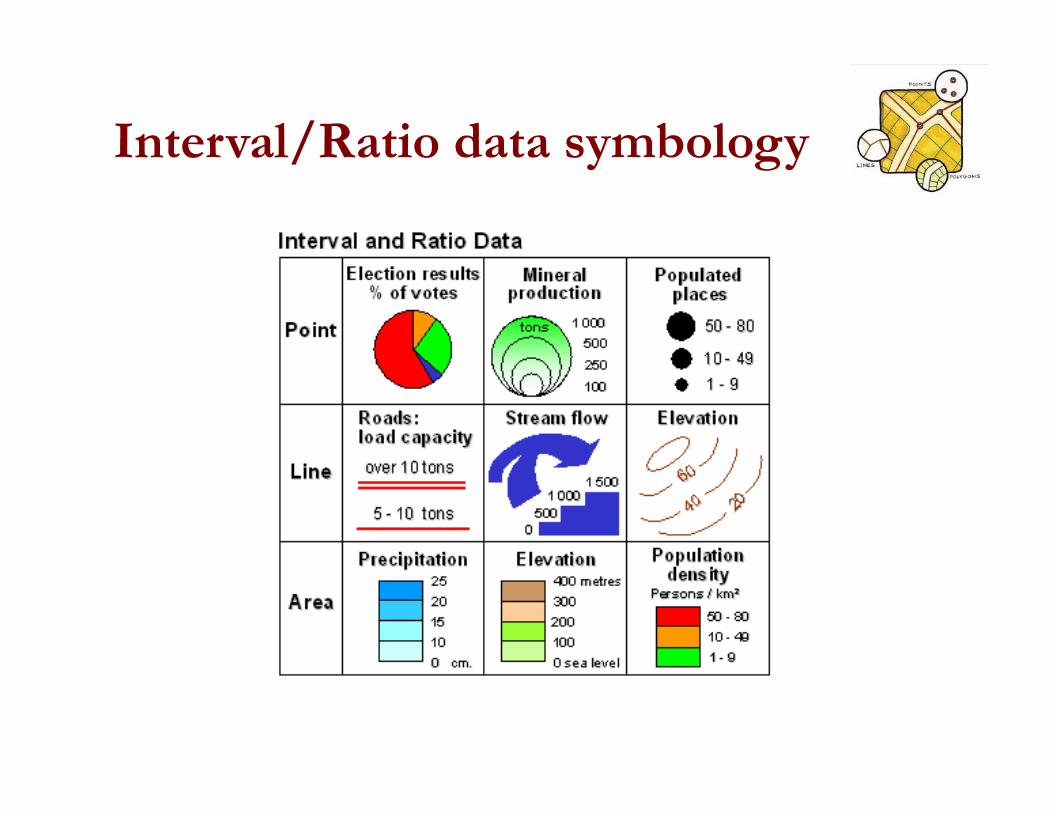
Interval/Ratio data symbology
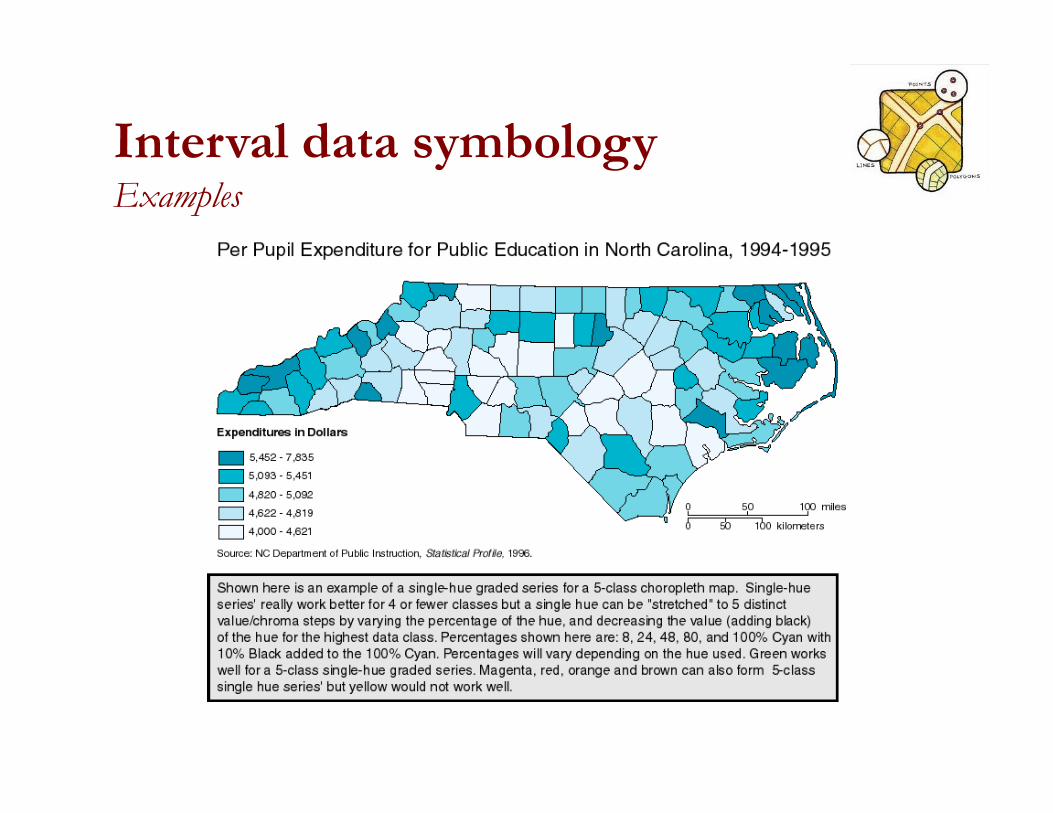
Interval data symbologyExamples
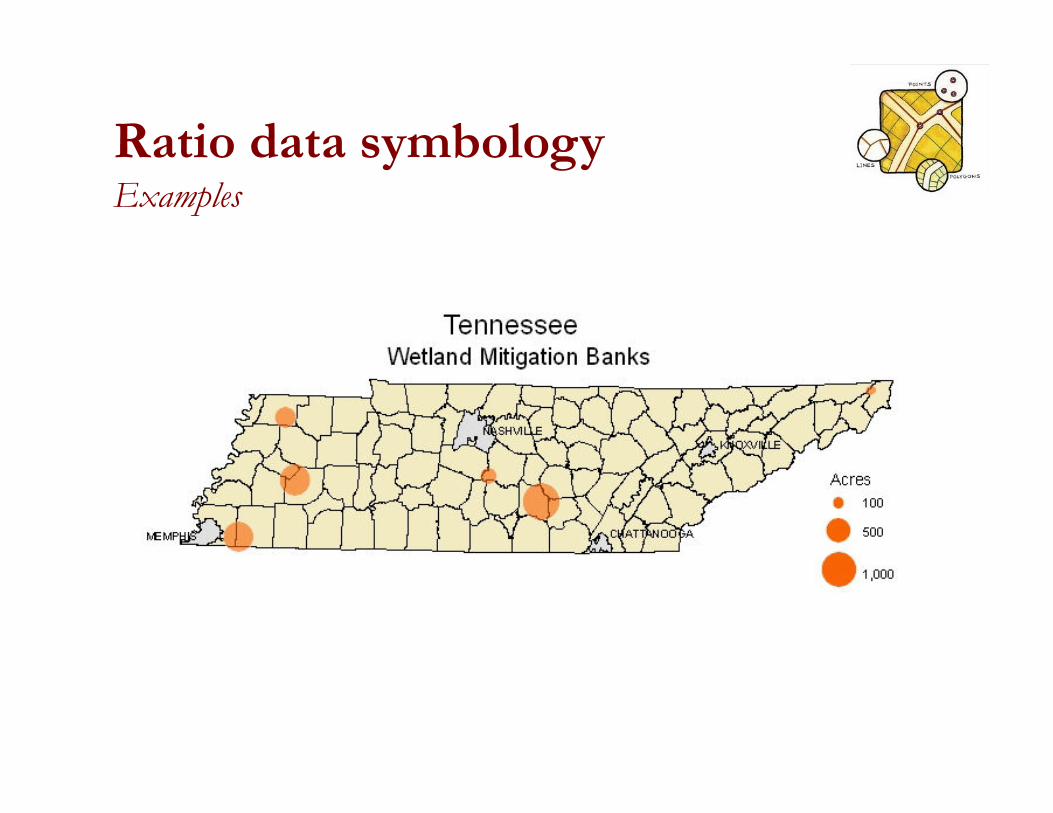
Ratio data symbologyExamples
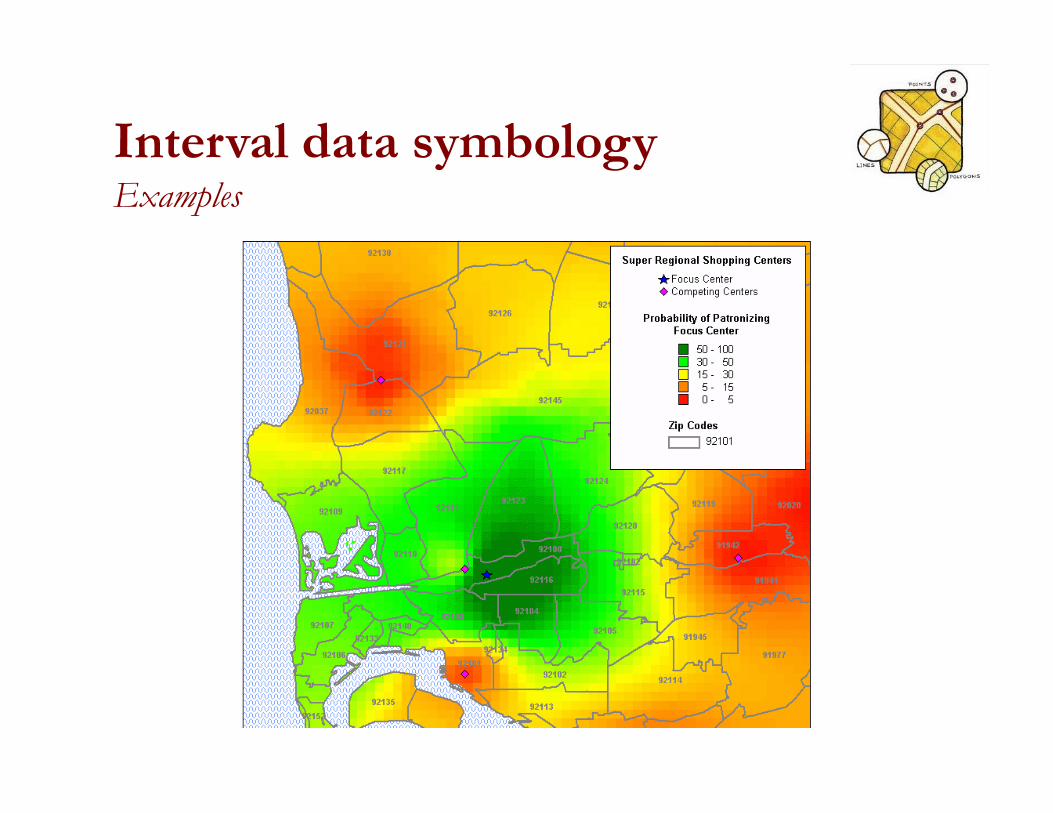
Interval data symbologyExamples
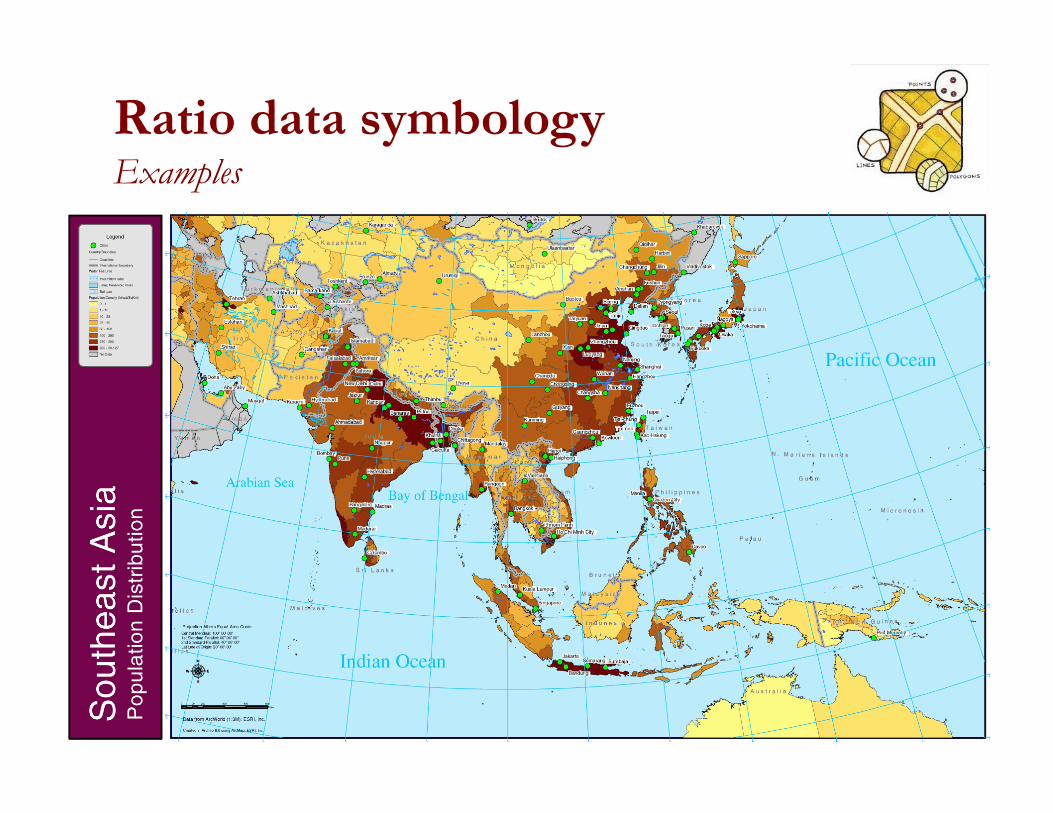
Ratio data symbologyExamples
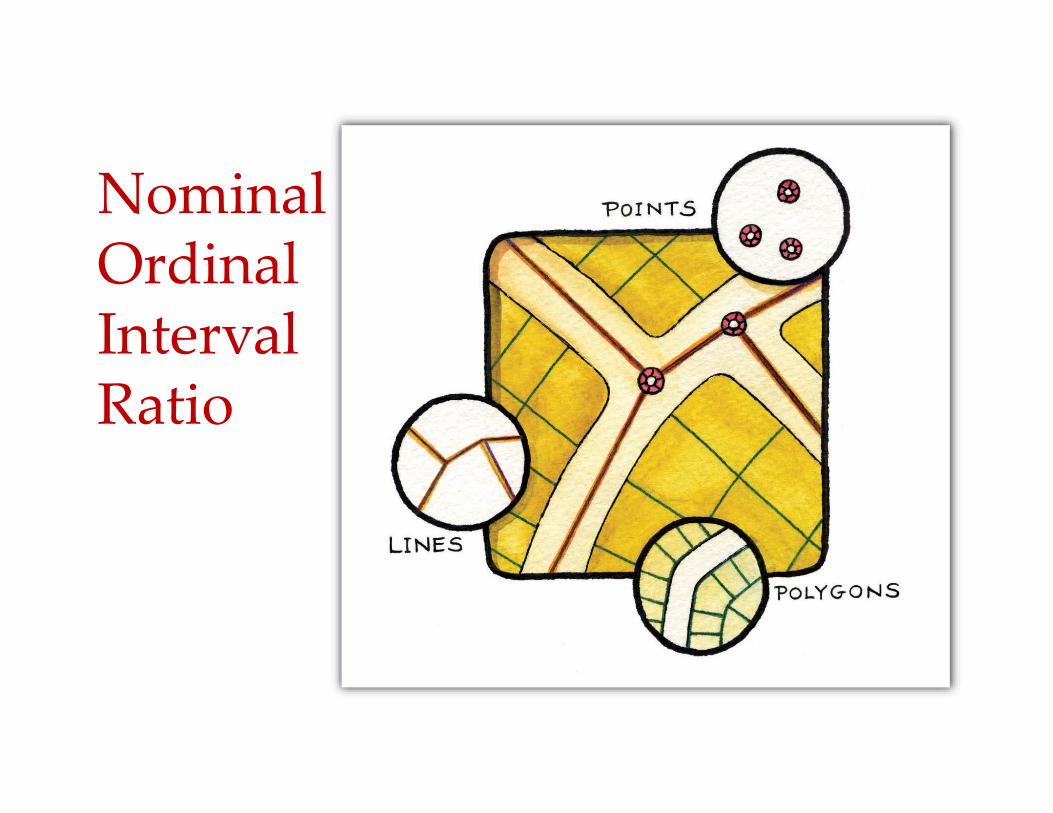
NominalOrdinalIntervalRatio