
Swebrec_2013_1_web.pdf
120
7/17/2019 Swebrec_2013_1_web.pdf http://slidepdf.com/reader/full/swebrec20131webpdf 1/120 Report 2013:1 ISSN 1653-5006 Improved blasting results through precise initiation – results from eld trials at the Aitik open pit mine Nikos Petropoulos Daniel Johansson Ulf Nyberg Evgeny Novikov Ali Beyglou
-
Upload
fernando-miralles -
Category
Documents
-
view
7 -
download
1
Transcript of Swebrec_2013_1_web.pdf

7/17/2019 Swebrec_2013_1_web.pdf
http://slidepdf.com/reader/full/swebrec20131webpdf 1/120
Report 2013:1 ISSN 1653-5006
Improved blasting results through
precise initiation – results from eld
trials at the Aitik open pit mine
Nikos Petropoulos
Daniel Johansson
Ulf Nyberg
Evgeny Novikov
Ali Beyglou

7/17/2019 Swebrec_2013_1_web.pdf
http://slidepdf.com/reader/full/swebrec20131webpdf 2/120

7/17/2019 Swebrec_2013_1_web.pdf
http://slidepdf.com/reader/full/swebrec20131webpdf 3/120
Improved blasting results through precise initiation
Improved blasting results through
precise initiation – results from field
trials at the Aitik open pit mine
Nikos Petropoulos
Daniel Johansson
Ulf Nyberg
Evgeny Novikov
Ali Beyglou

7/17/2019 Swebrec_2013_1_web.pdf
http://slidepdf.com/reader/full/swebrec20131webpdf 4/120
i
Improved blasting results through precise initiation

7/17/2019 Swebrec_2013_1_web.pdf
http://slidepdf.com/reader/full/swebrec20131webpdf 5/120
ii
Improved blasting results through precise initiation
Summary
Blast-induced fragmentation plays a leading role on mining efficiency, hence many
studies have been conducted in order to understand the mechanisms behind rock
breakage and to improve the fragmentation. This report presents the results from fieldtests conducted at the Aitik mine belonging to Boliden Mineral AB in Sweden, which
is part of a project called Vinnova. The project aims to evaluate the effects of short
delay time blasting on fragmentation and other post-blast parameters which influence
the comminution process, e.g. swelling and crushing.
A total number of 6 benches were assigned for trials with different inter-hole delay
times. Two of the benches were blasted with pyrotechnic Nonel caps and were used as
references for further comparisons. Two benches were blasted with 1 ms of inter-hole
delay time by use of electronic detonators. Two other benches were also blasted by
electronic detonators, but with 3 ms and 6 ms of inter-hole delay time respectively.MWD (Measure While Drilling) system was used to log and analyze the drilling
process in order to investigate the penetration rate and specific energy of drilling,
which represent the hardness of the rock. GPS (Global Positioning System) and RTK
(Real time Kinematic System) were used for measurements of benches’ swelling. The
blasts were also filmed using a high-speed camera.
Image analysis with Split-Desktop software was used to analyze the fragmentation of
the rock after blasts. A series of images was shot from trucks carrying the ore and was
later analyzed to obtain the fragmentation for each bench.
Minestar integrated operation and mobile equipment management system was used to
log the data from the fleet in the mine. The data were later used together with the
crusher energy consumption logs to evaluate the energy efficiency of the crushing
process for the ore from each bench.
The tests showed that the inter-hole delay time of 3 ms resulted in the finest
fragmentation among all benches; all examined values i.e. x50, x80 and xmax showed
improvements upon other benches. However, the crushing energy of the ore from this
trial was the highest among all.
Two trials with 1 ms inter-hole delay time did not result in any significant variationcompared to reference benches. The difference in x50 values were ignorable, the same
is true for crushing energy of the mentioned trials.
The bench with inter-hole delay time of 6 ms resulted in the lowest crushing energy
among other trials. However, the bench gave more boulders and coarser
fragmentation compared to reference benches.
Altogether, the results did not lead to any solid conclusion regarding the effect of the
short delay times on fragmentation. Such ambiguity might be resulted by various
sources of errors in data acquisition and analysis, as well as uncertainties regarding
geology of the test area. In order to investigate the effect of delay times on blast
results, more trials with more detailed data acquisition method is necessary.

7/17/2019 Swebrec_2013_1_web.pdf
http://slidepdf.com/reader/full/swebrec20131webpdf 6/120
iii
Improved blasting results through precise initiation

7/17/2019 Swebrec_2013_1_web.pdf
http://slidepdf.com/reader/full/swebrec20131webpdf 7/120
iv
Improved blasting results through precise initiation
Contents
Summary ........................................................................................................................ ii
List of figures ................................................................................................................ vi
List of tables ................................................................................................................... x
1 Introduction ............................................................................................................ 1
1.1 The Vinnova Project........................................................................................ 1
1.2 Precise initiation .............................................................................................. 2
Electronic vs. conventional caps .............................................................. 2 1.2.1
Previous studies and potential improvements .......................................... 3 1.2.2
Theoretical background ........................................................................... 4 1.2.3
2 Field test description ............................................................................................ 10
2.1 Test area description...................................................................................... 10
2.2 Blast trial design and test matrix ................................................................... 14
Description of zero tests......................................................................... 14 2.2.1
Test Matrix ............................................................................................. 14 2.2.2
Design of field campaign ....................................................................... 24 2.2.32.3 Data acquisition ............................................................................................. 27
Swelling data .......................................................................................... 27 2.3.1
High speed video filming ....................................................................... 28 2.3.2
Images of the trucks for fragmentation analysis .................................... 28 2.3.3
Measuring of the truck body sizes ......................................................... 28 2.3.4
2.4 Drill cuttings .................................................................................................. 30
2.5 Post-test analysis ........................................................................................... 30
2.6 Software evaluation ....................................................................................... 34
Internal resolution .................................................................................. 34 2.6.1
Relative error among the users .............................................................. 36 2.6.2
Delineation error .................................................................................... 38 2.6.3
Variation of the images .......................................................................... 39 2.6.4
Compatibility of the images ................................................................... 41 2.6.5
3 Results .................................................................................................................. 43

7/17/2019 Swebrec_2013_1_web.pdf
http://slidepdf.com/reader/full/swebrec20131webpdf 8/120
v
Improved blasting results through precise initiation
3.1 Geological and structural data ....................................................................... 43
3.2 Zero trials ...................................................................................................... 46
3.3 Fragmentation................................................................................................ 49
Bench S1_210_11 .................................................................................. 49 3.3.1
Bench S1_210_12 .................................................................................. 52 3.3.2
Bench S1_225_11 .................................................................................. 59 3.3.3
Bench S1_225_12 .................................................................................. 62 3.3.4
Bench S1_225_13 .................................................................................. 66 3.3.5
Bench S1_225_14 .................................................................................. 69 3.3.6
3.4 Comparative fragmentation results ............................................................... 73
3.5 Swelling ......................................................................................................... 77
Bench S1_210_11 .................................................................................. 77 3.5.1
Bench S1_210_12 .................................................................................. 77 3.5.2
Bench S1_225_11 .................................................................................. 79 3.5.3
Bench S1_225_12 .................................................................................. 81 3.5.4
Bench S1_225_13 .................................................................................. 84 3.5.5
Bench S1_225_14 .................................................................................. 85 3.5.6
Comparative results of the swelling of all the benches.......................... 88 3.5.7
3.6 Crusher data................................................................................................... 91
3.7 Feed-back from operators.............................................................................. 94
4 Discussion ............................................................................................................ 95
5 Conclusions .......................................................................................................... 98
6 Recommendation and future research .................................................................. 99
7 References .......................................................................................................... 100

7/17/2019 Swebrec_2013_1_web.pdf
http://slidepdf.com/reader/full/swebrec20131webpdf 9/120
vi
Improved blasting results through precise initiation
List of figures
Figure 1: Representation of stress wave/pulse in the a) space domain and b) time
domain; after Rossmanith (2002)................................................................................... 5
Figure 2: Definition of fronts and ends of a P-wave (PF, PE) and an S-wave (SF, SE)for a short pulse; after Rossmanith (2002). .................................................................... 6
Figure 3: Lagrange diagram of the interaction patterns of the waves from two
simultaneously initiated blastholes; after Rossmanith (2002). ...................................... 7
Figure 4: Ideal case for tensile tail overlap (Vanbrabant, 2010). ................................... 8
Figure 5: Aerial image of Aitik mine (Boliden’s photo archive) ................................. 10
Figure 6: Geology of the Aitik Cu-Au-Ag deposit and its close surroundings.
Horizontal section at 100-200 m depth (Wanhainen, 2005). ....................................... 11
Figure 7: Schematic ore flow from mine to smelter. ................................................... 12
Figure 8: Mine production areas (6 – waste rock; 5, 7, S1, S2 – ore with satellite open
pit Salmijärvi). There are three crushing stations, one at surface level and two inside
the pit. .......................................................................................................................... 12
Figure 9: Ore profile. ................................................................................................... 13
Figure 10: Test area S1, bench 210, blasts 11 (ref) and 12 (6 ms). ............................. 13
Figure 11: Test area S1, bench 225, blasts 10-11 (1 ms), 12 (3 ms), 13 (ref) and 14-15
(1 ms). .......................................................................................................................... 14 Figure 12: Bench S1_210_11....................................................................................... 15
Figure 13: Bench S1_210_12....................................................................................... 16
Figure 14: Delay time and blast direction. ................................................................... 17
Figure 15: Benches S1_225_10 and S1_225_11. ........................................................ 18
Figure 16: Blast direction............................................................................................. 18
Figure 17: Bench S1_225_12....................................................................................... 19
Figure 18: Delay times of bench S1_225_12. .............................................................. 20
Figure 19: Bench S1_225_13....................................................................................... 21
Figure 20: S1_225_13 Nonel system. .......................................................................... 22
Figure 21: Bench S1_225_14....................................................................................... 23
Figure 22: A Triaxial accelerometer (PCB 350B50) mounted on a steel anchor. The
orientations of the positive components are x-vertical upward, y- horizontal to the left
and z- horizontal out of the figure with center blasthole in positive z-direction. ........ 24
Figure 23: Schematic illustration of the downhole installation of the accelerometers in
a gauge hole. ................................................................................................................ 25

7/17/2019 Swebrec_2013_1_web.pdf
http://slidepdf.com/reader/full/swebrec20131webpdf 10/120
vii
Improved blasting results through precise initiation
Figure 24: The layout for zero trial no. 2 (60_1) September 20, 2011. 8.6 m Spacing
and 7.0 m Burden. ........................................................................................................ 26
Figure 25: Layout for zero trial no 3 (N6-75-13) November 10, 2011. The line
connects the center blasthole with the two gauge holes. ............................................. 26
Figure 26: The different truck bodies at the Aitik mine. ............................................. 29
Figure 27: Process flow of the image analysis............................................................. 32
Figure 28: A sample image without (a) and with (b) delineation. The image without
delineation (a) has been cropped and scaled at two positions (thin lines), the
delineated image (b) is the result of auto-delineation of the software followed by
detailed manual delineation corrections. ...................................................................... 33
Figure 29: A sample cut-out of an image with auto-delineation only (a) and with
manually corrected delineation (b). ............................................................................. 34
Figure 30: The scale positions. .................................................................................... 35
Figure 31: Resolution analysis. .................................................................................... 35
Figure 32: Fragmentation curves with different resolutions. ....................................... 36
Figure 33: The difference among different users. ........................................................ 38
Figure 34: Trial blast S1_210_12 with mostly muscovite schist (yellow). ................. 43
Figure 35: Geology for bench 225. Note that S1_225_13 is not in the trial series.
Muscovite schist (yellow), Biotite schist (green) and biotite gneiss (blue). ................ 44
Figure 36: Photo of slope face trial S1_210_12 with some pegmatite and sets of
fractures........................................................................................................................ 44
Figure 37: Example of results from collecting of drill cuttings. The red dots indicate
pegmatite in numbered production holes based on visual inspection of material in
plastic bags. .................................................................................................................. 45
Figure 38: Recording of triaxial signals from gauge hole at about 15 m from the
center blasthole. Upper one is from trial no. 2 (September 20, 2011) and the lower one
from trial no. 3 (November 10, 2011). ......................................................................... 47
Figure 39: To the left the x-component of the time signal at 2.41 s and to the right
Power Spectral Density (PSD) of the time signal for trial no. 3 (November 10, 2011).
Note that the x-component is vertical. ......................................................................... 48
Figure 40: Fragmentation curves of S1_210_11. ......................................................... 50
Figure 41: The size distribution histogram of the material. ......................................... 51
Figure 42: The final cumulative curve of the fragmentation of S1_210_11 by the
Swebrec function. ........................................................................................................ 51
Figure 43: Scatter of x50 and x80 of the passing mass. ................................................. 52 Figure 44: Bench S1_210_12....................................................................................... 52

7/17/2019 Swebrec_2013_1_web.pdf
http://slidepdf.com/reader/full/swebrec20131webpdf 11/120
viii
Improved blasting results through precise initiation
Figure 45: VoD from blast S1 210_12 March 28, 2012. ............................................. 53
Figure 46: Measured of the inter-hole delay time. ....................................................... 54
Figure 47: Fragmentation curves of S1_210_12. ......................................................... 56
Figure 48: The size distribution histogram of the material. ......................................... 57
Figure 49: The final cumulative curve of the fragmentation of S1_210_12 by the
Swebrec function. ........................................................................................................ 58
Figure 50: Scatter of x50 and x80 of the passing mass. ................................................. 58
Figure 51: Bench S1_225_11....................................................................................... 59
Figure 52: Fragmentation curves of S1_225_11. ......................................................... 60
Figure 53: The size distribution histogram of the material. ......................................... 61
Figure 54: The final cumulative curve of the fragmentation of S1_225_11 by theSwebrec function. ........................................................................................................ 61
Figure 55: Scatter of x50 and x80 of the passing mass. ................................................. 62
Figure 56: Bench S1_225_12....................................................................................... 62
Figure 57: The fragment size distribution of S1_225_12. ........................................... 64
Figure 58: The size distribution histogram of the material. ......................................... 64
Figure 59: The final cumulative curve of the fragmentation of S1_225_12 by the
Swebrec function. ........................................................................................................ 65
Figure 60: Scatter of x50 and x80 of the passing mass. ................................................. 65
Figure 61: Bench S1_225_13....................................................................................... 66
Figure 62: The fragment size distribution of S1_225_13. ........................................... 67
Figure 63: The size distribution histogram of the material. ......................................... 68
Figure 64: The final cumulative curve of the fragmentation of S1_225_13 by the
Swebrec function. ........................................................................................................ 68
Figure 65: Scatter of x50 and x80 of the passing mass. ................................................. 69
Figure 66: Bench S1_225_14....................................................................................... 69
Figure 67: The fragment size distribution of S1_225_14. ........................................... 71
Figure 68: The size distribution histogram of the material. ......................................... 71
Figure 69: The final cumulative curve of the fragmentation of S1_225_14 by the
Swebrec function. ........................................................................................................ 72
Figure 70: Scatter of x50 and x80 of the passing mass. ................................................. 72
Figure 71: Fragmentation results. ................................................................................ 73
Figure 72: Median and oversize vs. Delay time. ......................................................... 74

7/17/2019 Swebrec_2013_1_web.pdf
http://slidepdf.com/reader/full/swebrec20131webpdf 12/120
ix
Improved blasting results through precise initiation
Figure 73: Scatter of x50 values. ................................................................................... 75
Figure 74: Scatter of x80 values. ................................................................................... 76
Figure 75: Measured swelling for bench S1_210_12 in the north direction................ 78
Figure 76: Measured swelling for bench S1_210_12 in the east direction. ................. 79
Figure 77: Measured swelling for bench S1_225_11 in the north direction................ 80
Figure 78: Measured swelling for bench S1_225_11 in the east direction. ................. 81
Figure 79: Measured swelling for bench S1_225_12 in the north direction................ 82
Figure 80: Measured swelling for bench S1_225_12 in the east direction. ................. 83
Figure 81: Measured swelling for bench S1_225_13 in the north direction................ 84
Figure 82: Measured swelling for bench S1_225_13 in the east direction. ................. 85
Figure 83: Measured swelling for bench S1_225_14 in the north direction................ 86
Figure 84: Measured swelling for bench S1_225_14 in the east direction. ................. 87
Figure 85: Swelling in north direction for all the trials. .............................................. 88
Figure 86: Swelling in east direction for all the trials. ................................................. 89
Figure 87: The swelling of all benches. ....................................................................... 90
Figure 88: Delay time vs. Swelling.............................................................................. 91
Figure 89: MWD data analysis – penetration rate and specific energy ....................... 93
Figure 90: Crushing energy consumption and specific drilling energy. ...................... 94
Figure 91: Graphical illustration of main results of trials. ........................................... 96

7/17/2019 Swebrec_2013_1_web.pdf
http://slidepdf.com/reader/full/swebrec20131webpdf 13/120
x
Improved blasting results through precise initiation
List of tables
Table 1: The test matrix. .............................................................................................. 15
Table 2: The truck body dimensions. ........................................................................... 30
Table 3: The relative error among different users. ...................................................... 37
Table 4: Delineation error. ........................................................................................... 39
Table 5: Difference between different trucks. ............................................................. 40
Table 6: The difference in fragmentation between two perspectives. ......................... 41
Table 7: Time periods and frequency for the signals at approximately 15 and 25 m
from the center blasthole for trial no. 2 (September 20, 2011) and trial no. 3
(November 10, 2011). .................................................................................................. 48
Table 8: Fragmentation results of bench S1_210_11 and the results every 10 % of the passing mass................................................................................................................. 49
Table 9: The Swebrec function fitting parameters ....................................................... 50
Table 10: Fragmentation results of S1_210_12 and the results every 10 % of the
passing mass................................................................................................................. 55
Table 11: Fragmentation results of S1_225_11 and the results every 10 % of the
passing mass................................................................................................................. 59
Table 12: Fragmentation results of S1_225_12 and the results every 10 % of the
passing mass................................................................................................................. 63
Table 13: Fragmentation results of S1_225_13 and the results every 10 % of the
passing mass................................................................................................................. 66
Table 14: Fragmentation results of S1_225_14 and the results every 10 % of the
passing mass................................................................................................................. 70
Table 15: The measured average of all the trials. ........................................................ 88
Table 16: Summary of the most important results of all trials. ................................... 95

7/17/2019 Swebrec_2013_1_web.pdf
http://slidepdf.com/reader/full/swebrec20131webpdf 14/120

7/17/2019 Swebrec_2013_1_web.pdf
http://slidepdf.com/reader/full/swebrec20131webpdf 15/120
1
Improved blasting results through precise initiation
1 Introduction
Blasting, as one of the most utilized methods of rock extraction, plays a leading role
on mining efficiency. The primary purpose of all blasting is to fragment the rock into
pieces of suitable dimensions for further handling. Through the fragmentation,
blasting directly influences post- blast operations’ costs, e.g. haulage, crushing and
grinding. An improved fragmentation can result in reduced costs for transportation of
the blasted rock, as well as reductions in energy consumption during crushing and
grinding of the blasted rock. In addition to that, improvements in metal recovery and
environmental aspects can be achieved through improved fragmentation.
Production blasting in mining industry mainly consists of drilling blastholes in
particular patterns, charging them with certain amounts of explosive and finally
detonating them in a specifically designed sequence. The initiation sequence has beenof significant importance since the mechanism of rock breakage by blasting in large
scales, e.g. bench blasting, compels the blastholes to be initiated in a specific way.
The sequence should be designed in a way that compressive shockwaves, produced by
detonation, find enough time to reach the free face and their tensile reflections reach
the rock and break it in tension. Such constraint is due to the fact that available
detonation caps had not been developed to handle very short time intervals of wave
propagation speed. In addition to that, large scatter of delay time in conventional
pyrotechnic caps did not permit blast designers to consider theories of dynamic
fracture mechanics and wave propagation in practice.
Yet new horizons opened up on practical usage of wave propagation and dynamic
fracturing theories when reliable electronic detonators became available in the late
1990s. These detonation caps are now capable of delay times down to 1 millisecond
and are of higher precision compared to conventional caps. The availability of
electronic caps permitted the theories of overlapping, interaction and superposition of
shockwaves to be put in practice. Precise initiation with short delay times has been
practiced in many countries (Australia, Chile, United States, New Zealand, etc.) and
has resulted in noticeably better fragmentation, throw, swelling and digability, hence
considerable savings. However, quantitative computational models that describe this
phenomenon are lacking. To address this issue, a research project, funded by
Vinnova, has been commenced. The project aims to further investigate the theories
and to develop better computational tools for simulation of blasting with electronic
programmable delay (EPD) caps.
1.1 The Vinnova Project
The hypothesis proposed by Rossmanith (2002) states that by using short delay times,
fragmentation might be improved in areas between blastholes where the shockwaves
meet, overlap and interact. The Vinnova project mainly aims to investigate this
hypothesis through full-scale field tests and computer simulation of blast
performance. The project is a joint effort between the industrial partners, LKAB and

7/17/2019 Swebrec_2013_1_web.pdf
http://slidepdf.com/reader/full/swebrec20131webpdf 16/120
2
Improved blasting results through precise initiation
Boliden Mineral AB, and Luleå University of Technology (through Swebrec -The
Swedish Blasting Research Centre). The project is primarily funded by Vinnova (the
Swedish Governmental Agency for Innovation Systems), with supplementary funding
by LKAB, Boliden Mineral AB and Swebrec.
The main objectives of this project are to: (i) achieve a better fragmentation, throw
and other blast-induced results in quarries and mines; and (ii) study the extension of
Rossmanith’s concept to a three-dimensional geometry by identifying the rock
volumes within a blast, where the wave interaction from neighboring blastholes may
lead to additional damage and consequently enhanced fragmentation.
The project comprises nine different tasks involving computer simulation of blast
performance, coupled with full-scale field tests and model scale tests. This report
presents the results from field tests conducted at the Aitik mine.
1.2
Precise initiation
Electronic vs. conventional caps1.2.1
Blasting caps are commercially available on the market in various forms. Fuse caps,
electric detonators, non-electric detonators and electronic detonators are the different
types.
The oldest of all is fuse caps, which roots back to black powder. Unreliable burning
speed and hazardous nature of black powder makes this method of detonation
dangerous to be used in modern mining, of which the safety is extremely critical.However, fuse caps are widely used in the mining industry, especially in developing
countries.
Electric blasting caps are very similar to fuse caps, but insulated electric wires were
used instead of the fuse. Introduction of a pyrotechnical delay element in these caps
allowed an offset between two following charges, which led to creation of initiation
sequences. Electric detonators are sensitive to heat, shock, static electricity, radio
frequency energy and electromagnetic radiation; resulting in safety issues in their
usage.
In 1960s total non-electric initiation systems were introduced by Dyno Nobel. These
caps had all advantages of electric detonators in addition to safety benefits.
Insensitivity of non-electric detonators to electricity, radio frequency energy and
electromagnetic radiation, in addition to their wide operational flexibility made them
the world’s most widely used type of detonators. Despite all benefits of this type of
caps, they are impracticable in precise initiation blasting due to the long delay times
and large scatters of their pyrotechnical delay element.
In 1990’s, an idea was introduced that suggested using an embarked electronic clock
to replace the pyrotechnical delay element that creates inaccuracy for the conventionaldetonators. Extensive research from 1990 to 2000 led to the introduction of pre-

7/17/2019 Swebrec_2013_1_web.pdf
http://slidepdf.com/reader/full/swebrec20131webpdf 17/120
3
Improved blasting results through precise initiation
programmed or programmable electronic detonators. These caps offer an amazing
flexibility in the choice of initiation timing between 1 and 15000 milliseconds. Such
flexibility together with very high accuracy of detonation times opens doors for short
delay complex initiation sequences.
Previous studies and potential improvements1.2.2
Although many researchers have studied the subject of optimum delay time to
improve blast-induced fragmentation, controversy swirls about a coherent conclusion.
According to reduced-scale tests conducted by Stagg and Nutting (1987), the optimal
delay time regarding fragmentation is 3.3 to 55 ms/m of burden; their tests showed
coarse fragmentation from short delays (<3 ms), where breakage approached presplit
conditions with a major fracture between blastholes and large blocks in the burden
region. Otterness et al. (1991), based on 29 small-scale shots, also state that delay
times of 3.3-13 ms/m of burden resulted in 12-20% improvement in fragmentation.
On the other hand, Rossmanith (2003) suggests that interaction of the waves is of
importance in blasting fragmentation. Since the speed of wave propagation is rather
fast in typical rock, Rossmanith’s theory leads to usage of short delay times. He
claims that by use of electronic detonators with short delay times, the fragmentation
can be notably improved.
Through field tests at Barrick Goldstrike mines, McKinstry et al. (2004) have also
suggested a delay time of 3 ms between holes of the same row to take advantage of
interference of stress waves to improve the fragmentation. However, the only
available information on their tests is about the spacing, which was mentioned as 7
meters.
Likewise, Rosenstock (2005) has confirmed the positive effect of very small delay
times. He states that short delay blasting has resulted in 10-20% increase in
productivity and a reduction of 50% in the costs of drilling and blasting in Australian
mines.
Vanbrabant and Espinosa (2006) conducted a series of field tests to examine the
effects of overlapping of the negative tails of stress waves via the use of short delay
times of electronic detonators. They observed an average improvement of 45% in the
mean particle size of the fragmentation.
Small-scale tests in grandiorite blocks, conducted by Katsabanis et al. (2006), showed
that the worst fragmentation is achieved by instantaneous initiation and it improves
with increasing delay times up to 1 ms. By up-scaling the results, Katsabanis
concluded that delay times of few milliseconds per meter of burden result in improved
fragmentation in full-scale grandiorite blasting.
Rorke (2007) argues that a substantial reduction of fragmentation have been
documented at 2-7 ms inter-hole delay time compared to the conventional pyrotechnic
delays in blasting of hard rock. In soft rocks the differences were less clear.

7/17/2019 Swebrec_2013_1_web.pdf
http://slidepdf.com/reader/full/swebrec20131webpdf 18/120
4
Improved blasting results through precise initiation
However, full-scale experiments of Ouchterlony et al. (2010) showed contradictory
results. Their experiments included a drill pattern with 3.4 m spacing and 2.6 m
burden, i.e. spacing/burden ratio of 1.3. Designed inter-hole delay times of their tests
were 1.92 ms/m of burden and 3.84 ms/m of burden; the inter-row delay time was 67
ms. They reported coarser fragmentation for the electronic detonators compared to pyrotechnic caps.
Johansson and Ouchterlony (2012) also conducted a series of small-scale tests to
investigate the influence of delay time on the fragmentation. No distinct difference
was observed in the fragmentation for the case of shock wave interaction compared to
no shock wave interaction. Yi et al. (2012) performed a series of numerical
simulations of the aforementioned tests which led to the conclusion that improved
fragmentation can be achieved through a properly chosen delay time. Their
simulations were using the same methodology as Schill (2012), who carried out the
simulations with LSDYNA (Hallquist, 2007) and the RHT (Riedel et al., 1999)
material model for inter-hole delay times of 0, 1.5 and 5 ms. Schill (2012) had also
concluded that there was an effect of the interacting stress waves on the
fragmentation.
Altogether, previous studies show a potential for electronic detonators and short delay
times to improve fragmentation. However, more studies need to be conducted in order
to draw a confident conclusion whether the short delay times are beneficial to
fragmentation or not.
Theoretical background1.2.3
The entire fragmentation process in blasting is based upon the rapid detonation of
explosives. Once initiated, the explosive releases an enormous amount of energy
through chemical reactions, which results in high-pressure gases in the blasthole. The
reaction advances throughout the explosive column at a speed of approximately 2000
m/s to 6000 m/s, depending on the Velocity of Detonation (VoD) of the explosive.
The rapidity of such reaction causes an almost instantaneous pressure rise in the hole,
which produces a shockwave in the rock (Hustrulid, 1999).
Of the various types of waves that can propagate, the body and surface waves are ofthe most importance in rock breakage. Primary or longitudinal waves (P-waves) and
secondary or shear waves (S-waves) play the leading role in blasting. These waves
propagate in the rock at very high speeds (3000-5000 m/s) and cause strains and
stresses which form cracks or open existing cracks in the rock, resulting in breakage
(Esen et al., 2003).
According to wave propagation concept (Hustrulid, 1999), the positive pressure of
shockwave falls rapidly to negative values, which implies a sudden change from
compression to tension. In a more detailed description of this concept, Rossmanith
(2002) states that a stress wave of pulse type with finite length and duration consistsof a leading part and a tailing part (Figure 1). The leading parts are characterized by

7/17/2019 Swebrec_2013_1_web.pdf
http://slidepdf.com/reader/full/swebrec20131webpdf 19/120
5
Improved blasting results through precise initiation
the index “+” and the tailing parts by index “−”. The +/− sign does not necessarily
indicate compression or tension, but the leading and tailing parts.
Figure 1: Representation of stress wave/pulse in the a) space domain and b) time domain; after Rossmanith
(2002).
Pulse length or pulse duration is important in short delay blasting; the pulse length in
Figure 1 is Λw and its duration is τw. They both consist of a positive leading part and a
negative tailing.
The focus of traditional blasting technique is mostly on the compression pulse of the
shockwave, i.e., the leading part. But since the tensile strength of rock is much lower
than its compressive strength, the availability of a free face in the surrounding of the
blasthole is critical to allow the compressive pulses to reflect and return as tensile
pulses to open up cracks and/or break the rock in tension. The free faces are generally
generated through the sequenced initiation of blastholes in a way that the delay time
provides enough time for the previous blastholes to break the rock and move it
forward (Vanbrabant and Espinosa, 2006).
By use of electronic detonators, it is now possible to make the waves interact in such
a way that tensile and shearing pulses are overlapped to increase the effect of the
stress waves. The tensional states achieved in this way can be larger than those
obtained by the reflection of compression pulses. In addition to that, the blastholes in
other rows detonate in a confined environment (Vanbrabant and Espinosa, 2006).
For a clearer presentation of the aforementioned concept, Rossmanith (2002)
suggested the usage of Lagrange diagrams. For the sake of simplicity the stress waves
are assumed planar, i.e., one-dimensional; the three dimensional effects of blastholes
and charges are also ignored. Figure 2 illustrates the fronts and ends of a P-wave and
an S-wave of a short pulse on a Lagrange diagram, which consists of a time axisversus a position axis. The tangents of the associated lines are the inverse of the

7/17/2019 Swebrec_2013_1_web.pdf
http://slidepdf.com/reader/full/swebrec20131webpdf 20/120
6
Improved blasting results through precise initiation
speeds of the waves. Since the propagation speed of P-waves is larger than that of S-
waves, its associated line is of smaller slope. τs and τ p represent the duration of
compressive and shear waves, of which a part is the positive leading followed by a
negative tailing.
Figure 2: Definition of fronts and ends of a P-wave (PF, PE) and an S-wave (SF, SE) for a short pulse; after
Rossmanith (2002).
Short delay blasting aims to take advantage of the interaction and superposition of
tensile tailings of the stress waves from several blastholes. A schematic representationof the interaction of two stress waves from two instantaneously initiated blastholes is
presented in Figure 3. As seen, different types of interactions take place for the fronts
and ends of the S and P-waves. It should also be reminded that each of the waves
includes a positive leading part and a negative tailing part in the duration of its front
and end (Rossmanith, 2002). The diagram in Figure 3 shows the basis for the design
of short delays to increase the amplitude and effective length of the most favorable
wave interactions, as well as to avoid formation of destructive interactions
(Vanbrabant and Espinosa, 2006).

7/17/2019 Swebrec_2013_1_web.pdf
http://slidepdf.com/reader/full/swebrec20131webpdf 21/120
7
Improved blasting results through precise initiation
Figure 3: Lagrange diagram of the interaction patterns of the waves from two simultaneously initiated
blastholes; after Rossmanith (2002).
By introducing a delay time to the diagram in Figure 3, the initiation point of the
delayed blasthole will be shifted upwards on the time axis, reshaping the interaction
patterns. In order to reach a favorable pattern of interactions, one should carefully
consider the rock mass characteristics from wave propagation point of view, i.e., wave
propagation speed as well as geological aspects. More details on the calculation
procedure of short delay time interaction can be found in Rossmanith (2002) and
Vanbrabant (2010).
Inspired by Rossmanith and co-workers (1997; 1998; 2002), the delay times in this
project were chosen to create an overlap of the negative tails of the radial particle
velocity (P-waves) generated by the blastholes, since it is practically easier to measure
particle velocities than stresses. Vanbrabant (2010) presented this approach through a
Lagrange diagram (Figure 4), where the ideal case of overlapping can be seen. The
ideal timing between two blastholes is determined by measuring the primary wave
velocity and velocity of the tensile tail at certain distances from the blasthole. In
addition to that, the duration of the compressive pulse at the blasthole has to be taken
into account. The results of several small-scale tests on mortar blocks (Johansson,
2011; Johansson and Ouchterlony, 2013; Petropoulos, 2012) were utilized to evaluate
the shockwave interaction scheme and its influence on fragmentation.

7/17/2019 Swebrec_2013_1_web.pdf
http://slidepdf.com/reader/full/swebrec20131webpdf 22/120
8
Improved blasting results through precise initiation
Figure 4: Ideal case for tensile tail overlap (Vanbrabant, 2010).
For an ideal case as in Figure 4, the timing should be as follows:
01 T T T T d ideal
where,
Td = traveling time of the shockwave between the shot hole and the subsequent
neighboring hole.
T1 = duration of the first (compressive) half-wave at the neighboring hole (at one hole
spacing).
T0 = duration of the first half-wave at the shot hole when the charge detonates (at
distance D = 0).
In our first attempt, the blastholes are initiated and superimposed based on wave
travel time between two blastholes and the positive phase δt. The initiation time ∆t
between blastholes is calculated as ∆t=t1+t2 with t1=8.6 m/5000 m/s and t2=3/4·2·δt.
The term t1 is the ratio of hole spacing and p-wave velocity and t2 a factor for phase
and positive part of the period. The Fast Fourier transform (FFT) is not used for
estimation of hole initiation delay time due to data scatter.
For second and third trial the calculations led to ∆t2 = 7.4 ms and ∆t3 = 5.5 ms of
delay time. Note that the travel time of shockwave between the holes is a rough
T i m e
Hole #1 Hole #2 Hole #3
c o m p r e s
s i v e p u l
s e
T1
Td
T0
c o m p r e s
s i v e p u l
s e
T0
n e g a t i v e
t a i l
n e g a
t i v e t a
i l
Distance

7/17/2019 Swebrec_2013_1_web.pdf
http://slidepdf.com/reader/full/swebrec20131webpdf 23/120
9
Improved blasting results through precise initiation
approximation due to conical shape of waves and limited amount of data especially
for second trial. Based on the above estimations, the upper practical linear inter-hole
delay time was set to 6 ms.
Two other delay times of 1 ms and 3 ms were chosen based on successful full-scale
experiments of Chiappetta (2011) in several mines in South America (Chile, Peru,
Mexico and Colombia). According to Chiappetta (2011), the best fragmentation is
produced by an inter-hole delay time of 1-3 ms.

7/17/2019 Swebrec_2013_1_web.pdf
http://slidepdf.com/reader/full/swebrec20131webpdf 24/120
10
Improved blasting results through precise initiation
2 Field test description
2.1 Test area description
Aitik, situated outside the town of Gällivare in the north of Sweden, is the largestcopper mine in Sweden. The deposit consists of chalcopyrite and pyrite yielding
copper, gold and silver. Approximately 31.5 Mtonnes of ore is mined and
concentrated here every year. The annual ore production is expected to reach 36
Mtonnes in 2014. The open pit is currently 3 km long, 1.1 km wide and 450 meters
deep (Figure 5).
The ore is a low-grade copper mineralization with about 0.27% of copper, 0.16 ppm
gold and 2.07 ppm silver. The ore zone is 2500 x 300 m in size; it strikes
approximately N20°W and dips about 45
° to the west.
Figure 5: Aerial image of Aitik mine (Boliden’s photo archive)
The Aitik deposit is situated within an area of metamorphosed plutonic and volcano-
sedimentary rocks of Precambrian age (1.9-1.8 Ga). Rock types within the deposit are
strongly deformed and altered, and the mining area is divided into footwall, ore zone
and hanging wall, based on structural boundaries and copper grades.
The footwall mainly consists of quartz monzodiorite and feldspar-biotite-amphibolegneiss with <0.26 % Cu. The ore zone comprises garnet-bearing biotite schist towards

7/17/2019 Swebrec_2013_1_web.pdf
http://slidepdf.com/reader/full/swebrec20131webpdf 25/120
11
Improved blasting results through precise initiation
the footwall, and quartz-muscovite-sericite schist towards the hanging wall. The
hanging wall mainly comprises fine-grained, banded feldspar-biotite-amphibole
gneiss, which is separated from the ore zone by a major fault. Pegmatite dykes are
most frequent in the hanging wall and ore zone, where they occur both along strike
(north-south) and cross-cutting the foliation. They range in thickness from 0.5 to 20meters. Within the ore zone both types often carry chalcopyrite and pyrite, and
occasional molybdenite. Up to 50 cm wide baryte veins containing varying amounts
of magnetite, actinolite, quartz, epidote, chalcopyrite and pyrite are spatially
associated with the ore zone. Strong alteration in Aitik occurs as extensive
biotitization and sericitization in the ore zone, accompanied by garnet porphyroblasts,
quartz and pyrite. The main copper-bearing mineral in Aitik is chalcopyrite (>98 %).
Bornite and chalcocite are present in trace amounts. Other ore minerals include pyrite,
magnetite, pyrrhotite, ilmenite and molybdenite, where pyrite is by far the dominant
sulphide. The highest copper grades occur in the potassic altered biotite schist in the
ore zone (Figure 6, Wanhainen 2005).
Figure 6: Geology of the Aitik Cu-Au-Ag deposit and its close surroundings. Horizontal section at 100-200 m
depth (Wanhainen, 2005).
The ore flow in Aitik, Figure 7, starts with drilling and blasting, then the ore is loaded
with excavators and hauled with trucks to the in pit crusher. The ore is crushed and
transported on a conveyor belt, to two ore piles that feeds the grinding mills. After
grinding the ore goes through flotation, thickening, dewatering and finally drying. The
concentrate is transported to the Rönnskär smelter. Actual mine production areas and
ore profile are illustrated in Figure 8 and Figure 9.

7/17/2019 Swebrec_2013_1_web.pdf
http://slidepdf.com/reader/full/swebrec20131webpdf 26/120
12
Improved blasting results through precise initiation
Figure 7: Schematic ore flow from mine to smelter.
Figure 8: Mine production areas (6 – waste rock; 5, 7, S1, S2 – ore with satellite open pit Salmijärvi). There
are three crushing stations, one at surface level and two inside the pit.

7/17/2019 Swebrec_2013_1_web.pdf
http://slidepdf.com/reader/full/swebrec20131webpdf 27/120
13
Improved blasting results through precise initiation
Figure 9: Ore profile.
The selected test area for blasts is shown in Figure 10 and Figure 11. The area is
located in southern part of the mine at levels 210 and 225 m, representing fairly
similar geological characteristics and thus, reducing the possible influence of geology
on blast results from different benches.
Figure 10: Test area S1, bench 210, blasts 11 (ref) and 12 (6 ms).
N

7/17/2019 Swebrec_2013_1_web.pdf
http://slidepdf.com/reader/full/swebrec20131webpdf 28/120
14
Improved blasting results through precise initiation
Figure 11: Test area S1, bench 225, blasts 10-11 (1 ms), 12 (3 ms), 13 (ref) and 14-15 (1 ms).
2.2 Blast trial design and test matrix
Description of zero tests2.2.1
The purpose of the so-called zero trials, is to evaluate the characteristics of typical
vibration signals at about 10-15 m behind the blast in order to find blasthole time
delay for optimum fragmentation suggested by earlier research (Rossmannith, 2002;Vanbrabant and Espinosa, 2006; etc.). The signals are generated by production holes
(Ø311 mm) in the Aitik mine. The holes are approximately 18 m long, of which
approximately 15 m was loaded with emulsion explosive. In particular, wave
frequency, the propagation velocity and the wave amplitude are of interest and the
results will be used for estimation of the optimum inter-hole blast delay.
The overall objective is to find a relation between the blasthole timing and blast
fragmentation. Between the rows, standard delays are used (176 ms). For the entire
blast the hole initiation took place with help of electronic caps which have an
accuracy of ± 0.13 ms for interval 0 - 1300 ms and ± 0.01 % for interval 1301 - 15000
ms. The selected electronic caps were of type i-kon™ RX Electronic Detonators due
to programmability and durability of them.
Test Matrix2.2.2
This section describes all the trials in addition to the two reference benches in terms
of blast design, e.g., delay time, drilling pattern, blast direction, etc. The blasting
reports are placed in Appendix 1.
Table 1 shows the names, date of blasts and assigned inter-hole delay times of thetrials and reference blasts. Two benches were blasted with 1 ms inter-hole delay time
N

7/17/2019 Swebrec_2013_1_web.pdf
http://slidepdf.com/reader/full/swebrec20131webpdf 29/120
15
Improved blasting results through precise initiation
and two benches were blasted with respectively 6 ms and 3 ms of inter-hole delay
time. Benches S1_210_11 and S1_225_13 were blasted with Nonel initiation system.
Since Nonel is the normal initiation system used in the Aitik mine, benches
S1_210_11 and S1_225_13 were monitored and used as the references for the
comparison of the results of the trials.
Table 1: The test matrix.
Campaign Date Delay time, ms Bench no.
1st Ref. March 7, 2012 42 S1_210_11
1 March 28, 2012 6 S1_210_12
2 July 26, 2012 1 S1_225_11
3 August 28, 2012 3 S1_225_12
2nd Ref. August 28, 2012 42 S1_225_13
4 September 12, 2012 1 S1_225_14
S1_210_11
Figure 12 shows the first reference bench initiated with a Nonel system. This bench
was used to compare the short inter-hole delay time trials with the conventional
initiation system. The detailed data are shown in Appendix 2.
Figure 12: Bench S1_210_11.

7/17/2019 Swebrec_2013_1_web.pdf
http://slidepdf.com/reader/full/swebrec20131webpdf 30/120
16
Improved blasting results through precise initiation
S1_210_12
The first trial was planned to be blasted with 6 ms inter-hole delay time. There were
81 contour blastholes and 302 production blastholes. The volume of the blasted
material was 301 379 m3 and the amount of explosives was 303 401.5 kg. Hence, the
specific charge of the bench was 1.00 kg/m3. Figure 13 shows the map of the bench
and Figure 14 illustrates the delay time and the blast direction of the bench. The
charge report of the bench is shown in Appendix 3
Figure 13: Bench S1_210_12.

7/17/2019 Swebrec_2013_1_web.pdf
http://slidepdf.com/reader/full/swebrec20131webpdf 31/120
17
Improved blasting results through precise initiation
Figure 14: Delay time and blast direction.
N
7/17/2019 Swebrec_2013_1_web.pdf
http://slidepdf.com/reader/full/swebrec20131webpdf 32/120
18
Improved blasting results through precise initiation
S1_225_11
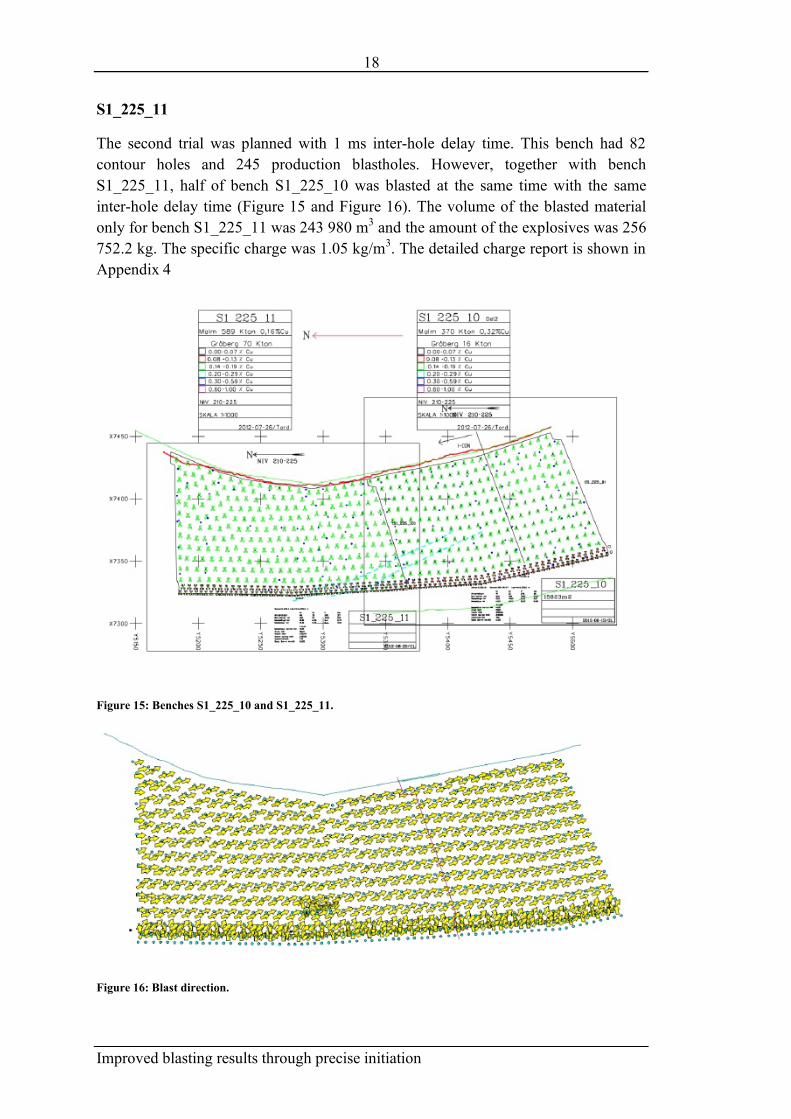
The second trial was planned with 1 ms inter-hole delay time. This bench had 82
contour holes and 245 production blastholes. However, together with bench
S1_225_11, half of bench S1_225_10 was blasted at the same time with the same
inter-hole delay time (Figure 15 and Figure 16). The volume of the blasted material
only for bench S1_225_11 was 243 980 m3 and the amount of the explosives was 256
752.2 kg. The specific charge was 1.05 kg/m3. The detailed charge report is shown in
Appendix 4
Figure 15: Benches S1_225_10 and S1_225_11.
Figure 16: Blast direction.
7/17/2019 Swebrec_2013_1_web.pdf
http://slidepdf.com/reader/full/swebrec20131webpdf 33/120
19
Improved blasting results through precise initiation
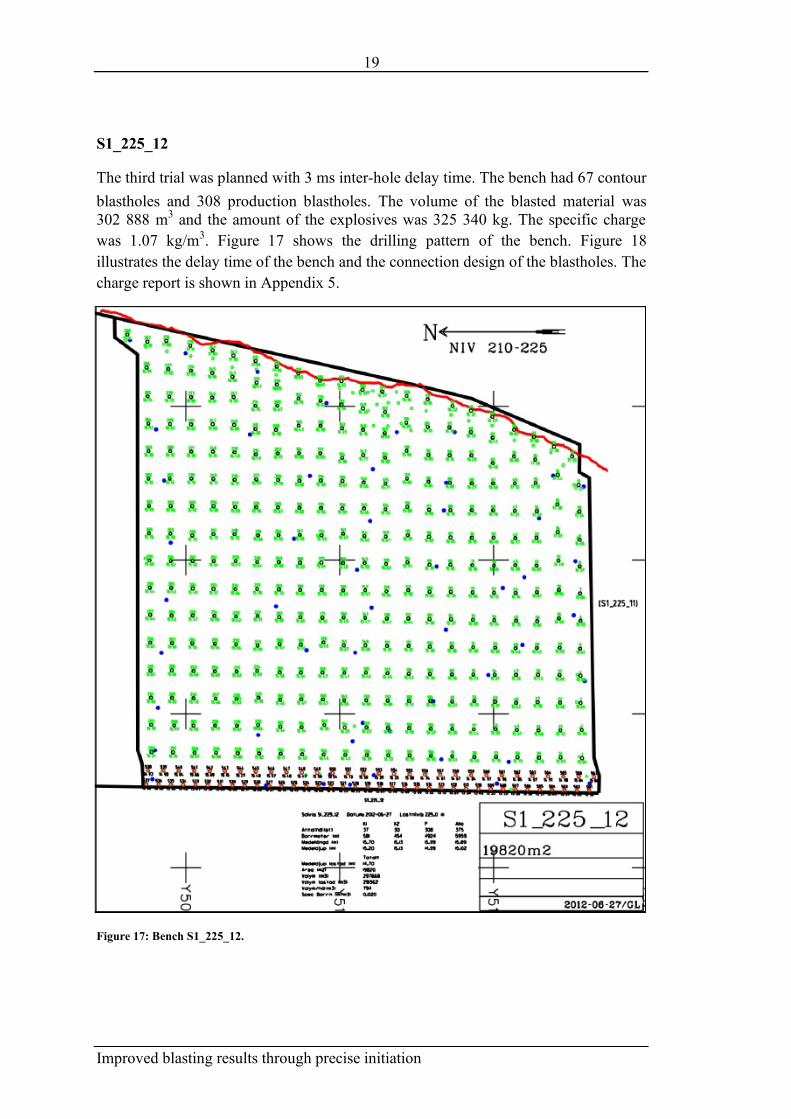
S1_225_12
The third trial was planned with 3 ms inter-hole delay time. The bench had 67 contour
blastholes and 308 production blastholes. The volume of the blasted material was
302 888 m3 and the amount of the explosives was 325 340 kg. The specific charge
was 1.07 kg/m3. Figure 17 shows the drilling pattern of the bench. Figure 18
illustrates the delay time of the bench and the connection design of the blastholes. The
charge report is shown in Appendix 5.
Figure 17: Bench S1_225_12.

7/17/2019 Swebrec_2013_1_web.pdf
http://slidepdf.com/reader/full/swebrec20131webpdf 34/120
20
Improved blasting results through precise initiation
Figure 18: Delay times of bench S1_225_12.
S1_225_13
This is the second reference blast. This bench was blasted with the regular blast
design as used in the mine. The blast design of the bench was 46 ms inter-hole delay
time and 176 ms inter-row delay time. Figure 19 shows the bench and Figure 20
shows the bench with a part of the next bench which was blasted at the same time.
The bench had 56 contour holes and 325 production blastholes. The volume of the
blasted material was 316 073 m3 and the amount of the explosives was 350 779.4 kg.
The specific charge was 1.11 kg/m3. The detailed data are shown in Appendix 6.

7/17/2019 Swebrec_2013_1_web.pdf
http://slidepdf.com/reader/full/swebrec20131webpdf 35/120
21
Improved blasting results through precise initiation
Figure 19: Bench S1_225_13.

7/17/2019 Swebrec_2013_1_web.pdf
http://slidepdf.com/reader/full/swebrec20131webpdf 36/120
22
Improved blasting results through precise initiation
Figure 20: S1_225_13 Nonel system.
S1_225_14
This is the last trial with 1 ms inter-hole delay time. The bench had 47 contour holes
and 301 production blastholes (Figure 21). The volume of the blasted material was
300 631 m3 and the amount of the explosives was 329 629.7 kg. The specific charge
was 1.10 kg/m3. The charge report is shown in Appendix 7

7/17/2019 Swebrec_2013_1_web.pdf
http://slidepdf.com/reader/full/swebrec20131webpdf 37/120
23
Improved blasting results through precise initiation
Figure 21: Bench S1_225_14.

7/17/2019 Swebrec_2013_1_web.pdf
http://slidepdf.com/reader/full/swebrec20131webpdf 38/120
24
Improved blasting results through precise initiation
Design of field campaign2.2.3
Three different zero-trials were conducted before the main trials. Each trial was
evaluated with focus on finding wave characteristics to be used for the decision of
optimum inter-hole delay time. The wave characteristics were determined based on
the wave arrivals from time-separated blastholes with help of Aitik standard
pyrotechnic initiation (Nonel).
The first trial did not produce any useful results and therefore will not be discussed
further in this report. But the other two trials on September 20, 2011 and November
10, 2011 were used for further analysis. For both zero trials, acceleration and Velocity
of Detonation (VoD) were measured for selected production holes. Figure 22 shows a
triaxial accelerometer mounted on a removable steel anchor.
Blast trials in general show the amplitude and dominating frequency for short
distances between blastholes; gauges often reach frequencies and accelerations as
high as 5 kHz and 5000 g respectively. Therefore, accelerometers were chosen based
on experiences from earlier full-scale trials and small-scale trials with similar types of
shock accelerometers. See for example Ouchterlony et al. (2003), Nyberg et al.
(2005), Wimmer et al. (2012), Shirzadegan (2012) and Johansson (2012).
Figure 22: A Triaxial accelerometer (PCB 350B50) mounted on a steel anchor. The orientations of the
positive components are x-vertical upward, y- horizontal to the left and z- horizontal out of the figure with
center blasthole in positive z-direction.
The anchors were grouted with help of about 13 liters of concrete (coarse concrete
Weber Saint-Gobain) in the bottom of 3.5 m deep and ø152 mm vertical boreholes,
which were drilled directly in the hard rock behind the blast. A similar groutingmethod was used earlier to measure wave arrivals behind blast, see Ouchterlony et al.

7/17/2019 Swebrec_2013_1_web.pdf
http://slidepdf.com/reader/full/swebrec20131webpdf 39/120
25
Improved blasting results through precise initiation
(2003). A casing (Ø70 mm PVC pipe) was used in order to mount the gauges,
determine the orientation and prevent water and concrete to get in contact with the
instrument cables. The concrete curing time varied from approximately 2 days for the
first two castings to about 1 week for the third casting (Figure 23).
Figure 23: Schematic illustration of the downhole installation of the accelerometers in a gauge hole.
For all the gauge holes (GH), one vertical and two horizontal components were usedand one of the horizontal ones was pointing at the closest blasthole which was
supposed to generate a useful signal.
In order to get as clear signals as possible, i.e. to avoid interference from many wave
arrivals at the gauge points, three and four production holes for the two zero trials,
respectively, were time separated from the main blasts with approximately 176 ms
interval time.
Figure 24 shows the two gauge holes with local mine coordinates (X, Y, Z) at
approximately 15 m and 25 m, respectively, from the center production hole no 113.
The distances were chosen based on practical issues, not too close to the blast due to

7/17/2019 Swebrec_2013_1_web.pdf
http://slidepdf.com/reader/full/swebrec20131webpdf 40/120
26
Improved blasting results through precise initiation
the risk for back break which would damage the gauge holes and not too far from
blastholes due to wave attenuation, i.e., no realistic wave frequency for blasthole
timing design.
The measurement line connects the gauge holes with the center hole. The center hole,
together with holes 112 and 114, was blasted slightly after the full blast in order to
reduce the noise level from blastholes at long distance. Each of the gauges has 3
components (x, y, z) according to Figure 22.
Figure 24: The layout for zero trial no. 2 (60_1) September 20, 2011. 8.6 m Spacing and 7.0 m Burden.
Figure 25 shows two gauge holes approximately 10 m apart with the closest one
approximately 15 m from the center production hole (256). Four production holes
(255-258) were time delayed with 176 ms compared to the other production holes andthe holes were drilled to about 19 m depth.
Figure 25: Layout for zero trial no 3 (N6-75-13) November 10, 2011. The line connects the center blasthole
with the two gauge holes.
Some of the key technical specifications for the data recording instruments are given
below.
GH 1 GH 2 y
z x vertical
GH 1
GH 2 x vertical
y z
N
N

7/17/2019 Swebrec_2013_1_web.pdf
http://slidepdf.com/reader/full/swebrec20131webpdf 41/120
27
Improved blasting results through precise initiation
Accelerometers
Type: Triaxial ICP shock sensor (PCB 350B50)
Filter: Built in 2nd order low pass filter (-3dB at 20 000 Hz)
Dynamic range: ± 98 km/s
2
Sensitivity: 0.5 mv/g
Frequency Response: ± 1dB for 3 to 10 kHz
Cables
Type: Coaxial cables
Impedance: 50 Ω
Max frequency: 500 MHz
Shielding and inner conductor: Copper
Mantel: PVC
Recorder
Typ: LAAN-XI 3050
Standard frequency range: 51.2 kHz
High frequency range: 102.4 kHz
Actual sampling rate for the trials: 65536 sample/sec/channel
Individual modules
VoD
In order to keep control of the explosive performance, VoDs were measured for a
limited number of production holes.
Recording unit
Micro Trap
Cable: robcable – LR 3.48 ohm/m.
2.3 Data acquisition
Swelling data2.3.1
The GPS data before the blasts had been provided by the mine. The swelling data
have been obtained the next day of the blast by using a Real Time Kinematic GPS
system (RTK). RTK surveying is a carrier phase-based relative positioning technique,
employing two or more receivers simultaneously tracking the same satellites. This
method is very useful because one can determine the coordinates in real time. The
base receiver remains stationary over the known point and is attached to a radio
transmitter. The rover receiver is normally carried in a backpack and is attached to a
radio receiver. The base receiver measurements and coordinates are transmitted to therover receiver through the communication radio link. The initial ambiguity parameters

7/17/2019 Swebrec_2013_1_web.pdf
http://slidepdf.com/reader/full/swebrec20131webpdf 42/120
28
Improved blasting results through precise initiation
are determined almost instantaneously using a technique called on-the-fly ambiguity
resolution. Once the ambiguity parameters are fixed to integer values, the receiver
will display the rover coordinates right in the field. In other words no post-processing
is required. The expected positioning accuracy is of the order of 2 to 5 cm; however,
the accuracy can be improved by staying over the point for a slightly longer period oftime, i.e., 30 seconds, to allow averaging the position (El-Rabbany, 2002).
High speed video filming2.3.2
Every blast has been filmed using a high speed camera. The camera that was used was
a Casio Exilim Pro EX-F1 at 300 fps (frames per second). The camera was installed
perpendicular to the north direction of the benches within the concrete bankers (power
station B6) locating close to the eastern wall of the mine. In all cases, the camera was
activated 15 minutes prior to blast. During the last trial (S1_225_14), a technical
problem occurred causing a delay in the blast of more than 30 minutes. The recordingrange of the camera is about 29 minutes. Hence the blast was out of the recording
range and no video record was obtained.
Images of the trucks for fragmentation analysis2.3.3
A series of images per truck have been taken in order to choose the most appropriate
one giving the best visibility of the material, i.e., without dust or water spray behind
the truck. The resolution of the images is 10 Megapixels (3872x2592) 24 bit depth.
The focus length of the images is 300 mm. The camera settings were without flash
because it created white spots on the images. The selected file type was JPG image.
The camera used was a Nikon D3000 equipped with a Tamron AF 70-300 mm lens.
All the images per blast have been taken from the same shooting point in order to
minimize errors related to changing shooting positions which may cause compatibility
problems between the images per set of them. The error can reach up to 40 %. The
most favorable shooting position is when the back side of the truck body is parallel to
the shooting axis and clearly visible.
All the images have been taken by using a tripod with a height of 1.90 m and the
system was located at a higher point than the truck axis in order to maximize the projected material in the image.
Measuring of the truck body sizes2.3.4
The truck body size was directly measured using a measuring tape because the Aitik
mine does not use the commercial Caterpillar truck bodies, but custom made ones.
The Aitik mine uses three different models of Caterpillar mine trucks (795 F AC
MSD II BODY (347 tons), 793 D X BODY (237 tons) and 793 C (223 tons) (Figure
26 and Table 2). The number of the trucks was not used because the mine ’s workshop
mounts the same truck body on different truck chassis, which means that if thenumber of the truck was taken into consideration the truck body dimensions would

7/17/2019 Swebrec_2013_1_web.pdf
http://slidepdf.com/reader/full/swebrec20131webpdf 43/120
29
Improved blasting results through precise initiation
have been wrong. Hence, the outer shape of the truck body was taken into
consideration to distinguish between the three different truck bodies.
Figure 26: The different truck bodies at the Aitik mine.
1
2
3
3
795 F
793 D
793 C
793 C

7/17/2019 Swebrec_2013_1_web.pdf
http://slidepdf.com/reader/full/swebrec20131webpdf 44/120
30
Improved blasting results through precise initiation
Table 2: The truck body dimensions.
Truck type Outer [m] Inner [m]
795 F AC MSD II BODY 8.73 8.21
793 D X BODY 7.64 7.12
793 C 6.95 6.32
2.4 Drill cuttings
This section briefly describes the use of drill cuttings for analyzing the geology and
mineralogy in Aitik. For each production hole, a representative sample of about 2 kg
was collected. The samples were put in plastic bags and mixed. Each plastic bag was
analyzed 6 times with help of an XRS roentgen analyzer to obtain average values of
minerals. For amounts of copper above 0.5 % the bags were sent to laboratory for
further analyses.
The content of pegmatite was estimated by visual inspection and no exact analysis
was done. If pegmatite was found, the specific production hole was marked on a map.
2.5 Post-test analysis
There are many software packages for fragmentation image analysis such as
SplitDesktop, FragScan, GoldSize, CIAS, IPACS, Fragmetrics, etc. Fragmetrics is an
installed system for evaluation of fragmentation at the Aitik mine. This system isinstalled on a shovel and evaluates the fragmentation per bucket of the shovel.
However, based on the produced results (poor quality images) this system was not
considered reliable enough to carry out the fragmentation analysis. The image
resolution of the taken images by this system was ranged from 240x90 to 441x242
pixels. There were restrictions related to manual delineation, i.e., someone can only
delineate a particle but not erase a line splitting a particle into two or more parts.
The fragmentation has been evaluated by means of image analysis software. The
selected software was SplitDesktop (version 3.1.0.76 64 bit) developed by Split
Engineering LLC, which at this date is the latest version (Split Engineering, 2013).
The image analysis procedure includes importing the image, placement of scales and
setting the degree of delineation. The software requires at least two scales to estimate
fragmentation; hence one scale was located at the bottom of each truck body and one
at the top of it. These scales are usually equal when one uses the internal dimensions
of the truck body, however in some cases the upper part of the truck body is not
visible; the used dimension in this case is the canopy length.
The settings of the software had been defined in the beginning of the image analysis.
The fines factor had been set to 50% in all analyzed images in order to keep this

7/17/2019 Swebrec_2013_1_web.pdf
http://slidepdf.com/reader/full/swebrec20131webpdf 45/120
31
Improved blasting results through precise initiation
sensitive factor constant, e.g., if someone increase the fine factor, the distribution
curve will move to finer area and vice versa. Several users have been involved in the
image analysis, which means that if the fine settings were altered, the evaluation
method would have become subjective. No auto-fines option was used as well as
boulder detection because the given results were not correct. This option masks the background of the image and not the broken material or masks boulders with pour
lighting and/or different color. The only parameter that was changed was the
delineation factor in order to reduce the editing time (Figure 27). This parameter does
not influence the results; the only influence is on the required editing time for manual
delineation.
The auto-delineated images require more analysis because the auto-delineation option
of the software is not accurate enough to produce reliable results, i.e., a detailed
manual delineation was needed for each image.

7/17/2019 Swebrec_2013_1_web.pdf
http://slidepdf.com/reader/full/swebrec20131webpdf 46/120
32
Improved blasting results through precise initiation
Figure 27: Process flow of the image analysis.
Figure 28 shows an image without (a) and with (b) the delineation. The particle sizedistribution is retrieved from the cropped, scaled, auto-delineated and manually
corrected image (Figure 28 b).

7/17/2019 Swebrec_2013_1_web.pdf
http://slidepdf.com/reader/full/swebrec20131webpdf 47/120
33
Improved blasting results through precise initiation
Figure 28: A sample image without (a) and with (b) delineation. The image without delineation (a) has been
cropped and scaled at two positions (thin lines), the delineated image (b) is the result of auto-delineation of
the software followed by detailed manual delineation corrections.
Figure 29 shows a magnified cut-out of the image in Figure 28. The image with auto-delineation does not provide any useful information about the particle size
distribution, since the borders of the particles (blue area) does not isolate particles
properly. Figure 29 b shows the same cut-out after manual correction of the
delineation. The cyan area is masked out to be excluded from the sieving analysis and
the particles are properly isolated by the blue area; the red area represents the fines,
which cannot be delineated due to poor visibility of the small particles.
a
b

7/17/2019 Swebrec_2013_1_web.pdf
http://slidepdf.com/reader/full/swebrec20131webpdf 48/120
34
Improved blasting results through precise initiation
Figure 29: A sample cut-out of an image with auto-delineation only (a) and with manually corrected
delineation (b).
The sieving series have been defined with respect to minimum fragment size, which
has been set to 4.00 mm. The upper limit has been free to reach the size of the biggest
estimated particle. The same sieving series has been used for the entire image
analysis.
2.6 Software evaluation
At the beginning of the image/fragmentation analysis some errors occurred among the
analyses by different users. Hence, these errors should be identified in order to
minimize them and to produce reliable results. Consequently, different kind of
evaluations of the software have been carried out, such as (i) consistency of the
software, i.e., if the software produces the same results for the same analyzing
conditions, (ii) issues related to lighting conditions, i.e., the influence of the shadows
or the different color areas on a truck body, (iii) internal image resolution and (iv)
relative error among different users, i.e., delineation quality.
Internal resolution2.6.1
The term internal means that the original image has a particular resolution, in this case10 Megapixels (3872x2592 pixels), and it was imported into the software by
automatically scaling down the resolution of the image. The software has this function
in order to decrease the processing time of an image. Some of the images have been
analyzed by using 2 Megapixels internal resolution and others with 10 Megapixels
resolution (original size). The software has been evaluated for different internal
resolutions. This factor varies from 2 Megapixels up to 10 Megapixels. As the
resolution increases, the computational time increases as well. Sometimes the
software by default sets the internal resolution to 2 Megapixels without any
notification.
a b

7/17/2019 Swebrec_2013_1_web.pdf
http://slidepdf.com/reader/full/swebrec20131webpdf 49/120
35
Improved blasting results through precise initiation
For this evaluation one image has been used and analyzed at ten different resolutions
by the same user, i.e., the user dependency was removed. Figure 31 shows the
variation of the dimensions of the scales with respect to the internal resolution. The
different internal resolutions have been fitted by using power regression, which fits
quite well.
Figure 30 shows the position of the scales in the truck body the scale at the upper part
of the image is called top scale and the lower one is called bottom scale
Figure 30: The scale positions.
Figure 31: Resolution analysis.
The results of the internal resolution analysis are shown in Figure 32. The analysis for
each image is presented in Appendix 8.
y = 82.799x0.4966
R² = 0.9996
y = 75.726x0.4957
R² = 0.9997
0
50
100
150
200
250
300
0 2 4 6 8 10 12
S c a l e d i m e n s i o n ,
[ p i x / m ]
Megapixels
Resolution analysis
Top Scale
Bottom Scale

7/17/2019 Swebrec_2013_1_web.pdf
http://slidepdf.com/reader/full/swebrec20131webpdf 50/120
36
Improved blasting results through precise initiation
Figure 32: Fragmentation curves with different resolutions.
Based upon Figure 32, the internal resolution does not have any influence on theresults, even if the resolution of the scale changes (pix/m) according to Figure 31.
Relative error among the users2.6.2
The error analysis has been carried out on 6 randomly selected images which have
been analyzed by all the users. The relative error, i.e., the error between different
users, was found to be large (up to 30%) (Figure 33). The relative error among the
users was minimized down to 1 %, i.e., a few millimeters, by detailed manual
delineation of the images by only one user. This size is smaller than the cut-off value
of the distribution curve. Table 3 shows the absolute error in percentage between theusers, which can be considered rather high. The results showed that the error is larger
in the mid-section of the distribution curve than the coarse region of it.

7/17/2019 Swebrec_2013_1_web.pdf
http://slidepdf.com/reader/full/swebrec20131webpdf 51/120
37
Improved blasting results through precise initiation
Table 3: The relative error among different users.
X50 X60 X70 X80 X90
User 1 vs. User 2
24.73 12.92 7.07 2.09 3.82
33.46 15.18 8.63 6.59 6.79
25.10 12.93 3.48 4.15 12.02
8.13 1.06 0.49 0.41 0.37
User 2 vs. User 3
1.03 0.59 1.91 3.22 5.51
1.10 0.67 0.05 2.38 3.11
11.00 6.98 4.21 0.65 3.04
22.33 19.24 16.55 14.27 12.56
User 1 vs. User 3
23.94 13.43 8.81 5.15 1.60
32.72 15.74 8.59 4.30 3.79
15.84 6.39 0.76 4.83 8.72
24.90 17.02 13.78 12.13 10.83
User 1 vs. User 2
10.99 0.89 2.65 0.05 10.56
22.97 5.27 3.76 8.13 8.30
10.47 7.49 6.51 6.09 6.23
Figure 33 illustrates the fragment distribution curves of the users visualizing the error
along the entire curve.

7/17/2019 Swebrec_2013_1_web.pdf
http://slidepdf.com/reader/full/swebrec20131webpdf 52/120
38
Improved blasting results through precise initiation
Figure 33: The difference among different users.
Delineation error2.6.3
The images have been analyzed by the same user and they show the same type of
truck (equal dimensions of the truck body). Two images are presented in Table 4 to
show the difference in the delineation quality. This is the most crucial factor for
obtaining reliable results. The image on the right is not a corrected image, which
means that several particles are covered by the delineation (blue area) or a single
particle is split into smaller particles. This is a result of different color of the particle
due to different material or lighting conditions (shadow); generally the darker areas of
a particle were covered 100 % by the delineation. The cyan area is used in order to
mask the background of the image and the visible truck body. Neither of the areas isconsidered in the analysis by the software.
The introduced error by these blue areas was too large to be acceptable. Further
processing of the images was required to reach an acceptable delineation level. All the
analyzed images have been delineated by one user. The level of delineation almost
reached the delineation of each visible individual particle.

7/17/2019 Swebrec_2013_1_web.pdf
http://slidepdf.com/reader/full/swebrec20131webpdf 53/120
39
Improved blasting results through precise initiation
Table 4: Delineation error.
Corrected By User
DSC_0351
% Passing Size[mm]
F10 39
F20 105F30 186
F40 305
F50 392
F60 472
F70 560
F80 663
F90 830
Topsize
(99.95%) 1319
DSC_0351
% Passing Size[mm]
F10 29
F20 85F30 160
F40 265
F50 358
F60 444
F70 537
F80 642
F90 793
Topsize
(99.95%) 1229
Variation of the images2.6.4
The images of each truck show a large range of sizes and their fragmentation analysis
varies a lot. This is due to the fact that some of the trucks had mainly big boulders and
other trucks had mostly fine material. This difference is shown in Table 5, where the
left truck contains mostly boulders and coarse material and the right truck having
more fine material.

7/17/2019 Swebrec_2013_1_web.pdf
http://slidepdf.com/reader/full/swebrec20131webpdf 54/120
40
Improved blasting results through precise initiation
The selection of the images has been arbitrarily done to minimize the influence of the
user selecting the images, i.e., to avoid choosing only images with fine material or
boulders. No criteria have been used regarding the image selection. Each folder with
images contained two subfolders such as morning and afternoon images. There were
at least two days of photo shooting per bench. The images were randomly distributedamong the users.
Table 5: Difference between different trucks.
DSC_0147
% Passing Size[mm]
F10 40
F20 119
F30 264
F40 414
F50 532F60 646
F70 774
F80 934
F90 1212
Topsize
(99.95%) 1569
DSC_0162
% Passing Size[mm]
F10 3
F20 15
F30 36
F40 67
F50 108F60 161
F70 213
F80 269
F90 353
Topsize
(99.95%) 678

7/17/2019 Swebrec_2013_1_web.pdf
http://slidepdf.com/reader/full/swebrec20131webpdf 55/120
41
Improved blasting results through precise initiation
Compatibility of the images2.6.5
The images from the first two benches (S1_210_11 and S1_210_12) have had
compatibility problems with respect to the rest of the benches. The images of these
benches have been taken at a different angle than the truck axis. Hence, there is adeviation on the results because the projection of the scales on a 2D-plane does not
correspond to the actual size of the real dimensions of the truck body. One attempt has
been made to correct this deviation of the image analysis by delineating the side and
the back side of some trucks. A total of 3 pairs of images have been analyzed to
estimate the deviation of the two sides of the truck (Appendix 9). Table 6 shows an
example of the two different perspectives of the same truck; the difference between
the two images is obvious.
However, this is very arbitrary because there are other sources of error in this case,
such as the projected area on the image, i.e., as the optical axis of the camera startsdeviating from the truck axis, the camera can take images of different perspectives of
the truck body. This means that the material is not the same at the side of a truck as
the back side of a truck e.g. for a flaky particle, one can see the largest surface of it at
the side of the truck but at the back side of it one can see the smallest projected area.
Table 6: The difference in fragmentation between two perspectives.
DSC_0331 DSC_0339

7/17/2019 Swebrec_2013_1_web.pdf
http://slidepdf.com/reader/full/swebrec20131webpdf 56/120
42
Improved blasting results through precise initiation
The images taken by the side of the trucks give an overestimation of the
fragmentation, i.e., coarser material. This has been observed in all the comparisons
between the images. The difference of the curves is not constant but it changes by
changing the mass passing.
The fragmentation analysis has been carried out based on three values, the median
size (x50) and the oversize material (x80) and the top size (x99.95). The other fractions of
the distribution have not been considered such as the fine part of the distribution
which is given by fitting a model.
In order to make the fragmentation curves of these images comparable to the results
of the other benches, the curves have been normalized. Since the analysis of the
images from the side of the trucks always resulted in coarser fragmentation, the
curves could be corrected by applying a correction factor, which shifted the curves
towards the right side of the graph (finer fragmentation). Three pairs of images oftrucks have been used to normalize the curves, each pair consisted of one image from
the side of a truck and an image from the backside of the same truck. Hence the
fragmentation curves of benches S1_210_11 and S1_210_12 are compared to the rest
of the benches by their normalized curves.

7/17/2019 Swebrec_2013_1_web.pdf
http://slidepdf.com/reader/full/swebrec20131webpdf 57/120
43
Improved blasting results through precise initiation
3 Results
3.1 Geological and structural data
This section provides a qualitative assessment of photos taken on the wall above thetrials of March 28: S1_210_12, July 26: S1_225_11, August 28: S1_225_12 and
September 12: S1_225_14 and geological data of the content of pegmatite in drill
cuttings.
Figure 34 shows the geology of trial S1_210_12 consisting essentially of muscovite
schist and Figure 35 shows the geology of S1_225_11 to S1_225_14 with a mixture
of muscovite schist, biotite schist and biotite gneiss, which is considered to affect the
blast results quite similarly. Pegmatite occurs sparingly in there blasts.
Figure 34: Trial blast S1_210_12 with mostly muscovite schist (yellow).
In Figure 35, blast S1_225_13 has been used as second reference because it was in the
same geological area. The bench was blasted with the regular blast design in the mine
(42 ms inter-hole delay time and 176 ms inter-row delay time).
Muscovite shist
Biotite schist
Biotite gneiss
Amphibolite
HB foliated gneiss
Pegmatite
Amphibolite- biotite gneiss
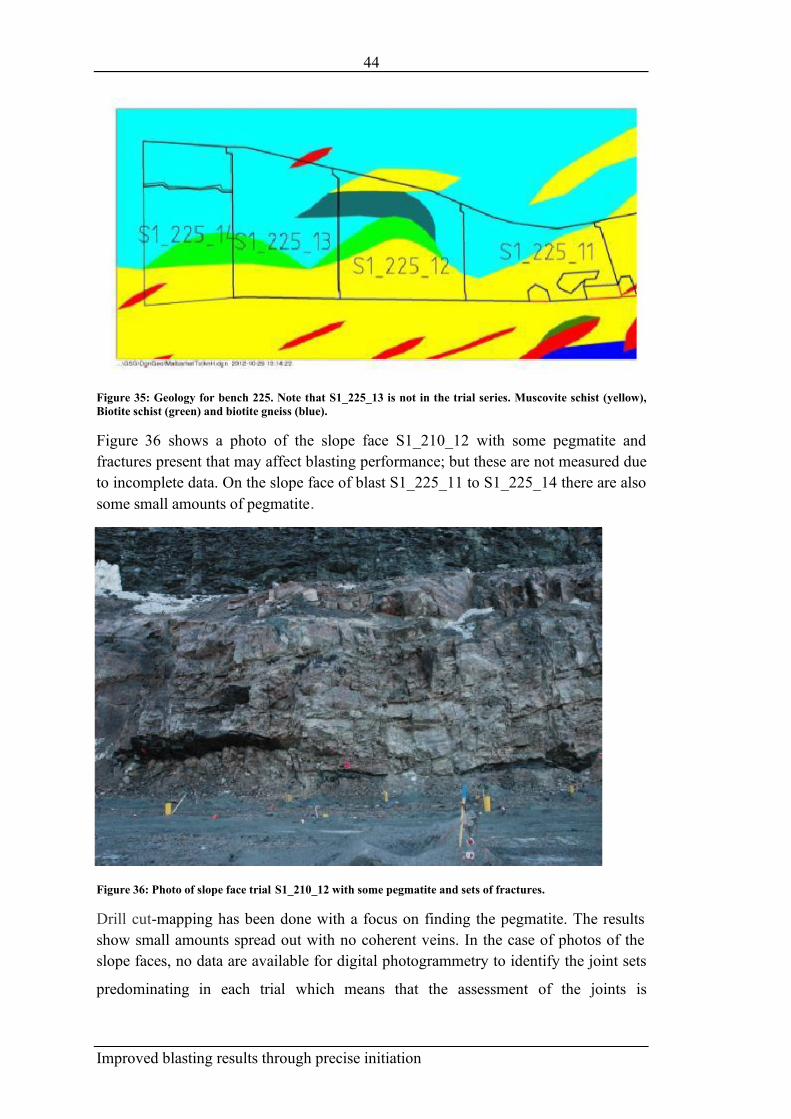
7/17/2019 Swebrec_2013_1_web.pdf
http://slidepdf.com/reader/full/swebrec20131webpdf 58/120
44
Improved blasting results through precise initiation
Figure 35: Geology for bench 225. Note that S1_225_13 is not in the trial series. Muscovite schist (yellow),
Biotite schist (green) and biotite gneiss (blue).
Figure 36 shows a photo of the slope face S1_210_12 with some pegmatite and
fractures present that may affect blasting performance; but these are not measured due
to incomplete data. On the slope face of blast S1_225_11 to S1_225_14 there are also
some small amounts of pegmatite.
Figure 36: Photo of slope face trial S1_210_12 with some pegmatite and sets of fractures.
Drill cut-mapping has been done with a focus on finding the pegmatite. The results
show small amounts spread out with no coherent veins. In the case of photos of the
slope faces, no data are available for digital photogrammetry to identify the joint sets
predominating in each trial which means that the assessment of the joints is

7/17/2019 Swebrec_2013_1_web.pdf
http://slidepdf.com/reader/full/swebrec20131webpdf 59/120
45
Improved blasting results through precise initiation
qualitative. The results show presence of some pegmatite, but the dip and partly
unknown orientation makes it difficult to assess the amount of pegmatite from photos.
The main results from interpretation of geological drill cuttings from the trials of
March 28: S1_210_12, July 26: S1_225_11, August 28: S1_225_12 (Höglund, 2012)
and images indicate that there are only a few holes with cuttings containing pegmatite
and some pegmatite veins running out of the faces.
Figure 37 shows the result for blast S1_225_14 with visual inspection of drill cuttings
and the red dots indicating that pegmatite was found for the specific production holes.
The results from the other trials have less findings of pegmatite.
Figure 37: Example of results from collecting of drill cuttings. The red dots indicate pegmatite in numbered
production holes based on visual inspection of material in plastic bags.
From a geological assessment, all the pegmatite veins have ore concentrations,
suggesting that they are quite narrow; metals are mobilized along the contact between
the veins and the surrounding rock and if the veins are wider they usually have no ore
concentration in the vein center .

7/17/2019 Swebrec_2013_1_web.pdf
http://slidepdf.com/reader/full/swebrec20131webpdf 60/120
46
Improved blasting results through precise initiation
3.2 Zero trials
This section presents results from triaxial acceleration recordings for two zero trials
with gauges at approximately 15-25 m distance from selected and time-separated
blastholes. Additionally, the section shows some results from monitoring of the VoDfor a limited number of production blastholes that were loaded with the same
explosives and approximately the same amount as the selected ones. Zero trial
number 1 did not produce any useful results but for trials no. 2 and 3 useful data were
acquired from three and five blastholes respectively.
Figure 38 shows examples of acceleration recordings (m/s2) vs. time (s) from trial no.
2 (the upper diagram) and trial no. 3 (the lower diagram). The recordings covered 10 s
and 3 s of tri-axial data for trials no. 2 and no. 3 respectively. The vertical (x)
component is strongly distorted for trial no. 2, i.e., both zero line offset and probably
cable connection problems. The problem of zero line offset occurs when the signalfrom an accelerometer does not level out at zero line but shows a residual
acceleration. At about 4 seconds, the time-separated blastholes seem to detonate
which is shown as 3 strong arrivals. The time interval is nominal 176 ms between the
holes but in reality slightly different due to pyrotechnic cap scatter.
For trial no. 3, all signals are recorded with normal noise level and no distortion. The
time-separated holes are shown to the right but there is a gap between the two latest
clear arrivals (about 250 ms time difference) and a weak arrival at about 176 ms
before the last one.
The amplitudes for the two recordings are strongly different probably due to scaling
error and the amplitudes in general are low (see Figure 23, Ouchterlony et.al., 1997)
in comparison with earlier recordings in the Aitik mine.

7/17/2019 Swebrec_2013_1_web.pdf
http://slidepdf.com/reader/full/swebrec20131webpdf 61/120
47
Improved blasting results through precise initiation
Figure 38: Recording of triaxial signals from gauge hole at about 15 m from the center blasthole. Upper one
is from trial no. 2 (September 20, 2011) and the lower one from trial no. 3 (November 10, 2011).
In order to get the most representative wave for estimating the wave characteristics,
only blastholes close to gauges are used, i.e., holes at approximately 15 m and 25 m
away from the closest center blasthole. In practice, the three latest arrivals in the
upper figure and the 5 latest arrivals in the lower figure are used. The figures also
show the normal amplitude dependence with distance, i.e., the amplitudes increase
with decreasing distance from the blasthole.
Figure 39 (right figure) shows the vertical x-component for gauge no. 1 for the last blasthole in Figure 39 (left figure), (18.5 m distance to wave generating blasthole) and
the signal power density spectrum, i.e., how the power of a signal or time series is
distributed with the frequency. The time period T is approximately 8.9 ms, i.e., 1/T=
112 Hz which is the principal frequency for the signal. The Fast Fourier Transform
(FFT) of the same signal has a dominating frequency of about 104 Hz and a frequency
resolution of 8 Hz. Note that often the FFT does not have a clear peak and therefore
not coinciding with the frequency based on time period T from zero-crossing time
interval in time domain. The sampling rate for the time signal is 65 536
samples/second which is strongly over-sampled due to expected high signal
frequencies up to 4 kHz for gauges close to blastholes.
A c c e l e r a t i o n m / s 2
A c c e l e r a t i o n m / s 2
Time s
Time s

7/17/2019 Swebrec_2013_1_web.pdf
http://slidepdf.com/reader/full/swebrec20131webpdf 62/120
48
Improved blasting results through precise initiation
Figure 39: To the left the x-component of the time signal at 2.41 s and to the right Power Spectral Density
(PSD) of the time signal for trial no. 3 (November 10, 2011). Note that the x-component is vertical.
Table 7 shows the results from evaluation of n=4 values for trial no. 2 and n=21
values for trial no. 3 for gauge holes GH 1 and GH 2, see example in Figure 39. The
positive phase is often shorter than the negative phase, and therefore the period T is
often greater than two times the positive phase 2δt. Similar result has been found by
Yang (2012), i.e., the principal frequency and the frequency calculated by FFT is
often not the same.
As a special case the horizontal z-component for trial no. 3 (GH 1) has a first strong
negative phase and a relative long positive phase. The negative sign is probably due to
orientation of the gauge, i.e., rotated a half turn but the reason for the long positive
phase is not clear.
Table 7: Time periods and frequency for the signals at approximately 15 and 25 m from the center blasthole
for trial no. 2 (September 20, 2011) and trial no. 3 (November 10, 2011).
Positive
Phase δt
ms
Period T
ms
2· δt
ms
1/T
Hz
Power Spectral
Density
Hz
Average trial 2 3.8 7.0 7.6 154 110
Standard
deviation trial 20.5 1.4 35 75
Average trial 3 2.6 6.6 5.2 285 210
Standard
deviation trial 31.3 6.1 209 99

7/17/2019 Swebrec_2013_1_web.pdf
http://slidepdf.com/reader/full/swebrec20131webpdf 63/120
49
Improved blasting results through precise initiation
3.3 Fragmentation
Bench S1_210_113.3.1
Bench S1_210_11 is the first reference bench of the trials with a total number of 25images analyzed. The images of the reference bench have been taken from the side of
the trucks. This means that the truck axis and the optical axis are not the same, and
have a difference of a particular angle. This angle is different from truck to truck or
from image to image. This bench has been used as a reference bench only for the first
short delay bench (S1_210_12, 6 ms). All the analyzed images are shown in
Appendix 10. Table 8 shows the results of the image analysis.
Table 8: Fragmentation results of bench S1_210_11 and the results every 10 % of the passing mass.
S1_210_11
Size[mm] % Passing
4000 100.0
2000 99.0
1000 88.2
750 79.0
500 61.2
250 38.9
125 26.7
88 21.8
63 18.0
44 14.7
31 12.0
22 9.9
16 8.3
11 6.7
7.8 5.5
5.5 4.6
4.0 3.8
S1_210_11
% Passing Size[mm]
F10 22
F20 75
F30 152
F40 263
F50 378
F60 485
F70 604
F80 768
F90 1093Topsize
(99.95%)2377
Figure 40 shows the fragment size distributions of the entire series of the images of
bench S1_210_11. The scatter of the distribution is rather large. Two potential
explanations can be given, firstly that the scatter is due to photographing the sides and
secondly, due to the blasted material. The histograms (Figure 41) show the frequency
of the appearance of the different material sizes. Moreover, it shows that there is a
high amount of material with fragment sizes greater than 1000 mm.
The histograms with the same sieving series were very coarse and large amounts of
particles with different sizes were hidden due to the low resolution. One solution to
that was to increase the resolution of the sieving series, i.e., to create shorter regionsof the particle sizes.

7/17/2019 Swebrec_2013_1_web.pdf
http://slidepdf.com/reader/full/swebrec20131webpdf 64/120
50
Improved blasting results through precise initiation
The 3-term Swebrec function has been used to fit the data (Ouchterlony, 2005):
(1)
Where, xmax is the maximum fragment size, x50 is the median fragment size and b is
an undulation parameter. The fitting parameters are presented in Table 9.
Table 9: The Swebrec function fitting parameters
Min Start Max
b 1.1 2 10
xmax/x50 1.1 5 50
xmax 5.0 4000 5000
The quality of the fit of the Swebrec function is based on the determination coefficient
(r 2) which is equal to 0.99 in all the cases (Figure 42).
Based on the analysis, the fragmentation of the first reference bench (S1_210_11)
contains fragments larger than 2491 mm (x80), see Figure 43.
Figure 40: Fragmentation curves of S1_210_11.

7/17/2019 Swebrec_2013_1_web.pdf
http://slidepdf.com/reader/full/swebrec20131webpdf 65/120
51
Improved blasting results through precise initiation
Figure 41: The size distribution histogram of the material.
Figure 42: The final cumulative curve of the fragmentation of S1_210_11 by the Swebrec function.

7/17/2019 Swebrec_2013_1_web.pdf
http://slidepdf.com/reader/full/swebrec20131webpdf 66/120
52
Improved blasting results through precise initiation
Figure 43: Scatter of x50 and x80 of the passing mass.
Bench S1_210_123.3.2
This was the first bench with short delay time and was blasted on March 28, 2012
using electronic detonators with 6 ms delay time between the holes (176 ms inter-row
delay). It was blasted under semi-confined conditions, which means that there was
material in front of the burden of the bench (Figure 44).
Figure 44: Bench S1_210_12
3.3.2.1 VoD measurements
In this bench some VoD measurements have been conducted (Figure 45) from the
first three holes. The average VoD is 5562 ± 95 ms/s.
S1_210_12S1_210_11
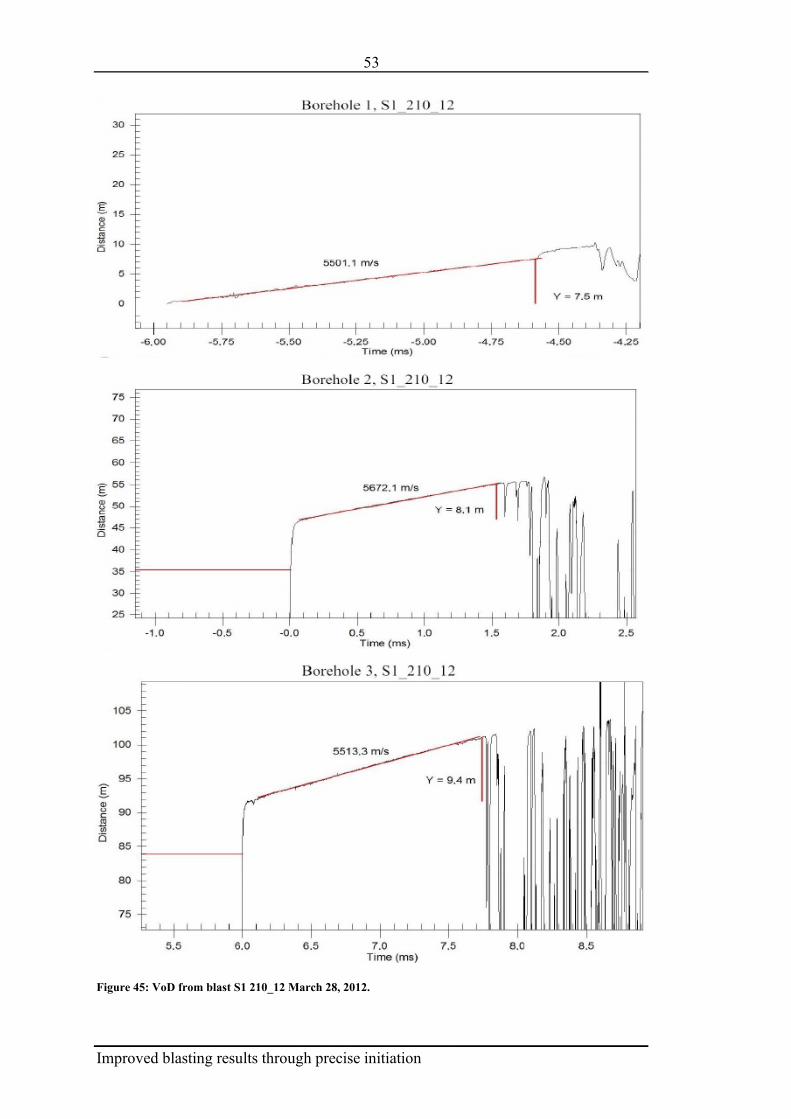
7/17/2019 Swebrec_2013_1_web.pdf
http://slidepdf.com/reader/full/swebrec20131webpdf 67/120
53
Improved blasting results through precise initiation
Figure 45: VoD from blast S1 210_12 March 28, 2012.

7/17/2019 Swebrec_2013_1_web.pdf
http://slidepdf.com/reader/full/swebrec20131webpdf 68/120
54
Improved blasting results through precise initiation
Figure 46 shows the actual inter-hole delay time and the deviation from the designed
inter-hole delay time. The results are from the same blastholes as in Figure 45. One
can see that the actual delay time is very close the designed time.
Figure 46: Measured of the inter-hole delay time.

7/17/2019 Swebrec_2013_1_web.pdf
http://slidepdf.com/reader/full/swebrec20131webpdf 69/120
55
Improved blasting results through precise initiation
3.3.2.2 Fragmentation
The fragmentation of the bench is shown in Table 10. The analysis was carried out
based on 49 images. The analyzed images are shown in Appendix 11.
Table 10: Fragmentation results of S1_210_12 and the results every 10 % of the passing mass.
S1_210_12
Size[mm] % Passing
4000 99.9
2000 99.0
1000 83.9
750 73.3
500 58.2
250 36.3
125 22.988 18.0
63 14.4
44 11.3
31 8.9
22 7.1
16 5.7
11 4.4
7.8 3.5
5.5 2.84 2.3
S1_210_12
% Passing Size[mm]
F10 36
F20 102
F30 185
F40 288
F50 396
F60 524
F70 684F80 892
F90 1212
Topsize
(99.95%)2483

7/17/2019 Swebrec_2013_1_web.pdf
http://slidepdf.com/reader/full/swebrec20131webpdf 70/120
56
Improved blasting results through precise initiation
Figure 47: Fragmentation curves of S1_210_12.
The variation of the fragment distribution curves and the histograms (Figure 47 andFigure 48) is larger than that of bench S1_210_11. The oversize material is of the
same magnitude as the first reference bench. However, bench S1_210_12 produced
coarser material in terms of boulders.

7/17/2019 Swebrec_2013_1_web.pdf
http://slidepdf.com/reader/full/swebrec20131webpdf 71/120
57
Improved blasting results through precise initiation
Figure 48: The size distribution histogram of the material.
The Swebrec function has been used to fit the data of the image analysis (Figure 49) and the fit is quite good (r 2 = 0.999).
The results showed a few outliers up to 1820 mm for the median fragment size (x 50)
and up to 2976 mm for x80 (Figure 50), which is significantly larger than that of bench
S1_210_11. Additionally, bench S1_210_12 gave several outliers for both x50 and x80.
This trial indicates marginal effects on the fragmentation compared to the reference
test. Though, the results of this bench have been normalized (section 2.6.5) with the
results from the rest of the benches due to different shooting angle.

7/17/2019 Swebrec_2013_1_web.pdf
http://slidepdf.com/reader/full/swebrec20131webpdf 72/120
58
Improved blasting results through precise initiation
Figure 49: The final cumulative curve of the fragmentation of S1_210_12 by the Swebrec function.
Figure 50: Scatter of x50 and x80 of the passing mass.

7/17/2019 Swebrec_2013_1_web.pdf
http://slidepdf.com/reader/full/swebrec20131webpdf 73/120
59
Improved blasting results through precise initiation
Bench S1_225_113.3.3
Bench S1_225_11 was blasted on July 26, 2012. It was blasted under free face
conditions since all the material from bench S1_225_10 had been removed (Figure
51). This was the second bench of the trials and was designed to have 1 ms inter-holedelay time by using electronic detonators. This was the only free-face blasted bench.
Figure 51: Bench S1_225_11.
The fragmentation analysis has been carried out based on 40 images. The images were
taken from the backside of the trucks and the fragmentation is as follows (Table 11).
The analyzed images are shown in Appendix 12.
Table 11: Fragmentation results of S1_225_11 and the results every 10 % of the passing mass.
S1_225_11Size[mm] % Passing
2000 100.0
1000 97.2
750 87.5
500 66.8
250 39.8
125 26.0
88 20.6
63 16.5
44 13.0
31 10.3
22 8.3
16 6.7
11 5.3
7.8 4.2
5.5 3.4
4.0 2.7
S1_225_11% Passing Size[mm]
F10 29
F20 83
F30 155
F40 251
F50 344
F60 436
F70 532
F80 644
F90 792
Topsize (99.95%) 1456
S1_210_12S1_210_11

7/17/2019 Swebrec_2013_1_web.pdf
http://slidepdf.com/reader/full/swebrec20131webpdf 74/120
60
Improved blasting results through precise initiation
The variation of the fragment distribution curves is narrower than the previous two
benches. This can be explained by the shooting angle of the photos, which was
constant in this case. Moreover, there are less boulders than the previous bench as
shown in Figure 53. The percentage of the material exceeding 1000 mm is also
smaller compared to Figure 48.
Figure 52: Fragmentation curves of S1_225_11.
Figure 53 shows a concentration of the particle sizes in the middle region of the graph
between 100 and 1000 mm with a tendency for the coarser region.
The Swebrec function also gives very good fit (r 2=0.998) in this case (Figure 54).
The scatter of the data is limited with one outlier in the median particle size (x50)
(Figure 55), 80 % of the material does not exceed the value of 934 mm.

7/17/2019 Swebrec_2013_1_web.pdf
http://slidepdf.com/reader/full/swebrec20131webpdf 75/120
61
Improved blasting results through precise initiation
Figure 53: The size distribution histogram of the material.
Figure 54: The final cumulative curve of the fragmentation of S1_225_11 by the Swebrec function.

7/17/2019 Swebrec_2013_1_web.pdf
http://slidepdf.com/reader/full/swebrec20131webpdf 76/120
62
Improved blasting results through precise initiation
Figure 55: Scatter of x50 and x80 of the passing mass.
Bench S1_225_123.3.4
Bench S1_225_12 was blasted on August 28, 2012. It was blasted under confined
conditions as a small part of bench S1_225_11 had been left (Figure 56). The third
bench was designed with 3 ms inter-hole delay time using electronic detonators.
Figure 56: Bench S1_225_12.
Totally 40 images have been analyzed to estimate the fragmentation. The shooting
direction of the images was from the backside of the trucks. The fragmentation
S1_225_12
S1_225_11

7/17/2019 Swebrec_2013_1_web.pdf
http://slidepdf.com/reader/full/swebrec20131webpdf 77/120
63
Improved blasting results through precise initiation
analysis is presented in Table 12. The complete image analysis is shown in Appendix
13.
Table 12: Fragmentation results of S1_225_12 and the results every 10 % of the passing mass.
S1_225_12Size[mm] % Passing
2000 100.0
1000 98.2
750 93.9
500 82.0
250 54.2
125 35.5
88 28.8
63 23.644 19.1
31 15.6
22 12.8
16 10.7
11 8.6
7.8 7.1
5.5 5.9
4.0 4.9
S1_225_12% Passing Size[mm]
F10 14
F20 47
F30 94
F40 152
F50 220
F60 291
F70 371
F80 474F90 634
Topsize(99.95%)
1319
The variation of the material is even narrower for this bench than bench S1_225_11
(Figure 57). The amount of boulders is smaller compared to the previous benches.
Figure 58 shows the histograms of all the analyzed trucks.
The Swebrec function gives a quite good fit (r 2=0.999) as well in this case (Figure
59).
The scatter is shown to be smaller for this bench compared to bench S1_225_11
(Figure 60).

7/17/2019 Swebrec_2013_1_web.pdf
http://slidepdf.com/reader/full/swebrec20131webpdf 78/120
64
Improved blasting results through precise initiation
Figure 57: The fragment size distribution of S1_225_12.
Figure 58: The size distribution histogram of the material.

7/17/2019 Swebrec_2013_1_web.pdf
http://slidepdf.com/reader/full/swebrec20131webpdf 79/120
65
Improved blasting results through precise initiation
Figure 59: The final cumulative curve of the fragmentation of S1_225_12 by the Swebrec function.
Figure 60: Scatter of x50 and x80 of the passing mass.

7/17/2019 Swebrec_2013_1_web.pdf
http://slidepdf.com/reader/full/swebrec20131webpdf 80/120
66
Improved blasting results through precise initiation
Bench S1_225_133.3.5
This is the second reference bench since the blast design was the same as the regular
one used in the mine. This bench was blasted at the same time on August 28, 2012 as
bench S1_225_12 and under confined conditions (Figure 61).
Figure 61: Bench S1_225_13.
Totally 40 images have been analyzed to carry out the fragmentation analysis. The
results of the analysis are presented in Table 13. The analyzed images are shown in
Appendix 14.
Table 13: Fragmentation results of S1_225_13 and the results every 10 % of the passing mass.
S1_225_13
Size[mm] % Passing
2000 100.0
1000 95.5750 89.9
500 77.7
250 50.8
125 33.0
88 26.5
63 21.6
44 17.4
31 14.1
22 11.516 9.5
11 7.6
7.8 6.3
5.5 5.1
4.0 4.3
S1_225_13
% Passing Size[mm]
F10 17
F20 55F30 107
F40 171
F50 244
F60 319
F70 407
F80 532
F90 751
Topsize
(99.95%)
1776
S1_225_12
S1_225_13

7/17/2019 Swebrec_2013_1_web.pdf
http://slidepdf.com/reader/full/swebrec20131webpdf 81/120
67
Improved blasting results through precise initiation
Figure 62 shows the distributions of all the analyzed images and Figure 63 portrays
the histograms of all the images. Only two images show a significant amount of
boulders, the same is pointed in Figure 65 as well by the outliers at x80 values. The
combined distribution curve is shown in Figure 64 and it is fitted by the Swebrec
function.
Figure 62: The fragment size distribution of S1_225_13.

7/17/2019 Swebrec_2013_1_web.pdf
http://slidepdf.com/reader/full/swebrec20131webpdf 82/120
68
Improved blasting results through precise initiation
Figure 63: The size distribution histogram of the material.
Figure 64: The final cumulative curve of the fragmentation of S1_225_13 by the Swebrec function.

7/17/2019 Swebrec_2013_1_web.pdf
http://slidepdf.com/reader/full/swebrec20131webpdf 83/120
69
Improved blasting results through precise initiation
Figure 65: Scatter of x50 and x80 of the passing mass.
Bench S1_225_143.3.6
Bench S1_225_14 was comparatively small and blasted together with bench
S1_225_15. It was blasted under confined conditions since material from bench
S1_225_13 was lying in front of the burden (Figure 66). The tested inter-hole delay
time was set to be 1 ms again by using electronic detonators. This bench was blasted
on September 12, 2012. In this report only the fragmentation of bench S1_225_14 has
been analyzed.
Figure 66: Bench S1_225_14.
The fragmentation analysis is based upon 40 images. The results are shown in Table
14. The analysis of the images is presented in Appendix 15.
S1_225_14S1_225_15
S1_225_13

7/17/2019 Swebrec_2013_1_web.pdf
http://slidepdf.com/reader/full/swebrec20131webpdf 84/120
70
Improved blasting results through precise initiation
Table 14: Fragmentation results of S1_225_14 and the results every 10 % of the passing mass.
S1_225_14
Size[mm] % Passing
2000 100.0
1000 96.6
750 89.3
500 74.2
250 47.9
125 32.3
88 26.2
63 21.6
44 17.5
31 14.4
22 11.9
16 10.0
11 8.1
7.8 6.8
5.5 5.6
4.0 4.8
S1_225_14
% Passing Size[mm]
F10 15
F20 55
F30 110
F40 183
F50 266
F60 352
F70 451
F80 577
F90 765
Topsize
(99.95%)
1438
Figure 67 illustrates the fragment distribution curves of all the images analyzed for
bench S1_225_14. The histogram (Figure 68) shows that the material size
concentration is closer to 100 mm. The Swebrec function fits the data quite well
(r 2=0.999), see Figure 69. The scatter in this case is larger than bench S1_225_13
(Figure 70).

7/17/2019 Swebrec_2013_1_web.pdf
http://slidepdf.com/reader/full/swebrec20131webpdf 85/120
71
Improved blasting results through precise initiation
Figure 67: The fragment size distribution of S1_225_14.
Figure 68: The size distribution histogram of the material.

7/17/2019 Swebrec_2013_1_web.pdf
http://slidepdf.com/reader/full/swebrec20131webpdf 86/120
72
Improved blasting results through precise initiation
Figure 69: The final cumulative curve of the fragmentation of S1_225_14 by the Swebrec function.
Figure 70: Scatter of x50 and x80 of the passing mass.

7/17/2019 Swebrec_2013_1_web.pdf
http://slidepdf.com/reader/full/swebrec20131webpdf 87/120
73
Improved blasting results through precise initiation
3.4 Comparative fragmentation results
The following figures illustrate the fragmentation of the four trials with different
delay times and the two reference benches. The first two benches (S1_210_11 and
S1_210_12) have been shifted in order to make them comparable with the other trials(Figure 71) according to the procedure described in section 2.6.5.
Figure 71: Fragmentation results.
Bench S1_210_12 with 6 ms inter-hole delay time shows the coarsest fragmentation
among all benches. The first reference (S1_210_11) is shown to have very similar
fragmentation to Bench S1_210_12.
The benches with 1 ms inter-hole delay time (S1_225_11 and S1_225_14) gave
coarser fragmentation than the second reference bench (S1_225_13) with the Nonel
system. The best (finest) fragmentation was observed in the bench with 3 ms inter-
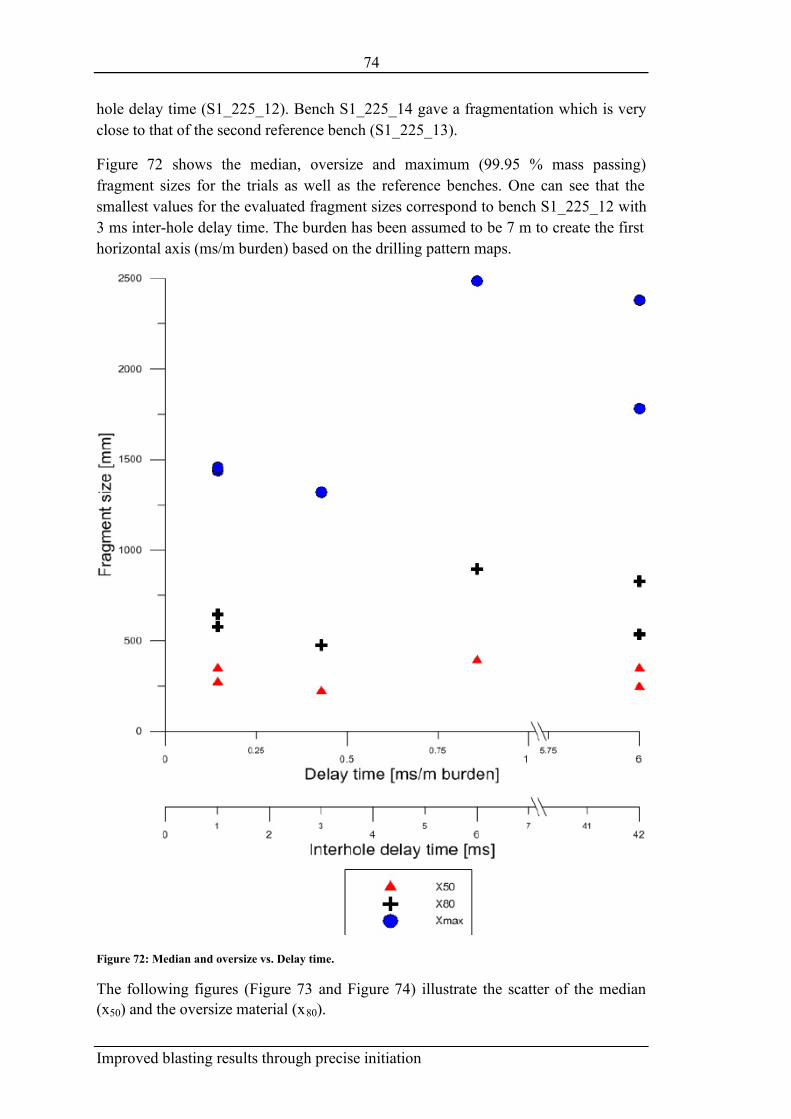
7/17/2019 Swebrec_2013_1_web.pdf
http://slidepdf.com/reader/full/swebrec20131webpdf 88/120
74
Improved blasting results through precise initiation
hole delay time (S1_225_12). Bench S1_225_14 gave a fragmentation which is very
close to that of the second reference bench (S1_225_13).
Figure 72 shows the median, oversize and maximum (99.95 % mass passing)
fragment sizes for the trials as well as the reference benches. One can see that the
smallest values for the evaluated fragment sizes correspond to bench S1_225_12 with
3 ms inter-hole delay time. The burden has been assumed to be 7 m to create the first
horizontal axis (ms/m burden) based on the drilling pattern maps.
Figure 72: Median and oversize vs. Delay time.
The following figures (Figure 73 and Figure 74) illustrate the scatter of the median
(x50) and the oversize material (x80).

7/17/2019 Swebrec_2013_1_web.pdf
http://slidepdf.com/reader/full/swebrec20131webpdf 89/120
75
Improved blasting results through precise initiation
Figure 73: Scatter of x50 values.
As mentioned above, the scatter is quite large for the first two benches probably due
to the shooting angle. Especially for the bench with 6 ms inter-hole delay time which
gave four outliers, i.e., the value of the upper quartile plus the difference between the
first and the third quartiles increased by a factor of 1.5, with very large particles for
the median size reaching up to 1820 mm (Figure 73). The scatter becomes
significantly smaller for the rest of the trials. Only one bench did not give outliers,
i.e., bench S1_225_12 with 3 ms inter-hole delay time, which in addition gave the
finest fragmentation. The benches with the shortest inter-hole delay time (1 ms) gave
outliers with larger particle sizes than the second reference bench (S1_225_13).
Ref. 6 ms 1 ms 3 ms Ref. 1 ms

7/17/2019 Swebrec_2013_1_web.pdf
http://slidepdf.com/reader/full/swebrec20131webpdf 90/120
76
Improved blasting results through precise initiation
Figure 74: Scatter of x80 values.
Figure 74 illustrates the scatter of the oversize material (x80). In practice this figure
shows the amount of boulders produced per blast. The second bench (S1_210_12)
with 6 ms inter-hole delay time gave more boulders than the first reference bench.
The other trials gave smaller amount of boulders. The benches with 1 ms delay time
showed similar amount of boulder. The second reference bench gave two outliers;
however, the maximum size of the material was smaller than the benches with 1 ms
delay time and very close to the bench with 3 ms delay time. The last bench did not
give any outlier.
Based on the above figures the bench giving the best fragmentation is the bench with
3 ms inter-hole delay time or 0.42 ms/m burden. However, limited data about the
geology introduce uncertainties.
Ref. 6 ms 1 ms 3 ms Ref. 1 ms

7/17/2019 Swebrec_2013_1_web.pdf
http://slidepdf.com/reader/full/swebrec20131webpdf 91/120
77
Improved blasting results through precise initiation
3.5 Swelling
The swelling is presented as the profile of the bench in two different directions, i.e.,
north and east. The GPS data before the blast have been provided by the mine and the
data after blast have been acquired by use of a GPS RTK system.
The analysis of the data is based on the average values before and after the blast. In
the following graphs the lower red line shows the average value of the elevation of the
bench before blast as well as the scatter of it (blue points). The upper blue line shows
the average value of the swelling. This value has been calculated by taking the
average of the bench level before the blast and subtracting the measured points after
the blast. Finally, the swelling value is the average of the differences by the
aforementioned procedure. The swelling data have been analyzed in two directions,
i.e., north and east, with respect to elevation measurements.
Bench S1_210_113.5.1
Swelling data were not available for this bench.
Bench S1_210_123.5.2
Figure 75 shows the elevation data before and after the blast in the north direction for
the first trial. The large scatter of the elevation is due to “peaks-and-valleys” formed
by cratering effect or the differential movement of the blasted material. The poor
stemming of some of the blastholes could be a possible explanation for the crateringeffect. However, the elevation before blast is remarkably constant and it is not known
if the same system (RTK) has been used to obtain the measurements as after the blast.

7/17/2019 Swebrec_2013_1_web.pdf
http://slidepdf.com/reader/full/swebrec20131webpdf 92/120
78
Improved blasting results through precise initiation
Figure 75: Measured swelling for bench S1_210_12 in the north direction.
Figure 76 illustrates the elevation in the east direction of the bench. It is obvious that
the elevation measurements before the blast exceed the boundaries of bench
S1_210_12. Only the values in the same range have been considered in the analysis.
The difference of the elevation gives the average swelling of the bench, which for this
bench is 4.76 m.

7/17/2019 Swebrec_2013_1_web.pdf
http://slidepdf.com/reader/full/swebrec20131webpdf 93/120
79
Improved blasting results through precise initiation
Figure 76: Measured swelling for bench S1_210_12 in the east direction.
Bench S1_225_113.5.3
The scatter is rather large for the elevation before and after the blast. The average
values of the elevations have been analyzed. The north and the east direction of the
bench have been plotted against the elevation as well as the average of each elevation
(Figure 77 and Figure 78).

7/17/2019 Swebrec_2013_1_web.pdf
http://slidepdf.com/reader/full/swebrec20131webpdf 94/120
80
Improved blasting results through precise initiation
Figure 77: Measured swelling for bench S1_225_11 in the north direction.

7/17/2019 Swebrec_2013_1_web.pdf
http://slidepdf.com/reader/full/swebrec20131webpdf 95/120
81
Improved blasting results through precise initiation
Figure 78: Measured swelling for bench S1_225_11 in the east direction.
The average swell of bench S1_225_11 is 4.48 m.
Bench S1_225_123.5.4
The scatter is large also for this bench. Figure 79 and Figure 80 show the elevation in
two directions, i.e., north and east. As the measuring points go to the boundary of the
bench (between S1_225_12 and S1_225_13), the elevation of the blasted material
becomes smaller and smaller up to the end of the bench. This is due to the transition
zone of the initiation system from electronic to Nonel. The delay time between the
electronic system and the Nonel was 42 ms, this difference gave enough time to the blasted mass to change its movement behavior and to form a groove between the two

7/17/2019 Swebrec_2013_1_web.pdf
http://slidepdf.com/reader/full/swebrec20131webpdf 96/120
82
Improved blasting results through precise initiation
parts. This effect is more pronounced in Figure 80 because it shows a side section of
the bench.
Figure 79: Measured swelling for bench S1_225_12 in the north direction.

7/17/2019 Swebrec_2013_1_web.pdf
http://slidepdf.com/reader/full/swebrec20131webpdf 97/120
83
Improved blasting results through precise initiation
Figure 80: Measured swelling for bench S1_225_12 in the east direction.
It is very difficult to extract the points, where the mass movement shows a different
behavior because there is a tendency for the swelling to be smaller at the end of the
bench. The average calculated swelling for this bench is 5.37 m.

7/17/2019 Swebrec_2013_1_web.pdf
http://slidepdf.com/reader/full/swebrec20131webpdf 98/120
84
Improved blasting results through precise initiation
Bench S1_225_133.5.5
As mentioned for the previous bench, this bench shows a similar behavior, i.e., at the
beginning the bench shows shorter swelling than the rest of the mass movement. It is
more obvious in the east direction (Figure 82) than the north one (Figure 81). This bench was blasted with regular Nonel initiation system.
Figure 81: Measured swelling for bench S1_225_13 in the north direction.

7/17/2019 Swebrec_2013_1_web.pdf
http://slidepdf.com/reader/full/swebrec20131webpdf 99/120
85
Improved blasting results through precise initiation
Figure 82: Measured swelling for bench S1_225_13 in the east direction.
The swelling for this bench averaged to 4.85 m.
Bench S1_225_143.5.6
This is the last trial of the field tests with 1 ms delay time. Figure 83 shows the north
direction of the bench against the elevation before and after the blast. Additionally, it
shows the swelling of bench S1_225_15, but there are no data regarding the initial
elevation of bench S1_225_15.

7/17/2019 Swebrec_2013_1_web.pdf
http://slidepdf.com/reader/full/swebrec20131webpdf 100/120
86
Improved blasting results through precise initiation
Figure 83: Measured swelling for bench S1_225_14 in the north direction.

7/17/2019 Swebrec_2013_1_web.pdf
http://slidepdf.com/reader/full/swebrec20131webpdf 101/120
87
Improved blasting results through precise initiation
Figure 84: Measured swelling for bench S1_225_14 in the east direction.
The swelling for this bench was 5.68 m.

7/17/2019 Swebrec_2013_1_web.pdf
http://slidepdf.com/reader/full/swebrec20131webpdf 102/120
88
Improved blasting results through precise initiation
Comparative results of the swelling of all the benches3.5.7
Figure 85 and Figure 86 illustrate the entire swelling of all the benches (trials and
references) in two directions, i.e., north and east, before and after the blasting. Some
points after the blast in Figure 85 overlap the points before the blast because these points have been taken on the ramp next to the bench. However, these points have not
been considered in the analysis. Table 15 shows the average swelling of all the trials.
Table 15: The measured average of all the trials.
Swelling [m]
S1_210_12 4.76
S1_225_11 4.48
S1_225_12 5.37
S1_225_13 4.85
S1_225_14 5.68
Figure 85: Swelling in north direction for all the trials.
In Figure 86, there are some gaps between the benches because that area was not
accessible. There were deep ditches between the blasted bench and the new round.
Those areas were too unstable to be measured in a safe manner.

7/17/2019 Swebrec_2013_1_web.pdf
http://slidepdf.com/reader/full/swebrec20131webpdf 103/120
89
Improved blasting results through precise initiation
Figure 86: Swelling in east direction for all the trials.
All the figures above have been plotted in a Box-and-Whisker plot (Figure 87) to
observe the behavior of the mass movement when the delay time changes.

7/17/2019 Swebrec_2013_1_web.pdf
http://slidepdf.com/reader/full/swebrec20131webpdf 104/120
90
Improved blasting results through precise initiation
Figure 87: The swelling of all benches.
It is difficult to define any significant difference in swelling between the trials. Figure
88 portrays the delay time of the trials without the reference bench. It seems that the
delay time does not significantly influence the swelling factor. There is, however, a
tendency of swelling to decrease with increasing delay time.
6 ms 1 ms 3 ms Ref. 1 ms

7/17/2019 Swebrec_2013_1_web.pdf
http://slidepdf.com/reader/full/swebrec20131webpdf 105/120
91
Improved blasting results through precise initiation
Figure 88: Delay time vs. Swelling.
3.6
Crusher data
The ore from the test areas was transported and crushed at the crusher station in the
pit at the 165 m level. The crusher station consists of two parallel gyratory crushers
(local names KR4 and KR5), model Allis Superior 60-109. The new crusher on the
surface was used during periods of maintenance and breakdowns of the crusher
station in the pit. The opening of the main crushers is 1520 mm and the diameter at
the lower part of the mantel is 2770 mm. The closed side setting, 190-270 mm,
determines the crusher product. The coarsest rocks after crushing vary from 350 mm
to 400 mm with variations depending on the characteristics of the ore.

7/17/2019 Swebrec_2013_1_web.pdf
http://slidepdf.com/reader/full/swebrec20131webpdf 106/120
92
Improved blasting results through precise initiation
To evaluate the effect of the fragmentation from trial and reference blasts, the energy
consumption for crushing of ore material was measured (in kWh/tonne). The energy
consumption is registered by ABB control system and the ore tonnage is extracted
from corresponding truck cycles, using the Minestar system. Minestar is an integrated
operations and mobile equipment management system by Caterpillar.
Drill rigs are equipped with Aquila Drill Management system including the MWD
(Measure While Drilling) application that measures drilling characteristics, i.e. torque,
rate of penetration, weight on bit etc. MWD logs were used to evaluate drilling
characteristics of the benches in terms of penetration rate (PR) and specific energy
(SE).
Specific energy is a concept that represents the work done per unit excavated. The
concept was introduced by Teale (1964) and has been evaluated by Schunesson
(2007). Teale (1964) introduced the following equation for specific energy:
() ( ) ( ) (2)
where,
SE = Specific Energy [N.cm/cm3]
F = Feed Force [N]
A = the cross-section area of the drill hole [cm2]
N = Rotation Speed [RPM]
T = Torque [Nm]
P = Penetration Rate [m/minute]
Penetration rate and Specific energy of six benches are presented in Figure 89. The
MWD data for bench S1_210_12 was not recorded due to mine network issues.
It should also be mentioned that the following method was implemented for the
analysis of MWD data:
- Fractured rock at the surface and secondary drilling values were found and
eliminated for every single blasthole.
- Large errors and false values of PR and SE caused by large fractures or drill bit
problems were eliminated.
- The MWD database was sorted by use of coordinates of the blastholes within each
bench.
- Mean values were calculated only for validly logged blastholes.

7/17/2019 Swebrec_2013_1_web.pdf
http://slidepdf.com/reader/full/swebrec20131webpdf 107/120
93
Improved blasting results through precise initiation
Figure 89: MWD data analysis – penetration rate and specific energy
Figure 89 shows higher penetration rates and lower specific energy for blasts on level
225. It can be explained by a variation in presence of pegmatite dykes that have a
negative effect on drilling performance due to their higher strength. Blast S1_225_12,
consisting of a mixture of muscovite schist, biotite schist and biotite gneiss without
visible mapped pegmatite, gave the highest penetration rate and the lowest specific
energy.
Data from crusher energy consumption together with corresponding specific energy of
benches (except bench S1_210_12, which had no available data) is presented in
Figure 90. It should be mentioned that the crushing energy values were logged in an
unsorted way, i.e., the ore from various benches was mixed in the crusher. In order to
overcome this issue, the Minestar database has been used to filter out favorable
recordings for the trial benches. The method to extract crushing energy consumption
values is as follows:
- Minestar data were sorted out based on the coordinates of benches and the loading
time.
- Payload values for trucks were filtered; untrue or false recordings were eliminated,
as well as trucks from unrelated benches.
- Mean crusher efficiencies were calculated for KR4 and KR5 separately for the
duration of each truck's payload crushing.
- Idle status and downtimes of crusher lines were eliminated from database.
- Average crushing energy values were calculated using only in-function crusher
lines.
- Crusher efficiency values were correlated to payloads of trucks by timestamps of
crusher lines and trucks.

7/17/2019 Swebrec_2013_1_web.pdf
http://slidepdf.com/reader/full/swebrec20131webpdf 108/120
94
Improved blasting results through precise initiation
Figure 90: Crushing energy consumption and specific drilling energy.
Short inter-hole delays are supposed to give finer fragmentation and, consequently,
lower crushing energy consumption. According to Figure 90, trial from benchS1_210_12 with 6 ms delay time gave the lowest energy consumption. However,
there are no clear trends, meaning that a large-scale test with more blasts during a
long-term period may be required to get statistically proven correlations.
3.7 Feed-back from operators
Conversations with shovel and crusher operators regarding their subjective opinion about
mucking and crushing of the ore from the mentioned benches were used as supplemental
measurement of blast performance. For blast S1_225_15 (1 ms), it was indicated a very
high crusher throughput, no boulder breakage needed, visually finer material and less boulders experienced during mucking. It was also noticed a relatively high swelling of
this blast, resulting in easier mucking.
Generally, the feedbacks describe the material from all other blasts as normal without
noticeable difference to a fine and “easy-to-muck”.

7/17/2019 Swebrec_2013_1_web.pdf
http://slidepdf.com/reader/full/swebrec20131webpdf 109/120
95
Improved blasting results through precise initiation
4 Discussion
In order to draw conclusions from the aforementioned test blasts, it is necessary to
acquire an abridged overview of the results in a comparative form. Table 16
summarizes the most important results for each bench.Table 16: Summary of the most important results of all trials.
Bench TypePenetration
rate (m/min)
Specific
Energy
(N.cm/cm3)
Swell
(m) x50 (mm) x80 (mm)
Crusher
consumption
per payload
(KWh/Ton)
S1_210_11 Ref. 0.507 4038 -NA- 498 906 1.97
S1_210_12 6 ms -NA- -NA- 4.8 401 899 1.29
S1_225_11 1 ms 0.616 3598 4.5 284 582 1.46
S1_225_12 3 ms 0.662 3362 5.5 211 471 1.72
S1_225_13 Ref. 0.606 3426 4.8 242 489 1.54
S1_225_14 1 ms 0.599 3527 5.9 241 527 1.48
Swelling data for bench S1_210_11 were not available, as well as MWD data for
bench S1_210_12. The values mentioned in Table 16 are the mean values for
comparative purposes only.
Penetration rate and specific energy both indicate the hardness of the rock. For the
sake of simplicity only specific energy will be taken into consideration as the
governing MWD parameter since it provides more normalized values compared to
Penetration rate (See section 3.6). For further simplicity in comparisons, only x50 is
considered as the main fragmentation representative parameter.
Figure 91 illustrates a graphical presentation of the main parameters in Table 16.
Fragmentation of the rock from each bench is indicated by the comparative size of the
bubbles as values of x50. The positions of bubbles on the chart show the meancrushing energy and mean rock hardness (Specific drilling energy) for each of the test
blasts. Due to unavailability of MWD data for bench S1_210_12, the position of the
bubble on the horizontal axis is assumed equal to that of bench S1_210_11 for visual
comparison of crushing energy and x50. Additionally, the swelling of the benches is
not shown in the graph due to the small differences in swelling.

7/17/2019 Swebrec_2013_1_web.pdf
http://slidepdf.com/reader/full/swebrec20131webpdf 110/120
96
Improved blasting results through precise initiation
Figure 91: Graphical illustration of main results of trials.
As seen in Figure 91, there is a significant difference between x50 values for benches
S1_210_11 and S1_210_12 compared to the rest of the benches. Such variation might
be due to different shooting angles of images from which the fragmentation is
derived. Considerably larger specific energy of bench S1_210_11 in comparison with
other benches (which indicates harder rock) might be another explanation for that.Since the specific energy of bench S1_210_12 is fictitious one cannot comment on the
effect of rock hardness on the fragmentation of this bench. However, the crushing
energy of bench S1_210_12 (6 ms) is the lowest among all, which shows the rock was
easier to crush despite of its comparatively large x50.
In a partial comparison between benches S1_210_11 and S1_210_12, considerably
lower crushing energy of the latter can be explained by better fracturing of particles as
a result of short delay time (6 ms), but such conclusion cannot be considered as
consistent since the MWD data were not available for bench S1_210_12.
The differences among four benches on level 225, i.e., S1_225_11, S1_225_12,
S1_225_13 and S1_225_14, are not as large in comparison to the aforementioned
benches on level 210. Drilling energy for the bench S1_225_12 (3 ms) is the lowest
among all as well as its x50; other fragmentation values, e.g. x80 and xmax, also show an
improvement compared to the reference and other benches.
Bench S1_225_14 (1 ms) showed slightly larger specific energy and almost the same
value of x50 as the reference bench (S1_225_13). The crushing energy was slightly
lower than the reference but all variations were so small and no significant distinction
can be seen between this bench and the reference bench.

7/17/2019 Swebrec_2013_1_web.pdf
http://slidepdf.com/reader/full/swebrec20131webpdf 111/120
97
Improved blasting results through precise initiation
The other bench with 1 ms delay time (S1_225_11) has also more or less the same
crushing energy as the reference bench (S1_225_13) as well as bench S1_225_14 (1
ms). However, the specific energy of drilling is larger and that might be the reason for
its slightly larger x50 value.
Altogether, the differences in fragmentation and crushing energies of benches were
not as discernible as experienced by for example Vanbrabant and Espinosa (2006). On
the other hand, data limitations and variations in geology and confinement conditions
of benches introduce uncertainties regarding the results of the field tests. In addition
to that, errors emerged by instrumentation, e.g., the MWD and crusher logging
systems, as well as those originated in the analysis of the data, e.g., fragmentation
analysis (See section 3.3), reduce the confidence level of the results. Undetermined
errors in different stages of blast preparation, such as drilling and charging, also add
to the ambiguity of the correlations.

7/17/2019 Swebrec_2013_1_web.pdf
http://slidepdf.com/reader/full/swebrec20131webpdf 112/120
98
Improved blasting results through precise initiation
5 Conclusions
According to the results and discussions, following statements summarize the
conclusions of four trials and two reference blasts:
The bench with inter-hole delay time of 6 ms resulted in the lowest crushing
energies among all trials. The bench resulted in more boulders and coarser
fragmentation than the second reference bench and other benches. However,
different shooting angles of images for different trials introduced uncertainties
about the fragmentation analysis.
The bench with inter-hole delay time of 3 ms gave the finest fragmentation
among all trials. All examined values, i.e., x50, x80 and xmax showed
improvements compared to the other benches. Although the x80 and xmax
values are significantly smaller, the improvement of the mean fragment size is
negligible. On the other hand, the crushing energy of the rock was the highestamong all trials.
The two trials with 1 ms delay time resulted in almost identical results as the
second reference bench. The variations in x50 values were ignorable. The same
was true for crushing energies for both benches.
Altogether, the variations in the fragmentation of the trials are insignificant
and are nearly within the same statistical error.
Swelling values of the benches were similar. Different delay times appear to
have only minor effects on the swelling of the broken rock.
VoD measurements on bench S1_210_12 showed good accuracy of electronicdetonators regarding the precision of short delay times and no misfire was
observed.
7/17/2019 Swebrec_2013_1_web.pdf
http://slidepdf.com/reader/full/swebrec20131webpdf 113/120
99
Improved blasting results through precise initiation
6 Recommendation and future research
The results from these trials showed the need for further investigation of the short
delay times, with more detailed data acquisition. Some short inter-hole delay times
must be reexamined; these are 6 ms and 3 ms in order to clarify the results from thetrials described in this report. However, from the mine operators’ point of view, based
on their visual observations, the trials with 1 ms delay time had the finest
fragmentation. Additionally, detailed investigations are required by “Mine-to-Mill”
concept to acquire reliable data from the crusher and from the further process of the
broken material. The future trials are recommended including extensive data
acquisition and analysis method, such as swelling data, stereographic analysis of the
slopes above the trials to identify the rock mass structure, Complete logging of MWD
data as well as core drilling, high speed filming of the blasts to observe the mass
movement, extensive fragmentation analysis based upon high-quality images shot
from a constant axis, detailed follow-up of the ore during crushing and grinding in
order to investigate the crushing energies and to observe the presence of micro-
fractures in the particles after crushing. A better camera with a better zoom lens must
be used in order to take clearer and sharper images from the truck bodies as well.
The blasting conditions, i.e. confined or free face, for the further investigations must
be kept as consistent as possible due to the potential effect on the fragmentation of
trial. It has been proven by Johansson & Ouchterlony (2011) and Petropoulos et al.
(2012) that the fragmentation under confined conditions is coarser than the free face
blast. Moreover, there is a transition zone in every trial bench when the blast is largely
elongated, which from free face blast changes to blast under confined conditions. At
this point a question arises regarding the part of the bench which has to be considered
as representative for the entire bench for fragmentation analysis. However, the crusher
data acquisition takes into consideration the entire bench.
The crusher data acquisition must be done very carefully and only the data from the
particular benches must be collected and not mixed data with other benches. This
process requires a person in the crusher control room to follow the trucks from the
trial benches because afterwards it is very difficult up to impossible to distinguish the
correct values of the crusher’s energy consumption.

7/17/2019 Swebrec_2013_1_web.pdf
http://slidepdf.com/reader/full/swebrec20131webpdf 114/120
100
Improved blasting results through precise initiation
7 References
Bergman, P. 2005, Optimisation of fragmentation and comminution at Boliden Mineral, Aitik Operation, Licentiate Dissertation 2005:90, Luleå University of
Technology, ISSN: 1402-1757.
Chiappetta, R.F. 2007, Combining Electronic Detonators, Stem Charges, Air Decks
and Very Short Hole Delays, The 6th Blasting Vibration Technology Conference,
January 15, Key Largo, Florida, USA.
Chiappetta, R.F. 2011, In personal communication with D. Johansson.
El-Rabbany, A. 2002, Introduction to GPS: the global positioning system, Artech
House Publishers, London.
Esen, S., Onederra, I. & Bilgin, H. 2003, "Modelling the size of the crushed zonearound a blasthole", International Journal of Rock Mechanics and Mining
Sciences, vol. 40, no. 4, pp. 485-495.
Hallquist, J. 2007, LS- DYNA keyword user’s manual , Livermore software technology
corporation, LSTC, Vol. 1 & 2.
Höglund, S 2012, In personal communication with U. Nyberg.
Hustrulid, W.A. 1999, Blasting principles for open pit mining: General design
concepts, A.A. Balkema.
Johansson, D. & Ouchterlony, F. 2011, "Fragmentation in small-scale confined
blasting", International Journal of Mining and Mineral Engineering, vol. 3, no.
1, pp. 72-94.
Johansson, D. & Ouchterlony, F. 2012, "Shock Wave Interactions in Rock Blasting:
the Use of Short Delays to Improve Fragmentation in Model-Scale", Rock
Mechanics and Rock Engineering, vol.45, no.1, pp. 1-18.
Katsabanis, P., Tawadrous, A., Braun, C. & Kennedy, C. 2006, "Timing effects on the
fragmentation of small scale blocks of granodiorite", Fragblast, vol. 10, no. 1-2, pp. 83-93.
McKinstry, R., Bolles, T. and Rantapaa, M. 2004, “Implementation of electronic
detonators at Barrick Goldstike Mines, Inc.”, Proceedings of the 30th ISEE
Annual Conference on Explosives and Blasting Technique, New Orleans, LA, 1-4
February, pp. 349-361.
Nyberg, U., Harefjord, L., Bergman, B. & Christiansson, R., 2005, Monitoring of
vibrations during blasting of the APSE tunnel. Stockholm: Svensk
kärnbränslehantering AB. (SKB report; No. R -05-07).

7/17/2019 Swebrec_2013_1_web.pdf
http://slidepdf.com/reader/full/swebrec20131webpdf 115/120
101
Improved blasting results through precise initiation
Otterness, R.E., Stagg, M.S. & Rholl, S.A. 1991, “Correlation of shock design
parameters to fragmentation”, Proceedings of the 7th ISEE Conference on
Explosives and Blasting Research, Las Vegas, Nevada, 3-7 February, pp. 179-
181.
Ouchterlony, F., Nie, S., Nyberg, U. & Deng, J. 1997, “Monitoring of large open cutrounds by VOD, PPV and gas pressure monitoring”, International Journal of
Fragmentation by Blasting , vol. 1, pp. 3-25.
Ouchterlony, F., Nyberg, U., Olsson, M., Bergqvist, I., Granlund, L. & Grind, H.
2003, "The energy balance of production blasts at Nordkalk’s Klinthagen
quarry", Proceedings of 2nd World Conference on Explosives and Blasting ,
Prague, pp. 10-12.
Ouchterlony, F. 2005, "The Swebrec function: linking fragmentation by blasting and
crushing", Mining Technology, vol. 114, no. 1, pp. 29-44.
Ouchterlony, F., Nyberg, U. & Olsson, M. et al. 2010, Optimal fragmentation in
quarries, field tests at Långåsen, Swebrec report, no. 2010:2, ISSN: 1653-5006.
Petropoulos, N., Johansson, D. & Ouchterlony, F. 2013, Measurement and Analysis
of Blast Fragmentation: Workshop Hosted by FRAGBLAST 10 - The 10th
International Symposium on Rock Fragmentation by Blasting. Sanchidrian
Blanco, J. A. & Singh, A. K. (eds.), CRC Press/Balkema, pp. 61-70.
Riedel, W., Thoma, K., Hiermaier, S. & Schmolinske, E. 1999, "Penetration of
reinforced concrete by BETA-B-500 numerical analysis using a newmacroscopic concrete model for hydrocodes", 9th Int Symp Interaction of the
Effects of Munitions with Structures, Berlin, pp. 315-322.
Rorke, A. J. 2007, “An evaluation of precise short delay periods on fragmentation in
blasting”, Vienna Conference Proceedings 2007 , Vienna, P. Moser et al. (Ed.),
pp. 257-307, ISBN: 978-0-9550290-1-1.
Rosenstock, W. 2004, "Advanced electronic blasting technology (AEBT). Breaking
3,205,000 tons of ore within a millisecond", Proceedings of the 30th Annual
Conference on Explosives & Blasting Technique, International Society of
Explosives Engineers, New Orleans, LA USA, 1-4 February, vol.1, pp. 61-68.
Rossmanith, H.P. 2003, "The mechanics and physics of electronic blasting",
Proceedings of the 29th ISEE Annual Conference on Explosives and Blasting
Technique, Nashville, Tennessee, 2-5 February, vol. 1, pp. 83-101.
Rossmanith, H.P. 2002, "The use of Lagrange diagrams in precise initiation blasting.
Part I: Two interacting blastholes", Fragblast, vol. 6, no. 1, pp. 104-136.
Rossmanith, H. & Kouzniak, N. 2004, "Supersonic Detonation in Rock Mass-Part 2:
Particle Displacements and Velocity Fields for Single and Multiple Non-Delayed
and Delayed Detonating Blastholes", Fragblast, vol. 8, no. 2, pp. 95-117.

7/17/2019 Swebrec_2013_1_web.pdf
http://slidepdf.com/reader/full/swebrec20131webpdf 116/120
102
Improved blasting results through precise initiation
Schill, M. 2012. Finite element simulations of blasting and the effects of precise
initiation on fragmentation. Swebrec report, no. 2012:2, ISSN: 1653-5006.
Schunnesson, H. & Kristoffersson, T. 2011, "Rock Mass Characterisation using Drill
and Crushability Monitoring — A Case Study.", International Journal of
Condition Monitoring and Diagnostic Engineering Management, vol. 14, no. 2, pp. 44-52.
Schunnesson, H. & Mozaffari, S. 2009, "Production control and optimization in open
pit mining using a drill monitoring system and an image analysis system : a case
study from Aitik copper mine in Sweden", Journal of Mines, Metals and Fuels,
vol. 57, no. 9, pp. 244-251.
Shirzadegan, S., Nordlund, E. , Nyberg, U. , Zhang, P. & Malmgren, L. 2011, ”Rock
support subjected to dynamic loading: Field testing of ground support using
simulated rockburst”, Proceedings of the 12th ISRM International Congress on Rock Mechanics, Beijing, October 18-21, Qian, Q. & Zhou, Y. (eds.). Leiden:
CRC Press/Balkema, pp. 1269-1273.
Split Engineering, 2013. Split Engineering. Available at: http://www.spliteng.com
[Accessed 10 September 2012].
Stagg, M. S. & Nutting M. J. 1987, “Influence of blast delay time on rockfragmentation: one-tenth-scale tests”, Proceedings: Bureau of Mines Technology
Transfer Seminar, Chicago, IL, 15 April, pp. 79-95.
Teale, R. 1965, "The concept of specific energy in rock drilling", International Journal of Rock Mechanics and Mining Sciences, vol. 2 , pp. 57-73.
Tesarik, D.R., Hustrulid, W.A. & Nyberg, U 2011. “Assessment and application of a
single-charge blast test at the Kiruna mine, Sweden”, Blasting and
Fragmentation, vol. 5, no. 1, pp. 47-72.
Vanbrabant, F. & Espinosa, A. 2006, “Impact of short delays sequence on
fragmentation by means of electronic detonators: theoretical concepts and field
validation”, Proceedings of 8th International Symposium on Rock Fragmentation
by Blasting- Fragblast 8, Santiago, pp. 326-331.
Vanbrabant, F. 2010, In personal communication with D. Johansson.
Wanhainen, C. 2005, On the origin and evolution of the Palaeoproterozoic Aitik Cu –
Au – Ag deposit, northern Sweden: a porphyry copper – gold ore, modified by
multistage metamorphic-deformational, magmatic-hydrothermal, and IOCG-
mineralizing events, Doctoral Dissertation 2005:36, Luleå University of
Technology, ISSN: 1402-1544.

7/17/2019 Swebrec_2013_1_web.pdf
http://slidepdf.com/reader/full/swebrec20131webpdf 117/120
103
Improved blasting results through precise initiation
Wimmer, M. 2012, Towards understanding breakage and flow in sublevel caving
(SLC): Development of new measurement techniques and results from full-scale
tests, Doctoral Dissertation, Luleå University of Technology, ISBN: 978-91-
7439-509-9.
Yang, R. 2012, “Relationship between peak particle acceleration, velocity anddisplacement of blast vibration”, Proceedings of the thirty-eigth annual
conference on explosive and blasting technique, February 12-15, Nashville, TN,
USA, pp. 317-334.
Yi, C., Johansson, D., Nyberg, U. & Sjöberg, J. 2012, ”Numerical simulation for the
influence of delay time on the rock fragmentation”, Proceedings of the 10th
International Symposium on Rock Fragmentation by Blasting: Fragblast 10.
Singh, P. K. & Sinha, A. (Eds), CRC Press/Balkema , pp. 213-220, ISBN: 978-0-
415-62143-4.

7/17/2019 Swebrec_2013_1_web.pdf
http://slidepdf.com/reader/full/swebrec20131webpdf 118/120
104
Improved blasting results through precise initiation

7/17/2019 Swebrec_2013_1_web.pdf
http://slidepdf.com/reader/full/swebrec20131webpdf 119/120

7/17/2019 Swebrec_2013_1_web.pdf
http://slidepdf.com/reader/full/swebrec20131webpdf 120/120


