Sustained AS160 and TBC1D1 phosphorylations in human ... · Sustained AS160 and TBC1D1...
8
Sustained AS160 and TBC1D1 phosphorylations in human skeletal muscle 30 min after a single bout of exercise M. H. Vendelbo, 1,2 A. B. Møller, 1,3 J. T. Treebak, 4 L. C. Gormsen, 2 L. J. Goodyear, 5 J. F. P. Wojtaszewski, 6 J. O. L. Jørgensen, 1 N. Møller, 1 and N. Jessen 1,3,7 1 Department of Endocrinology and Internal Medicine, Aarhus University Hospital, Aarhus, Denmark; 2 Department of Nuclear Medicine and PET center, Aarhus University Hospital, Aarhus, Denmark; 3 Research Laboratory for Biochemical Pathology, Aarhus University Hospital, Aarhus, Denmark; 4 Novo Nordisk Foundation Center for Basic Metabolic Research, Section of Integrative Physiology, University of Copenhagen, Copenhagen, Denmark; 5 Joslin Diabetes Center and Department of Medicine, Brigham and Women’s Hospital and Harvard Medical School, Boston, Massachusetts; 6 Molecular Physiology Group, Department of Nutrition, Exercise and Sports, The August Krogh Centre, University of Copenhagen, Copenhagen, Denmark; and 7 Department of Molecular Medicine, Aarhus University Hospital, Aarhus, Denmark Submitted 22 January 2014; accepted in final form 23 May 2014 Vendelbo MH, Møller AB, Treebak JT, Gormsen LC, Goodyear LJ, Wojtaszewski JF, Jørgensen JO, Møller N, Jessen N. Sustained AS160 and TBC1D1 phosphorylations in human skeletal muscle 30 min after a single bout of exercise. J Appl Physiol 117: 289 –296, 2014. First published May 29, 2014; doi:10.1152/japplphysiol.00044.2014.—Background: phos- phorylation of AS160 and TBC1D1 plays an important role for GLUT4 mobilization to the cell surface. The phosphorylation of AS160 and TBC1D1 in humans in response to acute exercise is not fully characterized. Objective: to study AS160 and TBC1D1 phos- phorylation in human skeletal muscle after aerobic exercise followed by a hyperinsulinemic euglycemic clamp. Design: eight healthy men were studied on two occasions: 1) in the resting state and 2) in the hours after a 1-h bout of ergometer cycling. A hyperinsulinemic euglycemic clamp was initiated 240 min after exercise and in a time-matched nonexercised control condition. We obtained muscle biopsies 30 min after exercise and in a time-matched nonexercised control condition (t 30) and after 30 min of insulin stimulation (t 270) and investigated site-specific phosphorylation of AS160 and TBC1D1. Results: phosphorylation on AS160 and TBC1D1 was increased 30 min after the exercise bout, whereas phosphorylation of the putative upstream kinases, Akt and AMPK, was unchanged compared with resting control condition. Exercise augmented in- sulin-stimulated phosphorylation on AS160 at Ser 341 and Ser 704 270 min after exercise. No additional exercise effects were ob- served on insulin-stimulated phosphorylation of Thr 642 and Ser 588 on AS160 or Ser 237 and Thr 596 on TBC1D1. Conclusions: AS160 and TBC1D1 phosphorylations were evident 30 min after exercise without simultaneously increased Akt and AMPK phosphorylation. Unlike TBC1D1, insulin-stimulated site-specific AS160 phosphor- ylation is modified by prior exercise, but these sites do not include Thr 642 and Ser 588 . Together, these data provide new insights into phosphorylation of key regulators of glucose transport in human skeletal muscle. AS160; TBC1D4; TBC1D1; endurance exercise; insulin sensitivity; skeletal muscle PHYSICAL EXERCISE HAS PROFOUND effects on substrate metab- olism in human skeletal muscle, and it is a cornerstone in the treatment of dysregulated metabolic conditions such as type 2 diabetes (30). A single bout of exercise can stimulate skeletal muscle glucose uptake in humans (14), and hours into the postexercise period insulin-stimulated glucose up- take is increased (3, 6, 7, 24, 25, 34). The glucose trans- porter protein GLUT4 is the major glucose transporter isoform expressed in skeletal muscle, and the translocation of GLUT4 from an intracellular location to the plasma membrane and T tubules is a major mechanism through which both insulin and exercise increase skeletal muscle glucose transport (20). The GLUT4 translocation process is under control of AS160, also known as tre-2/USP6, BUB2, and cdc16 domain family member 4 (TBC1D4), and the AS160 paralog TBC1D1 (1, 8, 22, 27, 39). In their active forms AS160 and TBC1D1 promote hydrolysis of GTP to GDP on Rab proteins and thereby restrain GLUT4 translocation (28). AS160 and TBC1D1 is inactivated through a combination of several phos- phorylations by the upstream kinases Akt and AMP-activated protein kinase (AMPK) (21, 32, 35, 39), and this allows GLUT4 to dock and fuse with the membrane. In muscle of both rats and humans, phosphorylation of AS160 after exercise has been shown to persist in the hours after termination of an exercise bout, whereas Akt and AMPK phosphorylation re- turns to baseline levels (2, 25). This is associated with a greater increase in AS160 phosphorylation when muscles are stimu- lated with insulin 3– 4 h postexercise (12, 25, 34). However, this finding has not been consistent in humans (17). Unlike AS160, TBC1D1 phosphorylation is not retained 3 h postex- ercise in humans (25). In addition, insulin-stimulated TBC1D1 phosphorylation is not increased 3.5 and 5 h after cessation of exercise in humans (25), and similar observations have been made in rat skeletal muscle 3 and 27 h after exercise (12). It was recently found that acute exercise in humans results in phosphorylation of both AS160 and TBC1D1 in skeletal mus- cle and that specific AMPK trimer complexes may phosphor- ylate AS160 and TBC1D1 (11, 19, 36). Thus it is possible that TBC1D1 may be involved in the acute effects of exercise, whereas phosphorylation events on AS160 increase both GLUT4 mobilization and insulin sensitivity in the hours after exercise. To date only few studies have investigated site- specific phosphorylation events of AS160 and TBC1D1 in human skeletal muscle and more data are warranted to outline Address for reprint requests and other correspondence: N. Jessen, Research Laboratory for Biochemical Pathology, Institute for Clinical Medicine, Aarhus Univ. Hospital, Nørrebrogade 44, DK-8000 Aarhus C (e-mail: Niels.Jessen @ki.au.dk). J Appl Physiol 117: 289–296, 2014. First published May 29, 2014; doi:10.1152/japplphysiol.00044.2014. 8750-7587/14 Copyright © 2014 the American Physiological Society http://www.jappl.org 289 by 10.220.33.3 on November 10, 2017 http://jap.physiology.org/ Downloaded from
Transcript of Sustained AS160 and TBC1D1 phosphorylations in human ... · Sustained AS160 and TBC1D1...
Sustained AS160 and TBC1D1 phosphorylations in human skeletal muscle 30min after a single bout of exercise
M. H. Vendelbo,1,2 A. B. Møller,1,3 J. T. Treebak,4 L. C. Gormsen,2 L. J. Goodyear,5
J. F. P. Wojtaszewski,6 J. O. L. Jørgensen,1 N. Møller,1 and N. Jessen1,3,7
1Department of Endocrinology and Internal Medicine, Aarhus University Hospital, Aarhus, Denmark; 2Department ofNuclear Medicine and PET center, Aarhus University Hospital, Aarhus, Denmark; 3Research Laboratory forBiochemical Pathology, Aarhus University Hospital, Aarhus, Denmark; 4Novo Nordisk Foundation Center for BasicMetabolic Research, Section of Integrative Physiology, University of Copenhagen, Copenhagen, Denmark; 5JoslinDiabetes Center and Department of Medicine, Brigham and Women’s Hospital and Harvard Medical School, Boston,Massachusetts; 6Molecular Physiology Group, Department of Nutrition, Exercise and Sports, The August Krogh Centre,University of Copenhagen, Copenhagen, Denmark; and 7Department of Molecular Medicine, Aarhus UniversityHospital, Aarhus, Denmark
Submitted 22 January 2014; accepted in final form 23 May 2014
Vendelbo MH, Møller AB, Treebak JT, Gormsen LC, Goodyear LJ,Wojtaszewski JF, Jørgensen JO, Møller N, Jessen N. Sustained AS160and TBC1D1 phosphorylations in human skeletal muscle 30 min after asingle bout of exercise. J Appl Physiol 117: 289–296, 2014. First publishedMay 29, 2014; doi:10.1152/japplphysiol.00044.2014.—Background: phos-phorylation of AS160 and TBC1D1 plays an important role forGLUT4 mobilization to the cell surface. The phosphorylation ofAS160 and TBC1D1 in humans in response to acute exercise is notfully characterized. Objective: to study AS160 and TBC1D1 phos-phorylation in human skeletal muscle after aerobic exercise followedby a hyperinsulinemic euglycemic clamp. Design: eight healthy menwere studied on two occasions: 1) in the resting state and 2) in thehours after a 1-h bout of ergometer cycling. A hyperinsulinemiceuglycemic clamp was initiated 240 min after exercise and in atime-matched nonexercised control condition. We obtained musclebiopsies 30 min after exercise and in a time-matched nonexercisedcontrol condition (t � 30) and after 30 min of insulin stimulation (t �270) and investigated site-specific phosphorylation of AS160 andTBC1D1. Results: phosphorylation on AS160 and TBC1D1 wasincreased 30 min after the exercise bout, whereas phosphorylationof the putative upstream kinases, Akt and AMPK, was unchangedcompared with resting control condition. Exercise augmented in-sulin-stimulated phosphorylation on AS160 at Ser341 and Ser704
270 min after exercise. No additional exercise effects were ob-served on insulin-stimulated phosphorylation of Thr642 and Ser588
on AS160 or Ser237 and Thr596 on TBC1D1. Conclusions: AS160and TBC1D1 phosphorylations were evident 30 min after exercisewithout simultaneously increased Akt and AMPK phosphorylation.Unlike TBC1D1, insulin-stimulated site-specific AS160 phosphor-ylation is modified by prior exercise, but these sites do not includeThr642 and Ser588. Together, these data provide new insights intophosphorylation of key regulators of glucose transport in humanskeletal muscle.
AS160; TBC1D4; TBC1D1; endurance exercise; insulin sensitivity;skeletal muscle
PHYSICAL EXERCISE HAS PROFOUND effects on substrate metab-olism in human skeletal muscle, and it is a cornerstone in thetreatment of dysregulated metabolic conditions such as type
2 diabetes (30). A single bout of exercise can stimulateskeletal muscle glucose uptake in humans (14), and hoursinto the postexercise period insulin-stimulated glucose up-take is increased (3, 6, 7, 24, 25, 34). The glucose trans-porter protein GLUT4 is the major glucose transporterisoform expressed in skeletal muscle, and the translocationof GLUT4 from an intracellular location to the plasmamembrane and T tubules is a major mechanism throughwhich both insulin and exercise increase skeletal muscleglucose transport (20).
The GLUT4 translocation process is under control ofAS160, also known as tre-2/USP6, BUB2, and cdc16 domainfamily member 4 (TBC1D4), and the AS160 paralog TBC1D1(1, 8, 22, 27, 39). In their active forms AS160 and TBC1D1promote hydrolysis of GTP to GDP on Rab proteins andthereby restrain GLUT4 translocation (28). AS160 andTBC1D1 is inactivated through a combination of several phos-phorylations by the upstream kinases Akt and AMP-activatedprotein kinase (AMPK) (21, 32, 35, 39), and this allowsGLUT4 to dock and fuse with the membrane. In muscle of bothrats and humans, phosphorylation of AS160 after exercise hasbeen shown to persist in the hours after termination of anexercise bout, whereas Akt and AMPK phosphorylation re-turns to baseline levels (2, 25). This is associated with a greaterincrease in AS160 phosphorylation when muscles are stimu-lated with insulin 3–4 h postexercise (12, 25, 34). However,this finding has not been consistent in humans (17). UnlikeAS160, TBC1D1 phosphorylation is not retained 3 h postex-ercise in humans (25). In addition, insulin-stimulated TBC1D1phosphorylation is not increased 3.5 and 5 h after cessation ofexercise in humans (25), and similar observations have beenmade in rat skeletal muscle 3 and 27 h after exercise (12). Itwas recently found that acute exercise in humans results inphosphorylation of both AS160 and TBC1D1 in skeletal mus-cle and that specific AMPK trimer complexes may phosphor-ylate AS160 and TBC1D1 (11, 19, 36). Thus it is possible thatTBC1D1 may be involved in the acute effects of exercise,whereas phosphorylation events on AS160 increase bothGLUT4 mobilization and insulin sensitivity in the hours afterexercise. To date only few studies have investigated site-specific phosphorylation events of AS160 and TBC1D1 inhuman skeletal muscle and more data are warranted to outline
Address for reprint requests and other correspondence: N. Jessen, ResearchLaboratory for Biochemical Pathology, Institute for Clinical Medicine, AarhusUniv. Hospital, Nørrebrogade 44, DK-8000 Aarhus C (e-mail: [email protected]).
J Appl Physiol 117: 289–296, 2014.First published May 29, 2014; doi:10.1152/japplphysiol.00044.2014.
8750-7587/14 Copyright © 2014 the American Physiological Societyhttp://www.jappl.org 289
by 10.220.33.3 on Novem
ber 10, 2017http://jap.physiology.org/
Dow
nloaded from
the role of these Rab-GAPs in contraction- and insulin-stimu-lated glucose uptake in humans.
We therefore investigated the phosphorylation at AS160and TBC1D1 in muscle biopsies from healthy humansobtained 30 min after a single bout of endurance exerciseand during a hyperinsulinemic euglycemic clamp initiated4 h postexercise.
METHODS
Ethical approval. All participants gave their written informedconsent after being given oral and written information regarding thestudy, in accordance with the Declaration of Helsinki II. The AarhusCounty local ethics scientific committee approved the study.
Subjects. Eight healthy men (age 26 � 4 yr, body weight 82.9 �8.8 kg, body mass index 23.8 � 1.6 kg/m2, and V̇O2 peak 4,189 �465.5 ml/min) participated. The subjects did not take prescriptionmedicine or have any family history of diabetes. Before completion ofthe experimental protocol, subjects completed an incremental V̇O2 peak
test on a Jaeger ER800 bicycle ergometer. The load was increaseduntil exhaustion. Rates of oxygen uptake and carbon dioxide releasewere determined using an automated breath-by-breath gas exchangeanalyzer (Oxycon Delta, Erich Jaeger, Germany). The maximal ob-tained V̇O2 for each subject was used to calculate the workloadcorresponding to 65% of V̇O2 peak.
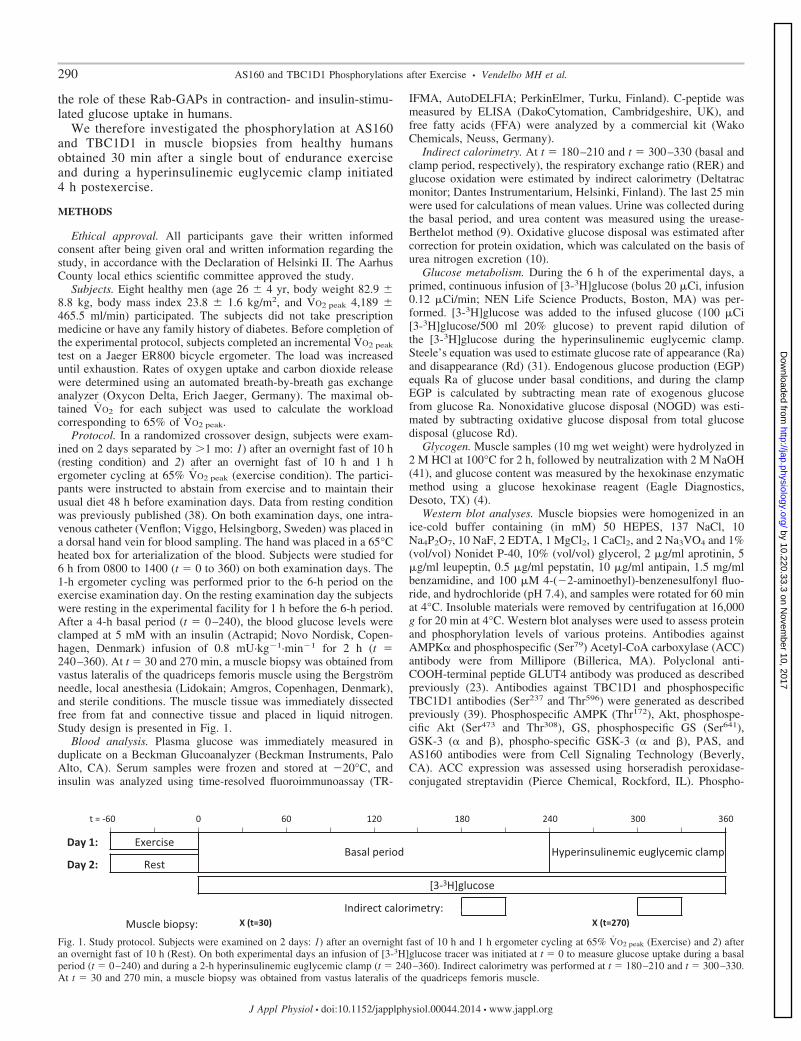
Protocol. In a randomized crossover design, subjects were exam-ined on 2 days separated by �1 mo: 1) after an overnight fast of 10 h(resting condition) and 2) after an overnight fast of 10 h and 1 hergometer cycling at 65% V̇O2 peak (exercise condition). The partici-pants were instructed to abstain from exercise and to maintain theirusual diet 48 h before examination days. Data from resting conditionwas previously published (38). On both examination days, one intra-venous catheter (Venflon; Viggo, Helsingborg, Sweden) was placed ina dorsal hand vein for blood sampling. The hand was placed in a 65°Cheated box for arterialization of the blood. Subjects were studied for6 h from 0800 to 1400 (t � 0 to 360) on both examination days. The1-h ergometer cycling was performed prior to the 6-h period on theexercise examination day. On the resting examination day the subjectswere resting in the experimental facility for 1 h before the 6-h period.After a 4-h basal period (t � 0–240), the blood glucose levels wereclamped at 5 mM with an insulin (Actrapid; Novo Nordisk, Copen-hagen, Denmark) infusion of 0.8 mU·kg�1·min�1 for 2 h (t �240–360). At t � 30 and 270 min, a muscle biopsy was obtained fromvastus lateralis of the quadriceps femoris muscle using the Bergströmneedle, local anesthesia (Lidokain; Amgros, Copenhagen, Denmark),and sterile conditions. The muscle tissue was immediately dissectedfree from fat and connective tissue and placed in liquid nitrogen.Study design is presented in Fig. 1.
Blood analysis. Plasma glucose was immediately measured induplicate on a Beckman Glucoanalyzer (Beckman Instruments, PaloAlto, CA). Serum samples were frozen and stored at �20°C, andinsulin was analyzed using time-resolved fluoroimmunoassay (TR-
IFMA, AutoDELFIA; PerkinElmer, Turku, Finland). C-peptide wasmeasured by ELISA (DakoCytomation, Cambridgeshire, UK), andfree fatty acids (FFA) were analyzed by a commercial kit (WakoChemicals, Neuss, Germany).
Indirect calorimetry. At t � 180–210 and t � 300–330 (basal andclamp period, respectively), the respiratory exchange ratio (RER) andglucose oxidation were estimated by indirect calorimetry (Deltatracmonitor; Dantes Instrumentarium, Helsinki, Finland). The last 25 minwere used for calculations of mean values. Urine was collected duringthe basal period, and urea content was measured using the urease-Berthelot method (9). Oxidative glucose disposal was estimated aftercorrection for protein oxidation, which was calculated on the basis ofurea nitrogen excretion (10).
Glucose metabolism. During the 6 h of the experimental days, aprimed, continuous infusion of [3-3H]glucose (bolus 20 �Ci, infusion0.12 �Ci/min; NEN Life Science Products, Boston, MA) was per-formed. [3-3H]glucose was added to the infused glucose (100 �Ci[3-3H]glucose/500 ml 20% glucose) to prevent rapid dilution ofthe [3-3H]glucose during the hyperinsulinemic euglycemic clamp.Steele’s equation was used to estimate glucose rate of appearance (Ra)and disappearance (Rd) (31). Endogenous glucose production (EGP)equals Ra of glucose under basal conditions, and during the clampEGP is calculated by subtracting mean rate of exogenous glucosefrom glucose Ra. Nonoxidative glucose disposal (NOGD) was esti-mated by subtracting oxidative glucose disposal from total glucosedisposal (glucose Rd).
Glycogen. Muscle samples (10 mg wet weight) were hydrolyzed in2 M HCl at 100°C for 2 h, followed by neutralization with 2 M NaOH(41), and glucose content was measured by the hexokinase enzymaticmethod using a glucose hexokinase reagent (Eagle Diagnostics,Desoto, TX) (4).
Western blot analyses. Muscle biopsies were homogenized in anice-cold buffer containing (in mM) 50 HEPES, 137 NaCl, 10Na4P2O7, 10 NaF, 2 EDTA, 1 MgCl2, 1 CaCl2, and 2 Na3VO4 and 1%(vol/vol) Nonidet P-40, 10% (vol/vol) glycerol, 2 �g/ml aprotinin, 5�g/ml leupeptin, 0.5 �g/ml pepstatin, 10 �g/ml antipain, 1.5 mg/mlbenzamidine, and 100 �M 4-(�2-aminoethyl)-benzenesulfonyl fluo-ride, and hydrochloride (pH 7.4), and samples were rotated for 60 minat 4°C. Insoluble materials were removed by centrifugation at 16,000g for 20 min at 4°C. Western blot analyses were used to assess proteinand phosphorylation levels of various proteins. Antibodies againstAMPK� and phosphospecific (Ser79) Acetyl-CoA carboxylase (ACC)antibody were from Millipore (Billerica, MA). Polyclonal anti-COOH-terminal peptide GLUT4 antibody was produced as describedpreviously (23). Antibodies against TBC1D1 and phosphospecificTBC1D1 antibodies (Ser237 and Thr596) were generated as describedpreviously (39). Phosphospecific AMPK (Thr172), Akt, phosphospe-cific Akt (Ser473 and Thr308), GS, phosphospecific GS (Ser641),GSK-3 (� and �), phospho-specific GSK-3 (� and �), PAS, andAS160 antibodies were from Cell Signaling Technology (Beverly,CA). ACC expression was assessed using horseradish peroxidase-conjugated streptavidin (Pierce Chemical, Rockford, IL). Phospho-
Fig. 1. Study protocol. Subjects were examined on 2 days: 1) after an overnight fast of 10 h and 1 h ergometer cycling at 65% V̇O2 peak (Exercise) and 2) afteran overnight fast of 10 h (Rest). On both experimental days an infusion of [3-3H]glucose tracer was initiated at t � 0 to measure glucose uptake during a basalperiod (t � 0–240) and during a 2-h hyperinsulinemic euglycemic clamp (t � 240–360). Indirect calorimetry was performed at t � 180–210 and t � 300–330.At t � 30 and 270 min, a muscle biopsy was obtained from vastus lateralis of the quadriceps femoris muscle.
290 AS160 and TBC1D1 Phosphorylations after Exercise • Vendelbo MH et al.
J Appl Physiol • doi:10.1152/japplphysiol.00044.2014 • www.jappl.org
by 10.220.33.3 on Novem
ber 10, 2017http://jap.physiology.org/
Dow
nloaded from
specific AS160 (Ser341, Ser588, Thr642, Ser704, and Ser751) antibodieswere generated as described previously (13, 37). Proteins were visu-alized by BioWest enhanced chemiluminescence (Pierce) and quan-tified using UVP BioImaging System (UVP, Upland, CA). Themembranes were stripped after Western blot analyses of phosphory-lated proteins, and then total expression of the same proteins weremeasured. Quantifications of protein phosphorylation are expressed asa ratio of total protein expression measured on the same membranes.
Statistical analysis. Results are expressed as means � SE. Normaldistribution was assessed by inspection of QQ plots, and the LeveneMedian test was used to test for equal variance. Isolated comparisonsbetween resting and exercise were assessed by a paired t-test. Com-parisons between the main effects of exercise and insulin stimulationwere assessed by two-way repeated-measurements ANOVA. One-way repeated-measurements ANOVA were used to compare fordifferences in site-specific AS160 phosphorylation. When the repeat-
Table 1. Glucose, insulin, C-peptide, glucagon, FFA concentrations in serum, and energy expenditure were determined afteran overnight fast (rest) and after 1 h ergometer cycling at 65% V̇O2peak
t � 0 (Basal Condition) t � 360 (Clamp Condition)
Rest Exercise Rest vs. Exercise Rest Exercise Rest vs. Exercise
Glucose, mmol/l 5.3 � 0.10 5.4 � 0.23 P � 0.70 4.9 � 0.10 4.8 � 0.06 P � 0.37Insulin, pmol/l 47 � 6 65 � 13 P � 0.18 271 � 7 276 � 16 P � 0.75C-peptide, pmol/l 604 � 76 728 � 160 P � 0.24 307 � 51 244 � 58 P � 0.14Glucagon, pg/ml 50 � 10 124 � 22 P � 0.005 26 � 6 39 � 11 P � 0.19FFA, mmol/l 0.53 � 0.10 0.92 � 0.22 P � 0.19 0.08 � 0.02 0.09 � 0.04 P � 0.68Energy expenditure, kcal/day 1,901 � 44 2,188 � 90 P � 0.002 1,891 � 43 2063 � 62 P � 0.001
Values are means � SE. Measurements were performed on both examination days at t � 0 (basal condition) and at t � 360 (clamp condition). Exercise, 65%V̇O2peak; FFA, free fatty acid. Energy expenditure was measured at t � 180–210 and t � 300–330 (basal and clamp conditions, respectively).
* # §
§
# § # §
# §
§
p=0.057
# § # §
BA
DC
E
Exercise - - + + Insulin - + - +
Exercise - - + + Insulin - + - +
Exercise - - + + Insulin - + - +
Exercise - +Insulin + +
Exercise - - + + Insulin - + - +
Res
pira
tory
Exc
hang
e R
atio
Glu
cose
Oxi
datio
n (m
g/kg
/min
)
GIR
(mg/
kg/m
in)
EG
P (m
g/kg
/min
)
Glu
cose
RD (m
g/kg
/min
)
††
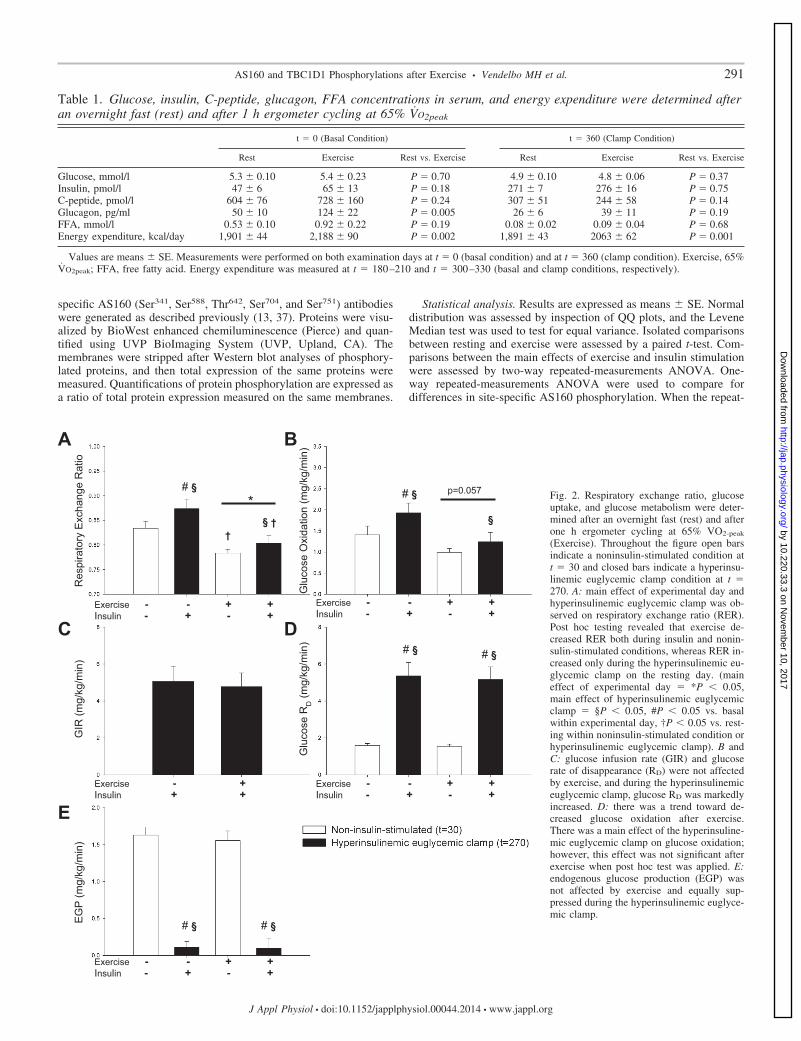
Fig. 2. Respiratory exchange ratio, glucoseuptake, and glucose metabolism were deter-mined after an overnight fast (rest) and afterone h ergometer cycling at 65% VO2-peak
(Exercise). Throughout the figure open barsindicate a noninsulin-stimulated condition att � 30 and closed bars indicate a hyperinsu-linemic euglycemic clamp condition at t �270. A: main effect of experimental day andhyperinsulinemic euglycemic clamp was ob-served on respiratory exchange ratio (RER).Post hoc testing revealed that exercise de-creased RER both during insulin and nonin-sulin-stimulated conditions, whereas RER in-creased only during the hyperinsulinemic eu-glycemic clamp on the resting day. (maineffect of experimental day � *P 0.05,main effect of hyperinsulinemic euglycemicclamp � §P 0.05, #P 0.05 vs. basalwithin experimental day, †P 0.05 vs. rest-ing within noninsulin-stimulated condition orhyperinsulinemic euglycemic clamp). B andC: glucose infusion rate (GIR) and glucoserate of disappearance (RD) were not affectedby exercise, and during the hyperinsulinemiceuglycemic clamp, glucose RD was markedlyincreased. D: there was a trend toward de-creased glucose oxidation after exercise.There was a main effect of the hyperinsuline-mic euglycemic clamp on glucose oxidation;however, this effect was not significant afterexercise when post hoc test was applied. E:endogenous glucose production (EGP) wasnot affected by exercise and equally sup-pressed during the hyperinsulinemic euglyce-mic clamp.
291AS160 and TBC1D1 Phosphorylations after Exercise • Vendelbo MH et al.
J Appl Physiol • doi:10.1152/japplphysiol.00044.2014 • www.jappl.org
by 10.220.33.3 on Novem
ber 10, 2017http://jap.physiology.org/
Dow
nloaded from
ed-measurements ANOVA revealed significant interactions or differ-ences between means, Student-Newman-Keul’s post hoc test wasperformed to detect specific differences. P 0.05 was consideredsignificant.
RESULTS
Substrate oxidation and insulin responsiveness. One hourergometer cycling at 65% of V̇O2 peak, 177 � 4 W, increasedcirculating glucagon levels, whereas FFA, glucose, insulin, and
c-peptide were not significantly altered (Table 1). This wasassociated with slightly increased resting energy expenditure(REE) after exercise (Table 1) together with significantlyreduced RER and a trend toward decreased glucose oxidation(P � 0.057, power: 0.418) (Fig. 2, A and B). A hyperinsuline-mic euglycemic clamp was used to assess insulin responsive-ness, and no differences were observed in insulin concentra-tions and glucose infusion rates (GIR) on the 2 experimentaldays (Table 1 and Fig. 2C). During the hyperinsulinemic
* * *
*
* *
*
BA
C
* *°
* * * *
*°
*
* *
*°
* °
TBC1D1 AS160
TBC1D1 AS160
p-Ser588
p-Ser341
p-Thr642
p-Ser704
p-Ser751
PAS
ACC p-Ser79
GS
p-Thr172
AMPK
p-Ser473
TBC1D1 p-Thr596
p-Ser237
total
total
p-Thr308
total
total
total
p-Ser641
total
Exercise - - + +
Insulin - + - +
AS160
Akt
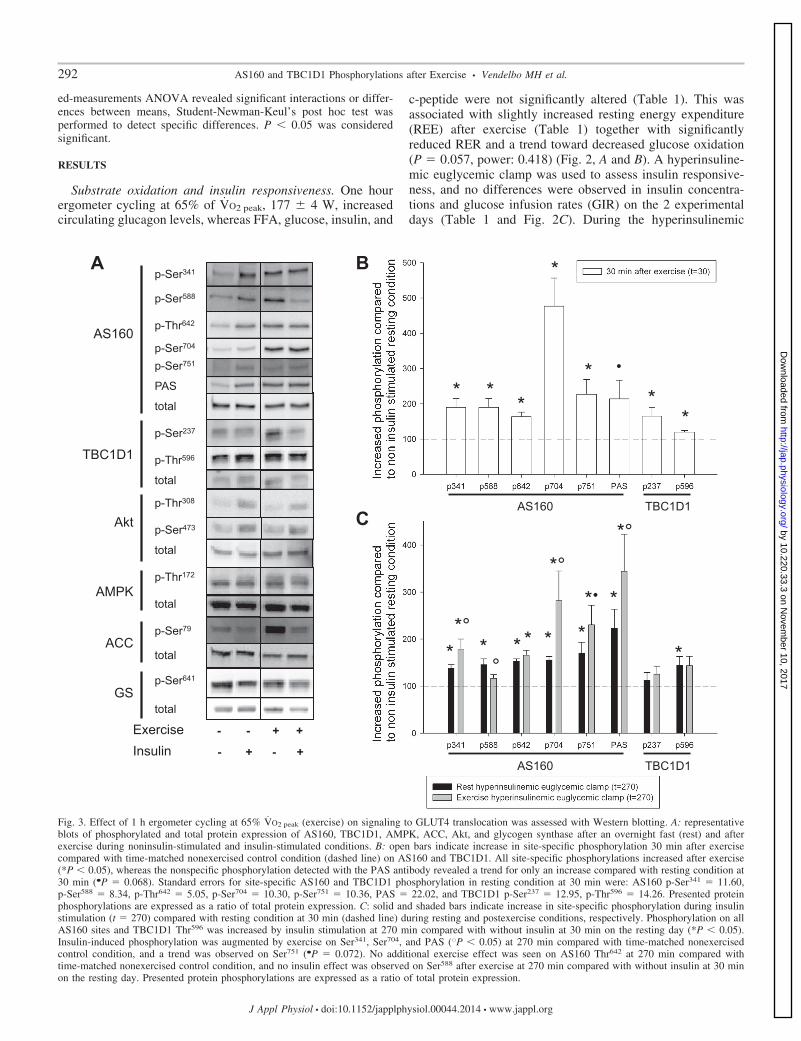
Fig. 3. Effect of 1 h ergometer cycling at 65% V̇O2 peak (exercise) on signaling to GLUT4 translocation was assessed with Western blotting. A: representativeblots of phosphorylated and total protein expression of AS160, TBC1D1, AMPK, ACC, Akt, and glycogen synthase after an overnight fast (rest) and afterexercise during noninsulin-stimulated and insulin-stimulated conditions. B: open bars indicate increase in site-specific phosphorylation 30 min after exercisecompared with time-matched nonexercised control condition (dashed line) on AS160 and TBC1D1. All site-specific phosphorylations increased after exercise(*P 0.05), whereas the nonspecific phosphorylation detected with the PAS antibody revealed a trend for only an increase compared with resting condition at30 min (�P � 0.068). Standard errors for site-specific AS160 and TBC1D1 phosphorylation in resting condition at 30 min were: AS160 p-Ser341 � 11.60,p-Ser588 � 8.34, p-Thr642 � 5.05, p-Ser704 � 10.30, p-Ser751 � 10.36, PAS � 22.02, and TBC1D1 p-Ser237 � 12.95, p-Thr596 � 14.26. Presented proteinphosphorylations are expressed as a ratio of total protein expression. C: solid and shaded bars indicate increase in site-specific phosphorylation during insulinstimulation (t � 270) compared with resting condition at 30 min (dashed line) during resting and postexercise conditions, respectively. Phosphorylation on allAS160 sites and TBC1D1 Thr596 was increased by insulin stimulation at 270 min compared with without insulin at 30 min on the resting day (*P 0.05).Insulin-induced phosphorylation was augmented by exercise on Ser341, Ser704, and PAS (ŒP 0.05) at 270 min compared with time-matched nonexercisedcontrol condition, and a trend was observed on Ser751 (�P � 0.072). No additional exercise effect was seen on AS160 Thr642 at 270 min compared withtime-matched nonexercised control condition, and no insulin effect was observed on Ser588 after exercise at 270 min compared with without insulin at 30 minon the resting day. Presented protein phosphorylations are expressed as a ratio of total protein expression.
292 AS160 and TBC1D1 Phosphorylations after Exercise • Vendelbo MH et al.
J Appl Physiol • doi:10.1152/japplphysiol.00044.2014 • www.jappl.org
by 10.220.33.3 on Novem
ber 10, 2017http://jap.physiology.org/
Dow
nloaded from
euglycemic clamp, RER and glucose oxidation were signifi-cantly increased on the control day, but after exercise thisincrease did not reach significance (P � 0.15 and P � 0.20,respectively) (Fig. 2, A and B). Endogenous glucose production(EGP) and glucose disposal rate (Rd) were not affected 210–240 min after exercise. The hyperinsulinemic euglycemicclamp markedly suppressed EGP and increased glucose Rdwithout any effect of prior exercise (Fig. 2, D and E).
AS160 and TBC1D1 phosphorylation. We determinedAS160 phosphorylation on five sites: Ser341, Ser588, Thr642,Ser704, and Ser751. In addition, the PAS antibody was used todetermine nonspecific AS160 phosphorylation. Significantlyincreased phosphorylation was evident on all specific AS160phosphorylation sites 30 min after exercise compared withtime-matched resting values, whereas the PAS antibody re-vealed a trend (P � 0.068, power: 0.370; Fig. 3B). There wasa significant exercise hyperinsulinemic euglycemic clampinteraction on all specific AS160 phosphorylation sites. One-way repeated-measurements ANOVA was used to compareAS160 phosphorylation in resting, resting insulin-stimulated,and exercised insulin-stimulated conditions. On the restingday, insulin stimulation increased AS160 phosphorylation onall sites. Phosphorylation on Ser341, Ser704, and PAS wereincreased during insulin stimulation on the exercise day com-pared with the resting day, and a strong trend toward increasedphosphorylation was observed on Ser751 (P � 0.072, power:0.905). Thr642 phosphorylation was increased during insulinstimulation but not affected by exercise. Ser588 phosphoryla-tion was increased by insulin on the resting day, however, nosignificant insulin effect was observed after exercise. OnTBC1D1, both Ser237 and Thr596 phosphorylation were in-
creased 30 min after exercise. A main effect of insulin stimu-lation was observed on Thr596 phosphorylation, and post hoctesting only revealed a significant effect on the resting day.Ser237 phosphorylation was unaffected during insulin stimula-tion on both experimental days (Fig. 3C).
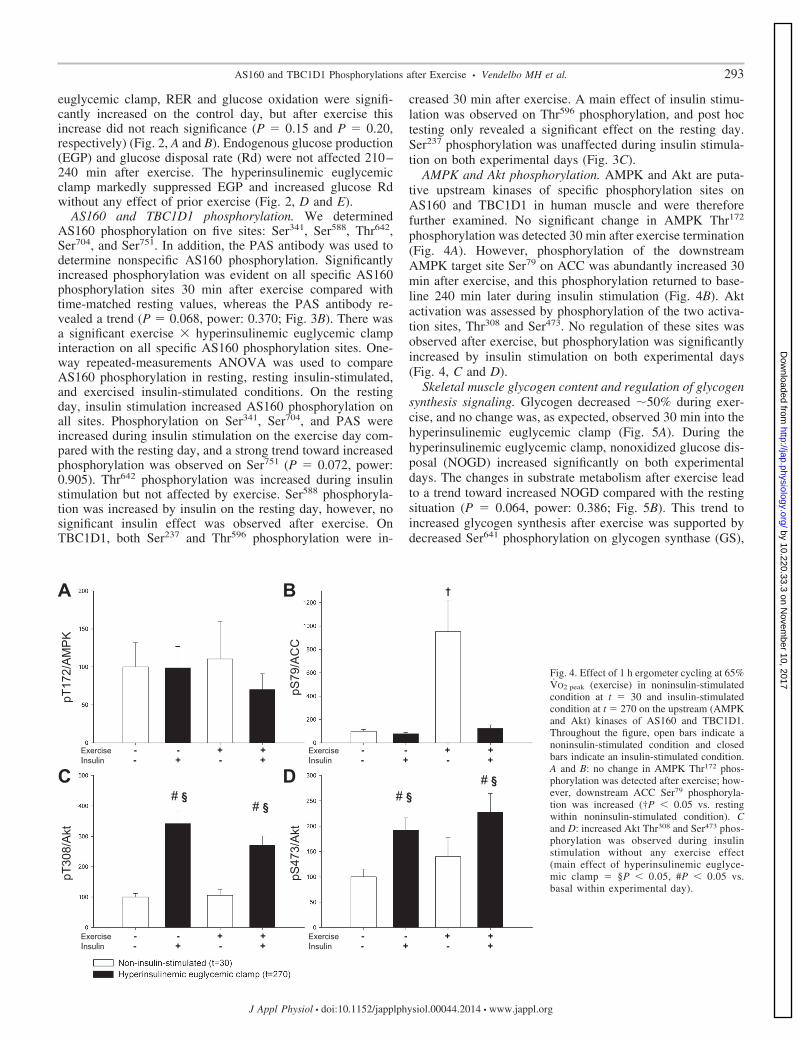
AMPK and Akt phosphorylation. AMPK and Akt are puta-tive upstream kinases of specific phosphorylation sites onAS160 and TBC1D1 in human muscle and were thereforefurther examined. No significant change in AMPK Thr172
phosphorylation was detected 30 min after exercise termination(Fig. 4A). However, phosphorylation of the downstreamAMPK target site Ser79 on ACC was abundantly increased 30min after exercise, and this phosphorylation returned to base-line 240 min later during insulin stimulation (Fig. 4B). Aktactivation was assessed by phosphorylation of the two activa-tion sites, Thr308 and Ser473. No regulation of these sites wasobserved after exercise, but phosphorylation was significantlyincreased by insulin stimulation on both experimental days(Fig. 4, C and D).
Skeletal muscle glycogen content and regulation of glycogensynthesis signaling. Glycogen decreased �50% during exer-cise, and no change was, as expected, observed 30 min into thehyperinsulinemic euglycemic clamp (Fig. 5A). During thehyperinsulinemic euglycemic clamp, nonoxidized glucose dis-posal (NOGD) increased significantly on both experimentaldays. The changes in substrate metabolism after exercise leadto a trend toward increased NOGD compared with the restingsituation (P � 0.064, power: 0.386; Fig. 5B). This trend toincreased glycogen synthesis after exercise was supported bydecreased Ser641 phosphorylation on glycogen synthase (GS),
# § # §
# § # §
BA
DCExercise - - + + Insulin - + - +
Exercise - - + + Insulin - + - +
Exercise - - + + Insulin - + - +
Exercise - - + + Insulin - + - +
pS47
3/A
ktpS
79/A
CC
pT30
8/A
ktpT
172/
AM
PK
†
Fig. 4. Effect of 1 h ergometer cycling at 65%V̇O2 peak (exercise) in noninsulin-stimulatedcondition at t � 30 and insulin-stimulatedcondition at t � 270 on the upstream (AMPKand Akt) kinases of AS160 and TBC1D1.Throughout the figure, open bars indicate anoninsulin-stimulated condition and closedbars indicate an insulin-stimulated condition.A and B: no change in AMPK Thr172 phos-phorylation was detected after exercise; how-ever, downstream ACC Ser79 phosphoryla-tion was increased (†P 0.05 vs. restingwithin noninsulin-stimulated condition). Cand D: increased Akt Thr308 and Ser473 phos-phorylation was observed during insulinstimulation without any exercise effect(main effect of hyperinsulinemic euglyce-mic clamp � §P 0.05, #P 0.05 vs.basal within experimental day).
293AS160 and TBC1D1 Phosphorylations after Exercise • Vendelbo MH et al.
J Appl Physiol • doi:10.1152/japplphysiol.00044.2014 • www.jappl.org
by 10.220.33.3 on Novem
ber 10, 2017http://jap.physiology.org/
Dow
nloaded from
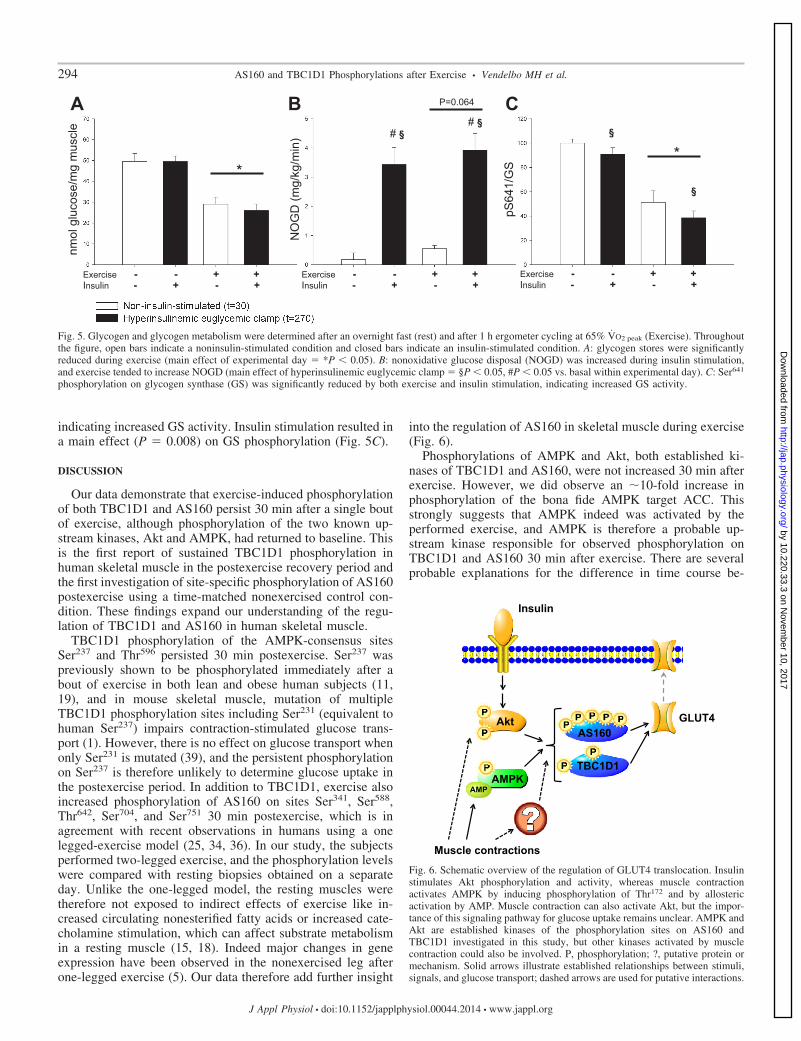
indicating increased GS activity. Insulin stimulation resulted ina main effect (P � 0.008) on GS phosphorylation (Fig. 5C).
DISCUSSION
Our data demonstrate that exercise-induced phosphorylationof both TBC1D1 and AS160 persist 30 min after a single boutof exercise, although phosphorylation of the two known up-stream kinases, Akt and AMPK, had returned to baseline. Thisis the first report of sustained TBC1D1 phosphorylation inhuman skeletal muscle in the postexercise recovery period andthe first investigation of site-specific phosphorylation of AS160postexercise using a time-matched nonexercised control con-dition. These findings expand our understanding of the regu-lation of TBC1D1 and AS160 in human skeletal muscle.
TBC1D1 phosphorylation of the AMPK-consensus sitesSer237 and Thr596 persisted 30 min postexercise. Ser237 waspreviously shown to be phosphorylated immediately after about of exercise in both lean and obese human subjects (11,19), and in mouse skeletal muscle, mutation of multipleTBC1D1 phosphorylation sites including Ser231 (equivalent tohuman Ser237) impairs contraction-stimulated glucose trans-port (1). However, there is no effect on glucose transport whenonly Ser231 is mutated (39), and the persistent phosphorylationon Ser237 is therefore unlikely to determine glucose uptake inthe postexercise period. In addition to TBC1D1, exercise alsoincreased phosphorylation of AS160 on sites Ser341, Ser588,Thr642, Ser704, and Ser751 30 min postexercise, which is inagreement with recent observations in humans using a onelegged-exercise model (25, 34, 36). In our study, the subjectsperformed two-legged exercise, and the phosphorylation levelswere compared with resting biopsies obtained on a separateday. Unlike the one-legged model, the resting muscles weretherefore not exposed to indirect effects of exercise like in-creased circulating nonesterified fatty acids or increased cate-cholamine stimulation, which can affect substrate metabolismin a resting muscle (15, 18). Indeed major changes in geneexpression have been observed in the nonexercised leg afterone-legged exercise (5). Our data therefore add further insight
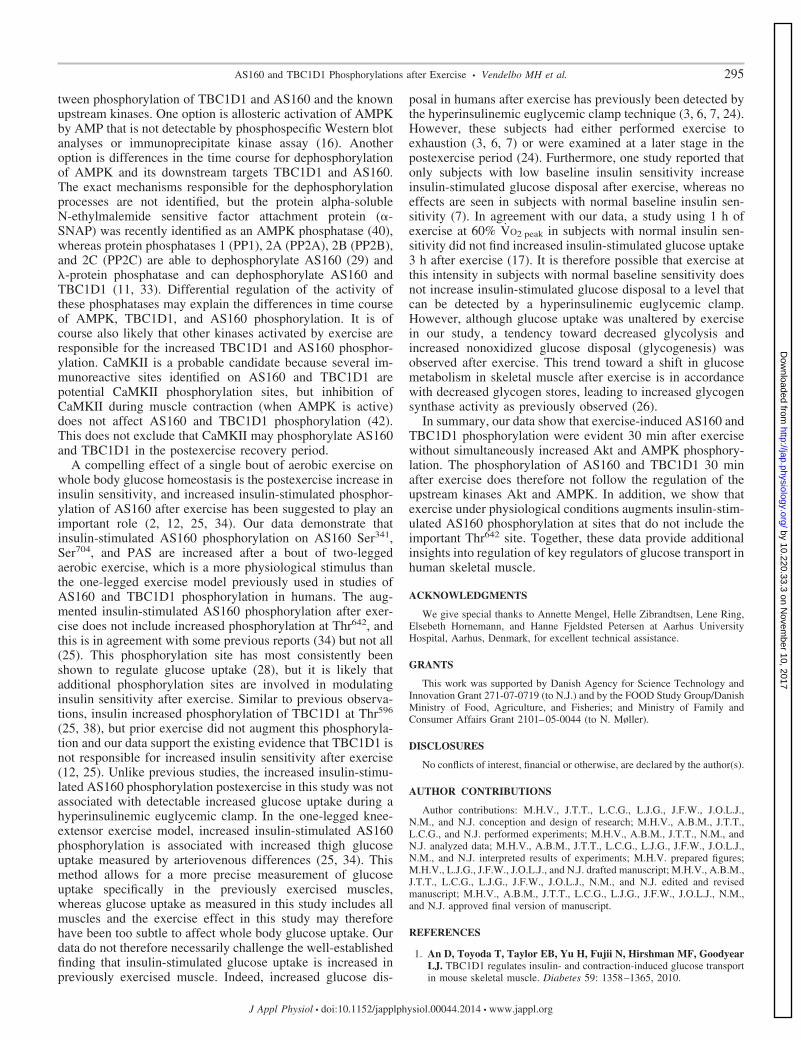
into the regulation of AS160 in skeletal muscle during exercise(Fig. 6).
Phosphorylations of AMPK and Akt, both established ki-nases of TBC1D1 and AS160, were not increased 30 min afterexercise. However, we did observe an �10-fold increase inphosphorylation of the bona fide AMPK target ACC. Thisstrongly suggests that AMPK indeed was activated by theperformed exercise, and AMPK is therefore a probable up-stream kinase responsible for observed phosphorylation onTBC1D1 and AS160 30 min after exercise. There are severalprobable explanations for the difference in time course be-
*
# § # §
P=0.064
* §
§
C B A
Exercise - - + + Insulin - + - +
Exercise - - + + Insulin - + - +
Exercise - - + + Insulin - + - +
nmol
glu
cose
/mg
mus
cle
NO
GD
(mg/
kg/m
in)
pS64
1/G
S
Fig. 5. Glycogen and glycogen metabolism were determined after an overnight fast (rest) and after 1 h ergometer cycling at 65% V̇O2 peak (Exercise). Throughoutthe figure, open bars indicate a noninsulin-stimulated condition and closed bars indicate an insulin-stimulated condition. A: glycogen stores were significantlyreduced during exercise (main effect of experimental day � *P 0.05). B: nonoxidative glucose disposal (NOGD) was increased during insulin stimulation,and exercise tended to increase NOGD (main effect of hyperinsulinemic euglycemic clamp � §P 0.05, #P 0.05 vs. basal within experimental day). C: Ser641
phosphorylation on glycogen synthase (GS) was significantly reduced by both exercise and insulin stimulation, indicating increased GS activity.
Akt
AMPK AMP
AS160
TBC1D1
GLUT4
Insulin
Muscle contractions
Fig. 6. Schematic overview of the regulation of GLUT4 translocation. Insulinstimulates Akt phosphorylation and activity, whereas muscle contractionactivates AMPK by inducing phosphorylation of Thr172 and by allostericactivation by AMP. Muscle contraction can also activate Akt, but the impor-tance of this signaling pathway for glucose uptake remains unclear. AMPK andAkt are established kinases of the phosphorylation sites on AS160 andTBC1D1 investigated in this study, but other kinases activated by musclecontraction could also be involved. P, phosphorylation; ?, putative protein ormechanism. Solid arrows illustrate established relationships between stimuli,signals, and glucose transport; dashed arrows are used for putative interactions.
294 AS160 and TBC1D1 Phosphorylations after Exercise • Vendelbo MH et al.
J Appl Physiol • doi:10.1152/japplphysiol.00044.2014 • www.jappl.org
by 10.220.33.3 on Novem
ber 10, 2017http://jap.physiology.org/
Dow
nloaded from
tween phosphorylation of TBC1D1 and AS160 and the knownupstream kinases. One option is allosteric activation of AMPKby AMP that is not detectable by phosphospecific Western blotanalyses or immunoprecipitate kinase assay (16). Anotheroption is differences in the time course for dephosphorylationof AMPK and its downstream targets TBC1D1 and AS160.The exact mechanisms responsible for the dephosphorylationprocesses are not identified, but the protein alpha-solubleN-ethylmalemide sensitive factor attachment protein (�-SNAP) was recently identified as an AMPK phosphatase (40),whereas protein phosphatases 1 (PP1), 2A (PP2A), 2B (PP2B),and 2C (PP2C) are able to dephosphorylate AS160 (29) and�-protein phosphatase and can dephosphorylate AS160 andTBC1D1 (11, 33). Differential regulation of the activity ofthese phosphatases may explain the differences in time courseof AMPK, TBC1D1, and AS160 phosphorylation. It is ofcourse also likely that other kinases activated by exercise areresponsible for the increased TBC1D1 and AS160 phosphor-ylation. CaMKII is a probable candidate because several im-munoreactive sites identified on AS160 and TBC1D1 arepotential CaMKII phosphorylation sites, but inhibition ofCaMKII during muscle contraction (when AMPK is active)does not affect AS160 and TBC1D1 phosphorylation (42).This does not exclude that CaMKII may phosphorylate AS160and TBC1D1 in the postexercise recovery period.
A compelling effect of a single bout of aerobic exercise onwhole body glucose homeostasis is the postexercise increase ininsulin sensitivity, and increased insulin-stimulated phosphor-ylation of AS160 after exercise has been suggested to play animportant role (2, 12, 25, 34). Our data demonstrate thatinsulin-stimulated AS160 phosphorylation on AS160 Ser341,Ser704, and PAS are increased after a bout of two-leggedaerobic exercise, which is a more physiological stimulus thanthe one-legged exercise model previously used in studies ofAS160 and TBC1D1 phosphorylation in humans. The aug-mented insulin-stimulated AS160 phosphorylation after exer-cise does not include increased phosphorylation at Thr642, andthis is in agreement with some previous reports (34) but not all(25). This phosphorylation site has most consistently beenshown to regulate glucose uptake (28), but it is likely thatadditional phosphorylation sites are involved in modulatinginsulin sensitivity after exercise. Similar to previous observa-tions, insulin increased phosphorylation of TBC1D1 at Thr596
(25, 38), but prior exercise did not augment this phosphoryla-tion and our data support the existing evidence that TBC1D1 isnot responsible for increased insulin sensitivity after exercise(12, 25). Unlike previous studies, the increased insulin-stimu-lated AS160 phosphorylation postexercise in this study was notassociated with detectable increased glucose uptake during ahyperinsulinemic euglycemic clamp. In the one-legged knee-extensor exercise model, increased insulin-stimulated AS160phosphorylation is associated with increased thigh glucoseuptake measured by arteriovenous differences (25, 34). Thismethod allows for a more precise measurement of glucoseuptake specifically in the previously exercised muscles,whereas glucose uptake as measured in this study includes allmuscles and the exercise effect in this study may thereforehave been too subtle to affect whole body glucose uptake. Ourdata do not therefore necessarily challenge the well-establishedfinding that insulin-stimulated glucose uptake is increased inpreviously exercised muscle. Indeed, increased glucose dis-
posal in humans after exercise has previously been detected bythe hyperinsulinemic euglycemic clamp technique (3, 6, 7, 24).However, these subjects had either performed exercise toexhaustion (3, 6, 7) or were examined at a later stage in thepostexercise period (24). Furthermore, one study reported thatonly subjects with low baseline insulin sensitivity increaseinsulin-stimulated glucose disposal after exercise, whereas noeffects are seen in subjects with normal baseline insulin sen-sitivity (7). In agreement with our data, a study using 1 h ofexercise at 60% V̇O2 peak in subjects with normal insulin sen-sitivity did not find increased insulin-stimulated glucose uptake3 h after exercise (17). It is therefore possible that exercise atthis intensity in subjects with normal baseline sensitivity doesnot increase insulin-stimulated glucose disposal to a level thatcan be detected by a hyperinsulinemic euglycemic clamp.However, although glucose uptake was unaltered by exercisein our study, a tendency toward decreased glycolysis andincreased nonoxidized glucose disposal (glycogenesis) wasobserved after exercise. This trend toward a shift in glucosemetabolism in skeletal muscle after exercise is in accordancewith decreased glycogen stores, leading to increased glycogensynthase activity as previously observed (26).
In summary, our data show that exercise-induced AS160 andTBC1D1 phosphorylation were evident 30 min after exercisewithout simultaneously increased Akt and AMPK phosphory-lation. The phosphorylation of AS160 and TBC1D1 30 minafter exercise does therefore not follow the regulation of theupstream kinases Akt and AMPK. In addition, we show thatexercise under physiological conditions augments insulin-stim-ulated AS160 phosphorylation at sites that do not include theimportant Thr642 site. Together, these data provide additionalinsights into regulation of key regulators of glucose transport inhuman skeletal muscle.
ACKNOWLEDGMENTS
We give special thanks to Annette Mengel, Helle Zibrandtsen, Lene Ring,Elsebeth Hornemann, and Hanne Fjeldsted Petersen at Aarhus UniversityHospital, Aarhus, Denmark, for excellent technical assistance.
GRANTS
This work was supported by Danish Agency for Science Technology andInnovation Grant 271-07-0719 (to N.J.) and by the FOOD Study Group/DanishMinistry of Food, Agriculture, and Fisheries; and Ministry of Family andConsumer Affairs Grant 2101–05-0044 (to N. Møller).
DISCLOSURES
No conflicts of interest, financial or otherwise, are declared by the author(s).
AUTHOR CONTRIBUTIONS
Author contributions: M.H.V., J.T.T., L.C.G., L.J.G., J.F.W., J.O.L.J.,N.M., and N.J. conception and design of research; M.H.V., A.B.M., J.T.T.,L.C.G., and N.J. performed experiments; M.H.V., A.B.M., J.T.T., N.M., andN.J. analyzed data; M.H.V., A.B.M., J.T.T., L.C.G., L.J.G., J.F.W., J.O.L.J.,N.M., and N.J. interpreted results of experiments; M.H.V. prepared figures;M.H.V., L.J.G., J.F.W., J.O.L.J., and N.J. drafted manuscript; M.H.V., A.B.M.,J.T.T., L.C.G., L.J.G., J.F.W., J.O.L.J., N.M., and N.J. edited and revisedmanuscript; M.H.V., A.B.M., J.T.T., L.C.G., L.J.G., J.F.W., J.O.L.J., N.M.,and N.J. approved final version of manuscript.
REFERENCES
1. An D, Toyoda T, Taylor EB, Yu H, Fujii N, Hirshman MF, GoodyearLJ. TBC1D1 regulates insulin- and contraction-induced glucose transportin mouse skeletal muscle. Diabetes 59: 1358–1365, 2010.
295AS160 and TBC1D1 Phosphorylations after Exercise • Vendelbo MH et al.
J Appl Physiol • doi:10.1152/japplphysiol.00044.2014 • www.jappl.org
by 10.220.33.3 on Novem
ber 10, 2017http://jap.physiology.org/
Dow
nloaded from
2. Arias EB, Kim J, Funai K, Cartee GD. Prior exercise increases phos-phorylation of Akt substrate of 160 kDa (AS160) in rat skeletal muscle.Am J Physiol Endocrinol Metab 292: E1191–E1200, 2007.
3. Bogardus C, Thuillez P, Ravussin E, Vasquez B, Narimiga M, AzharS. Effect of muscle glycogen depletion on in vivo insulin action in man.J Clin Invest 72: 1605–1610, 1983.
4. Bondar RJ, Mead DC. Evaluation of glucose-6-phosphate dehydroge-nase from Leuconostoc mesenteroides in the hexokinase method fordetermining glucose in serum. Clin Chem 20: 586–590, 1974.
5. Catoire M, Mensink M, Boekschoten MV, Hangelbroek R, Muller M,Schrauwen P, Kersten S. Pronounced effects of acute endurance exerciseon gene expression in resting and exercising human skeletal muscle. PLoSOne 7: e51066, 2012.
6. Devlin JT, Hirshman M, Horton ED, Horton ES. Enhanced peripheraland splanchnic insulin sensitivity in NIDDM men after single bout ofexercise. Diabetes 36: 434–439, 1987.
7. Devlin JT, Horton ES. Effects of prior high-intensity exercise on glucosemetabolism in normal and insulin-resistant men. Diabetes 34: 973–979,1985.
8. Eguez L, Lee A, Chavez JA, Miinea CP, Kane S, Lienhard GE,McGraw TE. Full intracellular retention of GLUT4 requires AS160 RabGTPase activating protein. Cell Metab 2: 263–272, 2005.
9. Fawcett JK, Scott JE. A rapid and precise method for the determinationof urea. J Clin Pathol 13: 156–159, 1960.
10. Ferrannini E. The theoretical bases of indirect calorimetry: a review.Metabolism 37: 287–301, 1988.
11. Frosig C, Pehmoller C, Birk JB, Richter EA, Wojtaszewski JF.Exercise-induced TBC1D1 Ser237 phosphorylation and 14–3-3 proteinbinding capacity in human skeletal muscle. J Physiol 588: 4539–4548,2010.
12. Funai K, Schweitzer GG, Sharma N, Kanzaki M, Cartee GD. In-creased AS160 phosphorylation, but not TBC1D1 phosphorylation, withincreased postexercise insulin sensitivity in rat skeletal muscle. Am JPhysiol Endocrinol Metab 297: E242–E251, 2009.
13. Geraghty KM, Chen S, Harthill JE, Ibrahim AF, Toth R, Morrice NA,Vandermoere F, Moorhead GB, Hardie DG, Mackintosh C. Regula-tion of multisite phosphorylation and 14–3-3 binding of AS160 in re-sponse to IGF-1, EGF, PMA and AICAR. Biochem J 407: 231–241, 2007.
14. Goodyear LJ, Kahn BB. Exercise, glucose transport, and insulin sensi-tivity. Annu Rev Med 49: 235–261, 1998.
15. Gormsen LC, Jessen N, Gjedsted J, Gjedde S, Norrelund H, Lund S,Christiansen JS, Nielsen S, Schmitz O, Moller N. Dose-response effectsof free fatty acids on glucose and lipid metabolism during somatostatinblockade of growth hormone and insulin in humans. J Clin EndocrinolMetab 92: 1834–1842, 2007.
16. Gowans GJ, Hawley SA, Ross FA, Hardie DG. AMP is a true physio-logical regulator of AMP-activated protein kinase by both allostericactivation and enhancing net phosphorylation. Cell Metab 18: 556–566,2013.
17. Howlett KF, Mathews A, Garnham A, Sakamoto K. The effect ofexercise and insulin on AS160 phosphorylation and 14–3-3 bindingcapacity in human skeletal muscle. Am J Physiol Endocrinol Metab 294:E401–E407, 2008.
18. Jensen J, Ruge T, Lai YC, Svensson MK, Eriksson JW. Effects ofadrenaline on whole-body glucose metabolism and insulin-mediated reg-ulation of glycogen synthase and PKB phosphorylation in human skeletalmuscle. Metabolism 60: 215–226, 2011.
19. Jessen N, An D, Lihn AS, Nygren J, Hirshman MF, Thorell A,Goodyear LJ. Exercise increases TBC1D1 phosphorylation in humanskeletal muscle. Am J Physiol Endocrinol Metab 301: E164–E171, 2011.
20. Jessen N, Goodyear LJ. Contraction signaling to glucose transport inskeletal muscle. J Appl Physiol 99: 330–337, 2005.
21. Kramer HF, Witczak CA, Fujii N, Jessen N, Taylor EB, Arnolds DE,Sakamoto K, Hirshman MF, Goodyear LJ. Distinct signals regulateAS160 phosphorylation in response to insulin, AICAR, and contraction inmouse skeletal muscle. Diabetes 55: 2067–2076, 2006.
22. Kramer HF, Witczak CA, Taylor EB, Fujii N, Hirshman MF, Good-year LJ. AS160 regulates insulin- and contraction-stimulated glucoseuptake in mouse skeletal muscle. J Biol Chem 281: 31478–31485, 2006.
23. Lund S, Flyvbjerg A, Holman GD, Larsen FS, Pedersen O, Schmitz O.Comparative effects of IGF-I and insulin on the glucose transporter systemin rat muscle. Am J Physiol Endocrinol Metab 267: E461–E466, 1994.
24. Mikines KJ, Sonne B, Farrell PA, Tronier B, Galbo H. Effect ofphysical exercise on sensitivity and responsiveness to insulin in humans.Am J Physiol Endocrinol Metab 254: E248–E259, 1988.
25. Pehmoller C, Brandt N, Birk JB, Hoeg LD, Sjoberg KA, Goodyear LJ,Kiens B, Richter EA, Wojtaszewski JF. Exercise alleviates lipid-in-duced insulin resistance in human skeletal muscle-signaling interaction atthe level of TBC1 domain family member 4. Diabetes 61: 2743–2752,2012.
26. Prats C, Helge JW, Nordby P, Qvortrup K, Ploug T, Dela F, Woj-taszewski JF. Dual regulation of muscle glycogen synthase during exer-cise by activation and compartmentalization. J Biol Chem 284: 15692–15700, 2009.
27. Roach WG, Chavez JA, Miinea CP, Lienhard GE. Substrate specificityand effect on GLUT4 translocation of the Rab GTPase-activating proteinTbc1d1. Biochem J 403: 353–358, 2007.
28. Sakamoto K, Holman GD. Emerging role for AS160/TBC1D4 andTBC1D1 in the regulation of GLUT4 traffic. Am J Physiol EndocrinolMetab 295: E29–E37, 2008.
29. Schweitzer GG, Arias EB, Cartee GD. Sustained postexercise increasesin AS160 Thr642 and Ser588 phosphorylation in skeletal muscle withoutsustained increases in kinase phosphorylation. J Appl Physiol (1985) 113:1852–1861, 2012.
30. Sigal RJ, Kenny GP, Wasserman DH, Castaneda-Sceppa C. Physicalactivity/exercise and type 2 diabetes. Diabetes Care 27: 2518–2539, 2004.
31. Steele R. Influences of glucose loading and of injected insulin on hepaticglucose output. Ann NY Acad Sci 82: 420–430, 1959.
32. Taylor EB, An D, Kramer HF, Yu H, Fujii NL, Roeckl KS, Bowles N,Hirshman MF, Xie J, Feener EP, Goodyear LJ. Discovery of TBC1D1as an insulin-, AICAR-, and contraction-stimulated signaling nexus inmouse skeletal muscle. J Biol Chem 283: 9787–9796, 2008.
33. Treebak JT, Birk JB, Hansen BF, Olsen GS, Wojtaszewski JF.A-769662 activates AMPK beta1-containing complexes but induces glu-cose uptake through a PI3-kinase-dependent pathway in mouse skeletalmuscle. Am J Physiol Cell Physiol 297: C1041–C1052, 2009.
34. Treebak JT, Frosig C, Pehmoller C, Chen S, Maarbjerg SJ, Brandt N,Mackintosh C, Zierath JR, Hardie DG, Kiens B, Richter EA, Pile-gaard H, Wojtaszewski JF. Potential role of TBC1D4 in enhancedpost-exercise insulin action in human skeletal muscle. Diabetologia 52:891–900, 2009.
35. Treebak JT, Glund S, Deshmukh A, Klein DK, Long YC, Jensen TE,Jorgensen SB, Viollet B, Andersson L, Neumann D, Wallimann T,Richter EA, Chibalin AV, Zierath JR, Wojtaszewski JF. AMPK-mediated AS160 phosphorylation in skeletal muscle is dependent onAMPK catalytic and regulatory subunits. Diabetes 55: 2051–2058, 2006.
36. Treebak JT, Pehmoller C, Kristensen JM, Kjobsted R, Birk JB,Schjerling P, Richter EA, Goodyear LJ, Wojtaszewski JF. Acuteexercise and physiological insulin induce distinct phosphorylation signa-tures on TBC1D1 and TBC1D4 in human skeletal muscle. J Physiol 592:351–375, 2014.
37. Treebak JT, Taylor EB, Witczak CA, An D, Toyoda T, Koh HJ, XieJ, Feener EP, Wojtaszewski JF, Hirshman MF, Goodyear LJ. Identi-fication of a novel phosphorylation site on TBC1D4 regulated by AMP-activated protein kinase in skeletal muscle. Am J Physiol Cell Physiol 298:C377–C385, 2010.
38. Vendelbo MH, Clasen BF, Treebak JT, Moller L, Krusenstjerna-Hafstrom T, Madsen M, Nielsen TS, Stodkilde-Jorgensen H, PedersenSB, Jorgensen JO, Goodyear LJ, Wojtaszewski JF, Moller N, JessenN. Insulin resistance after a 72-h fast is associated with impaired AS160phosphorylation and accumulation of lipid and glycogen in human skeletalmuscle. Am J Physiol Endocrinol Metab 302: E190–E200, 2012.
39. Vichaiwong K, Purohit S, An D, Toyoda T, Jessen N, Hirshman MF,Goodyear LJ. Contraction regulates site-specific phosphorylation ofTBC1D1 in skeletal muscle. Biochem J 431: 311–320, 2010.
40. Wang L, Brautigan DL. alpha-SNAP inhibits AMPK signaling to reducemitochondrial biogenesis and dephosphorylates Thr172 in AMPKalpha invitro. Nat Commun 4: 1559, 2013.
41. Witczak CA, Hirshman MF, Jessen N, Fujii N, Seifert MM,Brandauer J, Hotamisligil GS, Goodyear LJ. JNK1 deficiency does notenhance muscle glucose metabolism in lean mice. Biochem Biophys ResCommun 350: 1063–1068, 2006.
42. Witczak CA, Jessen N, Warro DM, Toyoda T, Fujii N, Anderson ME,Hirshman MF, Goodyear LJ. CaMKII regulates contraction- but notinsulin-induced glucose uptake in mouse skeletal muscle. Am J PhysiolEndocrinol Metab 298: E1150–E1160, 2010.
296 AS160 and TBC1D1 Phosphorylations after Exercise • Vendelbo MH et al.
J Appl Physiol • doi:10.1152/japplphysiol.00044.2014 • www.jappl.org
by 10.220.33.3 on Novem
ber 10, 2017http://jap.physiology.org/
Dow
nloaded from


![[XLS] · Web viewV33S-CE V42R-CE V42RE-CE V50-CE V50R-CE V50SR-CE V60R-CE V60RE-CE V84R-CE W-121 W-121-24V W-138PK SAA 3400 540 SAE AS160 AS165 17803 18003 18149 18207 18258 18262](https://static.fdocuments.net/doc/165x107/5afca39c7f8b9aa34d8c5e86/xls-viewv33s-ce-v42r-ce-v42re-ce-v50-ce-v50r-ce-v50sr-ce-v60r-ce-v60re-ce-v84r-ce.jpg)

