Sustainable Investment Report - Schroders Investment Report Q3 2017. Contents 1 Introduction 2...
30
Marketing material Sustainable Investment Report Q3 2017
-
Upload
hoangduong -
Category
Documents
-
view
214 -
download
0
Transcript of Sustainable Investment Report - Schroders Investment Report Q3 2017. Contents 1 Introduction 2...

Marketing material
Sustainable Investment Report
Q3 2017

Contents
1Introduction
2INsight
Climate Progress Dashboard: forecasts global warming of more than 4°C
6INterpret
Stakeholder analysis: smoking or obesity- which poses the greatest investment risk?
Culture: the intangibles
9INfluence
UK AGM review: more work to do on pay
Case study: GAM
12Third quarter 2017
Total company engagement
Shareholder voting
Engagement progress
The majority of fund managers spend most of their time talking about their buying discipline rather than discussing the ownership process, and how they exercised their stewardship responsibilities. However, we believe that actions speak louder than words so rather than just talking about it, we show exactly how we exercise our stewardship responsibilities by sharing actual insights from our engagement and voting activity. These demonstrate how sustainability is embedded in the lifecycle of our investments.
An obvious manifestation is how we vote at annual general meetings (AGMs). Our Swiss equity team has written up a case study based on the engagement and voting that they conducted at the AGM of one of their holdings, GAM. This activity was spearheaded by fund managers, and involved collaboration with competitors aimed at getting the best outcome for clients.
We also take you through the highlights from the 2017 UK AGM season to date, where much of the focus remains on pay. Corporate governance reform was high on Prime Minister May’s agenda when she took office and the 2017 season was a chance for investors to show how seriously they take their responsibilities in this area.
Another topic that has been in the headlines is corporate culture. We are delighted to share the insights from an event that we hosted on “culture the intangible.” This is a nebulous subject and the insights shared by accountants, the Banking Standards Board and other investors were helpful in defining what shareholders should be focusing on to assess the cultural health of their investments.
Moving onto research, our work on antimicrobial resistance in the food chain shows the implications for a number of sectors while our analysis of the tobacco industry yielded some surprising results. Because many of our clients exclude the sector on the basis of ethical, religious or individual preferences, the sector is often overlooked when it comes to engagement and risk assessment. We compare the tobacco industry to the consumer staples sector and find that in short, neither tobacco nor sugar are good for your health!
Finally, climate change remains a major focus for us. In July we published our latest tool, the Climate Progress Dashboard. The news isn’t good. Our calculations are based on a number of indicators from political commitments to electric vehicle and oil and gas output, and forecast a 4 degree rise in temperatures - double what scientists have forecast to be “safe.” We will publish more over the next quarter and update the dashboard on a regular basis. Look out for our latest climate change work here on our website.
Jessica GroundGlobal Head of Stewardship, Schroders
1Sustainable Investment Report
Q3 2017

INsight
Climate Progress Dashboard: forecasts global warming of more than 4°C
Climate change will be a defining driver of the global economy, society and financial markets over the coming years, decades and beyond. Schroders has developed a Climate Change Dashboard to measure progress towards a decarbonised world.
Global temperatures are on course to rise by up to 4°C, twice as far as safe levels, according to a Climate Progress Dashboard developed by the Schroders Sustainability team.
The unique dashboard tracks the progress governments and industries are making towards meeting the 2°C temperature rise commitment global leaders made in the Paris Agreement, which came into force in November.
It looks past headline noise and rhetoric to provide an objective gauge of change across the breadth of fields that will matter to addressing the climate challenge.
How the dashboard worksThe dashboard measures progress across political, industrial, technology and energy indicators, to create a unique, comprehensive view of change. The 12 individual indicators are shown overleaf; some measure aspiration while others gauge action.
‘Political ambition’, for example, captures the pledges governments have made to reduce carbon emissions. The dashboard points to a 2.8°C rise in temperatures based on current ambitions.
The dashboard also captures actual progress - the implementation of policies - under ‘political action’. Slower action here would lead to a 3.6°C rise in temperatures, underlining differences between headline statements and tangible action.
Least progress has been made on oil and gas production, which points to a rise of over 6°C, implying major changes will be needed to hit long term targets. Use of these fossil fuels will have to fall significantly in future, ultimately to zero.
Production of coal – typically cast as the villain of climate discussions – has already started falling, although not far enough to meet the two-degree target.
The full dashboard, designed for use by investors, also opens up to chart recent progress and scenarios of what it means for future trajectories of global warming.
The basic dashboard will be published quarterly at www.schroders.com/climatechange
Political change Business background Technology progress Energy change
Aspiration
Political ambition Corporate planning Electric vehicles Oil & Gas investment
2.8˚ 3.6˚ 4.1˚ 5.3˚Public concern Climate finance Renewable capacity Coal production
Action
3.3˚ 3.3˚ 3.1˚ 2.2˚Political action Carbon prices
Carbon capture and storage capacity Oil & Gas production
3.6˚ 5.5˚ 5.0˚ 7.8˚ Source: Schroders analysis based on industry sources. Based on data available in May 2017.
4.1˚Average temperature rise implied across all areas
2Sustainable Investment ReportQ3 2017

INsight
Why climate change should matter to investorsAndy Howard, Head of Sustainable Research, led the work on the dashboard. Here, he explains why it was developed:
“Climate change will be a defining driver of the global economy, society and financial markets over coming years, decades and beyond. While the issue has moved up investment agendas, the change in strategies has not kept pace.
“The danger is that investors think the problem is being tackled, and that their exposure to climate change risks is reduced, when this is not necessarily the case.
“We developed the Climate Progress Dashboard as part of our efforts to manage the risks and identify the opportunities climate change presents. It provides an objective and transparent view of change to help investors base decisions on the outcomes that are likely, rather than those they would like to see.
“It’s worth noting the dashboard is a snapshot of where we stand, not a forecast of where we will end. We are in the early stages of changes that will play out over several decades. Estimates could change quickly with small changes in direction over coming years.
“As a result, the dashboard conclusions must be seen as measures of the paths we are currently on, rather than conclusions on where we will end up.”
The climate change challenge: a 30-second guideGreenhouse gases (GHG), such as carbon dioxide, methane and nitrous oxide trap heat in the Earth’s atmosphere.
Emissions of these GHGs have grown in tandem with the world’s economic expansion, prompting a rise in temperatures. The late 1800s is usually taken as the pre-industrial baseline. Since then, atmospheric concentrations of GHGs have risen 50% from 270ppm to more than 400ppm. Average temperatures are up almost 1°C.
Scientific and political consensus has settled on 2°C as the acceptable limit for temperature rises, requiring concentrations to stay below 450ppm. On current trends, that limit will be breached within two decades.
Andy Howard said: “In short, there is no single silver bullet. Meeting global leaders’ commitment to limit temperature rises to two degrees over pre-industrial levels means cutting greenhouse gas emissions per person by 80% by 2050, a period in which global incomes are set to triple.
“This is not going to be easy. Every part of the global economy, every industry and every company will be affected to some extent. We need new ideas to make sure investors are prepared for those changes.”
3Sustainable Investment Report
Q3 2017
The cost of drug-resistant infections is potentially huge. Leading economists estimate resistance could contribute to 10 million deaths per year at a cost of $100 trillion by 2050 if no action is taken.
Yet the food and drug industries and investors do not yet factor in fully the implications and opportunities.
With a growing number of bacteria able to survive in the presence of antibiotics, it becomes increasingly difficult for doctors to cure patients with infections. Antimicrobial resistance (AMR) has been accelerated by the misuse and overuse of antibiotics in humans and animals.
For instance, globally, 480,000 people develop multi-drug resistant tuberculosis each year, and in 2016, news broke that bacteria were developing resistance to colistin, a ‘last-resort’ antibiotic.
AMR could fundamentally undermine the value of industries tied to conventional antimicrobials as lawmakers crack down on their excessive use and availability. Here, we briefly look at the implications for the healthcare and food industries and highlight potential risks and opportunities.
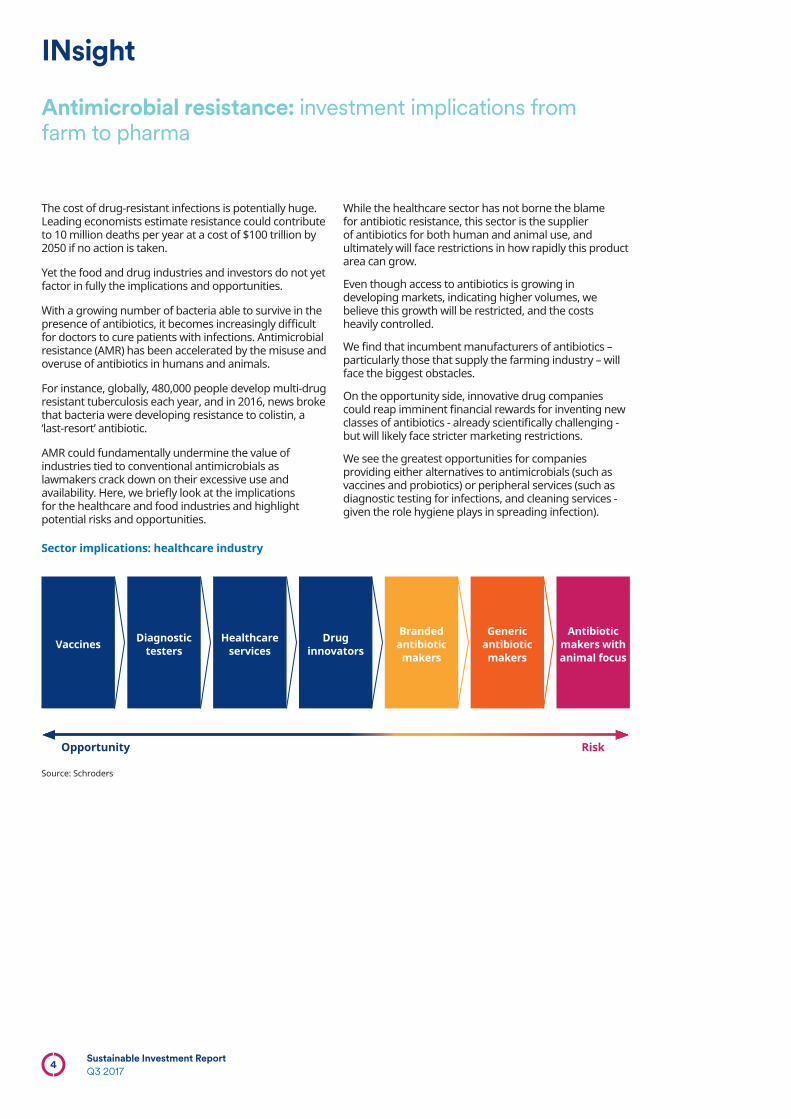
Sector implications: healthcare industry
While the healthcare sector has not borne the blame for antibiotic resistance, this sector is the supplier of antibiotics for both human and animal use, and ultimately will face restrictions in how rapidly this product area can grow.
Even though access to antibiotics is growing in developing markets, indicating higher volumes, we believe this growth will be restricted, and the costs heavily controlled.
We find that incumbent manufacturers of antibiotics – particularly those that supply the farming industry – will face the biggest obstacles.
On the opportunity side, innovative drug companies could reap imminent financial rewards for inventing new classes of antibiotics - already scientifically challenging - but will likely face stricter marketing restrictions.
We see the greatest opportunities for companies providing either alternatives to antimicrobials (such as vaccines and probiotics) or peripheral services (such as diagnostic testing for infections, and cleaning services - given the role hygiene plays in spreading infection).
Vaccines Diagnostic testers
Healthcare services
Drug innovators
Branded antibiotic makers
Generic antibiotic makers
Antibiotic makers with animal focus
Opportunity Risk
Source: Schroders
INsight
Antimicrobial resistance: investment implications from farm to pharma
4Sustainable Investment ReportQ3 2017

INsight
Sector implications: food industryA large body of academic research highlights the farming and food industries’ roles in the AMR challenge, the increased regulatory pressure and heightened scrutiny from consumers will have an impact on company policy.
Those most likely to be affected include food producers that are reliant on antibiotics to control infection, as they could face additional costs to upgrade farming practices.
Companies providing additives to animal feed will be well placed to benefit however, as they take the opportunity to innovate and expand nutrients to reduce the reliance on antibiotics.
Retailers and restaurants are also being affected by rising consumer awareness and many are already strengthening supply chain policies restricting the use of antibiotics.
How Schroders is engaging on antibiotic stewardshipGiven the substantial cross-industry investment impacts we have identified, we have sought to understand how companies are approaching and managing AMR risks and opportunities, and encouraging further data disclosure that will enable us to value the impacts in our models. This is vital: the resistance threat is not yet on corporate risk radars for 70% of the 10 companies with the largest US antibiotic sales.
Our engagement questions for healthcare companies centre on:
– Product areas affected by the AMR trend
– Sales, marketing and pricing disruptions
– Approach to R&D
– In-house knowledge of the latest policy developments
– Impact of the O’Neill review on risk discussions
– Assessment of the collateral impact of AMR on demand for other therapies, devices or treatments which are dependent on antibiotics
We have also supported collaborative engagement initiatives aimed at food companies in the antibiotic supply chain, led by non-profit programme Business Benchmark on Farm Animal Welfare (BBFAW).
Resolutions filed by shareholders on AMR have also started to creep into food company AGM ballots this year. The resolutions request timeframes be set on removing non-therapeutic use of antibiotics in meat supply chains.
We supported the resolution filed at Sanderson Farms but voted against at McDonald’s given the company is already committed to phasing out antibiotics.
5Sustainable Investment Report
Q3 2017

Tobacco industry: exclusion versus ESG integrationWhen discussing the tobacco sector within the context of sustainable investing, it is often in reference to clients’ preference for excluding the sector from their investment portfolios (an investment approach termed “screening” or “exclusion”). This decision may be taken to align with a charity’s mission, or to reflect ethical, religious or individual preferences. Schroders’ 2016 Global Investor Survey showed that 18% of investors would consider selling out of stocks associated with tobacco or alcohol.
However, we believe it is important to take a closer look at the sector through an integration lens given the prevalence of tobacco firms in global benchmarks and positions held across a range of client portfolios. Rather than simply exclude these stocks, we assess ESG issues and engage with tobacco companies on behalf of our clients that hold tobacco stocks in their portfolios.
Stakeholder analysis: surprising resultsUsing a stakeholder approach, we quantified a broad range of issues related to each individual stakeholder group in the tobacco industry including regulators, suppliers, employees and customers. We did this relative to the broader consumer staples sector, which includes food producers, beverage manufacturers and food retailers. By assessing each of these we thought we may be able to further explain why tobacco companies are valued at a discount to their consumer staples peers (part of the discount can be attributed to the material lawsuits and strict regulation facing tobacco firms).
However, the results surprised us. When assessing both risk exposure and risk management across the two industries, we found that:
1. Tobacco: better established risk management Tobacco companies have more established risk management systems in place resulting from past challenges. For example, they pay higher tax rates, higher wages and have more robust supply chain management. A summary of our analysis opposite shows that the risk profile for consumer companies is changing and we do not believe they have the adequate systems in place to adapt to these increasing risk.
1 In 2013, the number of GMB members was increased from 3 to 7.2 This was a voluntary consultative (non-binding) vote which effectively has no impact.3 This was a binding vote. According to GAM’s articles of incorporation, the Board must now submit a new compensation proposal for approval at a subsequent extraordinary shareholders’ meeting, or at the next ordinary shareholders’ meeting.
The rising risk profile of consumer staples companies versus tobacco firms
Stakeholder issue
Trend Tobacco risk profile
Consumer staples risk profile
Human capital
Wages are higher for tobacco as attracting talent is a challenge, but consumer staples could face similar pressures
➔
Supply chain management
Tobacco has more stable costs through greater supply chain visibility and lower risk of disruption. The opposite is true of consumer staples
➔
Product liability litigation
Continued but declining risk for tobacco, but a possibility of further litigation. Emerging risk for consumer staples
➔
Tax rates Tax rate for consumer staples companies looks unsustainably low
➔
Governance Lack of diversity on tobacco boards
➔
Bribery risks Risk to operating licences from potential fines for tobacco companies
➔
➔ Increasing risk Risk stable
➔
Decreasing risk
Source: Schroders
INterpret
Stakeholder analysis: Smoking or obesity – which poses the greatest investment risk?
6Sustainable Investment ReportQ3 2017
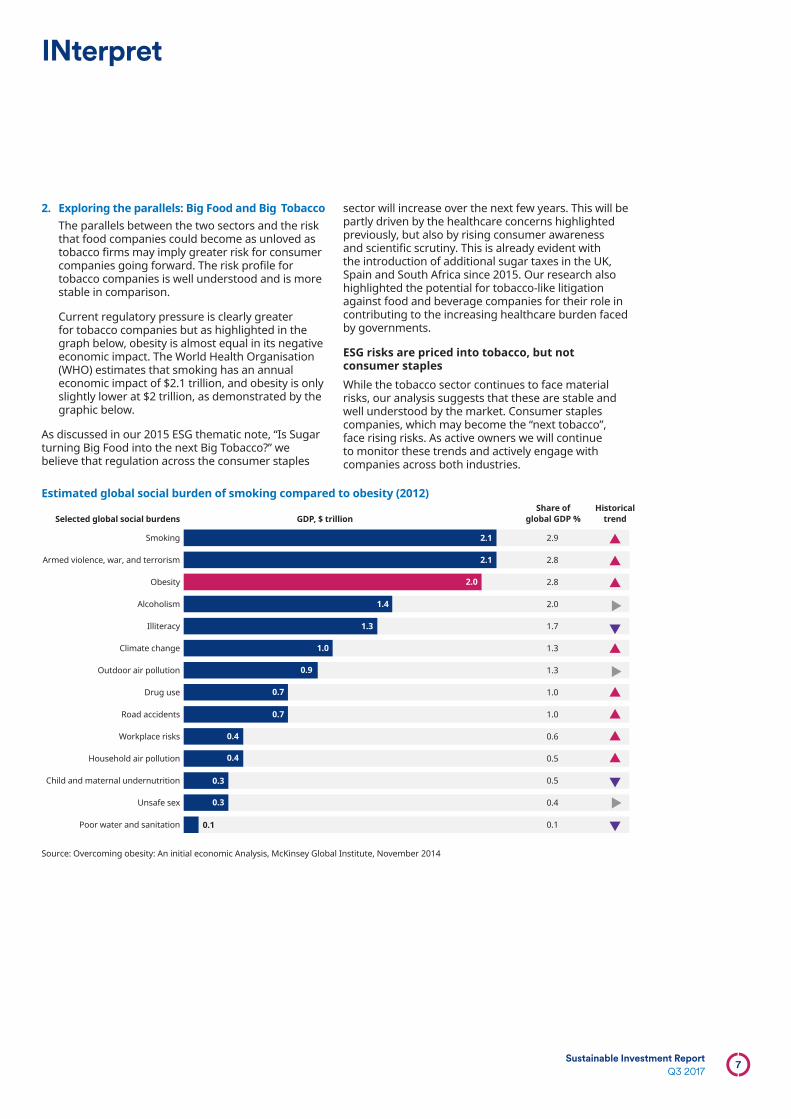
2. Exploring the parallels: Big Food and Big TobaccoThe parallels between the two sectors and the risk that food companies could become as unloved as tobacco firms may imply greater risk for consumer companies going forward. The risk profile for tobacco companies is well understood and is more stable in comparison.
Current regulatory pressure is clearly greater for tobacco companies but as highlighted in the graph below, obesity is almost equal in its negative economic impact. The World Health Organisation (WHO) estimates that smoking has an annual economic impact of $2.1 trillion, and obesity is only slightly lower at $2 trillion, as demonstrated by the graphic below.
As discussed in our 2015 ESG thematic note, “Is Sugar turning Big Food into the next Big Tobacco?” we believe that regulation across the consumer staples
sector will increase over the next few years. This will be partly driven by the healthcare concerns highlighted previously, but also by rising consumer awareness and scientific scrutiny. This is already evident with the introduction of additional sugar taxes in the UK, Spain and South Africa since 2015. Our research also highlighted the potential for tobacco-like litigation against food and beverage companies for their role in contributing to the increasing healthcare burden faced by governments.
ESG risks are priced into tobacco, but not consumer staplesWhile the tobacco sector continues to face material risks, our analysis suggests that these are stable and well understood by the market. Consumer staples companies, which may become the “next tobacco”, face rising risks. As active owners we will continue to monitor these trends and actively engage with companies across both industries.
Estimated global social burden of smoking compared to obesity (2012)
Smoking
Armed violence, war, and terrorism
Obesity
Alcoholism
Illiteracy
Climate change
Outdoor air pollution
Drug use
Road accidents
Workplace risks
Household air pollution
Child and maternal undernutrition
Unsafe sex
Poor water and sanitation
2.9
2.8
2.8
2.0
1.7
1.3
1.3
1.0
1.0
0.6
0.5
0.5
0.4
0.1
Selected global social burdens GDP, $ trillionShare of
global GDP %Historical
trend
2.1
2.1
2.0
1.4
1.3
1.0
0.9
0.7
0.7
0.4
0.4
0.3
0.3
0.1
Source: Overcoming obesity: An initial economic Analysis, McKinsey Global Institute, November 2014
INterpret
7Sustainable Investment Report
Q3 2017

As part of Governance Week 2017, Schroders organised an event on culture for female shareholders. The goal was to delve into the research, focus on tangible culture indicators, and come up with some practical strategies for engagement on the issue. We are grateful to the audience and to Aviva Investors, the Banking Standards Board, EY, the Financial Reporting Council (FRC), Morgan Stanley, Nuveen and Value Act who participated in the talks and panels for so generously sharing their insights.
Does culture really matter?The evidence from shareholders was that culture is a key part of both financial analysis and engagement. Increasingly, an assessment of the cultural health of an organisation is explicitly made before investing. Investors can get “lost in spreadsheets” and fail to ask the right questions as to how numbers are being achieved. Examples were cited from the technology sector, where companies had pursued a growth agenda at all costs but have “crashed and burned.” Culture eats strategy for breakfast, and no sector is immune.
The focus is not on identifying a single right culture, but on establishing how culture is being used to help businesses achieve their objectives. The best companies identify the cultural shifts needed to help them achieve their goals and explicitly monitor them.
Furthermore, there is a difference between culture and values. Articulated values are often “bought” and look remarkably similar across companies. According to the Banking Standards Board’s 2016 survey, 81% of respondents agree that their firm’s values and purpose are meaningful to them as an individual. However, only 65% say there is no conflict between their firm’s stated values and how they do business. Investors clearly need to look behind the platitudes.
Can you measure culture?Culture is most often measured by surveys. However, there was widespread agreement that the construction and framing of a firm’s own employee surveys can encourage positive answers and therefore lead to less-than-accurate results. In contrast, the Banking Standards Board’s survey consists of a mixture of 36 positive and negatively worded questions, to minimise bias. Other surveys ask for more spontaneous answers, mapping the words given against the firm’s aspirations.
It is important to have a meaningful framework to assess culture against; for example, mapping purpose, strategy and values to a cultural hierarchy to assess an overall contribution to society. Having established an ideal, it is then possible to assess an organisation’s health.
A firm’s culture is also a key input into any audit. Data analytics can be used to help identify areas of vulnerability, highlighting where deeper analysis is needed. This has the potential to shift audit priority away from a size to a risk focus.
We need to talk about cultureThe CEO is still viewed as a key component of any firm’s culture and without unfettered access to the board room, an assessment of culture from the outside can therefore be difficult. However a number of practical suggestions were made, with the most important message being “ask and validate”.
– A diverse board is often a good sign. This does not necessarily have to be just in terms of gender or nationality, but in terms of diversity of experience, ethnicity and age.
– Board turnover, both high and low should be challenged.
– Is the CEO happy for other board members to meet with shareholders without him/her being present?
– What is on the board agenda?
– What are the Key Performance Indicators (KPIs)?
– Is there a well articulated succession plan and culture? Can the firm promote from within?
– Remuneration structures are insightful; the best incentivise people on firm performance first, team performance second and finally individual performance. And it isn’t just CEO pay - how are people incentivised throughout the organisation?
– Can management provide examples of a healthy culture, but also discuss things that have gone wrong and what was done about it?
Regulatory scrutiny comingAs well as becoming more important for investors, culture is on the regulatory radar too. Given the FRC’s pioneering work in the area, it could feature in upcoming revisions of the UK Corporate Governance and Stewardship Code. In the future investors may be asked to articulate the work that they have done in this area. Participants in the investment chain should also be willing to provide transparency on their own cultures and behaviours.
Trust then verifyCulture is a relatively new arrival on the governance agenda. However as this event demonstrated, it shows no signs of going away, especially now that regulators have the issue firmly in their sights. The anecdotal link between culture and performance has clearly been made and with the new tools under development we will have a more data-driven approach for the future. The united view of contributors was that a strong commitment from the top to a healthy culture, and a willingness to drive it down into the organisation, is essential. Investors need to be able to delve past things like employee surveys and mission statements to verify if this is really happening.
INterpret
Culture: the intangibles
8Sustainable Investment ReportQ3 2017

The Corporate Governance team at Schroders branded 2016 “The year of the shareholder revolt on pay”. 2017 was supposed to be uncomplicated. The UK government had released its Green Paper on corporate governance reform towards the end of 2016 and we had engaged with companies and remuneration consultants on the need to lower quantum. We believed that they’d received the message. We’ve now learnt this wasn’t necessarily the case.
Large votes against pay We witnessed a significant percentage of “against” votes at some large companies this year.
Large votes against remuneration resolutions – In the biggest vote against this year, Pearson’s
investors rejected the pay report in which the CEO received a 20% pay rise.
– AstraZeneca suffered another shareholder revolt as the CEO’s compensation rose 68% to £13.4 million.
– Safestore pulled their initial remuneration resolution and presented a revised plan at an extraordinary general meeting (EGM), which just scraped through. This could see share awards worth up to 1.6% of the company’s market value.
Behind the headlinesSafestore’s move is part of a growing trend that has seen numerous companies withdrawing pay resolutions ahead of their annual general meetings (AGMs) following pressure from shareholders. The following plans were pulled by management prior to their AGM:
– Imperial Brands planned to increase the maximum bonus payable to the CEO by 100% to 450% of salary.
– Chemring’s new incentive plan was originally based on single year targets
– Aveva’s Restricted Share Plan allowed directors to be granted share awards irrespective of performance
For Against
34%
66%
Pearson remuneration
report
68%32%
AstraZeneca remuneration
report
51%49%
Safestore remuneration
policy
Source – Company websites
INfluence
UK AGM review: more work to do on pay
9Sustainable Investment Report
Q3 2017

INfluence
Director accountabilitySchroders is holding individuals more accountable than ever for poor governance practices. Since 2016 our policy has been to vote against the remuneration committee’s chair when there are repeated pay concerns. We executed this at:
– British American Tobacco
– AstraZeneca
– Standard Chartered
– Centrica
Of 410 UK meetings in 2017, Schroders voted against 53 directors at 34 companies. Although Schroders’ policy is to encourage board diversity, many of these negative votes were, unfortunately, against female directors. This is partly because over 40% of FTSE 350 remuneration chairpersons are currently women - a disproportionately high percentage considering the low percentage of women versus men on boards.
Schroder votes against remuneration 2016 vs 2017
0
20
40
60
80
10
30
50
70
Votes against director elections
2016
40
47
53
67
2017
Votes against remuneration
Source: Schroders
Glimmers of hopeThere have, however, been some signs of progress in 2016. For example, BP was dealt a blow as 60% of shareholders voted against its pay report. After extensive engagement with investors, the firm slashed the CEO’s pay package by around 40%. Quantum and complexity were both reduced and more than 97% of shareholders were in favour of the rejigged policy. We also saw an improvement in the banking sector. UK banks received universal approval of their revised pay plans, quantum was down and votes had over 95% approval rates.
A better way forward?The one thing investors agree on is that the current pay structure is flawed and disliked. Restricted share awards have been proposed as an alternative to long-term incentives. These awards would not involve performance criteria, but executives would be motivated by a long-term increase in the company’s share price. The majority of companies we met with had discussed alternatives at board level but still appear to support conventional long-term incentives.
That said, one of the companies we met with, Pets at Home, received 85% support for their proposed alternative incentive plan. Their approach was down to simplicity.
– The maximum potential of earnings was halved from 150% of salary to 75%.
– Insertion of a financial underpin with zero shares vesting in the event of negative total shareholder return (TSR)
– Staggered vesting over three to five years
– The incentive plan is subject to both Malus and Clawback clauses
More work to do on pay With some large votes against pay reports and policies, investors are signalling that companies have more work to do on pay. Furthermore, shareholders are holding boards and individual directors more accountable for pay. It appears long-term incentive plans aren’t going away. Although we are likely to see more and more companies discuss alternative incentive plans, the majority of pay policies are locked in for three years, so there will not be overnight change. 2018 may be just as interesting.
10Sustainable Investment ReportQ3 2017

When GAM Holding (GAM), a mid-sized Swiss asset manager with a history dating back to 1983, released its 2016 annual report, our local equity team in Zurich promptly picked up on the issue of executive compensation. A thorough review of GAM’s pay practices against history and peers revealed major concerns:
– Pay for performance: Despite poor performance, compensation was growing:
Growth in underlying profit before taxes
5 Years 3 Years 1 Year
-43.9% -48.5% -39.3%
Group Management Board (GMB) compensation growth2
5 Years 3 Years 1 Year
248.6%% 10.7%% 7.1%
CEO compensation growth
5 Years 3 Years 1 Year
156.5% 71.5% 22.8%
Source: Schroders, GAM 2011-2016 Annual reports
– Excessive transfer of wealth: Total compensation for the GMB stood at 15% of underlying profit before taxes and 1% of market cap, which we deem excessive irrespective of industry or company size. It was also more than double what we observed at peers, and the highest level in GAM’s own history.
– Poor communication: Tables and comments in the 2016 annual report and a pre-AGM (annual general meeting) presentation appeared misleading to us, particularly given the exclusion of long-term incentives (LTIP) from total compensation. The comparison with previous years’ figures was not properly adjusted to reflect prior one-off payments to management.
Under Swiss law shareholders vote on a series of resolutions around pay at an AGM. Our fiduciary duty towards our clients, the ultimate shareholders of GAM, demanded that we take action. We met with company management twice to voice our concerns. Unfortunately, the company did not change the 2017 AGM agenda, although the chief executive officer made voluntary concessions regarding his remuneration for 2017.
Collaborative engagementTogether with Schroders’ sustainability team we contacted other GAM shareholders to share our analysis and concerns, which resulted in constructive conversations with other shareholders around the world. We also raised these with ISS, the proxy voting advisor.
Our efforts seem to have contributed to the voting results at the 2017 AGM:
– The 2016 compensation report was strongly rejected, with only 17.6% of votes in its favour.3
– The 2017 GMB variable pay proposal was overwhelmingly dismissed, with a meagre 7.1% support.4
– The chairman of the compensation committee was not re-elected to this position.
Both proxy voting specialists ISS and Glass Lewis suggested voting against compensation, which played a significant role in the above results.
We are often asked by our clients about collective engagement, and this case shows how collaboration and knowledge sharing can play a powerful part in supporting shareholder rights.
Engaging to protect the interests of our clientsSince the AGM the company has approached us and other shareholders to conduct a full review of pay practices at GAM. We view this as a very positive step. In early June, we met with the newly elected chairman and a new member of the compensation committee to share our views not only on remuneration and other governance aspects, but also on capital allocation, target setting and cost culture. At the time of writing, our engagement is ongoing and we aim to better align strategy and management with the interests of long-term shareholders.
2 In 2013, the number of GMB members was increased from 3 to 7.3 This was a voluntary consultative (non-binding) vote which effectively has no impact.4 This was a binding vote. According to GAM’s articles of incorporation, the Board must now submit a new compensation proposal for approval at a subsequent extraordinary shareholders’ meeting, or at the next ordinary shareholders’ meeting.
INfluence
Case study: GAM
11Sustainable Investment Report
Q3 2017

Company E S G
Consumer Discretionary
Accor ✔
Alibaba Group ✔ ✔
Amazon.Com ✔ ✔
Antena 3 de TV ✔
ASOS ✔
Autoliv ✔
Bajaj Auto ✔
Belle International ✔
Bellway ✔
Berkeley Group ✔
BMW ✔
boohoo.com ✔
Bosch ✔
BOVIS HOMES ✔
Brembo ✔
Brilliance China Automotive ✔
Burberry Group ✔
CAIRO COMMUNICATIONS ✔
Carter's ✔ ✔
Coats Group ✔
Compass Group ✔
Continental ✔
Cooper Tires ✔
Daily Mail and General Trust ✔
Daimler ✔ ✔
Debenhams ✔
Company E S G
DFS FURNITURE ✔
Dixons Carphone ✔
Dometic Group ✔
Dongfeng Motor ✔
Dufry ✔
Enterprise Inns ✔
Faurecia ✔
Ferrari ✔ ✔
Fiat Chrysler ✔ ✔
Ford Motor ✔
Galaxy Entertainment Group ✔
Game Digital ✔
General Motors ✔
Genting Singapore ✔
GKN ✔
Granada Group ✔
Greene King ✔
Haier Electronics ✔
Halfords Group ✔
Harley-Davidson ✔
Headlam Group ✔
HOLLYWOOD BOWL GROUP ✔
Home Depot ✔
Honda Motor ✔
Howden Joinery ✔
Husqvarna ✔
HYUNDAI MOTOR ✔
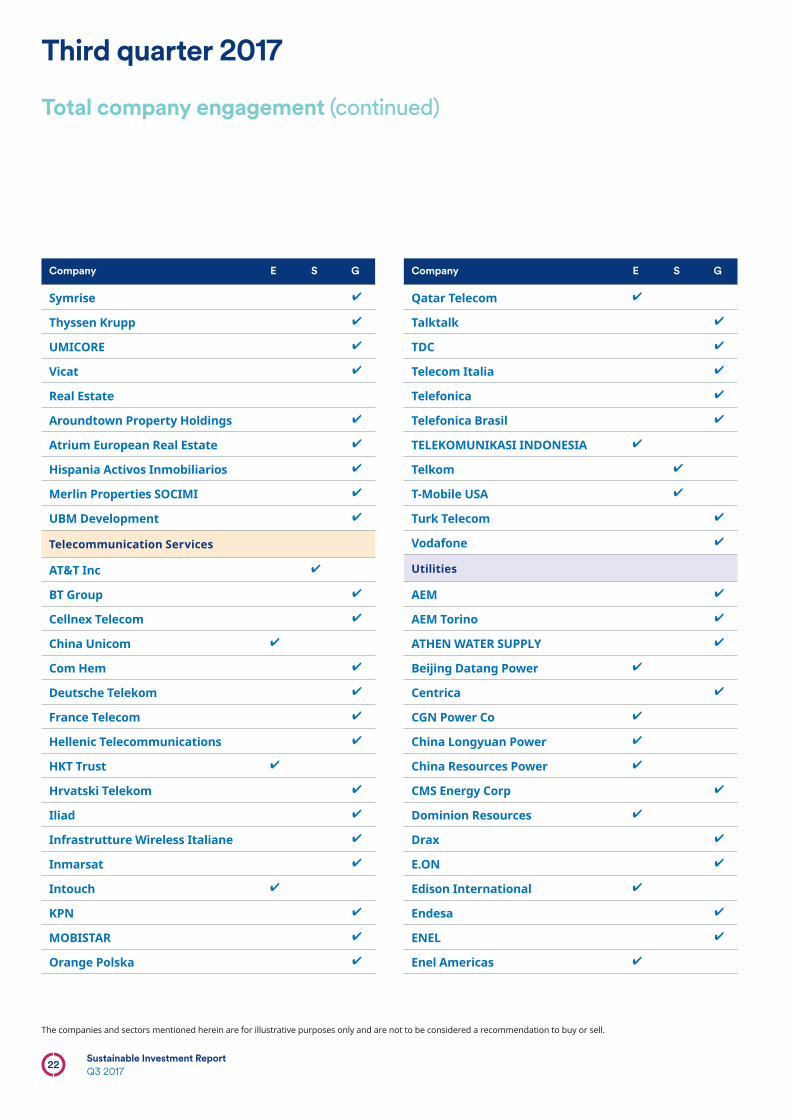
Our ESG team had 683 engagements this quarter with the 619 companies listed below, on a broad range of topics categorised under “environmental”, “social” and “governance”. They included one-to-one meetings, joint investor meetings, conferences, teleconferences, written correspondence and collaborative engagements.
Third quarter 2017
Total company engagement
The companies and sectors mentioned herein are for illustrative purposes only and are not to be considered a recommendation to buy or sell.
12Sustainable Investment ReportQ3 2017

Company E S G
Informa ✔
Intercontinental Hotels Group ✔
ITV ✔
Jaguar Land Rover ✔
JD Sports Fashion ✔
Kia Motors ✔ ✔
Ladbrokes Coral Group ✔
Lagardere ✔
LVMH ✔
Marks and Spencer ✔
Maruti ✔
Merlin Entertainments ✔
Michael Kors ✔
Mitchells and Butlers ✔
MODERN TIMES GROUP ✔
Moncler ✔ ✔
Mothercare ✔
Motherson Sumi Systems ✔
Mvideo ✔
N. Brown Group ✔
NEXT ✔
NH Hotels ✔
Nissan Motor ✔
Nokian ✔
OPAP ✔
OReilly Auto ✔
OVS SpA ✔
Company E S G
Pandora ✔
Pearson ✔
PERSIMMON ✔
Pets at Home ✔
Photo-Me International ✔
Porsche ✔ ✔
PT Astra International ✔ ✔
Publicis Groupe ✔
Redrow Group ✔
Reed Elsevier ✔
RELX Group ✔
Renault ✔
Restaurant Group ✔
Richemont ✔
Salvatore Ferragamo Italia ✔
Samsonite ✔
Sands China Ltd ✔
Shanghai Auto ✔
Shenzhou International ✔
Sports Direct ✔ ✔
Supergroup ✔
Swatch ✔
Tata Motors ✔
Taylor Wimpey ✔
Technicolor ✔
TECHNOGYM ✔
Television Francaise ✔
The companies and sectors mentioned herein are for illustrative purposes only and are not to be considered a recommendation to buy or sell.
Third quarter 2017
Total company engagement (continued)
13Sustainable Investment Report
Q3 2017

Company E S G
Toyota Motor ✔
Trinity Mirror ✔
Valeo ✔
Vivendi Universal ✔
Volkswagen ✔ ✔
William Hill ✔
Wolters Kluwer ✔
XXL ✔
Yoox ✔
Consumer Staples
Ahold Delhaize ✔
AMBEV / BRAHMA ✔
Anheuser-Busch InBev ✔
Aryzta ✔
Beiersdorf ✔
BRITANNIA ✔
British American Tobacco ✔
Carrefour ✔
China Mengniu Dairy ✔
China Resources Beer ✔
Colgate Palmolive ✔
Dairy Crest Group ✔
Danone ✔
Diageo plc ✔
Emart ✔
Glanbia ✔
Greencore Group ✔
Gruma ✔ ✔
Company E S G
Henkel ✔
Imperial Tobacco Group ✔
Indofood ✔
INDOFOOD CBP ✔
Kraft Heinz Foods ✔ ✔
MARR ✔
Monster Beverage Corporation ✔
Nestle ✔
Nu Skin Enterprises ✔ ✔
Ontex Group ✔
Pernod Ricard ✔
Philip Morris ✔
Reckitt Benckiser ✔
Sainsbury’s ✔
Svenska Cellulosa ✔
Tesco ✔
Thai Beverage ✔
TSURUHA ✔
Unilever ✔
Universal Corp ✔
Wal Mart Stores ✔
Wm. Morrison ✔
Wuliangye ✔
X5 ✔
Yili Industrial Group Co Ltd ✔
Energy
Adaro Energy ✔
Amec Foster Wheeler ✔
Third quarter 2017
Total company engagement (continued)
The companies and sectors mentioned herein are for illustrative purposes only and are not to be considered a recommendation to buy or sell.
14Sustainable Investment ReportQ3 2017

Company E S G
Anadarko Petroleum ✔
Apache ✔
BP ✔ ✔
Cabot Oil & Gas ✔
Cairn Energy ✔
Canadian Natural resources ✔
Chevron Texaco ✔
China Shenhua Energy ✔
Cimarex Energy Co. ✔
CNOOC ✔
DEVON ENERGY ✔ ✔
ENI ✔
EOG RES ✔
Exxaro ✔
Exxon Mobil ✔
Galp ✔
Gazprom ✔
Hargreaves Services ✔
Helmerich & Payne ✔
IHC Caland ✔
Lundin Petroleum ✔
Marathon Petroleum ✔
National Oilwell Varco ✔ ✔
Newfield Exploration Co ✔
NK Lukoil ✔
Occidental Petroleum Corpn ✔
Petro Geo Svcs ✔
Phillips 66 ✔
Company E S G
PIONEER NATURAL RESOURCES ✔
PKN ✔
Romgaz ✔
Royal Dutch Shell ✔
SARAS ✔
Sasol ✔
SCHLUMBERGER ✔ ✔
SK Innovation ✔
Soco International ✔
Statoil ✔
Tambang Batubara Bukit Asam ✔
Tatneft ✔ ✔
TechnipFMC ✔
Tenaris ✔
TGS ✔
Total ✔
Tupras ✔
VALERO ENERGY ✔
Wood Group ✔
YPF ✔
Financials
3i Group ✔
ABERDEEN ASSET MNGMT ✔
ABN AMRO ✔
Ageas ✔
Allianz ✔
Alpha Bank ✔
Amundi ✔
Third quarter 2017
Total company engagement (continued)
The companies and sectors mentioned herein are for illustrative purposes only and are not to be considered a recommendation to buy or sell.
15Sustainable Investment Report
Q3 2017

Company E S G
Anima Holding ✔
Ashmore Group ✔
Assura ✔
AURELIUS ✔
Aviva ✔
AXA SA ✔
BANCA FARMAFACTORING ✔
Banca Generali ✔
Banca IFIS ✔
Banca Mediolanum ✔
Banca Sistema ✔
Banco Santander ✔
Bankinter ✔
Barclays ✔
BBVA ✔
Bce Pop Unite ✔
BNP Paribas ✔
British Land ✔
Catal Occidente ✔
Cerved Information Solutions ✔
Cheung Kong Hutchison ✔
Coface ✔
COLLINS STEWART ✔
Credit Suisse Group ✔
Credito Emiliano ✔
Derwent London ✔
Deutsche Bank ✔
Deutsche Boerse ✔
Company E S G
Direct Line Insurance Group ✔
DNB Nor ✔
Erste Bank ✔
Euler Hermes ✔
FinecoBank ✔
Fondul Proprietatea ✔
Generali ✔
Grainger ✔
Grand City Properties ✔
Hastings Group ✔
Hellenic Exch Hlds ✔
HSBC Holdings ✔
Industrivarden ✔
ING Groep ✔
Intermediate Capital Group ✔
Intesa Sanpaolo ✔
Jardine Lloyd Thompson Group ✔
Jupiter Fund Management ✔
Just Retirement ✔
KBC Groep ✔
KLEPIERRE ✔
Lancashire ✔
LEG Immobilien ✔
Legal & General Group ✔
LIBERBANK 9 ✔
Lloyds Banking Group ✔
London Stock Exchange ✔
Man Group plc ✔
Third quarter 2017
Total company engagement (continued)
The companies and sectors mentioned herein are for illustrative purposes only and are not to be considered a recommendation to buy or sell.
16Sustainable Investment ReportQ3 2017

Company E S G
Mediobanca ✔
MLP ✔
MORSES CLUB ✔
Nets A ✔
NewRiver Retail Limited ✔
NEX Group ✔ ✔
Nexity ✔
Nordea ✔
Old Mutual ✔
Phoenix Holdings ✔
Provident Financial ✔
Prudential Corporation ✔
Rathbone Brothers ✔
Royal & Sun Alliance Insurance Group
✔
Royal Bank of Scotland Group ✔
Safestore ✔
Saga ✔
Sampo ✔
SEB ✔
Secure Trust Bank ✔
St Jamess Place Capital ✔
Standard Chartered HK ✔
Swedbank ✔
Swiss Reinsurance Company ✔
UBS ✔
Unibail-Rodamco ✔ ✔
Unicredit ✔
Unite Group ✔
Company E S G
Vienna Insurance Group ✔
Virgin Money ✔
Vonovia ✔
Wendel Investissem ✔
Wharf ✔
WORKSPACE GROUP ✔
Worldpay Group ✔
Zurich Financial Services ✔
Healthcare
Allergan ✔ ✔
AstraZeneca ✔ ✔
Basilea Pharmaceuticals ✔
Bayer ✔ ✔
BTG ✔
Dechra Pharma ✔
DiaSorin ✔
Elekta ✔
Endo International ✔
ESSILOR ✔
Fresenius Medical Care ✔
Fresenius SE & Co ✔
Genus ✔
GlaxoSmithKline ✔ ✔
H.LUNDBECK ✔
Hikma Pharmaceuticals ✔
Indivior ✔
Lilly, Eli & Co ✔
Lonza Group ✔
Third quarter 2017
Total company engagement (continued)
The companies and sectors mentioned herein are for illustrative purposes only and are not to be considered a recommendation to buy or sell.
17Sustainable Investment Report
Q3 2017

Company E S G
Merck & Co ✔
MorphoSys ✔
Novartis ✔ ✔
Novo Nordisk ✔ ✔
Orpea ✔
OTSUKA HOLDINGS ✔
Pfizer ✔ ✔
Recordati ✔
Roche Holding ✔ ✔
Sanofi-Aventis ✔ ✔
Shire Pharmaceuticals Group ✔ ✔
Sino Biopharmaceutical ✔
Smith & Nephew ✔
Spire Healthcare Group ✔
SUN PHARMACEUTICAL ✔
Teva Pharmaceuticals Industries ✔
UCB ✔
Valeant Pharmaceuticals ✔
Zoetis ✔
Industrials
Aalberts Inds ✔
ABB AG ✔
Acuity Brands ✔
Aena ✔
AGCO ✔
Aggreko ✔
AHLSELL ✔
Air France-KLM ✔
Company E S G
Alstom ✔
AP Moller-Maersk ✔
Ashtead ✔
Assa Abloy ✔
Atlas Copco ✔
Babcock Intl Group ✔
BAe Systems ✔ ✔
Balfour Beatty ✔
BEIJING ENTERPRISE ✔
Berendsen ✔
Bilfinger Berger ✔
Bodycote ✔
Bpost SA ✔
Brenntag ✔
Bunzl ✔ ✔
Capita Group ✔
Chemring Group ✔
China Communications Construction Co
✔
CHINA GEZHOUBA GROUP COMPANY
✔
China International Marine Containers Group
✔
China Railway Construction Corp Ltd
✔
China State Construction Engineering Corp
✔ ✔
Cie de Saint-Gobain ✔
Cobham ✔
D/S Norden ✔
Third quarter 2017
Total company engagement (continued)
The companies and sectors mentioned herein are for illustrative purposes only and are not to be considered a recommendation to buy or sell.
18Sustainable Investment ReportQ3 2017

Company E S G
Danieli & C Officine Meccaniche ✔
Dart Group ✔
De La Rue ✔
DMCI Holdings ✔
DP WORLD ✔
DSV ✔
EasyJet ✔
Eicher Motors ✔
Elis Services ✔
ENAV ✔
Experian Group ✔
Fanuc Ltd ✔ ✔
Finmeccanica ✔
FirstGroup ✔
Fisher(J)& Sons ✔
FORTIVE CORPORATION ✔
Fortune Brands Home & Security ✔
G4S ✔
GEA GROUP ✔
Go-Ahead Group ✔
IMA Industria Macchine Automatiche
✔
IMI ✔
Interpump Group ✔
Intertrust ✔
John Laing Group ✔
Johnson Electric ✔
KION GROUP ✔ ✔
Kone ✔
Company E S G
Korea Aerospace Industries ✔
Krones ✔
Larsen&Toubro ✔
Legrand ✔
Leoni ✔
MAEDA ROAD CONSTRUCTION ✔ ✔ ✔
Maire Tecnimont ✔
Mears Group ✔
Melrose Industries ✔
Munters ✔
National Express ✔ ✔
NWS Holdings ✔ ✔
Philips ✔
Porr ✔
Prysmian ✔
Qinetiq Group ✔
Rentokil Initial ✔
Rieter Holding ✔
Rolls-Royce ✔
Roper Technologies ✔
Royal Mail ✔
Rps Group ✔
Schindler Holding ✔
Serco Group ✔
Shanghai Electric Group ✔
Siemens ✔
Sig ✔
SMC Corp ✔
Third quarter 2017
Total company engagement (continued)
The companies and sectors mentioned herein are for illustrative purposes only and are not to be considered a recommendation to buy or sell.
19Sustainable Investment Report
Q3 2017

Company E S G
Smiths Group ✔
Spirax-Sarco Engineering ✔
Stabilus ✔
Stericycle ✔
Teleperformance ✔
Travis Perkins ✔
Trelleborg ✔
United Tractors ✔
Vallourec ✔
VAT Group ✔
Vestas Wind Systems ✔
Vinci ✔
Volvo ✔ ✔
Waste Connections ✔
Weg ✔
Weichai Power ✔
Weir Group ✔
Wienerberger ✔
Wolseley ✔
Zodiac Aerospace ✔
Information Technology
ALFA FINANCIAL SOFTWARE ✔
ALTRAN TECHNOLOGIE ✔
Amadeus IT ✔
ASM International ✔
ASM Lithography ✔
Computacenter ✔
Criteo ✔
Company E S G
Dassault Systemes ✔
Dmt ✔
Electrocomponents ✔
Fidessa Group ✔
Hexagon ✔
Imagination Technologies ✔ ✔
INDRA SISTEMAS ✔
Infineon ✔
Iomart Group ✔
IQE ✔
Keyence Corp ✔
Laird ✔ ✔ ✔
Largan Precision ✔
LOGITECH INTL ✔
MERKANTILDATA ✔
Micro Focus ✔
MoneySupermnaket.com ✔
Naver ✔
Netease.com ✔
Nokia Corporation ✔
OTSUKA ✔
Redcentric ✔
Sabre Corp ✔
Sage Group ✔
SAP ✔
SDL ✔
ServiceNow ✔
SILTRONIC ✔
Third quarter 2017
Total company engagement (continued)
The companies and sectors mentioned herein are for illustrative purposes only and are not to be considered a recommendation to buy or sell.
20Sustainable Investment ReportQ3 2017

Company E S G
SOITEC ✔
Sophos Group ✔
Sopra Group ✔
Spectris ✔
STMicroelectronics ✔
Tencent ✔ ✔
TKH Group ✔
u-blox Holding ✔
United Internet ✔
Materials
Albemarle Corporation ✔
Anglo American plc ✔
Anhui Conch Cement Company Limited
✔
Arcelor ✔
Asian Paints ✔
BASF AG ✔
BHP Billiton ✔
BillerudKorsnas ✔
Canfor Corporation ✔
Clariant ✔
CRH ✔
Croda International ✔
Dow Chemical ✔
DSM ✔
Elementis ✔
Ems-Chemie ✔
Essentra ✔
Company E S G
Evonik Industries ✔
FORTERRA ✔
Gerdau ✔
Glencore ✔
Hexpol ✔
Ibstock ✔
IMERYS ✔
Johnson Matthey ✔
K+S ✔
KGHM Polska Miedz ✔
Korea Zinc ✔
Lenzing ✔
Linde ✔
Metsa Board ✔
Norilsk Nickel ✔
Norsk Hydro ✔
Packaging America ✔
PETRONAS CHEMICALS GROUP ✔
Philips Lighting ✔
Pidilite Industries Ltd ✔
Polyus ✔
Reliance Steel and Aluminum Co ✔
Rio Tinto Limited ✔
Sesa Goa ✔
SIKA ✔
Sinofert ✔
Smurfit Kappa ✔
Steel Dynamics ✔
Third quarter 2017
Total company engagement (continued)
The companies and sectors mentioned herein are for illustrative purposes only and are not to be considered a recommendation to buy or sell.
21Sustainable Investment Report
Q3 2017
Company E S G
Symrise ✔
Thyssen Krupp ✔
UMICORE ✔
Vicat ✔
Real Estate
Aroundtown Property Holdings ✔
Atrium European Real Estate ✔
Hispania Activos Inmobiliarios ✔
Merlin Properties SOCIMI ✔
UBM Development ✔
Telecommunication Services
AT&T Inc ✔
BT Group ✔
Cellnex Telecom ✔
China Unicom ✔
Com Hem ✔
Deutsche Telekom ✔
France Telecom ✔
Hellenic Telecommunications ✔
HKT Trust ✔
Hrvatski Telekom ✔
Iliad ✔
Infrastrutture Wireless Italiane ✔
Inmarsat ✔
Intouch ✔
KPN ✔
MOBISTAR ✔
Orange Polska ✔
Company E S G
Qatar Telecom ✔
Talktalk ✔
TDC ✔
Telecom Italia ✔
Telefonica ✔
Telefonica Brasil ✔
TELEKOMUNIKASI INDONESIA ✔
Telkom ✔
T-Mobile USA ✔
Turk Telecom ✔
Vodafone ✔
Utilities
AEM ✔
AEM Torino ✔
ATHEN WATER SUPPLY ✔
Beijing Datang Power ✔
Centrica ✔
CGN Power Co ✔
China Longyuan Power ✔
China Resources Power ✔
CMS Energy Corp ✔
Dominion Resources ✔
Drax ✔
E.ON ✔
Edison International ✔
Endesa ✔
ENEL ✔
Enel Americas ✔
Third quarter 2017
Total company engagement (continued)
The companies and sectors mentioned herein are for illustrative purposes only and are not to be considered a recommendation to buy or sell.
22Sustainable Investment ReportQ3 2017

Company E S G
Enel Chile ✔
Engie ✔
ENN Energy Holdings Ltd ✔
First Energy Corp ✔
Fortum ✔
Gas Natural ✔
Hera ✔
IN National Thermal Power ✔
Meralco ✔
National Grid ✔
NHPC ✔
Pennon Group ✔
PGE ✔ ✔
Power Assets Holdings ✔
Power Grid Corporation of India ✔
Qatar Electricity & Water Co ✔
RWE ✔
Severn Trent ✔
Southern Co ✔
United Utilities ✔
Veolia Environnement ✔
Westar Energy Inc ✔
KeyE – Environment S – Social G – Governance
Source: Schroders as at 30 September 2017.
Third quarter 2017
Total company engagement (continued)
The companies and sectors mentioned herein are for illustrative purposes only and are not to be considered a recommendation to buy or sell.
23Sustainable Investment Report
Q3 2017

Source: Schroders as at 30 September 2017.
Engagement type Engagement by sector
Regional engagement
20972
97
289
7
9
11%1%
One to one callOther (e.g. letter)Email
One-to-one meeting
85%
Collaborative engagement (e.g. joint investor letter)
1%1% 5%
7%
6%
Utilities
Telecommunication Services
Materials
Real Estate
Consumer Staples
Energy
Health Care
Consumer Discretionary
Industrials
Information Technology
Financials
17%
1%19%
15%
8%
7%
8%
7%
Third quarter 2017
Engagement in numbers
Source: Schroders as at 30 September 2017.
UK 209
North America 72
Asia Pacific 97
Europe (ex-UK) 289
Middle East and Africa 7
Latin America 9
Source: Schroders as at 30 September 2017.
24Sustainable Investment ReportQ3 2017

We believe we have a responsibility to exercise our voting rights. We therefore evaluate voting issues on our investments and vote on them in line with our fiduciary responsibilities to clients. We vote on all resolutions unless we are restricted from doing so (e.g. as a result of shareblocking).
This quarter we voted on 486 companies and approximately 96% of all our holdings. We voted on 14 ESG-related shareholder resolutions, voting with management on 12.
The charts below provide a breakdown of our voting activity from this quarter. Our UK voting decisions are all available on our website at www.schroders.com/sustainability under ‘Influence’.
Source: Schroders as at 30 September 2017.
Source: Schroders as at 30 September 2017.
Direction of votes this quarter Reasons for votes against this quarter
Company meetings voted
44%
12%
18%
16%
6%
4%
For
Against
Abstain
Other
1%
86%
13%0%
15%
43%
2%
Director Related
Routine Business Reorganisation & Mergers
OtherRemuneration
Shareholder Proposals Anti-takeover
Allocation of Capital
11%
1%
3% 1%
24%
UK 44%
North America 12%
Asia Pacific 18%
Europe (ex-UK) 16%
Middle East and Africa 6%
Latin America 4%
Source: Schroders as at 30 September 2017.
Third quarter 2017Shareholder voting
25Sustainable Investment Report
Q3 2017

Third quarter 2017
Engagement progress
This section reviews any progress on suggestions for change we made a year ago, in this case the third quarter of 2016. There are four possible results: “Achieved”, “Almost”, “Some Change” and “No Change”. Of a total number of 80 “change facilitation” requests made, we recorded 22 as Achieved, 5 as Almost, 6 as Some Change and 47 as No Change.
Engagement progress 59%
6%
Achieved Almost Some Change No Change
7%
28%
The chart below shows the effectiveness of our engagement over a five-year period. We recognise that any changes we have requested will take time to be implemented into a company’s business process. We therefore usually review requests for change 12 months after they have been made, and also review progress at a later date. This explains why there is a higher number of engagement successes from previous years.
Effectiveness of requests for change – 5 year period
Source: Schroders as at 30 September 2017.
Success level of company engagement
0
20
40
60
80
100
No Further Change RequiredNo ChangeSome ChangeAlmostAchieved
20172016201520142013
%
26Sustainable Investment ReportQ3 2017

27Sustainable Investment Report
Q3 2017
Important Information: The views and opinions contained herein are those of the Sustainable Investment team, and may not necessarily represent views expressed or ref ected in other Schroders communications, strategies or funds. This material is intended to be for information purposes only. The material is not intended as an offer or solicitation for the purchase or sale of any financial instrument. The material is not intended to provide and should not be relied on for accounting, legal or tax advice, or investment recommendations. Reliance should not be placed on the views and information in this document when taking individual investment and/or strategic decisions. Past performance is not a guide to future performance and may not be repeated. The value of investments and the income from them may go down as well as up and investors may not get back the amounts originally invested. All investments involve risks including the risk of possible loss of principal. Information herein is believed to be reliable but Schroders does not warrant its completeness or accuracy. Some information quoted was obtained from external sources we consider to be reliable. No responsibility can be accepted for
errors of fact obtained from third parties, and this data may change with market conditions. This does not exclude any duty or liability that Schroders has to its customers under any regulatory system. Regions/sectors shown for illustrative purposes only and should not be viewed as a recommendation to buy/sell. The opinions in this document include some forecasted views. We believe we are basing our expectations and beliefs on reasonable assumptions within the bounds of what we currently know. However, there is no guarantee than any forecasts or opinions will be realised. These views and opinions may change. To the extent that you are in North America, this content is issued by Schroder Investment Management North America Inc., an indirect wholly owned subsidiary of Schroders plc and SEC registered adviser providing asset management products and services to clients in the US and Canada. For all other users, this content is issued by Schroder Investment Management Limited, 31 Gresham Street, London, EC2V 7QA. Registered No. 1893220 England. Authorised and regulated by the Financial Conduct Authority. SCH14393
Schroder Investment Management Limited31 Gresham Street, London EC2V 7QA, United KingdomT +44 (0) 20 7658 6000
@schrodersschroders.com