Sustainable Fishery Advocates
32
Sustainable Fishery Advocates Seafood Report Bluenose Hyperoglyphe antarctica (Illustration © New Zealand Fishing News) Final Report November 3, 2006 Teresa Ish and Katy Doctor Director of Science and Science Intern Sustainable Fishery Advocates
Transcript of Sustainable Fishery Advocates

Sustainable Fishery Advocates Seafood Report
Bluenose Hyperoglyphe antarctica
(Illustration © New Zealand Fishing News)
Final Report November 3, 2006
Teresa Ish and Katy Doctor Director of Science and Science Intern
Sustainable Fishery Advocates

About SFA® and the Seafood Reports Sustainable Fishery Advocates (SFA) evaluates the ecological sustainability of wild-caught and farmed seafood commonly found in the United States marketplace for its FishWise® program. In doing so, SFA applies the definition of sustainable seafood and the method for its evaluation and presentation developed by the Seafood Watch® program at the Monterey Bay Aquarium. Seafood Watch® defines sustainable seafood as originating from sources, whether wild-caught or farmed, which can maintain or increase production in the long-term without jeopardizing the structure or function of affected ecosystems. Although SFA and Seafood Watch® openly share their research and interpretation with each other, FishWise® seafood reports are independently produced products. As such, SFA is solely responsible for the findings and conclusions made in this seafood report. SFA makes its sustainable seafood recommendations available to the public through these reports and its FishWise® program. FishWise® is a patented, educational program that provides information on sustainability, catch method, and origin of seafood found at retail outlets. The program seeks to educate consumers, restaurants, distributors, and retailers on sustainable fishery issues, with the goal of decreasing unsustainable fishing practices, while improving the livelihoods of people who fish, fish populations, and ocean ecosystems. The body of this report synthesizes and evaluates current scientific information related to each of five sustainability criteria. For each criterion, research analysts at SFA seek out relevant scientific information from the following information sources (in order of preference): academic, peer-reviewed journals; government technical publications; fishery management plans and supporting documents; and other scientific reviews of ecological sustainability. The report then evaluates this information against Seafood Watch’s conservation ethic to arrive at a seafood recommendation of “Sustainable/Best Choices,” “Some Concerns/Good Alternative,” or “Unsustainable/Avoid.” The detailed evaluation methodology is available at Seafood Watch’s website (http://www.mbayaq.org/ cr/cr_seafoodwatch/sfw_aboutsfw.asp) and is also available upon request from SFA. The methodology reflects the common view of SFA and Seafood Watch® of the long-term sustainability of the species and the common methods by which it is currently harvested or grown. Parties interested in capture fisheries, aquaculture practices, and the sustainability of ocean ecosystems are welcome to use these seafood reports in any way they find useful. For more information about SFA and FishWise® please contact SFA at [email protected] or call (831) 427-1707. For additional information about Seafood Watch®, visit www.seafoodwatch.org or call 1-877-229-9990. Disclaimer SFA strives to have its seafood reports reviewed for accuracy by external scientists with expertise in ecology, fishery science and aquaculture. Scientific review, however, does not constitute an endorsement on the part of the reviewing scientists of SFA or the FishWise® program or its recommendations. SFA is solely responsible for the conclusions reached in this report. SFA, FishWise®, and the seafood reports are made possible through a grant from the David and Lucile Packard Foundation, the Campbell Foundation, the Rex Foundation, and the Marisla Foundation, as well as a number of individual and business donors.
1

Executive Summary Hyperoglyphe antarctica, called bluenose in New Zealand and blue eye trevalla in Australia, is a relatively new fishery in the southern Pacific Ocean. Early recorded landings were as bycatch from the deepwater trawl fisheries for alfonsino, and later from dropline or bottom longline fisheries. Current landings are a mix of bycatch from mid-water and demersal trawl fisheries and line fisheries for species including hapuku and ling, and targeted line, trawl, and in small amounts, gillnet fisheries. Life history parameters for bluenose are not well established, though estimates put maximum age at 40+ years (Paul et al. 2004). They are generally thought to be fecund fish with a long juvenile pelagic stage. There are some behaviors, such as spawning aggregations and schooling, as well as an ontogenetic shift, that increase correlation between the age distribution of the catch and fishing method. Australia and New Zealand rank their bluenose stocks as “not overfished,” but no quantitative assessment has been performed. New Zealand is more confident in the health of their population than Australia, but both countries acknowledge uncertainty in their assessments. The non-trawl fisheries for bluenose, as well as the non-trawl fisheries where bluenose is bycatch, have relatively low discards. While finfish bycatch is high, in Australia all of this bycatch is counted towards the set quotas and incorporated into calculating TAC (total allowable catch). The bottom trawl fisheries that take bluenose as bycatch take large amounts of benthic organisms that negatively affect the habitat and ecosystem. Management of the bluenose fishery is relatively robust; however, the lack of a quantitative stock assessment makes management difficult. While bluenose has many qualities to make it a sustainable fishery (i.e., high fecundity, wide range, low discards in the line fisheries, and governments that actively manage the stocks), the high uncertainty surrounding the biology of the species is an important conservation issue. The moderate conservation concerns for life history, stock status, and management result in an overall sustainability ranking of the bluenose fishery as “Some Concerns.”
Table of Sustainability Ranks
Conservation Concern Sustainability Criteria Low Moderate High Critical Inherent Vulnerability √ Status of Stocks √ Nature of Bycatch √ Habitat Effects √ Setline/mid-
water trawl √ Bottom trawl
Management Effectiveness √
2

About the Overall Seafood Recommendation1
• A seafood product is ranked “Unsustainable” if a total of two or more criteria are indicated as Concern: High (red) OR if one or more criteria are indicated as Concern: Critical (black) in the table above.
• A seafood product is ranked “Some Concerns” if a total of three or more criteria are indicated as Concern: Moderate (yellow) OR where the “Status of Stocks” and “Management Effectiveness” criteria are both indicated as Concern: Moderate.
• A seafood product is ranked “Best Choices” if a total of three or more criteria are indicated as Concern: Low (green) and no remaining criteria are indicated as Concern: High or Concern: Critical.
Overall Seafood Recommendation
Best Choice Some Concerns Unsustainable
1 Sustainable Fishery Advocates uses different language to describe the red, yellow, and green categories in Seafood Watch’s ranking methodology. This reflects the different needs of business customers versus general consumers but does not represent differences in evaluation methodologies between SFA and Seafood Watch®.
3

Introduction Bluenose (Hyperoglyphe antarctica), fished mainly by New Zealand within its Exclusive Economic Zone (EEZ) and by Australia, is found throughout the southern Pacific and Indian Oceans, along continental slopes and on offshore seamounts (Baelde 1996). The Australian fishery ranges from central New South Wales to southern Western Australia (Baelde 1996). Life history parameters (e.g., age at maturity, maximum age) for bluenose have undergone major revisions within the last 5 years, and current estimates have nearly doubled the maximum age up to 50-60 years (Paul et al. 2004). Biology and ecology Juveniles less than 45 cm FL (fork length) are epipelagic and school in the water column and near the surface (Duffy et al. 2000). Recruitment from pelagic to demersal lifestyle happens at approximately 47 cm. Last et al. (1993) suggest that juveniles are dependent on drifting kelp for shelter and have the ability to change color for camouflage. If juveniles drift with the kelp for an extended period of time, their distribution may ultimately be influenced by “the oceanographic features responsible for the movement of the algae” (Duffy et al. 2000). During their juvenile stage, they feed on planktonic and benthic organisms (Duffy et al. 2000). Adults are semi-pelagic; they live close to the sea-floor but make feeding excursions into the water column. They are associated with rocky ground on the upper continental slope between 100 and 600 m depth (Duffy et al. 2000; Horn 2003). It is not unusual for fish to school according to size-class (Horn 2003). Adults feed primarily on the pelagic tunicate Pyrosoma atlantica but also on cephalopods, crustaceans and fish, including small lanternfish (www.fishbase.org; Jones 1985). Bluenose can be relatively sedentary in the short term (6-8 months); however, some remain in the same vicinity for long periods of time (tagged and recaptured on the same ground 2-8 years). They are also capable of rapid and extensive movement. Evidence shows fish traveling in excess of 450 km during a study period of 8.5 years (Horn 2003). This indicates a potentially high level of mixing between management areas. Fishery development and landings In New Zealand, early bluenose landings were almost exclusively from bycatch. The deep water trawl fishery for alfonsinos (Beryx spp.) landed a large portion of these early bluenose landings. The deep water trawl fisheries are all bottom trawl fisheries, which take place on deep-water seamounts (Gianni 2004). In New Zealand, until the 1970s, most bluenose landings were taken as bycatch from the hapuku (groper, Polyprion oxyeneios) line fishery. In 1986, the semi pelagic trawl fishery for alfonsino accounted for 60% of New Zealand bluenose landings (1552 mt) (Horn 1988). The target fishery developed in the early 1980s off the lower east coast of the north island of New Zealand (BNS 2) (Figure 1) (see section 5 for more details).
4

Figure 1. New Zealands administrative zones within the EEZ, for bluenose.
Availability of biological information on bluenose when the target line fishery developed was minimal, so in 1985 the New Zealand Ministry of Agriculture and Fisheries began a research program to investigate bluenose and alfonsino (Horn 2003). New Zealand fisheries landed 28 mt of bluenose by deepwater trawl in 2001, mostly as bycatch in the alfonsinos (Beryx spp.) fishery (Gianni 2004), as well as in the gemfish (Rexea solandri) inshore trawl fishery (Annala et al. 2004). Annual landings of products fished off of seamounts, including orange roughy (Hoplostethus atlanticus), black oreo (Allocyttus niger), smooth oreo (Pseudocyttus maculatus), cardinal fish (Epigonus telescopus), alfonsino (Beryx splendens), bluenose, and rubyfish (Plagiogeneion spp.), amount to 40,000-45,000 mt (Annala et al. 2004). Most of the trawled bluenose is landed as bycatch from the alfonsino and gemfish trawl fisheries from one of New Zealand’s management regions (BNS 2); however in 1995-96, 31% of the bluenose catch from this region was taken by line, including dropline, bottom longline, and dahn lines. The landings in New Zealand’s BNS 2 have been maintained at approximately 800-1100 mt annually since the opening. This region accounts for about a third of the national landings, and was only surpassed by BNS 1 as the top producing area in the 2001-2002 fishing year (Sullivan et al. 2005). Much of the bluenose imported into the US now comes from a targeted hook-and-line fishery in New Zealand, which operates in three of the management regions (BNS1, BNS7, and BNS 8). Target fisheries opened up in BNS 1 in the late 1980s and in BNS 3 in the mid-1990s (Horn 2003). The remaining bluenose fishery is a small, targeted setnet fishery. Targeted trawl and line fisheries for bluenose are developing on the Chatham Rise as well (Annala et al. 2004). Chatham Rise has been fished commercially since 1978, and is one of the main deep-water fishing areas. The Subtropical Convergence (STC) overlies the Chatham Rise, consequently increasing its biological importance (Probert et al. 1997). In Australia, bluenose, known as blue eye trevalla, is a principal non-trawl species, and has been managed by limited entry since the mid-1980s and by Total Allowable Catch (TAC) since 1992 (Tilzey 2004). The fishery off Tasmania and the southeast coast has traditionally been operated
5

with droplines on hard sea bottom (target line fishery) at the continental shelf break between 300 and 500 m. Droplines consist of polypropylene lines anchored with a weight to the sea bottom and supported vertically by buoys. There are generally 10-15 lines per boat, each carrying about 100 hooks (Baelde 1996). A minor component of catches of bluenose to the east of New South Wales were recently identified as ocean blue eye (Schedophilus labyrinthicus), but reported as blue eye (Bruce et al. 2002). In 2003 bluenose non-trawl landings in the Southern and Eastern Scalefish and Shark Fishery (SESSF) reached nearly 700 metric tons (mt) (Tilzey 2004). Availability of Science In both Australia and New Zealand, fisheries data specific to bluenose have been collected since at least the early 1980s; however, the biology of juveniles is poorly known (Duffy et al. 2000). Much of the size and aging work done has resulted in a lower than expected maximum age, and research on age validation is ongoing. There are a fair amount of data on habitat impacts of the trawl fishery, which represents a small portion of both Australia and New Zealand’s fisheries. Due to log book programs in both countries, information on landings and bycatch are readily available, but reference points developed from adequate stock assessments for the species are lacking. Market Availability Common and market names: Common and market names for Hyperoglyphe antarctica include: Antarctic butterfish (fishbase common name), bluenose seabass, Antarctic cutlerfish (US, Canada), bluenose, stone eye (US, New Zealand), blue bream (US, Australia), blue-eye trevalla, bluenose warehou, trevalla, bonita, big-eye, blue eye cod, Griffins silverfish, deep-sea trevalla, deep sea trevally, sea trevally, (Australia) (www.inspection.gc.ca/english/anima/fispoi/fishlist/canadahomee.shtml; vm.cfsan.fda.gov; www.affa.gov.au; Horn 1988). Hyperoglyphe antarctica was formerly Hyperoglyphe porosa (www.fishbase.org). Seasonal availability: The fisheries operate year around (Baelde 1996). Product forms: Bluenose is available fresh (Baelde 1996) or frozen, usually headed and gutted. Bluenose has relatively high conversion rates (Table 1), the amount of whole fish needed to produce one pound of processed fish. Table 1. Conversion weights from processed to whole fish (http://www.fish.govt.nz/commercial/info/conversions.htm).
Greenweight Equivalent
Gutted Headed and Gutted Dressed Fillets Fillets, Skin-off Bluenose 1.10 1.40 1.70 2.25 2.80
6

Import and export sources and statistics: New Zealand’s exports of bluenose to the United States in 2004 totaled 858,687 kg, 55% of New Zealand’s total bluenose exports of 1,559,279 kg, and 51% of exports by value. This is a decrease over 2003’s US exports of 887,035 kg, following a slight decrease in worldwide bluenose exports. New Zealand’s exports of bluenose to Australia in 2004 made up 47% of total bluenose exports by value (these are official export figures prepared by the Information Centre, New Zealand Seafood Industry Council, Ltd., from information collected by NZ Customs and supplied by Statistics New Zealand). Imports of bluenose into the US are below their peak of 887,000 lbs in 2003, but still far above 2000 levels. Bluenose is not commercially exported from Australia (Dr Eileen Gosling, Program Manager-Fish Exports, Department of Agriculture, Fisheries and Forestry Australia, pers. comm., June 21, 2005). Analysis of Seafood Watch® Sustainability Criteria for Wild-Caught Species Criterion 1: Inherent Vulnerability to Fishing Pressure Growth, longevity and fecundity Data currently available on growth and longevity are not fully validated. Maximum ages are definitely more than 25 years and are likely to be in excess of 40 years (Table 2), but until aging studies are fully validated this wide range (25-40+ years) is still applicable. Previous estimates put maximum age as low as 12 years (Horn 1988); however, Horn’s (1988) life history parameters are no longer used in New Zealand and analysis of bomb radio-carbon in bluenose otoliths has indicated that the maximum age of this species in both Australia and New Zealand is in excess of 25 years (Kalish and Johnston 2002; Paul et al. 2004). Growth trajectories from Tasmania (Webb 1979 in Horn 1988) were similar to those found in samples from New Zealand, albeit with lower growth rates, and while the growth parameters have been refined, one would expect the same qualitative results. Horn (2003) attributes the early low estimates of maximum age to differences in the interpretation of otoliths. Paul et al. (2004) suggest that otolith zones counted as one year are more likely formed at a rate of one every two years, doubling the estimated ages. If original estimates put maximum age at around 25 years (Annala et al. 2004), an under estimation of half would corroborate Paul et al.’s (2004) estimate of a 50-60 year maximum age. If Baelde’s (1996) estimates for a 40 year lifespan are used, the commercial catch is dominated by 3-12 year old fish. Likewise, with Horn’s (1988) estimation of individuals being fully recruited to the fishery by age 4, we can adjust for longer lifespan and estimate that fish are recruited to the fishery between 8 and 12 years old, near estimated age at maturity. For the 2004-2005 fishing year, New Zealand’s assessment is based on estimates that most of the catch is aged between 5-10 years, with a maximum age of 40-50 years (Hore et al. 2004). Female fish have a significantly higher growth rate than males and dominate the larger size class. There is no indication of significant regional growth differences (Horn 1988). Reports of widely varying maximum ages as estimated from otoliths between Australia and New Zealand resulted from different aging methods (Paul et al. 2004). There is wide variation in growth rates of
7

individual fish. Their pelagic life history stage makes the fish unavailable to the fishery early in life (Horn 1988). Table 2. Life history characteristics of bluenose for the two main management regions. Superscript numbers on the life history parameters correspond to the superscript numbers in the sources column.
Intrinsic Rate of Increase (r)
Von Bertalanffy Growth
Parameters
Age at Maturity Maximum Age Fecundity Sources
Unavailable
Male: K=0.081
L∞=81.12
Female: K=0.081
L∞=86.12
Female: 11-12 years
Male: 8-9 years5
50-60 years3; greater than 25 (used in assessments)4
1.3-11 million oocytes per fish5
Smith and Wayte 20041; Horn 19882; Paul et al. 20043;
Annala et al. 20044; Baelde 19965
Spawning/reproductive strategy Off southeast Australia spawning occurs from early March to May (Baelde 1996). Bluenose are partial spawners and may not release all of their eggs in one or multiple spawning events. Each fish carries between 1.3 and 11 million oocytes, and like most fish fecundity shows an increase with the length of females (Baelde 1996). Seasonal spawning aggregations for bluenose make mature fish vulnerable to fishing pressure, particularly the hook-and-line fishery (Tilzey 2004). Baelde (1996) found that the proportion of larger fish of both sexes increased from 31.3% during non spawning season (May-Dec) to 61.3% during spawning season (March-May) in Australia. Species range Bluenose range throughout the southern Pacific and Indian Oceans, including New Zealand, in the southwest Pacific, and southern Australia (Baelde 1996). Reports from fishing vessels also identify bluenose near Argentina, in the southeast Atlantic, and near South Africa (www.fishbase.org). In Australia, bluenose range from central New South Wales to southern Western Australia and offshore seamounts (Baelde 1996). From the limited studies performed, the population seems to be well mixed. No genetic differences have been found from collections off New South Wales, Tasmania, or South Australia (Bolch et al. 1993; Tilzey 2004). Currently a study is being conducted to determine relationships between fish on offshore seamounts and those on the continental slope (Tilzey 2004). Habitat quality and special considerations Bluenose are found on continental slopes and around seamounts in the southern Pacific and Indian Oceans, primarily around New Zealand and southern Australia (Clark and O'Driscoll 2003). Around New Zealand, bluenose are found on the seamounts closest to land, and within the 1000 m depth contour (Figure 2). The 1000 m depth contour has the highest proportion of fished seamounts in New Zealand waters, with 80% of such seamounts fished (Clark and O'Driscoll 2003). Some seamount habitats have been heavily fished for other deepwater species, like orange roughy and oreos, with severe impacts on biotic and abiotic habitat structure from scraping of the seabed, re-suspension of sediments, and destruction of sessile animals like corals
8

and sponges (Clark and O'Driscoll 2003). More than 25 years of trawling on and within 10 km of seamounts have damaged the habitats. This habitat loss could in turn affect the bluenose population’s ability to sustain itself under heavy fishing pressure, although there have been no studies on bluenose productivity and its relationship to habitat quality.
Figure 2. Distribution of the most important seamounts in fisheries for orange roughy (yellow squares), oreos (red circles), black cardinalfish (green diamonds), alfonsino (black stars), and bluenose (blue triangles-highlighted with
arrows). Symbols on seamount have been offset for clarity. From Clark and O’Driscoll (2003). Behavior Bluenose may be resilient to fishing pressure due to widespread distribution, occurrence in untrawlable areas, and presumed pelagic juvenile lifestyle; however, schooling behavior does make bluenose vulnerable to certain fishing methods like a mid-water trawl (Horn 1988). There is also concern that longevity and lack of long distance moving during the non-spawning period may contribute to localized depletion (Sullivan et al. 2005). In Australia, migrations of bluenose between deeper wintering grounds, shallower feeding grounds, and spawning summer grounds in both northeast Tasmania and Victoria, Australia, have been observed (Winstanley 1978; Baelde 1996). Rowling (1999) found clear seasonal patterns in the Australian fishery with spring landings dominated by smaller fish and the highest number of large fish appearing in the fall. The seasonal variation could be attributed to size-specific migration (Horn 2003). Gear type also influences average size of the landings, with larger fish appearing in the dropline fishery than in the trawl fishery (Rowling 1999). The pattern of modes in the size distribution of landings from the dropline fishery is thought to reflect behavioral patterns that occur after settlement (Rowling 1999).
9

Experimental dropline surveys in southern Australia show that while immature individuals are vulnerable to the gear, they do not comprise the bulk of the landings (Jones 1985). In Tasmania, the bulk of commercial catch consisted of small (<55 cm FL) immature (3-4 years) fish year-round (Baelde 1996). This is consistent with other findings that show variation in latitude, where the small, northern fishery is dominated by large fish and the central and southern fisheries land more medium sized and small fish, except during the spawning season in the fall (Rowling 1999). In New Zealand, juveniles <45 cm FL are rarely caught (Horn 1988). Findings show that two thirds of the commercial catch are pre-reproductive fish (Horn 1988). There is some evidence that larger fish concentrate on seamounts, but the data are sparse, and there are suggestions of an increase in the proportion of small fish in seamount catches since the mid-1990s (Rowling 1999). Synthesis Recent recalculations of age based on bomb carbon have greatly increased the estimated maximum age of bluenose. The readjustment of the maximum age and recalculation of size at age have led to higher estimates of age at maturity. The new growth and aging parameters are of moderate to high conservation concern individually. Overall, based on a maximum age of more than 25 years, the overall inherent vulnerability is a moderate conservation concern, although it is just on the cusp of a high conservation concern. Finally the high levels of immature fish caught in the fishery as a result of migrations and schooling behaviors raises concern about the sustainability of the fishery. These areas of moderate concern combined with areas of low concern such as fecundity and range give bluenose a moderate inherent vulnerability ranking. Inherent Vulnerability Rank:
Resilient Moderate Vulnerable Criterion 2: Status of Wild Stocks Current population size and occurrence of overfishing While no quantitative stock assessments have been performed for the New Zealand or Australian bluenose stocks, both countries have developed qualitative assessments. Australia’s Southern and Eastern Scalefish and Shark Research Assessment Group (SESSRAG) is in the process of developing a quantitative stock assessment for Australia (Rowling, pers. comm.). The New Zealand plenary report on bluenose was completed in 1996, with the most recent update from May 2005 (Sullivan et al. 2005). The New Zealand stock is thought to be above maximum constant yield (MCY) in most regions (Sullivan et al. 2005). MCY is defined as “the maximum constant catch that is estimated to be sustainable, with an acceptable level of risk, at all probable future levels of biomass” (Sullivan et al. 2005). The Australian SESSF (Southern and Eastern Scalefish and Shark Fishery) 2004 status of bluenose classified the stock as “not overfished,” but localized overfishing may be occurring. There is uncertainty surrounding the classification of the Australian stock. Long term potential yield is unknown, and the reliability of the Australian assessment of bluenose is poor (Tilzey 2004).
10

No fishery-independent biomass estimates are available for bluenose, thus all biomass information is derived from fishery-dependent data. These assessments rely on catches and catch rates, which are affected by gear technology improvements. When fishing power increases, the use of unstandardized catch rates leads to optimistic assessments and a real possibility that catch rates do not reliably indicate relative stock abundance. Furthermore no age structured modeling has been completed, there is no information available to determine a stock-recruitment relationship, and there are inconsistencies and a lack of a good time series for logbook data. Additional complications of having fishery-dependent data only are that the introduction of ITQ (individual transferable quotas) as the main form of management makes interpretation of catch rates difficult. MCY cannot be estimated for the New Zealand fishery because stock size is unknown. An estimate of 520 mt, based on estimated B0 of 6,600 mt from the age-structured model, is the current best guess of MCY. The fishery sustained annual catch of approximately 1000 mt between 1991-92 and 1995-96, which suggests the estimated B0 was conservative (Annala et al. 2004). Furthermore, the 2002-03 population index in BNS1 was at 106% of the average index, indicating that the population in BNS1 is most likely above BMSY. For other management areas, the population is thought to be above BMSY as well (Annala et al. 2004). Catch per unit effort (CPUE) may not be a reliable index of abundance because of a combination of bluenose and fisher behavior such as schooling and habitat preference by size. While catch and effort data may prove useful in estimating biological reference points, a fishery-independent index would improve confidence. Since no fishery-independent index of abundance exists, determining whether proposed allowable catch limits would allow movement towards BMSY and whether the stock abundance has remained stable at current catch levels involves moderate uncertainty. Degree of uncertainty in status of stock There is moderate uncertainty in the status of the bluenose stock in both Australia and New Zealand. Both countries lack a quantitative stock assessment, little is known about the stock recruitment relationship, and nearly all of the population data comes from fishery sources. Despite these short-comings, both Australia and New Zealand have qualitative estimates of the status of the stock, and catch limits are adjusted to reflect these estimates (Annala et al. 2004). In New Zealand, the target logbook coverage in the longline fishery is 100% because this fishery accounts for 80% of total catch. However, overall coverage dropped from 40-50% in previous years to 22% and 15% in 2001-02 and 2002-03, respectively. Lacking full coverage and having variable levels of coverage compromises the ability of the adaptive management program (AMP) to reflect accurate spatial patterns of fishing effort and detect overfishing. In all management areas except for BNS3, managers are uncertain if the TACC (total allowable commercial catch, which excludes recreational “customary” fishing quotas) is sustainable or will “allow the stock to move towards the size that will support the MSY” (Annala et al. 2004). Australia faces the same uncertainty in stock size and structure as New Zealand, thus ranks the reliability of the bluenose assessment as “poor” (Tilzey 2004). Further contributing to uncertainty in the stock in both countries is the lack of validated aging data (Paul et al. 2004).
11

Long-term trend The bluenose fishery is relatively new, with very little long-term or time series data. The trawl fishery for bluenose did not begin with any significance until 1989, so long-term data available are minimal (Clark and O'Driscoll 2003). Prior to 1981, bluenose was sometimes recorded as hapuku (groper), thus earlier data may be inaccurate (FAO 2002). In Australian waters, bluenose have been identified in landing records since only 1978-79, despite the targeted fishery beginning nearly 20 years prior. Landings remained steady at around 100-150 tons annually until the mid-1980s when fishing on offshore seamounts increased landings (Rowling 1999). Short-term trend Australia Bluenose is a relatively small fishery in Australia, with landings at less than 1000 tons annually. Australia allows “carryover” of uncaught quota between years, and in 2003 permitted 20% carryover from the 2002 quota. In 2004, the TAC was reduced (Tilzey 2004). Despite the changes in TACs and interannual quota carryover, landings have remained relatively stable (Figure 3) although CPUE has declined slightly in recent years.
Figure 3. Landings and TACs for the trawl fishery and non-trawl fisheries in Australia between 1992 and 2003.
New Zealand In New Zealand, CPUE, both standardized and unstandardized, has remained relatively stable since bluenose became an important commercial fishery (Annala et al. 2004). CPUE for the combined targeted bluenose line fishery, as well as for the alfonsino target trawl fishery, in which bluenose can comprise a large portion of bycatch, have also shown relatively little change since heavier exploitation began (Figure 4).
12
00.20.40.60.8
11.21.4
1989-90
1990-91
1991-92
1992-93
1993-94
1994-95
1995-96
Fishing Year
Rela
tive
Inde
xTarget bluenose linefishery CPUETarget alfonsino trawlfishery CPUE
Figure 4. Index of CPUE for the bluenose fishery in New Zealand in BNS 2. From Annala et al. (2004).
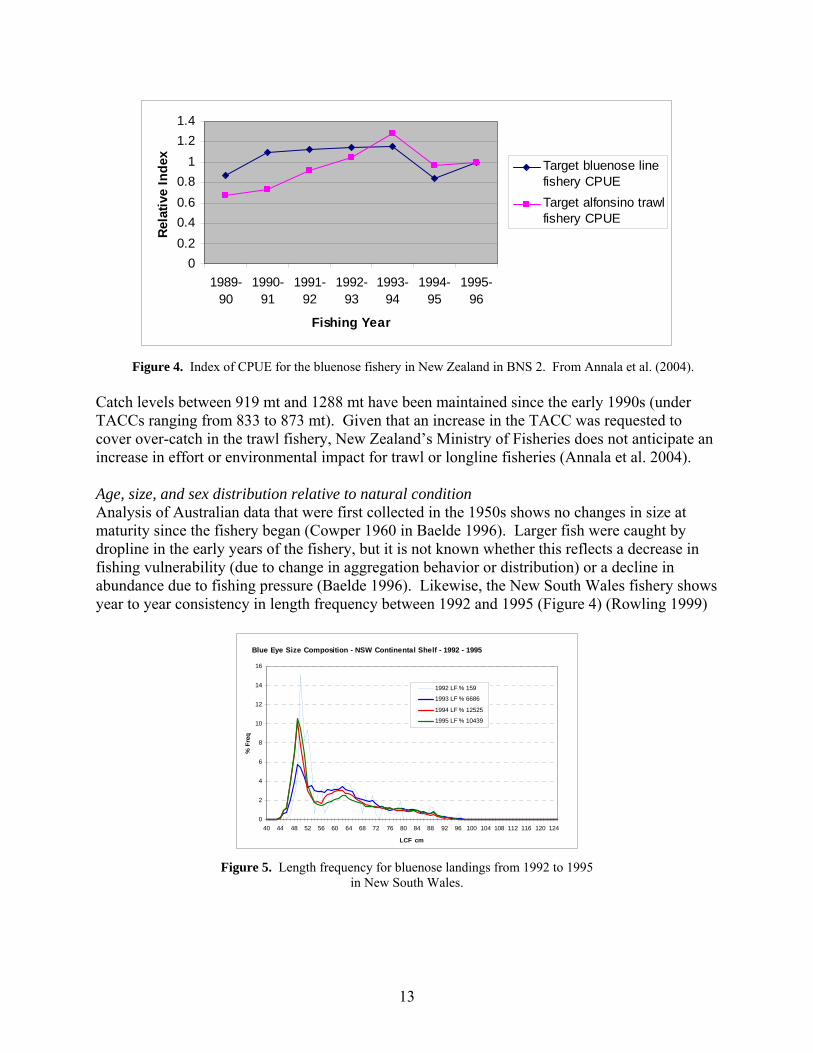
Catch levels between 919 mt and 1288 mt have been maintained since the early 1990s (under TACCs ranging from 833 to 873 mt). Given that an increase in the TACC was requested to cover over-catch in the trawl fishery, New Zealand’s Ministry of Fisheries does not anticipate an increase in effort or environmental impact for trawl or longline fisheries (Annala et al. 2004). Age, size, and sex distribution relative to natural condition Analysis of Australian data that were first collected in the 1950s shows no changes in size at maturity since the fishery began (Cowper 1960 in Baelde 1996). Larger fish were caught by dropline in the early years of the fishery, but it is not known whether this reflects a decrease in fishing vulnerability (due to change in aggregation behavior or distribution) or a decline in abundance due to fishing pressure (Baelde 1996). Likewise, the New South Wales fishery shows year to year consistency in length frequency between 1992 and 1995 (Figure 4) (Rowling 1999)
Blue Eye Size Composition - NSW Continental Shelf - 1992 - 1995
0
2
4
6
8
10
12
14
16
40 44 48 52 56 60 64 68 72 76 80 84 88 92 96 100 104 108 112 116 120 124
LCF cm
% F
req
1992 LF % 159
1993 LF % 6686
1994 LF % 12525
1995 LF % 10439
Figure 5. Length frequency for bluenose landings from 1992 to 1995
in New South Wales.
13

For fish taken in New Zealand’s Bay of Plenty (eastern BNS 1) there appears to be a decline in average length of female fish. This trend, however, is not apparent for females in East Northland (western BNS 1) or for males in either area (Annala et al. 2004). Synthesis While fishery-dependent data on bluenose landings and CPUE show that the populations have remained relatively stable, there has not been a quantitative stock assessment for bluenose in New Zealand or Australia. Thus, population biomass is unknown, making accurate estimates of MSY impossible. However, the general thought is that the New Zealand stocks are healthy and above BMSY, while Australia’s stocks are fully fished. TACs/TACCs have worked well in ensuring a consistent catch and CPUE since the fishery expanded in 1989-1990, indicating that the stock is most likely above the target population size. However, due to the number of uncertainties and the lack of a quantitative stock assessment, the status of wild stocks ranks as a moderate conservation concern. Status of the Stocks Rank: Healthy Moderate Poor Critical Criterion 3: Nature and Extent of Bycatch The close association of many species with bluenose is reflected in the fact that fisheries for species that occur as incidental catch in the bluenose fishery also take bluenose. Bluenose has been caught incidentally in commercial fisheries for many years prior to the development of a targeted fishery. In 1986, the semi-pelagic (or mid-water) trawl fishery for alfonsino accounted for 60% of New Zealand bluenose landings (1552 mt) (Horn 1988). Likewise, alfonsino is caught in the targeted bluenose bottom longline fishery in BNS1. Incidental catch of alfonsino has been consistent over time, but comprises a “very small proportion” of the total alfonsino catch in the region (Annala et al. 2004). Percent of targeted landings Hapuka, bass grouper, dogfish, gemfish, ling, redfish, ocean perch, blue grenadier, and Ray’s bream are all taken in Australia’s dropline bluenose fishery (Smith and Wayte 2001 in Bruce et al. 2002). A single experimental survey of the dropline fishery off South Australia targeting bluenose showed high levels of bycatch of piked dogfish (Squalus megalops), which was 68% of the bluenose catch. This shark is considered “data deficient” by the IUCN Redlist of Threatened Species™ (www.iucnredlist.org). However, catches of the piked dogfish and the size distribution of individuals caught did not change in comparisons between the 1976-77 and 1996-97 years (Graham et al. 2001), indicating that the bycatch is not having major deleterious effects on the population. A small number of other teleosts (47) and elasmobranches (37), excluding piked dogfish, were also caught in the experimental study indicated above. Total incidental catch, both discarded and retained, was 86% of the bluenose catch. There were no data in this study indicating what was retained (Jones 1985). The majority of the teleosts, which included hapuku, gemfish, and ling, are commercially-valuable and thus retained when caught (Tilzey 2004).
14

Bycatch in targeted bluenose fisheries Major concerns for the predominant fisheries are bycatch of undersized or non-target finfish and sharks resulting in stress, damage, or fatalities to bycatch species; lines entangling and damaging structures or marine life; and lost gear entangling seafloor or marine life (Morgan and Chuenpagdee 2003). In New Zealand’s BNS 1 and BNS 3 regions, the industry has acknowledged the potential interaction with seabirds and developed and implemented a Code of Practice that was proposed in 2001. Special deployment methods of longlines (heavy weights and quick sinking) used in the dropline fishery may result in lower seabird mortality than other longline methods (Annala et al. 2004). Australia’s Department of Environmental Heritage ranks the relative rate of seabird bycatch in the South East Non-trawl Fishery using longlines, trotlines, and droplines as “low/insufficient data” where the definition of high relative bycatch is “a regularly reported by-catch rate exceeding 0.1 birds/1000 hooks” (www.deh.gov.au). Reporting procedures are currently being developed in New Zealand to help measure and monitor rates of capture/mortality of non-fish bycatch (Annala et al. 2004). Further bird bycatch studies in New Zealand of the entire demersal longline fishery show that between 1999 and 2000, 203 seabirds were reported captured. Of these, 12 were released alive. However, observer coverage may be incomplete. Incidental catch figures are not available for the bluenose longline fishery as there is currently no observer coverage of this fishery (Anonymous 2004). In Australia, the continuing rise in the fur seal population has resulted in significant increases in seal-fishery interactions throughout the SESSF (Tilzey 2004), but given the low occurrence of interaction of marine mammals in the bottom longline fishery, this is of low concern. Furthermore, the ISMP (Integrated Scientific Monitoring Program) recorded a “low trawl bycatch of marine birds and reptiles” (Tilzey 2004). Observed discard rates for all fish species managed in Australia’s South East Trawl Fishery since 1993 are about 40-50% by weight of total catch for all species (approximately 100% of the targeted landings) off New South Wales and eastern Victoria, and around 35% (54% of targeted landings) west of Bass Strait; however, ecological and economic impacts of such discard is unknown. To address the high ratio of discards to total catch, the Australian government has permitted cross-sector leasing to encourage a reduction in discards (Tilzey 2004). Discards of non-quota fish in Australia’s non-trawl fishery were 41%, while discards of quota species were less than 1%. The quota species with highest discard over the entire non-trawl fishery were gummy sharks (36%). Piked dogfish comprised most of the discards (89.4%) in the dropline fishery as a whole (Talman et al. 2004). In 2003, allowable discards for the bluenose trawl fishery were set to zero (Tilzey 2004). In a sampling from the targeted bluenose dropline fishery in Australia discarded bycatch was very low, less than 1% of retained catch. Retained incidental catch, however, was about 6% of retained bluenose (Knuckey et al. 2002). The discarded fish in the study were comprised of black shark, draughtboard shark, and damaged bluenose. A similar study in the demersal longline fishery, most targeting pink ling (Genypterus blacodes) found a discarded bycatch rate of about 7% of retained catch, and a retained incidental catch rate of about 12%. The retained
15

species included blue eye trevalla, ribaldo, offshore ocean perch, platypus shark, and various other shark species (Knuckey et al. 2002). Bluenose as bycatch Nearly as much bluenose is landed as incidental catch in other fisheries as in targeted fisheries. It constitutes a major incidental catch species for alfonsino and gemfish target fisheries, as well as a minor incidental catch species for the gemfish and hoki trawls. Allowable discards of bluenose in the trawl fishery in 2003 were set to zero (Tilzey 2004). Approximately 50% of BNS 2 bluenose catch in 1995-96 was taken as incidental catch in the alfonsino midwater trawl fishery. Bluenose is also a minor incidental catch species of line fishing targeting hapuku and ling; incidental catch constitutes 32% of the bluenose landed in line fisheries (Annala et al. 2004). In Australia, bluenose is also taken in other fisheries, and has a discard rate of only 3% across all fisheries (Talman et al. 2004). Alfonsino and bluenose have the closest linkage (Clark and O'Driscoll 2003). In fact, the constraint on the expansion of the alfonsino fishery may be the levels of bluenose bycatch and limited bluenose TACC (Annala et al. 2004). Much of the overcatch of the bluenose quota comes from incidental catch. When fishing practices in the alfonsino trawl fishery changed to reduce bluenose bycatch, overcatch was reduced to around 10%, where it currently remains (Annala et al. 2004). Synthesis While incidental catch of finfish in the dropline fishery exceeds 100% of bluenose landed, the catch is counted against the allowable catch for the caught species and is not discarded. A predictable assemblage of finfish bycatch in the bluenose targeted fishery and in the fisheries where bluenose is bycatch has led to a rigorous management plan to ensure that bycatch is accounted for. There is concern about bycatch of benthic organisms in the bottom trawl fishery, but as this is a very small fraction of bluenose catch in a non-target fishery the threat is very low. Seabird bycatch is a concern in all bottom longline fisheries; however, both the Australian and New Zealand governments have taken an active role in reducing bycatch, and methods to reduce bycatch are incorporated in the fisheries’ management plans. Nature of Bycatch Rank:
Benign Moderate Severe Critical Criterion 4: Effect of Fishing Practices on Habitats and Ecosystems The bluenose fishery is split between a deep sea trawl fishery, often concentrated around seamounts, a midwater trawl fishery, and a dropline or bottom longline fishery. While bottom longlines have the potential to cause habitat damage by tangling on or crushing deepwater corals at anchor points, the amount of damage is generally thought to be low (Fossa et al. 2002). Hook-and-line fisheries contribute substantially to marine debris in reef areas, but affect a very small portion (0.2%) of reef habitat (Chiappone et al. 2005). Midwater trawls are not designed to contact the seafloor, but can be towed very near the bottom. The impacts of this occasional
16

contact is not well studied (Morgan and Chuenpagdee 2003); however, the deep sea trawl fishery has long been known to cause serious habitat damage (Clark and O'Driscoll 2003). While the targeted fishery for bluenose is dominated by dropline and other non-trawl fisheries, bluefish are also caught as bycatch in the deepwater trawl fishery for alfonsinos (Beryx spp.). New Zealand seamounts that are important for bluenose are all within the 1000 m depth contour, primarily around the east side of the North Island (Figure 1) (Clark and O'Driscoll 2003). Both of these fisheries are bottom trawl fisheries that occur primarily on seamounts in international waters (Gianni 2004). Such bottom trawl fisheries have large bobbins set along the ground rope of the trawl, which are likely to crush benthic organisms like corals and large sponges as they are pulled along the seafloor (Probert et al. 1997). As new seamounts and deepwater grounds are fished, New Zealand fishermen report an accompanying decline in invertebrate bycatch taken in trawls (Jones 1992), indicating rapid depletion of the deepwater reef building species. The fisheries for orange roughy and alfonsinos, combined with 8 other species, constitute 95% of the landed catch in high seas bottom trawl fisheries (Gianni 2004). In terms of habitat and ecological impacts of the high seas trawl fishery for orange roughy, the removal of epibenthic organisms that provide much of the habitat and community structure on the seamount is of great concern. Bycatch of corals such as Goniocorella dumosa and Solenosmilia variabilis, the most prominent deepwater reef-building species on seamounts around New Zealand and Australia, as well as other invertebrates are some of the characteristic bycatch species reported from the New Zealand orange roughy fishery (Probert et al. 1997; Gianni 2004). The foot rope of the trawl drags along the bottom, so these epibenthic organisms are removed or damaged along the track of the trawl (Koslow et al. 2001). In the Australian and Tasmanian trawl fisheries, so much deepwater coral was removed that an industry trade based on the bycatch of bamboo, gold, and black corals began (Grigg and Brown 1991). Fortunately the response of the Australian government to the high levels of bycatch on seamounts resulted in the closure of 370 km2 that contains 12 seamounts that peak at depths between 1300 and >1700 m (Koslow et al. 2001). As of 2003, New Zealand had protections that applied to three seamounts, Pyre, Gothic, and Morgue, two of which were unfished (Clark and O'Driscoll 2003). Most of the work done on the impacts of the deep sea trawls on habitats has focused primarily on seamounts. The bluenose fishery actually occurs farther from seamounts than fisheries like the orange roughy fishery (Figure 6), and expends higher effort near the seamount than the landings reflect, while the orange roughy fishery does the opposite (Clark and O'Driscoll 2003). This would indicate that effects of the bluenose fishery on seamounts could be reduced, or that the fishery has already depleted bluenose nearer to the seamount, which has clear implications for the current sustainability of the fishery.
17

Figure 6. Cumulative distribution of targeted effort (thin lines), and catch (thick lines) from both target and non-target tows, in relation to distance from the nearest seamount. Orange roughy is shown for comparison.
From Clark & O’Driscoll (2003). Synthesis Habitat and ecosystem impacts are by far the greatest in the bottom trawl fishery, in which bluenose is taken as bycatch. The deepwater corals found on the deep sea fishing grounds where bluenose are caught are susceptible to damage by trawl gear and are slow to re-grow once damaged or removed. The effects of deepwater trawling are thus a high conservation concern. Other fisheries for bluenose, either targeted or incidental, have relatively low impact on habitats or ecosystems. The greatest concern in non-trawl fisheries is often lost fishing gear. Effect of Fishing Practices Rank: Setline/midwater trawl: Low Moderate Severe Critical Bottom trawl: Low Moderate Severe Critical Criterion 5: Effectiveness of the Management Regime New Zealand The New Zealand Ministry of Fisheries divides the bluenose stock into five management sections within its EEZ: BNS 1; BNS 2; BNS 3; BNS 7; and BNS 8 (Figure 6) (Annala et al. 2004). The extent to which these management boundaries reflect the biological stock boundaries is unknown (Horn 2003). A TACC (Total Allowable Commercial Catch) is implemented for each individual BNS region that covers both the target fishery and bycatch from other fisheries, and all fisheries taking bluenose operate under an Adaptive Management Program (AMP) (Annala et al. 2004). Data collection Logbook programs associated with the AMP must provide information on non-fish bycatch as well as fishery data, such as landed green weight and sex and length composition data. The purpose of the logbook program is to “provide additional information on spatial-temporal
18

changes in relative abundance, fishing effort and size structure” to predict localized depletion (Annala et al. 2004). There are no large scale fishery-independent sampling programs, although individual researchers have performed independent sampling programs, but so far all the programs still depend on fisheries at some level (e.g., Horn 1988, Baelde 1996). Research bottom trawling is an ineffective way of assessing bluenose populations because they are often found in areas that are difficult to trawl, and acoustic methods for estimating school size are inappropriate because bluenose are often found mixed with other species (Hore et al. 2004). Scientific advice As landings have increased, it is clear that New Zealand TACCs are regularly exceeded country-wide (Figure 7), but in the past 2 years total landings have been less than the total TACC. BNS 2 and BNS 3 are the areas that most often exceed the recommending landings. Landings from BNS 2 were dominated by bycatch from the alfonsino midwater trawl fishery, but as regulation has controlled bycatch from this fishery, the landings of bluenose are closer to the TACC (Annala et al. 2004; Anonymous 2004).
0
500
1000
1500
2000
2500
3000
3500
1981
*
1983
†19
85†
1986
–87‡
1988
–89‡
1990
–91‡
1992
–93‡
1994
–95‡
1996
–97‡
1998
–99‡
2000
–01‡
2002
–03‡
BNS 1
BNS 2
BNS 3
BNS 7
BNS 8
BNS 10
Total
Landings
TACC
Figure 7. Reported landings (mt) of bluenose by fish stock from 1981 to 1998-99 and actual TACCs (mt) from 1986-87 to 2002-03 (*MAF data;† FSU data;‡ QMS data). Adapted from Annala et al. (2004).
Although, or perhaps because, no stock assessment has been completed, New Zealand Ministry of Fisheries has outlined the basis behind the TACC recommendation. TACC options are based on: environmental factors affecting stock; productivity of bluenose; associated inshore species, such as alfonsino, gemfish, and hoki (all of which are managed under the Quota Management System); seabird bycatch; and risk to population or ecosystem if TACCs increase (Anonymous 2004). TACCs are set annually according to the requirements of the AMP, which includes measurements of CPUE and landings (Annala et al. 2004). Bycatch reduction plan and minimization of habitat impacts The potential for non-fish bycatch is recognized in the bluenose AMP. Studies estimate that the bottom longline component of the fishery has the potential to result in “incidental catches of other species including seabirds.” However, the increase in the TACC is not thought to have any
19

significant impacts on bycatch (Anonymous 2004). The high levels of finfish bycatch in the bluenose fishery and the high levels at which bluenose is being taken as bycatch are accounted for in the TACCs for each fishery to ensure that those sources of mortality can be included in the overall assessment of the population. The majority of landings are taken from the bottom longline and midwater trawl fisheries, which have low habitat impacts. While no habitats are specifically protected from the effects of fishing bluenose, the Fisheries Act of 1996 requires that habitats of particular significance to fisheries management be protected (Anonymous 2004). Additionally, New Zealand has closed 19 of its seamounts and fishing grounds to trawling to protect habitat (Clark and O'Driscoll 2003; Anonymous 2004). Track record Over-catch in BNS 2 peaked in 1993-94 at 52%, then declined to 10% in recent years as a result of changes in fishing practices and methods such as quota rationalization and more effective fleet management in the alfonsino trawl fishery designed to reduce bluenose bycatch (Annala et al. 2004). The TACCs set to account for bycatch have been sufficient to cover a majority of overcatch without resulting in a decline of total landings, implying that the TACC might be within the population’s biologically sustainable levels. Australia Australia divides its fishery into trawl and non-trawl sectors, where non-trawl includes all line methods. In either sector, a quantitative stock assessment for bluenose has not been performed, but qualitative assessments were completed in 1994, 1995, and 1997 (Smith and Wayte 2001 in Bruce et al. 2002). TACs for bottom and midwater trawl fisheries, as well as the longline/dropline fisheries that take bluenose are allocated as individual transferable quotas (ITQs) (Larcrombe et al. 2002). Due to concerns of future and current over-fishing for three species regulated by quotas prior to 1996 (blue eye trevalla/bluenose, blue warehou, Seriolella brama, and ling, Genypterus blacodes) the number of licenses for the non-trawl fishery was reduced from ~550 to ~160. In 1998, this reduction in the number of licenses issued was strengthened by TACs and eventually individual quotas, with plans to expand the ITQ system to the 13 other targeted non-trawl species (Grieve and Richardson 2001). Currently, a variety of management methods are used. TACs, ITQ’s, limited entry, area restrictions, and gear restrictions are all part of the management tools for bluenose. Australia has implemented a series of management actions, eventually resulting in an established quota management system for bluenose and other fisheries (Figure 8). These measures have impacted both the target bluenose fishery and the fisheries that take bluenose as bycatch.
20

Figure 8. Management timeline for Australian southeast fisheries. Adapted
from Tilzey (2004) and Bruce et al. (2002). Within the SESSF, a number of management actions have been taken to control effort. Within the line fishery, a series of licensing arrangements, including a boat replacement policy and gear restrictions were set within state waters, three nautical miles offshore. Outside state waters, in the SESSF (Figure 9), the bottom trawl, midwater trawl, and line fisheries are under limited entry policy to limit the number of active boats, as well as gear restrictions (Larcrombe et al. 2002).
Figure 9. Blue lines indicate the areas falling under the Southern and Eastern
Scalefish and Shark Fishery (SESSF). Drawing from Tilzey (2004). Data collection The ISMP (Integrated Scientific Monitoring Program) now collects fishery-dependent, detailed information on composition of catch. The data are collected by scientific observers on a sample of fishing trips to gather data on species, size- and age-composition, and information on fishing practices. Catch rate and ISMP data are reviewed annually and formal stock assessments are conducted on priority species (Tilzey 2004).
21

The CPUE reference points used to determine the status of bluenose stocks in Australia are based on trawl CPUEs only, though the bulk of the targeted catch is taken by the non-trawl sector. As bycatch in the trawl fisheries is high, however, the estimates made from this fishery may be fairly accurate (Tilzey 2004). Scientific advice The Australian Bureau of Rural Sciences (BRS) is responsible for providing the scientific advice to establish TACs. The recommended TAC is the TAC set annually by the Australian Fisheries Management Authority (AFMA) board for individual quota species; however, the actual, allocated TAC includes the recommended TAC plus carryover (Tilzey 2004). During 2003 and 2004, the allocated TAC (801 mt total, 75 mt trawl, 726 mt non-trawl in 2003; 742 mt total, 109 mt trawl, 633 mt non-trawl in 2004) exceeded the recommended combined TAC of 690 mt in 2003 and 621 mt in 2004. However, 2003 landings were lower than both the recommended and allocated TACs. The allocation level in 2004 was impacted by quota transfers between the trawl and non-trawl fisheries (Tilzey 2004), and may not be a result of poor management decisions. Bycatch reduction plan and minimization of habitat impacts As part of national policy on fisheries bycatch, a bycatch action plan has been developed for the SESSF. Additionally, the industry has actively promoted a code of fishing practice aimed at minimizing interactions with wildlife and bycatch (Tilzey 2004). This code, developed by the Australian Seafood Industry Council, commits the industry to work towards minimizing discards, recording lost fishing gear, and retaining debris found at sea (Committee 2001). The South East Trawl Management Advisory Committee (SETMAC) and the South East Trawl Fishing Industry Association endorsed the SESSF (trawl) industry code of conduct for responsible fishing in 1995 (Tilzey 2004). The Ecological Risk Assessment of Commonwealth Fisheries is currently considering the ecological impacts of fishing (Tilzey 2004). Within the bottom trawl fishery, where the impacts are well described, the reduction of benthic biomass by 106% on trawled seamounts resulted in the closure of 370 km2, which contains 12 seamounts that peak at depths between 1300 and >1700 m (Koslow et al. 2001). Additionally, the AFMA and the biodiversity group of the Department of Environment and Heritage have designated a Marine Protected Area (MPA) to protect a group of seamounts off southern Tasmania from demersal trawling (Tilzey 2004). Attempts to reduce discarding and habitat impacts of the main fisheries are relatively new, so it is difficult to assess the impact that these regulations have had. Given that the majority of non-finfish bycatch and habitat impacts occur in the deepwater bottom trawl fishery, and this fishery currently constitutes a small portion of the total bluenose landings, the changes adopted will not have much impact on the already low impact of the fishery as a whole. Track record In response to assessments that indicate the Australian fishery is fully fished, there have been a number of moves to reduce TACs. In 2004, the TAC for SESSF was reduced by 10%. Likewise, prior to ITQ management, Tasmanian non-trawl landings increased to almost 700 mt due to increased effort (Tilzey 2004). AMFA has recognized that the bluenose stock is fully fished, and efforts to control landings by reducing TAC have taken place. These are recent
22

efforts, however, thus it is difficult to tell if these measures have yet proven successful in curbing effort. Synthesis The lack of a quantitative stock assessment in both New Zealand and Australia is a moderate concern with regard to the sustainable management of the bluenose stock. Both Australia and New Zealand admit that, while landings seem to be stable, catch limits may or may not be set at a sustainable level. The effectiveness of the management regime ranking of “moderate” is thus based primarily on the lack of a quantitative stock assessment. There are other management concerns as well. The high amount of bluenose bycatch in other fisheries has led to overcatch of the allowable catch. This has largely been controlled recently, but control measures have focused primarily on accommodating the catch limits, rather than reducing bycatch. Effectiveness of Management Rank: Highly Effective Moderately Effective Ineffective Critical
23

Overall Evaluation and Seafood Recommendation Bluenose is a wide-ranging, highly fecund species, and while current landings seem to be stable, there are a number of concerns surrounding the fishery. Unconfirmed life history parameters and bycatch of bluenose in other fisheries make a quantitative assessment of the population difficult, and without a quantitative assessment, setting catch limits within the biological limits is extremely difficult. While Australia and New Zealand have set catch limits and enforce these limits, it is uncertain whether or not the limits are sustainable or meet MSY. The fishery is de facto a multi-species fishery, even though permit and quota holders target specific species. A large proportion of bluenose landings are bycatch in other fisheries, and likewise, a large proportion of the fish landed in bluenose fisheries are other targeted species. Fortunately the bycatch is not discarded but rather is counted towards the given species quota. The main target fisheries are dropline or bottom longline fisheries, which have low habitat impacts, making them a more sustainable option that the deepwater trawl fisheries that take bluenose as bycatch. Despite the uncertainty in life history parameters and stock size, the bluenose fishery is relatively well managed, with clear catch limits set and enforced annually. However, the uncertainty surrounding the dynamics of the bluenose populations and stock size means that the “Inherent Vulnerability” and “Status of Wild Stocks” criteria, and thus the “Effectiveness of Management” criterion, each constitute a moderate conservation concern, thus giving the fishery for bluenose an overall ranking of “Some Concerns.” Table of Sustainability Ranks
Conservation Concern Sustainability Criteria Low Moderate High Critical Inherent Vulnerability √ Status of Stocks √ Nature of Bycatch √
Habitat Effects √ Setline/mid-water trawl √ Bottom
trawl
Management Effectiveness √ Overall Seafood Recommendation
Best Choice Some Concerns Unsustainable
24

Acknowledgements We would like to thank Dave Banks, Data Program Manager, New Zealand Seafood Industry Council Ltd. and Dr. Kevin Rowling, Principal, Commercial Finfish Research at the Cronulla Fisheries Research Centre, New South Wales, Australia, for their critical reviews of this report. Additional thanks go to Dr. George Leonard of the Monterey Bay Aquarium’s Seafood Watch® program for providing additional comments. Scientific review does not constitute an endorsement of SFA® or Seafood Watch® on the part of the reviewing scientists. SFA® staff is solely responsible for the conclusions reached in this report.
25

References Annala, J. H., K. J. Sullivan, N. W. M. Smith, M. H. Griffiths, P. R. Todd, P. M. Mace and A. M.
C. Connell (2004). Report from the Fishery Assessment Plenary, April 2004: stock assessments and yield estimates. Unpublished report held in NIWA library, Wellington.
Anonymous (2004). BLUENOSE (BNS2) AMP PROPOSAL – INITIAL POSITION PAPER. Review of Sustainability Measures and Other Management Controls for the 2004-05 Fishing Year Adaptive Management Programme Final Advice Paper. R. Grindley, S. Williamson and A. Hore. Wellington, New Zealand, New Zealand Ministry of Fisheries: 33-50.
Anonymous (2004). National Plan of Action to Reduce the Incidental Catch of Seabirds in New Zealand Fisheries. Wellington, New Zealand, Ministry of Fisheries and Department of Conservation: 59.
Baelde, P. (1996). "Biology and dynamics of the reproduction of blue-eye trevalla, Hyperoglyphe antarctica (Centrolophidae), off Tasmania, southern Australia." Fishery Bulletin 94(2): 199-211.
Bolch, C. J. S., N. G. Elliott and R. D. Ward (1993). "Enzyme Variation in South-Eastern Australian Samples of the Blue-Eye or Deep-Sea Trevalla, Hyperoglyphe-Antarctica Carmichael 1818 (Teleostei, Stromateoidei)." Australian Journal of Marine and Freshwater Research 44(5): 687-697.
Bruce, B. D., R. Bradford, R. Daley, M. Green and K. Phillips (2002). Targeted review of biological and ecological information from fisheries research in the south east marine region. Hobart, Tasmania, Australia, CSIRO Marine Research: 175.
Chiappone, M., H. Dienes, D. W. Swanson and S. L. Miller (2005). "Impacts of lost fishing gear on coral reef sessile invertebrates in the Florida Keys National Marine Sanctuary." Biological Conservation 121(2): 221-230.
Clark, M. and R. O'Driscoll (2003). "Deepwater Fisheries and Aspects of Their Impact on Seamount Habitat in New Zealand." Journal of Northwest Atlantic Fishery Science 31: 441-458.
Committee, A. S. o. t. E. (2001). Coasts and Oceans, Australia State of the Environment Report 2001 (Theme Report). Canberra, CSIRO Publishing on behalf of the Department of the Environment and Heritage: 112.
Duffy, A. J., A. L. Stewart and R. Yarrall (2000). "First record of pre-settlement juvenile bluenose, Hyperoglyphe antarctica, from New Zealand." New Zealand Journal of Marine and Freshwater Research 34: 353-358.
FAO (2002). Report of the Second Ad Hoc Meeting on the Management of Deepwater Fisheries Resources of the Southern Indian Ocean FAO Fisheries Report. No. 677. Fremantle, Western Australia, FAO Fisheries: 106 pp.
Fossa, J. H., P. B. Mortensen and D. M. Furevik (2002). "The deep-water coral Lophelia pertusa in Norwegian waters: distribution and fishery impacts." Hydrobiologia 471(1 - 3): 1-12.
Gianni, M. (2004). HIGH SEAS BOTTOM TRAWL FISHERIES AND THEIR IMPACTS ON THE BIODIVERSITY OF VULNERABLE DEEP-SEA ECOSYSTEMS. Gland, Switzerland, IUCN: 102.
26

Graham, K. J., N. L. Andrew and K. E. Hodgson (2001). "Changes in relative abundance of sharks and rays on Australian South East Fishery trawl grounds after twenty years of fishing." Marine and Freshwater Research 52(4): 549-561.
Grieve, C. and G. Richardson (2001). "Recent history of Australia's South East Fishery; a manager's perspective." Marine and Freshwater Research 52(4): 377-386.
Grigg, R. and G. Brown (1991). "Tasmanian gem corals." Aust Gemmologist May: 399–404 as cited in Koslow, J. A., K. Gowlett-Holmes, et al. (2001). "Seamount benthic macrofauna off southern Tasmania: community structure and impacts of trawling." Marine Ecology-Progress Series 213: 111-125.
Hore, A., S. Williamson, R. Grindley, J. Cornelius and J. Mantle (2004). Review of Sustainability Measures and Other Management Controls for the 2004-05 (01 October) Fishing Year: Final Advice Paper, New Zealand Ministry of Fisheries: 264.
Horn, P. L. (1988). "Age and Growth of Bluenose, Hyperoglyphe antarctica (Pisces, Stromateoidei) from the Lower East Coast, North Island, New Zealand." New Zealand Journal of Marine and Freshwater Research 22(3): 369-378.
Horn, P. L. (2003). "Stock structure of bluenose (Hyperoglyphe antarctica) off the north-east coast of New Zealand based on the results of a detachable hook tagging programme." New Zealand Journal of Marine and Freshwater Research 37(3): 623-631.
Jones, G. K. (1985). An exploratory dropline survey for deepsea trevalla (Hyperoglyphe antarctica) in continental slope waters off South Australia. Adelaide, South Australia, Department of Fisheries: 20.
Jones, J. B. (1992). "Environmental Impact of Trawling on the Seabed - a Review." New Zealand Journal of Marine and Freshwater Research 26(1): 59-67.
Kalish, J. and J. Johnston (2002). Application of the bomb radiocarbon chronometer to the validation of blue-eye trevalla (Hyperoglyphe antarctica) age. Use of the bomb radiocarbon chronometer to validate fish age. J. Kalish (comp.). Final Report FRDC Project 93/109, the Australian National University & Fisheries Research and Development Corporation: 148-163.
Knuckey, I., S. Berrie, S. Talman and L. Brown (2002). Integrated Scientific Monitoring Program for the South East Non-Trawl Fishery. Final Report to the Australian Fisheries Management Authority. Queenscliff, Victoria, Australia, Marine and Freshwater Resources Institute: 25.
Koslow, J. A., K. Gowlett-Holmes, J. K. Lowry, T. O'Hara, G. C. B. Poore and A. Williams (2001). "Seamount benthic macrofauna off southern Tasmania: community structure and impacts of trawling." Marine Ecology-Progress Series 213: 111-125.
Larcrombe, J., K. Brooks, C. Charalambou, M. Fenton, M. Fisher, M. Kinloch and R. Summerson (2002). Marine Matters--Atlas of marine activities and coastal communities in Australia's South-East Marine Region. Canberra, Australia, Bureau of Rural Sciences.
Last, P., C. J. S. Bolch and P. Baelde (1993). "Discovery of juvenile blue eye." Australian Fisheries 52(8): 16-18.
Morgan, L. E. and R. Chuenpagdee (2003). Shifting Gears: Addressing the Collateral Impacts of Fishing Methods in U.S. Waters. Washington D.C., Pew Charitable Trust.
Paul, L. J., R. J. Sparks, H. L. Neil and P. L. Horn (2004). Maximum ages for bluenose (Hyperoglyphe antarctica) and rubyfish (Plagiogeneion rubiginosum) determined by the bomb chonometer method of radiocarbon ageing, and comments on the inferred life
27

history of these species, Final Research Report for Ministry of Fisheries Project INS2000/02, Objectives 1& 2: 69.
Probert, P. K., D. G. McKnight and S. L. Grove (1997). "Benthic invertebrate bycatch from a deep-water trawl fishery, Chatham Rise, New Zealand." Aquatic Conservation: Marine and Freshwater Ecosystems 7(1): 27 - 40.
Rowling, K. R. (1999). Biological and fishery data available from study of the New South Wales deepwater dropline fishery. Cronulla, Australia, Unpublished Report, NSW Fisheries Research Institute: 24 pp.
Smith, A. D. M. and S. E. Wayte, Eds. (2004). The South East Fishery 2003, Fishery Assessment Report compiled by the South East Fishery Assessment Group. Canberra, Australia, Australian Fisheries Management Authority.
Sullivan, K. J., P. M. Mace, N. W. M. Smith, M. H. Griffiths, P. R. Todd, M. E. Livingston, S. J. Harley, J. M. Key and A. M. Connell-(Comps.) (2005). Report from the Fishery Assessment Plenary, May 2005: stock assessments and yield estimates. Unpublished report held in NIWA library, Wellington, Ministry of Fisheries. May 2005: 792.
Talman, S. G., M. Koopman and A. S. H. Gason (2004). Integrated Scientific Monitoring Program-Gillnet, Hook and Trap Fishery Annual Report 2003. Australian Fisheries Management Authority Project No. R03/1551, Primary Industries Research Queenscliff, Victoria, Australia.
Tilzey, R. (2004). South east fishery- trawl and non-trawl sectors. Fishery Status Reports 2004: Status of Fish Stocks Managed by the Australian Government. A. Caton and K. McLoughlin. Canberra, Bureau of Rural Sciences.
Winstanley, R. H. (1978). "Food of Trevalla Hyperoglyphe-Porosa (Richardson) Off Southeastern Australia." New Zealand Journal of Marine and Freshwater Research 12(1): 77-79.
28

Appendix 1: Rankings of individual criteria Factor Ranking Intrinsic rate of increase UnknownAge at 1st maturity Green: low (<5 years), Yellow: medium (5-10 years), Red: high (>10 years)
Von Bertalanffy growth coefficient (‘k’) Green: high (>0.16), Yellow: medium (0.05-0.15), Red: low (<0.05)
Maximum age Green: low (<11 years), Yellow: medium (11-30 years), Red: high (>30 years)
Reproductive potential (fecundity) Green: high (>100 inds./yr), Yellow: moderate (10-100 inds./yr), Red: low (<10 inds./yr)
Species Range Green: Multiple ocean basins with intermixing stocks, Yellow: Limited (Single ocean basin), Red: one coastline or numerous ESUs
Special Behaviors or Requirements Green: No known behaviors or behaviors that decrease vulnerability, Yellow: 1-2 behaviors, Red: Many behaviors
Quality of Habitat: degradation from non-fishery impacts
Conservation Concern: Inherent Vulnerability
Factor RankingManagement Classification Status Green: underutilized OR close to virgin biomass, Yellow: fully fished OR recovering from overfished OR unknown, Red: recruitment or growth overfished, overexploited, depleted or “threatened”
Current population abundance relative to Bmsy Green: well above Bmsy (>100%), Yellow: close to Bmsy (50-100%), Red: substantially below Bmsy (<50%)
Occurrence of overfishing Green: overfishing not occurring (Fcurr/Fmsy < 1.0), Yellow: overfishing is likely/probable, Red: overfishing occurring
Overall degree of uncertainty in status of stock Green: low (current stock assessment), Yellow: medium (limited fishery-dependent data), Red: high (little or no current fishery-dependent or independent data)
Long-term trend in population abundance Green: trend is up, Yellow: trend is flat or variable, Red: trend is down
Short-term trend in population abundance Green: trend is up, Yellow: trend is flat or variable, Red: trend is down
Current age, size, sex distribution of the stock relative to natural conditions Green: Functionally normal, Yellow: unknown, Red: skewed
Conservation Concern: Status of Wild Stocks
Factor Ranking
29

Quantity of bycatch, including species of “special concern” Green: low (<10% of targeted landings) and does not regularly include species of special concern, Yellow: moderate (10-100% of targeted landings and does not regularly include species of special concern OR unknown, Red: high (>100% of targeted landings) OR bycatch includes species of special concern
Population consequences of bycatch Green: little or no impact on population levels, Yellow: conflicting evidence of population consequences of bycatch OR unknown, Red: severe
Trend in bycatch interaction rates as a result of management measures Green: trend in bycatch is down, Yellow: trend in bycatch is flat OR unknown, Red: trend in bycatch is up, Neutral: N/A because bycatch is low
Evidence that ecosystem has been or likely will be substantially altered in response to continued discard of bycatch species Green: No evidence of ecosystem impacts, Yellow: Conflicting evidence OR unknown, Red: Studies show evidence of impacts
Conservation Concern: Nature and Extent of Discarded Bycatch
Factor RankingKnown effect of fishing gear on physical and biogenic habitats Green: minimal damage, Yellow: moderate damage, Red: great damage
Trawl Dropline
Resilience of physical and biogenic habitats to disturbance by fishing method Green: high (benthic habitats not impacted), Yellow: moderate, Red: low
Evidence that removal of targeted species or the removal/deployment of baitfish has or will likely disrupt food web Green: studies show no evidence, Yellow: conflicting evidence OR unknown, Red: ecosystem impacts demonstrated
Evidence that fishing method has caused or is likely to cause substantial ecosystem state changes Green: studies show no evidence of ecosystem impacts, Yellow: conflicting evidence OR unknown, Red: ecosystem impacts from fishing method demonstrated
Trawl Dropline
Conservation Concern: Effect of fishing practices on habitats and ecosystems
Trawl Dropline
Factor RankingStock Status Green: stock assessment complete and robust, Yellow: stock assessment is planned or underway but is incomplete, Red: no stock assessment
Scientific Monitoring Green: regular collection and assessment of both fishery-dependent and independent data, Yellow: regular collection of fishery-dependent data, Red: no regular collection of data
Scientific Advice- management has track record of consistently setting quotas beyond those recommended by scientific advisors Green: no, Red: yes
30

Bycatch: Management implements an effective bycatch reduction plan Green: bycatch plan in place and reaching goals, Yellow: bycatch plan in place but effectiveness debated or undetermined, Red: no bycatch plan implemented or not meeting goals, N/A: bycatch is low
Fishing Practices: Management addresses the effect of the fishing methods on habitats and ecosystems Green: mitigative measures in place and deemed effective, Yellow: mitigative measures in place but effectiveness debated or undetermined, Red: no mitigative measures in place, N/A: fishing method is benign
Enforcement Green: regulations regularly enforced by independent bodies, Yellow: regulations enforced by fishing industry, Red: regulations not enforced
Management track record Green: management maintained stock productivity and limited ecosystem change, Yellow: management not been in place long enough to evaluate effectiveness, Red: measures not prevented declines
Conservation Concern: Effectiveness of Management
31