Sustainability Report Card for Franklin Pierce University: Progress towards Environmental...
62
Sustainability Sustainability Report Card for Report Card for Franklin Pierce Franklin Pierce University: University: Progress towards Progress towards Environmental Environmental Responsibility Responsibility ES340: Creating Sustainable ES340: Creating Sustainable Communities Communities Emmy Andersen, Katie Emmy Andersen, Katie Bogaard, Pat Deane, Sean Doyle, Bogaard, Pat Deane, Sean Doyle, Greta Frost, Derrick Gardner, Patti Greta Frost, Derrick Gardner, Patti Gillen, Katie Hadsell, Andrew Gillen, Katie Hadsell, Andrew LaFleur, Reid Lichwell, Tom Merkt, LaFleur, Reid Lichwell, Tom Merkt, Catherine Owen Koning Catherine Owen Koning
-
Upload
cecily-harrell -
Category
Documents
-
view
214 -
download
0
Transcript of Sustainability Report Card for Franklin Pierce University: Progress towards Environmental...
Sustainability Sustainability Report Card for Report Card for Franklin Pierce Franklin Pierce
University: University: Progress towards Progress towards
Environmental Environmental ResponsibilityResponsibilityES340: Creating Sustainable ES340: Creating Sustainable
CommunitiesCommunities Emmy Andersen, Katie Emmy Andersen, Katie Bogaard, Pat Deane, Sean Doyle, Greta Bogaard, Pat Deane, Sean Doyle, Greta
Frost, Derrick Gardner, Patti Gillen, Katie Frost, Derrick Gardner, Patti Gillen, Katie Hadsell, Andrew LaFleur, Reid Lichwell, Hadsell, Andrew LaFleur, Reid Lichwell,
Tom Merkt, Catherine Owen KoningTom Merkt, Catherine Owen Koning

What is sustainability?What is sustainability?
If our activities are sustainable, then If our activities are sustainable, then we are meeting the needs of our we are meeting the needs of our present society present society without without compromising the ability of compromising the ability of future generations to meet future generations to meet their own needs.their own needs.
Recognizing the limits of the earth’s Recognizing the limits of the earth’s resourcesresources
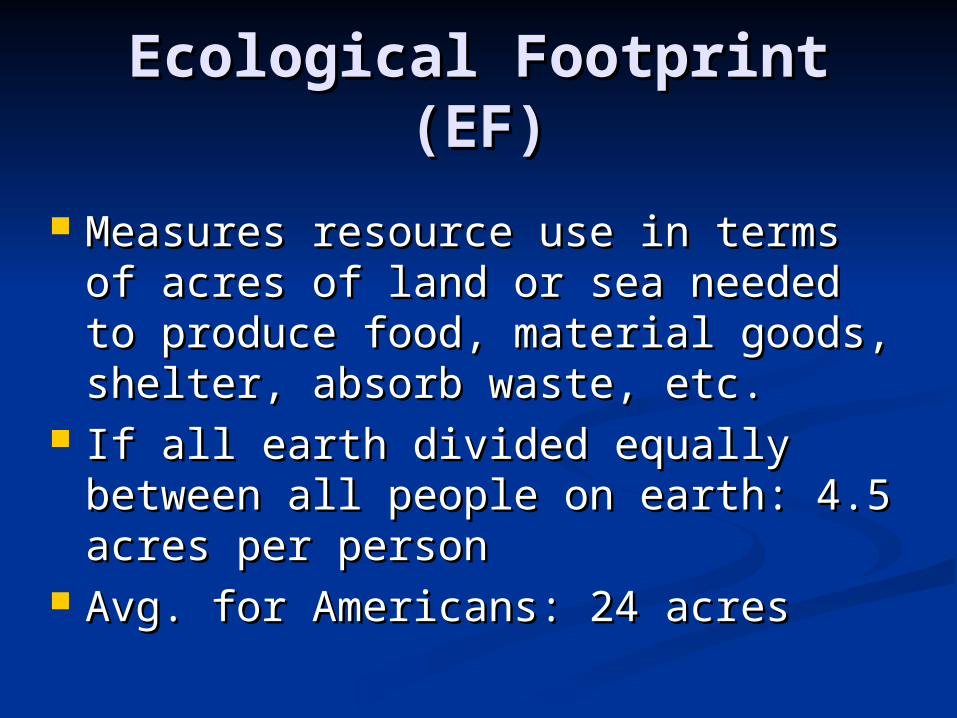
Ecological Footprint (EF)Ecological Footprint (EF)
Measures resource use in terms of Measures resource use in terms of acres of land or sea needed to acres of land or sea needed to produce food, material goods, shelter, produce food, material goods, shelter, absorb waste, etc.absorb waste, etc.
If all earth divided equally between If all earth divided equally between all people on earth: 4.5 acres per all people on earth: 4.5 acres per personperson
Avg. for Americans: 24 acresAvg. for Americans: 24 acres

http://seds.lpl.arizona.edu/nineplanets/nineplanets/gif/Earthbig.jpghttp://www.nasm.si.edu/earthtoday/realvapor.htm
With 0% of the earth set aside for other With 0% of the earth set aside for other species,species,it takesit takes
FIVE EARTHSFIVE EARTHSto support human population at average to support human population at average
American’s standard of living!!!American’s standard of living!!!

Ecological Footprint for FPC student, 2006
Waste52%
Recycled material
3%
Oil22%
Buildings0%
Lawns, parking lots, etc.
0%
Food14%
Equipment, furniture, etc.
8%
Gasoline+propane
1%
Footprint – 22.5 acres

Sustainability GoalSustainability Goal
Reduce the Ecological footprint of Reduce the Ecological footprint of the average FPC student from 22.5 the average FPC student from 22.5 acres in 2006 to 5 acres by 2026acres in 2006 to 5 acres by 2026
Difficult to achieve in the context of Difficult to achieve in the context of modern American society!modern American society!
Environmental Environmental Responsibility GoalResponsibility Goal
Based on a comparison with the Based on a comparison with the most environmentally committed most environmentally committed collegescolleges
Reduce resource use by 25% by Reduce resource use by 25% by 20262026
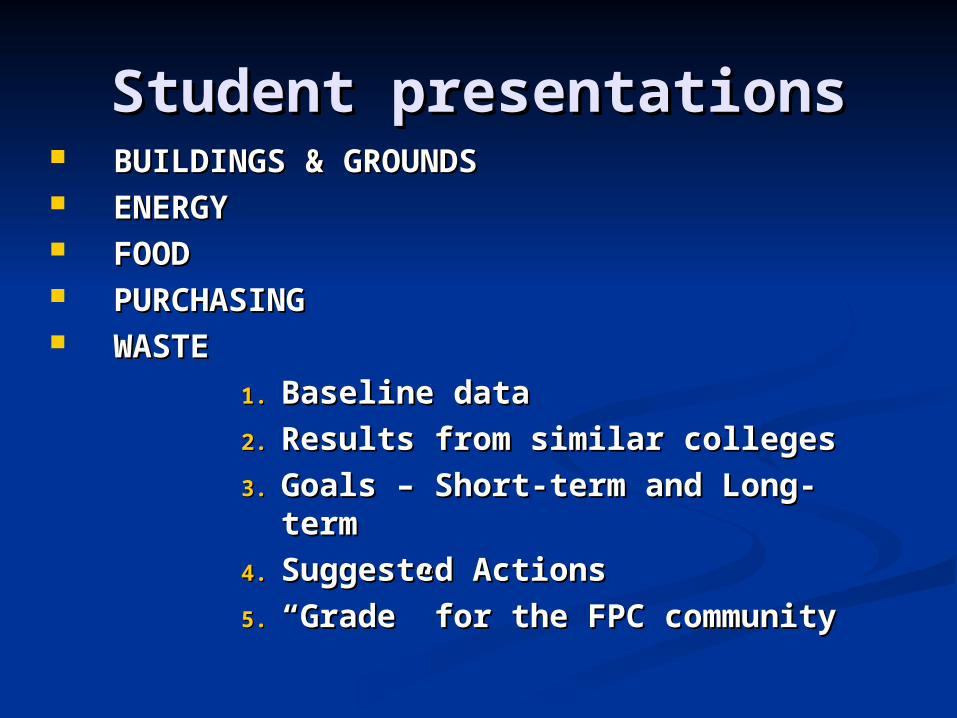
Student presentationsStudent presentations BUILDINGS & GROUNDSBUILDINGS & GROUNDS ENERGYENERGY FOODFOOD PURCHASINGPURCHASING WASTEWASTE
1.1. Baseline dataBaseline data
2.2. Results from similar collegesResults from similar colleges
3.3. Goals – Short-term and Long-Goals – Short-term and Long-termterm
4.4. Suggested ActionsSuggested Actions
5.5. ““Grade” for the FPC community Grade” for the FPC community

Grading systemGrading system
A= Best possible/excellent effortA= Best possible/excellent effort
B= Better than most/good effortB= Better than most/good effort
C= Average; what most colleges C= Average; what most colleges are doing/some effortare doing/some effort
D= Less than average/little effortD= Less than average/little effort
F= Much less than average/no F= Much less than average/no efforteffort

Buildings & Buildings & Grounds Grounds
Katie HadsellKatie Hadsell
Tom MerktTom Merkt

Water HeatingWater Heating
Baseline Data (Current Numbers)
Other Colleges
Short-term Goals (2012)
Long-term Goals (2026)
Temperature 120 ND 120 120Insulation 100% fiberglass, no Double ND 20% Double Insulate 100% Double Insulate

Avg. Response Time to Avg. Response Time to Resource-wasting ProblemsResource-wasting Problems
Baseline Data (Current Numbers)
Other Colleges
Short-term Goals (2012)
Long-term Goals (2026)
Response Time 15 - 20 min. ND Maintain Time Maintain Time

% of Metals & Furniture % of Metals & Furniture RecycledRecycled
Baseline Data (Current Numbers)
Other Colleges (Hamilton College)
Short-term Goals (2012)
Long-term Goals (2026)
% of furniture, metals etc. 50% of every load
25% of dorm and academic materials recycled 75% of every load 100% of every load
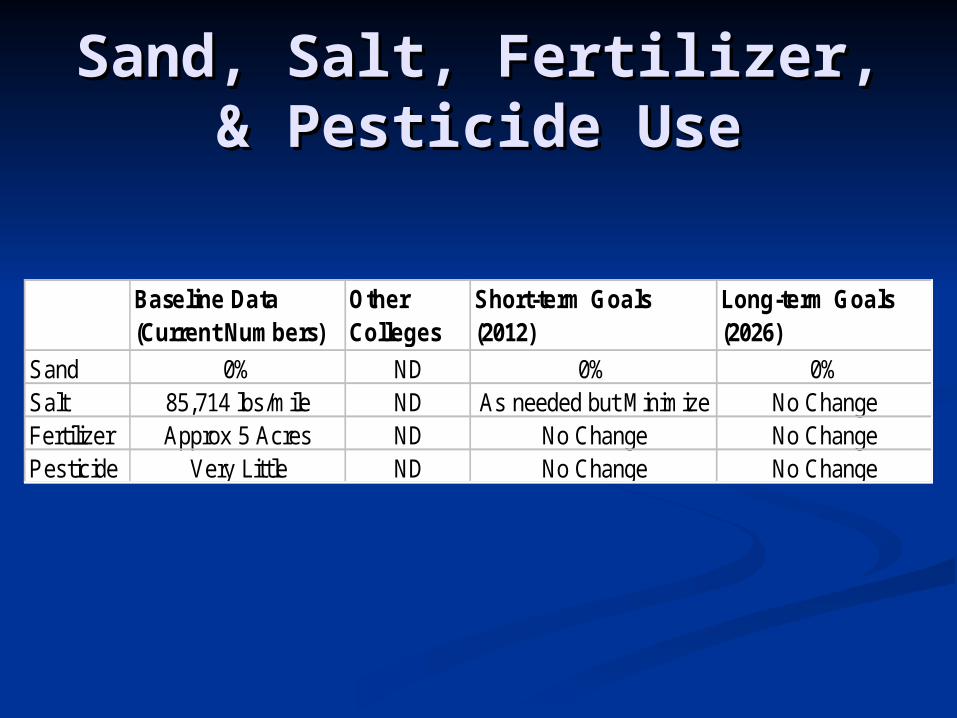
Sand, Salt, Fertilizer, & Sand, Salt, Fertilizer, & Pesticide UsePesticide Use
Baseline Data (Current Numbers)
Other Colleges
Short-term Goals (2012)
Long-term Goals (2026)
Sand 0% ND 0% 0%Salt 85,714 lbs/mile ND As needed but Minimize No ChangeFertilizer Approx 5 Acres ND No Change No ChangePesticide Very Little ND No Change No Change

Erosion & Flora SpeciesErosion & Flora Species
Baseline Data (Current Numbers)
Other Colleges
Short-term Goals (2012)
Long-term Goals (2026)
Erosion 60236 (sqft) ND 1,000 200Invasive Species (Planted) 1 Species ND 0 0Native Plant Species 92 ND 92 92

Land Use on CampusLand Use on Campus
Baseline Data (Current Numbers)
Other Colleges (Average) Short-term Goals (2012) Long-term Goals (2026)
Mowed Approx. 20 ND 20 20Restored Approx. 1 ND When Feasible When FeasibleOwned 1200 -Developed 81 ND Develop no more than 90 Maintain at 100 AcresProtected 46 35% have some land protected 250 acres 500 acres
with mean of 99 acres

Native Fauna on CampusNative Fauna on Campus
Baseline Data (Current Numbers)
Other Colleges
Short-term Goals (2012)
Long-term Goals (2026)
Mammals 32 ND 32 32Birds 105 ND 105 105Amphibians & Reptiles 21 ND 21 21

New Building DesignNew Building Design
Baseline Data (Current Numbers)
Other Colleges (Ecology Yearbook)
Short-term Goals (2012)
Long-term Goals (2026)
Building Design Energy Conservation is part of the design19 of 46 / 5 LEED 1 - 2 upgrades 1 Building LEED Cert.
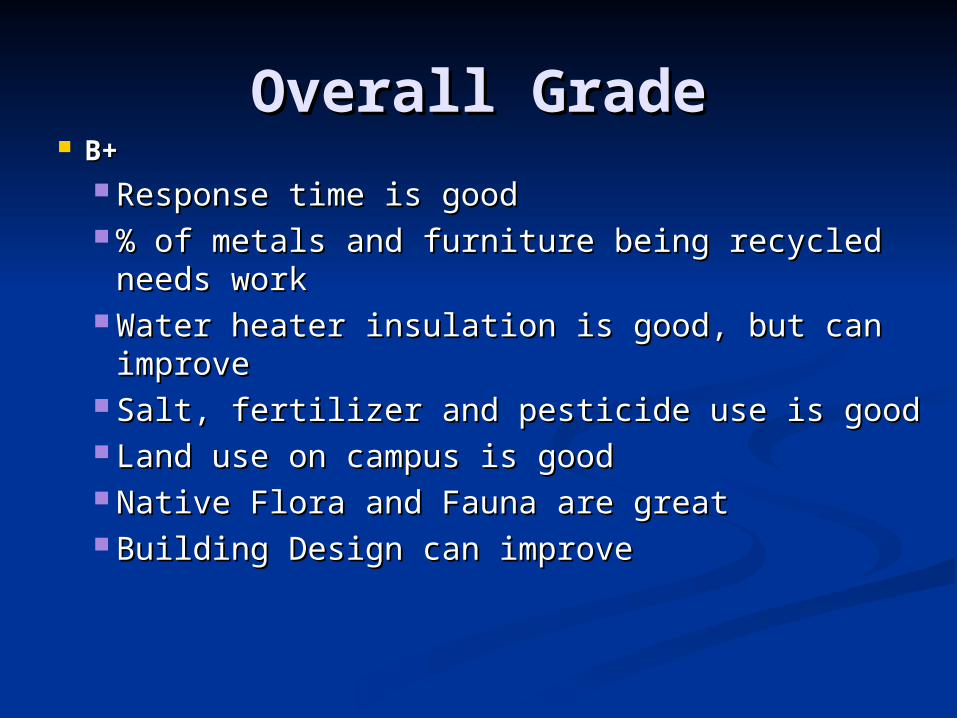
Overall GradeOverall Grade B+B+
Response time is goodResponse time is good % of metals and furniture being recycled % of metals and furniture being recycled
needs workneeds work Water heater insulation is good, but can Water heater insulation is good, but can
improveimprove Salt, fertilizer and pesticide use is goodSalt, fertilizer and pesticide use is good Land use on campus is goodLand use on campus is good Native Flora and Fauna are greatNative Flora and Fauna are great Building Design can improveBuilding Design can improve

EnergyEnergy
Sean DoyleSean Doyle
Andrew LaFleurAndrew LaFleur
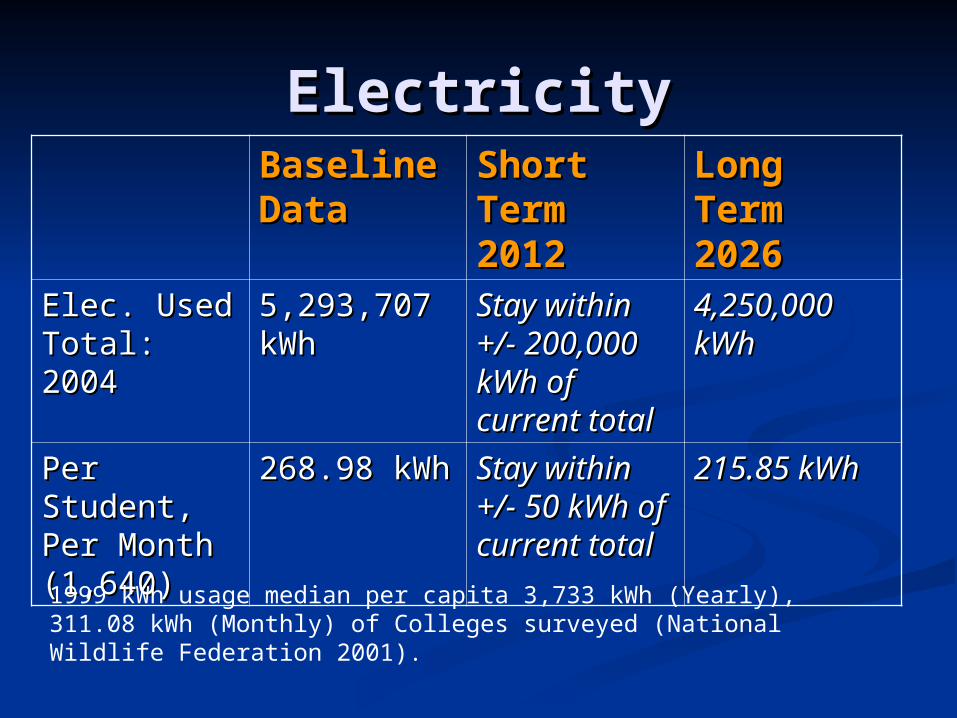
ElectricityElectricityBaseline Baseline DataData
Short Short Term Term 20122012
Long Long Term Term 20262026
Elec. Used Elec. Used Total: 2004Total: 2004
5,293,707 5,293,707 kWhkWh
Stay within Stay within +/- 200,000 +/- 200,000 kWh of kWh of current current totaltotal
4,250,000 4,250,000 kWhkWh
Per Per Student, Student, Per Month Per Month (1,640)(1,640)
268.98 kWh268.98 kWh Stay within Stay within +/- 50 kWh +/- 50 kWh of current of current totaltotal
215.85 kWh215.85 kWh
1999 kWh usage median per capita 3,733 kWh (Yearly), 311.08 kWh (Monthly) of Colleges surveyed (National Wildlife Federation 2001).

PSNH Audit PSNH Audit Recommendations Recommendations
Replace Chiller in Marcucella Replace Chiller in Marcucella (Summer 2006)(Summer 2006)
Energy Efficient light bulbs (T-5) in Energy Efficient light bulbs (T-5) in some buildings.some buildings.
Replacing conventional light bulbs Replacing conventional light bulbs with compact fluorescent with compact fluorescent
Purchasing energy efficient productsPurchasing energy efficient products Etc.Etc.

Survey InformationSurvey Information
Sample Size: 60 Students Sample Size: 60 Students
50% of students leave their lights on, 50% of students leave their lights on, while not in their room.while not in their room.
83% of students leave their computer 83% of students leave their computer on, while it is not in use.on, while it is not in use.
65% of students leave their windows 65% of students leave their windows open during the winter.open during the winter.
0% of students have compact 0% of students have compact fluorescent light bulbsfluorescent light bulbs

OilOilBaseline Baseline DataData
Short Short Term Term 20122012
Long Long Term Term 20262026
Oil Used Oil Used Total: Total: 20052005
1,122,681.1,122,681.5 Gallons5 Gallons
Stay Stay within +/- within +/- 100,000 100,000 Gallons of Gallons of current current totaltotal
975,000 975,000 GallonsGallons
Per Per Student, Student, Per Month Per Month (1,640)(1,640)
57.04 57.04 GallonsGallons
Stay Stay within +/- within +/- 10 Gallons 10 Gallons of current of current totaltotal
49.54 49.54 GallonsGallons

PropanePropaneBaselinBaseline Datae Data
Short Short Term Term 20122012
Long Long Term Term 20262026
Propane Propane Used Total: Used Total: 20052005
158,934 158,934 GallonsGallons
145,000 145,000 GallonsGallons
125,000 125,000 GallonsGallons
Per Student, Per Student, Per Month Per Month (1,640)(1,640)
8.07 8.07 GallonsGallons
7.3 7.3 GallonsGallons
6.35 6.35 GallonsGallons
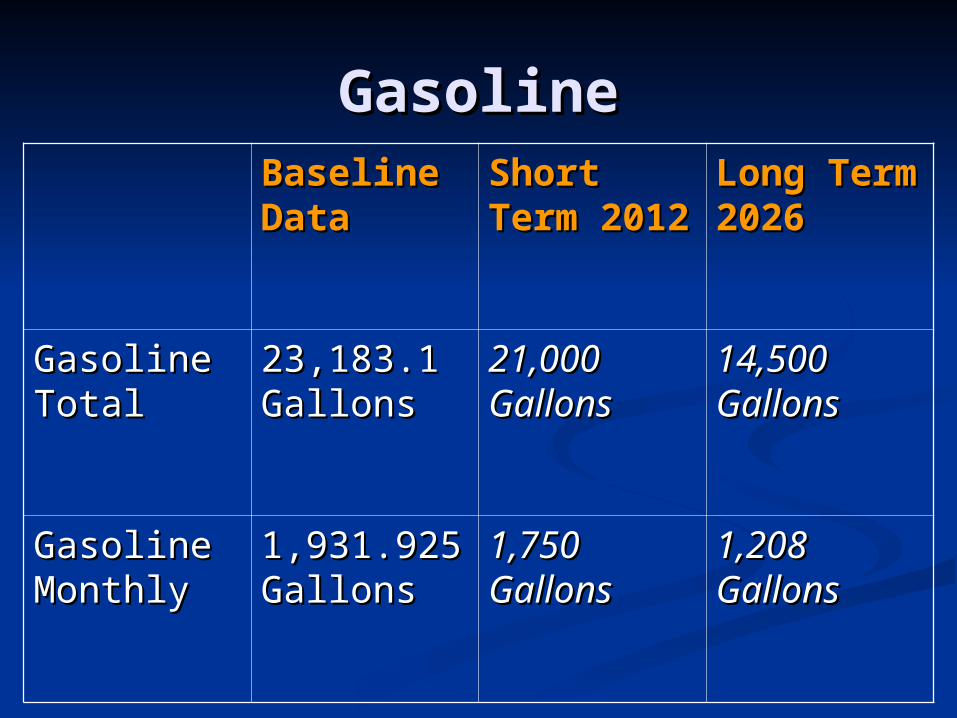
GasolineGasolineBaseline Baseline DataData
Short Short Term Term 20122012
Long Long Term Term 20262026
Gasoline Gasoline TotalTotal
23,183.1 23,183.1 GallonsGallons
21,000 21,000 GallonsGallons
14,500 14,500 GallonsGallons
Gasoline Gasoline MonthlyMonthly
1,931.925 1,931.925 GallonsGallons
1,750 1,750 GallonsGallons
1,208 1,208 GallonsGallons

Average CostsAverage Costs OilOil
$2.28 per gallon$2.28 per gallon Estimated FPC Cost of Oil per yearEstimated FPC Cost of Oil per year
$2,559,713$2,559,713 GasolineGasoline
$2.50$2.50 Estimated FPC Cost of Gasoline per yearEstimated FPC Cost of Gasoline per year
$57,957$57,957 PropanePropane
$2.23$2.23 Estimated FPC Cost of PropaneEstimated FPC Cost of Propane
$354,422$354,422

Energy Information Administration. Energy Information Administration. (2006, April 11). Short Term Energy (2006, April 11). Short Term Energy and Summer Fuel Outlook. and Summer Fuel Outlook. http://www.eia.doe.gov/emeu/steo/phttp://www.eia.doe.gov/emeu/steo/pub/contents.htmlub/contents.html

Grade For EnergyGrade For Energy B+B+ ElectricityElectricity
Our increase in electricity has been manageable Our increase in electricity has been manageable over the past 10 years. Following the over the past 10 years. Following the recommendations by PSNH the college has recommendations by PSNH the college has installed energy saving techniques and products.installed energy saving techniques and products.
Oil/Propane/GasolineOil/Propane/Gasoline Some steps have been taken to reduce the use of Some steps have been taken to reduce the use of
the these fuel sources, and more actions are the these fuel sources, and more actions are planned for the future to reduce our usage of these planned for the future to reduce our usage of these energy sources. Room for improvement exists, isn’t energy sources. Room for improvement exists, isn’t planned.planned.

Food ServicesFood Services
Reid LichwellReid Lichwell
Katrina BogaardKatrina Bogaard

Baseline DataBaseline Data Average number of meals served per Average number of meals served per
week: 8,936 for the month of Feb. 2006week: 8,936 for the month of Feb. 2006 Percent of locally grown foods (NH,VT, Percent of locally grown foods (NH,VT,
MA, ME and CT): unknown, 47.7% of MA, ME and CT): unknown, 47.7% of Sodexho purveyors are localSodexho purveyors are local
Beef Purchased per month: 146.2 lbs per Beef Purchased per month: 146.2 lbs per month or 0.004lb/student (Feb. 2006)month or 0.004lb/student (Feb. 2006)
Fish Purchased per month: 105 lbs per Fish Purchased per month: 105 lbs per month or 0.003lb/student (Feb 2006)month or 0.003lb/student (Feb 2006)

Baseline Data Continued Baseline Data Continued
Percent of organic food prepared Percent of organic food prepared per meal: 0.0%per meal: 0.0%
Amount of disposable dining Amount of disposable dining material purchased per month: material purchased per month: 1,500 plates, 5,250 cups, 2,000 lids, 1,500 plates, 5,250 cups, 2,000 lids, 1,000 forks, 500 knives (Feb 2006)1,000 forks, 500 knives (Feb 2006)
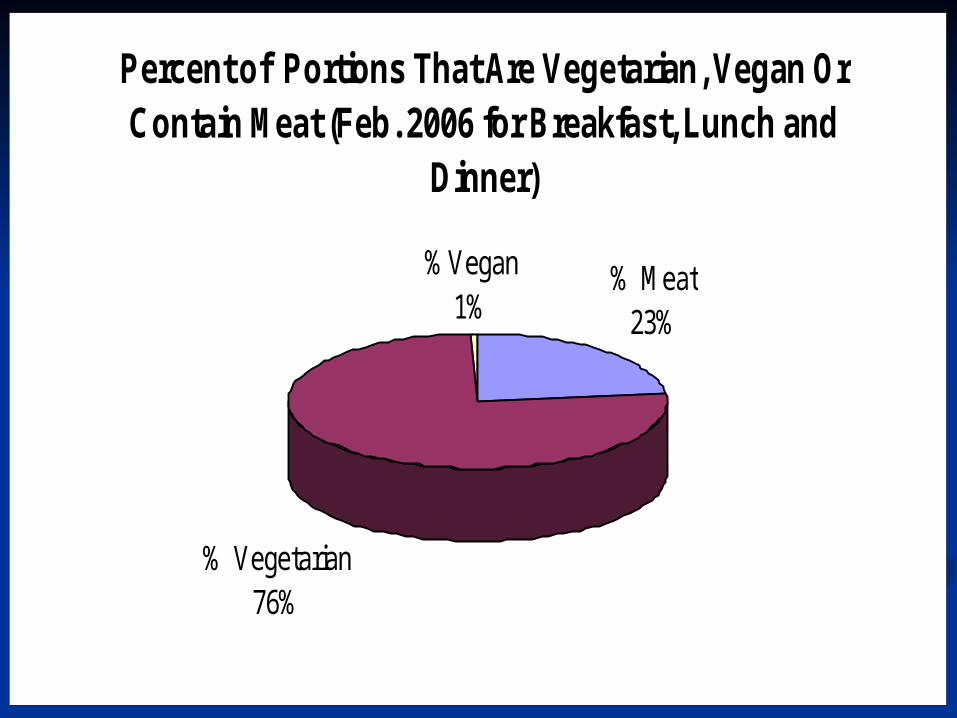
Percent of Portions That Are Vegetarian, Vegan Or Contain Meat (Feb. 2006 for Breakfast, Lunch and
Dinner)
% Meat23%
%Vegan1%
% Vegetarian76%

Percent of Brunch Portions that Are Vegetarian or Contain Meat (Feb. 2006)
% Meat, 19.83
% Vegetarian, 80.17

What Other Schools Are What Other Schools Are DoingDoing
Raising awareness about food sources and the Raising awareness about food sources and the environmental effect of obtaining those foodsenvironmental effect of obtaining those foods
Raising Food waste awarenessRaising Food waste awareness Increasing local and organic food purchasesIncreasing local and organic food purchases Establish a fish and seafood purchasing policy Establish a fish and seafood purchasing policy
using “Fish List” using “Fish List” More efficient cooking techniques like “just in More efficient cooking techniques like “just in
time” cookingtime” cooking Provide Organic snack options for purchaseProvide Organic snack options for purchase

What Other Schools Are What Other Schools Are Doing ContinuedDoing Continued
Reducing disposable dining Reducing disposable dining materials: plates, cups, forks, knivesmaterials: plates, cups, forks, knives
Donating excess food to sheltersDonating excess food to shelters Organizing organic dinnersOrganizing organic dinners Buying coffee that has been shade Buying coffee that has been shade
growngrown
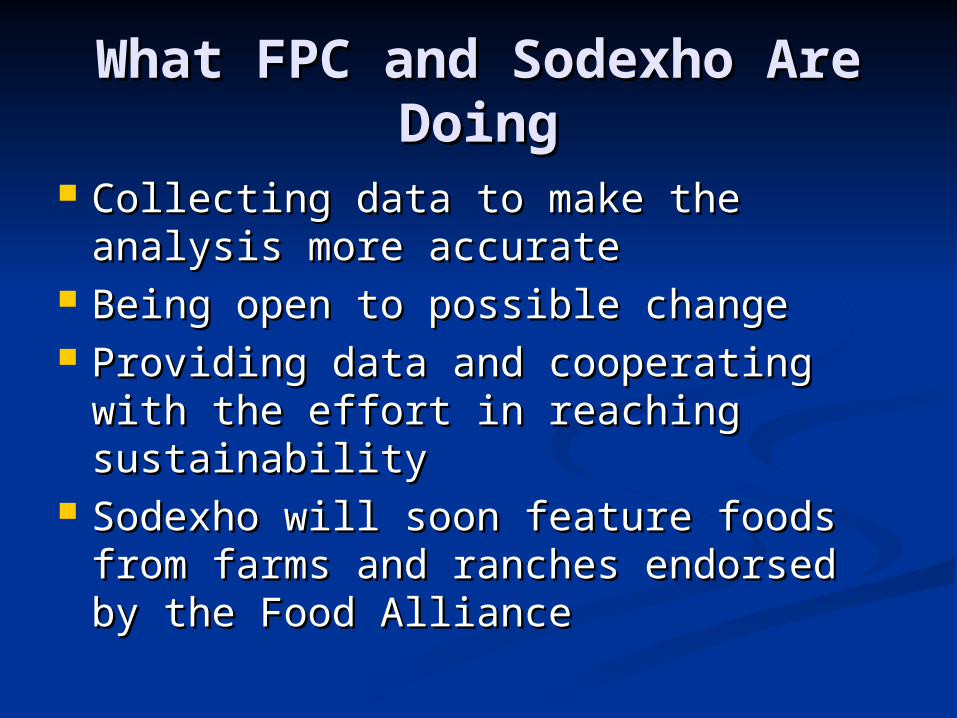
What FPC and Sodexho Are What FPC and Sodexho Are DoingDoing
Collecting data to make the analysis Collecting data to make the analysis more accurate more accurate
Being open to possible change Being open to possible change Providing data and cooperating with Providing data and cooperating with
the effort in reaching sustainabilitythe effort in reaching sustainability Sodexho will soon feature foods from Sodexho will soon feature foods from
farms and ranches endorsed by the farms and ranches endorsed by the Food AllianceFood Alliance

Franklin Pierce GoalsFranklin Pierce GoalsAreas for Areas for
improvementimprovementCurrent Current Short Short
Term Term GoalsGoals
(by (by 2012)2012)
Long Term Long Term GoalsGoals
(by 2026)(by 2026)
Number of Number of Organic Food Organic Food options (per options (per day)day)
00 66 2020
Number of Number of local growers local growers or producersor producers
unknownunknown 1515 7575
Reduced Reduced amount of fish amount of fish and meatand meat
0.004 lb 0.004 lb meat/student, meat/student, 0.003 0.003 lb/studentlb/student
(Monthly)(Monthly)
Reduce Reduce by 10% by 10% fishfish
5% 5% meatmeat
Reduce byReduce by
20% fish20% fish
10% meat10% meat

Food Sustainability Food Sustainability GradeGrade
Grade: C+Grade: C+ A little better than the average schoolA little better than the average school Good vegetarian and vegan alternatives Good vegetarian and vegan alternatives Sells plastics mugs to reduce disposable Sells plastics mugs to reduce disposable
cupscups But…But… No organic food No organic food Could work more with local food purveyors Could work more with local food purveyors There is room for improvementThere is room for improvement
PurchasingPurchasing
Derrick Gardner and Emmy AndersenDerrick Gardner and Emmy Andersen

Environmental Criteria Environmental Criteria in Contractsin Contracts
• At this time FPC has no environmental At this time FPC has no environmental criteria in any contracts.criteria in any contracts.
• Short Term Goals: Incorporate policy for Short Term Goals: Incorporate policy for purchasing recycled products.purchasing recycled products.
• Long Term Goals: Improve upon short Long Term Goals: Improve upon short term goals and mandate the use of term goals and mandate the use of “green” materials in all bidding contracts.“green” materials in all bidding contracts.

Purchased Items Purchased Items Containing “Green” or Containing “Green” or
Recycled ProductsRecycled Products 5.4% ($5,368.43) of total sales ($99,491.90) 5.4% ($5,368.43) of total sales ($99,491.90)
from central purchasing department are from central purchasing department are recycled or “green” productsrecycled or “green” products
Short Term Goals: Increase purchasing of Short Term Goals: Increase purchasing of recycled or “green” products to 20% by recycled or “green” products to 20% by 2012.2012.
Long Term Goals: Increase purchasing of Long Term Goals: Increase purchasing of recycled or “green” products to 65% by recycled or “green” products to 65% by 2026. 2026.

Purchases From Local Purchases From Local VendorsVendors
~ 80% of items purchased are from ~ 80% of items purchased are from local vendors.local vendors.
Short Term Goal: Increase this Short Term Goal: Increase this amount to 85%.amount to 85%.
Long Term Goal: Increase this Long Term Goal: Increase this amount to 95% amount to 95%

Appliances With Energy Appliances With Energy Star RatingStar Rating
At this time all washers, dryers and At this time all washers, dryers and refrigerators are energy star rated.refrigerators are energy star rated.
Short Term Goal: Upgrade copy machines Short Term Goal: Upgrade copy machines and printers to energy star rated ones.and printers to energy star rated ones.
Long Term Goal: Purchase only Long Term Goal: Purchase only electronics/appliances with maximum electronics/appliances with maximum energy efficiency energy efficiency

Committee/Student Group Committee/Student Group to Help With Purchasing of to Help With Purchasing of
Env. Friendly ProductsEnv. Friendly Products At this time no committee or student At this time no committee or student
group existsgroup exists
Short Term Goal: Establish a committee Short Term Goal: Establish a committee or student group.or student group.
Long Term Goal: Have committee or Long Term Goal: Have committee or student group play an active role in all student group play an active role in all purchasing.purchasing.
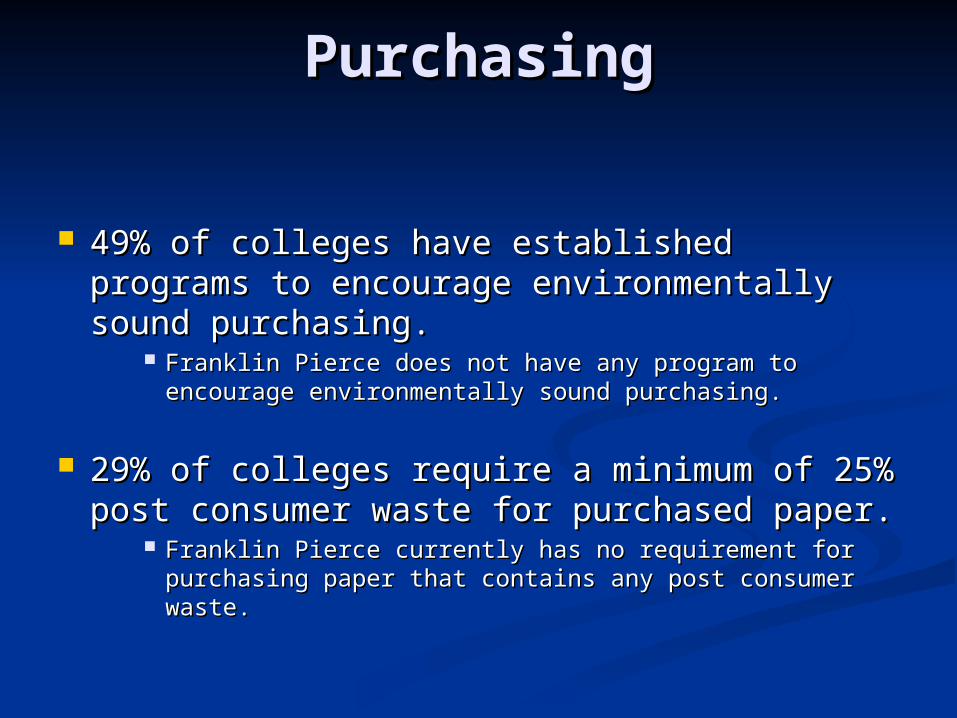
PurchasingPurchasing
49% of colleges have established programs to 49% of colleges have established programs to encourage environmentally sound purchasing.encourage environmentally sound purchasing.
Franklin Pierce does not have any program to encourage Franklin Pierce does not have any program to encourage environmentally sound purchasing.environmentally sound purchasing.
29% of colleges require a minimum of 25% 29% of colleges require a minimum of 25% post consumer waste for purchased paper.post consumer waste for purchased paper.
Franklin Pierce currently has no requirement for Franklin Pierce currently has no requirement for purchasing paper that contains any post consumer waste.purchasing paper that contains any post consumer waste.

PurchasingPurchasing
8% of colleges require chlorine-free 8% of colleges require chlorine-free paper.paper.
Franklin Pierce has no purchasing Franklin Pierce has no purchasing requirements for chlorine free paper.requirements for chlorine free paper.
At the present time, Franklin At the present time, Franklin
Pierce’s grade is D.Pierce’s grade is D.

GradeGrade No Env. Criteria in purchasing (49% of No Env. Criteria in purchasing (49% of
colleges have it)colleges have it) Low percentage of recycled products Low percentage of recycled products
purchasedpurchased Less than average amount of recycled paper Less than average amount of recycled paper
used (29% of colleges require recycled paper)used (29% of colleges require recycled paper) High percentage of local vendorsHigh percentage of local vendors Most appliances purchased are energy star Most appliances purchased are energy star
ratedrated No established group to help make No established group to help make
environmentally sound purchasingenvironmentally sound purchasing Final Grade: DFinal Grade: D

WasteWaste
Pat DeanePat Deane
Greta FrostGreta Frost
Patti GillenPatti Gillen

Monthly Solid WasteMonthly Solid Waste
FPC FPC Baseline Baseline DataData
Average Average Peer Peer InstitutiInstitutionon
Short Short Term Term GoalGoal
20122012
Long Long Term Term GoalGoal
20262026
Monthly Monthly Solid Solid WasteWaste
180,736 180,736 lbslbs
157,670 157,670 lbslbs 162,663162,663 90,36890,368
lbs/lbs/studentstudent 110110 5151
reducereduce
10%10%
9999
reducereduce
50% 50%
5555
lb/ftlb/ft22 0.280.28 NDND 0.250.25 0.140.14

Recycling MonthlyRecycling Monthly
FP FP BaselinBaseline Datae Data
Average Average Peer Peer InstitutiInstitutionon
Short Short Term Term GoalGoal
20122012
Long Long Term Term GoalGoal
20262026
RecyclinRecyclingMonthlygMonthly
10,000 10,000 lbslbs
57,321 57,321 lbslbs 20,00020,000 90,00090,000
lbs/lbs/studentstudent 66 2525
increaseincrease
100%100%
1212
increasincreasee
450%450%
5454
lb/ftlb/ft22 0.020.020.01* 0.01* only one only one institutioninstitution
0.040.04 0.180.18
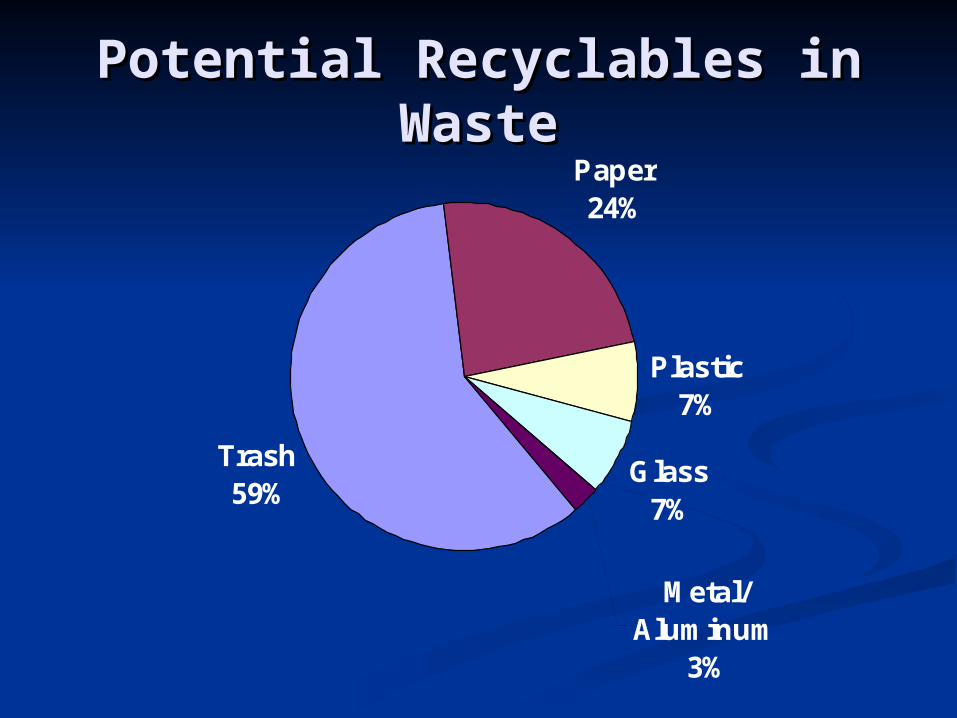
Potential Recyclables in Potential Recyclables in WasteWaste
Paper24%
Plastic7%
Glass7%
Metal/Aluminum
3%
Trash59%

FPC Waste DistributionFPC Waste Distribution

Peer Institution Waste Peer Institution Waste DistributionDistribution
Recycle30%
Compost7%
Trash/Garbage63%

Toxic Waste MonthlyToxic Waste Monthly
FPC FPC BaselinBaseline Datae Data
UVMUVM Short Short Term Term GoalGoal
20122012
Long Long Term GoalTerm Goal
20262026
Toxic Toxic Waste Waste MonthlyMonthly
124 lbs124 lbs 6666 lbs6666 lbs 118118 112112
lbs/lbs/studentstudent
0.076 0.076 lbslbs
0.76 lbs0.76 lbs decreasedecrease
5%5%
0.072 lbs0.072 lbs
decreasedecrease
10%10%
0.068 lbs0.068 lbs
violationviolationss
nonenone NDND nonenone nonenone

Water UseWater UseFPCFPC US US
average average per per capitacapita
Short Short Term Term GoalGoal
20122012
Long Long Term Term GoalGoal
20262026
Water Water Use Use MonthMonthlyly
GallonGallonss
4,334,404,334,4000
NDND 4,117,684,117,6800
3,900,963,900,9600
GallonGallons/s/
studenstudentt
26432643 14961496 decreasedecrease
5%5%
25112511
decreasedecrease
10%10%
23792379

GradeGrade Monthly Solid Waste/Student is double the Monthly Solid Waste/Student is double the
average peer institutionaverage peer institution More campus-wide effort needs to be put More campus-wide effort needs to be put
into recycling to reduce solid wasteinto recycling to reduce solid waste Composting would help to reduce solid Composting would help to reduce solid
wastewaste Water use can be reduced; considerably Water use can be reduced; considerably
higher than US averagehigher than US average
C-C-

THANK YOU!THANK YOU!
Kim Knox, Sodexho Food Kim Knox, Sodexho Food ServicesServices
Doug Lear, FacilitiesDoug Lear, Facilities Robert St. Jean, PurchasingRobert St. Jean, Purchasing Barbara Peloquin, Barbara Peloquin,
Environmental ServicesEnvironmental Services John Weir, MaintenanceJohn Weir, Maintenance

Report CardReport Card
Buildings/Grounds: B+Buildings/Grounds: B+
Energy: B+Energy: B+
Food: C+Food: C+
Purchasing: DPurchasing: D
Waste: C-Waste: C-

References (partial list)References (partial list) National Wildlife Federation. 2001 “State National Wildlife Federation. 2001 “State
of the Campus Environment.” National of the Campus Environment.” National Wildlife Federation. Reston, VA.Wildlife Federation. Reston, VA.
Franklin Pierce. 2004-2006 “Propane Franklin Pierce. 2004-2006 “Propane Billing Statement.” Rindge, NH.Billing Statement.” Rindge, NH.
Franklin Pierce. 1993-2005 “Electricity Franklin Pierce. 1993-2005 “Electricity Usage.” Rindge, NH.Usage.” Rindge, NH.
Franklin Pierce. 2005-2006 “Lorden Oil Franklin Pierce. 2005-2006 “Lorden Oil Company Billing Statement.” Rindge, NH.Company Billing Statement.” Rindge, NH.
Franklin Pierce. 2005-2006 “ Gasoline Franklin Pierce. 2005-2006 “ Gasoline Usage By Department.” Rindge, NH.Usage By Department.” Rindge, NH.

ReferencesReferences
American Water Works Association American Water Works Association http://www.awwa.org/Advocacy/pressroom/statswp5.cfm
EPA EPA http://www.epa.gov/sectors/colleges
Warren Wilson http://www.warren-Warren Wilson http://www.warren-wilson.edu/~recycle/wilson.edu/~recycle/
Bates Bates

Energy Information Administration. Energy Information Administration. (2006, April 11). Short Term Energy (2006, April 11). Short Term Energy and Summer Fuel Outlook. and Summer Fuel Outlook. http://www.eia.doe.gov/emeu/steo/phttp://www.eia.doe.gov/emeu/steo/pub/contents.htmlub/contents.html