Sustainability of Valorizing MSW - Energy
32
Advancing the Bioeconomy: From Waste to Conversion-Ready Feedstocks Sustainable Futures Institute Sustainability of Valorizing MSW David R. Shonnard, Ph.D. Professor and Robbins Chair Department of Chemical Engineering Sustainable Futures Institute Michigan Technological University Houghton, MI USA 1 February 19, 2020
Transcript of Sustainability of Valorizing MSW - Energy

Advancing the Bioeconomy: From Waste to Conversion-Ready Feedstocks
Sustainable Futures
Institute
Sustainability of Valorizing MSW
David R. Shonnard, Ph.D.
Professor and Robbins Chair
Department of Chemical Engineering
Sustainable Futures Institute
Michigan Technological University
Houghton, MI USA
1
February 19, 2020

Introduction
• Recycling Alternatives for Municipal Plastic Waste
2
Singh N. et al. (2017) Composites part B, 115: 409-422
Solvent Purification
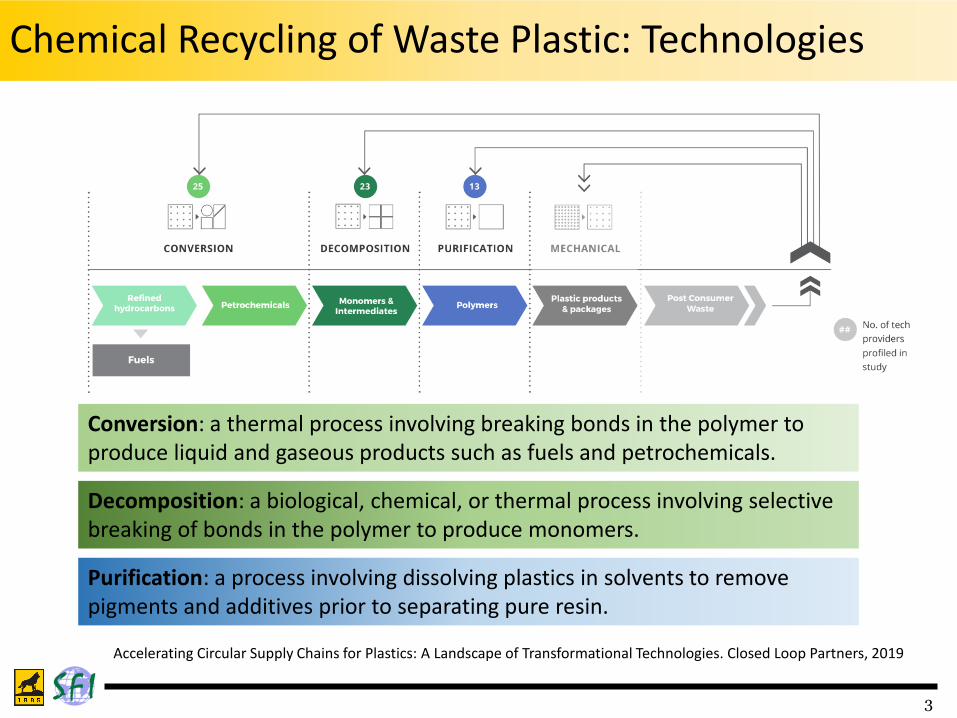
Chemical Recycling of Waste Plastic: Technologies
3
Conversion: a thermal process involving breaking bonds in the polymer to produce liquid and gaseous products such as fuels and petrochemicals.
Decomposition: a biological, chemical, or thermal process involving selective breaking of bonds in the polymer to produce monomers.
Purification: a process involving dissolving plastics in solvents to remove pigments and additives prior to separating pure resin.
Accelerating Circular Supply Chains for Plastics: A Landscape of Transformational Technologies. Closed Loop Partners, 2019

LCA Results for Mechanical Recycling: PET, HDPE, PP
4
LIFE CYCLE IMPACTS FOR POSTCONSUMER RECYCLED RESINS; PET, HDPE, PP, FRANKLIN AND ASSOCIATES DIVISION OF ERG, DEC 2018
!!

LCA Results for Mechanical Recycling: PET, HDPE, PP
5
LIFE CYCLE IMPACTS FOR POSTCONSUMER RECYCLED RESINS; PET, HDPE, PP, FRANKLIN AND ASSOCIATES DIVISION OF ERG, DEC 2018
!!

LCA Results for Mechanical Recycling: PET, HDPE, PP
6
LIFE CYCLE IMPACTS FOR POSTCONSUMER RECYCLED RESINS; PET, HDPE, PP, FRANKLIN AND ASSOCIATES DIVISION OF ERG, DEC 2018
!!

LCA Results for Chemical Recycling: HDPE
7
Benavides et al., 2017, Life-cycle analysis of fuels from post-use non-recycled plastics, Fuel 203, 11–22

Case Study: Sustainability Assessment - Thermal Conversion of Waste HDPE
Research Objectives
• Design and simulation a multi-product refinery process for conversion of waste High Density Polyethylene using pyrolysis.
• Evaluate the energy requirements of the refinery (Energy returned over energy invested).
• Evaluate the environmental performance of the refinery products (kg CO2 eq./kg of product).
• Evaluate the economic feasibility of the project (Net present value).
8

Materials and Methods
9
Pyrolysis experiments performed at 650 °C and 2.8 s of residence time, in a two-stage micropyrolysis reactor (Gracida-Alvarez et al., 2018).
Modeled with aid of the software Aspen Plus v.8.8. Operating conditions obtained from literature from similar petrochemical processes.
Calculation of the Energy Returned over Energy Invested (EROI) indicator.
Use of Life Cycle Assessment (LCA) with aid of the software Simapro v.8.5.0. Inventory of inputs obtained from the process simulation.
Calculation of the Net Present Value (NPV) considering five products. Costs and prices obtained from Aspen Plus and literature.
Laboratory experiments
Conceptual design
Energetic evaluation
Environmental evaluation
Economic evaluation
1
2
3
4
5
Gracida-Alvarez U. et al. (2018) Industrial & Engineering Chemistry Research, 57: 1912-1923

Results – Micro-pyrolysis experiments
• Composition of the two-stage micro-pyrolysis reactor outlet
(650 °C & 2.8s vapor residence time)
10
Chemical class Mass percentage
Hydrocarbon gases (C1-C4) 68.63
Gasoline range hydrocarbons (C5-C10) 20.68
Diesel range hydrocarbons (C11-C15) 3.14
Light waxes (C16-C20) 1.34
Heavy waxes (C21-C29) 0.75
Aromatics 5.46
A total of 86 compounds were used in the simulation
Process Temperature range: -140 °C to 1200 °CProcess Pressure range: 0.5 to 25 barProcessing Capacity: 500 tonnes/day (20.83 tonnes/hr)
Vapor Residence Time (s)

Results – Conceptual design
• Process Flow Diagram (PFD)
11
A-100: Pyrolysis
A-200: Monomer Separation
A-300: Aromatics Separation
A-400: Hydrotreatment

TEA Results
12
Total Installed Costs (MM USD)Variable Operating Costs
(MM USD/yr)
Gracida-Alvarez, U.R., et al., ACS Sustainable Chemistry and Engineering, DOI: 10.1021/acssuschemeng.9b04763

Results – Environmental evaluation
• Functional unit: 1 kg of product
• Scope: Cradle to gate
• Allocation: Mass allocation
• US grid electricity
• Heat from Flue gas is utilized internally
• Electricity generated in turbines is utilized internally
13
CollectionWaste HDPE
HDPE separation
(MRF)
Shredding and
Gridding
Diesel
Electricity
Natural gas
Fast Pyrolysis
Helium
Sand
Natural gas
Monomer
Separation
Aromatics
Extraction
Hydrotreatment
Electricity
Diesel
Hydrocarbon
Mixture
Electricity Water Natural gas
Ethylene
Propylene
Aromatics mixture
Water
Sulfolane
Low MW HC mixture
Natural gas
Hydrogen
High MW HC mixture
• General inventoryBasis: Processing of 20.83 tonnes of HDPE (Plant capacity for 1 hr of operation)
MRF: Materials Recovery Facility
Note: Recycled inputs (Helium, sand, andrefrigerants) were not considered in theinventory.
Fitzgerald G. et al. (2012) Resources, Conservation, and Recycling, 69: 50-56

LCA Results – Carbon Footprint of Products
14
GHG Savings
HI-2 vs Fossil (F): Ethylene: 32.5%Propylene: 11.6%Aromatics: 29.3%Low MWHCs: -11.1%High MWHCs: -27.5%
Gracida-Alvarez, U.R., et al., ACS Sustainable Chemistry and Engineering, DOI: 10.1021/acssuschemeng.9b04764
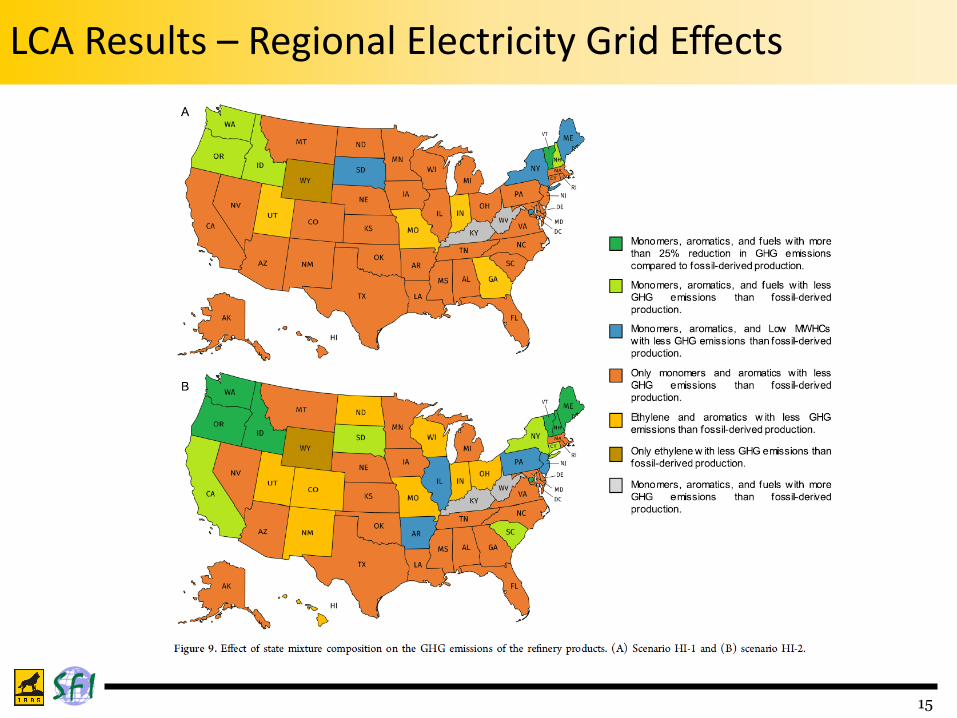
LCA Results – Regional Electricity Grid Effects
15

Systems Analysis Framework
16
Model-based approach
• Materials flow analyses
• Process simulation
• TEA models
• LCA
• Social LCA
• Sustainability Indicators
• Policy-driven analyses
Shonnard, et al., 2019, Systems analysis for PET and olefin polymers in a circular economy, Procedia CIRP, 80, 602-606, 26th CIRP Life Cycle Engineering (LCE) Conference.
Sustainability Assessments of Plastics in a Global Circular Economy
REMADE Project 18-01-SA-04
Production and Use
Collected and Processed for
Recycle/Reman.
Closed-LoopRecycling
Energy Recovery
Circular Dominant Economy
LandfilledVirginFeedstock
Wastes

Research issues and questions
• Will a plastics circular economy improve performance compared to the current plastics linear economy environmental, economic, and societal impacts?
• How would the prevalence of chemical versus mechanical recycling versus incineration for energy affect system performance?
• If renewable (i.e. plant-derived) feedstocks increase vs fossil, what affect would this have on system performance?
• What could be the impacts of biodegradable plastics on system performance? Including ocean debris effects
• External effects beyond the plastics pathways Indirect economic multipliers
Impacts to the petroleum, gas, and petrochemical industries
17

Acknowledgements
• Mexican Council of Science and Technology (CONACYT, Award No. 383220).
• Graduate School of Michigan Technological University.
• Richard and Bonnie Robbins Endowment.
• REMADE Institute (Manufacturing USA Institute Advanced Manufacturing Office Award Number DE-EE0007897)
18

Acknowledgements and Disclaimers
19
Acknowledgment: “This material is based upon work supported by the U.S. Department of Energy’s Office of Energy Efficiency and Renewable Energy (EERE) under the Advanced Manufacturing Office Award Number DE-EE0007897.”
Disclaimer: “This report was prepared as an account of work sponsored by an agency of the United States Government. Neither the United States Government nor any agency thereof, nor any of their employees, makes any warranty, express or implied, or assumes any legal liability or responsibility for the accuracy, completeness, or usefulness of any information, apparatus, product, or process disclosed, or represents that its use would not infringe privately owned rights. Reference herein to any specific commercial product, process, or service by trade name, trademark, manufacturer, or otherwise does not necessarily constitute or imply its endorsement, recommendation, or favoring by the United States Government or any agency thereof. The views and opinions of authors expressed herein do not necessarily state or reflect those of the United States Government or any agency thereof.”

Advancing the Bioeconomy: From Waste to Conversion-Ready Feedstocks
Sustainable Futures
Institute
Thank you for your attention!
Contact Information:
David R. Shonnard: [email protected]

Extra Slides
21

• Global Situation of Plastics
22
Plastics Challenge
PRODUCTION: 322 million tonnes /year (2015)
WASTE GENERATION: 300 million tonnes /year (2015)
RECYCLING RATE: 9 % (2015)
Plastics Europe (2018) Plastics – the Facts 2017
Geyer R. et al. (2017) Science Advances, 3:
e1700782

Cumulative Plastic Production/Use Data
Production/Use
• 4% of petroleum (feedstocks)
• 4% of petroleum (process energy)
• Additional inputs in Natural Gas
• Non-fiber plastics (88%)
• Packaging (39%) is largest consumption sector (PE, PP, PET) with the shortest in-use lifetime (<1 yr)
End of Life
• Landfilling (79%)
• Incineration (12%)
• Recycled (9%)
23
RRS, Ann Arbor, MI, 2017

• Cumulative plastic waste generation and disposal
24
Projections to 2050
Plastics Europe (2018) Plastics – the Facts 2017Geyer R. et al. (2017) Science Advances, 3: e1700782
World Economic Forum et al. (2016) The New Plastics Economy. Rethinking the future of plastics.
2015: 4.9Billion tonnes
2050: 12Billion tonnes
• Health risk to aquatic and terrestrial life.• Displacing primary plastic production.• Use of emerging technologies.
2014 2025

Linear vs Circular Economy for Plastics
25
VirginFeedstock
Production and Use
Collected for Recycle
Closed-LoopRecycling
Recycle ProcessLosses
Open-LoopRecycling
Incineration /Energy Recovery
Wastes Landfilled
Leakage(Litter)
Linear Dominant Economy
Production and Use
Collected and Processed for
Recycle/Reman.
Closed-LoopRecycling
Energy Recovery
Circular Dominant Economy
LandfilledVirginFeedstock
Wastes
• Reduce the use of virgin materials.• Eliminate mismanagement and leakage.• Build up recycling infrastructure.
• 80% of plastics is landfilled or lost to the environment.• Economic losses between 80 to 120 billion USD/year.• Consumption of virgin fossil resources.
World Economic Forum et al. (2016) The New Plastics Economy. Rethinking the future of plastics.Arena U. et al. (2011) Waste Management, 31, 1494-1504.European Commission (2016) A European Strategy for Plastics in a Circular Economy.
Shonnard, D.R., Tipaldo, E., Thompson, V., Pearce, J., Caneba, G., Handler, R.M., 2019, Systems analysis for PET and olefin
polymers in a circular economy, Procedia CIRP, 26th CIRP Life Cycle Engineering (LCE) Conference.
8 million tons / yearmarine debris

Linear Economy: Production Inputs
26
VirginFeedstock
Production and Use
Collected for Recycle
Closed-LoopRecycling
Recycle ProcessLosses
Open-LoopRecycling
Incineration /Energy Recovery
Wastes Landfilled
Leakage(Litter)
Linear Dominant Economy
Extraction of Petroleum and Natural Gas
e
Refinery,Petrochemicals Operations
Plastics Fabrication
Consumer Use
Waste Collection
LandfillOperations
Resin Plastics MSWTrash

Circular economy: production inputs
27
Production and Use
Collected and Processed for
Recycle/Reman.
Closed-LoopRecycling
Energy Recovery
Circular Dominant Economy
LandfilledVirginFeedstock
Wastes
e
Plastics Fabrication
Consumer Use
Waste Collection
Plastics Fabrication
MaterialsRecoveryFacility
MechanicalRecycling
ChemicalRecycling

Conceptual Design –Mass and Energy Balances
28
Streams ProductAmount
(tonnes/hr)
INLET
Waste HDPE 20.83
Helium 0.001
Sulfolane 0.006
Water 0.004
Hydrogen 0.33
TOTAL 21.17
OUTLET
Flue gas purge 1.32
Ethylene 3.91
Propylene 2.80
Aromatic mixture 0.77
Low MW HC (C4-C12) 11.25
High MW HC (C12-C29) 1.12
TOTAL 21.17
Refinery Mass Balances
Streams Energy SourceAmount (GJ/hr)
INLET
Process Energy 223.03
Materials Energy 931.31
TOTAL 1154.35
OUTLET
Process Energy 180.78
Products Energy 966.43
TOTAL 1147.20
Refinery Energy Balances

Conceptual Design - Results
29
Primary Energy Requirements
0
40
80
120
160
200
240
BC HI BC HI BC HI BC HI
A-100 A-200 A-300 A-400
Pri
ma
ry e
ne
rgy r
eq
uir
em
en
ts(G
J /
h)
Refinery section
Electricity
Natural gas
Product Recovery (%) Purity (%)
Ethylene 89.51 97.22
Propylene 99.70 97.85
Aromatics mixture
57.15 84.27
Low MWHCs 56.10 97.74
High MWHCs 76.43 83.33
Refinery Products Specifications
Base Case (BC): 2.2Heat Integrated (HI): 3.0Petroleum Refining: 9
Energy Returned over Invested (EROI)
Primary Energy Savings
HI vs BC: 35% reduction

TEA Methods
Parameters for Discounted Cash Flow Analysis
30
Parameter Value
Internal rate of return (%) 10
Project economic life (years) 20
Depreciation method 7-year MACRS
Tax rate (%) 21
Working capital (WC) 15% FCI
Base year 2017
Operating days per year 350
Investment year 1 30% FCI
Investment year 2 50% FCI
Investment year 3 20% FCI + WC + FOC + 50%
VOC
Investment year 4 FOC + 90% VOC
Investment year 5 FOC + VOC
Prices for Discounted Cash Flow Analysis
Product Price
Waste HDPE (USD/tonne) 22.0
Electricity (USD/kWh) 0.069
Natural gas (USD/GJ) 3.95
Cooling water (USD/m3) 0.053
Hydrogen (USD/kg) 2.83
Helium (USD/kg) 42.81
Ethylene (USD/kg) 0.61
Propylene (USD/kg) 0.97
Aromatics mixture (USD/kg) 1.02
Low MWHC mixture (USD/kg) 0.86
High MWHC mixture
(USD/kg)
0.84
LP steam (USD/kg) 0.021
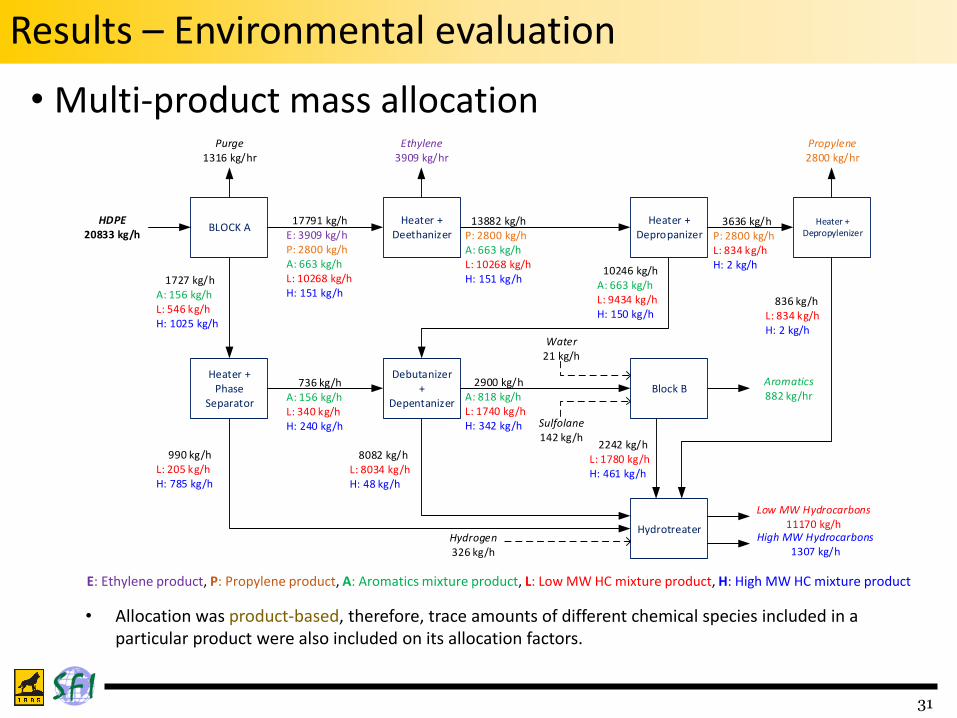
Results – Environmental evaluation
• Multi-product mass allocation
31
BLOCK AHeater +
DeethanizerHeater +
DepropanizerHDPE
20833 kg/h
Purge1316 kg/hr
Ethylene3909 kg/hr
17791 kg/hE: 3909 kg/hP: 2800 kg/hA: 663 kg/hL: 10268 kg/hH: 151 kg/h
Heater + Phase
Separator
1727 kg/hA: 156 kg/hL: 546 kg/hH: 1025 kg/h
Heater + Depropylenizer
Propylene2800 kg/hr
Hydrotreater
Aromatics882 kg/hr
Block BDebutanizer
+ Depentanizer
Sulfolane142 kg/h
Water21 kg/h
Hydrogen 326 kg/h
Low MW Hydrocarbons11170 kg/h
High MW Hydrocarbons1307 kg/h
13882 kg/hP: 2800 kg/hA: 663 kg/hL: 10268 kg/hH: 151 kg/h
736 kg/hA: 156 kg/hL: 340 kg/hH: 240 kg/h
10246 kg/hA: 663 kg/hL: 9434 kg/hH: 150 kg/h
990 kg/hL: 205 kg/hH: 785 kg/h
8082 kg/hL: 8034 kg/hH: 48 kg/h
2900 kg/hA: 818 kg/hL: 1740 kg/hH: 342 kg/h
836 kg/hL: 834 kg/hH: 2 kg/h
3636 kg/hP: 2800 kg/hL: 834 kg/hH: 2 kg/h
2242 kg/hL: 1780 kg/hH: 461 kg/h
• Allocation was product-based, therefore, trace amounts of different chemical species included in a particular product were also included on its allocation factors.
E: Ethylene product, P: Propylene product, A: Aromatics mixture product, L: Low MW HC mixture product, H: High MW HC mixture product

Results – Environmental evaluation
32
• Carbon Footprint: Process Sections
GHG Savings
HI-2 vs BC: 18% reduction