
SURVEY & RANKING 2019...53 Sontag Advisory New York, N.Y. 4,994.19 –5.24% $3.83 –12.72% 8.57% 54...
14
July 2019 • www.fa-mag.com SURVEY & RANKING 2019 SPONSORED BY
Transcript of SURVEY & RANKING 2019...53 Sontag Advisory New York, N.Y. 4,994.19 –5.24% $3.83 –12.72% 8.57% 54...

July 2019 • www.fa-mag.com
SURVEY & RANKING 2019
SPONSORED BY
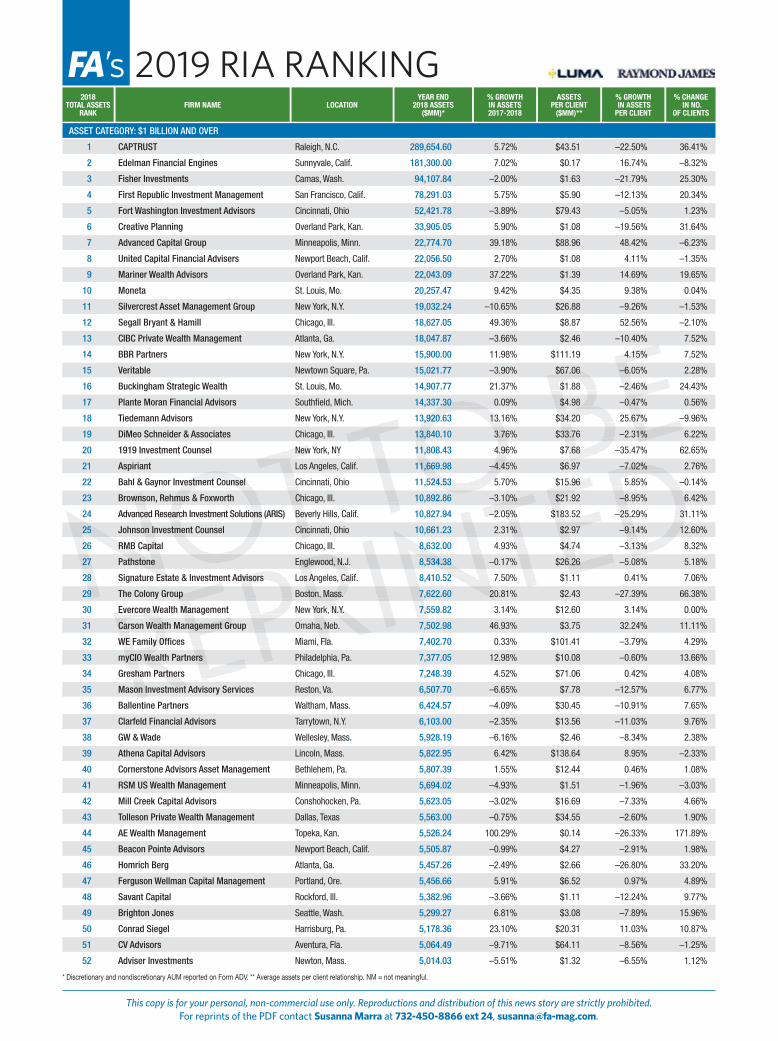
ASSET CATEGORY: $1 BILLION AND OVER
1 CAPTRUST Raleigh, N.C. 289,654.60 5.72% $43.51 –22.50% 36.41%
2 Edelman Financial Engines Sunnyvale, Calif. 181,300.00 7.02% $0.17 16.74% –8.32%
3 Fisher Investments Camas, Wash. 94,107.84 –2.00% $1.63 –21.79% 25.30%
4 First Republic Investment Management San Francisco, Calif. 78,291.03 5.75% $5.90 –12.13% 20.34%
5 Fort Washington Investment Advisors Cincinnati, Ohio 52,421.78 –3.89% $79.43 –5.05% 1.23%
6 Creative Planning Overland Park, Kan. 33,905.05 5.90% $1.08 –19.56% 31.64%
7 Advanced Capital Group Minneapolis, Minn. 22,774.70 39.18% $88.96 48.42% –6.23%
8 United Capital Financial Advisers Newport Beach, Calif. 22,056.50 2.70% $1.08 4.11% –1.35%
9 Mariner Wealth Advisors Overland Park, Kan. 22,043.09 37.22% $1.39 14.69% 19.65%
10 Moneta St. Louis, Mo. 20,257.47 9.42% $4.35 9.38% 0.04%
11 Silvercrest Asset Management Group New York, N.Y. 19,032.24 –10.65% $26.88 –9.26% –1.53%
12 Segall Bryant & Hamill Chicago, Ill. 18,627.05 49.36% $8.87 52.56% –2.10%
13 CIBC Private Wealth Management Atlanta, Ga. 18,047.87 –3.66% $2.46 –10.40% 7.52%
14 BBR Partners New York, N.Y. 15,900.00 11.98% $111.19 4.15% 7.52%
15 Veritable Newtown Square, Pa. 15,021.77 –3.90% $67.06 –6.05% 2.28%
16 Buckingham Strategic Wealth St. Louis, Mo. 14,907.77 21.37% $1.88 –2.46% 24.43%
17 Plante Moran Financial Advisors Southfi eld, Mich. 14,337.30 0.09% $4.98 –0.47% 0.56%
18 Tiedemann Advisors New York, N.Y. 13,920.63 13.16% $34.20 25.67% –9.96%
19 DiMeo Schneider & Associates Chicago, Ill. 13,840.10 3.76% $33.76 –2.31% 6.22%
20 1919 Investment Counsel New York, NY 11,808.43 4.96% $7.68 –35.47% 62.65%
21 Aspiriant Los Angeles, Calif. 11,669.98 –4.45% $6.97 –7.02% 2.76%
22 Bahl & Gaynor Investment Counsel Cincinnati, Ohio 11,524.53 5.70% $15.96 5.85% –0.14%
23 Brownson, Rehmus & Foxworth Chicago, Ill. 10,892.86 –3.10% $21.92 –8.95% 6.42%
24 Advanced Research Investment Solutions (ARIS) Beverly Hills, Calif. 10,827.94 –2.05% $183.52 –25.29% 31.11%
25 Johnson Investment Counsel Cincinnati, Ohio 10,661.23 2.31% $2.97 –9.14% 12.60%
26 RMB Capital Chicago, Ill. 8,632.00 4.93% $4.74 –3.13% 8.32%
27 Pathstone Englewood, N.J. 8,534.38 –0.17% $26.26 –5.08% 5.18%
28 Signature Estate & Investment Advisors Los Angeles, Calif. 8,410.52 7.50% $1.11 0.41% 7.06%
29 The Colony Group Boston, Mass. 7,622.60 20.81% $2.43 –27.39% 66.38%
30 Evercore Wealth Management New York, N.Y. 7,559.82 3.14% $12.60 3.14% 0.00%
31 Carson Wealth Management Group Omaha, Neb. 7,502.98 46.93% $3.75 32.24% 11.11%
32 WE Family Offi ces Miami, Fla. 7,402.70 0.33% $101.41 –3.79% 4.29%
33 myCIO Wealth Partners Philadelphia, Pa. 7,377.05 12.98% $10.08 –0.60% 13.66%
34 Gresham Partners Chicago, Ill. 7,248.39 4.52% $71.06 0.42% 4.08%
35 Mason Investment Advisory Services Reston, Va. 6,507.70 –6.65% $7.78 –12.57% 6.77%
36 Ballentine Partners Waltham, Mass. 6,424.57 –4.09% $30.45 –10.91% 7.65%
37 Clarfeld Financial Advisors Tarrytown, N.Y. 6,103.00 –2.35% $13.56 –11.03% 9.76%
38 GW & Wade Wellesley, Mass. 5,928.19 –6.16% $2.46 –8.34% 2.38%
39 Athena Capital Advisors Lincoln, Mass. 5,822.95 6.42% $138.64 8.95% –2.33%
40 Cornerstone Advisors Asset Management Bethlehem, Pa. 5,807.39 1.55% $12.44 0.46% 1.08%
41 RSM US Wealth Management Minneapolis, Minn. 5,694.02 –4.93% $1.51 –1.96% –3.03%
42 Mill Creek Capital Advisors Conshohocken, Pa. 5,623.05 –3.02% $16.69 –7.33% 4.66%
43 Tolleson Private Wealth Management Dallas, Texas 5,563.00 –0.75% $34.55 –2.60% 1.90%
44 AE Wealth Management Topeka, Kan. 5,526.24 100.29% $0.14 –26.33% 171.89%
45 Beacon Pointe Advisors Newport Beach, Calif. 5,505.87 –0.99% $4.27 –2.91% 1.98%
46 Homrich Berg Atlanta, Ga. 5,457.26 –2.49% $2.66 –26.80% 33.20%
47 Ferguson Wellman Capital Management Portland, Ore. 5,456.66 5.91% $6.52 0.97% 4.89%
48 Savant Capital Rockford, Ill. 5,382.96 –3.66% $1.11 –12.24% 9.77%
49 Brighton Jones Seattle, Wash. 5,299.27 6.81% $3.08 –7.89% 15.96%
50 Conrad Siegel Harrisburg, Pa. 5,178.36 23.10% $20.31 11.03% 10.87%
51 CV Advisors Aventura, Fla. 5,064.49 –9.71% $64.11 –8.56% –1.25%
52 Adviser Investments Newton, Mass. 5,014.03 –5.51% $1.32 –6.55% 1.12%
* Discretionary and nondiscretionary AUM reported on Form ADV. ** Average assets per client relationship. NM = not meaningful.
FIRM NAME LOCATIONYEAR END
2018 ASSETS ($MM)*
% GROWTH IN ASSETS 2017-2018
ASSETS PER CLIENT
($MM)**
% CHANGE IN NO.
OF CLIENTS
% GROWTH IN ASSETSPER CLIENT
2018TOTAL ASSETS
RANK
FA’s 2019 RIA RANKING
This copy is for your personal, non-commercial use only. Reproductions and distribution of this news story are strictly prohibited.For reprints of the PDF contact Susanna Marra at 732-450-8866 ext 24, [email protected].
11.98% $111.19 4.15% 7.52%
–3.90% $67.06 –6.05% 2.28%
21.37% $1.88 –2.46% 24.43%
0.09% $4.98 –0.47% 0.56%
13.16% $34.20 25.67% –9.96%
3.76% $33.76 –2.31% 6.22%
–3.90% $67.06 –6.05% 2.28%
21.37% $1.88 –2.46% 24.43%
0.09% $4.98 –0.47% 0.56%
13.16% $34.20 25.67% –9.96%
3.76% $33.76 –2.31% 6.22%
4.96% $7.68 –35.47% 62.65%
14,337.30 0.09% $4.98 –0.47% 0.56%
13,920.63 13.16% $34.20 25.67% –9.96%
13,840.10 3.76% $33.76 –2.31% 6.22%
11,808.43 4.96% $7.68 –35.47% 62.65%
11,669.98 –4.45% $6.97 –7.02% 2.76%
11,524.53 5.70% $15.96 5.85% –0.14%
13,920.63
13,840.10
11,808.43
10,892.86
New York, NY
Los Angeles, Calif.
Cincinnati, Ohio
Chicago, Ill.
Beverly Hills, Calif.
Cincinnati, Ohio
Bahl & Gaynor Investment Counsel Cincinnati, Ohio
Brownson, Rehmus & Foxworth Chicago, Ill.
Advanced Research Investment Solutions (ARIS)
Johnson Investment Counsel
Chicago, Ill.
Englewood, N.J.
Brownson, Rehmus & Foxworth
Advanced Research Investment Solutions (ARIS)
25 Johnson Investment Counsel
26 RMB Capital
27 Pathstone Englewood, N.J.
28 Signature Estate & Investment Advisors
29 The Colony Group
–4.45% $6.97 –7.02% 2.76%
5.70% $15.96 5.85% –0.14%
–3.10% $21.92 –8.95% 6.42%
–2.05% $183.52 –25.29% 31.11%
2.31% $2.97 –9.14% 12.60%
4.93% $4.74 –3.13% 8.32%
5.70% $15.96 5.85% –0.14%
–3.10% $21.92 –8.95% 6.42%
–2.05% $183.52 –25.29% 31.11%
2.31% $2.97 –9.14% 12.60%
4.93% $4.74 –3.13% 8.32%
–0.17% $26.26 –5.08% 5.18%
7.50% $1.11 0.41% 7.06%
–3.10% $21.92 –8.95% 6.42%
–2.05% $183.52 –25.29% 31.11%
2.31% $2.97 –9.14% 12.60%
4.93% $4.74 –3.13% 8.32%
–0.17% $26.26 –5.08% 5.18%
7.50% $1.11 0.41% 7.06%
–2.05% $183.52 –25.29% 31.11%
2.31% $2.97 –9.14% 12.60%
8,632.00 4.93% $4.74 –3.13% 8.32%
8,534.38 –0.17% $26.26 –5.08% 5.18%
8,410.52 7.50% $1.11 0.41% 7.06%
7,622.60 20.81% $2.43 –27.39% 66.38%
7,559.82
7,622.60
Englewood, N.J.
Los Angeles, Calif.
Boston, Mass. 7,622.60
New York, N.Y.
Omaha, Neb.
Miami, Fla.
Signature Estate & Investment Advisors Los Angeles, Calif.
Boston, Mass.
New York, N.Y.
Omaha, Neb.
Miami, Fla.
Philadelphia, Pa.
Signature Estate & Investment Advisors
The Colony Group Boston, Mass.
Evercore Wealth Management
Carson Wealth Management Group
Miami, Fla.
myCIO Wealth Partners Philadelphia, Pa.
Chicago, Ill.
Evercore Wealth Management
Carson Wealth Management Group
WE Family Offi ces
myCIO Wealth Partners
Gresham Partners
Mason Investment Advisory Services

53 Sontag Advisory New York, N.Y. 4,994.19 –5.24% $3.83 –12.72% 8.57%
54 Monroe Vos Consulting Group Houston, Texas 4,958.30 –7.52% $52.75 –7.52% 0.00%
55 Douglas C. Lane & Associates New York, N.Y. 4,884.86 –8.31% $4.09 –11.76% 3.91%
56 Wetherby Asset Management San Francisco, Calif. 4,851.93 3.64% $8.94 1.35% 2.26%
57 Freestone Capital Management Seattle, Wash. 4,689.55 10.66% $2.69 2.15% 8.33%
58 Welch & Forbes Boston, Mass. 4,589.19 –6.31% $6.01 –0.91% –5.45%
59 MAI Capital Management Cleveland, Ohio 4,460.01 –2.38% $4.61 –13.98% 13.48%
60 Altair Advisers Chicago, Ill. 4,404.37 –2.74% $14.16 –3.99% 1.30%
61 Signature Family Wealth Advisors Charlottesville, Va. 4,347.02 –1.31% $25.72 –4.23% 3.05%
62 Cafaro Greenleaf Red Bank, N.J. 4,300.00 86.96% $10.75 –29.89% 166.67%
63 Litman Gregory Asset Management Walnut Creek, Calif. 4,269.82 –14.68% $11.21 –20.06% 6.72%
64 Ropes Wealth Advisors Boston, Mass. 4,260.36 10.80% $3.86 4.37% 6.15%
65 Gofen And Glossberg Chicago, Ill. 4,186.89 –4.30% $4.57 –6.07% 1.89%
66 Finaccess Advisors Miami, Fla. 4,185.91 –4.63% $50.43 –20.71% 20.29%
67 Heck Capital Advisors Rhinelander, Wis. 4,161.58 –2.01% $4.69 –17.90% 19.35%
68 Retirement Planners of America Plano, Texas 4,147.39 0.21% $0.48 –10.10% 11.46%
69 Joel Isaacson & Co. New York, N.Y. 4,137.42 7.28% $3.76 –9.40% 18.41%
70 Northside Capital Management Hood River, Ore. 4,124.34 –17.93% $152.75 –14.89% –3.57%
71 EP Wealth Advisors Torrance, Calif. 4,107.30 24.58% $1.14 –7.43% 34.58%
72 Beaumont Financial Partners Needham, Mass. 4,094.00 –1.09% $2.05 –6.03% 5.26%
73 Lido Advisors Los Angeles, Calif. 4,086.49 47.38% $2.56 –5.79% 56.43%
74 B|O|S San Francisco, Calif. 4,056.83 –8.51% $4.45 –8.00% –0.55%
75 Alesco Advisors Pittsford, N.Y. 4,041.87 4.87% $8.98 –2.12% 7.14%
76 R. M. Davis Portland, Maine 3,938.59 –1.74% $2.56 –9.16% 8.16%
77 Sequoia Financial Group Akron, Ohio 3,903.14 0.01% $1.03 –40.39% 67.77%
78 The Mather Group Chicago, Ill. 3,873.06 156.13% $3.40 101.71% 26.98%
79 Balasa Dinverno Foltz Itasca, Ill. 3,864.05 –3.26% $2.79 –8.01% 5.17%
80 RGT Wealth Advisors Dallas, Texas 3,857.12 –4.22% $6.81 –7.94% 4.04%
81 Dowling & Yahnke San Diego, Calif. 3,829.23 –3.26% $3.19 –7.93% 5.08%
82 Ingalls & Snyder New York, N.Y. 3,791.56 10.07% $0.94 –30.04% 57.34%
83 Valeo Financial Advisors Indianapolis, Ind. 3,750.48 12.13% $2.50 –2.82% 15.38%
84 WMS Partners Towson, Md. 3,679.84 –10.96% $9.46 –15.54% 5.42%
85 Plancorp St. Louis, Mo. 3,661.61 –8.70% $2.97 –13.37% 5.39%
86 CLA Wealth Advisors Minneapolis, Minn. 3,616.02 0.00% $0.79 –15.22% 17.95%
87 RegentAtlantic Morristown, N.J. 3,597.79 –1.97% $2.44 –13.49% 13.31%
88 Lourd Capital Beverly Hills, Calif. 3,573.95 –0.31% $7.05 0.87% –1.17%
89 Sullivan, Bruyette, Speros & Blayney McLean, Va. 3,518.35 1.34% $3.36 –4.27% 5.86%
90 Greenspring Advisors Towson, Md. 3,505.28 8.58% $7.67 –3.07% 12.01%
91 SignatureFD Atlanta, Ga. 3,494.18 14.15% $3.11 0.74% 13.31%
92 Allworth Financial Sacremento, Calif. 3,453.73 38.93% $0.52 –7.45% 50.11%
93 HBKS Wealth Advisors Erie, Pa. 3,448.04 8.55% $0.69 0.23% 8.30%
94 Bradley, Foster & Sargent Hartford, Conn. 3,440.59 –4.07% $2.44 –6.73% 2.85%
95 Cornerstone Advisors Bellevue, Wash. 3,400.00 –8.11% $5.23 –8.11% 0.00%
96 South Texas Money Management San Antonio, Texas 3,385.23 2.09% $1.79 –1.59% 3.73%
97 Coldstream Wealth Management Bellevue, Wash. 3,348.19 2.26% $2.52 –5.66% 8.39%
98 Brightworth Atlanta, Ga. 3,335.52 0.03% $2.57 9.96% –9.03%
99 Forum Financial Management Lombard, Ill. 3,262.67 0.15% $1.00 2.71% –2.49%
100 Pension Consultants Springfi eld, Mo. 3,255.95 –4.70% $35.39 –6.78% 2.22%
101 Forbes Family Trust New York, N.Y. 3,230.00 –4.33% $30.76 –36.22% 50.00%
102 Camden Capital El Segundo, Calif. 3,174.61 60.53% $10.51 44.05% 11.44%
103 Honkamp Krueger Financial Services Dubuque, Iowa 3,160.64 4.58% $0.83 3.01% 1.52%
104 Geller Advisors New York, N.Y. 3,144.39 12.68% $66.90 –16.09% 34.29%
105 Wipfl i Financial Advisors Milwaukee, Wis. 3,043.91 –37.41% $1.68 –32.00% –7.97%
FIRM NAME LOCATIONYEAR END
2018 ASSETS ($MM)*
% GROWTH IN ASSETS 2017-2018
ASSETS PER CLIENT
($MM)**
% CHANGE IN NO.
OF CLIENTS
% GROWTH IN ASSETSPER CLIENT
2018TOTAL ASSETS
RANK
FA’s 2019 RIA RANKING
* Discretionary and nondiscretionary AUM reported on Form ADV. ** Average assets per client relationship. NM = not meaningful.
This copy is for your personal, non-commercial use only. Reproductions and distribution of this news story are strictly prohibited.For reprints of the PDF contact Susanna Marra at 732-450-8866 ext 24, [email protected].
–2.01% $4.69 –17.90% 19.35%
0.21% $0.48 –10.10% 11.46%
7.28% $3.76 –9.40% 18.41%
–17.93% $152.75 –14.89% –3.57%
24.58% $1.14 –7.43% 34.58%
–1.09% $2.05 –6.03% 5.26%
0.21% $0.48 –10.10% 11.46%
7.28% $3.76 –9.40% 18.41%
–17.93% $152.75 –14.89% –3.57%
24.58% $1.14 –7.43% 34.58%
–1.09% $2.05 –6.03% 5.26%
47.38% $2.56 –5.79% 56.43%
4,124.34 –17.93% $152.75 –14.89% –3.57%
4,107.30 24.58% $1.14 –7.43% 34.58%
4,094.00 –1.09% $2.05 –6.03% 5.26%
4,086.49 47.38% $2.56 –5.79% 56.43%
4,056.83 –8.51% $4.45 –8.00% –0.55%
4,041.87 4.87% $8.98 –2.12% 7.14%
Needham, Mass.
Los Angeles, Calif.
San Francisco, Calif.
Pittsford, N.Y.
Portland, Maine
Akron, Ohio
Chicago, Ill.
San Francisco, Calif.
Pittsford, N.Y.
Portland, Maine
Sequoia Financial Group Akron, Ohio
The Mather Group Chicago, Ill.
Balasa Dinverno Foltz Itasca, Ill.
Dallas, Texas
R. M. Davis
Sequoia Financial Group
78 The Mather Group
79 Balasa Dinverno Foltz
80 RGT Wealth Advisors
81 Dowling & Yahnke
82 Ingalls & Snyder
–8.51% $4.45 –8.00% –0.55%
4.87% $8.98 –2.12% 7.14%
–1.74% $2.56 –9.16% 8.16%
0.01% $1.03 –40.39% 67.77%
156.13% $3.40 101.71% 26.98%
–3.26% $2.79 –8.01% 5.17%
4.87% $8.98 –2.12% 7.14%
–1.74% $2.56 –9.16% 8.16%
0.01% $1.03 –40.39% 67.77%
156.13% $3.40 101.71% 26.98%
–3.26% $2.79 –8.01% 5.17%
–4.22% $6.81 –7.94% 4.04%
–3.26% $3.19 –7.93% 5.08%
–1.74% $2.56 –9.16% 8.16%
0.01% $1.03 –40.39% 67.77%
156.13% $3.40 101.71% 26.98%
–3.26% $2.79 –8.01% 5.17%
–4.22% $6.81 –7.94% 4.04%
–3.26% $3.19 –7.93% 5.08%
0.01% $1.03 –40.39% 67.77%
156.13% $3.40 101.71% 26.98%
3,864.05 –3.26% $2.79 –8.01% 5.17%
3,857.12 –4.22% $6.81 –7.94% 4.04%
3,829.23 –3.26% $3.19 –7.93% 5.08%
3,791.56 10.07% $0.94 –30.04% 57.34%
3,750.48
Dallas, Texas
San Diego, Calif.
New York, N.Y.
Indianapolis, Ind.
Towson, Md.
St. Louis, Mo.
San Diego, Calif.
New York, N.Y.
St. Louis, Mo.
San Diego, Calif.
Ingalls & Snyder New York, N.Y.
Valeo Financial Advisors
St. Louis, Mo.
CLA Wealth Advisors
Valeo Financial Advisors
WMS Partners
Plancorp St. Louis, Mo.
CLA Wealth Advisors
RegentAtlantic
Lourd Capital Beverly Hills, Calif.

106 Massey Quick Simon Morristown, N.J. 2,975.55 –1.72% $9.79 –12.71% 12.59%
107 Crescent Grove Advisors Lake Forest, Ill. 2,889.27 11.78% $14.74 –5.33% 18.07%
108 Wilbanks Smith & Thomas Asset Management Norfolk, Va. 2,848.66 –3.77% $1.50 21.40% –20.73%
109 Clifford Swan Investment Counselors Pasadena, Calif. 2,776.00 –4.90% $3.58 –7.23% 2.51%
110 TFO Phoenix Phoenix, Ariz. 2,771.25 15.21% $18.47 2.92% 11.94%
111 LAMCO Advisory Services Lake Mary, Fla. 2,743.36 12.34% $12.03 –5.89% 19.37%
112 Truepoint Wealth Counsel Cincinnati, Ohio 2,731.50 –2.69% $2.66 –27.99% 35.13%
113 JMG Financial Group Downers Grove, Ill. 2,675.00 3.76% $3.12 –10.39% 15.79%
114 Badgley Phelps Wealth Managers Seattle, Wash. 2,636.48 5.89% $5.09 –2.49% 8.60%
115 Westmount Asset Management Los Angeles, Calif. 2,636.40 5.63% $2.23 2.59% 2.96%
116 Telemus Capital Southfi eld, Mich. 2,590.06 –6.99% $1.69 –27.05% 27.50%
117 Prio Wealth Boston, Mass. 2,560.19 –7.91% $4.03 –5.01% –3.05%
118 Covington Capital Management Los Angeles, Calif. 2,556.75 7.96% $4.39 –26.17% 46.23%
119 RAA Addison, Texas 2,556.23 –4.52% $0.80 –8.29% 4.11%
120 Allegheny Financial Group Pittsburgh, Pa. 2,536.04 –13.53% $0.69 –52.37% 81.55%
121 Budros, Ruhlin and Roe Columbus, Ohio 2,527.74 1.20% $3.47 1.34% –0.14%
122 Frontier Investment Management Co. Dallas, Texas 2,527.23 8.76% $1.63 –1.72% 10.66%
123 Advance Capital Management Southfi eld, Mich. 2,512.17 –3.60% $0.45 –8.35% 5.19%
124 Fort Pitt Capital Group Pittsburgh, Pa. 2,473.34 –1.30% $1.12 –6.73% 5.82%
125 TCI Wealth Advisors Tucson, Ariz. 2,464.23 –5.35% $1.14 –9.06% 4.08%
126 Carroll Financial Associates Charlotte, N.C. 2,463.90 –0.52% $0.48 –15.92% 18.31%
127 Merriman Wealth Management Seattle, Wash. 2,443.11 –9.36% $1.05 10.58% –18.03%
128 Parsec Financial Management Asheville, N.C. 2,442.31 –4.57% $1.47 –10.14% 6.19%
129 Matter Family Offi ce St. Louis, Mo. 2,428.41 –5.82% $15.98 –0.24% –5.59%
130 Wellesley Asset Management Wellesley, Mass. 2,427.82 –12.13% $1.42 –12.23% 0.12%
131 Cassaday & Company Mclean, Va. 2,398.35 1.17% $1.23 –3.09% 4.40%
132 Modera Wealth Management Westwood, N.J. 2,391.44 0.22% $1.70 –8.39% 9.40%
133 Parallel Advisors San Francisco, Calif. 2,386.83 27.26% $1.16 17.24% 8.54%
134 Grimes & Company Westborough, Mass. 2,376.40 9.07% $0.96 –2.69% 12.09%
135 Brookstone Capital Management Wheaton, Ill. 2,350.00 9.30% $0.14 6.09% 3.03%
136 Halbert Hargrove Global Advisors Long Beach, Calif. 2,343.32 –7.13% $3.68 –10.20% 3.41%
137 SYM Financial Advisors Winona Lake, Ind. 2,328.58 –3.51% $2.08 –6.78% 3.51%
138 Heritage Investors Management Bethesda, Md. 2,321.73 –6.34% $3.46 –11.64% 6.00%
139 MRA Associates Phoenix, Ariz. 2,319.43 –2.45% $3.35 –12.72% 11.77%
140 EMM Wealth New York, N.Y. 2,314.81 –10.90% $17.54 –16.98% 7.32%
141 Spectrum Investment Advisors Mequon, Wis. 2,314.47 4.99% $6.17 –4.81% 10.29%
142 Warren Averett Asset Management Birmingham, Ala. 2,296.74 –8.35% $1.95 –11.31% 3.34%
143 Hamilton Capital Columbus, Ohio 2,294.83 –4.01% $1.15 –9.44% 6.00%
144 Mainstay Capital Management Grand Blanc, Mich. 2,268.98 –2.01% $0.62 –3.52% 1.56%
145 Kovack Advisors Fort Lauderdale, Fla. 2,261.27 3.08% $0.30 30.27% –20.87%
146 Destination Wealth Management Walnut Creek, Calif. 2,249.19 –0.16% $1.33 –6.88% 7.22%
147 JFS Wealth Advisors Hermitage, Pa. 2,205.58 –7.72% $1.10 –10.62% 3.24%
148 Evergreen Gavekal Bellevue, Wash. 2,197.09 –4.33% $3.03 –1.03% –3.33%
149 Capital Directions Atlanta, Ga. 2,187.38 –6.81% $1.68 –13.98% 8.33%
150 TFO–TDC Maumee, Ohio 2,175.23 –8.42% $1.60 –10.92% 2.80%
151 ARGI Louisville, Ky. 2,162.65 17.05% $0.66 6.93% 9.47%
152 Palladium Registered Investment Advisors Norfolk, Va. 2,159.26 –3.79% $2.21 –9.70% 6.54%
153 Annex Wealth Management Elm Grove, Wis. 2,136.43 16.90% $0.33 2.02% 14.58%
154 Bordeaux Wealth Advisors Menlo Park, Calif. 2,133.45 2.89% $17.35 –18.86% 26.80%
155 Advisors Capital Management Ridgewood, N.J. 2,132.07 5.87% $0.42 –0.36% 6.25%
156 Pure Financial Advisors San Diego, Calif. 2,128.53 4.36% $0.89 –9.92% 15.85%
157 Frontier Wealth Management Kansas City, Mo. 2,113.81 2.97% $1.33 1.60% 1.34%
158 Coastal Bridge Advisors Westport, Conn. 2,097.54 –11.67% $7.98 –1.26% –10.54%
FIRM NAME LOCATIONYEAR END
2018 ASSETS ($MM)*
% GROWTH IN ASSETS 2017-2018
ASSETS PER CLIENT
($MM)**
% CHANGE IN NO.
OF CLIENTS
% GROWTH IN ASSETSPER CLIENT
2018TOTAL ASSETS
RANK
FA’s 2019 RIA RANKING
* Discretionary and nondiscretionary AUM reported on Form ADV. ** Average assets per client relationship. NM = not meaningful.
This copy is for your personal, non-commercial use only. Reproductions and distribution of this news story are strictly prohibited.For reprints of the PDF contact Susanna Marra at 732-450-8866 ext 24, [email protected].
–13.53% $0.69 –52.37% 81.55%
1.20% $3.47 1.34% –0.14%
8.76% $1.63 –1.72% 10.66%
–3.60% $0.45 –8.35% 5.19%
–1.30% $1.12 –6.73% 5.82%
–5.35% $1.14 –9.06% 4.08%
1.20% $3.47 1.34% –0.14%
8.76% $1.63 –1.72% 10.66%
–3.60% $0.45 –8.35% 5.19%
–1.30% $1.12 –6.73% 5.82%
–5.35% $1.14 –9.06% 4.08%
–0.52% $0.48 –15.92% 18.31%
2,512.17 –3.60% $0.45 –8.35% 5.19%
2,473.34 –1.30% $1.12 –6.73% 5.82%
2,464.23 –5.35% $1.14 –9.06% 4.08%
2,463.90 –0.52% $0.48 –15.92% 18.31%
2,443.11 –9.36% $1.05 10.58% –18.03%
2,442.31 –4.57% $1.47 –10.14% 6.19% 2,442.31
Charlotte, N.C.
Seattle, Wash.
Asheville, N.C.
St. Louis, Mo.
Wellesley, Mass.
Mclean, Va.
Merriman Wealth Management
Parsec Financial Management
Matter Family Offi ce St. Louis, Mo.
Wellesley Asset Management Wellesley, Mass.
Cassaday & Company Mclean, Va.
Modera Wealth Management
Matter Family Offi ce
Wellesley Asset Management
131 Cassaday & Company
132 Modera Wealth Management
133 Parallel Advisors
134 Grimes & Company
135 Brookstone Capital Management
–9.36% $1.05 10.58% –18.03%
–4.57% $1.47 –10.14% 6.19%
–5.82% $15.98 –0.24% –5.59%
–12.13% $1.42 –12.23% 0.12%
1.17% $1.23 –3.09% 4.40%
0.22% $1.70 –8.39% 9.40%
–4.57% $1.47 –10.14% 6.19%
–5.82% $15.98 –0.24% –5.59%
–12.13% $1.42 –12.23% 0.12%
1.17% $1.23 –3.09% 4.40%
0.22% $1.70 –8.39% 9.40%
27.26% $1.16 17.24% 8.54%
9.07% $0.96 –2.69% 12.09%
–5.82% $15.98 –0.24% –5.59%
–12.13% $1.42 –12.23% 0.12%
1.17% $1.23 –3.09% 4.40%
0.22% $1.70 –8.39% 9.40%
27.26% $1.16 17.24% 8.54%
9.07% $0.96 –2.69% 12.09%
–12.13% $1.42 –12.23% 0.12%
1.17% $1.23 –3.09% 4.40%
2,391.44 0.22% $1.70 –8.39% 9.40%
2,386.83 27.26% $1.16 17.24% 8.54%
2,376.40 9.07% $0.96 –2.69% 12.09%
2,350.00 9.30% $0.14 6.09% 3.03%
2,343.32
2,376.40
2,328.58
San Francisco, Calif.
Westborough, Mass.
Wheaton, Ill.
Long Beach, Calif.
Winona Lake, Ind. 2,328.58
Bethesda, Md.
Westborough, Mass.
Wheaton, Ill.
Long Beach, Calif.
Winona Lake, Ind.
Westborough, Mass.
Brookstone Capital Management
Halbert Hargrove Global Advisors
SYM Financial Advisors Winona Lake, Ind.
Heritage Investors Management
New York, N.Y.
Halbert Hargrove Global Advisors
SYM Financial Advisors
Heritage Investors Management
MRA Associates
EMM Wealth New York, N.Y.
Spectrum Investment Advisors

159 Strategic Wealth Partners Group Deerfi eld, Ill. 2,083.80 26.91% $3.19 4.79% 21.11%
160 Exencial Wealth Advisors Oklahoma City, Okla. 2,055.17 –2.36% $2.10 –3.96% 1.66%
161 Private Ocean Wealth Management San Rafael, Calif. 2,004.72 25.93% $1.92 –27.63% 74.00%
162 Wescott Financial Advisory Group Philadelphia, Pa. 2,003.14 3.23% $4.11 –8.64% 12.99%
163 Johnson Sterling Birmingham, Ala. 1,962.45 14.39% $5.45 13.75% 0.56%
164 Sowell Management North Little Rock, Ark. 1,960.64 35.89% $0.45 10.56% 22.91%
165 Pinnacle Advisory Group Columbia, Md. 1,954.30 –2.29% $1.58 –1.50% –0.80%
166 Gradient Investments Arden Hills, Minn. 1,953.79 2.67% $0.15 –12.76% 17.68%
167 Raub Brock Capital Management Larkspur, Calif. 1,912.82 50.04% $0.62 177.15% –45.86%
168 Capital Asset Advisory Services Haslett, Mich. 1,901.00 17.64% $0.23 –27.26% 61.72%
169 Mission Wealth Management Santa Barbara, Calif. 1,884.01 10.90% $1.93 –2.28% 13.49%
170 Accredited Investors Wealth Management Edina, Minn. 1,869.38 –3.48% $3.84 –9.23% 6.33%
171 SJS Investment Services Sylvania, Ohio 1,867.60 –5.29% $2.57 –13.64% 9.67%
172 Andersen Tax McLean, Va. 1,865.08 –11.90% $5.67 –19.39% 9.30%
173 Water Oak Advisors Winter Park, Fla. 1,855.45 –5.86% $2.94 –7.50% 1.77%
174 Sage Financial Group Conshohocken, Pa. 1,840.00 8.24% $2.83 –0.09% 8.33%
175 Carnegie Investment Counsel Pepper Pike, Ohio 1,838.01 8.90% $1.67 –15.85% 29.41%
176 Fairview Capital Investment Management Greenbrae, Calif. 1,827.54 –8.28% $10.38 –8.80% 0.57%
177 RINET Company Boston, Mass. 1,823.15 –7.77% $10.13 –10.33% 2.86%
178 Welch Hornsby Montgomery, Ala. 1,817.96 –5.77% $3.91 –10.63% 5.44%
179 Crestwood Advisors Group Boston, Mass. 1,807.61 –1.32% $4.72 –6.98% 6.09%
180 PagnatoKarp Reston, Va. 1,801.50 0.74% $5.36 3.14% –2.33%
181 Cardiff Park Advisors San Marcos, Calif. 1,799.90 3.37% $4.65 3.37% 0.00%
182 Family Management Corporation New York, N.Y. 1,782.20 0.63% $2.76 –12.92% 15.56%
183 Carlson Capital Management Northfi eld, Minn. 1,778.50 –8.18% $1.79 –15.20% 8.28%
184 Klingman & Associates New York, N.Y. 1,774.54 –0.87% $4.50 –15.21% 16.91%
185 Morton Capital Management Calabasas, Calif. 1,762.40 –3.64% $1.85 –6.17% 2.70%
186 G.W. Henssler & Associates Kennesaw, Ga. 1,758.38 –3.12% $1.61 –6.32% 3.41%
187 Resource Consulting Group Orlando, Fla. 1,756.69 –4.38% $4.01 –9.62% 5.80%
188 F. L. Putnam Investment Management Company Wellesley, Mass. 1,747.90 1.68% $3.04 –5.57% 7.68%
189 RCL Advisors New York, N.Y. 1,736.37 4.38% $12.23 10.26% –5.33%
190 Barrett Asset Management New York, N.Y. 1,715.73 –5.39% $2.62 –6.11% 0.77%
191 Retirement Income Solutions Ann Arbor, Mich. 1,713.23 –3.14% $1.43 –4.68% 1.61%
192 HoyleCohen San Diego, Calif. 1,713.17 –0.87% $1.49 –3.37% 2.59%
193 Gratus Capital Atlanta, Ga. 1,674.18 4.61% $2.84 –21.85% 33.86%
194 Brouwer and Janachowski Mill Valley, Calif. 1,656.13 –0.40% $2.21 –4.92% 4.76%
195 Courier Capital Buffalo, N.Y. 1,630.55 –3.23% $1.99 –4.41% 1.23%
196 Chesley, Taft & Associates Chicago, Ill. 1,610.30 –8.55% $4.50 –3.18% –5.54%
197 Anderson Financial Partners Ponte Vedra, Fla. 1,610.00 –8.00% $38.33 –8.00% 0.00%
198 Radnor Financial Advisors Wayne, Pa. 1,600.76 –5.84% $4.42 –9.74% 4.32%
199 Aldrich Wealth Lake Oswego, Ore. 1,599.83 32.86% $2.13 25.77% 5.63%
200 Polaris Greystone Financial Group San Rafael, Calif. 1,591.41 6.81% $1.00 3.58% 3.12%
201 Beirne Wealth Consulting Services Shelton, Conn. 1,589.99 –30.72% $2.89 29.36% –46.45%
202 Chicago Capital Chicago, Ill. 1,587.67 31,653.36% $3.62 28,832.44% 9.75%
203 Burney Company Reston, Va. 1,578.47 –10.59% $0.75 –19.11% 10.53%
204 Colorado Financial Management Boulder, Colo. 1,569.96 8.25% $1.89 –3.11% 11.73%
205 Birch Hill Investment Advisors Boston, Mass. 1,564.01 –1.21% $8.94 –10.81% 10.76%
206 Argent Wealth Management Waltham, Mass. 1,560.98 –3.98% $3.74 –7.90% 4.25%
207 MCF Advisors Covington, Ky. 1,551.19 0.13% $2.42 0.91% –0.77%
208 Vivaldi Capital Management Chicago, Ill. 1,525.59 26.85% $2.54 –4.86% 33.33%
209 TrustCore Financial Services Brentwood, Tenn. 1,525.31 21.09% $0.82 14.54% 5.71%
210 Private Vista Chicago, Ill. 1,523.93 –10.21% $1.48 –14.23% 4.69%
211 Goelzer Investment Management Indianapolis, Ind. 1,521.45 –3.56% $3.10 –3.95% 0.41%
FIRM NAME LOCATIONYEAR END
2018 ASSETS ($MM)*
% GROWTH IN ASSETS 2017-2018
ASSETS PER CLIENT
($MM)**
% CHANGE IN NO.
OF CLIENTS
% GROWTH IN ASSETSPER CLIENT
2018TOTAL ASSETS
RANK
FA’s 2019 RIA RANKING
* Discretionary and nondiscretionary AUM reported on Form ADV. ** Average assets per client relationship. NM = not meaningful.
This copy is for your personal, non-commercial use only. Reproductions and distribution of this news story are strictly prohibited.For reprints of the PDF contact Susanna Marra at 732-450-8866 ext 24, [email protected].
–5.86% $2.94 –7.50% 1.77%
8.24% $2.83 –0.09% 8.33%
8.90% $1.67 –15.85% 29.41%
–8.28% $10.38 –8.80% 0.57%
–7.77% $10.13 –10.33% 2.86%
–5.77% $3.91 –10.63% 5.44%
8.24% $2.83 –0.09% 8.33%
8.90% $1.67 –15.85% 29.41%
–8.28% $10.38 –8.80% 0.57%
–7.77% $10.13 –10.33% 2.86%
–5.77% $3.91 –10.63% 5.44%
–1.32% $4.72 –6.98% 6.09%
1,827.54 –8.28% $10.38 –8.80% 0.57%
1,823.15 –7.77% $10.13 –10.33% 2.86%
1,817.96 –5.77% $3.91 –10.63% 5.44%
1,807.61 –1.32% $4.72 –6.98% 6.09%
1,801.50 0.74% $5.36 3.14% –2.33%
1,799.90 3.37% $4.65 3.37% 0.00%
Montgomery, Ala.
Boston, Mass.
San Marcos, Calif.
New York, N.Y.
Northfi eld, Minn.
New York, N.Y.
Cardiff Park Advisors San Marcos, Calif.
Family Management Corporation
Carlson Capital Management
Klingman & Associates New York, N.Y.
Morton Capital Management
G.W. Henssler & Associates Kennesaw, Ga.
Family Management Corporation
Carlson Capital Management
184 Klingman & Associates
185 Morton Capital Management
186 G.W. Henssler & Associates
187 Resource Consulting Group
188 F. L. Putnam Investment Management Company
0.74% $5.36 3.14% –2.33%
3.37% $4.65 3.37% 0.00%
0.63% $2.76 –12.92% 15.56%
–8.18% $1.79 –15.20% 8.28%
–0.87% $4.50 –15.21% 16.91%
–3.64% $1.85 –6.17% 2.70%
3.37% $4.65 3.37% 0.00%
0.63% $2.76 –12.92% 15.56%
–8.18% $1.79 –15.20% 8.28%
–0.87% $4.50 –15.21% 16.91%
–3.64% $1.85 –6.17% 2.70%
–3.12% $1.61 –6.32% 3.41%
–4.38% $4.01 –9.62% 5.80%
0.63% $2.76 –12.92% 15.56%
–8.18% $1.79 –15.20% 8.28%
–0.87% $4.50 –15.21% 16.91%
–3.64% $1.85 –6.17% 2.70%
–3.12% $1.61 –6.32% 3.41%
–4.38% $4.01 –9.62% 5.80%
–8.18% $1.79 –15.20% 8.28%
–0.87% $4.50 –15.21% 16.91%
1,762.40 –3.64% $1.85 –6.17% 2.70%
1,758.38 –3.12% $1.61 –6.32% 3.41%
1,756.69 –4.38% $4.01 –9.62% 5.80%
1,747.90 1.68% $3.04 –5.57% 7.68%
1,736.37
Kennesaw, Ga.
Orlando, Fla.
Wellesley, Mass.
New York, N.Y.
New York, N.Y.
Ann Arbor, Mich.
Orlando, Fla.
F. L. Putnam Investment Management Company Wellesley, Mass. F. L. Putnam Investment Management Company Wellesley, Mass. F. L. Putnam Investment Management Company
New York, N.Y.
Ann Arbor, Mich.
F. L. Putnam Investment Management Company
New York, N.Y.
Barrett Asset Management
Retirement Income Solutions
Atlanta, Ga.
RCL Advisors
Barrett Asset Management
Retirement Income Solutions
HoyleCohen
Gratus Capital Atlanta, Ga.
Brouwer and Janachowski

212 Farr Miller & Washington Washington, D.C. 1,509.94 1.79% $2.75 9.94% –7.41%
213 Bridgewater Advisors New York, N.Y. 1,500.71 5.14% $3.63 –3.26% 8.68%
214 RTD Financial Philadelphia, Pa. 1,487.45 0.02% $2.46 –2.79% 2.89%
215 West Financial Services McLean, Va. 1,481.94 6.86% $1.99 –12.62% 22.30%
216 Golub Group San Mateo, Calif. 1,481.83 –6.62% $1.30 –7.52% 0.97%
217 6 Meridian Wichita, Kan. 1,474.79 3.29% $2.14 –5.69% 9.52%
218 CM Wealth Advisors Beachwood, Ohio 1,451.00 –15.98% $8.69 –14.98% –1.18%
219 Integrated Financial Group Atlanta, Ga. 1,439.11 –23.99% $0.34 7.33% –29.19%
220 Financial Clarity Mountain View, Calif. 1,437.58 –1.47% $47.92 1.82% –3.23%
221 Cadinha & Co. Honolulu, Hawaii 1,432.70 15.96% $2.24 13.42% 2.24%
222 The Welch Group Birmingham, Ala. 1,431.56 2.40% $1.43 –6.19% 9.15%
223 Arlington Partners Birmingham, Ala. 1,425.25 –8.51% $13.97 –10.30% 2.00%
224 Schneider Downs Wealth Management Advisors Pittsburgh, Pa. 1,425.08 3.28% $2.57 1.60% 1.65%
225 Capstone Financial Advisors Downers Grove, Ill. 1,421.20 3.69% $2.85 –2.97% 6.87%
226 GM Advisory Group Melville, N.Y. 1,415.46 72.35% $3.42 66.93% 3.24%
227 Heritage Financial Services Westwood, Mass. 1,411.60 –0.74% $1.52 –9.39% 9.55%
228 Obermeyer Wood Investment Counsel Aspen, Colo. 1,400.00 –13.42% $2.67 –15.07% 1.94%
229 Miracle Mile Advisors Los Angeles, Calif. 1,399.69 55.85% $2.84 3.06% 51.23%
230 BerganKDV Wealth Management Bloomington, Minn. 1,398.98 0.70% $1.60 3.34% –2.56%
231 One Capital Management Westlake Village, Calif. 1,378.87 1.78% $0.53 10.30% –7.72%
232 Smith Salley & Associates Greensboro, N.C. 1,377.89 2.26% $3.02 –13.89% 18.75%
233 Fairway Wealth Management Independence, Ohio 1,374.88 3.05% $6.25 –10.07% 14.58%
234 Verdence Capital Advisors Hunt Valley, Md. 1,374.84 –9.05% $1.48 –8.76% –0.32%
235 Northwest Asset Management Mercer Island, Wash. 1,372.76 3.09% $0.71 –3.53% 6.86%
236 Glassman Wealth Services Vienna, Va. 1,370.86 37.99% $5.71 26.49% 9.09%
237 Greenwich Wealth Management Greenwich, Conn. 1,354.01 18.92% $9.21 13.26% 5.00%
238 Reilly Financial Advisors La Mesa, Calif. 1,334.42 21.86% $1.33 9.67% 11.11%
239 TrueWealth Management Atlanta, Ga. 1,333.08 –7.74% $2.36 –16.56% 10.57%
240 SFMG Wealth Advisors Plano, Texas 1,312.43 6.43% $2.09 3.22% 3.11%
241 Foster & Motley Cincinnati, Ohio 1,302.88 11.91% $2.18 3.50% 8.12%
242 North American Management Boston, Mass. 1,296.66 –14.67% $3.09 –7.16% –8.10%
243 Lucia Capital Group San Diego, Calif. 1,290.08 –5.76% $0.31 –14.44% 10.15%
244 Regal Investment Advisors Kentwood, Mich. 1,277.83 4.51% $0.18 –5.99% 11.17%
245 GHP Investment Advisors Denver, Colo. 1,277.26 1.85% $1.60 –5.19% 7.42%
246 Lenox Wealth Advisors New York, N.Y. 1,276.22 13.87% $1.16 –16.46% 36.30%
247 Guyasuta Investment Advisors Pittsburgh, Pa. 1,242.59 –3.42% $3.53 –8.08% 5.07%
248 EFS Advisors Cambridge, Minn. 1,236.98 15.36% $0.07 –18.57% 41.67%
249 Legacy Wealth Management Memphis, Tenn. 1,225.20 –2.18% $1.21 –8.84% 7.31%
250 Sadoff Investment Management Milwaukee, Wis. 1,221.00 –11.73% $1.90 –12.00% 0.31%
251 Capital Wealth Planning Naples, Fla. 1,211.45 28.89% $0.44 –6.66% 38.09%
252 Windsor Wealth Management Indianapolis, Ind. 1,210.68 1.48% $1.49 –9.52% 12.15%
253 Altfest Personal Wealth Management New York, N.Y. 1,210.00 –10.13% $1.95 –10.13% 0.00%
254 Huber Financial Advisors Lincolnshire, Ill. 1,203.50 –2.38% $1.20 –3.65% 1.31%
255 Altium Wealth Management Purchase, N.Y. 1,202.94 31.99% $1.51 11.92% 17.93%
256 Financial Advisory Service Leawood, Kan. 1,200.00 –2.44% $1.31 –6.29% 4.10%
257 Artemis Wealth Advisors New York, N.Y. 1,198.97 42.73% $92.23 31.76% 8.33%
258 Compass Capital Management Minneapolis, Minn. 1,158.95 –0.59% $4.28 22.21% 4.23%
259 CPS Investment Advisors Lakeland, Fla. 1,155.09 4.63% $0.24 –8.95% 14.91%
260 Resource Management Metairie, La. 1,152.86 –6.43% $2.56 –12.67% 7.14%
261 Alpha Cubed Investments Irvine, Calif. 1,143.59 2.62% $0.83 –4.83% 7.82%
262 Capital Wealth Advisors Naples, Fla. 1,124.57 14.42% $1.36 0.18% 14.21%
263 Belpointe Asset Management Phoenix, Ariz. 1,120.48 17.70% $0.33 2.36% 14.98%
264 Per Stirling Capital Management Austin, Texas 1,087.99 74.82% $1.16 36.92% 27.68%
FIRM NAME LOCATIONYEAR END
2018 ASSETS ($MM)*
% GROWTH IN ASSETS 2017-2018
ASSETS PER CLIENT
($MM)**
% CHANGE IN NO.
OF CLIENTS
% GROWTH IN ASSETSPER CLIENT
2018TOTAL ASSETS
RANK
FA’s 2019 RIA RANKING
* Discretionary and nondiscretionary AUM reported on Form ADV. ** Average assets per client relationship. NM = not meaningful.
This copy is for your personal, non-commercial use only. Reproductions and distribution of this news story are strictly prohibited.For reprints of the PDF contact Susanna Marra at 732-450-8866 ext 24, [email protected].
72.35% $3.42 66.93% 3.24%
–0.74% $1.52 –9.39% 9.55%
–13.42% $2.67 –15.07% 1.94%
55.85% $2.84 3.06% 51.23%
0.70% $1.60 3.34% –2.56%
1.78% $0.53 10.30% –7.72%
–0.74% $1.52 –9.39% 9.55%
–13.42% $2.67 –15.07% 1.94%
55.85% $2.84 3.06% 51.23%
0.70% $1.60 3.34% –2.56%
1.78% $0.53 10.30% –7.72%
2.26% $3.02 –13.89% 18.75%
1,399.69 55.85% $2.84 3.06% 51.23%
1,398.98 0.70% $1.60 3.34% –2.56%
1,378.87 1.78% $0.53 10.30% –7.72%
1,377.89 2.26% $3.02 –13.89% 18.75%
1,374.88 3.05% $6.25 –10.07% 14.58%
1,374.84 –9.05% $1.48 –8.76% –0.32%
Westlake Village, Calif.
1,370.86
Greensboro, N.C.
Independence, Ohio
Hunt Valley, Md.
Mercer Island, Wash.
Vienna, Va.
Greenwich, Conn.
Fairway Wealth Management
Verdence Capital Advisors Hunt Valley, Md.
Northwest Asset Management
Glassman Wealth Services
Greenwich Wealth Management
Reilly Financial Advisors La Mesa, Calif.
TrueWealth Management
Northwest Asset Management
Glassman Wealth Services
237 Greenwich Wealth Management
238 Reilly Financial Advisors
239 TrueWealth Management
240 SFMG Wealth Advisors
241 Foster & Motley
3.05% $6.25 –10.07% 14.58%
–9.05% $1.48 –8.76% –0.32%
3.09% $0.71 –3.53% 6.86%
37.99% $5.71 26.49% 9.09%
18.92% $9.21 13.26% 5.00%
21.86% $1.33 9.67% 11.11%
–9.05% $1.48 –8.76% –0.32%
3.09% $0.71 –3.53% 6.86%
37.99% $5.71 26.49% 9.09%
18.92% $9.21 13.26% 5.00%
21.86% $1.33 9.67% 11.11%
–7.74% $2.36 –16.56% 10.57%
6.43% $2.09 3.22% 3.11%
3.09% $0.71 –3.53% 6.86%
37.99% $5.71 26.49% 9.09%
18.92% $9.21 13.26% 5.00%
21.86% $1.33 9.67% 11.11%
–7.74% $2.36 –16.56% 10.57%
6.43% $2.09 3.22% 3.11%
1,334.42 21.86% $1.33 9.67% 11.11%
1,333.08 –7.74% $2.36 –16.56% 10.57%
1,312.43 6.43% $2.09 3.22% 3.11%
1,302.88 11.91% $2.18 3.50% 8.12%
1,296.66
1,302.88
Atlanta, Ga.
Plano, Texas
Cincinnati, Ohio
Boston, Mass.
San Diego, Calif.
Kentwood, Mich.
Cincinnati, Ohio
San Diego, Calif.
Kentwood, Mich.
Foster & Motley Cincinnati, Ohio
North American Management
Lucia Capital Group San Diego, Calif.
Regal Investment Advisors
GHP Investment Advisors
Lenox Wealth Advisors New York, N.Y.
North American Management
Lucia Capital Group
Regal Investment Advisors
GHP Investment Advisors
Lenox Wealth Advisors
Guyasuta Investment Advisors

265 Vigilant Capital Management Portsmouth, N.H. 1,087.18 4.47% $3.31 –10.82% 17.14%
266 Novare Capital Management Charlotte, N.C. 1,085.00 2.36% $2.97 0.96% 1.39%
267 BigSur Wealth Management Miami, Fla. 1,082.72 –6.26% $56.99 –6.26% 0.00%
268 True North Advisors Dallas, Texas 1,081.54 –10.56% $2.38 –10.36% –0.22%
269 Beaird Harris Dallas, Texas 1,072.32 4.30% $1.84 –2.13% 6.57%
270 LBMC Investment Advisors Brentwood, Tenn. 1,064.34 2.61% $2.85 –7.81% 11.31%
271 CFS Investment Advisory Services Totowa, N.J. 1,058.82 –0.67% $2.58 0.55% –1.20%
272 Cornerstone Advisory Hunt Valley, Md. 1,056.92 –3.09% $1.58 –6.85% 4.03%
273 Ruggie Wealth Management Tavares, Fla. 1,050.53 12.24% $2.71 5.28% 6.61%
274 Durbin Bennett Private Wealth Management Austin, Texas 1,044.97 0.40% $5.10 –4.50% 5.13%
275 Abacus Planning Group Columbia, S.C. 1,044.69 –1.10% $4.41 –4.43% 3.49%
276 BLB&B Advisors Montgomeryville, Pa. 1,039.83 –7.35% $1.23 –9.76% 2.67%
277 CapTrust Financial Advisors Holland, Mich. 1,031.55 4.11% $1.45 –3.05% 7.39%
278 Willow Creek Wealth Management Sebastopol, Calif. 1,022.94 13.20% $1.89 9.22% 3.65%
279 Planning Alternatives Bloomfi eld Hills, Mich. 1,017.11 –7.76% $1.25 –6.63% –1.21%
280 Round Table Wealth Management Westfi eld, N.J. 1,012.16 –1.04% $5.22 –16.85% 19.02%
281 McKinley Carter Wealth Services Wheeling, W.Va. 1,003.83 –5.78% $1.12 –0.54% –5.26%
282 Magnus Financial Group New York, N.Y. 1,001.01 256.53% $2.01 166.50% 33.78%
ASSET CATEGORY: $500 million to < $1 billion
283 Bitterroot Capital Advisors Bozeman, Mont. 996.01 –8.04% $66.40 –8.04% 0.00%
284 Pillar Pacifi c Capital Management San Marino, Calif. 980.63 –5.48% $2.60 –9.49% 4.43%
285 Stegner Investment Associates Louisville, Ky. 980.02 –2.41% $6.09 –9.08% 7.33%
286 Albion Financial Group Salt Lake City, Utah 978.58 –2.23% $1.50 –12.90% 12.24%
287 Hardy Reed Tupelo, Miss. 966.60 34.07% $3.55 14.35% 17.24%
288 Lutz Financial Omaha, Neb. 963.42 12.52% $1.75 –2.38% 15.27%
289 Sigma Investment Counselors Northville, Mich. 960.69 –0.80% $1.53 –1.91% 1.13%
290 Condor Capital Management Martinsville, N.J. 960.68 –4.50% $1.31 –5.93% 1.52%
291 Tanglewood Total Wealth Management Houston, Texas 953.32 –2.42% $2.03 –6.99% 4.91%
292 Wealthquest Cincinnati, Ohio 938.39 7.28% $0.82 –23.21% 39.71%
293 Kingsview Asset Management Grants Pass, Ore. 937.38 24.41% $0.39 8.86% 14.29%
294 True Private Wealth Advisors Salem, Ore. 935.96 3.11% $0.65 –6.36% 10.11%
295 Van Hulzen Asset Management El Dorado Hills, Calif. 933.36 15.19% $1.24 4.44% 10.29%
296 The Institute for Wealth Management Denver, Colo. 926.23 4.06% $0.25 0.42% 3.63%
297 AJ Wealth New York, N.Y. 926.00 21.20% $4.65 5.37% 15.03%
298 BT Wealth Management Atlanta, Ga. 924.45 17.72% $2.70 –10.51% 31.54%
399 StraightLine Group Troy, Mich. 922.48 –3.42% $0.33 –1.53% –1.91%
300 Main Street Research Sausalito, Calif. 914.30 7.74% $1.56 –8.10% 17.23%
301 Ironview Capital Management King of Prussia, Pa. 914.03 13.97% $3.18 0.86% 12.99%
302 AEPG Wealth Strategies Warren, N.J. 912.81 2.47% $1.63 8.70% –5.72%
303 Sapient Private Wealth Management Eugene, Ore. 907.17 –4.72% $1.69 –6.14% 1.51%
304 TFC Financial Management Boston, Mass. 904.39 –5.56% $2.58 –10.95% 6.06%
305 Valley National Financial Advisors Bethlehem, Pa. 897.17 3.77% $0.45 –3.43% 7.46%
306 The Financial Advisory Group Houston, Texas 877.86 2.48% $2.51 –3.38% 6.06%
307 TrilogyCapital Huntington Beach, Calif. 877.12 33.25% $0.07 –46.02% 146.86%
308 United Asset Strategies Garden City, N.Y. 872.97 –3.24% $1.02 –6.06% 3.00%
309 Versant Capital Management Phoenix, Ariz. 872.57 –4.04% $1.69 –28.77% 34.73%
310 Delphi Private Advisors San Diego, Calif. 860.90 –9.37% $4.70 –7.39% –2.14%
311 Romano Wealth Management Evanston, Ill. 859.99 –4.86% $1.28 –8.81% 4.33%
312 Palisade Asset Management Minneapolis, Minn. 858.13 –10.76% $1.88 –15.25% 5.30%
313 Doyle Wealth Management St Petersburg, Fla. 853.32 0.87% $1.07 –9.13% 11.00%
314 SAX Wealth Advisors Clifton, N.J. 853.19 –4.71% $1.33 0.21% –4.90%
315 Schechter Investment Advisors Birmingham, Mich. 850.69 2.28% $4.27 –10.57% 14.37%
316 Baltimore Washington Financial Advisors Columbia, Md. 850.00 0.00% $1.00 –17.65% 21.43%
FIRM NAME LOCATIONYEAR END
2018 ASSETS ($MM)*
% GROWTH IN ASSETS 2017-2018
ASSETS PER CLIENT
($MM)**
% CHANGE IN NO.
OF CLIENTS
% GROWTH IN ASSETSPER CLIENT
2018TOTAL ASSETS
RANK
FA’s 2019 RIA RANKING
* Discretionary and nondiscretionary AUM reported on Form ADV. ** Average assets per client relationship. NM = not meaningful.
This copy is for your personal, non-commercial use only. Reproductions and distribution of this news story are strictly prohibited.For reprints of the PDF contact Susanna Marra at 732-450-8866 ext 24, [email protected].
–7.76% $1.25 –6.63% –1.21%
–1.04% $5.22 –16.85% 19.02%
–5.78% $1.12 –0.54% –5.26%
256.53% $2.01 166.50% 33.78%
–8.04% $66.40 –8.04% 0.00%
–1.04% $5.22 –16.85% 19.02%
–5.78% $1.12 –0.54% –5.26%
256.53% $2.01 166.50% 33.78%
–8.04% $66.40 –8.04% 0.00%
–5.48% $2.60 –9.49% 4.43%
1,001.01 256.53% $2.01 166.50% 33.78%
996.01 –8.04% $66.40 –8.04% 0.00%
–5.48% $2.60 –9.49% 4.43%
980.02 –2.41% $6.09 –9.08% 7.33%
978.58 –2.23% $1.50 –12.90% 12.24%
Bozeman, Mont.
980.02
978.58
San Marino, Calif.
Salt Lake City, Utah
Tupelo, Miss.
Omaha, Neb.
Northville, Mich.
Stegner Investment Associates
Albion Financial Group Salt Lake City, Utah
Tupelo, Miss.
Sigma Investment Counselors Northville, Mich.
Condor Capital Management
Tanglewood Total Wealth Management
Hardy Reed
Lutz Financial
289 Sigma Investment Counselors
290 Condor Capital Management
291 Tanglewood Total Wealth Management
292 Wealthquest
293 Kingsview Asset Management
–2.41% $6.09 –9.08% 7.33%
–2.23% $1.50 –12.90% 12.24%
34.07% $3.55 14.35% 17.24%
12.52% $1.75 –2.38% 15.27%
–0.80% $1.53 –1.91% 1.13%
–4.50% $1.31 –5.93% 1.52%
–2.23% $1.50 –12.90% 12.24%
34.07% $3.55 14.35% 17.24%
12.52% $1.75 –2.38% 15.27%
–0.80% $1.53 –1.91% 1.13%
–4.50% $1.31 –5.93% 1.52%
–2.42% $2.03 –6.99% 4.91%
7.28% $0.82 –23.21% 39.71%
34.07% $3.55 14.35% 17.24%
12.52% $1.75 –2.38% 15.27%
–0.80% $1.53 –1.91% 1.13%
–4.50% $1.31 –5.93% 1.52%
–2.42% $2.03 –6.99% 4.91%
7.28% $0.82 –23.21% 39.71%
12.52% $1.75 –2.38% 15.27%
960.69 –0.80% $1.53 –1.91% 1.13%
–4.50% $1.31 –5.93% 1.52%
953.32 –2.42% $2.03 –6.99% 4.91%
938.39 7.28% $0.82 –23.21% 39.71%
24.41% $0.39 8.86% 14.29%
935.96
953.32
938.39
Houston, Texas
Cincinnati, Ohio 938.39
Grants Pass, Ore.
Salem, Ore.
El Dorado Hills, Calif.
Denver, Colo.
Grants Pass, Ore.
Salem, Ore.
El Dorado Hills, Calif.
New York, N.Y.
Kingsview Asset Management
True Private Wealth Advisors
Van Hulzen Asset Management
The Institute for Wealth Management
New York, N.Y.
BT Wealth Management Atlanta, Ga.
True Private Wealth Advisors
Van Hulzen Asset Management
The Institute for Wealth Management
AJ Wealth New York, N.Y.
BT Wealth Management
StraightLine Group

317 Meyer Capital Group Marlton, N.J. 847.17 –6.24% $1.20 –5.84% –0.42%
318 Sheaff Brock Investment Advisors Indianapolis, Ind. 845.96 –18.85% $0.82 –14.36% –5.24%
319 Endurance Wealth Management Providence, R.I. 836.73 –6.51% $2.89 –9.74% 3.57%
320 Wacker Wealth Partners San Luis Obispo, Calif. 830.92 –6.82% $1.35 –11.82% 5.67%
321 Quadrant Capital Group Cincinnati, Ohio 829.45 36.85% $14.06 27.57% 7.27%
322 Austin Asset Austin, Texas 824.00 –0.72% $2.22 –6.33% 5.98%
323 Column Capital Indianapolis, Ind. 820.20 –2.71% $2.93 –12.09% 10.67%
324 The Advisory Group Of San Francisco San Francisco, Calif. 818.65 –4.85% $4.99 –1.94% –2.96%
325 Paragon Capital Management Denver, Colo. 816.66 –0.59% $5.63 0.78% –1.36%
326 Warwick Partners Bryan, Texas 813.58 –4.28% $4.87 –0.85% –3.47%
327 Acorn Financial Advisory Services Reston, Va. 810.80 18.24% $0.54 6.13% 11.41%
328 Greene Wealth Management Seattle, Wash. 806.04 2.22% $2.44 –7.08% 10.00%
329 RZH Advisors Stamford, Conn. 797.00 –3.74% $3.32 –15.78% 14.29%
330 Delegate Advisors Chapel Hill, N.C. 794.59 –55.06% $27.40 –55.06% 0.00%
331 Madison Wealth Management Cincinnati, Ohio 791.86 54.90% $1.70 2.60% 50.97%
332 Kings Point Capital Management Great Neck, N.Y. 789.15 –1.49% $4.20 –9.35% 8.67%
333 Oakwood Capital Management Los Angeles, Calif. 783.59 –5.66% $1.91 –5.89% 0.24%
334 Argent Advisors Ruston, La. 782.16 47.82% $0.37 1.11% 46.20%
335 Ensemble Capital Management Burlingame, Calif. 780.85 8.68% $4.00 –17.51% 31.76%
336 Axxcess Wealth Management Carlsbad, Calif. 777.74 50.65% $0.89 11.91% 34.62%
337 Carnick & Kubik Group Denver, Colo. 775.43 –3.07% $1.44 –5.76% 2.86%
338 L&S Advisors Los Angeles, Calif. 774.81 –3.75% $0.54 –15.91% 14.46%
339 Weatherly Asset Management Del Mar, Calif. 769.82 3.41% $2.07 –0.49% 3.91%
340 Financial Synergies Wealth Advisors Houston, Texas 768.63 10.48% $1.52 –1.94% 12.67%
341 SilverOak Wealth Management Edina, Minn. 760.37 1.12% $2.63 –2.38% 3.58%
342 Northern Oak Wealth Management Milwaukee, Wis. 758.43 –3.36% $2.08 –7.33% 4.29%
343 YorkBridge Wealth Partners New York, N.Y. 757.01 –6.01% $3.10 –2.55% –3.56%
344 Nadler Financial Group Deerfi eld, Ill. 749.33 1.49% $1.00 –5.70% 7.63%
345 Bogart Wealth McLean, Va. 748.14 5.60% $1.34 –10.11% 17.47%
346 Fund Direct Advisors Greensboro, N.C. 745.00 10.37% $2.98 –33.78% 66.67%
347 Narwhal Capital Management Marietta, Ga. 742.89 –3.15% $7.08 –34.51% 47.89%
348 SB Capital Management Encino, Calif. 741.44 11.12% $2.90 5.05% 5.79%
349 Intelligence Driven Advisers Carlsbad, Calif. 740.00 68.18% $0.62 19.13% 41.18%
350 Corrigan Financial Middletown, R.I. 735.00 –5.77% $0.75 –8.37% 2.84%
351 WealthSource Partners Arroyo Grande, Calif. 730.30 11.12% $0.47 –10.48% 24.14%
352 The Insight Group Salt Lake City, Utah 727.35 3.10% $1.80 –0.72% 3.85%
353 Smith Anglin Financial Dallas, Texas 722.23 5.80% $0.86 2.29% 3.43%
354 CJM Wealth Advisers Fairfax, Va. 718.62 –1.94% $0.95 –4.02% 2.17%
355 Oakbridge Partners Atlanta, Ga. 715.38 2.77% $1.66 –3.41% 6.40%
356 Woodmont Investment Counsel Nashville, Tenn. 715.07 3.63% $2.38 –2.24% 6.01%
357 Aurum Wealth Management Mayfi eld Village, Ohio 709.00 –0.73% $0.86 –12.16% 13.01%
358 Cable Hill Partners Portland, Ore. 708.33 14.76% $1.23 –0.38% 15.20%
359 Hemington Wealth Management Falls Church, Va. 706.48 –1.42% $1.64 –18.35% 20.73%
360 Cardan Capital Partners Denver, Colo. 702.54 0.06% $2.21 –10.01% 11.19%
361 Steel Peak Wealth Management Woodland Hills, Calif. 683.95 –18.79% $0.57 –18.99% 0.25%
362 Burton Enright Welch Walnut Creek, Calif. 683.30 5.01% $1.69 5.53% –0.49%
363 Raffa Wealth Management Washington, D.C. 678.46 –0.81% $4.71 –6.32% 5.88%
364 The Planning Center Moline, Ill. 676.45 1.14% $0.75 –8.89% 11.02%
365 Petersen Hastings Investment Management Kennewick, Wash. 670.21 –2.91% $0.99 –8.22% 5.79%
366 Sanderson Wealth Management Buffalo, N.Y. 666.73 –10.12% $2.74 –14.93% 5.65%
367 Retirement Investment Advisors Oklahoma City, Okla. 665.23 –2.58% $0.56 –8.76% 6.77%
368 Yeske Buie San Francisco, Calif. 663.57 –6.62% $2.51 –10.51% 4.35%
369 REDW Wealth Albuquerque, N.M. 662.12 –5.46% $1.90 –7.36% 2.05%
FIRM NAME LOCATIONYEAR END
2018 ASSETS ($MM)*
% GROWTH IN ASSETS 2017-2018
ASSETS PER CLIENT
($MM)**
% CHANGE IN NO.
OF CLIENTS
% GROWTH IN ASSETSPER CLIENT
2018TOTAL ASSETS
RANK
FA’s 2019 RIA RANKING
* Discretionary and nondiscretionary AUM reported on Form ADV. ** Average assets per client relationship. NM = not meaningful.
This copy is for your personal, non-commercial use only. Reproductions and distribution of this news story are strictly prohibited.For reprints of the PDF contact Susanna Marra at 732-450-8866 ext 24, [email protected].
54.90% $1.70 2.60% 50.97%
–1.49% $4.20 –9.35% 8.67%
–5.66% $1.91 –5.89% 0.24%
47.82% $0.37 1.11% 46.20%
8.68% $4.00 –17.51% 31.76%
50.65% $0.89 11.91% 34.62%
–1.49% $4.20 –9.35% 8.67%
–5.66% $1.91 –5.89% 0.24%
47.82% $0.37 1.11% 46.20%
8.68% $4.00 –17.51% 31.76%
50.65% $0.89 11.91% 34.62%
–3.07% $1.44 –5.76% 2.86%
782.16 47.82% $0.37 1.11% 46.20%
780.85 8.68% $4.00 –17.51% 31.76%
777.74 50.65% $0.89 11.91% 34.62%
–3.07% $1.44 –5.76% 2.86%
774.81 –3.75% $0.54 –15.91% 14.46%
769.82 3.41% $2.07 –0.49% 3.91%
Carlsbad, Calif.
769.82
768.63
760.37
Denver, Colo.
Del Mar, Calif.
Houston, Texas
Edina, Minn.
Milwaukee, Wis
Weatherly Asset Management Del Mar, Calif.
Financial Synergies Wealth Advisors Houston, Texas
SilverOak Wealth Management Edina, Minn.
Northern Oak Wealth Management Milwaukee, Wis
YorkBridge Wealth Partners New York, N.Y.
Nadler Financial Group
Financial Synergies Wealth Advisors
SilverOak Wealth Management
342 Northern Oak Wealth Management
343 YorkBridge Wealth Partners
344 Nadler Financial Group
345 Bogart Wealth
346 Fund Direct Advisors
–3.75% $0.54 –15.91% 14.46%
3.41% $2.07 –0.49% 3.91%
10.48% $1.52 –1.94% 12.67%
1.12% $2.63 –2.38% 3.58%
–3.36% $2.08 –7.33% 4.29%
–6.01% $3.10 –2.55% –3.56%
3.41% $2.07 –0.49% 3.91%
10.48% $1.52 –1.94% 12.67%
1.12% $2.63 –2.38% 3.58%
–3.36% $2.08 –7.33% 4.29%
–6.01% $3.10 –2.55% –3.56%
1.49% $1.00 –5.70% 7.63%
5.60% $1.34 –10.11% 17.47%
10.48% $1.52 –1.94% 12.67%
1.12% $2.63 –2.38% 3.58%
–3.36% $2.08 –7.33% 4.29%
–6.01% $3.10 –2.55% –3.56%
1.49% $1.00 –5.70% 7.63%
5.60% $1.34 –10.11% 17.47%
1.12% $2.63 –2.38% 3.58%
. 758.43 –3.36% $2.08 –7.33% 4.29%
–6.01% $3.10 –2.55% –3.56%
749.33 1.49% $1.00 –5.70% 7.63%
748.14 5.60% $1.34 –10.11% 17.47%
10.37% $2.98 –33.78% 66.67%
742.89
748.14
741.44
Deerfi eld, Ill.
McLean, Va. 748.14
Greensboro, N.C.
Marietta, Ga.
Encino, Calif. 741.44
Carlsbad, Calif.
McLean, Va.
Greensboro, N.C.
Marietta, Ga.
Carlsbad, Calif.
McLean, Va.
Fund Direct Advisors Greensboro, N.C.
Narwhal Capital Management
SB Capital Management
Intelligence Driven Advisers
WealthSource Partners
Narwhal Capital Management
SB Capital Management
Intelligence Driven Advisers
Corrigan Financial
WealthSource Partners
The Insight Group

370 Aveo Capital Partners Greenwood Village, Colo. 660.01 –1.05% $0.69 –1.26% 0.21%
371 Medley & Brown Ridgeland, Miss. 651.00 –10.46% $1.25 –10.28% –0.19%
372 WBH Advisory Baltimore, Md. 637.86 –1.05% $1.22 –10.14% 10.13%
373 CRA Financial Northfi eld, N.J. 633.63 –1.25% $1.10 –10.19% 9.96%
374 Redwood Wealth Management Alpharetta, Ga. 631.85 –0.37% $1.03 0.28% –0.65%
375 Deerfi eld Financial Advisors Indianapolis, Ind. 629.05 –6.52% $1.95 –6.81% 0.31%
376 SPC Financial Rockville, Md. 628.03 –18.27% $0.65 –19.20% 1.15%
377 Sunrise Advisors Leawood, Kan. 620.81 7.41% $1.13 –14.70% 25.92%
378 Granite Investment Advisors Concord, N.H. 620.03 –9.76% $1.53 –12.21% 2.79%
379 Delta Financial Group Basking Ridge, N.J. 618.69 0.72% $1.03 –4.84% 5.84%
380 Hill Investment Group St. Louis, Mo. 615.50 –3.68% $2.86 –17.57% 16.85%
381 The McGowan Group Asset Management Dallas, Texas 614.92 –11.89% $0.65 –11.89% 0.00%
382 Azzad Asset Management Falls Church, Va. 614.77 2.77% $0.61 –7.51% 11.11%
383 Tradition Capital Management Summit, N.J. 611.60 –6.74% $2.15 –7.73% 1.06%
384 Traphagen Financial Group Oradell, N.J. 610.17 5.10% $0.50 –2.87% 8.21%
385 American Financial Advisors Marietta, Ga. 609.62 –5.57% $0.58 –18.55% 15.93%
386 Vintage Financial Services Ann Arbor, Mich. 608.40 4.04% $1.16 –4.91% 9.41%
387 Cabana Asset Management Fayetteville, Ark. 608.01 101.87% $0.17 63.94% 23.14%
388 Quadrant Private Wealth Bethlehem, Pa. 606.91 –1.02% $1.59 1.57% –2.55%
389 Vision Capital Management Portland, Ore. 604.89 3.67% $1.56 –3.03% 6.91%
390 ACG Advisory Services Midlothian, Va. 602.95 –7.00% $2.18 –11.36% 4.92%
391 Apella Capital Glastonbury, Conn. 600.00 5.26% $0.40 –5.26% 11.11%
392 Cahaba Wealth Management Atlanta, Ga. 593.05 2.19% $1.12 –10.37% 14.01%
393 Sather Financial Group Victoria, Texas 586.15 –0.49% $1.58 –9.90% 10.45%
394 MG&A Wealth Plantation, Fla. 583.70 2.00% $1.17 –8.20% 11.11%
395 PDS Planning Columbus, Ohio 572.21 1.19% $1.07 –4.88% 6.37%
396 Stepp & Rothwell Overland Park, Kan. 565.48 –11.24% $2.28 –11.95% 0.81%
397 Financial Advisory Corporation Grand Rapids, Mich. 563.21 –3.33% $3.08 –6.50% 3.39%
398 Archford Capital Strategies Swansea, Ill. 557.44 –19.81% $1.06 –23.15% 4.35%
399 Meridian Wealth Partners Blue Bell, Pa. 555.73 –16.25% $1.01 –34.71% 28.27%
400 St. Clair Advisors Mayfi eld Heights, Ohio 554.33 –2.85% $5.77 –17.02% 17.07%
401 Schaefer Financial Management Centennial, Colo. 554.29 –8.44% $1.80 –8.14% –0.32%
402 Stratford Consulting Addison, Texas 552.32 –2.20% $3.27 –3.36% 1.20%
403 Evermay Wealth Management Arlington, Va. 551.97 2.26% $1.64 –12.00% 16.21%
404 Seasons of Advice Wealth Management New York, N.Y. 547.00 4.03% $0.80 –0.56% 4.62%
405 Moisand Fitzgerald Tamayo Orlando, Fla. 543.38 –2.83% $0.98 –7.37% 4.91%
406 HTG Investment Advisors New Canaan, Conn. 541.63 –1.25% $1.79 –9.10% 8.63%
407 Briaud Financial Advisors College Station, Texas 539.70 2.16% $2.16 2.16% 0.00%
408 Blue Chip Partners Farmington Hills, Mich. 537.02 10.20% $1.25 –4.47% 15.36%
409 Southern Financial Group Birmingham, Ala. 535.55 –3.29% $0.28 3.49% –6.55%
410 3D Asset Management Hartford, Conn. 532.87 –7.67% $0.54 –13.25% 6.44%
411 Investec Advisory Group, LP Houston, Texas 531.67 –6.08% $1.88 –11.72% 6.39%
412 New England Investment & Retirement Group North Andover, Mass. 523.12 0.09% $0.70 –1.92% 2.05%
413 Mitchell Capital Management Leawood, Kan. 519.40 –6.30% $0.97 –8.21% 2.09%
414 Financial Planning and Information Services De Pere, Wis. 517.00 4.01% $0.55 –3.15% 7.39%
415 Alpha Fiduciary Phoenix, Ariz. 511.15 –7.50% $3.96 1.11% –8.51%
416 Pinkerton Retirement Specialists Coeur D Alene, Idaho 510.39 13.85% $0.73 8.16% 5.26%
417 PJS Investment Management Cedarburg, Wis. 509.04 –6.80% $1.74 –8.72% 2.10%
418 Richard P. Slaughter Associates Austin, Texas 507.39 2.83% $1.23 –1.41% 4.30%
419 Willis Johnson & Associates Houston, Texas 505.76 1.90% $1.59 –20.21% 27.71%
420 Blankinship & Foster Solana Beach, Calif. 503.92 –4.70% $2.07 –3.92% –0.81%
421 Northeast Financial Group Tannersville, Pa. 503.75 10.70% $0.44 –15.45% 30.92%
422 ARS Wealth Advisors St. Petersburg, Fla. 503.11 –0.30% $1.14 –5.97% 6.02%
FIRM NAME LOCATIONYEAR END
2018 ASSETS ($MM)*
% GROWTH IN ASSETS 2017-2018
ASSETS PER CLIENT
($MM)**
% CHANGE IN NO.
OF CLIENTS
% GROWTH IN ASSETSPER CLIENT
2018TOTAL ASSETS
RANK
FA’s 2019 RIA RANKING
* Discretionary and nondiscretionary AUM reported on Form ADV. ** Average assets per client relationship. NM = not meaningful.
This copy is for your personal, non-commercial use only. Reproductions and distribution of this news story are strictly prohibited.For reprints of the PDF contact Susanna Marra at 732-450-8866 ext 24, [email protected].
5.10% $0.50 –2.87% 8.21%
–5.57% $0.58 –18.55% 15.93%
4.04% $1.16 –4.91% 9.41%
101.87% $0.17 63.94% 23.14%
–1.02% $1.59 1.57% –2.55%
3.67% $1.56 –3.03% 6.91%
–5.57% $0.58 –18.55% 15.93%
4.04% $1.16 –4.91% 9.41%
101.87% $0.17 63.94% 23.14%
–1.02% $1.59 1.57% –2.55%
3.67% $1.56 –3.03% 6.91%
–7.00% $2.18 –11.36% 4.92%
608.01 101.87% $0.17 63.94% 23.14%
606.91 –1.02% $1.59 1.57% –2.55%
604.89 3.67% $1.56 –3.03% 6.91%
–7.00% $2.18 –11.36% 4.92%
600.00 5.26% $0.40 –5.26% 11.11%
593.05 2.19% $1.12 –10.37% 14.01%
606.91
593.05
583.70
Midlothian, Va.
Glastonbury, Conn.
Atlanta, Ga.
Victoria, Texas
Plantation, Fla.
Columbus, Ohio
Glastonbury, Conn.
Cahaba Wealth Management Atlanta, Ga.
Sather Financial Group Victoria, Texas
Plantation, Fla.
Columbus, Ohio
Stepp & Rothwell Overland Park, Kan.
Financial Advisory Corporation
Sather Financial Group
MG&A Wealth
395 PDS Planning
396 Stepp & Rothwell
397 Financial Advisory Corporation
398 Archford Capital Strategies
399 Meridian Wealth Partners
5.26% $0.40 –5.26% 11.11%
2.19% $1.12 –10.37% 14.01%
–0.49% $1.58 –9.90% 10.45%
2.00% $1.17 –8.20% 11.11%
1.19% $1.07 –4.88% 6.37%
–11.24% $2.28 –11.95% 0.81%
2.19% $1.12 –10.37% 14.01%
–0.49% $1.58 –9.90% 10.45%
2.00% $1.17 –8.20% 11.11%
1.19% $1.07 –4.88% 6.37%
–11.24% $2.28 –11.95% 0.81%
–3.33% $3.08 –6.50% 3.39%
–19.81% $1.06 –23.15% 4.35%
–0.49% $1.58 –9.90% 10.45%
2.00% $1.17 –8.20% 11.11%
1.19% $1.07 –4.88% 6.37%
–11.24% $2.28 –11.95% 0.81%
–3.33% $3.08 –6.50% 3.39%
–19.81% $1.06 –23.15% 4.35%
2.00% $1.17 –8.20% 11.11%
1.19% $1.07 –4.88% 6.37%
–11.24% $2.28 –11.95% 0.81%
563.21 –3.33% $3.08 –6.50% 3.39%
557.44 –19.81% $1.06 –23.15% 4.35%
–16.25% $1.01 –34.71% 28.27%
554.33
Overland Park, Kan.
Grand Rapids, Mich.
Swansea, Ill.
Blue Bell, Pa.
Mayfi eld Heights, Ohio
Centennial, Colo.
Addison, Texas
Swansea, Ill.
Mayfi eld Heights, Ohio
Swansea, Ill.
Meridian Wealth Partners
St. Clair Advisors Mayfi eld Heights, Ohio
Schaefer Financial Management
Stratford Consulting
Evermay Wealth Management
Seasons of Advice Wealth Management
St. Clair Advisors
Schaefer Financial Management
Stratford Consulting
Evermay Wealth Management
Seasons of Advice Wealth Management
Moisand Fitzgerald Tamayo

ASSET CATEGORY: $300 million to <$500 million
423 Stratos Wealth Advisors Beachwood, Ohio 494.63 NM $0.54 NM NM
424 FJY Financial Reston, Va. 493.26 –3.69% $1.44 –6.22% 2.70%
425 The Wealth Collaborative Westlake Village, Calif. 491.38 –3.79% $2.47 –12.01% 9.34%
426 Starfi re Investment Advisers Southfi eld, Mich. 483.64 2.84% $1.57 0.84% 1.99%
427 Red Door Wealth Management Memphis, Tenn. 481.03 37.07% $1.60 16.12% 18.04%
428 Socius Family Offi ce Fort Lauderdale, Fla. 477.69 22.22% $4.55 17.57% 3.96%
429 Concentus Wealth Advisors Berwyn, Pa. 477.68 –7.08% $2.09 –8.71% 1.78%
430 Jackson Financial Management Costa Mesa, Calif. 477.39 –2.55% $1.01 –5.65% 3.29%
431 Roof Advisory Group Harrisburg, Pa. 476.25 1.06% $2.11 –4.31% 5.61%
432 Greenline Partners New York, N.Y. 475.73 –5.69% $16.99 –5.69% 0.00%
433 Porter White & Company Birmingham, Ala. 474.44 –11.49% $4.61 –15.79% 5.10%
434 Fairman Group Family Offi ce Berwyn, Pa. 471.45 –3.50% $4.14 –11.11% 8.57%
435 Ellis Investment Partners Berwyn, Pa. 470.93 –0.97% $0.84 –9.76% 9.75%
436 The Arkansas Financial Group Little Rock, Ark. 467.14 –2.03% $1.52 –5.53% 3.70%
437 Financial Partners Capital Management New York, N.Y. 466.15 –44.74% $1.86 –36.34% –13.19%
438 Virtue Capital Management Brentwood, Tenn. 465.24 36.69% $0.10 102.51% –32.50%
439 Rappaport Reiches Capital Management Skokie, Ill. 463.96 –0.54% $1.76 –3.93% 3.53%
440 Patton Albertson Miller Group Chattanooga, Tenn. 459.16 –8.47% $1.73 –4.32% –4.33%
441 CapSouth Wealth Management Dothan, Ala. 455.36 –39.19% $1.34 –45.47% 11.51%
442 Harris Financial Advisors Torrance, Calif. 453.54 –4.57% $1.18 –7.31% 2.96%
443 Optima Asset Management Dallas, Texas 452.94 –11.86% $4.62 –32.55% 30.67%
444 WorthPointe San Diego, Calif. 451.38 –11.59% $0.96 –8.02% –3.89%
445 SkyOak Wealth Las Vegas, Nev. 450.00 12.50% $1.13 –1.56% 14.29%
446 J.P. King Advisors Walnut Creek, Calif. 445.40 –2.09% $1.24 –6.46% 4.68%
447 Total Wealth Planning Blue Ash, Ohio 444.67 –7.78% $1.14 –13.71% 6.87%
448 Janiczek Wealth Management Denver, Colo. 443.45 –13.40% $2.36 –9.25% –4.57%
449 ClearRock Capital Ketchum, Idaho 442.57 –2.87% $1.58 –1.48% –1.41%
450 Ariston Services Group San Diego, Calif. 437.09 1.54% $6.94 1.54% 0.00%
451 Droms Strauss Wealth Management St. Louis, Mo. 434.95 –6.11% $1.45 –6.11% 0.00%
452 BlueSky Wealth Advisors New Bern, N.C. 426.08 11.25% $1.52 6.10% 4.85%
453 The L. Warner Companies Timonium, Md. 421.18 –10.50% $1.42 –22.59% 15.63%
454 KMH Wealth Management Victoria, Texas 420.25 9.02% $1.01 6.65% 2.22%
455 Summit Wealth Partners Orlando, Fla. 412.53 –4.19% $0.88 –23.92% 25.94%
456 Asset Management Group Stamford, Conn. 410.60 –5.96% $1.59 –4.50% –1.53%
457 Halpern Financial Ashburn, Va. 409.22 6.73% $1.86 1.39% 5.26%
458 Frisch Financial Group Melville, N.Y. 409.09 –8.20% $0.96 –2.81% –5.56%
459 CIC Wealth Rockville, Md. 402.22 17.16% $0.72 0.39% 16.70%
460 Bernhardt Wealth Management McLean, Va. 398.91 –6.50% $1.43 –15.92% 11.20%
461 Schiavi + Dattani Wilmington, Del. 395.45 –2.13% $2.21 –12.52% 11.88%
462 Demming Financial Services Corporation Aurora, Ohio 394.11 –6.90% $0.49 –12.71% 6.67%
463 White Oaks Wealth Advisors Minneapolis, Minn. 393.39 –6.69% $1.46 –12.24% 6.32%
464 Investmark Advisory Group Shelton, Conn. 392.17 –29.84% $0.85 –31.67% 2.67%
465 Sikich Capital Management Springfi eld, Ill. 386.89 29.87% $0.32 34.43% –3.40%
466 Goodman Financial Corporation Houston, Texas 386.29 –1.38% $1.62 –5.52% 4.39%
467 Summit Wealth Strategies Chesterfi eld, Mo. 385.58 8.01% $0.28 –2.78% 11.10%
468 Vestory Seattle, Wash. 381.24 –8.23% $0.56 –7.42% –0.87%
469 Klaas Financial Asset Advisors Loves Park, Ill. 378.00 9.25% $0.39 7.43% 1.69%
470 Waller Financial Planning Group Columbus, Ohio 375.86 –6.71% $0.78 –9.03% 2.54%
471 Financial Symmetry Raleigh, N.C. 372.00 1.36% $0.79 –10.07% 12.71%
472 Birchwood Financial Partners Edina, Minn. 370.32 –0.87% $0.97 –2.18% 1.33%
473 Effi cient Wealth Management The Woodlands, Texas 368.91 0.79% $1.97 –6.21% 7.47%
474 Silverleaf Advisor Group Omaha, Neb. 368.30 11.42% $0.42 –8.06% 21.19%
FIRM NAME LOCATIONYEAR END
2018 ASSETS ($MM)*
% GROWTH IN ASSETS 2017-2018
ASSETS PER CLIENT
($MM)**
% CHANGE IN NO.
OF CLIENTS
% GROWTH IN ASSETSPER CLIENT
2018TOTAL ASSETS
RANK
FA’s 2019 RIA RANKING
* Discretionary and nondiscretionary AUM reported on Form ADV. ** Average assets per client relationship. NM = not meaningful.
This copy is for your personal, non-commercial use only. Reproductions and distribution of this news story are strictly prohibited.For reprints of the PDF contact Susanna Marra at 732-450-8866 ext 24, [email protected].
–2.03% $1.52 –5.53% 3.70%
–44.74% $1.86 –36.34% –13.19%
36.69% $0.10 102.51% –32.50%
–0.54% $1.76 –3.93% 3.53%
–8.47% $1.73 –4.32% –4.33%
–39.19% $1.34 –45.47% 11.51%
–44.74% $1.86 –36.34% –13.19%
36.69% $0.10 102.51% –32.50%
–0.54% $1.76 –3.93% 3.53%
–8.47% $1.73 –4.32% –4.33%
–39.19% $1.34 –45.47% 11.51%
–4.57% $1.18 –7.31% 2.96%
463.96 –0.54% $1.76 –3.93% 3.53%
459.16 –8.47% $1.73 –4.32% –4.33%
455.36 –39.19% $1.34 –45.47% 11.51%
–4.57% $1.18 –7.31% 2.96%
452.94 –11.86% $4.62 –32.55% 30.67%
451.38 –11.59% $0.96 –8.02% –3.89%
459.16
Torrance, Calif.
San Diego, Calif.
Las Vegas, Nev.
Walnut Creek, Calif.
Blue Ash, Ohio
Optima Asset Management
SkyOak Wealth Las Vegas, Nev.
J.P. King Advisors
Total Wealth Planning Blue Ash, Ohio
Janiczek Wealth Management Denver, Colo.
Ketchum, Idaho
SkyOak Wealth
446 J.P. King Advisors
447 Total Wealth Planning
448 Janiczek Wealth Management
449 ClearRock Capital
450 Ariston Services Group
451 Droms Strauss Wealth Management
–11.86% $4.62 –32.55% 30.67%
–11.59% $0.96 –8.02% –3.89%
12.50% $1.13 –1.56% 14.29%
–2.09% $1.24 –6.46% 4.68%
–7.78% $1.14 –13.71% 6.87%
–13.40% $2.36 –9.25% –4.57%
–11.59% $0.96 –8.02% –3.89%
12.50% $1.13 –1.56% 14.29%
–2.09% $1.24 –6.46% 4.68%
–7.78% $1.14 –13.71% 6.87%
–13.40% $2.36 –9.25% –4.57%
–2.87% $1.58 –1.48% –1.41%
1.54% $6.94 1.54% 0.00%
12.50% $1.13 –1.56% 14.29%
–2.09% $1.24 –6.46% 4.68%
–7.78% $1.14 –13.71% 6.87%
–13.40% $2.36 –9.25% –4.57%
–2.87% $1.58 –1.48% –1.41%
1.54% $6.94 1.54% 0.00%
–2.09% $1.24 –6.46% 4.68%
–7.78% $1.14 –13.71% 6.87%
443.45 –13.40% $2.36 –9.25% –4.57%
442.57 –2.87% $1.58 –1.48% –1.41%
437.09 1.54% $6.94 1.54% 0.00%
–6.11% $1.45 –6.11% 0.00%
426.08 426.08
421.18
Ketchum, Idaho
San Diego, Calif.
St. Louis, Mo.
New Bern, N.C. 426.08
Timonium, Md. 421.18
Victoria, Texas
San Diego, Calif.
Droms Strauss Wealth Management St. Louis, Mo.
New Bern, N.C.
Timonium, Md.
Orlando, Fla.
San Diego, Calif.
Droms Strauss Wealth Management
BlueSky Wealth Advisors
The L. Warner Companies Timonium, Md.
KMH Wealth Management
Summit Wealth Partners Orlando, Fla.
Asset Management Group Stamford, Conn.
BlueSky Wealth Advisors
The L. Warner Companies
KMH Wealth Management
Summit Wealth Partners
Asset Management Group
Halpern Financial

475 Financial Insights Tacoma, Wash. 367.97 10.81% $0.54 –13.74% 28.46%
476 Indie Asset Partners Indianapolis, Ind. 367.43 14.17% $1.51 –0.80% 15.09%
477 Marotta Wealth Management Charlottesville, Va. 365.54 1.29% $1.29 –18.76% 24.67%
478 J. W. Coons Advisors Columbus, Ohio 363.63 –6.05% $2.44 –5.42% –0.67%
479 Level Financial Advisors Amherst, N.Y. 348.33 –3.28% $0.58 –3.28% 0.00%
480 Jentner Wealth Management Akron, Ohio 345.31 –6.74% $1.25 –11.47% 5.34%
481 Meritas Wealth Managment Larkspur, Calif. 345.08 23.14% $2.10 29.90% –5.20%
482 Woodward Financial Advisors Chapel Hill, N.C. 344.42 3.08% $2.50 4.58% –1.43%
483 William Mack & Associates Troy, Mich. 341.65 –5.06% $0.67 –8.99% 4.31%
484 Rowling & Associates San Diego, Calif. 340.89 37.98% $1.16 28.16% 7.66%
485 Claro Advisors Boston, Mass. 339.67 38.60% $0.74 11.55% 24.25%
486 Elser Financial Planning Indianapolis, Ind. 334.13 11.37% $1.90 –6.98% 19.73%
487 Altrius Capital Management New Bern, N.C. 332.00 –4.60% $0.95 –8.69% 4.48%
488 Insight Wealth Partners Plano, Texas 331.78 –24.04% $0.59 –35.78% 18.28%
489 Tobias Financial Advisors Plantation, Fla. 331.00 1.85% $1.62 –11.13% 14.61%
490 First Ohio Planning Columbus, Ohio 330.00 4.70% $1.03 1.43% 3.23%
491 Net Worth Advisory Group Sandy, Utah 326.00 4.43% $0.79 –2.65% 7.27%
492 Grand Wealth Management Grand Rapids, Mich. 325.92 8.41% $2.40 –10.72% 21.43%
493 Hochman Cole Investment Advisors Deerfi eld, Ill. 322.96 –4.70% $1.76 –18.24% 16.56%
494 Integris Wealth Management Monterey, Calif. 322.78 6.92% $1.96 –4.10% 11.49%
495 Financial Insight Center Salt Lake City, Utah 317.82 13.77% $0.31 5.36% 7.98%
496 Hopwood Financial Services Reston, Va. 316.48 2.79% $1.48 –11.14% 15.68%
497 Mark Sheptoff Financial Planning Glastonbury, Conn. 315.55 10.72% $0.86 4.65% 5.80%
498 HFG Wealth Management The Woodlands, Texas 314.70 10.36% $1.14 –7.70% 19.57%
499 Heron Wealth New York, N.Y. 314.16 0.58% $2.05 –9.28% 10.87%
500 Apex Financial Advisors Yardley, Pa. 311.10 16.17% $4.15 8.43% 7.14%
501 Cedar Rowe Partners Atlanta, Ga. 309.17 –13.10% $2.81 –5.99% –7.56%
502 Next Generation Wealth Management Milwaukee, Wis. 307.34 8.92% $1.07 –1.33% 10.38%
503 Point View Wealth Management Summit, N.J. 306.78 –7.70% $1.84 –11.57% 4.38%
504 Wealth Care Merritt Island, Fla. 306.00 –8.38% $2.11 –16.60% 9.85%
505 Align Wealth Management Oklahoma City, Okla. 305.40 3.32% $1.49 –6.76% 10.81%
506 Gradient Capital Advisors San Diego, Calif. 301.13 0.18% $0.74 –3.02% 3.30%
507 Clune & Associates Chicago, Ill. 300.58 –7.08% $1.89 –13.51% 7.43%
ASSET CATEGORY: $150 million to <$300 million
508 WJ Interests Sugar Land, Texas 299.00 –8.56% $1.40 –10.27% 1.90%
509 Regency Wealth Management Ramsey, N.J. 296.80 15.87% $1.54 13.47% 2.12%
510 Century Wealth Management Memphis, Tenn. 296.63 10.02% $5.20 –1.56% 11.76%
511 Andrews, Lucia Wealth Management Danville, Calif. 294.17 –2.75% $1.82 –4.55% 1.89%
512 Court Place Advisors West Friendship, Md. 292.91 –6.09% $0.90 –8.98% 3.17%
513 W.A. Smith Financial Group Sandusky, Ohio 290.92 33.50% $0.27 20.19% 11.08%
514 Monument Wealth Management Alexandria, Va. 290.68 5.14% $1.54 1.80% 3.28%
515 Pinnacle Financial Group Western Springs, Ill. 284.91 –2.08% $0.92 –3.35% 1.31%
516 Wechter Feldman Wealth Management Parsippany, N.J. 274.66 –6.78% $1.78 –6.78% 0.00%
517 WFA Wealth Managers San Diego, Calif. 272.71 –7.01% $0.84 –11.58% 5.18%
518 W. H. Financial Appleton, Wis. 272.64 –7.62% $0.34 –8.55% 1.02%
519 PARAGON Wealth Strategies Jacksonville, Fla. 271.55 19.89% $1.06 2.09% 17.43%
520 Resolute Financial Newburyport, Mass. 269.71 5.26% $0.89 –0.32% 5.59%
521 CTS Financial Group Chicago, Ill. 264.17 11.94% $0.75 8.74% 2.94%
522 Asset Planning Cypress, Calif. 263.51 0.23% $0.88 –1.45% 1.71%
523 Palisade Investments Stateline, Nev. 263.08 4.03% $0.75 –10.45% 16.17%
524 Transitions Wealth Management Greenwood Village, Colo. 255.79 –2.62% $0.70 –8.76% 6.73%
525 Allodium Investment Consultants Minneapolis, Minn. 255.49 0.86% $1.26 –14.54% 18.02%
526 Inspire Investing Hollister, Calif. 251.78 92.43% $0.55 65.66% 16.16%
FIRM NAME LOCATIONYEAR END
2018 ASSETS ($MM)*
% GROWTH IN ASSETS 2017-2018
ASSETS PER CLIENT
($MM)**
% CHANGE IN NO.
OF CLIENTS
% GROWTH IN ASSETSPER CLIENT
2018TOTAL ASSETS
RANK
FA’s 2019 RIA RANKING
* Discretionary and nondiscretionary AUM reported on Form ADV. ** Average assets per client relationship. NM = not meaningful.
This copy is for your personal, non-commercial use only. Reproductions and distribution of this news story are strictly prohibited.For reprints of the PDF contact Susanna Marra at 732-450-8866 ext 24, [email protected].
1.85% $1.62 –11.13% 14.61%
4.70% $1.03 1.43% 3.23%
4.43% $0.79 –2.65% 7.27%
8.41% $2.40 –10.72% 21.43%
–4.70% $1.76 –18.24% 16.56%
6.92% $1.96 –4.10% 11.49%
4.70% $1.03 1.43% 3.23%
4.43% $0.79 –2.65% 7.27%
8.41% $2.40 –10.72% 21.43%
–4.70% $1.76 –18.24% 16.56%
6.92% $1.96 –4.10% 11.49%
13.77% $0.31 5.36% 7.98%
325.92 8.41% $2.40 –10.72% 21.43%
322.96 –4.70% $1.76 –18.24% 16.56%
322.78 6.92% $1.96 –4.10% 11.49%
13.77% $0.31 5.36% 7.98%
316.48 2.79% $1.48 –11.14% 15.68%
315.55 10.72% $0.86 4.65% 5.80%
322.96
Monterey, Calif. 322.78
Salt Lake City, Utah
Reston, Va.
Glastonbury, Conn.
The Woodlands, Texas
New York, N.Y.
Yardley, Pa.
Hopwood Financial Services
Mark Sheptoff Financial Planning Glastonbury, Conn.
HFG Wealth Management
New York, N.Y.
Apex Financial Advisors Yardley, Pa.
Cedar Rowe Partners Atlanta, Ga.
Next Generation Wealth Management
HFG Wealth Management
499 Heron Wealth
500 Apex Financial Advisors
501 Cedar Rowe Partners
502 Next Generation Wealth Management
503 Point View Wealth Management
504 Wealth Care
2.79% $1.48 –11.14% 15.68%
10.72% $0.86 4.65% 5.80%
10.36% $1.14 –7.70% 19.57%
0.58% $2.05 –9.28% 10.87%
16.17% $4.15 8.43% 7.14%
–13.10% $2.81 –5.99% –7.56%
10.72% $0.86 4.65% 5.80%
10.36% $1.14 –7.70% 19.57%
0.58% $2.05 –9.28% 10.87%
16.17% $4.15 8.43% 7.14%
–13.10% $2.81 –5.99% –7.56%
8.92% $1.07 –1.33% 10.38%
–7.70% $1.84 –11.57% 4.38%
10.36% $1.14 –7.70% 19.57%
0.58% $2.05 –9.28% 10.87%
16.17% $4.15 8.43% 7.14%
–13.10% $2.81 –5.99% –7.56%
8.92% $1.07 –1.33% 10.38%
–7.70% $1.84 –11.57% 4.38%
0.58% $2.05 –9.28% 10.87%
311.10 16.17% $4.15 8.43% 7.14%
309.17 –13.10% $2.81 –5.99% –7.56%
307.34 8.92% $1.07 –1.33% 10.38%
306.78 –7.70% $1.84 –11.57% 4.38%
306.00 –8.38% $2.11 –16.60% 9.85%
305.40
306.00
Milwaukee, Wis.
Summit, N.J.
Merritt Island, Fla.
Oklahoma City, Okla.
San Diego, Calif.
Chicago, Ill.
Summit, N.J.
Merritt Island, Fla.
Oklahoma City, Okla.
San Diego, Calif.
Chicago, Ill.
Point View Wealth Management
Merritt Island, Fla.
Align Wealth Management
Gradient Capital Advisors San Diego, Calif.
Chicago, Ill.
ASSET CATEGORY: $150 million to <$300 million
Sugar Land, Texas
Align Wealth Management
Gradient Capital Advisors
Clune & Associates
ASSET CATEGORY: $150 million to <$300 million
WJ Interests Sugar Land, Texas
Regency Wealth Management

527 Day & Ennis Macon, Ga. 249.75 4.47% $1.25 –0.75% 5.26%
528 Carolina Wealth Management Greenville, N.C. 248.47 –4.57% $0.59 –9.11% 5.00%
529 Cascade Investment Group Colorado Springs, Colo. 247.02 –14.58% $0.82 –21.70% 9.09%
530 Arista Wealth Management Las Vegas, Nev. 246.82 –53.24% $0.96 6.66% –56.16%
531 Cassady Schiller Wealth Management Cincinnati, Ohio 243.63 19.07% $1.05 –2.48% 22.11%
532 Manske Wealth Management Houston, Texas 243.00 14.62% $0.88 3.82% 10.40%
533 QP Consulting Takoma Park, Md. 241.82 –3.10% $5.04 –9.16% 6.67%
534 LJI Wealth Management Indianapolis, Ind. 240.00 17.07% $0.96 7.71% 8.70%
535 Interactive Financial Advisors Chicago, Ill. 238.56 12.53% $0.08 0.38% 12.10%
536 Horizon Wealth Advisors Houston, Texas 236.60 1.50% $1.92 –3.45% 5.13%
537 Anthony Smith Advisors Atlanta, Ga. 234.44 6.54% $1.37 –9.66% 17.93%
538 Wakefi eld Wealth Management Englewood, Colo. 233.28 –4.48% $1.53 –4.48% 0.00%
539 Navigoe Redondo Beach, Calif. 232.20 –8.29% $1.86 –11.96% 4.17%
540 Fortune Wealth Management Dallas, Texas 232.08 2.56% $1.12 –2.89% 5.61%
541 Searcy Financial Services Overland Park, Kan. 230.06 –6.18% $1.31 –14.76% 10.06%
542 Fi3 Financial Advisors Indianapolis, Ind. 229.09 53.69% $3.14 30.53% 17.74%
543 Poehling Capital Management Madison, Wis. 228.57 –17.84% $0.63 –15.59% –2.67%
544 Arbor Wealth Management Miramar Beach, Fla. 226.21 3.84% $0.78 –7.61% 12.40%
545 Ballast Lexington, Ky. 225.43 4.93% $0.83 19.15% –11.94%
546 Smedley Financial Services Salt Lake City, Utah 224.60 12.14% $0.26 7.62% 4.20%
547 Wilsey Asset Management San Diego, Calif. 224.50 8.54% $0.33 1.00% 7.47%
548 Alpha Financial Advisors Charlotte, N.C. 223.08 8.39% $1.14 0.65% 7.69%
549 Perspective Wealth Partners Boise, Idaho 223.07 4.78% $1.72 –4.09% 9.24%
550 Premia Global Advisors Coral Gables, Fla. 218.00 3.37% $4.84 –8.12% 12.50%
551 RMR Wealth Advisors Madison, Wis. 217.72 –1.74% $1.45 –8.29% 7.14%
552 Slayton Lewis Salt Lake City, Utah 217.69 11.63% $3.75 7.78% 3.57%
553 Integrated Wealth Management Scottsdale, Ariz. 217.30 8.11% $0.38 1.34% 6.68%
554 Trinity Financial Advisors Columbus, Ohio 214.89 2.85% $1.94 –6.42% 9.90%
555 MFA Wealth Pittsburgh, Pa. 212.80 –1.39% $0.49 –6.86% 5.87%
556 Morling Financial Advisors San Francisco, Calif. 212.60 6.48% $0.90 –1.19% 7.76%
557 Camarda Wealth Advisory Group Fleming Island, Fla. 211.34 –0.70% $0.50 –5.85% 5.47%
558 The Doman Group New York, N.Y. 211.00 27.11% $3.40 29.16% –1.59%
559 Castleview Wealth Advisors Oklahoma City, Okla. 209.00 81.74% $1.39 22.37% 48.51%
560 DeGreen Capital Management Scottsdale, Ariz. 207.40 –8.55% $0.77 –19.77% 13.98%
561 Asset Planning Corporation Knoxville, Tenn. 204.99 –2.96% $1.05 –7.42% 4.81%
562 Financial Alternatives La Jolla, Calif. 204.78 2.23% $1.69 –4.53% 7.08%
563 Baron Financial Group Fair Lawn, N.J. 203.42 –12.12% $0.75 –12.77% 0.74%
564 Spotlight Asset Group Oakbrook Terrace, Ill. 202.85 105.56% $1.08 –65.01% 487.50%
565 Mullooly Asset Management Wall, N.J. 199.48 3.10% $0.29 –0.16% 3.26%
566 Altruist Financial Advisors Holland, Mich. 198.29 –10.32% $6.84 –10.32% 0.00%
567 NCM Capital Management Ramsey, N.J. 196.00 2.62% $1.63 –10.21% 14.29%
568 Investment Advisory Professionals Boca Raton, Fla. 195.00 –7.45% $1.86 –11.86% 5.00%
569 Berno Financial Management Cincinnati, Ohio 194.30 –6.90% $1.63 –10.03% 3.48%
570 Zuraw Financial Advisors Greensboro, N.C. 193.77 1.88% $1.17 –6.14% 8.55%
571 Capital Investment Advisors Washington, D.C. 188.86 65.25% $0.44 47.27% 12.21%
572 Legacy Consulting Group Plano, Texas 188.59 3.97% $1.50 –0.98% 5.00%
573 Empyrion Wealth Management Roseville, Calif. 188.42 24.11% $2.36 21.01% 2.56%
574 Sard Wealth Management Group Atlanta, Ga. 186.95 16.91% $0.87 8.25% 8.00%
575 JVL Associates Wyoming, Mich. 186.22 14.24% $4.14 4.09% 9.76%
576 Marrs Wealth Management Ames, Iowa 186.20 8.15% $0.65 –2.36% 10.77%
577 Trinity Financial Advisors Chicago, Ill. 185.90 –11.29% $2.86 –14.02% 3.17%
578 Fiduciary Wealth Management Alexandria, Va. 185.53 4.52% $0.83 –6.73% 12.06%
579 Tull Financial Group Chesapeake, Va. 183.57 –4.56% $0.78 –5.77% 1.29%
FIRM NAME LOCATIONYEAR END
2018 ASSETS ($MM)*
% GROWTH IN ASSETS 2017-2018
ASSETS PER CLIENT
($MM)**
% CHANGE IN NO.
OF CLIENTS
% GROWTH IN ASSETSPER CLIENT
2018TOTAL ASSETS
RANK
FA’s 2019 RIA RANKING
* Discretionary and nondiscretionary AUM reported on Form ADV. ** Average assets per client relationship. NM = not meaningful.
This copy is for your personal, non-commercial use only. Reproductions and distribution of this news story are strictly prohibited.For reprints of the PDF contact Susanna Marra at 732-450-8866 ext 24, [email protected].
–6.18% $1.31 –14.76% 10.06%
53.69% $3.14 30.53% 17.74%
–17.84% $0.63 –15.59% –2.67%
3.84% $0.78 –7.61% 12.40%
4.93% $0.83 19.15% –11.94%
12.14% $0.26 7.62% 4.20%
53.69% $3.14 30.53% 17.74%
–17.84% $0.63 –15.59% –2.67%
3.84% $0.78 –7.61% 12.40%
4.93% $0.83 19.15% –11.94%
12.14% $0.26 7.62% 4.20%
8.54% $0.33 1.00% 7.47%
226.21
225.43 4.93% $0.83 19.15% –11.94%
224.60 12.14% $0.26 7.62% 4.20%
8.54% $0.33 1.00% 7.47%
223.08 8.39% $1.14 0.65% 7.69%
223.07 4.78% $1.72 –4.09% 9.24%
Salt Lake City, Utah
San Diego, Calif.
Boise, Idaho
Coral Gables, Fla.
Madison, Wis.
Salt Lake City, Utah
Perspective Wealth Partners
Premia Global Advisors
RMR Wealth Advisors Madison, Wis.
Integrated Wealth Management
Trinity Financial Advisors Columbus, Ohio
Premia Global Advisors
551 RMR Wealth Advisors
552 Slayton Lewis
553 Integrated Wealth Management
554 Trinity Financial Advisors
555 MFA Wealth Pittsburgh, Pa.
556 Morling Financial Advisors
8.39% $1.14 0.65% 7.69%
4.78% $1.72 –4.09% 9.24%
3.37% $4.84 –8.12% 12.50%
–1.74% $1.45 –8.29% 7.14%
11.63% $3.75 7.78% 3.57%
8.11% $0.38 1.34% 6.68%
4.78% $1.72 –4.09% 9.24%
3.37% $4.84 –8.12% 12.50%
–1.74% $1.45 –8.29% 7.14%
11.63% $3.75 7.78% 3.57%
8.11% $0.38 1.34% 6.68%
2.85% $1.94 –6.42% 9.90%
–1.39% $0.49 –6.86% 5.87%
3.37% $4.84 –8.12% 12.50%
–1.74% $1.45 –8.29% 7.14%
11.63% $3.75 7.78% 3.57%
8.11% $0.38 1.34% 6.68%
2.85% $1.94 –6.42% 9.90%
–1.39% $0.49 –6.86% 5.87%
–1.74% $1.45 –8.29% 7.14%
11.63% $3.75 7.78% 3.57%
217.30 8.11% $0.38 1.34% 6.68%
214.89 2.85% $1.94 –6.42% 9.90%
212.80 –1.39% $0.49 –6.86% 5.87%
6.48% $0.90 –1.19% 7.76%
211.34
Columbus, Ohio
Pittsburgh, Pa.
San Francisco, Calif.
Fleming Island, Fla.
New York, N.Y.
Oklahoma City, Okla.
Pittsburgh, Pa.
San Francisco, Calif.
Fleming Island, Fla.
New York, N.Y.
Oklahoma City, Okla.
Pittsburgh, Pa.
Morling Financial Advisors San Francisco, Calif.
Camarda Wealth Advisory Group
New York, N.Y.
Castleview Wealth Advisors
DeGreen Capital Management
Asset Planning Corporation
Camarda Wealth Advisory Group
The Doman Group
Castleview Wealth Advisors
DeGreen Capital Management
Asset Planning Corporation
Financial Alternatives
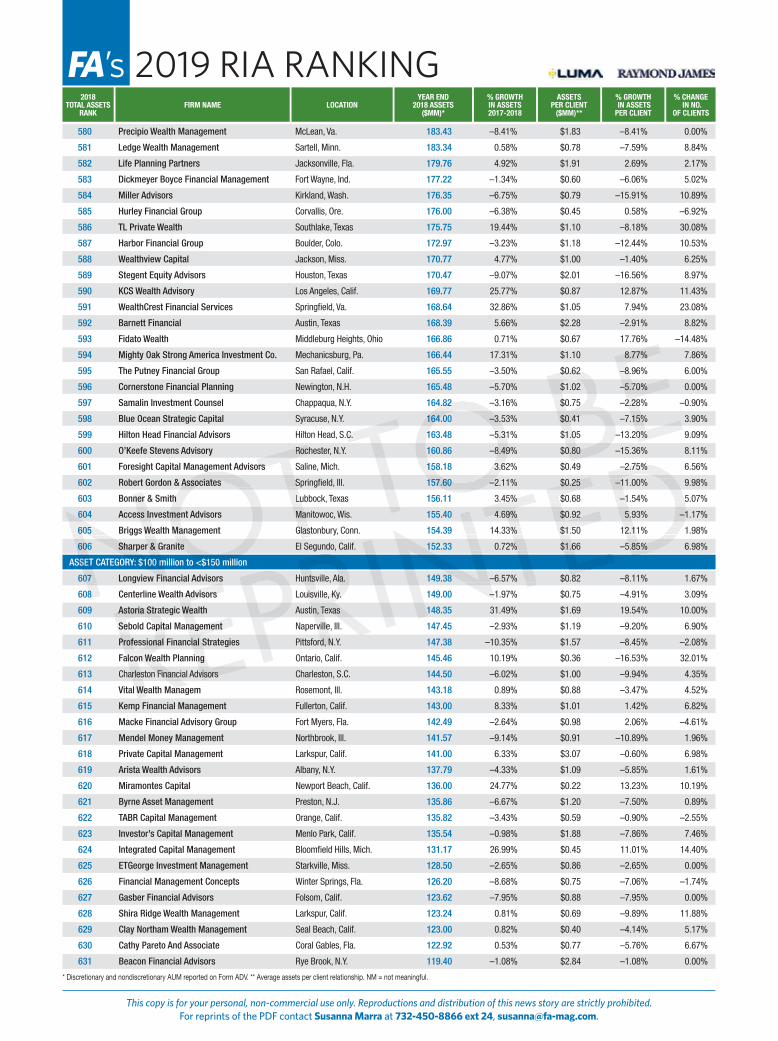
580 Precipio Wealth Management McLean, Va. 183.43 –8.41% $1.83 –8.41% 0.00%
581 Ledge Wealth Management Sartell, Minn. 183.34 0.58% $0.78 –7.59% 8.84%
582 Life Planning Partners Jacksonville, Fla. 179.76 4.92% $1.91 2.69% 2.17%
583 Dickmeyer Boyce Financial Management Fort Wayne, Ind. 177.22 –1.34% $0.60 –6.06% 5.02%
584 Miller Advisors Kirkland, Wash. 176.35 –6.75% $0.79 –15.91% 10.89%
585 Hurley Financial Group Corvallis, Ore. 176.00 –6.38% $0.45 0.58% –6.92%
586 TL Private Wealth Southlake, Texas 175.75 19.44% $1.10 –8.18% 30.08%
587 Harbor Financial Group Boulder, Colo. 172.97 –3.23% $1.18 –12.44% 10.53%
588 Wealthview Capital Jackson, Miss. 170.77 4.77% $1.00 –1.40% 6.25%
589 Stegent Equity Advisors Houston, Texas 170.47 –9.07% $2.01 –16.56% 8.97%
590 KCS Wealth Advisory Los Angeles, Calif. 169.77 25.77% $0.87 12.87% 11.43%
591 WealthCrest Financial Services Springfi eld, Va. 168.64 32.86% $1.05 7.94% 23.08%
592 Barnett Financial Austin, Texas 168.39 5.66% $2.28 –2.91% 8.82%
593 Fidato Wealth Middleburg Heights, Ohio 166.86 0.71% $0.67 17.76% –14.48%
594 Mighty Oak Strong America Investment Co. Mechanicsburg, Pa. 166.44 17.31% $1.10 8.77% 7.86%
595 The Putney Financial Group San Rafael, Calif. 165.55 –3.50% $0.62 –8.96% 6.00%
596 Cornerstone Financial Planning Newington, N.H. 165.48 –5.70% $1.02 –5.70% 0.00%
597 Samalin Investment Counsel Chappaqua, N.Y. 164.82 –3.16% $0.75 –2.28% –0.90%
598 Blue Ocean Strategic Capital Syracuse, N.Y. 164.00 –3.53% $0.41 –7.15% 3.90%
599 Hilton Head Financial Advisors Hilton Head, S.C. 163.48 –5.31% $1.05 –13.20% 9.09%
600 O’Keefe Stevens Advisory Rochester, N.Y. 160.86 –8.49% $0.80 –15.36% 8.11%
601 Foresight Capital Management Advisors Saline, Mich. 158.18 3.62% $0.49 –2.75% 6.56%
602 Robert Gordon & Associates Springfi eld, Ill. 157.60 –2.11% $0.25 –11.00% 9.98%
603 Bonner & Smith Lubbock, Texas 156.11 3.45% $0.68 –1.54% 5.07%
604 Access Investment Advisors Manitowoc, Wis. 155.40 4.69% $0.92 5.93% –1.17%
605 Briggs Wealth Management Glastonbury, Conn. 154.39 14.33% $1.50 12.11% 1.98%
606 Sharper & Granite El Segundo, Calif. 152.33 0.72% $1.66 –5.85% 6.98%
ASSET CATEGORY: $100 million to <$150 million
607 Longview Financial Advisors Huntsville, Ala. 149.38 –6.57% $0.82 –8.11% 1.67%
608 Centerline Wealth Advisors Louisville, Ky. 149.00 –1.97% $0.75 –4.91% 3.09%
609 Astoria Strategic Wealth Austin, Texas 148.35 31.49% $1.69 19.54% 10.00%
610 Sebold Capital Management Naperville, Ill. 147.45 –2.93% $1.19 –9.20% 6.90%
611 Professional Financial Strategies Pittsford, N.Y. 147.38 –10.35% $1.57 –8.45% –2.08%
612 Falcon Wealth Planning Ontario, Calif. 145.46 10.19% $0.36 –16.53% 32.01%
613 Charleston Financial Advisors Charleston, S.C. 144.50 –6.02% $1.00 –9.94% 4.35%
614 Vital Wealth Managem Rosemont, Ill. 143.18 0.89% $0.88 –3.47% 4.52%
615 Kemp Financial Management Fullerton, Calif. 143.00 8.33% $1.01 1.42% 6.82%
616 Macke Financial Advisory Group Fort Myers, Fla. 142.49 –2.64% $0.98 2.06% –4.61%
617 Mendel Money Management Northbrook, Ill. 141.57 –9.14% $0.91 –10.89% 1.96%
618 Private Capital Management Larkspur, Calif. 141.00 6.33% $3.07 –0.60% 6.98%
619 Arista Wealth Advisors Albany, N.Y. 137.79 –4.33% $1.09 –5.85% 1.61%
620 Miramontes Capital Newport Beach, Calif. 136.00 24.77% $0.22 13.23% 10.19%
621 Byrne Asset Management Preston, N.J. 135.86 –6.67% $1.20 –7.50% 0.89%
622 TABR Capital Management Orange, Calif. 135.82 –3.43% $0.59 –0.90% –2.55%
623 Investor’s Capital Management Menlo Park, Calif. 135.54 –0.98% $1.88 –7.86% 7.46%
624 Integrated Capital Management Bloomfi eld Hills, Mich. 131.17 26.99% $0.45 11.01% 14.40%
625 ETGeorge Investment Management Starkville, Miss. 128.50 –2.65% $0.86 –2.65% 0.00%
626 Financial Management Concepts Winter Springs, Fla. 126.20 –8.68% $0.75 –7.06% –1.74%
627 Gasber Financial Advisors Folsom, Calif. 123.62 –7.95% $0.88 –7.95% 0.00%
628 Shira Ridge Wealth Management Larkspur, Calif. 123.24 0.81% $0.69 –9.89% 11.88%
629 Clay Northam Wealth Management Seal Beach, Calif. 123.00 0.82% $0.40 –4.14% 5.17%
630 Cathy Pareto And Associate Coral Gables, Fla. 122.92 0.53% $0.77 –5.76% 6.67%
631 Beacon Financial Advisors Rye Brook, N.Y. 119.40 –1.08% $2.84 –1.08% 0.00%
FIRM NAME LOCATIONYEAR END
2018 ASSETS ($MM)*
% GROWTH IN ASSETS 2017-2018
ASSETS PER CLIENT
($MM)**
% CHANGE IN NO.
OF CLIENTS
% GROWTH IN ASSETSPER CLIENT
2018TOTAL ASSETS
RANK
FA’s 2019 RIA RANKING
* Discretionary and nondiscretionary AUM reported on Form ADV. ** Average assets per client relationship. NM = not meaningful.
This copy is for your personal, non-commercial use only. Reproductions and distribution of this news story are strictly prohibited.For reprints of the PDF contact Susanna Marra at 732-450-8866 ext 24, [email protected].
17.31% $1.10 8.77% 7.86%
–3.50% $0.62 –8.96% 6.00%
–5.70% $1.02 –5.70% 0.00%
–3.16% $0.75 –2.28% –0.90%
–3.53% $0.41 –7.15% 3.90%
–5.31% $1.05 –13.20% 9.09%
–3.50% $0.62 –8.96% 6.00%
–5.70% $1.02 –5.70% 0.00%
–3.16% $0.75 –2.28% –0.90%
–3.53% $0.41 –7.15% 3.90%
–5.31% $1.05 –13.20% 9.09%
–8.49% $0.80 –15.36% 8.11%
164.82 –3.16% $0.75 –2.28% –0.90%
164.00 –3.53% $0.41 –7.15% 3.90%
163.48 –5.31% $1.05 –13.20% 9.09%
–8.49% $0.80 –15.36% 8.11%
158.18 3.62% $0.49 –2.75% 6.56%
157.60 –2.11% $0.25 –11.00% 9.98%
Hilton Head, S.C.
Rochester, N.Y.
Foresight Capital Management Advisors Saline, Mich.
Springfi eld, Ill.
Lubbock, Texas
Manitowoc, Wis.
Glastonbury, Conn.
Foresight Capital Management Advisors
Robert Gordon & Associates Springfi eld, Ill.
Bonner & Smith
Access Investment Advisors
Briggs Wealth Management
Sharper & Granite
ASSET CATEGORY: $100 million to <$150 million
Bonner & Smith
604 Access Investment Advisors
605 Briggs Wealth Management
606 Sharper & Granite
ASSET CATEGORY: $100 million to <$150 million
607 Longview Financial Advisors
608 Centerline Wealth Advisors
3.62% $0.49 –2.75% 6.56%
–2.11% $0.25 –11.00% 9.98%
3.45% $0.68 –1.54% 5.07%
4.69% $0.92 5.93% –1.17%
14.33% $1.50 12.11% 1.98%
0.72% $1.66 –5.85% 6.98%
–2.11% $0.25 –11.00% 9.98%
3.45% $0.68 –1.54% 5.07%
4.69% $0.92 5.93% –1.17%
14.33% $1.50 12.11% 1.98%
0.72% $1.66 –5.85% 6.98%
–6.57% $0.82 –8.11% 1.67%
3.45% $0.68 –1.54% 5.07%
4.69% $0.92 5.93% –1.17%
14.33% $1.50 12.11% 1.98%
0.72% $1.66 –5.85% 6.98%
–6.57% $0.82 –8.11% 1.67%
4.69% $0.92 5.93% –1.17%
14.33% $1.50 12.11% 1.98%
0.72% $1.66 –5.85% 6.98%
149.38 –6.57% $0.82 –8.11% 1.67%
–1.97% $0.75 –4.91% 3.09%
148.35
Huntsville, Ala.
Louisville, Ky.
Austin, Texas
Naperville, Ill.
Pittsford, N.Y.
Huntsville, Ala. Longview Financial Advisors
Centerline Wealth Advisors
Astoria Strategic Wealth
Sebold Capital Management
Professional Financial Strategies
Falcon Wealth Planning
Charleston Financial Advisors Charleston, S.C.
Astoria Strategic Wealth
Sebold Capital Management
Professional Financial Strategies
Falcon Wealth Planning
Charleston Financial Advisors Charleston, S.C.
Vital Wealth Managem

632 Caissa Wealth Strategies Bloomington, Minn. 118.50 23.44% $1.39 7.46% 14.86%
633 Colman Knight Advisory Group Carlisle, Mass. 115.00 0.10% $1.53 1.43% –1.32%
634 Salvus Wealth Management Shrewsbury, N.J. 113.35 8.35% $1.08 –3.00% 11.70%
635 Purtill Financial Highland Heights, Ohio 110.52 7.88% $0.67 –3.24% 11.49%
636 Ivy League Financial Advisors Rockville, Md. 105.78 –13.12% $1.03 –13.12% 0.00%
637 HCO Private Wealth Roanoke, Va. 105.00 10.53% $0.86 –1.25% 11.93%
638 Gold Medal Waters Boulder, Colo. 103.39 0.20% $0.78 –14.11% 16.67%
639 Financial Investment Team Portland, Ore. 100.81 7.66% $0.27 –12.71% 23.33%
640 Paragon Wealth Management Provo, Utah 100.72 –2.02% $0.75 –0.56% –1.47%
641 BCK Partner Corning, N.Y. 100.59 3.70% $0.64 –10.26% 15.56%
642 Rebel Financial Columbus, Ohio 100.22 5.39% $0.29 –15.69% 25.00%
643 RHS Financial San Francisco, Calif. 100.16 –5.32% $0.93 –11.46% 6.93%
ASSET CATEGORY: <$100 million
644 Flagship Capital Management Media, Pa. 97.10 6.70% $0.84 3.92% 2.68%
645 Atwater Wealth Management Boston, Mass. 96.40 10.25% $1.27 5.90% 4.11%
646 G. DeWayne McAnally Oklahoma City, Okla. 94.00 10.59% $0.25 –4.16% 15.38%
647 Smith Bruer Advisors Tallahassee, Fla. 91.22 9.73% $0.70 –2.93% 13.04%
648 Lighthouse Wealth Management Ashland, Ohio 90.82 12.09% $0.30 6.91% 4.84%
649 Williams Wealth Management Group Bradenton, Fla. 90.00 7.14% $0.30 –1.79% 9.09%
650 Hanseatic Management Services Albuquerque, N.M. 88.41 –11.96% $1.28 26.32% –30.30%
651 Sage Future Financial Albuquerque, N.M. 86.68 4.01% $2.11 –3.60% 7.89%
652 Mosaic Wealth Management Atlanta, Ga. 77.24 11.72% $1.17 6.65% 4.76%
653 Foundation Wealth Management Media, Pa. 77.00 16.00% $1.10 2.75% 12.90%
654 Kotys Wealth Professionals Valparaiso, Ind. 75.06 9.34% $0.29 0.76% 8.51%
655 Elderado Financial Montrose, Colo. 74.80 –10.41% $0.29 –9.35% –1.17%
656 Snowball Wealth Management Louisville, Colo. 74.70 –21.78% $0.98 –24.87% 4.11%
657 S. P. Parkin & Co Chesterfi eld, Mo. 70.17 64.86% $0.90 35.27% 21.88%
658 International Capital Management Corp Dallas, Texas 63.89 –4.61% $1.21 –2.81% –1.85%
659 Sommers Financial Management St. Helens, Ore. 62.00 19.23% $0.19 11.89% 6.56%
660 The Dowling Group Greenwich, Conn. 60.57 –4.59% $0.76 –4.59% 0.00%
661 Chilmark Financial Advisors Miami, Fla. 60.33 –4.41% $1.02 10.17% –13.24%
662 Hofer & Associates Wealth Management Thousand Oaks, Calif. 60.28 33.85% $0.28 21.46% 10.20%
663 Graf Financial Baton Rouge, La. 55.52 –2.62% $0.72 –7.67% 5.48%
664 Ark Royal Wealth Management Raleigh, N.C. 54.45 –1.71% $1.65 –13.63% 13.79%
665 Clary Financial So. Easton, Mass. 50.00 0.00% $0.13 –6.25% 6.67%
666 Bills Asset Management Nashville, Tenn. 49.00 –10.91% $0.22 –16.85% 7.14%
667 Royal Asset Managers Saint Charles, Ill. 47.50 10.47% $1.25 4.65% 5.56%
668 Synergy Wealth Management Grand Rapids, Mich. 47.40 4.76% $0.18 –19.42% 30.00%
669 Safe Harbor Asset Management Huntington, N.Y. 46.61 32.88% $0.88 25.36% 6.00%
670 GLO CPAs Houston, Texas 45.00 –6.25% $0.75 1.56% –7.69%
671 Timmons Wealth Management Attleboro, Mass. 43.82 22.86% $0.51 0.00% 22.86%
672 Keating Wealth Management Greenwood Village, Colo. 41.92 12.11% $1.68 –23.77% 47.06%
673 Oak Street Advisors Myrtle Beach, S.C. 40.50 10.62% $0.42 6.06% 4.30%
674 First and Main Financial Piedmont, Calif. 36.00 12.50% $0.30 –6.25% 20.00%
675 Private Client Wealth Advisors Denver, Colo. 33.50 31.37% $0.27 –15.92% 56.25%
676 Shriver Investments Parker, Colo. 29.50 7.02% $0.41 4.05% 2.86%
677 Hamilton Financial Planning Austin, Texas 23.72 229.47% $0.30 45.97% 125.71%
678 3Sisters Sustainable Management Philadelphia, Pa. 21.44 –8.60% $0.86 –8.60% 0.00%
679 Freitag Financial Group Charlotte, N.C. 19.65 3.70% $0.66 –10.13% 15.38%
680 Afterburner Financial Round Rock, Texas 12.06 31.67% $0.17 –9.81% 46.00%
681 Carthage Financial Group Braintree, Mass. 7.50 0.00% $0.15 –20.00% 25.00%
682 Lindy S. Diamond, Personal Financial Services San Marcos, Calif. 5.68 –7.99% $1.42 –7.99% 0.00%
683 Atherean Wealth Management Jersey City, N.J. 4.07 38.31% $0.19 25.14% 10.53%
FIRM NAME LOCATIONYEAR END
2018 ASSETS ($MM)*
% GROWTH IN ASSETS 2017-2018
ASSETS PER CLIENT
($MM)**
% CHANGE IN NO.
OF CLIENTS
% GROWTH IN ASSETSPER CLIENT
2018TOTAL ASSETS
RANK
FA’s 2019 RIA RANKING
* Discretionary and nondiscretionary AUM reported on Form ADV. ** Average assets per client relationship. NM = not meaningful.
This copy is for your personal, non-commercial use only. Reproductions and distribution of this news story are strictly prohibited.For reprints of the PDF contact Susanna Marra at 732-450-8866 ext 24, [email protected].
10.25% $1.27 5.90% 4.11%
10.59% $0.25 –4.16% 15.38%
9.73% $0.70 –2.93% 13.04%
12.09% $0.30 6.91% 4.84%
7.14% $0.30 –1.79% 9.09%
–11.96% $1.28 26.32% –30.30%
10.59% $0.25 –4.16% 15.38%
9.73% $0.70 –2.93% 13.04%
12.09% $0.30 6.91% 4.84%
7.14% $0.30 –1.79% 9.09%
–11.96% $1.28 26.32% –30.30%
4.01% $2.11 –3.60% 7.89%
90.82 12.09% $0.30 6.91% 4.84%
90.00 7.14% $0.30 –1.79% 9.09%
–11.96% $1.28 26.32% –30.30%
4.01% $2.11 –3.60% 7.89%
77.24 11.72% $1.17 6.65% 4.76%
77.00 16.00% $1.10 2.75% 12.90%
Albuquerque, N.M.
Albuquerque, N.M.
Media, Pa.
Valparaiso, Ind.
Montrose, Colo.
Louisville, Colo.
Mosaic Wealth Management
Foundation Wealth Management
Kotys Wealth Professionals
Elderado Financial
Snowball Wealth Management Louisville, Colo.
S. P. Parkin & Co Chesterfi eld, Mo.
International Capital Management Corp
Kotys Wealth Professionals
655 Elderado Financial
656 Snowball Wealth Management
657 S. P. Parkin & Co
658 International Capital Management Corp
659 Sommers Financial Management
660 The Dowling Group
11.72% $1.17 6.65% 4.76%
16.00% $1.10 2.75% 12.90%
9.34% $0.29 0.76% 8.51%
–10.41% $0.29 –9.35% –1.17%
–21.78% $0.98 –24.87% 4.11%
64.86% $0.90 35.27% 21.88%
16.00% $1.10 2.75% 12.90%
9.34% $0.29 0.76% 8.51%
–10.41% $0.29 –9.35% –1.17%
–21.78% $0.98 –24.87% 4.11%
64.86% $0.90 35.27% 21.88%
–4.61% $1.21 –2.81% –1.85%
19.23% $0.19 11.89% 6.56%
9.34% $0.29 0.76% 8.51%
–10.41% $0.29 –9.35% –1.17%
–21.78% $0.98 –24.87% 4.11%
64.86% $0.90 35.27% 21.88%
–4.61% $1.21 –2.81% –1.85%
19.23% $0.19 11.89% 6.56%
–10.41% $0.29 –9.35% –1.17%
64.86% $0.90 35.27% 21.88%
63.89 –4.61% $1.21 –2.81% –1.85%
62.00
–4.59% $0.76 –4.59% 0.00%
Dallas, Texas
St. Helens, Ore.
Greenwich, Conn.
Miami, Fla.
Thousand Oaks, Calif.
Baton Rouge, La.
Sommers Financial Management
Greenwich, Conn.
Hofer & Associates Wealth Management
Raleigh, N.C.
Sommers Financial Management
The Dowling Group Greenwich, Conn.
Chilmark Financial Advisors
Hofer & Associates Wealth Management
Ark Royal Wealth Management Raleigh, N.C.
Chilmark Financial Advisors
Hofer & Associates Wealth Management
Graf Financial
Ark Royal Wealth Management
Clary Financial
Bills Asset Management


