
Surface finish improvement in ball nose end milling by optimizing...
13
Indian Journal of Engineering & Materials Sciences Vol. 22, February 2015, pp. 38-50 Surface finish improvement in ball nose end milling by optimizing operating conditions for different cutting times Charnnarong Saikaew a * & Paramet Baowan b a Department of Industrial Engineering, Khon Kaen University, Khon Kaen, 40002, Thailand b Department of Industrial Engineering, Rajamangala University of Technology Isan, Khon Kaen Campus, Khon Kaen 40000 Thailand Received 17 January 2014; accepted 27 August 2014 An important problem of ball nose end milling is degradation of the quality of machined surface for long run machining due to rapid tool wear. In this work, a practical solution to this problem by employing designed experiments (DOE) and response surface methodology (RSM) to determine optimal operating conditions with different tool cutting times is proposed. The significant cutting process factors and corresponding optimal operating conditions are found to depend on the cutting time. The machined surface finish produced by tools with different cutting times are verified by confirmation experiments and evaluated by pair comparison method at the optimal and non-optimal operating conditions. The results show that the optimal operating conditions of the process factors are different when machining with different cutting times. Surface roughness values are low and insignificantly different over a wider range of cutting time when machining at the optimal operating conditions. On the other hand, there are significant differences in all pair comparisons under non-optimal operating conditions. In addition, electron microscopic characterization confirmed that severe notch tool wear would not occur within short cutting time if the tool is operated at the optimal conditions. Therefore, the surface quality of machined parts as well as tool life could be effectively improved by the use of optimal operating conditions as a function of cutting time obtained by DOE and RSM. Keywords: Surface roughness, Ball nose end milling, Cutting time, Statistical analysis A main challenge in manufacturing technology such as milling process is to improve surface finish quality of products while minimizing machining time and production cost 1-7 . An effective approach to achieve this goal is to optimize cutting tools and machining conditions 8 . The effects of process factors such as cutting speed, depth of cut and feed per tooth on the quality of surface finish and tool life have continuously been widely studied over past decades 9 . For instance, a recent study on mould and die manufacturing showed that surface roughness of surface finish would be lower with the use of indexable-insert ball nose end mills (TiCN and TiAlCrYN coated carbide and uncoated cermet) than the use of solid tool (TiAlN-TiN coated carbide) but solid tool had substantially longer life-time than the insert tools for various cutting speeds 10 . In addition, the effects of various milling conditions on surface roughness had been studied simultaneously. Ding et al. 11 investigated the effects of step over, cutting speed, feed per tooth, and axial depth of cut on surface roughness in hard milling of AISI H13 steel with coated carbide tools. They found that surface roughness reduced when the axial depth of cut increased from 1 to 2 mm but became increasing rapidly as the axial depth of cut increased further to 3 mm. Zhang and Guo 12 optimized the step over and feed rate for end milling of hardened AISI H13 tool steel with TiAlN coated end mill, yielding a very low surface roughness of less than 0.1 μm. Likewise, Gologlu and Sakarya 13 found that step over was one of the most significant factors on surface roughness of 40CrMnNiMo8-4 DIN 1.2738 mould steel produced by different pocket milling operations. Moreover, Topal 14 reported that step over was a crucial factor affecting average surface roughness of flat end milled surface using predictive models based on artificial neural network methodology with average root mean square error for training and testing. Buj-Corral et al. 15 stated that surface roughness of ball-end- milled surface decreased more strongly with decreasing step over than decreasing feed rate. For analysis, control and optimization of these process factors, various predictive models for surface roughness as a function of operating factors have been developed. Erzurumlu and Oktem 16 employed the response surface model (RSM) and an artificial neural network (ANN) model to predict mould surface —————— *Corresponding author (E-mail: [email protected])
Transcript of Surface finish improvement in ball nose end milling by optimizing...

Indian Journal of Engineering & Materials Sciences
Vol. 22, February 2015, pp. 38-50
Surface finish improvement in ball nose end milling by optimizing operating
conditions for different cutting times
Charnnarong Saikaewa* & Paramet Baowan
b
aDepartment of Industrial Engineering, Khon Kaen University, Khon Kaen, 40002, Thailand bDepartment of Industrial Engineering, Rajamangala University of Technology Isan, Khon Kaen Campus, Khon Kaen 40000 Thailand
Received 17 January 2014; accepted 27 August 2014
An important problem of ball nose end milling is degradation of the quality of machined surface for long run machining
due to rapid tool wear. In this work, a practical solution to this problem by employing designed experiments (DOE) and
response surface methodology (RSM) to determine optimal operating conditions with different tool cutting times is
proposed. The significant cutting process factors and corresponding optimal operating conditions are found to depend on the
cutting time. The machined surface finish produced by tools with different cutting times are verified by confirmation
experiments and evaluated by pair comparison method at the optimal and non-optimal operating conditions. The results
show that the optimal operating conditions of the process factors are different when machining with different cutting times.
Surface roughness values are low and insignificantly different over a wider range of cutting time when machining at the
optimal operating conditions. On the other hand, there are significant differences in all pair comparisons under non-optimal
operating conditions. In addition, electron microscopic characterization confirmed that severe notch tool wear would not
occur within short cutting time if the tool is operated at the optimal conditions. Therefore, the surface quality of machined
parts as well as tool life could be effectively improved by the use of optimal operating conditions as a function of cutting
time obtained by DOE and RSM.
Keywords: Surface roughness, Ball nose end milling, Cutting time, Statistical analysis
A main challenge in manufacturing technology
such as milling process is to improve surface finish
quality of products while minimizing machining time
and production cost1-7
. An effective approach to
achieve this goal is to optimize cutting tools and
machining conditions8. The effects of process factors
such as cutting speed, depth of cut and feed per tooth
on the quality of surface finish and tool life have
continuously been widely studied over past decades9.
For instance, a recent study on mould and die
manufacturing showed that surface roughness of
surface finish would be lower with the use of
indexable-insert ball nose end mills (TiCN and
TiAlCrYN coated carbide and uncoated cermet) than
the use of solid tool (TiAlN-TiN coated carbide) but
solid tool had substantially longer life-time than the
insert tools for various cutting speeds10
. In addition, the effects of various milling conditions
on surface roughness had been studied simultaneously. Ding et al.
11 investigated the effects of step over,
cutting speed, feed per tooth, and axial depth of cut on surface roughness in hard milling of AISI H13 steel with coated carbide tools. They found that surface
roughness reduced when the axial depth of cut increased from 1 to 2 mm but became increasing rapidly as the axial depth of cut increased further to 3 mm. Zhang and Guo
12 optimized the step over and feed
rate for end milling of hardened AISI H13 tool steel with TiAlN coated end mill, yielding a very low surface roughness of less than 0.1 µm. Likewise, Gologlu and Sakarya
13 found that step over was one of
the most significant factors on surface roughness of 40CrMnNiMo8-4 DIN 1.2738 mould steel produced by different pocket milling operations. Moreover, Topal
14
reported that step over was a crucial factor affecting average surface roughness of flat end milled surface using predictive models based on artificial neural network methodology with average root mean square error for training and testing. Buj-Corral et al.
15 stated
that surface roughness of ball-end- milled surface decreased more strongly with decreasing step over than decreasing feed rate.
For analysis, control and optimization of these
process factors, various predictive models for surface
roughness as a function of operating factors have been
developed. Erzurumlu and Oktem16
employed the
response surface model (RSM) and an artificial neural
network (ANN) model to predict mould surface —————— *Corresponding author (E-mail: [email protected])

SAIKAEW & BAOWAN: SURFACE FINISH IMPROVEMENT IN BALL NOSE END MILLING
39
roughness in terms of cutting speed, feed rate, depth
of cut and machining tolerance for milling operations.
The results indicated that RSM provided fair accuracy
in predicting surface roughness within a range
of process factors while ANN model gave
better agreement with experimental measurements.
Zain et al.17
applied the regression and ANN models
to predict the minimum surface roughness value as a
function of cutting speed, feed rate and radial rake
angle for end milling of Ti-6Al-4V (Ti-64). Both
modeling approaches effectively yielded the
minimum surface roughness value matched with
experimental data while the regression model gave
better results compared with ANN. Raj et al.18
developed a mathematical model for predicting the
surface roughness of end-milled glass fiber reinforced
plastic composites in terms of cutting speed, feed rate,
depth of cut and tool material. The depth of cut and
tool material were found to be the most influential
main factors on surface roughness.
In general, surface finish quality is unavoidably
degraded with increasing cutting time due to tool
wear. The degradation is especially rapid and
significant for mould machining due to relatively high
hardness of mould. Traditionally, cutting tool is
operated continuously under a normal condition until
unacceptable quality of surface finish is observed.
This practice results in considerable loss of tools,
materials and process time. To reduce such losses,
tool should be operated under an optimal operating
condition, which may be adjusted according to tool
condition indicated by tool cutting time. Over
decades, many researchers have investigated and
optimized significant machining factors for optimal
quality characteristics of various machined parts using
design of experiments (DOE), response surface
methodology (RSM) and other evolutionary
techniques16,18-22
. However, they have never explored
the optimal operating conditions of the process factors
at different tool cutting times.
In this work, we proposed a practical solution to
improve tool life and surface finish quality by
operating the cutting tool under optimal operating
conditions that were periodically changed according
to tool cutting time. The significant process factors
and optimal operating conditions for different cutting
times were systematically determined by DOE and
RSM. In addition, the performances of cutting tools
operated at optimal and non-optimal operating
conditions were comparatively evaluated to assess the
effectiveness of the proposed method.
Experimental Procedure
Materials and machine
The work-piece material was AISI P20 steel for
plastic injection mould, which had an average
hardness of 30 HRC and chemical compositions as
shown in Table 1. Firstly, the work-piece was cleaned
by a standard cleaning procedure prior to each
machining experiment. Next, it was machined in
finishing operation to the final shape, which
comprised four regions including a round sector, a
horizontal plane and two inclined planes with 30° and
45° slopes as illustrated in Fig. 1. Ball nose end
Fig. 1—The work-piece designed for the experiments

INDIAN J. ENG. MATER. SCI., FEBRUARY 2015
40
milling experiments were carried out on a CNC
milling machine (MIKRON model VCE 750). The
cutting tools employed for finishing operation
were high speed steel (HSS) ball nose end mills
(OSG model HSS-Co 8%, 10 mm in diameter). The
CNC milling machine and HSS ball nose end mills
are illustrated in Fig. 2.
Procedure
A factorial design with additional four center
points was utilized to investigate the effects of
process factors on surface roughness of ball-nose-end-
milled AISI P20 mould steel. Four process factors
including spindle speed, feed per tooth, depth of cut,
and step over were chosen as factors for experimental
design since they were deemed to be important factors
affecting surface finish quality. The ranges
comprising low and high levels of process factors as
listed in Table 2 were obtained from recommended
values in tool catalog. In this work, the cutting time
was varied from 150 to 750 min with 150 min
increment. In each machining experiment, a cutting
tool was applied for continuous milling along the four
regions of mould (Fig. 1). Surface roughness of
finished work-piece was measured parallel to the feed
direction using a commercial surface analyzer
(Make-Mitutoyo 3D Surf tester) with a cut-off
distance of 0.8 mm. Roughness measurements were
performed in the four regions of mould surfaces with
three replications. The average and standard deviation
of roughness values were then computed from the raw
data and recorded in the experimental design matrix
as shown in Table 3. The surface morphologies of
cutting tools after machining experiments were
examined by scanning electron microscope (SEM)
to evaluate the effect of operating condition on
tool wear.
Statistical analysis
A normal probability analysis was used in order to
identify the significant main and interaction effects on
the quality characteristics (i.e., the average and
standard deviation of surface roughness values). In
this analysis, standardized main and interaction
effects of process factors were calculated and plotted
against cumulative normal probability (in percent).
Table 1—Chemical composition of the work-piece
material AISI P20 (wt%)
Carbon (C) Manganese (Mn) Chromium (Cr) Molybdenum (Mo)
0.4 1.5 1.9 0.2
Fig. 2—Photograph of CNC milling operation with the diagram of ball nose end mill used in all experiments
Table 2—Milling process factors for experimental design
Factor Low level High level Unit
Spindle speed (A) 2500 3500 rpm
Feed per tooth (B) 0.17 0.36 mm/tooth
Depth of cut (C) 0.1 0.2 mm
Step over (D) 0.1 0.2 mm

SAIKAEW & BAOWAN: SURFACE FINISH IMPROVEMENT IN BALL NOSE END MILLING
41
The effects that fell off from the main straight line
were deemed to be statistically significant while those
that followed along the straight line were considered
to be statistically insignificant23,24
. Main and
interaction effect plots were then constructed in order
to identify the best levels of the process factors, which
gave the minimum surface roughness. In addition,
RSM was applied to obtain the optimal operating
condition of significant process factors25
. The
optimization was conducted using the Design-Expert®
V7 software package26
, which used the optimization
method developed by Derringer and Suich27
and
described by Myer and Montgomery25
.
An analysis of variance (ANOVA) was then used
to identify if the average surface roughness of work-
pieces machined by tools for various cutting times
differed from one another28-30
. If ANOVA indicated a
significant difference, a pair comparison method
would be employed to specifically identify the
differences among results with different tool cutting
times. Differences between pair of average surface
roughness for a pair of two distinct tool cutting times
were evaluated using a test of hypothesis based on
Fisher least significant difference (LSD) method24
. If
any pair of average surface roughness for two
conditions or treatments (e.g., average surface
roughness with 150 min tool cutting time and that
with 300 min tool cutting time) differed in magnitude
by more than the LSD value, the corresponding pair
of surface roughness was considered to be
significantly different.
Results and Discussion
The complete results of average and standard
deviation of surface roughness for all experimental
conditions with different tool cutting times ranging
from 150 to 750 min are listed along with the process
factors of designed experiments in Table 3. In
particular, surface roughness values of all operating
conditions (run#1-20) with 150 min and 750 min tool
cutting times are plotted as shown in Fig. 3. It can be
seen that the average surface roughness values with
150 min cutting time are significantly different and
lower than those with 750 min cutting time for all
runs. In addition, longer tool cutting time tends to
cause large variations of surface roughness values
ranging under various operating conditions. The
results can be explained from the fact that long cutting
Table 3—Experimental design matrix with surface roughness results with various cutting times from 150 to 750 min
Factors
Surface roughness (µm) for various cutting
times (min)
Standard deviation (µm) for various
cutting times (min)
Runs
Spindle
speed (A)
Feed/
tooth (B)
Depth of
cut (C)
Step
over (D)
150 300 450 600 750 150 300 450 600 750
1 2500 0.24 0.1 0.1 1.03 1.15 1.38 1.74 1.81 0.39 0.41 0.42 0.53 0.39
2 3500 0.17 0.1 0.1 0.99 1.33 1.46 1.74 2.04 0.16 0.35 0.40 0.52 0.57
3 2500 0.36 0.1 0.1 1.23 1.69 1.70 2.09 2.49 0.60 0.62 0.58 0.37 0.56
4 3500 0.26 0.1 0.1 1.41 1.70 1.85 2.07 2.45 0.55 0.57 0.40 0.40 0.44
5 2500 0.24 0.2 0.1 0.97 1.12 2.20 2.60 3.27 0.17 0.17 0.31 0.38 0.42
6 3500 0.17 0.2 0.1 0.94 1.18 2.22 2.58 3.24 0.19 0.13 0.21 0.39 0.48
7 2500 0.36 0.2 0.1 1.40 1.77 2.49 3.16 3.59 0.67 0.57 0.28 0.50 0.60
8 3500 0.26 0.2 0.1 1.39 1.85 2.69 3.25 3.61 0.67 0.50 0.34 0.53 0.62
9 2500 0.24 0.1 0.2 1.81 1.92 2.07 2.18 2.40 0.94 0.65 0.59 0.56 0.56
10 3500 0.17 0.1 0.2 1.62 1.67 2.06 2.21 2.42 0.58 0.80 0.75 0.72 0.61
11 2500 0.36 0.1 0.2 2.20 2.32 2.39 2.58 3.17 1.28 0.99 0.96 0.91 0.74
12 3500 0.26 0.1 0.2 1.99 2.36 2.48 2.77 3.20 1.00 0.73 0.88 0.81 0.72
13 2500 0.24 0.2 0.2 1.92 2.30 2.82 2.94 3.77 0.76 0.52 0.71 0.72 0.75
14 3500 0.17 0.2 0.2 1.62 2.15 2.93 3.10 3.77 0.76 0.58 0.70 0.72 0.64
15 2500 0.36 0.2 0.2 1.84 2.35 3.54 3.80 4.11 1.04 0.66 0.64 0.66 0.70
16 3500 0.26 0.2 0.2 2.42 2.55 3.50 3.87 4.19 1.36 0.76 0.67 0.64 0.70
17 3000 0.25 0.15 0.15 1.72 1.80 2.34 2.54 3.03 0.67 0.65 0.43 0.50 0.59
18 3000 0.25 0.15 0.15 1.67 1.74 2.36 2.67 3.13 0.74 0.63 0.54 0.55 0.62
19 3000 0.25 0.15 0.15 1.68 1.80 2.41 2.72 3.10 0.61 0.63 0.63 0.50 0.56
20 3000 0.25 0.15 0.15 1.63 1.85 2.44 2.62 3.10 0.58 0.56 0.52 0.54 0.59

INDIAN J. ENG. MATER. SCI., FEBRUARY 2015
42
time naturally leads to tool wear, which will result in
poor cutting characteristics with large irregular chip
formation and high surface irregularity.
Figure 4 shows the normal probability plot of
effects of process factors on surface roughness for
finishing operations in ball nose end milling with
750 min cutting time. It can be seen that three main
process factors including feed per tooth, depth of cut,
and step over have significant influence on surface
roughness since their normal probability drop below
the main straight line. Similarly, one interaction effect
between feed per tooth and depth of cut is statistically
significant at 95% level of confidence. Plots of the
residuals for the full factorial design with additional
four center points as shown in Fig. 5 are used for
checking model adequacy. Figure 5a, a normal
probability plot of the residuals, suggests that there is
neither severe indication of non-normality nor any
evidence pointing to possible outliers. In addition,
Fig. 5b, plots of the residuals versus the predicted
values, reveals no correlation between the size of the
residuals and the predicted values. This means that the
variance of the surface roughness values is constant as
the magnitude of surface roughness values increases
and the surface roughness values should follow a
normal distribution. Figure 5c, plots of the residuals
in time order of surface roughness data collection,
indicates no correlation between the residuals and
confirms the assumption of error independency.
In running the factorial experiments, adding the
replicate runs at the design center provides protection
Fig. 3—Surface roughness results with 150 and 750 min cutting times
Fig. 4—Normal probability plot of effects of process factors on
surface roughness for finishing operation in ball nose end milling
using 750 min cutting time
SAIKAEW & BAOWAN: SURFACE FINISH IMPROVEMENT IN BALL NOSE END MILLING
43
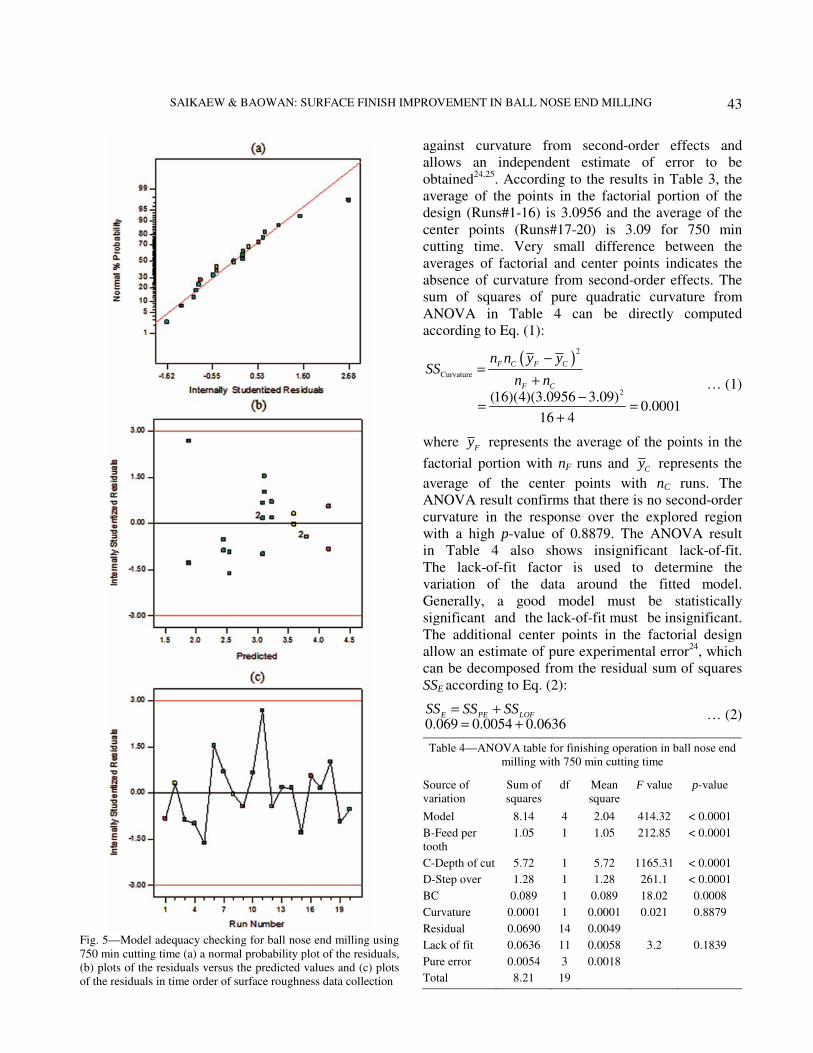
Fig. 5—Model adequacy checking for ball nose end milling using
750 min cutting time (a) a normal probability plot of the residuals,
(b) plots of the residuals versus the predicted values and (c) plots
of the residuals in time order of surface roughness data collection
against curvature from second-order effects and
allows an independent estimate of error to be
obtained24,25
. According to the results in Table 3, the
average of the points in the factorial portion of the
design (Runs#1-16) is 3.0956 and the average of the
center points (Runs#17-20) is 3.09 for 750 min
cutting time. Very small difference between the
averages of factorial and center points indicates the
absence of curvature from second-order effects. The
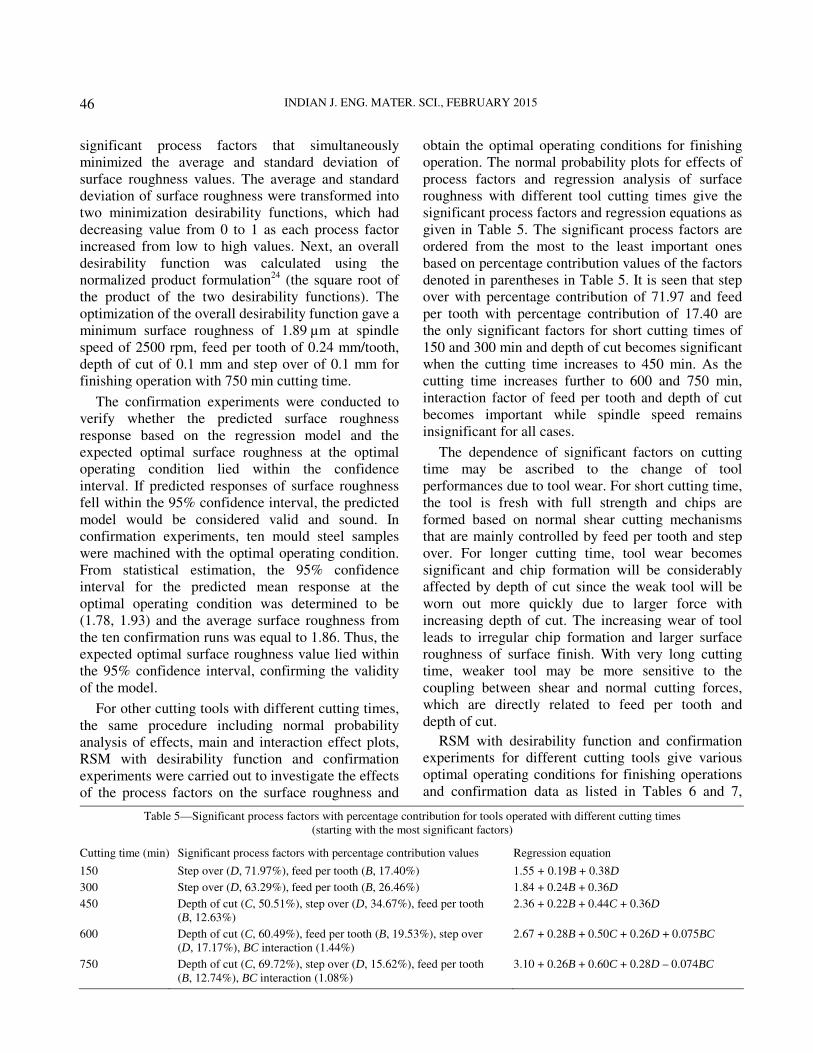
sum of squares of pure quadratic curvature from
ANOVA in Table 4 can be directly computed
according to Eq. (1):
( )2
Curvature
2(16)(4)(3.0956 3.09)0.0001
16 4
F C F C
F C
n n y ySS
n n
−=
+−
= =+
… (1)
where F
y represents the average of the points in the
factorial portion with nF runs and C
y represents the
average of the center points with nC runs. The
ANOVA result confirms that there is no second-order
curvature in the response over the explored region
with a high p-value of 0.8879. The ANOVA result
in Table 4 also shows insignificant lack-of-fit.
The lack-of-fit factor is used to determine the
variation of the data around the fitted model.
Generally, a good model must be statistically
significant and the lack-of-fit must be insignificant.
The additional center points in the factorial design
allow an estimate of pure experimental error24
, which
can be decomposed from the residual sum of squares
SSE according to Eq. (2):
0.069 0.0054 0.0636E PE LOF
SS SS SS= += +
… (2)
Table 4—ANOVA table for finishing operation in ball nose end
milling with 750 min cutting time
Source of
variation
Sum of
squares
df Mean
square
F value p-value
Model 8.14 4 2.04 414.32 < 0.0001
B-Feed per
tooth
1.05 1 1.05 212.85 < 0.0001
C-Depth of cut 5.72 1 5.72 1165.31 < 0.0001
D-Step over 1.28 1 1.28 261.1 < 0.0001
BC 0.089 1 0.089 18.02 0.0008
Curvature 0.0001 1 0.0001 0.021 0.8879
Residual 0.0690 14 0.0049
Lack of fit 0.0636 11 0.0058 3.2 0.1839
Pure error 0.0054 3 0.0018
Total 8.21 19

INDIAN J. ENG. MATER. SCI., FEBRUARY 2015
44
where SSPE is the sum of squares due to pure error and
SSLOF is the sum of squares due to lack-of-fit. The
statistical test for lack-of-fit can be determined from
Eq. (3):
0.00583.2
0.0018
LOF
LOF
PE
MSF
MS=
= =
… (3)
where MSLOF is the mean square due to lack-of-fit and
MSPE is the mean square due to pure error. The FLOF
value gives the corresponding p-value of 0.1839,
which indicates insignificant lack-of-fit. Hence, the
factorial design with additional four center point
model allows good fit of the outer points in the
factorial portion (insignificant lack of fit) as well as
the inner center points (insignificant curvature),
indicating sufficient information to adequately model
the true surface. Thus, it is not necessary to take more
sequential experimentation via additional
experimental runs at new levels of the significant
factors.
In order to interpret interaction effect more
effectively, an interaction plot between feed per tooth
and depth of cut is constructed as shown in Fig. 6.
The non-parallel lines of the two process factors
indicate significant interaction between them because
the effect of feed per tooth on the surface roughness is
different at low and high levels of depth of cut. This
result agrees with some previous reports, which
demonstrated that increasing feed per tooth and depth
of cut resulted in higher cutting forces and higher
surface roughness values31-35
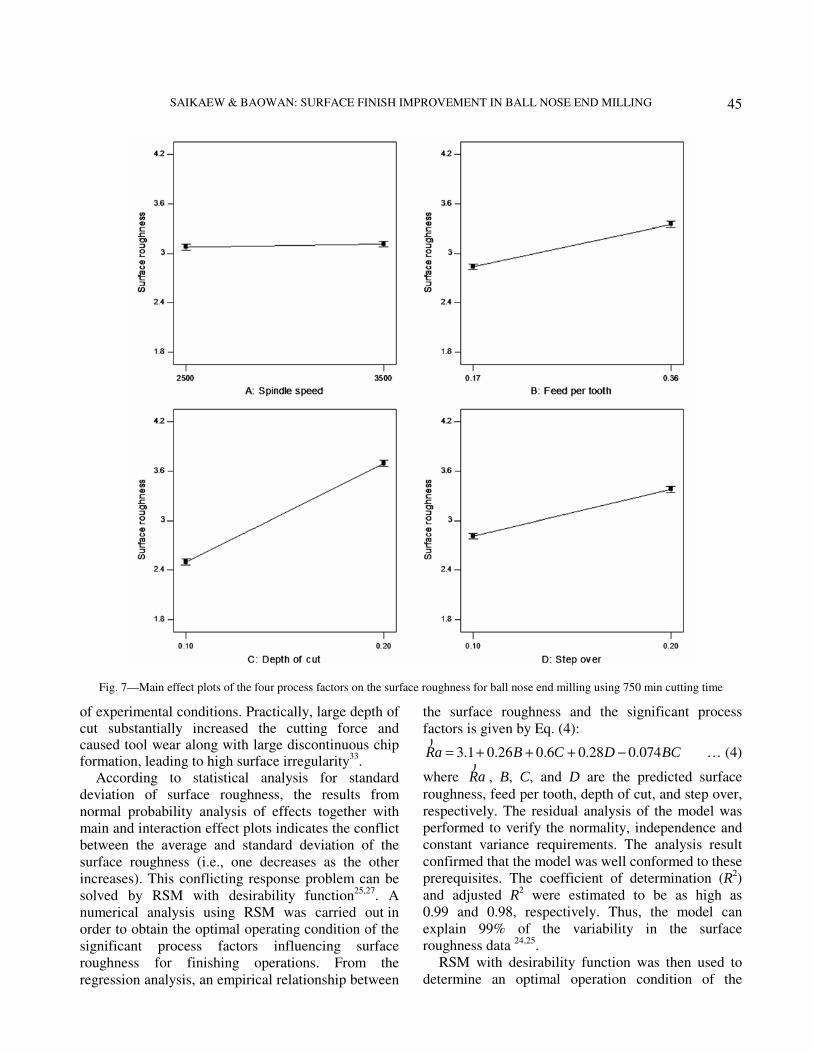
. Figure 7 illustrates main
effect plots of the three significant process factors
(feed per tooth, depth of cut, and step over) and non-
significant process factor (spindle speed) on the
surface roughness for 750 min cutting time. It is
evident that depth of cut is the most active factor
compared with the other two. The result is deviated
from the basic machining theory and many studies, in
which feed rate or feed per tooth is the most
influential factor on surface roughness. Yang et al.36
and Kivak37
reported that feed rate was the most
significant factor affecting surface roughness in dry
milling with different carbide inserts of high-purity
graphite and Hadfield steel (austenitic manganese
steel), respectively. Durakbasa et al.35
confirmed that
feed rate was the most effective factor on surface
roughness based on the linear model for the flat and
spherical surfaces of steel and aluminium. Sonawane
and Joshi31
reported that feed per tooth was a more
significant factor than depth of cut in a single-pass of
ball-end milling on Inconel 718. Theoretically, the
surface roughness on feed direction increased with the
square of feed per tooth since chip size would
significantly increase with feed rate due to enhanced
shear deformation36
.
In contrast, several other reports demonstrated that depth of cut was the most dominant factor on surface roughness of end-milled work pieces. Ding et al.
11
stated that depth of cut contributed the most to surface roughness whereas the interactions among other process factors provided secondary contribution to surface roughness in hard milling of AISI H13 steel with coated carbide tools. Raj et al.
18 found that
cutting speed and depth of cut and interactions among other process factors were the most influential main factors on surface roughness of glass fiber reinforced plastic composites after end milling operation. Ghani et al.
38 reported that depth of cut, cutting speed, and
feed rate are important main factors for end milling of hardened steel AISI H13 with TiN coated carbide insert tool. Yong et al.
34 demonstrated that depth of
cut, feed rate, the interaction of feed rate and depth of cut, and the quadratic term of depth of cut were the significant factors affecting surface roughness in end milling of nano-crystalline hydroxyapatite bioceramic using polycrystalline diamond insert. The deviations could be due to the fact that the theory does not take into account for factors of tool and work-piece materials as well as nonlinearity over different ranges
Fig. 6—Interaction plot between feed/tooth and depth of cut for
ball nose end milling using 750 min cutting time
SAIKAEW & BAOWAN: SURFACE FINISH IMPROVEMENT IN BALL NOSE END MILLING
45
of experimental conditions. Practically, large depth of cut substantially increased the cutting force and caused tool wear along with large discontinuous chip formation, leading to high surface irregularity
33.
According to statistical analysis for standard
deviation of surface roughness, the results from
normal probability analysis of effects together with
main and interaction effect plots indicates the conflict
between the average and standard deviation of the
surface roughness (i.e., one decreases as the other
increases). This conflicting response problem can be
solved by RSM with desirability function25,27
. A
numerical analysis using RSM was carried out in
order to obtain the optimal operating condition of the
significant process factors influencing surface
roughness for finishing operations. From the
regression analysis, an empirical relationship between
the surface roughness and the significant process
factors is given by Eq. (4):
3.1 0.26 0.6 0.28 0.074Ra B C D BC= + + + −)
… (4)
where Ra)
, B, C, and D are the predicted surface
roughness, feed per tooth, depth of cut, and step over,
respectively. The residual analysis of the model was
performed to verify the normality, independence and
constant variance requirements. The analysis result
confirmed that the model was well conformed to these
prerequisites. The coefficient of determination (R2)
and adjusted R2 were estimated to be as high as
0.99 and 0.98, respectively. Thus, the model can
explain 99% of the variability in the surface
roughness data 24,25
.
RSM with desirability function was then used to
determine an optimal operation condition of the
Fig. 7—Main effect plots of the four process factors on the surface roughness for ball nose end milling using 750 min cutting time
INDIAN J. ENG. MATER. SCI., FEBRUARY 2015
46
significant process factors that simultaneously
minimized the average and standard deviation of
surface roughness values. The average and standard
deviation of surface roughness were transformed into
two minimization desirability functions, which had
decreasing value from 0 to 1 as each process factor
increased from low to high values. Next, an overall
desirability function was calculated using the
normalized product formulation24
(the square root of
the product of the two desirability functions). The
optimization of the overall desirability function gave a
minimum surface roughness of 1.89 µm at spindle
speed of 2500 rpm, feed per tooth of 0.24 mm/tooth,
depth of cut of 0.1 mm and step over of 0.1 mm for
finishing operation with 750 min cutting time.
The confirmation experiments were conducted to
verify whether the predicted surface roughness
response based on the regression model and the
expected optimal surface roughness at the optimal
operating condition lied within the confidence
interval. If predicted responses of surface roughness
fell within the 95% confidence interval, the predicted
model would be considered valid and sound. In
confirmation experiments, ten mould steel samples
were machined with the optimal operating condition.
From statistical estimation, the 95% confidence
interval for the predicted mean response at the
optimal operating condition was determined to be
(1.78, 1.93) and the average surface roughness from
the ten confirmation runs was equal to 1.86. Thus, the
expected optimal surface roughness value lied within
the 95% confidence interval, confirming the validity
of the model.
For other cutting tools with different cutting times,
the same procedure including normal probability
analysis of effects, main and interaction effect plots,
RSM with desirability function and confirmation
experiments were carried out to investigate the effects
of the process factors on the surface roughness and
obtain the optimal operating conditions for finishing
operation. The normal probability plots for effects of
process factors and regression analysis of surface
roughness with different tool cutting times give the
significant process factors and regression equations as
given in Table 5. The significant process factors are
ordered from the most to the least important ones
based on percentage contribution values of the factors
denoted in parentheses in Table 5. It is seen that step
over with percentage contribution of 71.97 and feed
per tooth with percentage contribution of 17.40 are
the only significant factors for short cutting times of
150 and 300 min and depth of cut becomes significant
when the cutting time increases to 450 min. As the
cutting time increases further to 600 and 750 min,
interaction factor of feed per tooth and depth of cut
becomes important while spindle speed remains
insignificant for all cases.
The dependence of significant factors on cutting
time may be ascribed to the change of tool
performances due to tool wear. For short cutting time,
the tool is fresh with full strength and chips are
formed based on normal shear cutting mechanisms
that are mainly controlled by feed per tooth and step
over. For longer cutting time, tool wear becomes
significant and chip formation will be considerably
affected by depth of cut since the weak tool will be
worn out more quickly due to larger force with
increasing depth of cut. The increasing wear of tool
leads to irregular chip formation and larger surface
roughness of surface finish. With very long cutting
time, weaker tool may be more sensitive to the
coupling between shear and normal cutting forces,
which are directly related to feed per tooth and
depth of cut.
RSM with desirability function and confirmation
experiments for different cutting tools give various
optimal operating conditions for finishing operations
and confirmation data as listed in Tables 6 and 7,
Table 5—Significant process factors with percentage contribution for tools operated with different cutting times
(starting with the most significant factors)
Cutting time (min) Significant process factors with percentage contribution values Regression equation
150 Step over (D, 71.97%), feed per tooth (B, 17.40%) 1.55 + 0.19B + 0.38D
300 Step over (D, 63.29%), feed per tooth (B, 26.46%) 1.84 + 0.24B + 0.36D
450 Depth of cut (C, 50.51%), step over (D, 34.67%), feed per tooth
(B, 12.63%)
2.36 + 0.22B + 0.44C + 0.36D
600 Depth of cut (C, 60.49%), feed per tooth (B, 19.53%), step over
(D, 17.17%), BC interaction (1.44%)
2.67 + 0.28B + 0.50C + 0.26D + 0.075BC
750 Depth of cut (C, 69.72%), step over (D, 15.62%), feed per tooth
(B, 12.74%), BC interaction (1.08%)
3.10 + 0.26B + 0.60C + 0.28D – 0.074BC

SAIKAEW & BAOWAN: SURFACE FINISH IMPROVEMENT IN BALL NOSE END MILLING
47
respectively. From Table 6, the optimal surface
roughness considerably increases from 0.98 to
1.82 µm as the cutting time increases from 150 to
450 min and the optimal surface roughness became
almost constant as the cutting time increased further.
The results may be explained based on consideration
of tool wear under different optimal operating
conditions. The initial increase of optimal surface
roughness with cutting time can be ascribed to natural
tool flank wear due to shear deformation. For long
tool cutting time, the surface roughness may become
independent from the cutting time because further tool
wear could be minimized by the use of new optimal
operating conditions that result in much less severe
shear deformation. According to the data in Table 7,
the measured average surface roughness at the
optimal operating conditions for all cutting times lie
within the 95% confidence intervals, confirming the
validity and reproducibility of the optimal operating
conditions for finishing operations in ball nose end
milling of the mould steel. Figure 8 also illustrates
surface roughness values obtained from milling
operation at the optimal operating conditions
compared after confirmation experiments for cutting
tools operated with different cutting times. These
results confirm that there are no significant
differences of surface roughness values obtained from
the milling operation with the confirmation
experiments and the predictions by model are highly
accurate.
The surface finish and wear characteristic tools
with various cutting times at the optimal operating
conditions and non-optimal operating conditions were
further evaluated and compared. ANOVA of the
confirmation results with different cutting times
indicated that at least one average surface roughness
result of a case (e.g., 150 min cutting time) differed
from another case for different cutting times.
However, ANOVA could not specifically identify the
differences. Thus, a pair comparison with LSD
method was employed to determine the exact
differences among tools with different cutting times.
Tables 8 and 9 show the results of differences
between each pair of average surface roughness with
various cutting times at the optimal and non-optimal
operating conditions, respectively. It is seen that the
Table 6—Optimal operating conditions for tools with
different cutting times
Cutting
time (min)
Spindle
speed
(rpm)
Feed per
tooth
(mm/tooth)
Depth
of cut
(mm)
Step
over
(mm)
Surface
roughness
(µm)
150 3500 0.171 0.10 0.1 0.98
300 3460 0.173 0.20 0.1 1.24
450 3500 0.171 0.15 0.1 1.82
600 2500 0.300 0.10 0.1 1.96
750 2500 0.240 0.10 0.1 1.89
Table 7—Results of confirmation experiments
Cutting time
(min)
Average Surface
roughness (µm)
Lower of 95%
C.I. (µm)
Upper of 95%
C.I. (µm)
150 0.99 0.91 1.05
300 1.19 1.11 1.28
450 1.86 1.78 1.94
600 2.01 1.88 2.13
750 1.86 1.78 1.93
Table 8—Pair comparisons at optimal operating conditions
Treatment
pair
Mean
difference
df Standard
error
t for H0
Coeff = 0
Prob > |t|
150 vs 300 -0.2025 1 0.1346 -1.5049 *0.1531
150 vs 450 -0.8675 1 0.1346 -6.4467 < 0.0001
150 vs 600 -1.0100 1 0.1346 -7.5057 < 0.0001
150 vs 750 -0.8575 1 0.1346 -6.3724 < 0.0001
300 vs 450 -0.6650 1 0.1346 -4.9419 0.0002
300 vs 600 -0.8075 1 0.1346 -6.0009 < 0.0001
300 vs 750 -0.6550 1 0.1346 -4.8676 0.0002
450 vs 600 -0.1425 1 0.1346 -1.0590 *0.3064
450 vs 750 0.0100 1 0.1346 0.0743 *0.9417
600 vs 750 0.1525 1 0.1346 1.1333 *0.2749
*indicates not significant difference at the level of
significance 0.05
Fig. 8—Surface roughness values obtained from milling operation
at the optimal operating conditions compared after confirmation
experiments with different tool cutting times

INDIAN J. ENG. MATER. SCI., FEBRUARY 2015
48
average surface roughness are not significantly
different if the steel moulds are machined with the
optimal operating conditions using tools with cutting
times in the same range. The range of cutting time can
be divided into low range from 150 to 300 min and
high range from 450 to 750 min because the result of
150 min cutting time is not significantly dissimilar
from that of 300 min cutting time and the result of
450 min cutting time is not significantly different
from those of 600 min and 750 min cutting times.
This result agrees with the above observation in
Table 6 and may also be explained based on the
variation of tool wear under different optimal
operating conditions discussed earlier for Table 6.
However, there are some differences of results with
cutting times across the low and high ranges but the
differences are not large. On the other hand, there are
significant differences of average surface roughness
in all pair comparisons (i.e., 150 vs 300, 450 vs
600, etc.) when the mould steel was machined with
non-optimal operating conditions (Table 9).
Moreover, the average surface roughness substantially
increases as the cutting time increases when tools are
operated at non-optimal conditions. The results
indicate that non-optimal condition leads to severe
tool wear that is progressively increased with tool
cutting time. Therefore, the tool wear resistance and
surface quality of the mould can be greatly improved
if the cutting tool is operated at the optimal operating
conditions that are varied as function of cutting time.
The effect of optimal and non-optimal operating
conditions on tool wear was further examined by
SEM. Figures 9 (a) and (b) show typical SEM
micrographs of surface of tools for 450 min cutting
Table 9—Pair comparisons at non-optimal operating conditions
Treatment
pair
Mean
difference
df Standard
error
t for H0
Coeff = 0
Prob > |t|
150 vs 300 -0.1246 1 0.0363 -3.4349 0.0037
150 vs 450 -0.7165 1 0.0363 -19.7535 < 0.0001
150 vs 600 -0.9604 1 0.0363 -26.4797 < 0.0001
150 vs 750 -1.4179 1 0.0363 -39.0935 < 0.0001
300 vs 450 -0.5919 1 0.0363 -16.3186 < 0.0001
300 vs 600 -0.8358 1 0.0363 -23.0448 < 0.0001
300 vs 750 -1.2933 1 0.0363 -35.6586 < 0.0001
450 vs 600 -0.2440 1 0.0363 -6.7262 < 0.0001
450 vs 750 -0.7015 1 0.0363 -19.3400 < 0.0001
600 vs 750 -0.4575 1 0.0363 -12.6138 < 0.0001
Fig. 9—Typical SEM micrographs of surface of tools operated with 450 min cutting time (a) under optimal operating operation and
(b) non-optimal operating operation.
SAIKAEW & BAOWAN: SURFACE FINISH IMPROVEMENT IN BALL NOSE END MILLING
49
time operated under the optimal and non-optimal
operating conditions, respectively. It is seen that tool
operated under non-optimal operating condition
(Fig. 9b) exhibits a severe notch wear on the cutting
edge of the ball nose end mill while that operated
under optimal operating condition shows much
weaker flank wear on the flank face (Fig. 9a). The
occurrence of notch wear signified severe tool
damage that occurred within a short cutting time
when tools operated under a non-optimal operating
condition while much less tool damage would take
place if optimal operating conditions were used.
Nevertheless, the weak flank wear occurred under
optimal operating condition after 450 min also
signifies considerable degradation of tool
performances. This observation supported the above
significant factor analysis that tool wear occurred
after cutting time of ≥ 450 min could cause depth of
cut to become significant factor affecting surface
finish. The much less severe tool wear with optimal
operating conditions may be attributed to appropriate
cutting force produced at moderate feed per tooth,
depth of cut and step over. These results demonstrate
that the tool wear and tool life can be significantly
improved by the use of optimal operating conditions
as a function of cutting time determined from DOE
and RSM approaches.
Conclusions
The rapid degradation of mould’s surface finish
quality problem for increasing cutting time has been
effectively solved by employing DOE and RSM. The
significant process factors and corresponding optimal
operating conditions of tools with different cutting
times were determined by normal probability analysis
and RSM with desirability function. The optimal
operating conditions of the process factors were
different when machining at different cutting times.
The reproducibility and performance of tools with
different cutting times operated at optimal operating
conditions were successfully verified by confirmation
experiments and pair comparison with LSD method.
The quality of surface finish of AISI P20 steel for
plastic injection mould produced by high speed steel
ball nose end mills with different cutting times was
found to be high and insignificantly different over a
wider range of cutting time if optimal operating
conditions were used and adjusted according to tool
cutting time. Moreover, the improvements of tool
wear resistance and surface finish were qualitatively
confirmed by SEM characterization. Consequently,
machining at optimal operating conditions with
different cutting times would increase tool life and
reduce machining time and cost while maintaining
satisfactory product quality.
Acknowledgements The authors would like to thank Khon Kaen
University for financial support for this study.
References 1 Oktem H, Erzurumlu T & Erzincanli F, Mater Des,
27 (2006) 735-744.
2 Xu A P, Qu Y X, Zhang D W & Huang T, Int J Mach Tools
Manuf, 43 (2003) 283-292.
3 Grzesik W, Advanced machining processes of metallic
materials (Elsevier, Amsterdam), 2008.
4 Lopez de Lacalle L N, Lamikiz A, Sanchez J A & Arana J L,
J Mater Process Technol, 123 (2002) 292-302.
5 Dewes R C & Aspinwall D K, J Mater Process Technol,
69 (1997) 1-17.
6 D’Errico G E, Guglielmi E & Rutelli G, J Mater Process
Technol, 92-93 (1999) 251-256.
7 Juan H, Yu S F & Lee B Y, Int J Mach Tools Manuf,
43 (2003) 679-686.
8 Sahin Y & Motorcu A R, Mater Des, 26 (2005) 321-326.
9 Arrazola P J, Ozel T, Umbrello D, Davies M & Jawahir I S,
CIRP Ann Manuf Technol, 62 (2013) 695-718.
10 Urbanski J P, Koshy P, Dewes R C & Aspinwall D K, Mater
Des, 21 (2000) 395-402.
11 Ding T, Zhang S, Wang Y & Zhu X, Int J Adv Manuf
Technol, 51 (2010) 45-55.
12 Zhang S & Guo Y B, ASME J Manuf Sci Eng, 131 (2009)
051003-1-9.
13 Gologlu C & Sakarya N, J Mater Process Technol, 206
(2008) 7-15.
14 Topal E S, Int J Mech Sci, 51 (2009) 782-789.
15 Buj-Corral I, Vivancos-Calvet J & Dominguez-Fernandez A,
Int J Mach Tools Manuf, 53 (2012) 151-159.
16 Erzurumlu T & Oktem H, Mater Des, 28 (2007) 459-465.
17 Zain A M, Haron H, Qasem S N & Sharif S, Appl Math
Model, 36 (2012) 1477-1492.
18 Raj P P, Perumal A E & Ramu P, Indian J Eng Mater Sc,
19 (2012) 107-120.
19 Alauddin M, Baradie M A & Hashmi M S J, J Mater Process
Technol, 56 (1996) 54-65.
20 Arruda E M, Brandão L C, Filho S L M R & Oliveira J A,
Measurement, 47 (2014)54-63.
21 Yusap N, Zain A M & Hashim S Z M, Expert Syst Appl,
39 (2012) 9909-9927.
22 Zain A M, Haron H & Sharif S, Int J Comput Integr Manuf,
24 (2011) 574-592.
23 Daniel C, Technometrics, 1 (1995) 311-342.
24 Montgomery D C, Design and analysis of experiments,
6th ed, (Wiley, New York), 2005.
25 Myers R H & Montgomery D C, Response surface
methodology process and product optimization using
designed experiments, 2nd ed, (Wiley, New York), 2002.

INDIAN J. ENG. MATER. SCI., FEBRUARY 2015
50
26 StatEase Inc, Design Expert 7 user’s guide, (Minneapolis), 2005.
27 Derringer G & Suich R, J Quality Technol, 12 (1980) 214-219.
28 Ramanujam R, Muthukrishnan N & Raji R, Int J Precis Eng
Manuf, 12 (2011) 651-656. 29 Babu T S M & Krishnan N M, Scholarly J Eng Res,
1(2) (2012) 25-31. 30 Somashekara H M & Swamy N L, Int J Eng Sci Technol,
4 (2012) 1967-1973. 31 Sonawane H A & Joshi S S, J Manuf Process, 14 (2012)
257-268. 32 Korkut I & Donertas M A, Mater Des, 28 (2007)
308-312.
33 Savas V & Ozay C, J Mater Process Technol, 186 (2007)
279-283.
34 Yong Y, Kulkarni S S, Rys M & Lei S, Ceram Int, 38 (2012)
6865-6871.
35 Durakbasa M N, Osanna P H & Demircioglu P,
Measurement, 44 (2011) 1986–1999.
36 Yang Y K, Chung M T & Lin S S, J Mater Process Technol,
209 (2009) 4395-4400.
37 Kivak T, Measurement, 50 (2014) 19-28.
38 Ghani J A , Choudhury I A & Hassan H H, J Mater Process
Technol, 145 (2004) 84-92.