Supreme Flour World Wheat Presentation (March 2014)
16
WORLD WHEAT Source: US Wheat Associates monthly supply and demand report, found on their website: http://www.uswheat.org/
-
Upload
supreme-flour -
Category
Economy & Finance
-
view
153 -
download
0
Transcript of Supreme Flour World Wheat Presentation (March 2014)

WORLD WHEAT
Source: US Wheat Associates monthly supply and demand report, found on their website: http://www.uswheat.org/
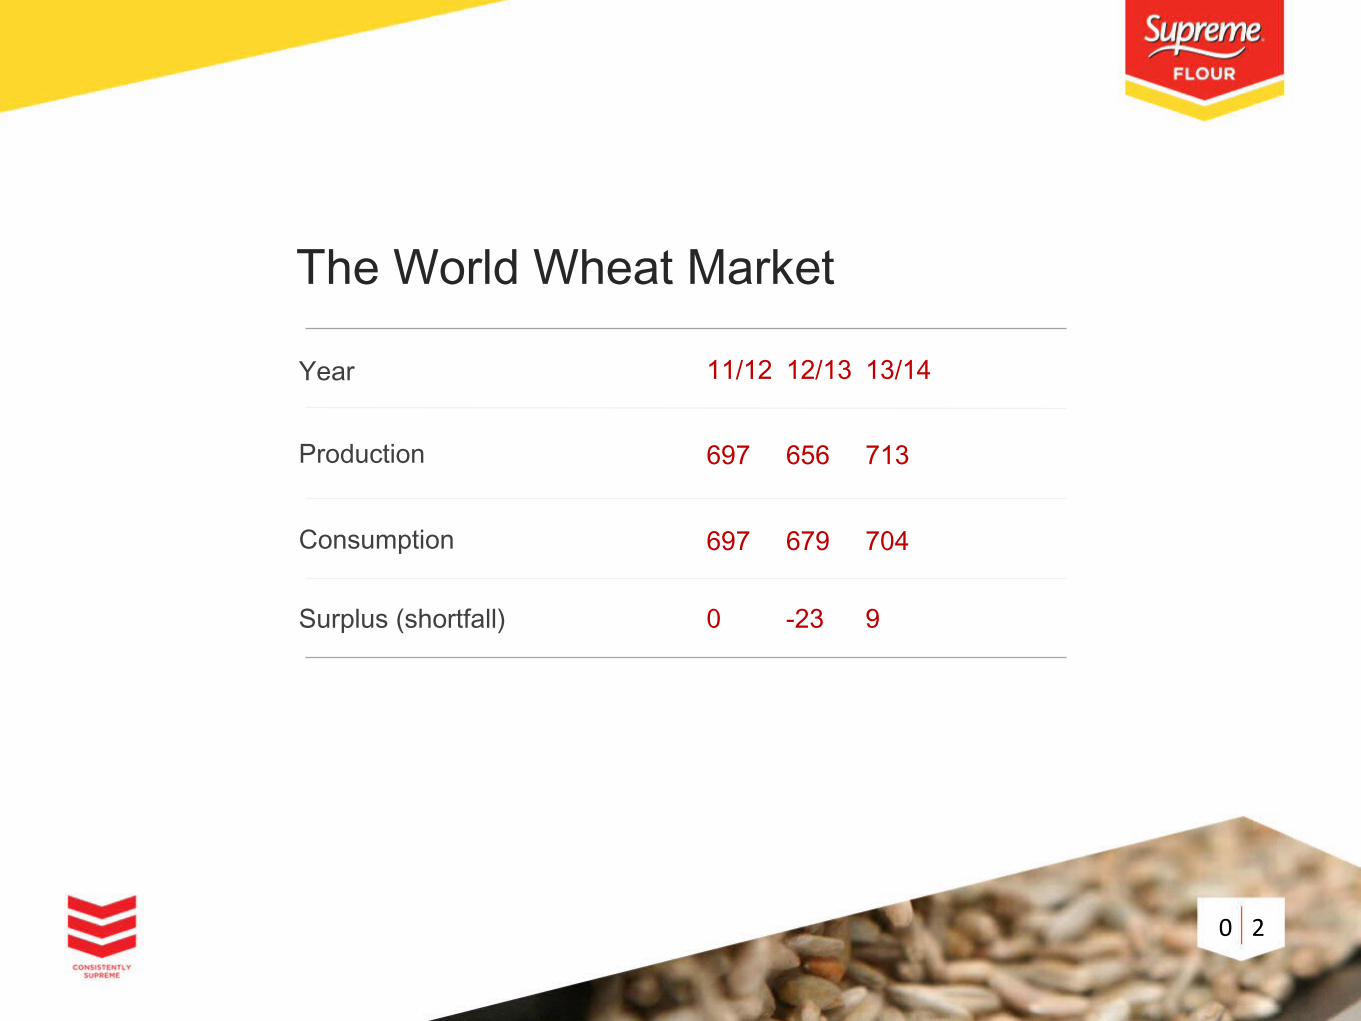
The World Wheat Market
Year
Production
Consumption
Surplus (shortfall)
11/12 12/13 13/14
697 656 713
697 679 704
0 -23 9
0 2

World Production and Use
0 3
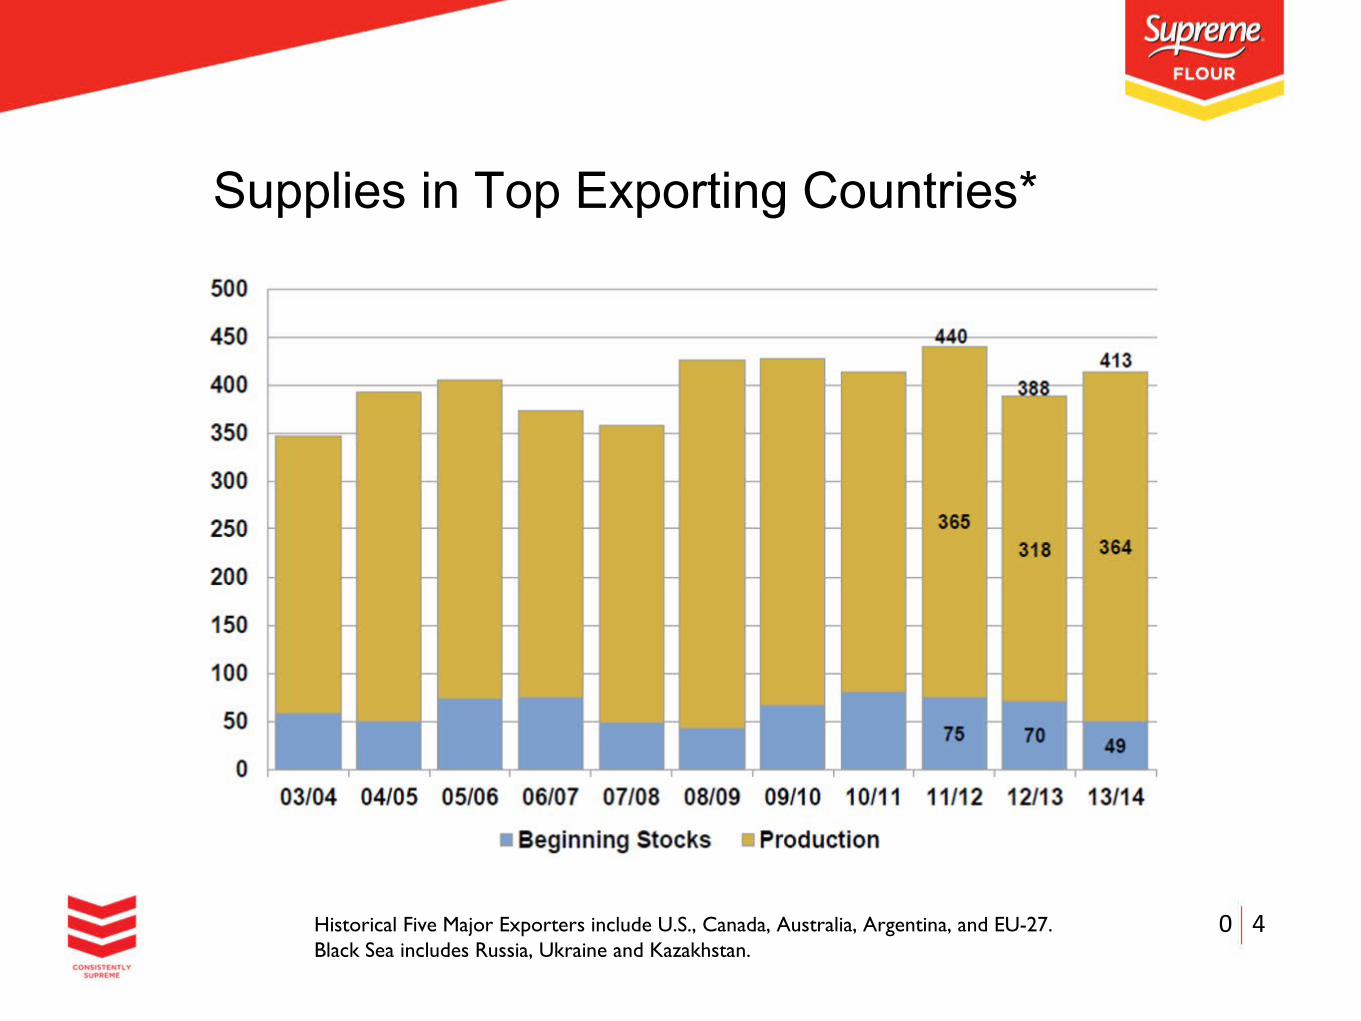
Supplies in Top Exporting Countries*
0 4Historical Five Major Exporters include U.S., Canada, Australia, Argentina, and EU-27.Black Sea includes Russia, Ukraine and Kazakhstan.

World wheat supply & demand
Date 11/12 12/13 13/14
Supply
Trade
Demand
Endingstocks
199 199 176
697 656 712
896 855 888
158 137 159
550 543 569
147 136 135
697 679 704
199 176 184
Exports/imports
Beginning stockProductionSupply total
Food & seedFeed & residualUse tool
0 5

Global Stocks* -to-Use Ratio
0 6*Ending stocks

Global Ending Stocks and Price
0 7

World Ending Stocks
0 8

International Wheat Factors Record 2013/14 world wheat crop – increase of 8.6% from last season, +57 million tons.
Approximately 19.2% of all wheat globally goes into the feed market and with the current spread at more than US$2.10 / buschel feed wheat is going to battle.
Canadian production up by 38% from 2012/13 to a record 37.5 MMT and EU production up 7% to 143 MMT but US production down 6% to 58 MMT
Black Sea production has rebounded to 105 MMT from 77.5 MMT in 2012/13 with exports expected to be 33% higher.
Argentine exports to fall 15% to 3 MMT vs. 5-year average of 7.57 MMT
0 9

Canada Situation
0 10
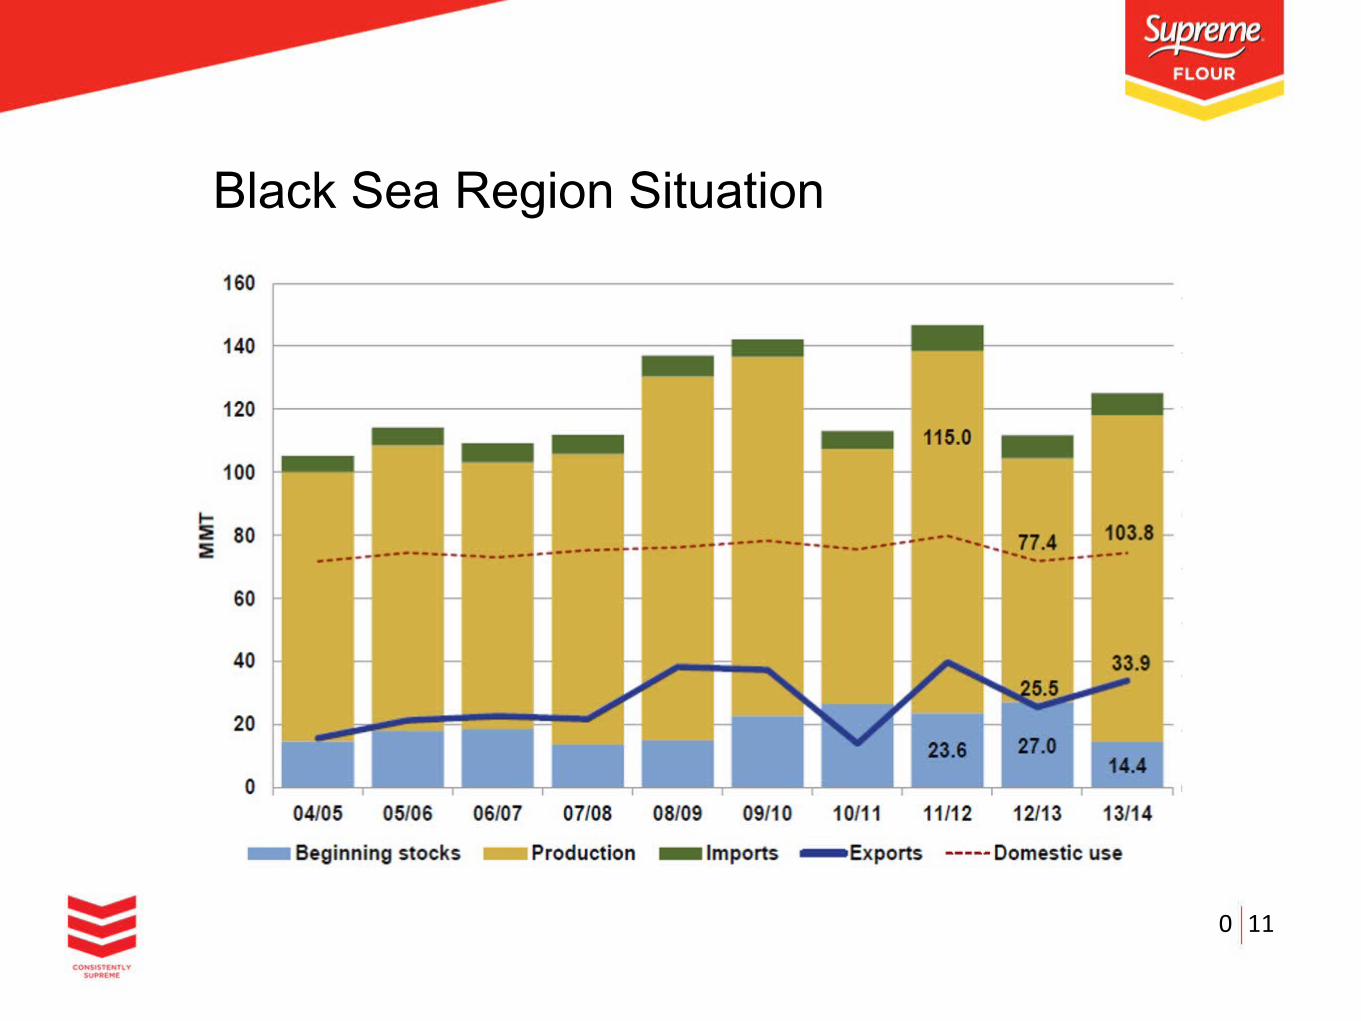
Black Sea Region Situation
0 11

EU-27 Situation
0 12

Date
Opening stock
Production
Imports
489
Consumption
Exports
Closing stock
1805
1650*
3199
233
512
13/14*
Supply & demand of wheat in South Africa (‘000 tons)
0 13

Local Wheat Drivers Limited small crop – 1,805 million tons (need to import 48% of requirement) = import parity driven
With record world crop produced, fairly good export competition but dryness in US HRW wheat areas needs to be watched.
Besides the recent US weather dryness, the largest driver of local prices is the weak currency.
Another important driver is the pace of actual imports i.e. by 21 March 2014 –818 717 tons imported vs. imports needed to date to balance supply = 831 283 tons.
0 14

0 15

0 16