Supporting Wireless Access Markets with a User-centric QoE
8
Supporting Wireless Access Markets with a User-centric QoE-based Geo-database Georgios Fortetsanakis 1 , Michalis Katsarakis 1 , Maria Plakia 1 , Nick Syntychakis 1 , and Maria Papadopouli 1,2,* 1 Department of Computer Science, University of Crete & Institute of Computer Science, Foundation for Research and Technology-Hellas 2 ACCESS Linnaeus Centre, KTH Royal Institute of Technology, Sweden ABSTRACT This paper presents the u-map, a novel user-centric geo- database for wireless access markets that enables clients to upload information about their profile, their quality-of- experience (QoE) feedback for a service, traffic demand, network/spectrum conditions (e.g., interference, coverage), providers, and their position (e.g., GPS-based measurements) in a spatio-temporal geo-database. To evaluate the impact of the u-map on wireless access markets and study the evolu- tion of such markets, we have developed an economic-driven modeling framework. The framework integrates models of the channel, clients and network operators, wireless infras- tructures, types of interaction, and price adaptation in a modular manner. We have implemented a simulation plat- form based on this framework and instantiated a cellular- based duopoly. Via simulations, we analyzed the impact of the u-map, user profiles, and network coverage of providers on the evolution of the market. The analysis demonstrates that the u-map can be beneficial to users in their network operator selection process. We also developed a proof-of- concept implementation of the u-map and performed a pre- liminary analysis. Finally, the paper highlights the research directions that need to be explored for developing a robust and effective mechanism. Categories and Subject Descriptors K.6.2 [Management of computing and information systems]: Installation Management; K.6.3 [Management of computing and information systems]: Software Man- agement; H.2.4 [Database management]: Systems; H.2.8 [Database management]: Database Applications; I.6.5 [Simulation and modeling]: Model Development; I.6.6 [Simulation and modeling]: Simulation Output Analysis * Contact author: [email protected]. Permission to make digital or hard copies of all or part of this work for personal or classroom use is granted without fee provided that copies are not made or distributed for profit or commercial advantage and that copies bear this notice and the full citation on the first page. To copy otherwise, to republish, to post on servers or to redistribute to lists, requires prior specific permission and/or a fee. MobiArch’12, August 22, 2012, Istanbul, Turkey. Copyright 2012 ACM 978-1-4503-1526-5/12/08 ...$15.00. General Terms Management, Measurement, Performance, Design, Economics Keywords Geo-database, quality of experience, wireless networks, net- work economics, access markets, modeling, simulation 1. INTRODUCTION Recently wireless technologies have received considerable attention. Emerging protocols and access paradigms in- troduce new types of wireless access markets. Unlike the traditional cellular-based markets, these markets are more heterogeneous (in terms of users and providers), more com- plex and dynamic, and can offer an improved set of services. As the demand for wireless access increases, users are dif- ferentiated even more in terms of their profile. Inevitably subscribers with relatively high usage pattern and QoE re- quirements are subsidized by the ones with lower usage and QoE. As the wireless network technology advances, an even more diverse set of services becomes available. We intro- duced a service paradigm, the “flex service” that allows a user with a cognitive radio to select the appropriate base station (BS) of a provider based on various criteria, such as its profile, network conditions, and offered prices. The flex service, which is a typical access paradigm in wireless LANs, could be a new type of service offered in cellular markets. A similar concept is the soft (or virtual) SIM cards. Given the diverse customer profile with respect to their traffic demand and QoE requirements, and the availability of many services and access options, the selection of the ap- propriate provider/BS becomes complex and dynamic. We speculate that the selection process may involve a software agent running on a mobile device that makes the decisions on behalf of its customer. Motivated by the need to enable users to select the appropriate provider, especially when visiting a new environment, we propose the u-map, a novel system that enables wireless devices to upload information about their usage profile, their QoE feedback for services, traffic demand, network/spectrum conditions, willingness-to-pay, bitrate requirements, and their position in a spatio-temporal geo-database. The u-map can be accessed by users in order to obtain information about a network provider, such as its coverage, price, quality of services, and customers satisfac- tion and make an “educated” selection of the appropriate provider. Providers can also access this database to obtain
Transcript of Supporting Wireless Access Markets with a User-centric QoE

Supporting Wireless Access Markets with a User-centricQoE-based Geo-database
Georgios Fortetsanakis1, Michalis Katsarakis1, Maria Plakia1, Nick Syntychakis1, andMaria Papadopouli1,2,∗
1Department of Computer Science, University of Crete &Institute of Computer Science, Foundation for Research and Technology-Hellas
2ACCESS Linnaeus Centre, KTH Royal Institute of Technology, Sweden
ABSTRACTThis paper presents the u-map, a novel user-centric geo-database for wireless access markets that enables clientsto upload information about their profile, their quality-of-experience (QoE) feedback for a service, traffic demand,network/spectrum conditions (e.g., interference, coverage),providers, and their position (e.g., GPS-based measurements)in a spatio-temporal geo-database. To evaluate the impactof the u-map on wireless access markets and study the evolu-tion of such markets, we have developed an economic-drivenmodeling framework. The framework integrates models ofthe channel, clients and network operators, wireless infras-tructures, types of interaction, and price adaptation in amodular manner. We have implemented a simulation plat-form based on this framework and instantiated a cellular-based duopoly. Via simulations, we analyzed the impact ofthe u-map, user profiles, and network coverage of providerson the evolution of the market. The analysis demonstratesthat the u-map can be beneficial to users in their networkoperator selection process. We also developed a proof-of-concept implementation of the u-map and performed a pre-liminary analysis. Finally, the paper highlights the researchdirections that need to be explored for developing a robustand effective mechanism.
Categories and Subject DescriptorsK.6.2 [Management of computing and informationsystems]: Installation Management; K.6.3 [Managementof computing and information systems]: Software Man-agement; H.2.4 [Database management]: Systems; H.2.8[Database management]: Database Applications; I.6.5[Simulation and modeling]: Model Development; I.6.6[Simulation and modeling]: Simulation Output Analysis
∗ Contact author: [email protected].
Permission to make digital or hard copies of all or part of this work forpersonal or classroom use is granted without fee provided that copies arenot made or distributed for profit or commercial advantage and that copiesbear this notice and the full citation on the first page. To copy otherwise, torepublish, to post on servers or to redistribute to lists, requires prior specificpermission and/or a fee.MobiArch’12, August 22, 2012, Istanbul, Turkey.Copyright 2012 ACM 978-1-4503-1526-5/12/08 ...$15.00.
General TermsManagement, Measurement, Performance, Design, Economics
KeywordsGeo-database, quality of experience, wireless networks, net-work economics, access markets, modeling, simulation
1. INTRODUCTIONRecently wireless technologies have received considerable
attention. Emerging protocols and access paradigms in-troduce new types of wireless access markets. Unlike thetraditional cellular-based markets, these markets are moreheterogeneous (in terms of users and providers), more com-plex and dynamic, and can offer an improved set of services.As the demand for wireless access increases, users are dif-ferentiated even more in terms of their profile. Inevitablysubscribers with relatively high usage pattern and QoE re-quirements are subsidized by the ones with lower usage andQoE. As the wireless network technology advances, an evenmore diverse set of services becomes available. We intro-duced a service paradigm, the “flex service” that allows auser with a cognitive radio to select the appropriate basestation (BS) of a provider based on various criteria, such asits profile, network conditions, and offered prices. The flexservice, which is a typical access paradigm in wireless LANs,could be a new type of service offered in cellular markets. Asimilar concept is the soft (or virtual) SIM cards.
Given the diverse customer profile with respect to theirtraffic demand and QoE requirements, and the availabilityof many services and access options, the selection of the ap-propriate provider/BS becomes complex and dynamic. Wespeculate that the selection process may involve a softwareagent running on a mobile device that makes the decisions onbehalf of its customer. Motivated by the need to enable usersto select the appropriate provider, especially when visitinga new environment, we propose the u-map, a novel systemthat enables wireless devices to upload information abouttheir usage profile, their QoE feedback for services, trafficdemand, network/spectrum conditions, willingness-to-pay,bitrate requirements, and their position in a spatio-temporalgeo-database. The u-map can be accessed by users in orderto obtain information about a network provider, such as itscoverage, price, quality of services, and customers satisfac-tion and make an “educated” selection of the appropriateprovider. Providers can also access this database to obtain

information about their coverage and user feedback to im-prove/adjust their deployment and services.Recently databases have been proposed to maintain spec-
trum or physical-layer based information (e.g., [1, 11, 10,13, 9, 7]), focusing on spectrum availability/usage, “whites-pace”, and interference. For example, in [9], Min et al.presented a cooperative sensing algorithm that employs theknowledge of the network topology and signal propagationcharacteristics to detect attacks. Gurney et al. [7] focusedon a geo-database for TV-band incumbents that allows dy-namic updating techniques and enables regulators to correctinterference problems after device deployment, focusing onthe use of interference models. Unlike these approaches, theu-map aims to integrate a richer set of data, encompassingcross-layer measurements (e.g., RSSI values to QoE scores)and user preferences and constraints with respect to datarate and price. Karlsson et al. [8] proposed an open spec-trum approach in which providers consult a database withuser feedback to improve their network infrastructure andreduce interference.Other studies [5, 4] present systems that also enable mo-
bile phones to share their measurements. Gaonkar et al. [5]proposed the Micro-Blog, which follows a client-to-server ar-chitecture. Micro-Blog users can upload measurements cap-tured by their mobile phone sensors (e.g., cameras, GPS,accelerometers, health monitors) on a database. Froehlichet al. [4] proposed the MyExperience, a system that collectsvarious types of objective and subjective measurements in-cluding, device usage, user context information, and environ-mental measurements. In contrast to these approaches, theu-map focuses on network-based measurements (e.g., QoEscores, RSSI, interference, demand, and preferences) for as-sessing wireless access markets.In general, the u-map system can be developed and pro-
vided as a service by different entities, employing variousbusiness models. For example, a user community can of-fer this system as a review mechanism in an altruistic and“grass-root” manner to enable users to make a more “edu-cated” selection of their service provider. A different ap-proach is that of a third party that provides this serviceto registered users or network operators/service providers.Alternatively, a network operator/service provider may de-velop and support such a system and set of services. Each ofthese paradigms and underlying business models affect thedesign of the system and its architecture.In the context of this paper, we focus on the basic func-
tionality of the u-map system and its generic features. Specif-ically, we have developed a proof-of-concept implementationof the u-map and analyzed its performance using a real-world testbed. Furthermore, to evaluate the impact of theu-map on the evolution of wireless access markets, we havedeveloped a network-economics driven modeling framework.The modeling framework integrates models for the chan-nel, network topology, users and providers, their interaction,price adaptation, and u-map. It also considers two user pop-ulations, namely the flex users and subscribers. Flex usersdecide about their provider on a per-session basis, while sub-scribers are associated with a specific provider for the entireduration of their contract. In this paper, the sessions canbe GSM calls or VoIP calls. Flex users can be informed ofthe network conditions in their region by the u-map. Tothe best of our knowledge, there are no studies that proposesuch spatio-temporal data repositories and assess their po-
Provider 2
Provider1
To start a session, select any BS of either provider in range
Flexi User
Provider 1
BS
To start a session
select any BS of
Provider 1 in range
BS of Provider 1
Provider 2
BS
U-map server
U-map client
Subscriber
of Provider 1
A2. Regularly upload
traces with network
& QoE measurements
A1. Record network performance & QoE scores
(with spatial & temporal info) locally
1. Users query u-map
for the best provider
in a region2. Response
to query
Providers query for their QoS &
coverage in regions
Regularors query about QoS &
Coverage of various providers
Figure 1: An access market supported by the u-map.
tential impact on the evolution of wireless access markets.This paper extends our earlier work [3] in several ways: (a)it presents the u-map system and its preliminary analysisusing a prototype, (b) it evaluates the impact of the u-mapon the evolution of a cellular-based duopoly via simulations,and (c) it extends the performance analysis in [3] by consid-ering various user constraints and mobility and the presenceof a partial monopoly.
Section 2 describes the u-map system focusing on the maincomponents of its architecture. Section 3 presents a proto-type of the u-map, while Section 3.1 discusses its preliminaryperformance analysis. The economic-driven modeling frame-work and simulation platform that instantiate access mar-kets enabled by the u-map are presented in Section 4. Sec-tion 4.1 analyzes the evolution of a cellular-based duopolyunder different client populations and the presence of the u-map. Finally, Section 5 summarizes our main findings andfuture work plans.
2. U-MAP
2.1 ArchitectureThe u-map is a review system that enables wireless users
to upload their feedback about the QoE of their serviceson a spatio-temporal geo-database. This database is main-tained by a distributed system of u-map servers that collect,process, and store information provided by users. The u-map follows a client-to-server architecture. Fig. 1 gives thegeneral overview of a wireless access market with flex usersand subscribers supported by the u-map. The u-map archi-tecture includes several components, namely, the communi-cation protocol between a u-map server and u-map client,the GUI for the u-map client, the database that stores theuser feedback and its ER structure, the data representationscheme, the set of services and queries, and the security andaccess control mechanisms.
Design objectives: The large size and heterogeneity of thecollected measurements from different devices impose vari-ous challenges. A proper data representation scheme shouldbe determined to ensure an efficient and scalable data man-agement and access control. Furthermore, the set of sup-ported services and queries should be designed in such a way,that the various entities (e.g., users, providers) can accessthe information they need in a reliable and efficient manner.
1
Storing Postgre SQL
server
RetrievalAccess control
PHP
application
Certificate
authority
Security & privacy Database
U-map server
Battery consumption
GPS
Wireless network
Phone state listener
Sipdroid App
Streaming service
Other services
Back-end
interface
Monitor
QoE
OrmLite
GUI
GSM receiver
Sipdroid
receiver
Sa
ve
tra
ces
Qu
eri
es
Pe
rfo
rma
nce
me
asu
rem
en
ts
Up
loa
d t
race
s
Energy
Position
RSSI(802.11)
RSSI (GSM)
Sqlite
U-map client
. .
. .
. .
User feedback
Performance
estimator
Android device
QoE score
Figure 2: The u-map client-to-server architecture.
The provision of data integrity and fault-tolerance, detec-tion of erroneous data (e.g., injected by mis-configured ormalicious users), support of non-repudiation, protection ofuser privacy, and appropriate access control are also criticalfor the adoption of the u-map system.Communication, query, retrieval, searching: U-map clients
(or simply clients) may connect and exchange informationwith the u-map server. U-map clients also record the statuswith which their sessions were terminated, namely whetherthese sessions were terminated successfully or abruptly orwere blocked, along with the QoE scores which were pro-vided by the user (to assess the services of those sessions).Monitors that run at the u-map client record network-relatedinformation, such as traffic demand, network data (e.g., in-terference, RSSI, packet loss) with timestamps. In addition,the position information of the device is recorded. All thisinformation is stored locally in the client device. Duringa connection, a client may upload this information to theu-map server.Access control: A user-centric access control will allow
users to control the information revealed to third parties.When a user reports its experience, it provides possiblysensitive data. The u-map will define rules that determine“who” has access to “what” data. “Who” can be a user or arole (e.g., operator, application), and “what” is a query overthe data.Security and user privacy: The database should be pro-
tected from compromise through standardized widely-acceptedtechniques that prevent unauthorized access and intrusions.The protection of the collected data and customers can relyon strong authentication of the querying customers. The
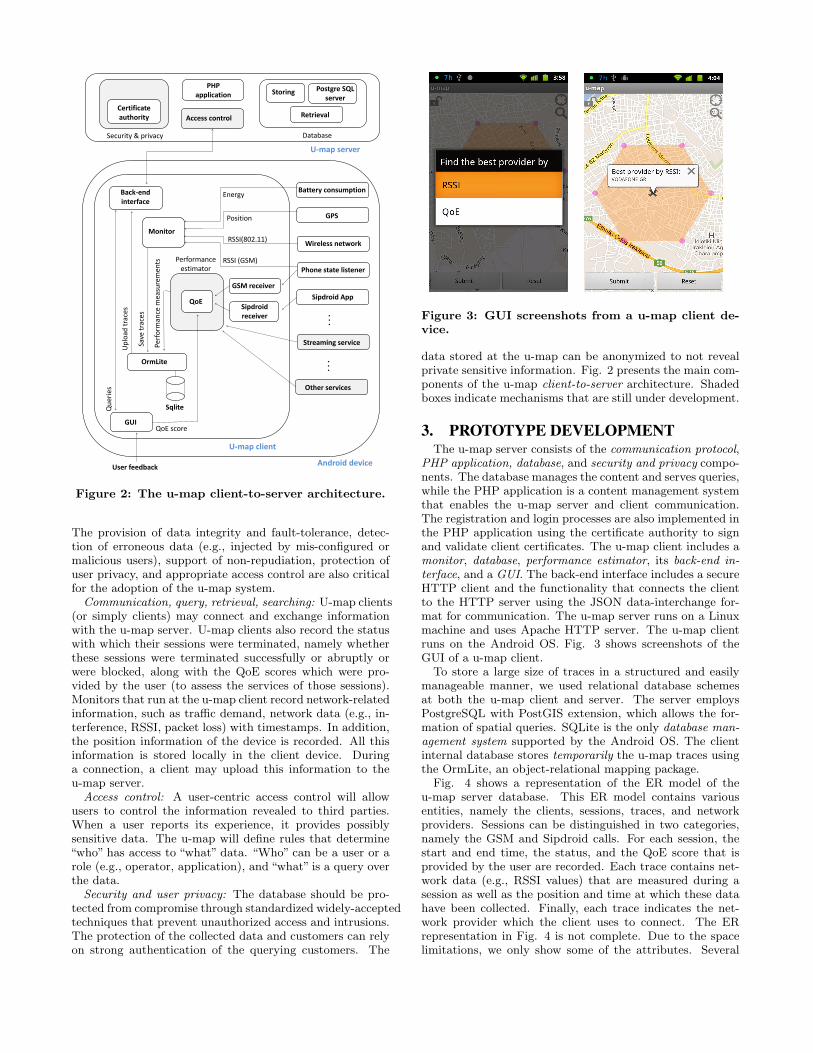
Figure 3: GUI screenshots from a u-map client de-vice.
data stored at the u-map can be anonymized to not revealprivate sensitive information. Fig. 2 presents the main com-ponents of the u-map client-to-server architecture. Shadedboxes indicate mechanisms that are still under development.
3. PROTOTYPE DEVELOPMENTThe u-map server consists of the communication protocol,
PHP application, database, and security and privacy compo-nents. The database manages the content and serves queries,while the PHP application is a content management systemthat enables the u-map server and client communication.The registration and login processes are also implemented inthe PHP application using the certificate authority to signand validate client certificates. The u-map client includes amonitor, database, performance estimator, its back-end in-terface, and a GUI. The back-end interface includes a secureHTTP client and the functionality that connects the clientto the HTTP server using the JSON data-interchange for-mat for communication. The u-map server runs on a Linuxmachine and uses Apache HTTP server. The u-map clientruns on the Android OS. Fig. 3 shows screenshots of theGUI of a u-map client.
To store a large size of traces in a structured and easilymanageable manner, we used relational database schemesat both the u-map client and server. The server employsPostgreSQL with PostGIS extension, which allows the for-mation of spatial queries. SQLite is the only database man-agement system supported by the Android OS. The clientinternal database stores temporarily the u-map traces usingthe OrmLite, an object-relational mapping package.
Fig. 4 shows a representation of the ER model of theu-map server database. This ER model contains variousentities, namely the clients, sessions, traces, and networkproviders. Sessions can be distinguished in two categories,namely the GSM and Sipdroid calls. For each session, thestart and end time, the status, and the QoE score that isprovided by the user are recorded. Each trace contains net-work data (e.g., RSSI values) that are measured during asession as well as the position and time at which these datahave been collected. Finally, each trace indicates the net-work provider which the client uses to connect. The ERrepresentation in Fig. 4 is not complete. Due to the spacelimitations, we only show some of the attributes. Several

Figure 4: The ER model of the u-map serverdatabase.
entities, such as, the service type and charging scheme, havebeen omitted.
3.1 Preliminary performance analysisThe analysis aims to evaluate the performance of the u-
map by measuring the delay that a user experiences whenuploading traces or querying. To measure the delay we setup a testbed that consists of a u-map client, running on anAndroid device, an external monitor, running on a laptop, awireless access point (AP) and the u-map server (as shownin Fig. 5). The Android device runs the u-map client ap-plication and connects to the server via the AP. The exter-nal monitor captures all data exchanged between the u-mapclient and the AP. Using this testbed, we performed two se-ries of experiments. In the first, the u-map client uploads500 traces to the u-map server, while in the second, it per-forms 50 queries. The sequence of events and definition ofthe various delays are shown in Table 1 and Fig. 5.Specifically, the following delays have been defined: 1)
server delay: it corresponds to the total time elapsed be-tween the reception of a client request by the server and thetransmission of the response (i.e., T4 − T3). The compo-nents that contribute the most to the server delay are thedistance estimation and the information retrieval modules.2) network delay: it consists of the time required for the
Table 1: Measured eventsTime Event
Recorded atDevice Application
T1Client triggered to Android
System.currentTimeMillissend query/upload traces client
T2Client sends query/traces External
Tcpdumpto the server monitor
T3 Server receives the query/traces Server PHP microtimeT4 Server responds to the client Server PHP microtime
T5 Client receives the responseExternal
Tcpdumpmonitor
T6 Client displays the resultAndroid
System.currentTimeMillisclient
Figure 5: The u-map testbed for the delay measure-ments.
client request to reach the server and the server responseto reach the client (i.e., T3 − T2 + T5 − T4). Note that thetimestamps T2, and T5 are recorded at the external monitor,while T3, and T4 are recorded at the u-map server. Possibleasynchronicities between the clocks of the two devices do notaffect the measured network delay. 3) Android delay: it con-sists of the time for the client request generation and displayof the server response on the screen (i.e., T2−T1+T6−T5). 4)total delay: it is defined as the sum of the Android, networkand server delays (i.e., T6 − T1).
Figs. 6 (a) and 6 (b) show the cumulative distributionfunctions of all types of delays when uploading traces or per-forming queries, respectively. In the case of sending queries,the median Android, network, server, and total delays are43.32 ms, 8.01 ms, 135 ms, and 187 ms, while on uploadingtraces they are 49.17 ms, 397.19 ms, 159.5 ms, and 604 ms,respectively.
To study the scalability issues of the u-map server, i.e.,the delay as a function of simultaneous requests, we useda desktop PC that emulates a number of u-map clients bysending a large number of concurrent requests ranging from5 to 50 (step of 5). We repeated the experiment 20 times andmeasured the server and total delay. In this case, the times-tamps T1 and T6 were recorded at the desktop PC insteadof the Android client. Fig. 6 (c) shows the server and totaldelay. Each point corresponds to the mean value across allemulated clients and runs of the experiment. A prominentincrease in the delay occurs when the number of concurrentrequests is 40 or more, due to the substantial increase in thememory required for processing.
The power consumption during the query or trace trans-mission was recorded using the PowerTutor application [14].We ran an experiment with the transmission of 100 queries(trace uploading). The power consumption was recorded ineach case. The power consumption due to the IEEE802.11wireless interface, Organic Light-Emitting Diode (OLED)display, and CPU was measured separately. In the caseof query transmission, the mean power consumption of theOLED display prevails by 97% and its value is 401 mW.During uploading, the wireless interface contributes by 97% in the power consumption with a mean value of 412 mW.
The analysis demonstrates that when uploading traces,the delay is relatively high, especially for large number ofconcurrent requests (Fig. 6 (c)). This is due to the large

0 50 100 150 200 250 3000
0.5
1
Delay (ms)
CD
F
Android delay
Network delay
Server delay
Total delay
(a)
0 200 400 600 800 10000
1
0.5
Delay (ms)
CD
F
Android delay
Network delay
Server delay
Total delay
(b)
0 10 20 30 40 500
4
8
12
16
20
Number of requests
De
lay (
s)
Total delay uploadServer delay upload
Total delay queryServer delay query
(c)
Figure 6: Cumulative distribution functions of de-lays for sending queries (a) and uploading traces (b).The scalability of the u-map server as a function ofthe number of simultaneous queries (c).
amount of data exchanged between the client and server.However, the uploading runs in the background and doesnot affect the user experience. In contrast, when query-ing, the delay is substantially smaller. These delays canbe significantly reduced by using more advanced equipment.Furthermore, we found that the power consumption of theu-map client application when uploading traces or queryingis relatively low.
4. MODELING & SIMULATIONTo evaluate the potential impact of the u-map on the evo-
lution of wireless access markets, we designed a network-economics driven modeling framework and simulation plat-form in which users and providers rely on the u-map infor-mation to determine their strategies. The modeling frame-work is parameterized based on the channel, infrastructureand network topology, type of users (e.g., requirements, de-mand, mobility, profile), providers (e.g., access protocol,price adaptation mechanism), and their interactions, userand provider distributions, mobility, and available informa-tion. The simulation environment based on this frameworkis modular, in that, it can instantiate and implement differ-ent models for these parameters.Infrastructure: Each provider has deployed a cellular topol-
ogy that offers wireless access via its BSs to users in a smallcity. Providers divide their channels into time slots accord-
ing to a TDMA scheme. To model the channel quality, weemployed the Okumura Hata path-loss model for small citiesconsidering the contribution of shadowing to the channelgain [6, 2].
Price setting: To penalize an aggressive increase of thetransmission power, providers adopt a pricing scheme thatcharges users proportionally to their transmission power.The payoff function of a provider indicates the impact ofthe offered prices to the revenue of that provider. In thesimulated market there is no analytical model of the pay-off functions of providers, and as such, a machine-learningapproach is used to estimate these functions from historicaldata. Specifically, each provider performs a price adapta-tion algorithm based on a second-degree concave polynomialapproximation of the payoff function and estimates its pa-rameters dynamically using fitting. The price is adaptedby applying a steepest ascent rule on the estimated polyno-mial. Providers could also obtain information about the userdemand, and behavior via the u-map, which would enablemore sophisticated pricing.
Populations: Two user populations are present: flex usersand subscribers. A flex user selects a BS at the start of eachsession dynamically, while subscribers choose their providerupon their arrival in the region and connect only to BSs ofthat provider. Users are characterized by a price-tolerancethreshold and a target transmission rate threshold. Based ontheir preference, users can also be distinguished in two cat-egories, namely the price-preference and transmission rate-preference ones. In rate preference, users aim to optimizeonly their transmission rate when selecting a BS, given thatthis BS can satisfy both the price tolerance and target trans-mission rate thresholds. Users with price preference aimto minimize the financial cost, when selecting a BS, giventhat this BS can satisfy both their thresholds. If any of thethresholds are not satisfied, the user chooses to remain dis-connected.
User demand: Users generate sessions. For each session,a user connects to a BS. The duration of sessions and dis-connection periods are given by appropriate stochastic pro-cesses.
User mobility: Users move with a pedestrian speed ac-cording to the random waypoint model.
u-map: The u-map system is modeled as a data structurethat corresponds to a grid-based representation of a region.Each cell of the grid stores statistics about the providersand the QoE of sessions. At the end of a session, a flexuser reports the number of available time slots of the clos-est BS of each provider. Subscribers also report the numberof available time slots of the closest BS of their providers.This information is stored in the u-map. Based on this in-formation, the average channel availability, i.e., number ofavailable time slots of a BS of a provider, averaged over allcollected measurements, is computed.
Due to the long duration of a subscription, it is expectedthat a subscriber will move across various locations. There-fore, the average channel availability across the entire re-gion can help subscribers to make a more educated selectionof their provider. Specifically, each subscriber selects theprovider with the highest average channel availability, as re-ported by the u-map. On the other hand, flex users selecttheir provider/BS according to the instantaneous channelquality, as measured locally. In a more general context, dif-ferent types of measurements can be stored in the u-map

and different BS/provider selection mechanisms can be em-ployed to improve the QoE of a user.
4.1 Simulation platformThe simulation platform considers a small city, represented
by a grid of 11 Km x 9 Km. Each provider has a cellu-lar network that consists of 49 BSs placed on the sites ofa triangular grid, with a distance between two neighboringsites of 1.6 Km. Moreover, each provider owns bandwidthof 5.6 MHz, that is divided into 28 channels of 0.2 MHzwidth. These channels are allocated to BSs according to afrequency reuse scheme with spatial reuse factors of 4 and7, for provider 1 and provider 2, respectively. Each channelis further divided into three time slots in a TDMA scheme,resulting in 21 time slots per BS of provider 1 and 12 slotsper BS of provider 2. A single time slot of a given BS canbe offered to only one user. Also, the demand of each useris exactly one slot.We consider two different BS deployments, namely, the
uniform deployment, in which the network of each providercovers the entire city, and the non-uniform deployment, inwhich six BSs (out of 49) of provider 2 are removed. Thisis an example of a partial monopoly, in the sense that thereare regions in which users have only the option of connectingto BSs of a single provider.Providers determine the prices for flex users dynamically,
at time instances generated by a Poisson process of rate0.002 renewals per minute. We assume that both providersoffer the same prices to subscribers, which remain fixedthrough the entire duration of the experiment. There are5000 users in total (4400 flex users and 600 subscribers), dis-tributed according to a uniform distribution in the simulatedregion of this small city. In our experiments, the price toler-ance threshold and target transmission rate (in Mbps) followGaussian distributions. Specifically, we simulated user pop-ulations with normal price tolerance (m = 0.15, σ = 0.0375)and high price tolerance (m = 0.2, σ = 0.0375). We alsosimulated user populations with a normal target transmis-sion rate (m = 0.1, σ = 0.01) and high target transmissionrate (m = 0.2, σ = 0.01). A user generates a sequenceof session requests. The session duration follows a Paretodistribution (xs = 3.89, a = 4.5) of mean 5 min, whilethe disconnection period follows a Log-normal distribution(m = 3.22, σ = 0.37) of mean 27 min. We assume that dur-ing disconnection periods, users move with pedestrian speedof maximum value 1 m/sec, while they remain stationaryduring sessions. Furthermore, during a session, the user re-mains connected at the same BS for the entire duration ofthe session.Metrics: The performance of a provider is characterized
by its revenue and spectrum utilization, while the perfor-mance of a user is indicated by the percentage of blockedsessions. The spectrum utilization of a provider correspondsto the average utilization of all its BSs. We implemented thesimulation platform and this market in Matlab. 10 Monte
Table 2: Description of scenarios
ScenarioPrice Rate BS u-map
threshold threshold deployment usedNormal normal normal uniform yes
High price tolerance high normal uniform yesHigh target rate normal high uniform yesPartial monopoly normal normal non-uniform yes
Partial monopoly (rnd) normal normal non-uniform no
Carlo runs were performed for each scenario (shown in Table2). Each scenario simulates a homogeneous user populationwith respect to preferences. Specifically, “P” correspondsto a price-preference population, while “R” to a rate pref-erence one (Fig. 7). Note that in partial monopoly (rnd)scenarios, subscribers select randomly their provider. Ourreported results are average statistics over all Monte Carloruns. Each run represents the evolution of the market for30500 minutes.
4.2 Performance analysisThe u-map can help users to make a more educated selec-
tion of their provider. When a flex user performs a call, itselects the appropriate provider/BS based on the instanta-neous channel quality, as measured by the flex user locally.Similarly, when a subscriber enters the market, it obtains theaverage channel availability of providers from the u-map. Itselects the provider with the highest channel availability. Inthe simulations, the u-map indicates that the channel avail-ability of the provider 1 is higher compared to the provider 2.As expected, all subscribers select the provider 1. To evalu-ate the impact of the u-map, we ran a scenario in which sub-scribers select a provider randomly (rnd). Compared to therandom selection (rnd), the u-map based selection exhibitslower average blocking probability for subscribers, both inrate and price preference (Fig. 7 (f)). Clearly the u-map isbeneficial to users.
Potentially providers could also take advantage from thereported information about the session arrivals. For exam-ple, an increased blocking probability in certain areas mayalarm them to perform better capacity planning. The anal-ysis reveals also several interesting phenomena with respectto the performance of providers and users. In general, pricepreference (P) triggers a more intense competition amongproviders than rate preference (R) resulting in lower pricesand revenue (Fig. 7 (a)&(b)).
In the case of increased price tolerance, the revenue ofproviders increases in rate preference, while it remains sim-ilar to the normal scenario in price preference (Fig. 7 (a)).In rate preference, the competition between providers is notintense. Users tend to select the BS with the best channelquality to achieve high data rate. Therefore, the prices aremainly constrained by the price-tolerance threshold of users.On the other hand, in price preference, users are more sen-sitive to the price. This enhances the competition betweenproviders, keeping the prices and revenue at relatively lowlevels regardless of the price-tolerance thresholds.
In the case of increased target rate, in rate preference, therevenue of providers decreases (Fig. 7 (a)). Compared to thenormal scenario, fewer users will achieve their target rate,and therefore, the blocking probability will increase, result-ing to a smaller revenue and spectrum utilization. Interest-ingly, in price preference, the revenue of providers increases.As the target rate increases, the price-based selection cri-terion “deteriorates”, since a user will tend to select morefrequently the BS with the best channel quality than theleast expensive one in order to satisfy the increased datarate requirement. This allows providers to increase theirprices, and thus, their revenue.
In partial monopoly, unlike in the case of rate preference,in which the revenue increase is not dramatic, in price pref-erence, the revenue of the monopoly provider is doubled(Fig. 7 (b)). This is due to the price-tolerance threshold

(a) (b) (c)
(d) (e) (f)
Figure 7: Main results on the revenue of providers, percentage of blocked calls of users and spectrumutilization for the cellular-based market.
and the competition with the other provider. Note that inmonopoly scenarios, there are some regions in which BSsof both providers are present, resulting in a competition.On the other hand, in the region of monopoly, the pricesetting mechanism of the provider is constrained by theprice-tolerance threshold of users. The larger the regionof a monopoly, the larger the flexibility for the monopolyprovider to set its price. This strategy of the monopolyprovider to increase its price gives the opportunity to theother provider to also increase its price, and thus, its rev-enue.
5. CONCLUSIONS AND FUTURE WORKThis work presents the u-map, a user-centric geo-database
that enables wireless users to upload their feedback aboutthe QoE of their services. We have developed a client-to-server prototype and performed a preliminary analysis. Theanalysis demonstrates the feasibility of the u-map given thatthe delays and power consumption are relatively low and canbe even further reduced with a more advanced technology.To assess the impact of the u-map on the evolution of wire-less access markets, we designed an economic-driven model-ing framework and simulation platform. Using this frame-work, we instantiated a cellular-based duopoly, with two cus-tomer types, namely the subscribers and flex users, undervarious scenarios with respect to their profile, the presenceof monopoly, and the u-map. The analysis showed that theu-map can be beneficial in enabling users to select in a more“educated” manner their provider and improve their access.
We plan to extend the modeling framework by incorporat-ing a richer set of measurements at the u-map (e.g., percent-age of blocked calls, RSSI values, QoE scores), non-uniformdistributions of pedestrians and mobility patterns. The sta-
tistical analysis and inference of such heterogenous multi-source measurements opens several questions with respectto the accuracy of the inference and predictions.
Another important aspect is the provision of incentives formonitoring the network conditions and uploading the datato the u-map server. In general, the u-map service could beinstantiated according to various business models. Depend-ing on the underlying business model, the user motivationcan be altruism, reputation, and/or payment. For example,when the u-map is provided by a network operator or serviceprovider, the provider may offer free SMS or video calls toits u-map users. On the other hand, if the u-map is a grass-root system that supports a user community, the altruismand reputation could be the catalysts.
The development of the u-map prototype is an on-goingeffort. We have extended the QoE study described in [12]for Android users to better understand the impact of thenetwork conditions on the QoE. The next milestone is thedeployment of a small-scale testbed and the performance ofempirical studies with u-map clients and “virtual providers”(using our software-defined radio testbed). This will help usto obtain a better understanding of the potential benefitsand performance of the u-map.. Another important direc-tion is the analysis of historical spatio-temporal cross-layeru-map traces to detect “weak spots” of coverage of providersin certain regions.
The diversity and large number of spatio-temporal mea-surements from different devices impose also questions aboutthe data representation for efficient and scalable data man-agement and querying. Finally, the provision of data in-tegrity and fault-tolerance, detection of erroneous data, thesupport of non-repudiation, and protection of user privacyneed to be investigated. Depending on the type of services,certain design choices are more appropriate than others. At
the same time, the adoption of such mechanisms and ser-vices depends on various systems and business-driven pa-rameters, opening up several interesting systems, statistical,and business-driven questions.
6. ACKNOWLEDGMENTThe authors would like to thank Manos Dramitinos, Irini
Fundulaki, Gunnar Karlsson, Stefanos Papadakis, Panos Pa-padimitratos, and the anonymous ACM MobiArch’12 re-viewers for their feedback and Panagiotis Lionakis, Mano-lis Sourligas, and Menelaos Viskadouros for their contribu-tion in the development of the u-map prototype. Thanksalso goes to Google for the equipment grant with Androidssmart phones (Google AndroidEDU programme). This workis funded by the General Secretariat for Research and Tech-nology in Greece with a Research Excellence, Investigator-driven grant (APIΣTEIA) and the CS-ORION (PIAP-GA-2009-251605) grant within the 7th Framework Program ofthe European Community.
7. REFERENCES[1] Opensignalmaps - cell phone tower and signal heat maps,
Jun. 2011.[2] I. Forkel, M. Schinnenburg, and M. Ang. Generation of
two-dimensional correlated shadowing for mobile radionetwork simulation. In WPMC, Abano Terme, Italy, Sep.2004.
[3] G. Fortetsanakis, M. Katsoulakis, and M. Papadopouli. Anovel multi-layer framework for modeling the evolution ofspectrum markets and cognitive-radio devices. In IEEEDySPAN (Poster session), Aachen, Germany, May 2011.
[4] J. Froehlich, M. Y. Chen, S. Consolvo, B. Harrison, andJ. A. Landay. Myexperience: a system for in situ tracingand capturing of user feedback on mobile phones. In ACMMobiSys, San Juan, Puerto Rico, Jun. 2007.
[5] S. Gaonkar, J. Li, R. R. Choudhury, L. Cox, andA. Schmidt. Micro-blog: sharing and querying contentthrough mobile phones and social participation. In ACMMobiSys, 2008.
[6] M. Gudmundson. Correlation model for shadow fading inmobile radio systems. Electronics Letters, 27(23):2145–2146, 1991.
[7] D. Gurney, G. Buchwald, L. Ecklund, S. Kuffner, andJ. Grosspietsch. Geo-location database techniques forincumbent protection in the TV white space. In IEEEDySPAN, Chicago, Illinois, Oct. 2008.
[8] G. Karlsson, E. A. Yavuz, and G. C. Polyzos. A futurewireless Internet beyond generations. In ACM CFI, Seoul,Korea, Jun. 2010.
[9] A. Min, K.-H. Kim, and K. Shin. Robust cooperativesensing via state estimation in cognitive radio networks. InIEEE DySPAN, Aachen, Germany, May 2011.
[10] M. Mishra and A. Sahai. How much white space is there?Technical Report UCB/EECS-2009-3, EECS Department,University of California, Berkeley, Jan. 2009.
[11] R. Murty, R. Chandra, T. Moscibroda, and P. Bahl.Senseless: A database-driven white spaces network. InIEEE DySPAN, Aachen, Germany, May 2011.
[12] I. Tsompanidis, G. Fortetsanakis, T. Hirvonen, andM. Papadopouli. A comparative analysis of the perceivedquality of VoIP under various wireless network conditions.In WWIC, Lulea, Sweden, Jun. 2010.
[13] J. van de Beek, J. Riihijarvi, A. Achtzehn, andP. Mahonen. UHF white space in Europe - a quantitativestudy into the potential of the 470 - 790 MHz band. InIEEE DySPAN, Aachen, Germany, May 2011.
[14] L. Zhang, B. Tiwana, Z. Qian, Z. Wang, R. P. Dick, Z. M.Mao, and L. Yang. Accurate online power estimation andautomatic battery behavior based power model generationfor smartphones. In IEEE/ACM/IFIP CODES+ISSS,Scottsdale, Arizona, 2010.