
Supporting information Metal-free Conditions Hydrogels ... · The gelatin was dissolved in PBS...
25
1 Supporting information Mussel-inspired Injectable Supramolecular and Covalent Bonds Crosslinked Hydrogels with Rapid Self-healing and Recovery via a Facile Approach Under Metal-free Conditions Xin Zhao a , Mengyao Zhang a , Baolin Guo a, *, Peter X. Ma a,b,c,d,e, * a Center for Biomedical Engineering and Regenerative Medicine, Frontier Institute of Science and Technology, Xi’an Jiaotong University, Xi’an, 710049, China b Department of Biomedical Engineering, University of Michigan, Ann Arbor, MI 48109, USA c Department of Biologic and Materials Sciences, University of Michigan, 1011, North University Ave., Room 2209, Ann Arbor, MI 48109, USA d Macromolecular Science and Engineering Center, University of Michigan, Ann Arbor, MI 48109, USA e Department of Materials Science and Engineering, University of Michigan, Ann Arbor, MI 48109, USA * To whom correspondence should be addressed. Tel.:+86-29-83395363. Fax: +86- 29-83395131. E-mail: [email protected], [email protected] Electronic Supplementary Material (ESI) for Journal of Materials Chemistry B. This journal is © The Royal Society of Chemistry 2016
Transcript of Supporting information Metal-free Conditions Hydrogels ... · The gelatin was dissolved in PBS...

1
Supporting information
Mussel-inspired Injectable Supramolecular and Covalent Bonds Crosslinked
Hydrogels with Rapid Self-healing and Recovery via a Facile Approach Under
Metal-free Conditions
Xin Zhao a, Mengyao Zhang a, Baolin Guo a,*, Peter X. Ma a,b,c,d,e,*
a Center for Biomedical Engineering and Regenerative Medicine, Frontier Institute of
Science and Technology, Xi’an Jiaotong University, Xi’an, 710049, China
b Department of Biomedical Engineering, University of Michigan, Ann Arbor, MI
48109, USAc Department of Biologic and Materials Sciences, University of Michigan, 1011,
North University Ave., Room 2209, Ann Arbor, MI 48109, USAd Macromolecular Science and Engineering Center, University of Michigan, Ann
Arbor, MI 48109, USAe Department of Materials Science and Engineering, University of Michigan, Ann
Arbor, MI 48109, USA
* To whom correspondence should be addressed. Tel.:+86-29-83395363. Fax: +86-
29-83395131. E-mail: [email protected], [email protected]
Electronic Supplementary Material (ESI) for Journal of Materials Chemistry B.This journal is © The Royal Society of Chemistry 2016

2
1. Experimental detail
1.1 Materials
Dopamine hydrochloride (purity 98%) was purchased from J&K. Gelatin (Catalog
number: G7041, gelatin from cold water fish skin, type A, Mn=60kDa, heavy
metals≤20 ppm, gelatin solution is in liquid state at 10 oC hindering the test of bloom
number of the gelatin), NaOH, dextran (Mn=35-45KDa) and sodium periodate
(NaIO4) were purchased from Sigma-Aldrich. Phosphate-buffered saline (PBS) was
purchased from Gibco. All the other reagents are used as received.
1.2 Hydrogel preparation
The gelatin was dissolved in PBS (0.01 M, pH 7.4) at 60 oC then cooled to room
temperature to prepare gelatin solution. After that, a designed amount of dopamine
and NaOH solution (10 M) was added into the gelatin solution. The NaOH was used
to adjust the pH of the gelatin/dopamine/NaIO4 mixture back to 7.0 after the
introduction of NaIO4. After adding the desired amount of NaIO4 solution into the
above mixture, the mixture was vortex-mixed for 10 seconds and placed at 37 oC for
gelation. The hydrogel components were shown in Table S1 and Table S2. The
dextran (Mn=35000-45000 g/mol)/dopamine/NaIO4 mixture (sol state) was prepared
as the same as the above description. The concentrations of dextran and dopamine
were 20wt% and 3wt%, respectively, and the molar ratio of NaIO4 to dopamine was
1:1. Then, the dextran/dopamine/NaIO4 mixture was placed at 37 oC for 12 hours to
observe the state of the mixture. The hydrogels (GT150-DA30-SP0.5) with different
initial pH values of 1 and 4 were prepared using a similar procedure as above
3
described except for adding 8µL and 1µL of concentrated hydrochloric acid into 1mL
of GT150/DA30/SP0.5 mixtures, respectively.
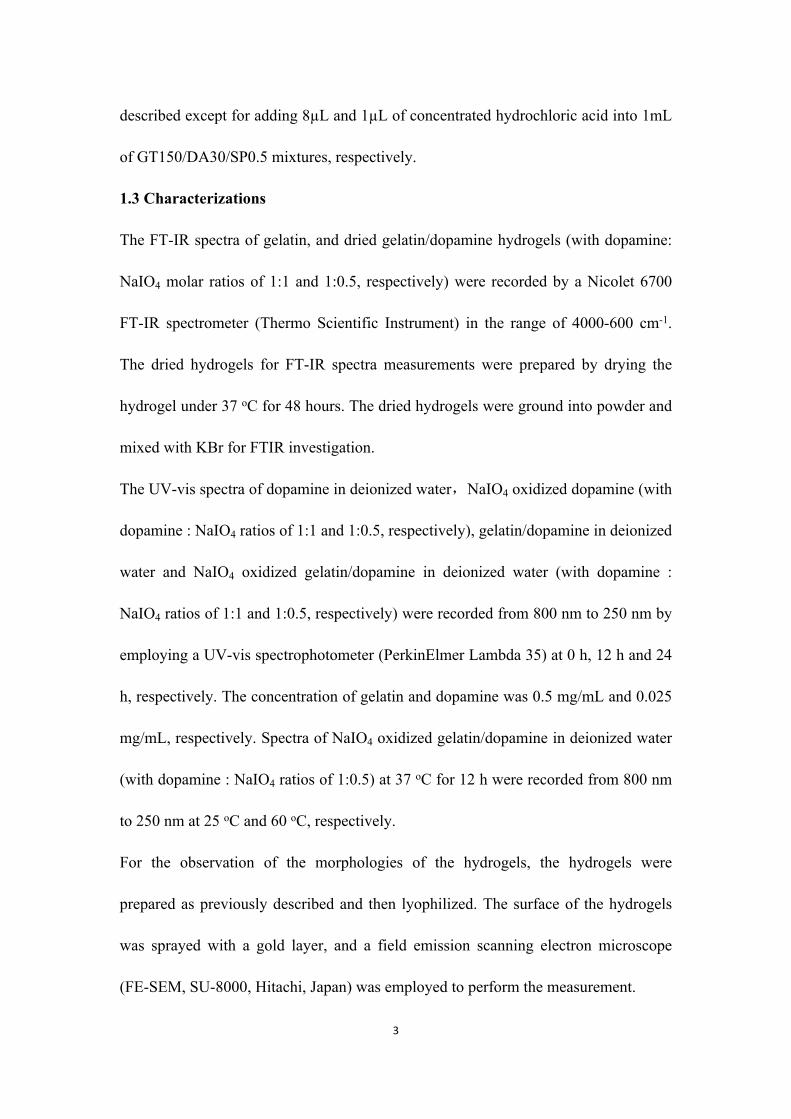
1.3 Characterizations
The FT-IR spectra of gelatin, and dried gelatin/dopamine hydrogels (with dopamine:
NaIO4 molar ratios of 1:1 and 1:0.5, respectively) were recorded by a Nicolet 6700
FT-IR spectrometer (Thermo Scientific Instrument) in the range of 4000-600 cm-1.
The dried hydrogels for FT-IR spectra measurements were prepared by drying the
hydrogel under 37 oC for 48 hours. The dried hydrogels were ground into powder and
mixed with KBr for FTIR investigation.
The UV-vis spectra of dopamine in deionized water,NaIO4 oxidized dopamine (with
dopamine : NaIO4 ratios of 1:1 and 1:0.5, respectively), gelatin/dopamine in deionized
water and NaIO4 oxidized gelatin/dopamine in deionized water (with dopamine :
NaIO4 ratios of 1:1 and 1:0.5, respectively) were recorded from 800 nm to 250 nm by
employing a UV-vis spectrophotometer (PerkinElmer Lambda 35) at 0 h, 12 h and 24
h, respectively. The concentration of gelatin and dopamine was 0.5 mg/mL and 0.025
mg/mL, respectively. Spectra of NaIO4 oxidized gelatin/dopamine in deionized water
(with dopamine : NaIO4 ratios of 1:0.5) at 37 oC for 12 h were recorded from 800 nm
to 250 nm at 25 oC and 60 oC, respectively.
For the observation of the morphologies of the hydrogels, the hydrogels were
prepared as previously described and then lyophilized. The surface of the hydrogels
was sprayed with a gold layer, and a field emission scanning electron microscope
(FE-SEM, SU-8000, Hitachi, Japan) was employed to perform the measurement.

4
Gelation time of the hydrogels was determined by using the inverting test tube
method employing a 4 mL vial test tube (10 mm diameter) at 37 °C. The gelation time
was determined as the time when no visual flow was observed within 30 s by
inverting the vial. Each group was repeated three times.
1.4 Swelling test
The hydrogels were prepared in 2 mL tubes. After complete gel formation, the
hydrogels were put into vials with 20 mL PBS (0.01 M, pH 7.4) and then the vials
were placed at 37 °C for 24 h. After that, the hydrogels were brought out from the
vials and the superficial water on the hydrogels was absorbed using a filter paper. The
swelling ratio (SR) was calculated using the following equation: SR= (Wt-Wi) / Wi, in
which Wi and Wt represent the initial weight and the weight of the swollen hydrogels
in PBS, respectively. Each group was repeated three times.
1.5 Rheological measurements
The rheological measurements of the hydrogels were performed by employing a TA
rheometer (DHR-2) using different methods. (1) A time sweep test with 1% constant
strain and a constant frequency of 10 rad/s at 37 oC was used to evaluate the stiffness
of the hydrogels. Before the collection of the data, 350 µL of the
gelatin/dopamine/NaIO4 mixture (mixing the gelatin, dopamine and NaIO4 and then
vibrating the mixture for 10 seconds using a vortex mixer) was placed between 20
mm parallel plates with a gap of 1000 µM and the periphery was sealed by silicone oil
to prevent the evaporation of water. (2) The completely crosslinked hydrogel disk
with a 20 mm diameter and a thickness of 1000 µM was prepared using a silicone

5
mould. The disk was placed between parallel plates with a 20 mm diameter and a gap
of 1000 µM. Then the strain amplitude sweep test (γ=0.1%-500%) with constant
frequency of 1 rad/s at 25 oC was performed. (3) Completely gelled hydrogel disc
with a 20 mm diameter and a thickness of 1000 µM was placed between 20 mm
parallel plates with a gap of 1000 µM at 25 oC. Then, the alternate step strain sweep
test was performed at a fixed angular frequency (1 rad/s) at 25 oC. Amplitude
oscillatory strains were switched from small strain (γ=1.0%) to subsequent large strain
(γ=500%) with 100 s for every strain interval[1]. The self-healing efficiency of the
hydrogel was calculated as following equation: self-healing efficiency %= G2′/G1′,
where G1′ was the original storage modulus and G2′ was the storage modulus after
suffering the break strain.
1.6 Macroscopic self-healing experiments
Hydrogel discs (GT150-DA30-SP0.5, 20 mm in diameter and 10 mm in height) were
prepared as previously described. The hydrogels were firstly cut into two pieces and
then put them together to view that whether they could rapidly self-heal together. A
short movie was used to show the cutting and adhesion processes of the hydrogels
(see Movie S1). Besides, the hydrogel (GT150-DA30-SP0.5) was firstly cut into
pieces, and then the hydrogel pieces were put into a syringe to form self-healed
hydrogel line by injection with or without syringe needle. Movie S2 and Movie S3
recorded the processes.
1.7 Compression test to evaluate the self-healing efficiency of the hydrogel
Hydrogel was prepared into cylindrical hydrogel using a mode with an inner diameter

6
of 15 mm and height of 10 mm. Then, the cylindrical hydrogel was used to perform
the compression strain test employing a TA rheometer with a compression speed of
100 µm/s. After the compression test, the broken hydrogel was cut into pieces and
reshaped into cylindrical hydrogel using a mode with an inner diameter of 15 mm and
height of 10 mm. After allowing the reshaped cylindrical hydrogel self-healing for 24
hours at room temperature, the self-healed cylindrical hydrogel was used to perform
the compression strain test to obtain the stress at break. The self-healing efficiency
was calculated using the following the equation: self-healing efficiency %=
Soriginal/Shealed, where Soriginal was the original hydrogel compression stress at break and
Shealed was the self-healed hydrogel compression stress at break.
1.8 Adhesive performance evaluation
A lap shear testing was used to test the bulk adhesive strength of the hydrogels. As
reference [2] described, the actual pigskin tissues surfaces were used. The skin tissue
surfaces were cut into 10 mm × 30 mm rectangle. Then, 40 μL of
gelatin/dopamine/NaIO4 mixture was applied to the surface of the fresh skin tissue
epidermis and another skin tissue epidermis was placed on top of the previous skin
tissue, the contact area of the two skin tissues was kept 10 mm × 10 mm. After that,
the samples were placed at room temperature for three hours for gelation before the
lab shear test. The samples were lap shear-tested to failure on an Instron Materials
Test system (MTS Criterion 43, MTS Criterion) equipped with a 50 N load cell by
using a cross-head speed of 5 mm/min under ambient conditions. All measurements
were triplicate.

7
1.9 In vitro biocompatibility tests of the hydrogel
The cytotoxicity of the leachable fraction from the hydrogel was evaluated as
reference [3] described. In brief, 2 mL hydrogel in 3 mL cell culture medium was
incubated for 24 hours to obtain the 1 X hydrogel extract. Then the 1/5 X hydrogel
extract was obtained by 5 times dilution of 1X hydrogel extract. L929 fibroblasts were
seeded in 96-well plate (Costar) at a density of 104 cells/well. After cultured for 24
hours, the culture medium was removed and 100 µL of hydrogel extract was added
into the plate and then cultured for another 24 hours in a humidified incubator
containing 5% CO2 at 37 °C. After that, the medium was removed and 10 μL of
alamarBlue® reagent in 100 μL complete growth medium was then added into each
well. The plate was incubated for 4 h. Then, 100 μL of the medium in each well was
transferred into a 96-well black plate (Costar). Fluorescence was read using 530 nm as
the excitation wavelength and 600 nm as the emission wavelength using a microplate
reader (Molecular Devices) according to the manufacturer’s instructions. Blank
culture medium was used as control group. Tests were repeated four times for each
group. The viability of the cells was also evaluated by LIVE/DEAD®
Viability/Cytotoxicity Kit assay. Cells cultured on TCPS plate was used as positive
control. Cell adhesion and proliferation were observed under an inverted fluorescence
microscope (IX53, Olympus).
1.10 Reformability evaluation of the hydrogel
The hydrogel (GT150-DA30-SP0.5) was prepared as the hydrogel preparation part
described. Then, on one hand, the hydrogel was cut up into pieces, and then the

8
hydrogel pieces were fabricated into hydrogel homogenate by a homogenizer. After
that, the flowable hydrogel homogenate was introduced into a silica gel model
containing four different shapes to reshape the hydrogel. After self-healing at room
temperature for 12 hours, the flowable hydrogel homogenate transformed into non-
liquid hydrogel. On the other hand, the hydrogel pieces were put into syringe to form
self-healed hydrogel line by injection with syringe needle and then the hydrogel line
could be reshaped into a whole hydrogel by rolling. Movie S4 recorded the processes.
1.11 Recovery evaluation of the hydrogel
The recovery of the hydrogels (GT150-DA30-SP0.5 and GT150-DA30-SP1.0) was
preliminary evaluated using rheometer by a uniaxial compression test with
compression speed of 500 µm/s. Also, the movies recording the process was provided
(Movie S5 and Movie S6). Besides, we qualitatively evaluated the recovery and
withstanding deformation property of the hydrogel under physiological condition. The
female Sprague–Dawley rats with body weight of 240 g were used. All animal
procedures were conducted in accordance with the Institutional Animal Ethics
Committee of the University. Firstly, the animal was anaesthetized by injecting 10%
chloral hydrate. When the rat had been anaesthetized, 1mL of mixture was
subcutaneously injected into the rat using a syringe with a 25 gauge needle. After 1, 2
and 3 days, the hydrogel was removed from the rat’s skin and the recovery and
withstanding property was qualitatively determined by pressure and release. All the
shapes of the hydrogels under pressure and after release were taken photographs.
1.12 Stability evaluation of hydrogels

9
Hydrogel GT150-DA30-SP0.5 and GT150-DA30-SP1.0 prepared without NaOH
were immersed in 5 M urea solution and water, respectively at room temperature for
different time. The morphology of the hydrogel was observed and photographed.
1.13 Biodegradation test of the hydrogel in vivo
For the in vivo biodegradation assay, female Sprague–Dawley rats with body weight
of 240 g were used. All animal procedures were conducted in accordance with the
Institutional Animal Ethics Committee of the University. Firstly, the animal was
anaesthetized by injecting 10% chloral hydrate. When the rat had been anaesthetized,
100 µL of mixture was subcutaneously injected into the rat’s skin using a syringe with
a 25 gauge needle to allow gelation. After 0, 1, 2 and 3 weeks, the rats were sacrificed
by cervical dislocation and the remaining hydrogels were peeled from the rats’ skin.
The wet hydrogels were weighed. All measurements were triplicate. The mass loss
percentage was calculated from: (Wi- Wr) / Wi, where Wi and Wr were the initial
weight and the residual weight of the hydrogels.
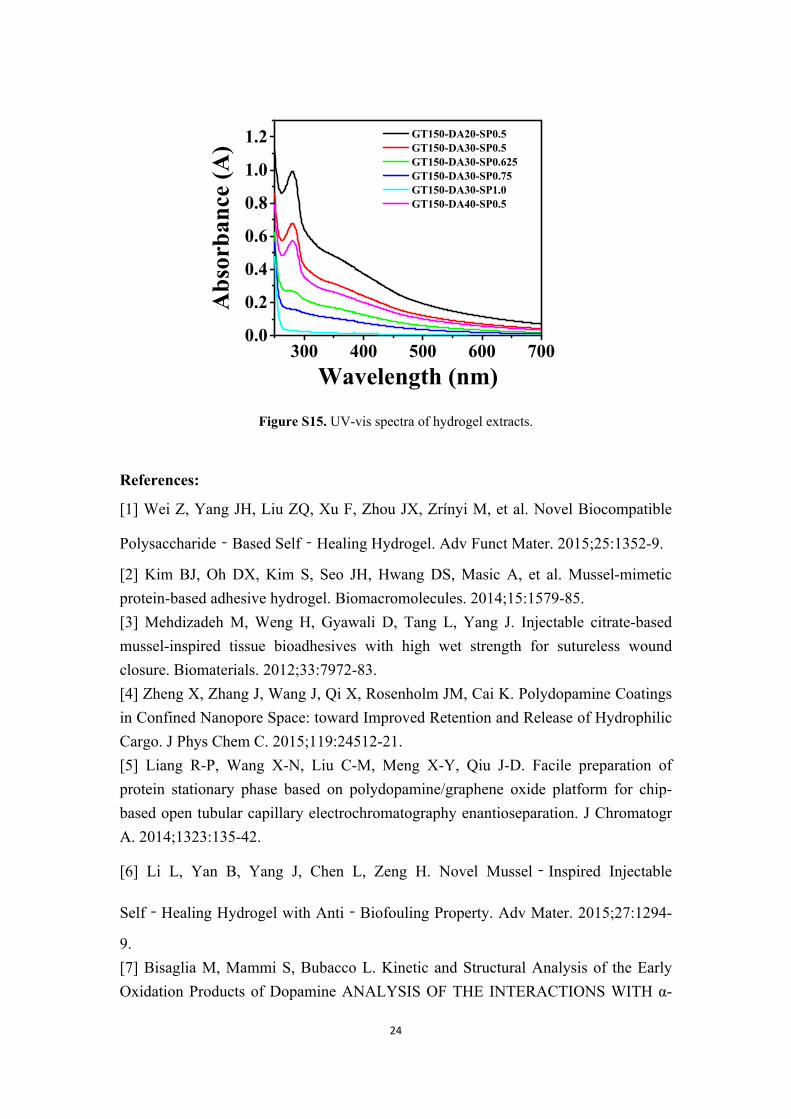
1.14 Determination of released dopamine/polydopamine in the hydrogel extratcs
2 mL hydrogel in 3 mL PBS was incubated for 24 hours at 37oC with a 100 rpm
shaking speed to obtain the hydrogel extract. Then the hydrogel extract was taken
photographs after diluted three times. Besides, the UV-vis spectra of the hydrogel
extracts were performed from 700 nm to 250 nm. The deeper color of extract means
more dopamine/polydopamine content in the extract. The higher absorption value at
about 280 nm means more dopamine/polydopamine.
1.15 Statistic analysis

10
The experimental data in this study were analyzed by Student’s t test. P < 0.05 was
considered as statistical significance. The results were expressed as mean ± standard
deviation (SD).
2. Results and discussions
Table S1 The components of the hydrogels with 0.5 : 1 and 1:1 molar ratio of NaIO4 to dopamine, respectively. GT, DA and SP represented gelatin, dopamine and sodium periodate, respectively. The number after GT and DA means the weight (mg) in per milliliter hydrogel, and the number after SP means the molar ratio of sodium periodate to dopamine.
Samples Gelatin (mg)
DA (mg)
NaOH (mg)
NaIO4 (mg)
Solvent (mL) Gelation
GT100-DA5-SP0.5 100 5 0.8 2.82 1 NOGT100-DA10-SP0.5 100 10 1.6 5.64 1 NOGT100-DA20-SP0.5 100 20 3.2 11.28 1 YESGT100-DA30-SP0.5 100 30 4.8 16.92 1 YESGT100-DA40-SP0.5 100 40 6.4 22.56 1 YESGT150-DA5-SP0.5 150 5 0.8 2.82 1 NOGT150-DA10-SP0.5 150 10 1.6 5.64 1 NOGT150-DA20-SP0.5 150 20 3.2 11.28 1 YESGT150-DA30-SP0.5 150 30 4.8 16.92 1 YESGT150-DA40-SP0.5 150 40 6.4 22.56 1 YESGT200-DA5-SP0.5 200 5 0.8 2.82 1 NOGT200-DA10-SP0.5 200 10 1.6 5.64 1 NOGT200-DA20-SP0.5 200 20 3.2 11.28 1 YESGT200-DA30-SP0.5 200 30 4.8 16.92 1 YESGT200-DA40-SP0.5 200 40 6.4 22.56 1 YESGT100-DA5-SP1.0 100 5 1.6 5.64 1 NO
GT100-DA10- SP1.0 100 10 3.2 11.28 1 YESGT100-DA20-SP1.0 100 20 4.8 16.92 1 YESGT100-DA30-SP1.0 100 30 6.4 22.56 1 YESGT100-DA40-SP1.0 100 40 12.8 45.12 1 YESGT150-DA5-SP1.0 150 5 1.6 5.64 1 NOGT150-DA10-SP1.0 150 10 3.2 11.28 1 YESGT150-DA20-SP1.0 150 20 4.8 16.92 1 YESGT150-DA30-SP1.0 150 30 6.4 22.56 1 YESGT150-DA40-SP1.0 150 40 12.8 45.12 1 YESGT200-DA5-SP1.0 200 5 1.6 5.64 1 NOGT200-DA10-SP1.0 200 10 3.2 11.28 1 YESGT200-DA20-SP1.0 200 20 4.8 16.92 1 YESGT200-DA30-SP1.0 200 30 6.4 22.56 1 YESGT200-DA40-SP1.0 200 40 12.8 45.12 1 YES

11
Table S2 The components of the hydrogels. GT, DA and SP represented gelatin,
dopamine and sodium periodate, respectively. The number after GT and DA means
that the weight (mg) in per milliliter hydrogel, and the number after SP means that the
molar ratio of sodium periodate to dopamine.
Samples Gelatin (mg)
DA (mg)
NaOH (mg)
NaIO4 (mg)
Solvent (mL)
Gelation
GT150-DA30-SP0 150 30 0 0 1 NOGT150-DA30-SP0.25 150 30 0.45 8.46 1 NOGT150-DA30- SP0.5 150 30 0.90 16.92 1 YES
GT150-DA30- SP0.625 150 30 0.96 21.15 1 YESGT150-DA30-SP0.75 150 30 1.35 25.38 1 YESGT150-DA30-SP1.00 150 30 1.8 33.84 1 YES

12
Figure S1. Photographs of gelatin (1), gelatin/dopamine mixture (2), and
gelatin/dopamine mixture with 0.25 (3), 0.5 (4), 0.625 (5), 0.75 (6), and 1.0 (7) molar
ratio of NaIO4 to dopamine, respectively, at 37 oC for 12 hours. Row A is positive
position of the bottles, Row B is inversion of the bottles, and Row C is the situation of
hydrogels (4-7) soaked in water. The diameter of the bottles is 15 mm.

13
0
20
40
60
80
100
GT200-DA20-SP0.5
GT200-DA30-SP0.5
GT200-DA40-SP0.5
GT150-DA40-SP0.5
GT150-DA30-SP0.5
GT150-DA20-SP0.5
GT100-DA40-SP0.5
GT100-DA30-SP0.5
GT100-DA20-SP0.5
Gela
tion
time (
min
)B
Figure S2. (A): photographs of hydrogels of GT100-DA20-SP0.5, GT100-DA30-
SP0.5, GT100-DA40-SP0.5, GT150-DA20-SP0.5, GT150-DA30-SP0.5, GT150-
DA40-SP0.5, GT200-DA20-SP0.5, GT200-DA30-SP0.5 and GT200-DA40-SP0.5
(from left to right); (B): gelation time of the hydrogels at 37 oC.

14
0 4000 8000 120001
10
100
Stor
age m
odul
us G
' (Pa
) L
oss m
udul
us G
'' (P
a)
Time (s)
GT100-DA20-SP0.5G'' GT100-DA20-SP0.5G' GT100-DA30-SP0.5G'' GT100-DA30-SP0.5G' GT100-DA40-SP0.5G'' GT100-DA40-SP0.5G'
A
0 4000 8000 120001
10
100
GT150-DA20-SP0.5G' GT150-DA20-SP0.5G'' GT150-DA30-SP0.5G' GT150-DA30-SP0.5G'' GT150-DA40-SP0.5G' GT150-DA40-SP0.5G''
Stor
age m
odul
us G
' (Pa
) L
oss m
udul
us G
'' (P
a)
Time (s)
B
0 4000 8000 120001
10
100
1000
Stor
age m
odul
us G
' (Pa
) L
oss m
udul
us G
'' (P
a)
Time (s)
GT200-DA20-SP0.5 G' GT200-DA20-SP0.5 G'' GT200-DA30-SP0.5 G' GT200-DA30-SP0.5 G'' GT200-DA40-SP0.5 G' GT200-DA40-SP0.5 G''
C
Figure S3. Time sweep test for mechanical strength test. A: GT100-DA20-SP0.5,
15
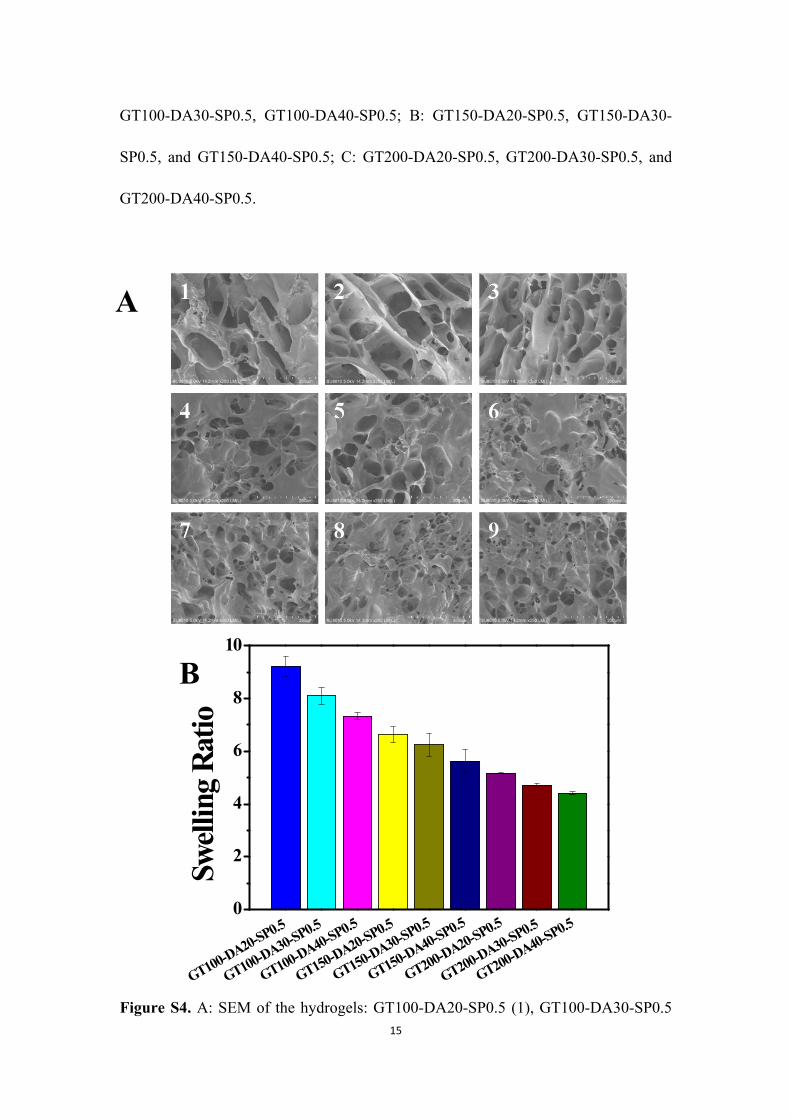
GT100-DA30-SP0.5, GT100-DA40-SP0.5; B: GT150-DA20-SP0.5, GT150-DA30-
SP0.5, and GT150-DA40-SP0.5; C: GT200-DA20-SP0.5, GT200-DA30-SP0.5, and
GT200-DA40-SP0.5.
0
2
4
6
8
10
GT200-DA40-SP0.5
GT200-DA30-SP0.5
GT200-DA20-SP0.5
GT150-DA40-SP0.5
GT150-DA30-SP0.5
GT150-DA20-SP0.5
GT100-DA40-SP0.5
GT100-DA30-SP0.5
GT100-DA20-SP0.5
Swell
ing
Ratio
B
Figure S4. A: SEM of the hydrogels: GT100-DA20-SP0.5 (1), GT100-DA30-SP0.5
A

16
(2), GT100-DA40-SP0.5 (3), GT150-DA20-SP0.5 (4), GT150-DA30-SP0.5 (5),
GT150-DA40-SP0.5 (6), GT200-DA20-SP0.5 (7), GT200-DA30-SP0.5 (8) and
GT200-DA40-SP0.5 (9); B: Swelling ratios of the hydrogels.
1X 1/5X0.0
0.5
1.0
1.5
Viab
ility
%
Concentration
GT150-DA30-SP0.5 GT150-DA30-SP0.625 GT150-DA30-SP0.75 GT150-DA30-SP1.0 GT150-DA20-SP0.5 GT150-DA40-SP0.5
A
Figure S5. Cytotoxicity of hydrogel extracts for 24 hours. A: cell viability measured
by Alamarblue assay; B: Live/Dead staining of cell. 1x represented 2 mL hydrogel in
3 mL culture medium, and 1/5x represented the five times dilution of the 1x extracts.
Scale Bar 250 µm. a-f: GT150-DA30-SP0.5, GT150-DA30-SP0.625, GT150-DA30-
17
SP0.75, GT150-DA30-SP1.0, GT150-DA20-SP0.5, and GT150-DA40-SP0.5.
3500 2800 2100 1400 700
GT-DA-SP1.0
GT-DA-SP0.5
GT
Tran
smitt
ance
(%)
Wavenumber (cm-1)
A
1700 1600 1500
GT-DA-SP1.0
GT-DA-SP0.5
GT
Tran
smitt
ance
(%)
Wavelength (cm-1)
Schiff Base
B
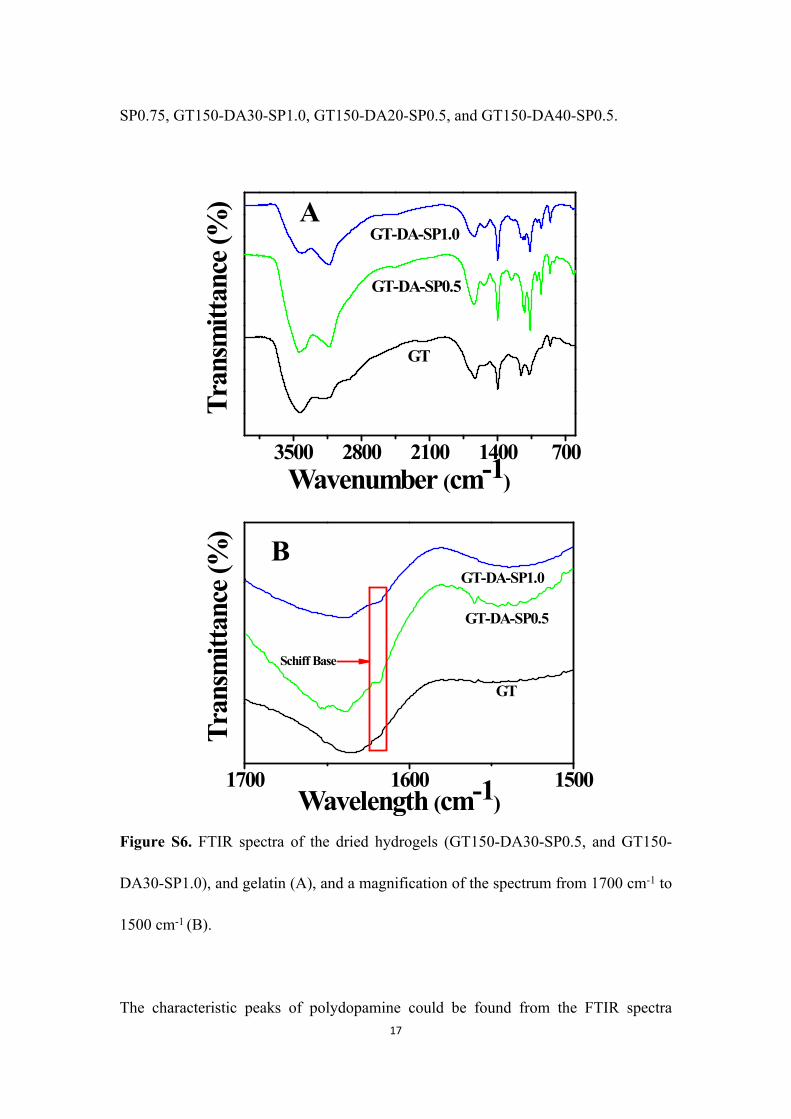
Figure S6. FTIR spectra of the dried hydrogels (GT150-DA30-SP0.5, and GT150-
DA30-SP1.0), and gelatin (A), and a magnification of the spectrum from 1700 cm-1 to
1500 cm-1 (B).
The characteristic peaks of polydopamine could be found from the FTIR spectra

18
(Figure S6A) of hydrogels. Absorption at about 1637 cm-1 corresponding to the
stretching vibration of aromatic ring and bending vibration of N-H [4], the catechol-
OH groups at around 3420 cm-1 [5], the phenolic C-O-H bending vibration at 1400
cm-1, and C-O vibration at 1120 cm-1 [4] were all observed.
300 400 500 600 700 800
0.0
0.2
0.4
0.6
0.8
1.0
1.2
Abso
rban
ce
Wavelength (nm)
GT-DA GT-DA-SP0.5 GT-DA-SP1.0 DA DA-SP0.5 DA-SP1.0
A
300 400 500 600 700 8000.0
0.5
1.0
1.5
2.0
285 nm
Abso
rban
ce
Wavelength (nm)
GT-DA GT-DA-SP0.5 GT-DA-SP1.0 DA DA-SP0.5 DA-SP1.0
B
280 nm

19
300 400 500 600 700 8000.0
0.5
1.0
1.5
2.0
Abso
rban
ce
Wavelength (nm)
GT-DA GT-DA-SP0.5 GT-DA-SP1.0 DA DA-SP0.5 DA-SP1.0
C
Figure S7. UV-vis spectra of dopamine, dopamine oxidized by 0.5 and 1.0 molar
ratio of NaIO4, gelatin/dopamine, gelatin/dopamine oxidized by 0.5 and 1.0 molar
ratio of NaIO4, at 0 hour (A), 12 hours (B) and 24 hours (C), respectively, in
deionized water. GT, DA and SP represented the gelatin, dopamine and NaIO4,
respectively.
As shown in Figure S7A, the spectra of DA and GT/DA (0.5 mg/mL GT and
0.025mg/mL DA) presented the characteristic absorption peak at 280 nm
corresponding to unoxidized catechol groups [6]. After the introduction of half molar
ratio of NaIO4 into pure DA solution and GT/DA solution, in addition to the
unoxidized catechol groups absorption peaks, two new features appeared in the
spectra at 300 nm and 476 nm (Figure S7B), which is associated with aminochrome
[7]. However, when adding equal molar ratio of NaIO4 into the pure DA solution and
GT/DA solution, the catechol group absorption peak disappeared, and a characteristic
peak for dopaquinone at about 400 nm appeared (Figure S7A) and gradually replaced

20
by the absorption peaks of aminochrome at 300 nm and 476 nm.
Figure S8. Stability test of hydrogels in 5 M urea solution and deionized water. (1).
Hydrogel GT150-DA30-SP0.5 in 5 M urea solution; (2). Hydrogel GT150-DA30-
SP0.5 in deionized water; (3). Hydrogel GT150-DA30-SP1.0 in 5 M urea solution; (4).
Hydrogel GT150-DA30-SP1.0 in deionized water.

21
300 400 500 600 700 8000.0
0.4
0.8
1.2
430 440 450 460 470 480 490 5000.20
0.25
0.30
300 nm 473 nm
476 nm
473 nm
476 nm
Abso
rban
ce
Wavelength (nm)
GT-DA-SP0.5 at RT GT-DA-SP0.5 at 60 oC
285 nm
Figure S9. UV-vis spectra of GT-DA-SP0.5 cured at RT and 60oC, respectively.
Figure S10. Photographs of 20wt% dextran with 3wt% dopamine oxidized by 1:1
molar ratio of NaIO4 to dopamine at 37 oC for 0 hour and 12 hours, respectively.
22
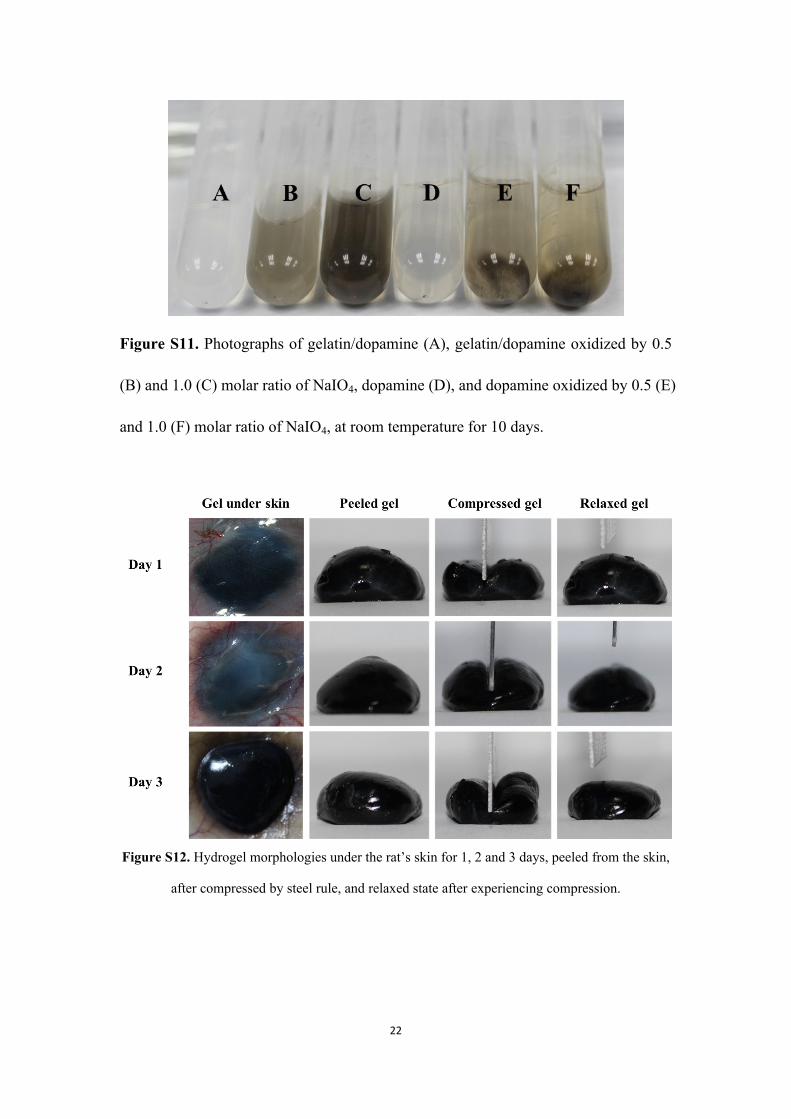
Figure S11. Photographs of gelatin/dopamine (A), gelatin/dopamine oxidized by 0.5
(B) and 1.0 (C) molar ratio of NaIO4, dopamine (D), and dopamine oxidized by 0.5 (E)
and 1.0 (F) molar ratio of NaIO4, at room temperature for 10 days.
Figure S12. Hydrogel morphologies under the rat’s skin for 1, 2 and 3 days, peeled from the skin,
after compressed by steel rule, and relaxed state after experiencing compression.

23
0 1 2 3
0
20
40
60
80
100 GT150-DA30-SP0.5
Mas
s los
s (%
)
Time (day)
Figure S13. In vivo biodegradation profile of hydrogel GT150-DA30-SP0.5 under rat’s skin.
Figure S14. Photographs of hydrogel extracts after diluted 3 times. (1) GT150-DA20-SP0.5; (2)
GT150-DA30-SP0.5; (3) GT150-DA30-SP0.625; (4) GT150-DA30-SP0.75; (5) GT150-DA30-
SP1.0; (6) GT150-DA40-SP0.5.
24
300 400 500 600 7000.0
0.2
0.4
0.6
0.8
1.0
1.2
Abs
orba
nce
(A)
Wavelength (nm)
GT150-DA20-SP0.5 GT150-DA30-SP0.5 GT150-DA30-SP0.625 GT150-DA30-SP0.75 GT150-DA30-SP1.0 GT150-DA40-SP0.5
Figure S15. UV-vis spectra of hydrogel extracts.
References:
[1] Wei Z, Yang JH, Liu ZQ, Xu F, Zhou JX, Zrínyi M, et al. Novel Biocompatible
Polysaccharide‐Based Self‐Healing Hydrogel. Adv Funct Mater. 2015;25:1352-9.
[2] Kim BJ, Oh DX, Kim S, Seo JH, Hwang DS, Masic A, et al. Mussel-mimetic protein-based adhesive hydrogel. Biomacromolecules. 2014;15:1579-85.[3] Mehdizadeh M, Weng H, Gyawali D, Tang L, Yang J. Injectable citrate-based mussel-inspired tissue bioadhesives with high wet strength for sutureless wound closure. Biomaterials. 2012;33:7972-83.[4] Zheng X, Zhang J, Wang J, Qi X, Rosenholm JM, Cai K. Polydopamine Coatings in Confined Nanopore Space: toward Improved Retention and Release of Hydrophilic Cargo. J Phys Chem C. 2015;119:24512-21.[5] Liang R-P, Wang X-N, Liu C-M, Meng X-Y, Qiu J-D. Facile preparation of protein stationary phase based on polydopamine/graphene oxide platform for chip-based open tubular capillary electrochromatography enantioseparation. J Chromatogr A. 2014;1323:135-42.
[6] Li L, Yan B, Yang J, Chen L, Zeng H. Novel Mussel‐Inspired Injectable
Self‐Healing Hydrogel with Anti‐Biofouling Property. Adv Mater. 2015;27:1294-
9.[7] Bisaglia M, Mammi S, Bubacco L. Kinetic and Structural Analysis of the Early Oxidation Products of Dopamine ANALYSIS OF THE INTERACTIONS WITH α-

25
SYNUCLEIN. J Biol Chem. 2007;282:15597-605.


![Synthesis and Characterization of Gelatin-Based Crosslinkers ......hydrogels have been synthesized [13–15]. However, there have been no systematic studies on the effect of the concentration](https://static.fdocuments.net/doc/165x107/60748af1bdc3a02c394e6e6c/synthesis-and-characterization-of-gelatin-based-crosslinkers-hydrogels-have.jpg)


