Supporting Information for - The Royal Society of Chemistry Finnigan (San Jose, CA, USA) LCQTM...
22
Electronic Supplementary Information, ESI 1 Supporting Information for Reactivity comparison of high-valent iron(IV)-oxo complexes bearing N- tetramethylated cyclam ligands with different ring size Seungwoo Hong, a‡ Hee So, a‡ Heejung Yoon, a Kyung-Bin Cho, a Yong-Min Lee, a Shunichi Fukuzumi* ab and Wonwoo Nam* a a Department of Bioinspired Science, Ewha Womans University, Seoul, 120-750, Korea. b Department of Material and Life Science Graduate School of Engineering, Osaka University and ALCA (JST), 2-1 Yamada-oka, Suita, Osaka 565-0871, Japan. E-mail: [email protected], [email protected] Electronic Supplementary Material (ESI) for Dalton Transactions This journal is © The Royal Society of Chemistry 2013
Transcript of Supporting Information for - The Royal Society of Chemistry Finnigan (San Jose, CA, USA) LCQTM...

Electronic Supplementary Information, ESI 1
Supporting Information for
Reactivity comparison of high-valent iron(IV)-oxo complexes bearing N-
tetramethylated cyclam ligands with different ring size
Seungwoo Hong,a‡ Hee So, a‡ Heejung Yoon,a Kyung-Bin Cho,a Yong-Min Lee,a
Shunichi Fukuzumi*ab and Wonwoo Nam*a
a Department of Bioinspired Science, Ewha Womans University, Seoul, 120-750, Korea. b Department of Material and Life Science Graduate School of Engineering, Osaka
University and ALCA (JST), 2-1 Yamada-oka, Suita, Osaka 565-0871, Japan.
E-mail: [email protected], [email protected]
Electronic Supplementary Material (ESI) for Dalton TransactionsThis journal is © The Royal Society of Chemistry 2013

Electronic Supplementary Information, ESI 2
Table of Contents
Experimental Section 3
Materials 3
Instrumentation 3 Synthesis of [FeII(13-TMC)(CF3SO3)](CF3SO3) 4
Generation and Characterization of [FeIV(O)(13-TMC)]2+ (2) 4
Spectral Redox Titration 5 Reactivity Studies 5
References (Experimental Section) 6
Table S1 7
Figure S1 8 Figure S2 9
Figure S3 10
Figure S4 11 Figure S5 12
Figure S6 13
Figure S7 14
Figure S8 15 Figure S9 16
Figure S10 17
Figure S11 18 Figure S12 19
Figure S13 20
DFT Calculation Section 21
DFT Calculation Methods 21 References (DFT Section) 21
Tables S2-S4 22
DFT Coordinates 22
Electronic Supplementary Material (ESI) for Dalton TransactionsThis journal is © The Royal Society of Chemistry 2013

Electronic Supplementary Information, ESI 3
Experimental Section
Materials. All chemicals obtained from Aldrich Chemical Co. were the best available purity
and used without further purification unless otherwise indicated. Solvents were dried
according to published procedures and distilled under Ar prior to use.1 Iodosylbenzene
(PhIO) was prepared by a literature method.2 H218O (95 % 18O-enriched) was purchased from
ICON Services Inc. (Summit, NJ, USA). 1,4,7,10-tetraazacyclotridecane was purchased from
Chematech Co. (France). The deuterated substrate, xanthene-d2, was prepared by taking
xanthene (0.16 g, 0.87 mmol) in DMSO-d6 (5.0 mL) along with NaH (0.10 g, 4.2 mmol)
under an inert atmosphere.3 The reaction solution was stirred for 8 h and quenched with D2O
(5.0 mL). The crude product was filtered and washed with copious amounts of H2O. 1H NMR
confirmed >99% deuteration of xanthene. Fe(CF3SO3)2·2CH3CN was synthesized by reacting
iron powder with trifluoromethanesulfonic acid (CF3SO3H) under an inert atmosphere in
CH3CN. 13-TMC ligand was prepared by reacting an excess amount of formaldehyde and
formic acid with 1,4,7,10-tetraazacyclotridecane.4 [FeIV(O)(14-TMC)(CH3CN)]2+ (1) was
prepared according to literature methods.5
Instrumentation. UV-vis spectra were recorded on a Hewlett Packard Agilent 8453 UV-
visible spectrophotometer equipped with a circulating water bath or an UNISOKU cryostat
system (USP-203; UNISOKU, Japan) or on a Hi-Tech Scientific (U.K.) SF-61 DX2
cryogenic stopped-flow spectrometer equipped with a Xe arc lamp and a KinetaScan diode
array rapid scanning unit. Electrospray ionization mass (ESI-MS) spectra were collected on a
Thermo Finnigan (San Jose, CA, USA) LCQTM Advantage MAX quadrupole ion trap
instrument, by infusing samples directly into the source at 20 µL/min using a syringe pump.
The spray voltage was set at 4.7 kV and the capillary temperature at 80 °C. CW-EPR spectra
were taken at 5 K using an X-band Bruker EMX-plus spectrometer equipped with a dual
mode cavity (ER 4116DM). Low temperatures were achieved and controlled with an Oxford
Instruments ESR900 liquid He quartz cryostat with an Oxford Instruments ITC503
temperature and gas flow controller. The experimental parameters for EPR spectra were as
follows: Microwave frequency = 9.646 GHz, microwave power = 1 mW, modulation
amplitude = 10 G, gain = 1x 10⁴, modulation frequency 100 kHz, Time constant = 40.96 ms,
conversion time = 85.00 ms and measuring temperature = 5 K. 1H NMR spectra were
Electronic Supplementary Material (ESI) for Dalton TransactionsThis journal is © The Royal Society of Chemistry 2013
Electronic Supplementary Information, ESI 4
measured with Bruker DPX-400 spectrometer. Resonance Raman spectra were obtained
using a liquid nitrogen cooled CCD detector (CCD-1024x256-OPEN-1LS, HORIBA Jobin
Yvon) attached to a 1-m single polychromator (MC-100DG, Ritsu Oyo Kogaku) with a 1200
grooves/mm holographic grating. Excitation wavelength of 407.0 nm was provided by He-Cd
laser (Kimmon Koha, IK5651R-G and KR1801C), with 20 mW power at the sample point.
All measurements were carried out with a spinning cell (1000 rpm) at –20 °C. Raman shifts
were calibrated with indene, and the accuracy of the peak positions of the Raman bands was
±1 cm–1. The isomer shifts were referenced against that of a room-temperature metallic iron
foil. Analysis of the data was performed with the program WMOSS (WEB Research).
Product analysis was performed with an Agilent Technologies 6890N gas chromatograph
(GC) and Thermo Finnigan (Austin, Texas, USA) FOCUS DSQ (dual stage quadrupole) mass
spectrometer interfaced with Finnigan FOCUS gas chromatograph (GC-MS).
Synthesis of [FeII(13-TMC)(CF3SO3)](CF3SO3). Iron(II) complex, [FeII(13-
TMC)(CH3CN)]2+ was prepared by mixing Fe(CF3SO3)2·2CH3CN (0.60 g, 1.2 mmol) and 13-
TMC (0.20 g, 0.83 mmol) in CH3CN (2.0 mL). The mixture was stirred for 12 h, and then
diethyl ether (10 mL) was added to the resulting solution to yield white powder, which was
collected by filtration, washed with diethyl ether, and dried in vacuo. Yield: 0.30 g (80 %).
ESI-MS in acetonitrile: m/z of 169.5 for [FeII(13-TMC)(NCCH3)]2+ and m/z of 447.2 for
[FeII(13-TMC)(CF3SO3)]+ (ESI,† Fig. S1). Anal. Calc. for C15H30F6FeN4O6S2: C, 30.21; H,
5.07; N, 9.39. Found: C, 30.42; H, 5.02; N, 9.27%.
Generation and Characterization of [FeIV(O)(13-TMC)]2+ (2). PhIO (0.75 mM, 1.5 equiv.)
was added to acetonitrile solution containing [FeII(13-TMC)(CF3SO3)](CF3SO3) (0.50 mM)
at –40 °C, producing a green solution (λmax = 735 nm, ε = 240 M–1 cm–1). Resonance Raman
(rRaman) and ESI-MS spectroscopic measurements were performed for the characterization
of 2. The 18O-labeled iron(IV)-oxo complex, [FeIV(18O)(13-TMC)]2+ (2-18O), was prepared by
reacting [FeII(13-TMC)(CF3SO3)](CF3SO3) (0.50 mM) and PhIO (0.75 mM) in the presence
of H218O (10 µL) in CH3CN at –40 °C. Upon excitation at 407 nm, the isotopic shifts of
resonance-enhanced vibrations were observed (833 cm–1 for 2-16O and 797 cm–1 for 2-18O).
Electronic Supplementary Material (ESI) for Dalton TransactionsThis journal is © The Royal Society of Chemistry 2013

Electronic Supplementary Information, ESI 5
In ESI-MS (in CH3CN), m/z = 463.0 for [FeIV(16O)(13-TMC)(CF3SO3)]+ and m/z = 465.1 for
[FeIV(18O)(13-TMC)(CF3SO3)]+ were observed (Fig. 1).
Spectral Redox Titration. Redox titration of electron-transfer from bromoferrocene (BrFc)
to [FeIV(O)(13-TMC)]2+ (0.50 mM) was examined using different concentrations of BrFc
(0.10 – 2.5 mM) in CH3CN at –40 °C. The concentration of bromoferricenium ion (BrFc+)
was determined from the absorption band at 570 nm because of the overlap of absorption
band λ = 675 nm due to BrFc+ (εBrFc+ = 320 M–1 cm–1) and λ = 735 nm due to [FeIV(O)(13-
TMC)]2+ (εFeIV = 240 M–1 cm–1). The concentration of BrFc+ produced was then calculated by
eqn (S2), which was derived from eqn (S1). {[FeIV(O)(13-TMC)]2+}0 in eqn (2) denotes the
initial concentration of [FeIV(O)(13-TMC)]2+.
Abs570 = εBrFc+[Br2Fc+] + εFeIV{[FeIV(O)(13-TMC)]2+} (S1)
[BrFc+] = (Abs570 – εFeIV{[FeIV(O)(13-TMC)]2+}0)/(εBrFc+ – εFeIV) (S2)
The ε value of BrFc+ was confirmed by carrying out an electron-transfer oxidation of BrFc by
cerium(IV) ammonium nitrate in CH3CN at –40 °C.
Reactivity Studies. All reactions were run in a 1-cm UV cuvette and followed by monitoring
UV-vis spectral changes of reaction solutions, and rate constants were determined by fitting
the changes in absorbance at 820 nm for [FeIV(O)(14-TMC)(CH3CN)]2+ (1) and at 735 nm for
[FeIV(O)(13-TMC)]2+ (2). The intermediate 2 (0.50 mM) was used in C-H bond activation
reactions of various substrates with different bond dissociation energy (BDE), such as 10-
methyl-9,10-dihydroacridine (AcrH2, 73.7 kcal mol–1), xanthene (75.5 kcal mol–1), 9,10-
dihydroanthracene (DHA, 77 kcal mol–1), and 1,4-cyclohexadiene (CHD, 78 kcal mol–1) and
in OAT reaction of thioanisole in CH3CN at –40 °C. Given that the second-order rate
constants (k2) of C-H bond activation and OAT reactions for 1 have already been determined
in CH3CN at 25 °C and 15 °C,6,7 respectively, temperature-dependent kinetic experiments
were performed with 1 (0.50 mM) in order to estimate its k2 in CH3CN at –40 °C. The kinetic
isotope effect value (KIE) of the reaction between 2 and xanthene was determined by
Electronic Supplementary Material (ESI) for Dalton TransactionsThis journal is © The Royal Society of Chemistry 2013

Electronic Supplementary Information, ESI 6
comparing k2 values obtained from C-H bond activation reactions of xanthene and that of
xanthene-d2 in CH3CN at –40 °C. Reactions were run at least in triplicate, and the data
reported represent the average of these reactions.
For product analysis, the purity of substrates was checked with GC and GC-MS prior
to use. Products were identified by comparing with authentic samples, and product yields
were determined by comparison against standard curves prepared with authentic samples and
using decane as an internal standard.
References
1. W. L. F. Armarego and C. L. L. Chai, Purification of Laboratory Chemicals, 6th edn,
Pergamon Press, Oxford, U.K, 2009.
2. H. Saltzman and J. G. Sharefkin, Organic Syntheses, Wiley, New York, 1973, Collect.
Vol. V, pp. 658.
3. C. R. Goldsmith, R. T. Jonas and T. D. P. Stack, J. Am. Chem. Soc., 2002, 124, 83.
4. J. A. Halfen and V. G. Young, Jr., Chem. Commun., 2003, 2894.
5. J.-U. Rohde, J. In, M. H. Lim, W. W. Brennessel, M. R. Bukowski, A. Stubna, E. Münck,
W. Nam and L. Que, J., Science., 2003, 299, 1037.
6. C. V. Sastri, J. Lee, K. Oh, Y. J. Lee, J. Lee, T. A. Jackson, K. Ray, H. Hirao, W. Shin, J.
A. Halfen, J. Kim, L. Que, J., S. Shaik and Nam, W. Proc. Natl. Acad. Sci. USA., 2007,
104, 19183.
7. S. A. Wilson, J. Chen, S. Hong, Y.-M. Lee, M. Clémancey, R. Garcia-Serres, T. Nomura,
T. Ogura, J.-M. Latour, B. Hedman, K. O. Hodgson, W. Nam and E. I. Solomon, J. Am.
Chem. Soc., 2012, 134, 11791.
Electronic Supplementary Material (ESI) for Dalton TransactionsThis journal is © The Royal Society of Chemistry 2013

Electronic Supplementary Information, ESI 7
Table S1. Second-order rate constants (k2) and apparent second-order rate constants (k2’)
determined in substrate oxidations (e.g., C–H bond activation and oxygen atom transfer
reactions) by [FeIV(O)(14-TMC)(CH3CN)]2+ (1) and [FeIV(O)(13-TMC)]2+ (2) in CH3CN at -
40 °C.
a See references: (a) T. Matsumoto, K. Okubo, K. Honda, A. Yazawa, H. Furutachi, S.
Fujinami, S. Fukuzumi and M. Suzuki, J. Am. Chem. Soc, 2009, 131, 9258; (b) Y.-R. Luo,
Handbook of bond dissociation energies in organic compounds, CRC Press, New York, 2003. b All k2 values in C–H bond activation reactions were adjusted for reaction stoichiometry to
yield k2’ values based on the number of equivalent target C–H bonds in the substrate (e.g.,
two for xanthene and four for DHA)
Electronic Supplementary Material (ESI) for Dalton TransactionsThis journal is © The Royal Society of Chemistry 2013

Electronic Supplementary Information, ESI 8
Figure S1. (a) ESI-MS spectrum of [FeII(13-TMC)]2+. Mass and isotope distribution patterns
of two prominent ion peaks at m/z 169.5 and 447.2 correspond to [FeII(13-TMC)(CH3CN)]2+
(calcd. m/z 169.6) and [FeII(13-TMC)(CF3SO3)]+ (caldc. m/z 447.1), respectively. Inset
shows the isotopic distribution patterns of each peak. (b) X-band EPR spectrum of [FeII(13-
TMC)]2+ (1.0 mM) measured at 5 K.
Electronic Supplementary Material (ESI) for Dalton TransactionsThis journal is © The Royal Society of Chemistry 2013

Electronic Supplementary Information, ESI 9
Figure S2. (a) ESI-MS spectrum of [FeIV(O)(13-TMC)]2+. Mass and isotope distribution
patterns of two prominent ion peaks at m/z 177.5 and 463.0 correspond to [FeIV(O)13-
TMC)(CH3CN)]2+ (calcd. m/z 177.6) and [FeIV(O)(13-TMC)(CF3SO3)]+ (calcd. m/z 463.1),
respectively. Inset shows the isotopic distribution patterns of each peak.
Electronic Supplementary Material (ESI) for Dalton TransactionsThis journal is © The Royal Society of Chemistry 2013

Electronic Supplementary Information, ESI 10
Figure S3. (a) UV-vis spectral changes observed in the reaction of 2 (0.50 mM) and xanthene
(5.0 mM) in CH3CN at –40 °C (left panel) and time course of the absorbance monitored at
735 nm due to 2 (right panel). (b) UV-vis spectral changes observed in the reaction of 2 (0.50
mM) and CHD (10 mM) in CH3CN at –40 °C (left panel) and time course of the absorbance
monitored at 735 nm due to 2 (right panel).
Electronic Supplementary Material (ESI) for Dalton TransactionsThis journal is © The Royal Society of Chemistry 2013

Electronic Supplementary Information, ESI 11
Figure S4. Plots of pseudo-first-order rate constants (kobs) against the concentration of
substrates ((a) AcrH2, (b) xanthene, (c) DHA, and (d) CHD) to determine second-order rate
constants (k2) in the C–H bond activation reaction of substrates by 2 in CH3CN at –40 °C (see
Table S1).
Electronic Supplementary Material (ESI) for Dalton TransactionsThis journal is © The Royal Society of Chemistry 2013

Electronic Supplementary Information, ESI 12
Figure S5. Plots of pseudo-first-order rate constants (kobs) against the concentration of
xanthene (red line) and xanthene-d2 (black line) to determine second-order rate constants (k2)
in the oxidation of xanthene and xanthene-d2 by 2 in CH3CN at –40 °C. KIE value was
determined to be 36.
Electronic Supplementary Material (ESI) for Dalton TransactionsThis journal is © The Royal Society of Chemistry 2013

Electronic Supplementary Information, ESI 13
Figure S6. X-band CW-EPR spectra of the resulting solutions obtained in the reaction of 2
(1.0 mM) with cyclohexadiene (5.0 mM) (black line) and after addition of dimethylferrocene
(Me2Fc, 5.0 mM, red line) in CH3CN at –40 oC. EPR spectra were measured at 5 K.
Electronic Supplementary Material (ESI) for Dalton TransactionsThis journal is © The Royal Society of Chemistry 2013

Electronic Supplementary Information, ESI 14
Figure S7. (a) ESI-MS spectrum of the reaction solution of [FeIV(O)(13-TMC)]2+ (1.0 mM)
and cyclohexadiene (5.0 mM). Two prominent ion peaks at m/z 157.5 and 464.0 correspond
to [FeIII(OH)(13-TMC)]2+ (calcd. m/z 157.6) and [FeIII(OH)(13-TMC)(CF3SO3)]+ (calcd. m/z
464.1), respectively. Inset shows the isotopic distribution patterns of each peak. (b) ESI-MS
spectrum taken after addition of Me2Fc (5.0 mM) to the reaction solution of [FeIV(O)(13-
TMC)]2+ (1.0 mM) and cyclohexadiene (5.0 mM). Two prominent ion peaks at m/z 169.5 and
447.2 correspond to [FeII(13-TMC)(NCCH3)]2+ (calcd. m/z 169.6) and [FeII(13-
TMC)(CF3SO3)]+ (calcd. m/z 447.1), respectively. Inset shows the isotopic distribution
patterns of each peak. The peak at m/z 214.1 corresponds to Me2Fc+ (calcd. m/z 214.1).
Electronic Supplementary Material (ESI) for Dalton TransactionsThis journal is © The Royal Society of Chemistry 2013

Electronic Supplementary Information, ESI 15
Figure S8. Eyring plots of ln(k2/T) against 1/T in the reactions of 1 with (a) xanthene, (b)
DHA, (c) CHD and (d) thioanisole to estimate second-order rate constants in CH3CN at -
40 °C. (e) Plots of pseudo-first-order rate constants (kobs) against AcrH2 concentration in the
reaction of AcrH2 by 1 in CH3CN at -40 °C (see Table S1).
Electronic Supplementary Material (ESI) for Dalton TransactionsThis journal is © The Royal Society of Chemistry 2013

Electronic Supplementary Information, ESI 16
Figure S9. (a) X-band EPR spectrum of the reaction solution of [FeIV(O)(13-TMC)]2+ (2)
(1.0 mM) and thioanisole (5.0 mM) in CH3CN at –40 oC. EPR spectrum was recorded at 5 K.
(b) ESI-MS spectrum of the reaction solution of 2 (1.0 mM) and thioanisole (5.0 mM) in
CH3CN at -40 oC. Two prominent ion peaks at m/z 169.5 and 447.2 correspond to [FeII(13-
TMC)(NCCH3)]2+ (calcd. m/z 169.6) and [FeII(13-TMC)(CF3SO3)]+ (calcd. m/z 447.1),
respectively. Inset shows the isotopic distribution patterns of each peak.
Electronic Supplementary Material (ESI) for Dalton TransactionsThis journal is © The Royal Society of Chemistry 2013

Electronic Supplementary Information, ESI 17
Figure S10. (a) UV-vis spectral changes observed in the reaction of 2 (0.50 mM) and
thioanisole (5.0 mM) in CH3CN at –40 °C (left panel) and time course of the absorbance
monitored at 735 nm due to 2 (right panel). (b) Plots of pseudo-first-order rate constants (kobs)
against thioanisole concentration to determine the second-order rate constant in CH3CN at –
40 °C (see Table S1).
Electronic Supplementary Material (ESI) for Dalton TransactionsThis journal is © The Royal Society of Chemistry 2013

Electronic Supplementary Information, ESI 18
Figure S11. UV-vis spectral changes observed in the electron transfer from BrFc (5.0 mM) to
2 (0.50 mM) in CH3CN at –40 °C.
Electronic Supplementary Material (ESI) for Dalton TransactionsThis journal is © The Royal Society of Chemistry 2013

Electronic Supplementary Information, ESI 19
Figure S12. Plot of concentration of BrFc+ produced in electron transfer from BrFc (0.54 V
vs. SCE) to 2 against initial concentration of BrFc, [BrFc]0, in CH3CN at –40 oC. The
equilibrium constant was determined to be 28.
Electronic Supplementary Material (ESI) for Dalton TransactionsThis journal is © The Royal Society of Chemistry 2013

Electronic Supplementary Information, ESI 20
Figure S13. Plot of concentration of Fc+ produced in electron transfer from Fc (0.37 V vs.
SCE) to 1 against initial concentration of Fc, [Fc]0, in CH3CN at –40 oC. The equilibrium
constant was determined to be 2.5.
Electronic Supplementary Material (ESI) for Dalton TransactionsThis journal is © The Royal Society of Chemistry 2013

Electronic Supplementary Information, ESI 21
DFT Calculation Section
DFT Calculation Methods. Density functional theory (DFT)8 was applied at
B3LYP/LACV3P*+//B3LYP/LACVP level9 using Gaussian 09.10 The high molecular charge
(2+) made it necessary to perform the optimizations in solvent to avoid artificial results.11
The solvent (acetonitrile) effects were included using CPCM model with UFF cavity, per
G09 default.12 Dispersion was included using DFT-D3 program.13
References 8. W. Kohn and L. J. Sham, Phys. Rev., 1965, 140, A1133-A1138.
9. (a) A. D. Becke, Phys. Rev. A, 1988, 38, 3098; (b) A. D. Becke, J. Chem. Phys., 1993, 98,
1372-1377; (c) A. D. Becke, J. Chem. Phys., 1993, 98, 5648-5652; (d) C. Lee, W. Yang
and R. G. Parr, Phys. Rev. B, 1988, 37, 785-789; e) P. J. Hay and W. R. Wadt, J. Chem. Phys., 1985, 82, 299-310.
10. M. J. Frisch, G. W. Trucks, H. B. Schlegel, G. E. Scuseria, M. A. Robb, J. R. Cheeseman,
G. Scalmani, V. Barone, B. Mennucci, G. A. Petersson, H. Nakatsuji, M. Caricato, X. Li,
H. P. Hratchian, A. F. Izmaylov, J. Bloino, G. Zheng, J. L. Sonnenberg, M. Hada, M.
Ehara, K. Toyota, R. Fukuda, J. Hasegawa, M. Ishida, T. Nakajima, Y. Honda, O. Kitao,
H. Nakai, T. Vreven, J. A. Montgomery, J. E. Peralta, F. Ogliaro, M. Bearpark, J. J. Heyd,
E. Brothers, K. N. Kudin, V. N. Staroverov, R. Kobayashi, J. Normand, K. Raghavachari,
A. Rendell, J. C. Burant, S. S. Iyengar, J. Tomasi, M. Cossi, N. Rega, J. M. Millam, M.
Klene, J. E. Knox, J. B. Cross, V. Bakken, C. Adamo, J. Jaramillo, R. Gomperts, R. E.
Stratmann, O. Yazyev, A. J. Austin, R. Cammi, C. Pomelli, J. W. Ochterski, R. L. Martin,
K. Morokuma, V. G. Zakrzewski, G. A. Voth, P. Salvador, J. J. Dannenberg, S. Dapprich,
A. D. Daniels, Farkas, J. B. Foresman, J. V. Ortiz, J. Cioslowski and D. J. Fox, Gaussian Inc., Wallingford CT, 2009.
11. A. J. Johansson, M. R. A. Blomberg and P. E. M. Siegbahn, J. Chem. Phys., 2008, 129,
154301-154313.
12. (a) M. Cossi, N. Rega, G. Scalmani and V. Barone, J. Comput. Chem., 2003, 24, 669-681;
(b) V. Barone and M. Cossi, J. Phys. Chem. A, 1998, 102, 1995-2001.
13. S. Grimme, J. Antony, S. Ehrlich and H. Krieg, J. Chem. Phys., 2010, 132, 154104.
Electronic Supplementary Material (ESI) for Dalton TransactionsThis journal is © The Royal Society of Chemistry 2013
Electronic Supplementary Information, ESI 22
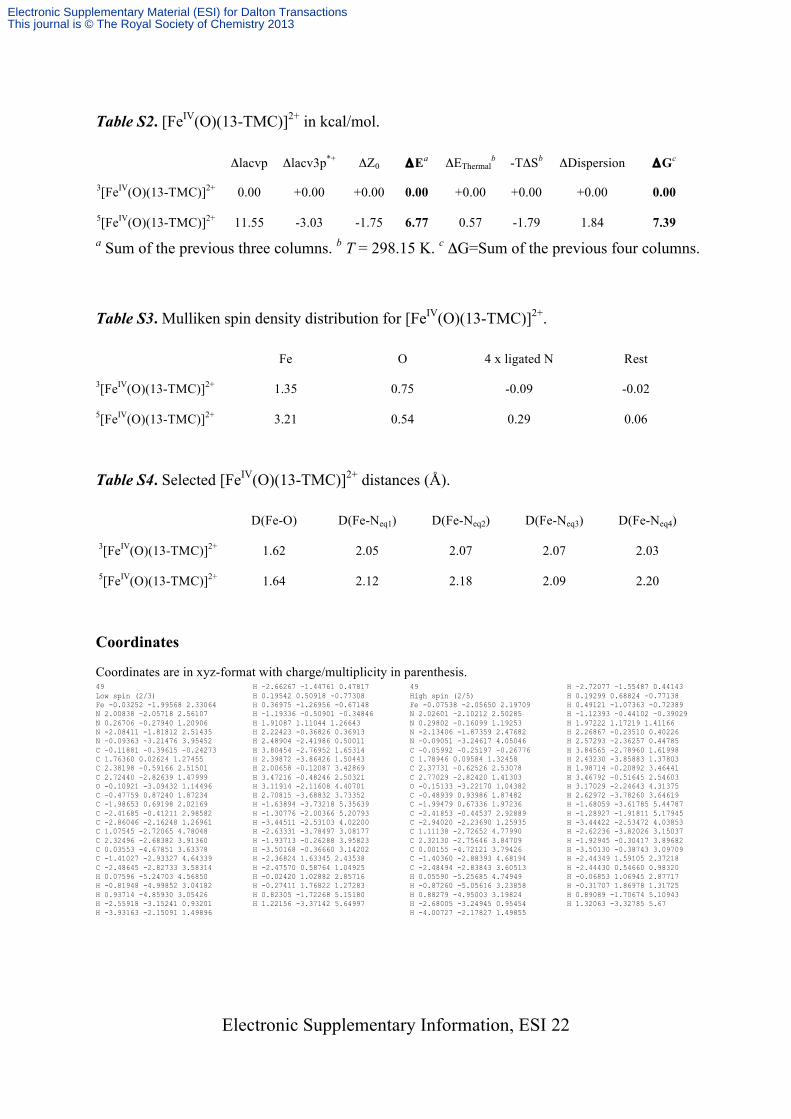
Table S2. [FeIV(O)(13-TMC)]2+ in kcal/mol.
Δlacvp Δlacv3p*+ ΔZ0 ΔEa ΔEThermalb -TΔSb ΔDispersion ΔGc
3[FeIV(O)(13-TMC)]2+ 0.00 +0.00 +0.00 0.00 +0.00 +0.00 +0.00 0.00
5[FeIV(O)(13-TMC)]2+ 11.55 -3.03 -1.75 6.77 0.57 -1.79 1.84 7.39 a Sum of the previous three columns. b T = 298.15 K. c ΔG=Sum of the previous four columns.
Table S3. Mulliken spin density distribution for [FeIV(O)(13-TMC)]2+.
Fe O 4 x ligated N Rest
3[FeIV(O)(13-TMC)]2+ 1.35 0.75 -0.09 -0.02
5[FeIV(O)(13-TMC)]2+ 3.21 0.54 0.29 0.06
Table S4. Selected [FeIV(O)(13-TMC)]2+ distances (Å).
D(Fe-O) D(Fe-Neq1) D(Fe-Neq2) D(Fe-Neq3) D(Fe-Neq4)
3[FeIV(O)(13-TMC)]2+ 1.62 2.05 2.07 2.07 2.03
5[FeIV(O)(13-TMC)]2+ 1.64 2.12 2.18 2.09 2.20
Coordinates
Coordinates are in xyz-format with charge/multiplicity in parenthesis. 49 Low spin (2/3) Fe -0.03252 -1.99568 2.33064 N 2.00838 -2.05718 2.56107 N 0.26706 -0.27940 1.20906 N -2.08411 -1.81812 2.51435 N -0.09363 -3.21476 3.95452 C -0.11881 -0.39615 -0.24273 C 1.76360 0.02624 1.27455 C 2.38198 -0.59166 2.51501 C 2.72440 -2.82639 1.47999 O -0.10921 -3.09432 1.14496 C -0.47759 0.87240 1.87234 C -1.98653 0.69198 2.02169 C -2.41685 -0.41211 2.98582 C -2.86046 -2.16248 1.26961 C 1.07545 -2.72065 4.78048 C 2.32496 -2.68382 3.91360 C 0.03553 -4.67851 3.63378 C -1.41027 -2.93327 4.64339 C -2.48645 -2.82733 3.58314 H 0.07596 -5.24703 4.56850 H -0.81948 -4.99852 3.04182 H 0.93714 -4.85930 3.05426 H -2.55918 -3.15241 0.93201 H -3.93163 -2.15091 1.49896
H -2.66267 -1.44761 0.47817 H 0.19542 0.50918 -0.77308 H 0.36975 -1.26956 -0.67148 H -1.19336 -0.50901 -0.34846 H 1.91087 1.11044 1.26643 H 2.22423 -0.36826 0.36913 H 2.48904 -2.41986 0.50011 H 3.80454 -2.76952 1.65314 H 2.39872 -3.86426 1.50443 H 2.00658 -0.12087 3.42869 H 3.47216 -0.48246 2.50321 H 3.11914 -2.11608 4.40701 H 2.70815 -3.68832 3.73352 H -1.63894 -3.73218 5.35639 H -1.30776 -2.00366 5.20793 H -3.44511 -2.53103 4.02200 H -2.63331 -3.78497 3.08177 H -1.93713 -0.26288 3.95823 H -3.50168 -0.36660 3.14202 H -2.36824 1.63345 2.43538 H -2.47570 0.58764 1.04925 H -0.02420 1.02882 2.85716 H -0.27411 1.76822 1.27283 H 0.82305 -1.72268 5.15180 H 1.22156 -3.37142 5.64997
49 High spin (2/5) Fe -0.07538 -2.05650 2.19709 N 2.02601 -2.10212 2.50285 N 0.29802 -0.16099 1.19253 N -2.13406 -1.87359 2.47682 N -0.09051 -3.24617 4.05046 C -0.05992 -0.25197 -0.26776 C 1.78946 0.09584 1.32458 C 2.37731 -0.62526 2.53078 C 2.77029 -2.82420 1.41303 O -0.15133 -3.22170 1.04382 C -0.48939 0.93986 1.87482 C -1.99479 0.67336 1.97236 C -2.41853 -0.44537 2.92889 C -2.94020 -2.23690 1.25935 C 1.11138 -2.72652 4.77990 C 2.32130 -2.75646 3.84709 C 0.00155 -4.72121 3.79426 C -1.40360 -2.88393 4.68194 C -2.48494 -2.83843 3.60513 H 0.05590 -5.25685 4.74949 H -0.87260 -5.05616 3.23858 H 0.88279 -4.95003 3.19824 H -2.68005 -3.24945 0.95454 H -4.00727 -2.17827 1.49855
H -2.72077 -1.55487 0.44143 H 0.19299 0.68824 -0.77138 H 0.49121 -1.07363 -0.72389 H -1.12393 -0.44102 -0.39029 H 1.97222 1.17219 1.41166 H 2.26867 -0.23510 0.40226 H 2.57293 -2.36257 0.44785 H 3.84565 -2.78960 1.61998 H 2.43230 -3.85883 1.37803 H 1.98714 -0.20892 3.46441 H 3.46792 -0.51645 2.54603 H 3.17029 -2.24643 4.31375 H 2.62972 -3.78260 3.64619 H -1.68059 -3.61785 5.44787 H -1.28927 -1.91811 5.17945 H -3.44422 -2.53472 4.03853 H -2.62236 -3.82026 3.15037 H -1.92945 -0.30417 3.89682 H -3.50130 -0.38743 3.09709 H -2.44349 1.59105 2.37218 H -2.44430 0.54660 0.98320 H -0.06853 1.06945 2.87717 H -0.31707 1.86978 1.31725 H 0.89089 -1.70674 5.10943 H 1.32063 -3.32785 5.67
Electronic Supplementary Material (ESI) for Dalton TransactionsThis journal is © The Royal Society of Chemistry 2013