Supporting Information for - rsc.org · Supporting Information for: ... Jeffcat DPA 0 IPDI 27.149...
17
S1 Supporting Information for: Multisensitive drug-loaded polyurethane/polyurea nanocapsules with pH-synchronized shell cationization and redox-triggered release Cristina Cuscó,* 1,2 Jordi Garcia, 2 Ernesto Nicolás, 2 Pau Rocas 1 and Josep Rocas* 1 1 Nanobiotechnological Polymers Division, Ecopol Tech, S.L., El Foix Business Park, Indústria 7, 43720 L’Arboç del Penedès, Tarragona, Spain 2 Organic Chemistry Section, Inorganic and Organic Chemistry Department, Faculty of Chemistry, CIBERobn and IBUB, University of Barcelona, Martí i Franquès 1-11, 08028 Barcelona, Spain 1. Acronyms IPDI: isophorone diisocyanate. It is an organic aliphatic diisocyanate. Interestingly, aliphatic isocyanates are less pulmonary sensitizing and not carcinogenic compared to the aromatic ones. It is particularly noteworthy that fully reacted isocyanate polymers to form their respective urethane or urea bonds do not contain toxicity referred to the isocyanate group. [1] In addition, degradation products of IPDI, such as isophorone diamine are rapidly eliminated via urinary excretion. [2] DEDS: 2-hydroxyethyl disulfide. YMER N-120: polymeric non-ionic hydrophilic building block containing two primary hydroxyl groups and a long capped ethoyxylated side chain. From a synthetic point of view, YMER N-120 was selected because of its low melting point and viscosity. Genamin TAP 100D: N-tallow-1,3-propylenediamine. It is a hydrophobic building block containing C18 fatty chain and two reactive amines for polymerization. Jeffcat DPA: N-(3-dimethylaminopropyl)-N,N-diisopropanolamine. It contains two cationizable tertiary amines and two alcohols for polymerization. THF: tetrahydrofurane. Electronic Supplementary Material (ESI) for Polymer Chemistry. This journal is © The Royal Society of Chemistry 2016
Transcript of Supporting Information for - rsc.org · Supporting Information for: ... Jeffcat DPA 0 IPDI 27.149...

S1
Supporting Information for:
Multisensitive drug-loaded polyurethane/polyurea
nanocapsules with pH-synchronized shell cationization
and redox-triggered release
Cristina Cuscó,*1,2 Jordi Garcia,2 Ernesto Nicolás,2 Pau Rocas1 and Josep Rocas*1
1 Nanobiotechnological Polymers Division, Ecopol Tech, S.L., El Foix Business Park, Indústria 7,
43720 L’Arboç del Penedès, Tarragona, Spain
2 Organic Chemistry Section, Inorganic and Organic Chemistry Department, Faculty of
Chemistry, CIBERobn and IBUB, University of Barcelona, Martí i Franquès 1-11, 08028
Barcelona, Spain
1. Acronyms
IPDI: isophorone diisocyanate. It is an organic aliphatic diisocyanate. Interestingly, aliphatic
isocyanates are less pulmonary sensitizing and not carcinogenic compared to the aromatic
ones. It is particularly noteworthy that fully reacted isocyanate polymers to form their
respective urethane or urea bonds do not contain toxicity referred to the isocyanate group.[1]
In addition, degradation products of IPDI, such as isophorone diamine are rapidly eliminated
via urinary excretion.[2]
DEDS: 2-hydroxyethyl disulfide.
YMER N-120: polymeric non-ionic hydrophilic building block containing two primary hydroxyl
groups and a long capped ethoyxylated side chain. From a synthetic point of view, YMER N-120
was selected because of its low melting point and viscosity.
Genamin TAP 100D: N-tallow-1,3-propylenediamine. It is a hydrophobic building block
containing C18 fatty chain and two reactive amines for polymerization.
Jeffcat DPA: N-(3-dimethylaminopropyl)-N,N-diisopropanolamine. It contains two cationizable
tertiary amines and two alcohols for polymerization.
THF: tetrahydrofurane.
Electronic Supplementary Material (ESI) for Polymer Chemistry.This journal is © The Royal Society of Chemistry 2016

S2
DETA: diethylenetriamine. It is a water-soluble molecule used as a crosslinker and it contains
two primary amines and one secondary amine.
HCl: hydrochloric acid.
DiO: 3,3’-dioctadecyloxacarbocyanine perchlorate (lipophilic tracer).
DiI: 1,1'-dioctadecyl-3,3,3'3'-tetramethylindocarbocyanine perchlorate (lipophilic tracer).
MWCO: molecular weight cut off.
FT-IR (ATR): Fourier transform infrared spectroscopy (attenuated total reflectance).
DLS: dynamic light scattering.
TEM: transmission electron microscopy.
AFM: atomic force microscopy.
UV-Vis: ultraviolet-visible spectroscopy.
DL: drug loading.
EE: encapsulation efficiency.
FRET: Förster resonance energy transfer.
PBS: phosphate buffered saline.
HSA: human serum albumin.
BSA: bovine serum albumin.
L-GSH: reduced L-glutathione.
HLB: hydrophilic lipophilic balance.
EPR: enhanced permeability and retention.

S3
2. Figures
Composition (% by weight) of each polymer
Synthesis of the amphiphilic cationic prepolymer (P1)
Monomer % by weight
DEDS 3.524
Ymer N-120 40.820
Jeffcat DPA 3.432
IPDI 29.322
TAP 100 D 22.903
Synthesis of the amphiphilic prepolymer (P2)
Monomer % by weight
DEDS 4.098
Ymer N-120 47.467
Jeffcat DPA 0
IPDI 27.149
TAP 100 D 21.286
Synthesis of non-labile amphiphilic and amphoteric prepolymer (P3)
Monomer % by weight
1,6-hexanediol 2.705
Ymer N-120 41.166
Jeffcat DPA 3.461
IPDI 29.571
TAP 100 D 23.097
Figure S1. Composition of each polymer in % by weight.
S4
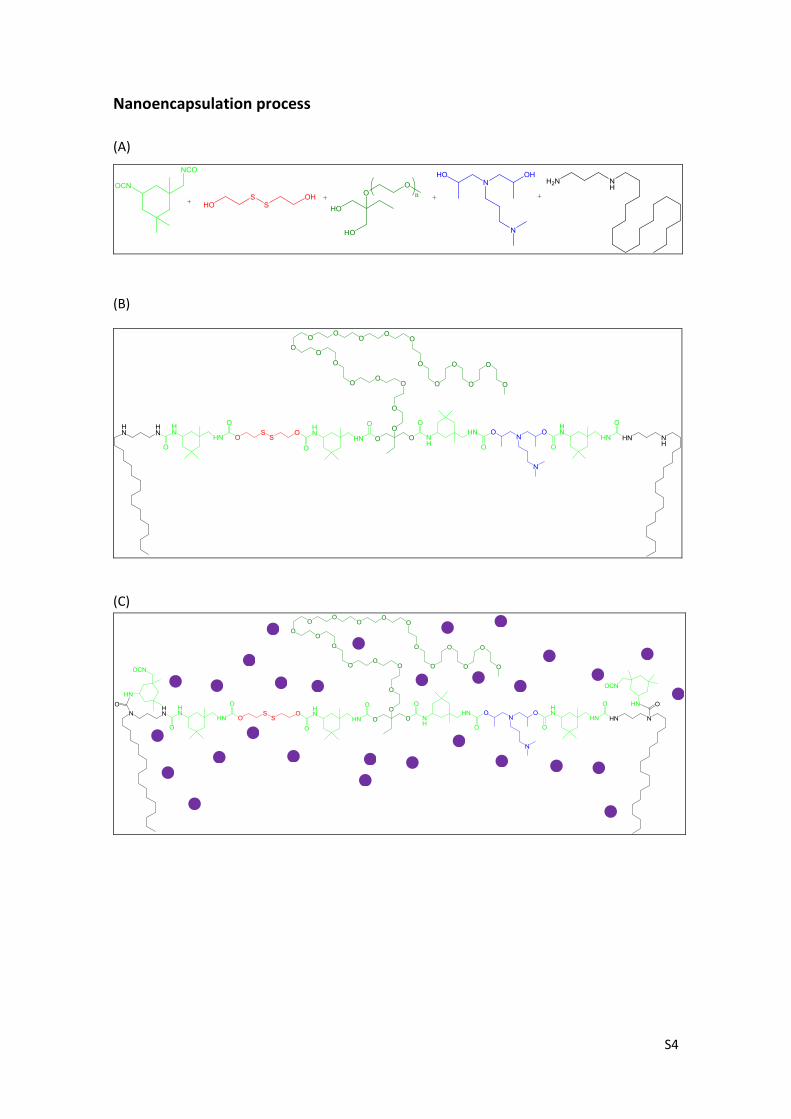
Nanoencapsulation process
(A)
(B)
(C)

S5
(D)

S6
(E)
Figure S2. Main species present in each step. (A) The monomers are loaded; (B) the
amphiphilic prepolymer is formed; (C) the desired hydrophobic drug (purple dots) is added into
the polymeric mixture; (D) an aminic ionomer is introduced and cold water is added and the
nanoemulsion is formed; (E) a polyamine (yellow dots) is added to crosslink the nanocapsules.

S7
Figure S3. FT-IR spectrum corresponding to steps 1a, 1b and 2 of the synthetic process
(amphiphilic prepolymer P1 preparation).
Figure S4. FT-IR spectrum corresponding to steps 2, 3 and 4 of the nanoencapsulation process
(amphiphilic prepolymer P1 preparation).
Step 1a
Step 1b
Step 2
Step 2
Step 3
Step 4

S8
Figure S5. Measurement of pH over time after crosslinker addition.
Figure S6. TEM micrographs of nanocapsules loaded with: (A) paclitaxel, (B) curcumin, (C) HL3
and (D) HL4.
7.5
8
8.5
9
9.5
10
10.5
11
11.5
0 100 200 300
pH
Time (min)
Amine consumption
A B
C D

S9
Figure S7. AFM micrographs of nanocapsules loaded with paclitaxel in: (A) 2D and (B) 3D; scale
bar in nanometres.
Figure S8. Z-potential measurements at different pH conditions of amphiphilic anionic
nanocapsules (P2-drug loaded anionic NCs) and surface charge at: (A) extracellular
microenvironmental pH and (B) blood pH.
-20
-10
0
10
5 5.5 6 6.5 7 7.5 8 8.5
Z-p
ote
nti
al (
mV
)
pH
Z-potential vs. pH (anionic NCs)
A B
B A
A B

S10
Figure S9. Z-potential measurements at different pH conditions of amphiphilic cationic
nanocapsules (P1-drug-loaded cationic NCs) and surface charge at: (A) microenvironmental
extracellular pH and (B) blood pH.
Figure S10. Formulae to calculate %EE and %DL of the nanocapsules.
0
10
20
30
40
50
60
5 5.5 6 6.5 7 7.5 8 8.5
Z-p
ote
nti
al (
mV
)
pH
Z-potential vs. pH (cationic NCs)
A B
B A

S11
Figure S11. Size distribution by number of nanocapsules under control conditions (PBS),
measured at different periods of time.
Fluorescence studies
Figure S12. Fluorescence studies with DiO- and DiI-loaded NCs in control conditions (PBS).
0
5
10
15
20
25
30
35
1 10 100 1000 10000
Nu
mb
er
(%)
Size (nm)
Size distribution by number
0 h
24 h
48 h
72 h
96 h
0 E+00
1 E+04
2 E+04
3 E+04
4 E+04
5 E+04
6 E+04
7 E+04
490 510 530 550 570 590 610 630 650
Inte
nsi
ty
Wavelength (nm)
Assay with PBS PBS 0h PBS 0.5h
PBS 1h PBS 1.5h
PBS 2h PBS 3h
PBS 4h PBS 5h
PBS 6h PBS 7h
PBS 8h PBS 9h
PBS 10h PBS 24h
PBS 48h PBS 72h
PBS 96h

S12
Figure S13. Fluorescence studies with DiO- and DiI-loaded NCs in HSA.
Figure S14. Fluorescence studies with DiO- and DiI-loaded NCs in BSA.
0 E+00
2 E+04
4 E+04
6 E+04
8 E+04
1 E+05
1 E+05
490 510 530 550 570 590 610 630 650
Inte
nsi
ty
Wavelength (nm)
Assay with HSA HSA 0h HSA 0.5h
HSA 1h HSA 1.5h
HSA 2h HSA 3h
HSA 4h HSA 5h
HSA 6h HSA 7h
HSA 8h HSA 9h
HSA 10h HSA 24h
HSA 48h HSA 72h
HSA 96h
0 E+00
2 E+04
4 E+04
6 E+04
8 E+04
1 E+05
1 E+05
490 510 530 550 570 590 610 630 650
Inte
nsi
ty
Wavelength (nm)
Assay with BSA BSA 0h BSA 0.5h
BSA 1h BSA 1.5h
BSA 2h BSA 3h
BSA 4h BSA 5h
BSA 6h BSA 7h
BSA 8h BSA 9h
BSA 10h BSA 24h
BSA 48h BSA 72h
BSA 96h

S13
Figure S15. Fluorescence studies with DiO- and DiI-loaded NCs in reductive conditions (L-GSH
10 mM).
0 E+00
1 E+04
2 E+04
3 E+04
4 E+04
5 E+04
6 E+04
7 E+04
8 E+04
9 E+04
490 510 530 550 570 590 610 630 650
Inte
nsi
ty
Wavelength (nm)
Assay with L-GSH PBS 0h PBS 0.5hPBS 1h PBS 1.5hGSH 0h GSH 1hGSH 2h GSH 3hGSH 4h GSH 5hGSH 6h GSH 7hGSH 8h GSH 22hGSH 24h GSH 25hGSH 26h GSH 27hGSH 28h GSH 29hGSH 30h GSH 48hGSH 49h GSH 50hGSH 51h GSH 52hGSH 53h GSH 54hGSH 70h GSH 71hGSH 94h

S14
Figure S16. Slope calculated from FRET ratio over time with DiO- and DiI-loaded NCs in
reductive conditions (L-GSH 10 mM)
y = 0.0038x + 0.2179
0.22
0.23
0.24
0.25
0.26
0 2 4 6 8 10 12
FRET
rat
io
Time (h)
GSH (I)
y = 0.0125x + 0.1329
0
0.2
0.4
0.6
0.8
1
20 30 40 50 60
FRET
rat
io
Time (h)
GSH (II)
y = 0.0010x + 0.8066
0.5
0.6
0.7
0.8
0.9
1
70 75 80 85 90 95 100
FRET
rat
io
Time (h)
GSH (III)
S15
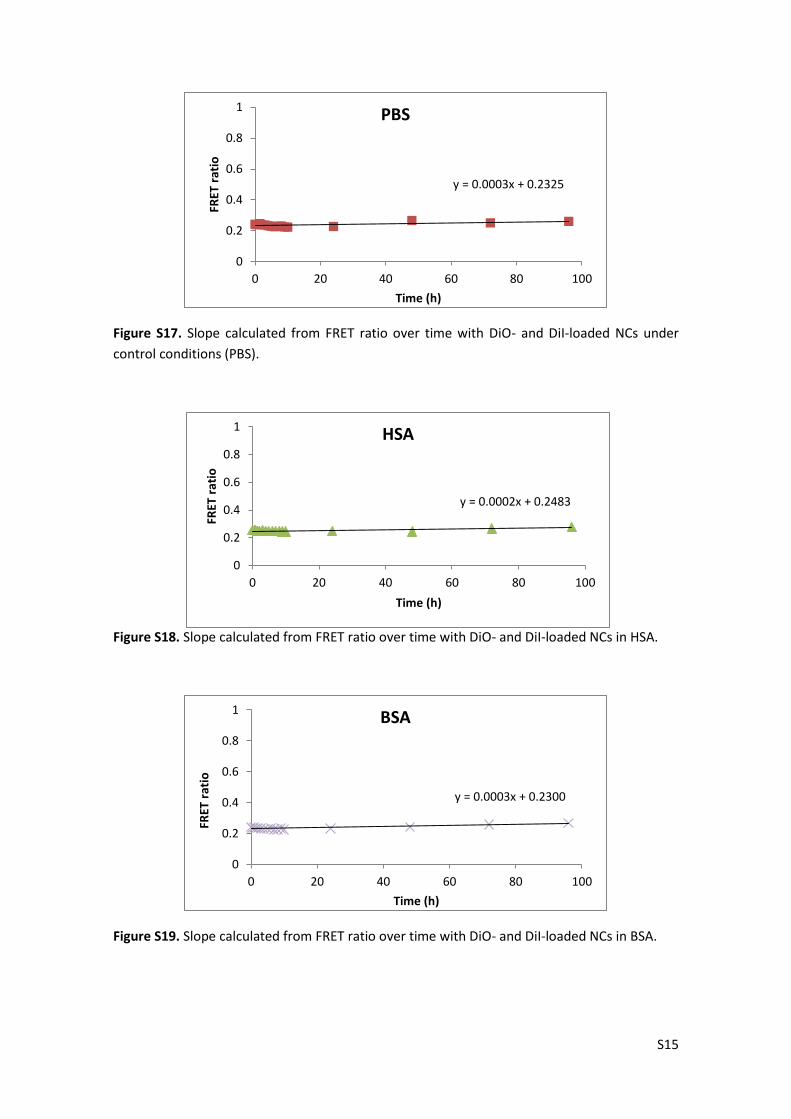
Figure S17. Slope calculated from FRET ratio over time with DiO- and DiI-loaded NCs under
control conditions (PBS).
Figure S18. Slope calculated from FRET ratio over time with DiO- and DiI-loaded NCs in HSA.
Figure S19. Slope calculated from FRET ratio over time with DiO- and DiI-loaded NCs in BSA.
y = 0.0003x + 0.2325
0
0.2
0.4
0.6
0.8
1
0 20 40 60 80 100
FRET
rat
io
Time (h)
PBS
y = 0.0003x + 0.2300
0
0.2
0.4
0.6
0.8
1
0 20 40 60 80 100
FRET
rat
io
Time (h)
BSA
y = 0.0002x + 0.2483
0
0.2
0.4
0.6
0.8
1
0 20 40 60 80 100
FRET
rat
io
Time (h)
HSA

S16
Figure S20. Fluorescence studies with non-labile DiO- and DiI-loaded NCs under reductive
conditions (L-GSH 10 mM).
Figure S21. Slope calculated from FRET ratio over time with non-labile DiO- and DiI-loaded NCs
under reductive conditions (L-GSH 10 mM).
0 E+00
2 E+04
4 E+04
6 E+04
8 E+04
1 E+05
1 E+05
490 510 530 550 570 590 610 630 650
Inte
nsi
ty
Wavelength (nm)
Assay with GSH (non-labile NCs) PBS 0h PBS 0.5h
PBS 1h PBS 1.5h
GSH 0h GSH 1h
GSH 2h GSH 3h
GSH 4h GSH 5h
GSH 6h GSH 7h
GSH 20h GSH 21h
GSH 22h GSH 23h
GSH 24h GSH 25h
GSH 48h GSH 55h
GSH 68h GSB 72h
GSH 94h
y = 0.0003x + 0.2610
0
0.2
0.4
0.6
0.8
1
0 20 40 60 80
FRET
rat
io
Time (h)
GSH (I) (non-labile NCs)
y = 0.0032x + 0.0399
0
0.2
0.4
0.6
0.8
1
70 75 80 85 90 95 100
FRET
rat
io
Time (h)
GSH (II) (non-labile NCs)

S17
3. References
[1] US Environmental Protection Agency_Diisocyanates Toxicology.
http://www.epa.gov/oppt/auto/profile/toxicology1a.pdf (accessed May 20, 2016).
[2] L.T. Budnik, D. Nowak, R. Merget, C. Lemiere and X. Baur, J. Occup. Med. Toxicol., 2011, 6,
9.