Supporting Information for Development and Applications of ...
19
S1 Supporting Information for Development and Applications of Fluorogenic Probes for Mercury(II) Based on Vinyl Ether Oxymercuration Shin Ando and Kazunori Koide* Department of Chemistry, University of Pittsburgh, 219 Parkman Avenue, Pittsburgh, Pennsylvania 15260 [email protected] Reference 44 MacDougall, D.; Amore, F. J.; Cox, G. V.; Crosby, D. G.; Estes, F. L.; Freeman, D. H.; Gibbs, W. E.; Gordon, G. E.; Keith, L. H.; Lal, J.; Langner, R. R.; McClelland, N. I.; Phillips, W. F.; Pojasek, R. B.; Sievers, R. E.; Smerko, R. G.; Wimert, D. C.; Crummett, W. B.; Amore, F. J.; Freeman, D. H.; Libby, R.; Laitinen, H. A.; Reddy, M. M.; Taylor, J. K. Anal. Chem. 1980, 52, 2242–2249. Table S1. Buffer solutions. Buffer solutions were used as received from the vendors shown below. Buffer Vendor, ingredients, and catalog number pH 4 (50 mM) J. T. Baker, potassium acid phthalate, Cat. No. JTB-5606-01 pH 5 (50 mM) VWR, potassium acid phthalate, sodium hydroxide, Cat. No. 34170-109 pH 6 (50 mM) VWR, potassium acid phthalate, sodium hydroxide, Cat. No. 34170-112 pH 7 (50 mM) J. T. Baker, potassium phosphate monobasic, sodium phosphate dibasic, Cat. No. JTB-5608-01 pH 8 (50 mM) VWR, sodium phosphate monobasic, potassium phosphate, Cat. No. 34170-118 pH 7 (1.23 M) Fisher Scientific, potassium phosphate monobasic, sodium hydroxide Cat. No. SB109-1 pH 4 (250 mM) Fisher Scientific, potassium acid phthalate, Cat. No. SB99-500 pH 10 (500 mM) Fisher Scientific, boric acid, sodium hydroxide, Cat. No. SB141-500 a) b) c) Figure S1. a) UV-Vis absorption of 1 and 3 in 0.1% DMSO/pH 7 buffer. Absorption spectra were acquired on a Cary 50 UV/Vis spectrometer under the control of Windows-based PCs running the manufacturer’s supplied software. b) Fluorescence emission spectra of 1 and 3 in 0.1% DMSO/pH 7 buffer. c) Fluorescence emission spectra of 13 and 12 in 0.1% DMSO /pH 8 buffer (excited at 470 nm to avoid the scattering).
Transcript of Supporting Information for Development and Applications of ...

S1
Supporting Information for
Development and Applications of Fluorogenic Probes for Mercury(II) Based on Vinyl Ether Oxymercuration
Shin Ando and Kazunori Koide*
Department of Chemistry, University of Pittsburgh, 219 Parkman Avenue, Pittsburgh, Pennsylvania 15260
[email protected] Reference 44 MacDougall, D.; Amore, F. J.; Cox, G. V.; Crosby, D. G.; Estes, F. L.; Freeman, D. H.; Gibbs, W. E.; Gordon, G. E.; Keith, L. H.; Lal, J.;
Langner, R. R.; McClelland, N. I.; Phillips, W. F.; Pojasek, R. B.; Sievers, R. E.; Smerko, R. G.; Wimert, D. C.; Crummett, W. B.; Amore, F.
J.; Freeman, D. H.; Libby, R.; Laitinen, H. A.; Reddy, M. M.; Taylor, J. K. Anal. Chem. 1980, 52, 2242–2249.
Table S1. Buffer solutions. Buffer solutions were used as received from the vendors shown below.
Buffer Vendor, ingredients, and catalog number pH 4 (50 mM) J. T. Baker, potassium acid phthalate, Cat. No. JTB-5606-01
pH 5 (50 mM) VWR, potassium acid phthalate, sodium hydroxide, Cat. No. 34170-109
pH 6 (50 mM) VWR, potassium acid phthalate, sodium hydroxide, Cat. No. 34170-112
pH 7 (50 mM) J. T. Baker, potassium phosphate monobasic, sodium phosphate dibasic, Cat. No. JTB-5608-01
pH 8 (50 mM) VWR, sodium phosphate monobasic, potassium phosphate, Cat. No. 34170-118
pH 7 (1.23 M) Fisher Scientific, potassium phosphate monobasic, sodium hydroxide Cat. No. SB109-1
pH 4 (250 mM) Fisher Scientific, potassium acid phthalate, Cat. No. SB99-500
pH 10 (500 mM) Fisher Scientific, boric acid, sodium hydroxide, Cat. No. SB141-500
a) b) c)
Figure S1. a) UV-Vis absorption of 1 and 3 in 0.1% DMSO/pH 7 buffer. Absorption spectra were acquired on a Cary 50 UV/Vis spectrometer under the control of Windows-based PCs running the manufacturer’s supplied software. b) Fluorescence emission spectra of 1 and 3 in 0.1% DMSO/pH 7 buffer. c) Fluorescence emission spectra of 13 and 12 in 0.1% DMSO /pH 8 buffer (excited at 470 nm to avoid the scattering).

S2
a) Compound 3
b) Compound 2
c) Compounds 2 and 3
Figure S2. HPLC analysis of compound 3. HPLC chromatogram of compound 3 (a), compound 2 (b), and a coinjected sample (c). HPLC analysis was performed on a Zorbax XDB C18 column, 4.6 × 75 mm. Elution conditions: 1.0 mL/min, 60% MeOH/H2O to 100% MeOH/ H2O linear gradient elution from 0 to 20 min. a) Compound 3
b) Compound 12
Figure S3. Fluorescence responses to Hg(II). The fluorescence response of 3 and 12 (Figures 1d and 4e) to various concentration of Hg was shown. [3 or 12] = 1.0 mM, [Hg] = 0, 1, 2, 4, 8, 16, 32 ppb.
Figure S4. The relationship between fluorescence intensity and the concentration of compound 13. The fluorescence intensities of compound 13 in 1% DMSO/50 mM phosphate pH 8 buffer were measured at various concentrations (0.78, 1.56, 3.13, 6.25, 12.5, 25, 50, 100, 200, and 400 nM) of 13. Fluorescence Intensity = 14670•[13] + 66368. R2 = 0.9974. The equation was calculated using Microsoft Excel.
Note: The relationship between fluorescence intensity and concentration of compound 1 (in 1% DMSO/50 mM phosphate pH 7 buffer, with the same instrument) was reported from our group in reference 24. (Fluorescence Intensity = 21269•[1] + 209136, R2 = 0.996)

S3
pH pH
Figure S5. Analysis of the data in Figure 4a. The analysis was performed based on the following equation (pH = pKa - log[(Fmax-F)/(F-Fmin)]). The pKa values of compound 13 were 6.00 and 12.08.
Figure S6. Hg detection in the presence of Cl- in a pH 4 buffer.
Table S2. Raw data for Figure 1b (Metal specificity)
Metal I525 Metal I525 Metal I525 Metal I525
No metal 125,186 Co 117,022 Li 120,050 Pd 384,773
Ag 123,852 Cr 126,897 Mg 131,012 Pt 781,743
Au 120,083 Cu 120,330 Mn 123,062 Rh 94,441
Ba 123,293 Fe 123,457 Na 120,017 Ru 119,260
Ca 122,618 Hg 8,555,110 Ni 123,392 Zn 123,375
Cd 113,269 K 119,310 Pb 121,170
I525 = Fluorescence intensity at 525 nm
S4
Table S3. Raw data for Figure 1d (Correlation between fluorescence intensities and [Hg(II)] in the presence and absence of NCS) Fluorescence Intensity at 525 nm Fluorescence Intensity at 525 nm NCS (0 µM) NCS (10 µM) Hg(II) (ppb) Experiment 1 Experiment 2 Experiment 3 Experiment 1 Experiment 2 Experiment 3
0 93,437 95,214 91,939 113,500 118,865 90,655
1 88,367 87,989 95,099 115,903 97,864 86,079
2 98,127 94,984 98,868 123,178 108,727 105,237
4 148,359 139,291 131,736 194,461 174,364 164,390
8 325,719 325,374 318,313 350,621 325,686 316,996
16 723,429 687,763 667,157 628,281 592,269 584,781
32 1,306,980 1,329,130 1,250,040 1,248,280 1,134,040 1,161,480
Table S4. Raw data for Figure 3b (Mercury detection in river water) Fluorescence Intensity at 525 nm
Table S5. Raw data for Figure 3c (Mercury detection in river water in the presence of organic compound)
Fluorescence Intensity at 525 nm Hg(-) Hg(+)
Contaminant Experiment 1 Experiment 2 Experiment 3 Experiment1 Experiment 2 Experiment 3
- 247,721 228,629 229,633 267,340 262,732 270,796
Phenol 235,097 225,650 205,965 261,793 256,543 267,291
Acetophenone 237,402 227,724 217,980 254,733 269,068 270,270
Caffeine 226,572 224,432 225,535 256,165 274,582 284,786
Cholesterol 238,323 226,572 218,918 257,103 258,913 255,259
Spiked Hg(II) (ppb) Experiment 1 Experiment 2 Experiment 3
0 314,231 298,957 357,304
1 309,145 293,987 316,651
2 369,187 310,034 317,556
4 362,587 327,612 345,322
8 451,415 404,145 399,274
16 731,000 640,675 647,028
32 1,428,440 1,314,600 1,280,670
64 2,939,690 2,846,650 2,256,380
128 5,364,490 5,814,890 5,463,050
256 8,949,830 8,803,740 8,593,100
S5
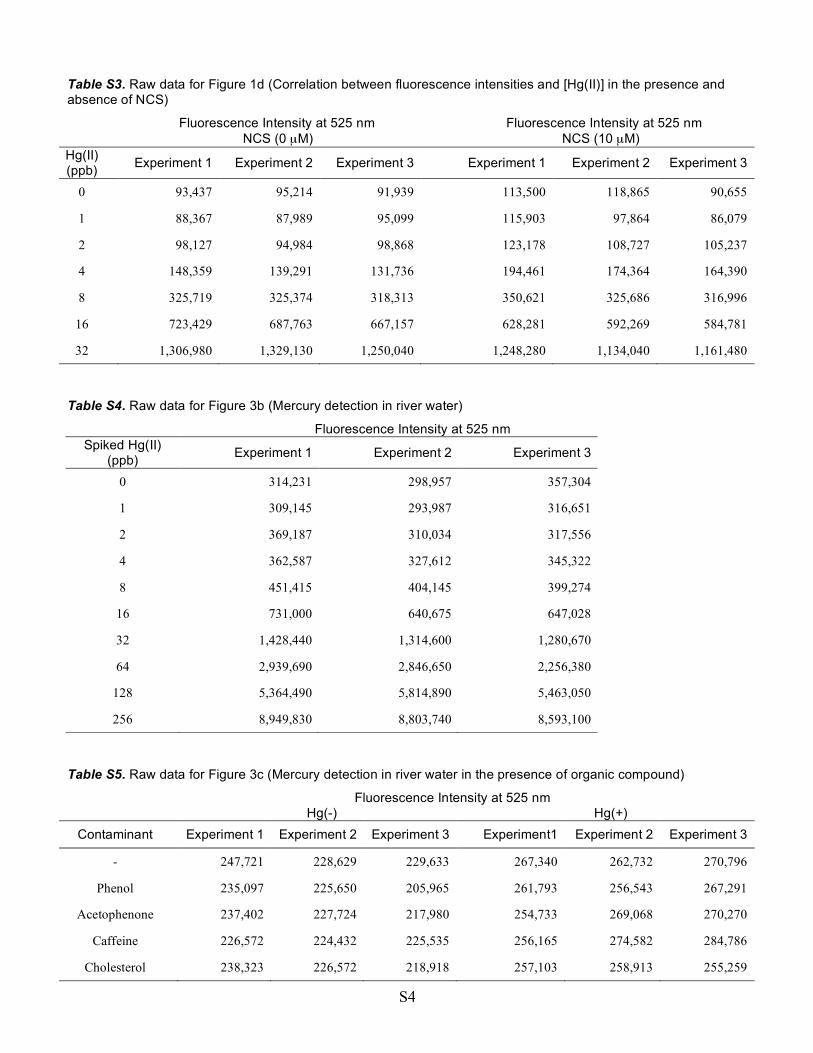
Table S6. Raw data for Figure 3d (dental samples)
Fluorescence Intensity at 525 nm Conditions Experiment 1 Experiment 2 Experiment 3
H2O only 114,306 126,683 120,758
Teeth with H2O 113,335 116,018 126,305
Teeth with cysteine solution 167,123 144,031 153,544
Table S7. Raw data for Figure 5d (Hg(II) vs. fluorescence with 12)
Fluorescence Intensity at 515 nm Hg(II) (ppb) Experiment 1 Experiment 2 Experiment 3
0 114,469 106,823 98,594
1 166,000 168,000 170,000
2 243,103 229,753 234,419
4 450,877 448,544 442,885
8 819,761 810,176 817,535
16 1,480,390 1,468,780 1,491,300
32 2,611,540 2,673,740 2,723,060
Table S8. Raw data for Figure 7 (Application of 12 for the detection of Hg(II) in river water)
Fluorescence Intensity at 515 nm
Spiked Hg(II) (ppb) Experiment 1 Experiment 2 Experiment 3
0.0 124,473 137,218 120,960
0.25 128,482 126,975 146,351
0.50 146,892 129,047 137,446
1.0 172,501 151,219 154,673
2.0 218,897 223,030 201,118
4.0 320,437 311,611 321,717

S6
OO
O
Cl
Cl
OH
Figure S7. 1H NMR spectrum of compound 3 (300 MHz, acetone-d6, 293K)

S7
Figure S8. 13C NMR spectrum of compound 3 (75 MHz, acetone-d6, 293K)
OO
O
Cl
Cl
OH

S8
CHO
HgX
Figure S9. 1H NMR spectrum of compound 8 (300 MHz, acetone-d6, 293K)
Solvent →
Impurity →

S9
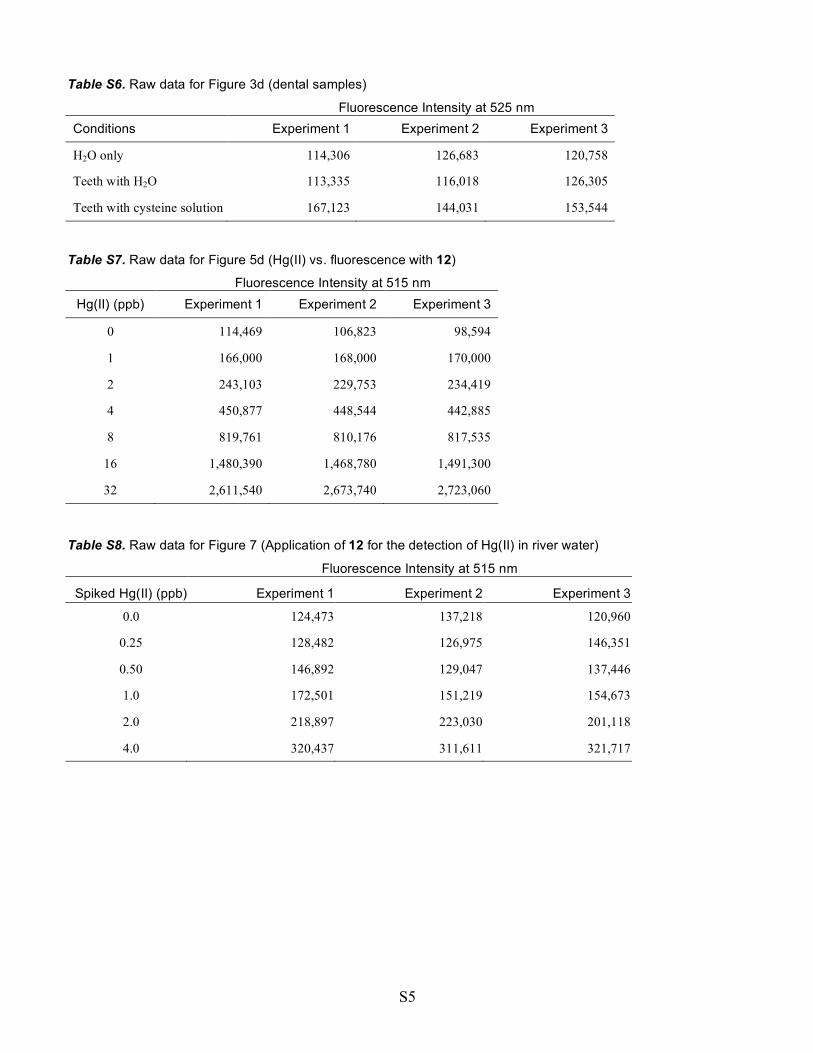
Figure S10. 1H NMR spectrum of compound 10 (300 MHz, CDCl3, 293K)
OO
O
O
O
S10
Figure S10. 1H NMR spectrum of compound 10 (continued)
OO
O
O
O

S11
Figure S11. 13C NMR spectrum of compound 10 (75 MHz, CDCl3, 293K)
OO
O
O
O
S12
OO
O
OH
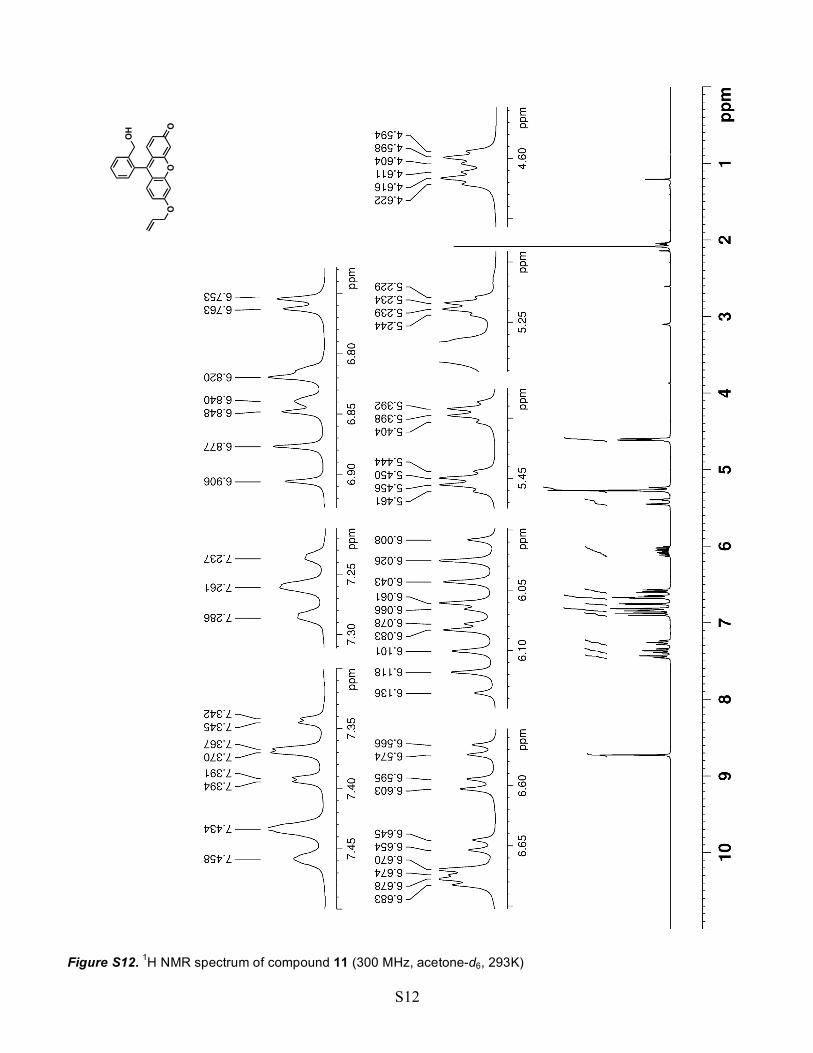
Figure S12. 1H NMR spectrum of compound 11 (300 MHz, acetone-d6, 293K)

S13
Figure S13. 13C NMR spectrum of compound 11 (75 MHz, acetone-d6, 293K)
OO
O
OH

S14
Figure S14. 1H NMR spectrum of compound 12 (400 MHz, acetone-d6, 293K)
OO
O
OH
S15
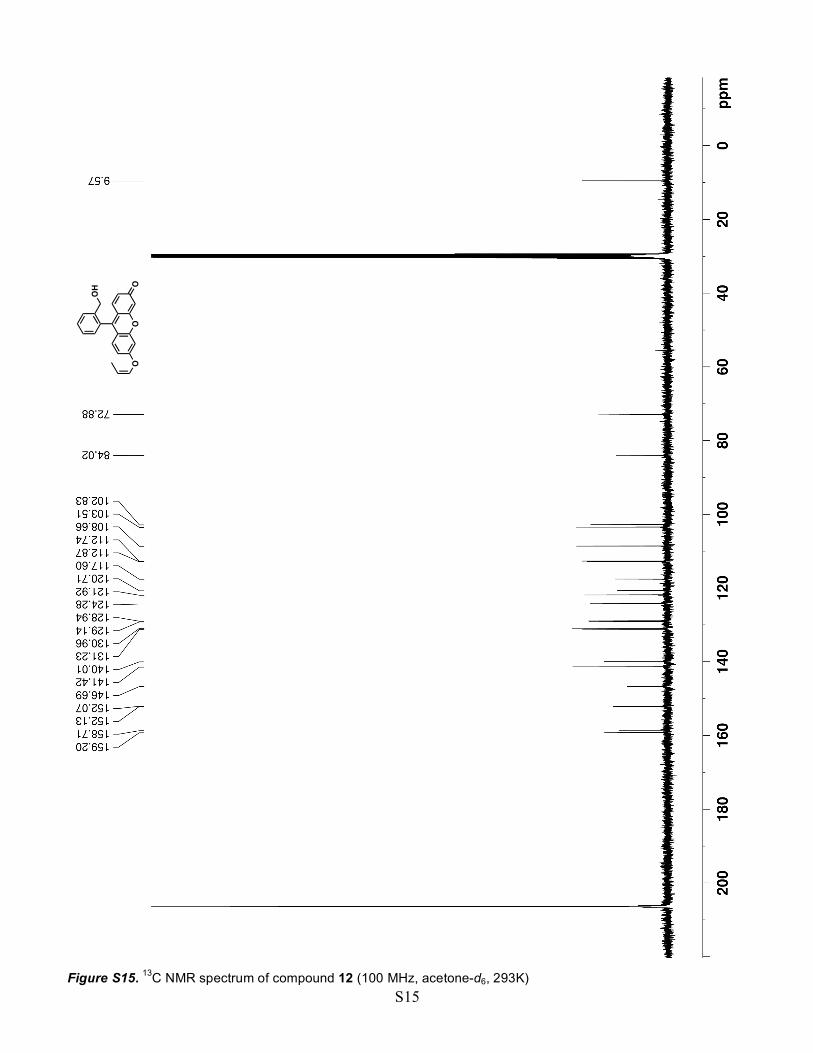
Figure S15. 13C NMR spectrum of compound 12 (100 MHz, acetone-d6, 293K)
OO
O
OH

S16
Figure S16. 1H NMR spectrum of compound 13 (300 MHz, acetone-d6, 293K)
OO
HO
OH

S17
Figure S17. 13C NMR spectrum of compound 13 (75 MHz, acetone-d6, 293K)
OO
HO
OH

S18
Interference of oxymercuration by chloride ions. A solution of compound 3 (8.5 mg, 20 µmol) in DMSO (200 µL) was treated with pH 4.0 buffer (50 mM, 3.8 mL), NaCl (0.58 g, 10 mmol), and then HgCl2 (14 mg, 50 µmol) at 25 °C. After stirring for 1 h at 25 °C, the reaction mixture was extracted with EtOAc (3 × 5 mL). The combined organic layers were washed with H2O (2 × 15 mL) and brine (15 mL), dried over Na2SO4, filtered, and concentrated under reduced pressure. The crude mixture was dissolved in acetone-d6 and analyzed by 1H NMR spectroscopy (see below).
Figure S18. 1H NMR spectrum of 3 before and after the treatment with HgCl2 in the presence of NaCl (300 MHz, acetone-d6, 293K)

S19
Mercury detection in wastewater. Pretreatment: 10 N NaOH (500 µL) was added to samples A and B from a
coal-fired power plant (10 mL). This operation was important to remove the fluorescence contaminants, although
we have not yet characterized the contaminants. The precipitated solid was removed by centrifuge (4000 rpm, 15
min). The supernatant was neutralized with 69% OmniTrace UltraTM High Purity Acid HNO3 (Hg < 10 ppt), and 5.0
mL of the resulting solution was added to the salt of pH 4 buffer (dried salts from 5.0 mL of 50 mM phthalate buffer).
Detection: A solution of AgNO3 (20 µL, 100 mM in ARISTAR® ULTRA water, [AgNO3]final = 2.0 mM) was
added to the treated samples A and B (1.0 mL, triplicate), and the resulting mixtures were shaken by vortex for 2 s.
A solution of compound 12 (10 µL, 0.1 mM in 50% DMSO/50 mM phosphate pH 8 buffer, [probe]final = 1.0 µM) was
added to the resulting mixtures. After incubating at 25 °C for 1 h, the reaction mixtures were basified with 500 mM
borate pH 10 buffer (200 µL) and 1.23 M phosphate pH 7 buffer (40 µL). The solid precipitates were removed by
centrifuge (2000 rpm, 1 min), and the resulting supernatants were used for the fluorescence measurement.
The signal from Sample A (see the graph below) indicated that ~8 ppb Hg was present in the original
sample. We did not observe any increased signal from Sample B, indicating that there was not a detectable amount
of Hg in this sample. The ICP-MS analysis of samples A and B indicated that the Hg concentrations in these
sampled were 2 ppb and below 500 ppt, respectively.