Supporting Information for Development and Applications of ...
Online Supporting Information’s for
A new Route for the Shape-selective formation of Magnetic MnWO4
Nanomaterials on DNA Scaffold: Catalytic and Supercapacitor
Applications
U. Nithiyanantham,† Sivasankara Rao Ede,† T. Kesavan,# P. Ragupathy,# M. D. Mukadam,$ S.
M. Yusuf $ and Subrata Kundu†*
†Electrochemical Materials Science (ECMS) Division, #Fuel Cell Division, CSIR-Central
Electrochemical Research Institute (CECRI), Karaikudi-630006, Tamil Nadu, INDIA.
$Solid State Physics Division, Bhabha Atomic Research Centre (BARC), Trombay, Mumbai 400085,
INDIA.
Instruments
The shape-selective MnWO4 nanomaterials on DNA scaffold were characterized
using several spectroscopic techniques. The UV-Visible (UV-Vis) absorption spectra were
recorded in double beam spectrophotometer purchased from Unico (model 4802 UV-Vis
spectrophotometer) equipped with a 1 cm quartz cuvette holder for liquid samples. A part of
the samples also characterized with another. The transmission electron microscopy (TEM)
analysis was done with a Tecnai model TEM instrument (TecnaiTM G2 F20, FEI) with an
accelerating voltage of 200 KV. The Brunauer-Emmett-Teller (BET) analysis was performed
with Quantachrome® ASiQwin™ © 1994-2012, Quantachrome Instruments v2.02 and
nitrogen (N2) gas is used as an adsorptive for the determination of the surface area. The
Energy Dispersive X-ray Spectroscopy (EDS) analysis was done using the Field Emission
Scanning Electron Microscopy (FE-SEM) instrument where a separate EDS detector (INCA)
was connected to that instrument. The X-ray diffraction (XRD) analysis was done using a
PAN analytical Advanced Bragg-Brentano X-ray powder diffractometer (XRD) with Cu Kα
radiation (λ = 0.154178 nm) with a scanning rate of 0.020 s-1 in the 2θ range 10-90°. The
LASER Raman measurements were carried out with Renishaw inVia Raman Microscope
using an excitation wavelength of 632.8 nm (He-Ne laser). The excitation light intensity in
Electronic Supplementary Material (ESI) for RSC Advances.This journal is © The Royal Society of Chemistry 2014
front of the objective was ~10 mW with a spectral collection time of 1 sec for Raman
experiment. The integration time for our measurement was set to 10 sec. The Fourier
Transform Infrared (FT-IR) spectroscopy analysis was done with the model Nexus 670 (FT-
IR), Centaurms 10X (Microscope) having spectral Range 4,000 to 400 cm-1 with a MCT-B
detector. The photoluminescence (PL) study was done with Varian (Cary Eclipse Winflr)
fluorescence spectrophotometer (serial number el02045776) both in excitation and emission
mode using a xenon pump lamps. The thermal analysis study was recorded with a thermal
analyser-simultaneous TGA/DTA instrument with model name SDT Q600 and the analysis
was performed in air. A hot air oven (temperature up to 1000 °C) was used to anneal the
samples at specific temperature. The DC magnetization measurements were carried out, using
a vibrating sample magnetometer (Cryogenic, UK make) and the electrochemical studies
were carried out using an electrochemical work station (Princeton Applied Research,
PARSTAT 4000) and further details are given below. A domestic microwave (MW) oven
(Samsung Company, DE68-03714B) was used for the MW heating during the entire
synthesis. The output power was 1000 W and the operating frequency was 2450 MHz.
UV-Visible and Energy Dispersive X-ray Spectroscopy (EDS) analysis
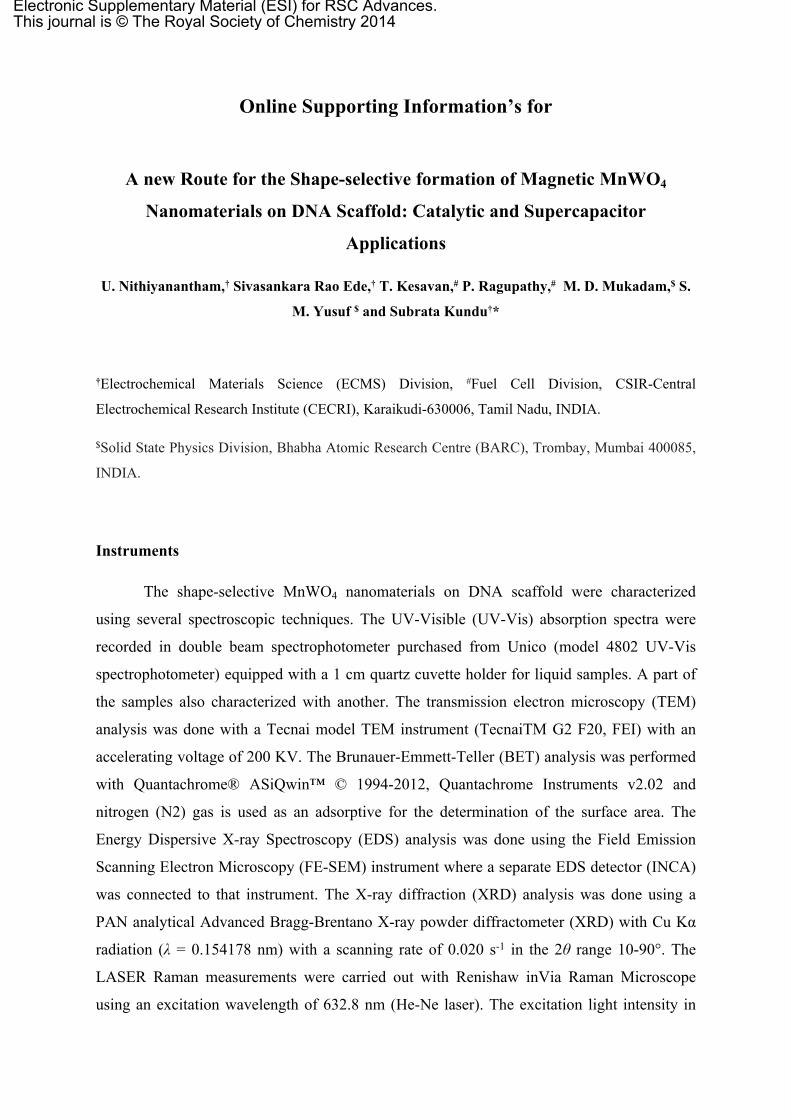
Figure S-1 shows the diffuse reflectance spectra of solid MnWO4 nanomaterials for
three different morphologies. The spectra for the aqueous dispersion are given in main
document as Figure 1. Figure S-3 shows the energy dispersive X-ray spectroscopic (EDS)
analysis of the rice-like MnWO4 nanomaterials on DNA scaffold. Here, we showing the
analysis taking rice-like MnWO4 nanomaterials although other morphology also expected to
generate similar types of spectra feature as all are prepared by using the DNA molecule. An
EDS analysis is used to identify the probable elements present in the product and the
spectrum is consists of the different peaks corresponding to Mn, O, W, P and Na. The large
and high intense peak for W, Mn and O came from the MnWO4 nanomaterials. The small
intense P peak came from the DNA which is used as a stabilizing or capping agent for the
formation and growth of the MnWO4 nanomaterials. A very low intense Na peak is also
appeared probably from the DNA or from the Na2WO4 as used during our synthesis.
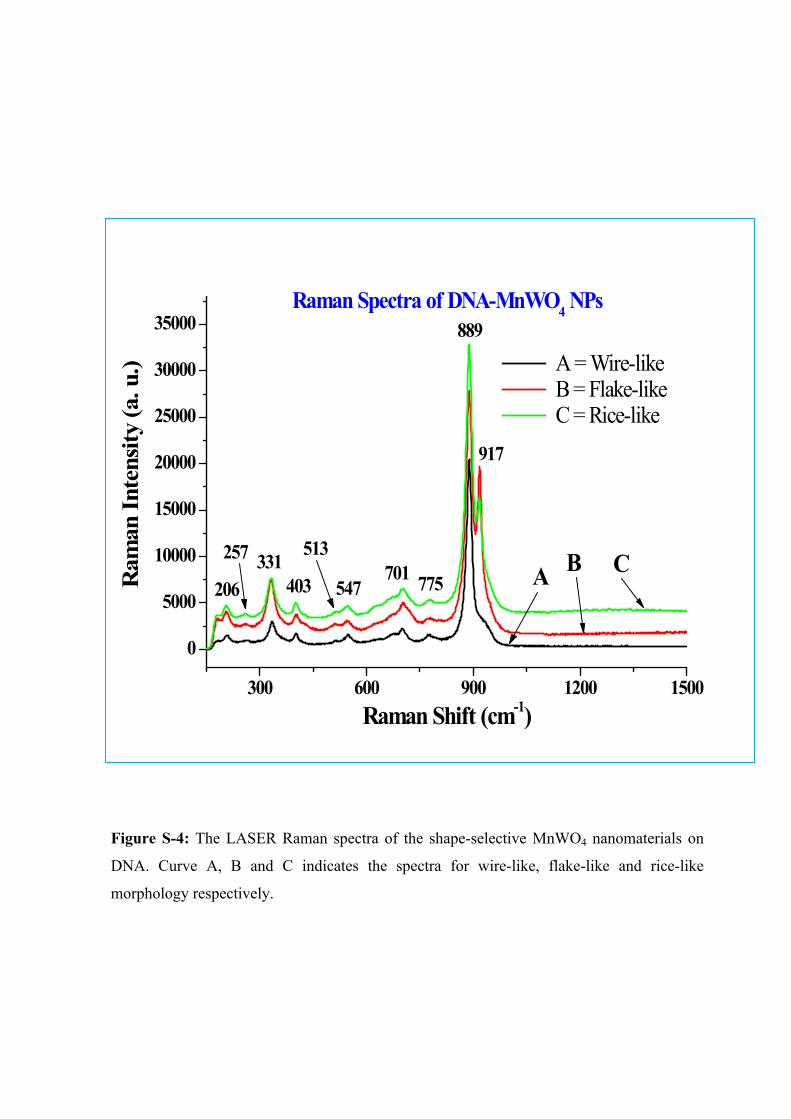
LASER Raman study
Figure S-4 shows the LASER Raman spectra of the shape-selective MnWO4
nanomaterials on DNA. In Figure S-4, curve A, B and C indicates the spectra for wire-like,
flake-like and rice-like morphology respectively. The Raman spectra is very similar to those
of huebnerite structured MnWO4.40 Two very strong bands at 917 cm-1 and 889 cm-1 is
belongs to symmetric Ag mode and a weak 775 cm-1 band belongs to anti-symmetric Bg
mode of terminal WO2 group. The 701 and 672 cm-1 band corresponds to asymmetric Ag and
Bg modes of (W2O4)n chain. The 547 cm-1 and 513 cm-1 band corresponds to asymmetric Ag
and Bg mode. The 403 cm-1 and 331 cm-1 band corresponds to the deformation mode of
terminal WO2 group.41 The 257 cm-1 and 206 cm-1 bands corresponds to the deformation
mode of the Ag due to cationic sub-lattices. It was found that at lower wave-number the
vibration frequency is small and the structure is more regular. Whereas at higher wave
number, the vibration frequency is much higher and the structure is more distorted which
found similarity by others. 42 Our result found similarity with earlier reports by Thongtem et
al. for their study on MnWO4 nanomaterials.42
Study of other reaction parameters
We did some control experiments and checked the effect of different reaction
parameters on the formation of shape-selective MnWO4 nanomaterials on DNA. The specific
morphology of rice-like, flake-like and wire-like shapes are formed at a particular
concentration those are given details in Table 1 (in main text). From Table 1 we can see that
at low DNA concentration, rice-like shapes are formed whereas at high DNA concentration
the wire-like shapes are formed, while at intermediate concentration, flake-like shapes are
formed. We did few control experiments keeping other reagents concentration fixed to check
the specific role of DNA or other reaction parameters. We have observed that when we use
DNA concentration very high like ~ 1.27 × 10⁻¹ (M) or more, the MnWO4 particles formed
aggregated structure as seen in Figure S-5A. Similarly, when we used DNA concentration
very low ~ 1.3 × 10⁻⁵ (M), the MnWO4 particles formed agglomerated structure due to
presence of very less amounts of stabilizer as seen in Figure S-5B. Similar types of results
(aggregated structure) obtained in absence of DNA also. In the synthesis, if we used Mn(II)
salt concentration very high (≥ 5 × 10⁻¹ M), the solution immediate resulted white color
precipitate just after addition of Na2WO4 and from the TEM analysis it was shown that the
solution contains mixture of different shapes with no specific morphology (Figure S-5C). On
the other hand when Mn(II) salt concentration very less (≤ 10-4 M), the reaction takes long
time for the generation of particles and amounts of product is also very less. Similar types of
observation was also noticed for Na2WO4 where at high concentration of tungstate ions
results the formation of particles very fast while low concentration take longer time with
lower yield of the particles. We also observed that the microwave heating time is important
parameter for the formation of shape-selective MnWO4 nanomaterials. We have seen that
five minute heating time is sufficient to the generation of MnWO4 particles with specific
morphology as given in Table 1. While we heat the reaction mixture for longer period (> 10
minute) there is no significant change of particles morphology was observed whereas, heating
the solution mixture for lesser time (40-60 seconds), results spherical particles as observed
from the TEM image at Figure S-5D. So from all the above control experiments it is
confirmed that the MnWO4 nanomaterials at specific morphology are formed only at a certain
concentrations.
200 250 300 350 4001.0
1.1
1.2
1.3
1.4
1.5
1.6
1.7
1.8
C
B
A
Diffuse Reflectance Spectra of Shape-selective MnWO4 Nanomaterials
A = Wire-like B = Rice-like C = Flake-like
Diff
use R
efle
ctan
ce
Wavelength (nm)
Figure S-1: UV-Vis diffuse reflectance spectra of solid MnWO4 nanomaterials. Curve A, B and C denotes the spectra for wire-like, rice-like and flake-like morphologies respectively.
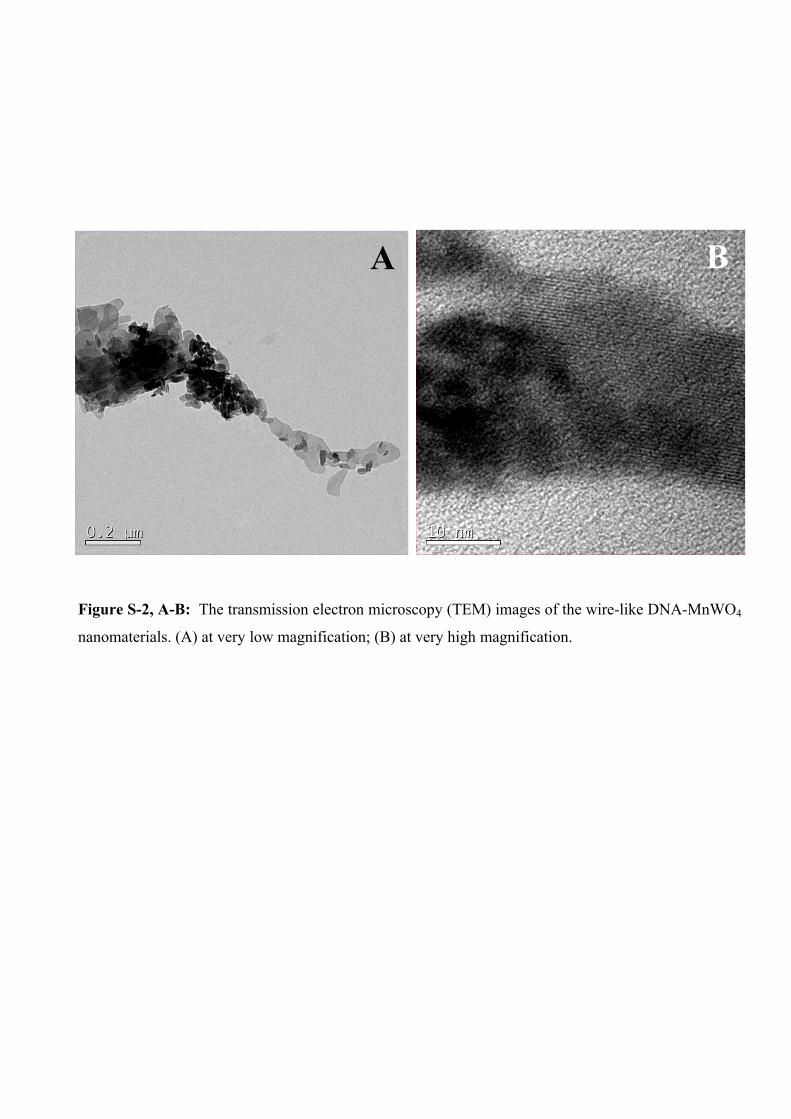
Figure S-2, A-B: The transmission electron microscopy (TEM) images of the wire-like DNA-MnWO4
nanomaterials. (A) at very low magnification; (B) at very high magnification.
A B
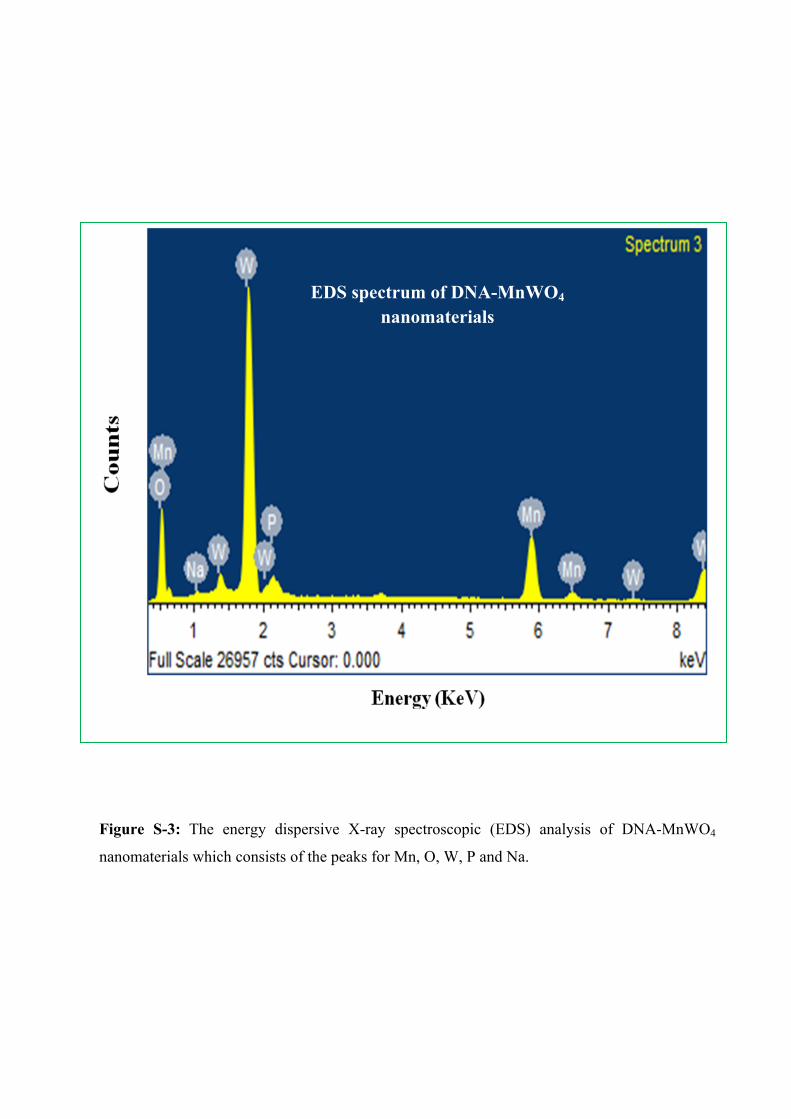
Figure S-3: The energy dispersive X-ray spectroscopic (EDS) analysis of DNA-MnWO4
nanomaterials which consists of the peaks for Mn, O, W, P and Na.
EDS spectrum of DNA-MnWO4 nanomaterials
EDS spectrum of
CoO NPs
Figure S-4: The LASER Raman spectra of the shape-selective MnWO4 nanomaterials on
DNA. Curve A, B and C indicates the spectra for wire-like, flake-like and rice-like
morphology respectively.
300 600 900 1200 1500
0
5000
10000
15000
20000
25000
30000
35000
257 513
917
889
775 701 547 403
331 206
BA C
Raman Spectra of DNA-MnWO4 NPs
A = Wire-like B = Flake-like C = Rice-like
Ram
an In
tens
ity (a
. u.)
Raman Shift (cm-1)
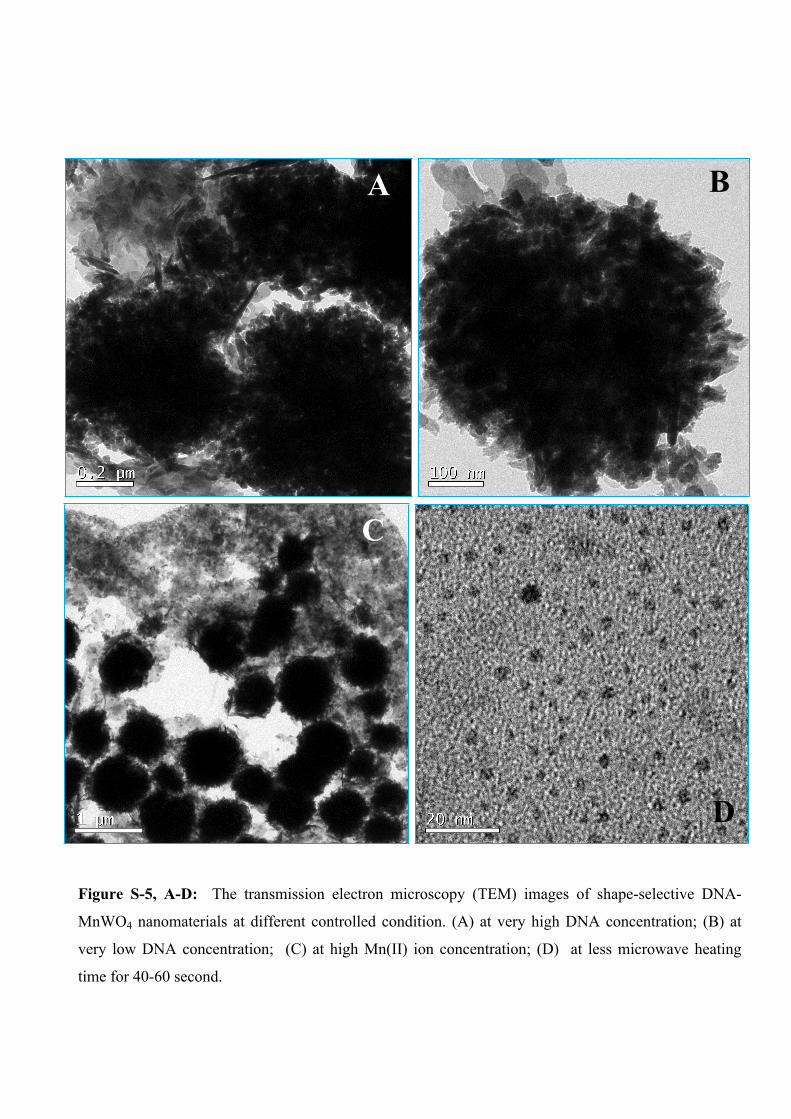
Figure S-5, A-D: The transmission electron microscopy (TEM) images of shape-selective DNA-
MnWO4 nanomaterials at different controlled condition. (A) at very high DNA concentration; (B) at
very low DNA concentration; (C) at high Mn(II) ion concentration; (D) at less microwave heating
time for 40-60 second.
A B
C
D
References 40-43 in the above text are given in the main document.
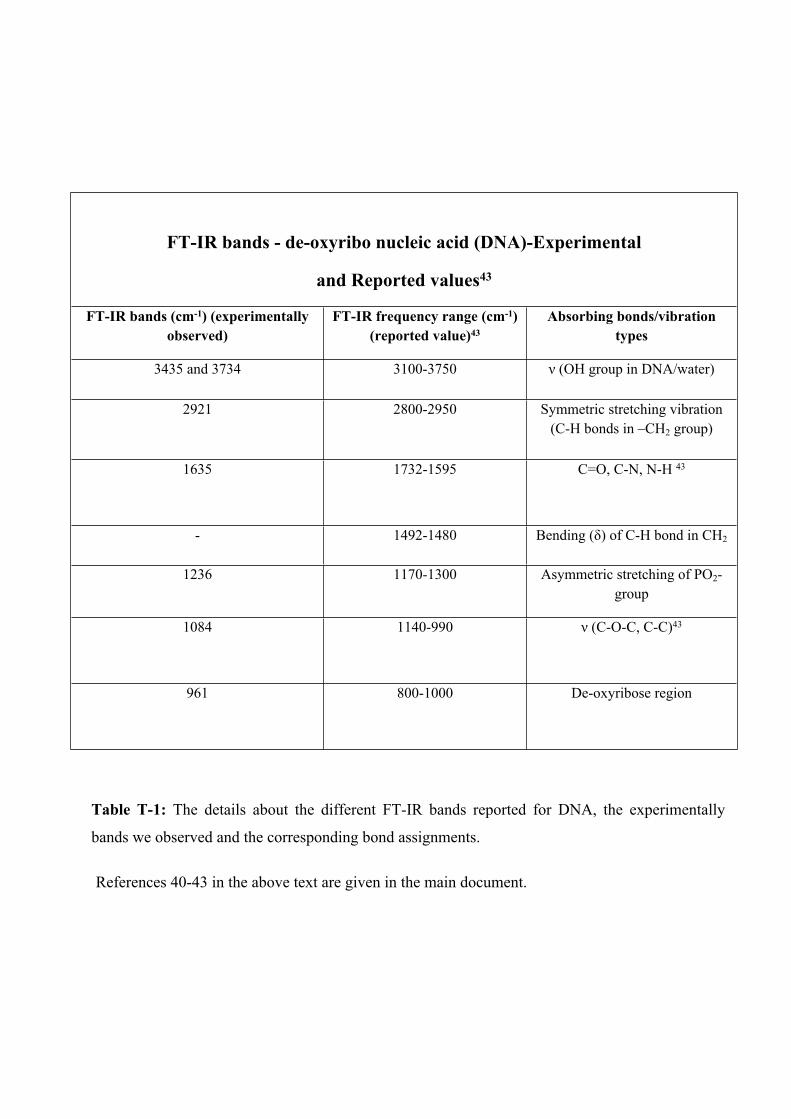
FT-IR bands - de-oxyribo nucleic acid (DNA)-Experimental
and Reported values43
FT-IR bands (cm-1) (experimentally observed)
FT-IR frequency range (cm-1) (reported value)43
Absorbing bonds/vibration types
3435 and 3734 3100-3750 ν (OH group in DNA/water)
2921 2800-2950 Symmetric stretching vibration (C-H bonds in –CH2 group)
1635 1732-1595 C=O, C-N, N-H 43
- 1492-1480 Bending (δ) of C-H bond in CH2
1236 1170-1300 Asymmetric stretching of PO2- group
1084 1140-990 ν (C-O-C, C-C)43
961 800-1000 De-oxyribose region
Table T-1: The details about the different FT-IR bands reported for DNA, the experimentally
bands we observed and the corresponding bond assignments.