Support the Greater Minnesota BDPI program and help grow ...
4
The Greater MN Business Development Public Infrastructure (BDPI) Grant Program Providing the public infrastructure necessary for private investment * Jobs data for recently announced grant to Le Sueur for Cambria expansion not yet included, as job numbers are not yet known. Prepared by Flaherty and Hood, P.A. for the Coalition of Greater MN Cities, 1/11/2017 What is BDPI? The BDPI program provides grants to cities in Greater Minnesota of up to 50% of the capital costs of the public infrastructure necessary to expand economic growth, retain or create jobs, or increase the tax base (§ 116J.431). Greater Minnesota cities depend on the grant program to attract new businesses and create jobs in their communities. BDPI Quick Facts 194 Greater Minnesota cities and counties have received BDPI grants since FY 2003 2,214 jobs created and 8,851 jobs retained since 2003 * More than $57.8 million awarded since 2003 “This program has an outstanding return on investment” --DEED, State of Minnesota 2010 Preliminary Capital Budget Requests, 7/15/2009 “One of DEED’s best programs” --MMB Director Tom Hanson, press conference regarding governor’s 2010 Bonding Bill Requests 2017 BDPI Proposal: - Bonding Appropriation: At least $15 million - General Fund Appropriation: $2 million ongoing Support the Greater Minnesota BDPI program and help grow Greater Minnesota’s economy
Transcript of Support the Greater Minnesota BDPI program and help grow ...

The Greater MN Business Development Public Infrastructure (BDPI) Grant Program Providing the public infrastructure necessary for private investment
* Jobs data for recently announced grant to Le Sueur for Cambria expansion not yet included, as job numbers are not yet known.
Prepared by Flaherty and Hood, P.A. for the Coalition of Greater MN Cities, 1/11/2017
What is BDPI?
The BDPI program provides grants to cities in Greater Minnesota of up to 50% of the capital costs of the public infrastructure necessary to expand economic growth, retain or create jobs, or increase the tax base (§ 116J.431).
Greater Minnesota cities depend on the grant program to attract new businesses and create jobs in their communities.
BDPI Quick Facts
194 Greater Minnesota cities and counties have received BDPI grants since FY 2003
2,214 jobs created and 8,851 jobs retained since 2003*
More than $57.8 million awarded since 2003
“This program has an outstanding return on investment” --DEED, State of Minnesota 2010 Preliminary Capital Budget Requests, 7/15/2009
“One of DEED’s best programs” --MMB Director Tom Hanson, press conference regarding governor’s 2010 Bonding Bill Requests
2017 BDPI Proposal: - Bonding Appropriation: At least $15 million - General Fund Appropriation: $2 million ongoing
Support the Greater Minnesota BDPI program and help grow Greater Minnesota’s economy
Prepared by Flaherty and Hood, P.A. for the Coalition of Greater MN Cities, 1/12/2017
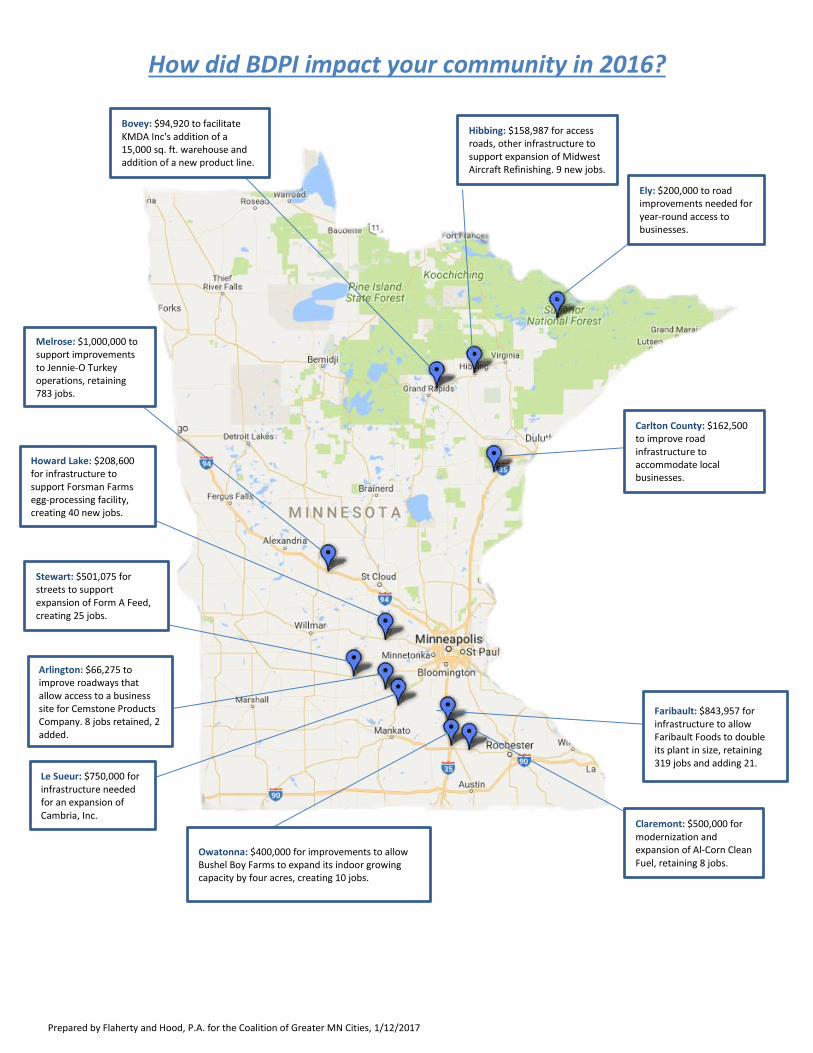
How did BDPI impact your community in 2016?
Bovey: $94,920 to facilitate KMDA Inc's addition of a 15,000 sq. ft. warehouse and addition of a new product line.
Hibbing: $158,987 for access roads, other infrastructure to support expansion of Midwest Aircraft Refinishing. 9 new jobs.
Ely: $200,000 to road improvements needed for year-round access to businesses.
Carlton County: $162,500 to improve road infrastructure to accommodate local businesses.
Faribault: $843,957 for infrastructure to allow Faribault Foods to double its plant in size, retaining 319 jobs and adding 21.
Claremont: $500,000 for modernization and expansion of Al-Corn Clean Fuel, retaining 8 jobs.
Owatonna: $400,000 for improvements to allow Bushel Boy Farms to expand its indoor growing capacity by four acres, creating 10 jobs.
Le Sueur: $750,000 for infrastructure needed for an expansion of Cambria, Inc.
Arlington: $66,275 to improve roadways that allow access to a business site for Cemstone Products Company. 8 jobs retained, 2 added.
Stewart: $501,075 for streets to support expansion of Form A Feed, creating 25 jobs.
Howard Lake: $208,600 for infrastructure to support Forsman Farms egg-processing facility, creating 40 new jobs.
Melrose: $1,000,000 to support improvements to Jennie-O Turkey operations, retaining 783 jobs.
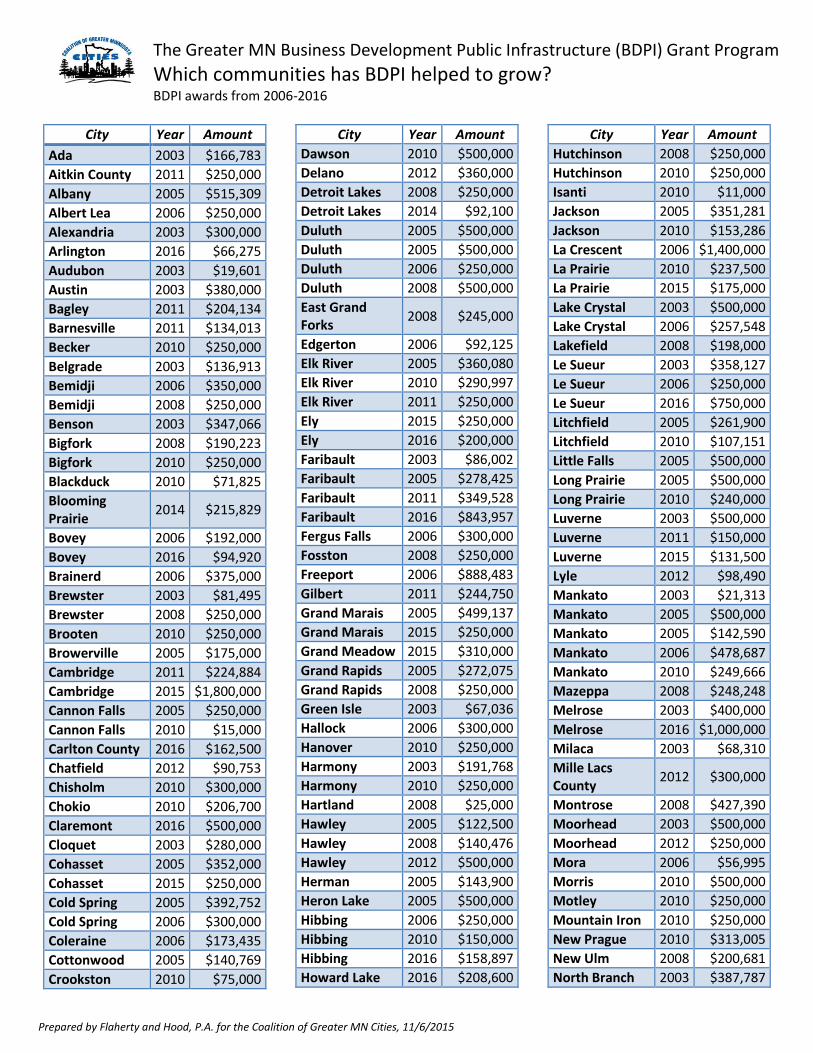
The Greater MN Business Development Public Infrastructure (BDPI) Grant Program
Which communities has BDPI helped to grow? BDPI awards from 2006-2016
Prepared by Flaherty and Hood, P.A. for the Coalition of Greater MN Cities, 11/6/2015
City Year Amount
Ada 2003 $166,783
Aitkin County 2011 $250,000
Albany 2005 $515,309
Albert Lea 2006 $250,000
Alexandria 2003 $300,000
Arlington 2016 $66,275
Audubon 2003 $19,601
Austin 2003 $380,000
Bagley 2011 $204,134
Barnesville 2011 $134,013
Becker 2010 $250,000
Belgrade 2003 $136,913
Bemidji 2006 $350,000
Bemidji 2008 $250,000
Benson 2003 $347,066
Bigfork 2008 $190,223
Bigfork 2010 $250,000
Blackduck 2010 $71,825
Blooming Prairie
2014 $215,829
Bovey 2006 $192,000
Bovey 2016 $94,920
Brainerd 2006 $375,000
Brewster 2003 $81,495
Brewster 2008 $250,000
Brooten 2010 $250,000
Browerville 2005 $175,000
Cambridge 2011 $224,884
Cambridge 2015 $1,800,000
Cannon Falls 2005 $250,000
Cannon Falls 2010 $15,000
Carlton County 2016 $162,500
Chatfield 2012 $90,753
Chisholm 2010 $300,000
Chokio 2010 $206,700
Claremont 2016 $500,000
Cloquet 2003 $280,000
Cohasset 2005 $352,000
Cohasset 2015 $250,000
Cold Spring 2005 $392,752
Cold Spring 2006 $300,000
Coleraine 2006 $173,435
Cottonwood 2005 $140,769
Crookston 2010 $75,000
City Year Amount
Dawson 2010 $500,000
Delano 2012 $360,000
Detroit Lakes 2008 $250,000
Detroit Lakes 2014 $92,100
Duluth 2005 $500,000
Duluth 2005 $500,000
Duluth 2006 $250,000
Duluth 2008 $500,000
East Grand Forks
2008 $245,000
Edgerton 2006 $92,125
Elk River 2005 $360,080
Elk River 2010 $290,997
Elk River 2011 $250,000
Ely 2015 $250,000
Ely 2016 $200,000
Faribault 2003 $86,002
Faribault 2005 $278,425
Faribault 2011 $349,528
Faribault 2016 $843,957
Fergus Falls 2006 $300,000
Fosston 2008 $250,000
Freeport 2006 $888,483
Gilbert 2011 $244,750
Grand Marais 2005 $499,137
Grand Marais 2015 $250,000
Grand Meadow 2015 $310,000
Grand Rapids 2005 $272,075
Grand Rapids 2008 $250,000
Green Isle 2003 $67,036
Hallock 2006 $300,000
Hanover 2010 $250,000
Harmony 2003 $191,768
Harmony 2010 $250,000
Hartland 2008 $25,000
Hawley 2005 $122,500
Hawley 2008 $140,476
Hawley 2012 $500,000
Herman 2005 $143,900
Heron Lake 2005 $500,000
Hibbing 2006 $250,000
Hibbing 2010 $150,000
Hibbing 2016 $158,897
Howard Lake 2016 $208,600
City Year Amount
Hutchinson 2008 $250,000
Hutchinson 2010 $250,000
Isanti 2010 $11,000
Jackson 2005 $351,281
Jackson 2010 $153,286
La Crescent 2006 $1,400,000
La Prairie 2010 $237,500
La Prairie 2015 $175,000
Lake Crystal 2003 $500,000
Lake Crystal 2006 $257,548
Lakefield 2008 $198,000
Le Sueur 2003 $358,127
Le Sueur 2006 $250,000
Le Sueur 2016 $750,000
Litchfield 2005 $261,900
Litchfield 2010 $107,151
Little Falls 2005 $500,000
Long Prairie 2005 $500,000
Long Prairie 2010 $240,000
Luverne 2003 $500,000
Luverne 2011 $150,000
Luverne 2015 $131,500
Lyle 2012 $98,490
Mankato 2003 $21,313
Mankato 2005 $500,000
Mankato 2005 $142,590
Mankato 2006 $478,687
Mankato 2010 $249,666
Mazeppa 2008 $248,248
Melrose 2003 $400,000
Melrose 2016 $1,000,000
Milaca 2003 $68,310
Mille Lacs County
2012 $300,000
Montrose 2008 $427,390
Moorhead 2003 $500,000
Moorhead 2012 $250,000
Mora 2006 $56,995
Morris 2010 $500,000
Motley 2010 $250,000
Mountain Iron 2010 $250,000
New Prague 2010 $313,005
New Ulm 2008 $200,681
North Branch 2003 $387,787
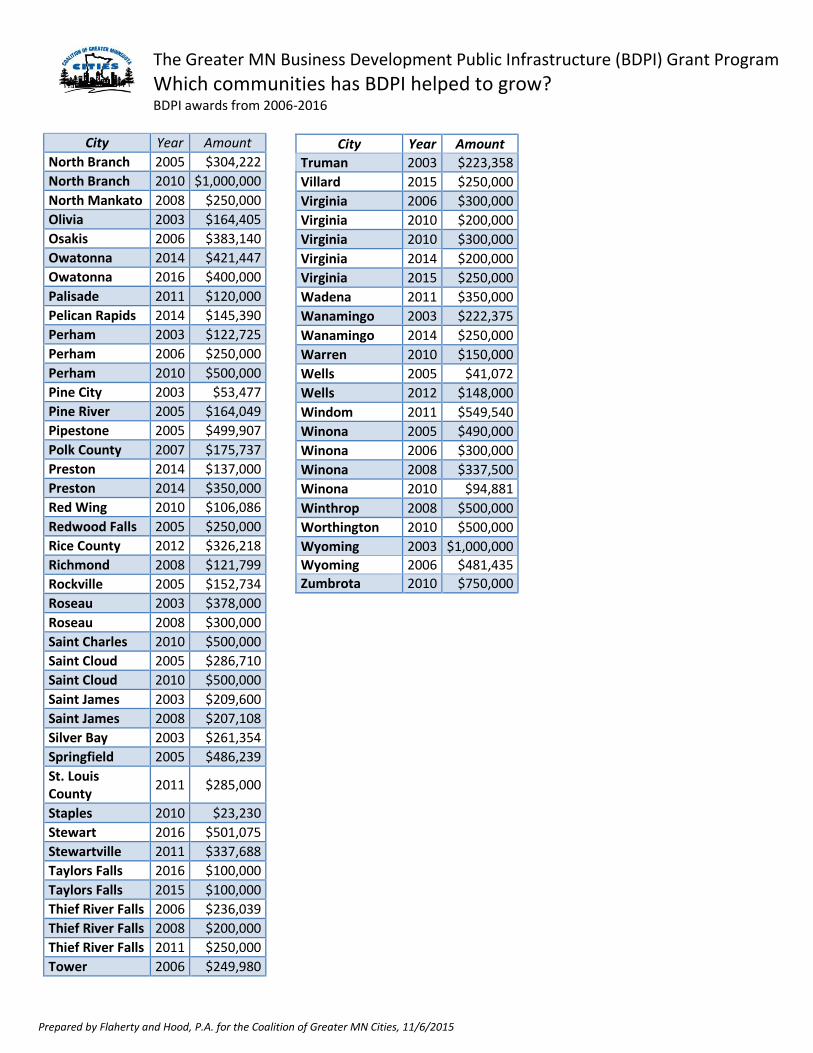
The Greater MN Business Development Public Infrastructure (BDPI) Grant Program
Which communities has BDPI helped to grow? BDPI awards from 2006-2016
Prepared by Flaherty and Hood, P.A. for the Coalition of Greater MN Cities, 11/6/2015
City Year Amount
North Branch 2005 $304,222
North Branch 2010 $1,000,000
North Mankato 2008 $250,000
Olivia 2003 $164,405
Osakis 2006 $383,140
Owatonna 2014 $421,447
Owatonna 2016 $400,000
Palisade 2011 $120,000
Pelican Rapids 2014 $145,390
Perham 2003 $122,725
Perham 2006 $250,000
Perham 2010 $500,000
Pine City 2003 $53,477
Pine River 2005 $164,049
Pipestone 2005 $499,907
Polk County 2007 $175,737
Preston 2014 $137,000
Preston 2014 $350,000
Red Wing 2010 $106,086
Redwood Falls 2005 $250,000
Rice County 2012 $326,218
Richmond 2008 $121,799
Rockville 2005 $152,734
Roseau 2003 $378,000
Roseau 2008 $300,000
Saint Charles 2010 $500,000
Saint Cloud 2005 $286,710
Saint Cloud 2010 $500,000
Saint James 2003 $209,600
Saint James 2008 $207,108
Silver Bay 2003 $261,354
Springfield 2005 $486,239
St. Louis County
2011 $285,000
Staples 2010 $23,230
Stewart 2016 $501,075
Stewartville 2011 $337,688
Taylors Falls 2016 $100,000
Taylors Falls 2015 $100,000
Thief River Falls 2006 $236,039
Thief River Falls 2008 $200,000
Thief River Falls 2011 $250,000
Tower 2006 $249,980
City Year Amount
Truman 2003 $223,358
Villard 2015 $250,000
Virginia 2006 $300,000
Virginia 2010 $200,000
Virginia 2010 $300,000
Virginia 2014 $200,000
Virginia 2015 $250,000
Wadena 2011 $350,000
Wanamingo 2003 $222,375
Wanamingo 2014 $250,000
Warren 2010 $150,000
Wells 2005 $41,072
Wells 2012 $148,000
Windom 2011 $549,540
Winona 2005 $490,000
Winona 2006 $300,000
Winona 2008 $337,500
Winona 2010 $94,881
Winthrop 2008 $500,000
Worthington 2010 $500,000
Wyoming 2003 $1,000,000
Wyoming 2006 $481,435
Zumbrota 2010 $750,000