Supply-side Indicators for the UK Economy Tutor2u Economics February 2009.
21
Supply-side Indicators for the UK Economy Tutor2u Economics February 2009
-
Upload
martin-ball -
Category
Documents
-
view
214 -
download
0
Transcript of Supply-side Indicators for the UK Economy Tutor2u Economics February 2009.

Supply-side Indicators for the UK Economy
Tutor2u Economics
February 2009

Key supply side concepts
• Aggregate supply• Incentives for people and businesses• Productivity• The economy’s productive potential• Capital Investment• Research and development• Product and Process Innovation• Skills / Human Capital• Competitive markets / market deregulation• Long run economic growth• Non-inflationary growth

What are Supply-Side Policies?
• Supply-side policies are designed to:– Improve incentives for people to get new jobs– Increase the productivity of labour and capital inputs – Increase the occupational and geographical mobility of labour to
reduce unemployment– Increase the level of capital investment and research and
development spending by firms– Stimulate inflows of overseas capital investment– Increase business efficiency by promoting more competition
within and between markets– Stimulate a faster pace of invention and innovation throughout
the economy– Provide a platform for sustained non-inflationary growth of an
economy

Importance of supply-side policies
More productivity - better living
standards
Allows the economy to grow without inflation
More competition - lower prices –
gains in welfare
Makes the UK more competitive in global markets
Increased tax revenues to fund state spending
Provides the platform for long
term growth
Long term importance of supply-side policies for the British economy

Relative productivityLabour productivity relative to the EU average
UK Labour Productivity per Person Employed
Source: Reuters EcoWin
95 96 97 98 99 00 01 02 03 04 05 06 07 08
105
106
107
108
109
110
111
112
113
114E
U2
7=
10
0
105
106
107
108
109
110
111
112
113
114

Estimates of Trend GrowthAnnual % change in potential GDP, source: OECD World Economic Outlook
Estimated Trend Growth Rates
United States Ireland
Euro Zone United Kingdom
Japan SpainSource: OECD World Economic Outlook
90 91 92 93 94 95 96 97 98 99 00 01 02 03 04 05 06 07 08 09 10
0
1
2
3
4
5
6
7
8P
erc
en
t
0
1
2
3
4
5
6
7
8
Ireland
SpainUSA
Japan
UK
Euro Zone
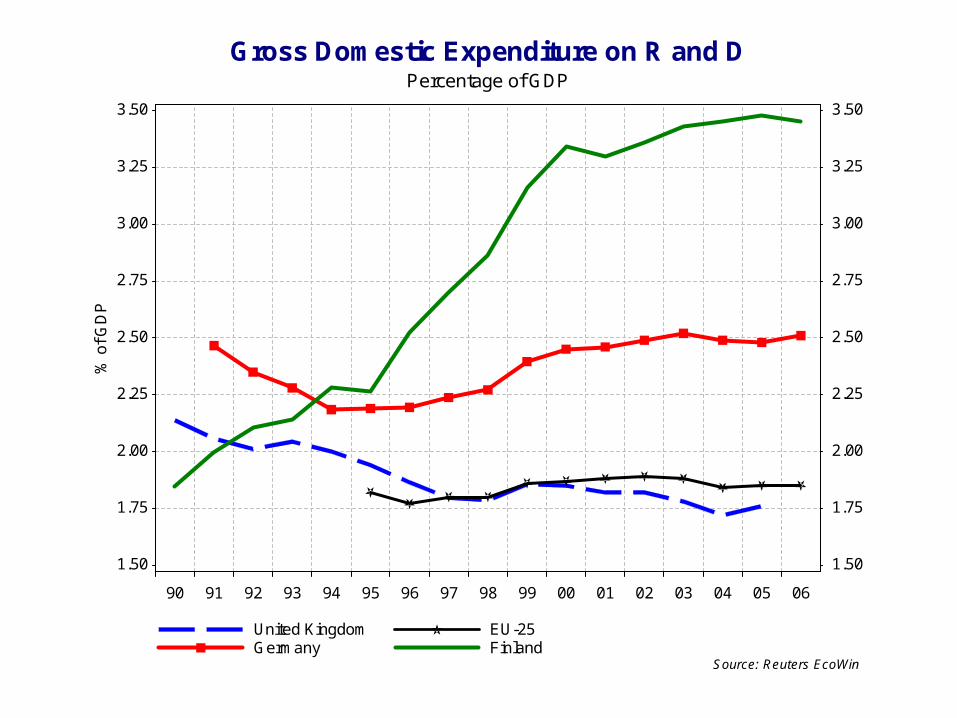
Spending on research and development
Percentage of GDP
Gross Domestic Expenditure on R and D
United Kingdom Germany
EU-25 Finland
Source: Reuters EcoWin
90 91 92 93 94 95 96 97 98 99 00 01 02 03 04 05 06
1.50
1.75
2.00
2.25
2.50
2.75
3.00
3.25
3.50%
of
GD
P
1.50
1.75
2.00
2.25
2.50
2.75
3.00
3.25
3.50
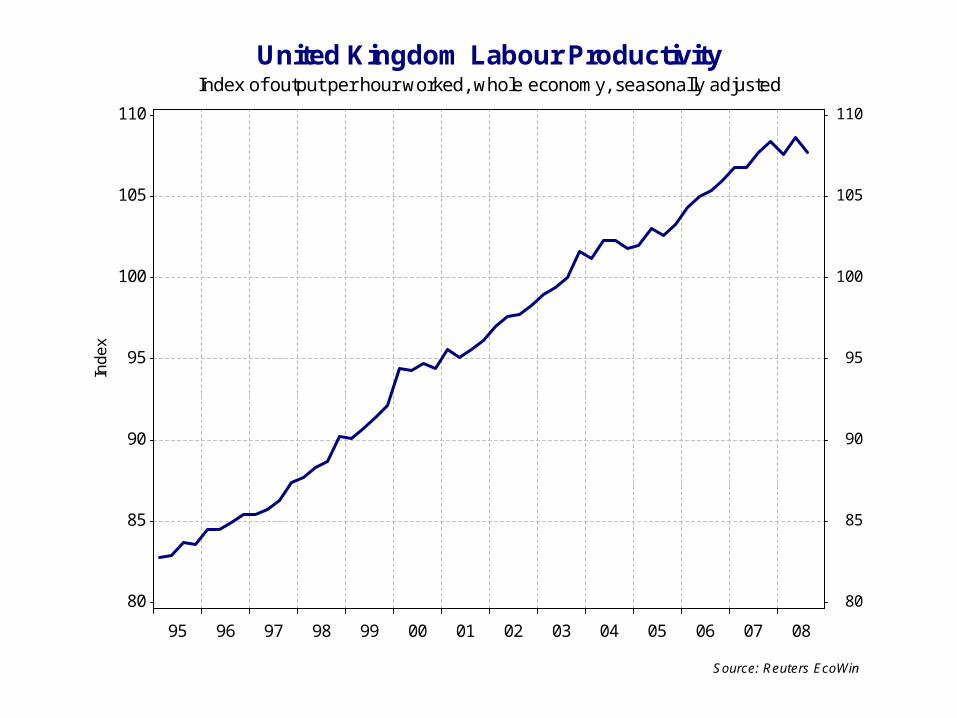
Output per hour workedIndex of output per hour worked, whole economy, seasonally adjusted
United Kingdom Labour Productivity
Source: Reuters EcoWin
95 96 97 98 99 00 01 02 03 04 05 06 07 08
80
85
90
95
100
105
110In
de
x
80
85
90
95
100
105
110

Potential GDP and Trend GrowthSource: OECD World Economic Outlook
UK - Potential GDP and Trend Growth
Source: OECD World Economic Outlook
76 78 80 82 84 86 88 90 92 94 96 98 00 02 04 06 08 10
tho
usa
nd
bill
ion
s
0.5
0.6
0.7
0.8
0.9
1.0
1.1
1.2
1.3
1.4
Re
al G
DP
(th
ou
san
d b
illio
ns)
0.5
0.6
0.7
0.8
0.9
1.0
1.1
1.2
1.3
1.4
Potential GDP
1.50
1.75
2.00
2.25
2.50
2.75
3.00P
erc
en
t
1.50
1.75
2.00
2.25
2.50
2.75
3.00
Trend Growth Rate

Investment and Productivity in the UK Economy
Quarterly value of capital spending at constant 2003 prices, index of labour productivity
Investment and Productivity in the UK Economy
Source: Reuters EcoWin
90 91 92 93 94 95 96 97 98 99 00 01 02 03 04 05 06 07 08
bill
ions
25
30
35
40
45
50
55
60
GB
P (
bill
ions)
25
30
35
40
45
50
55
60
Real value of capital spending, £bn per quarter
mill
ions
87.5
90.0
92.5
95.0
97.5
100.0
102.5
105.02003=
100 (
mill
ions)
87.5
90.0
92.5
95.0
97.5
100.0
102.5
105.0
Output per worker employed, whole economy

Actual and Potential GDP£ thousand billion at constant 2003 prices. Source: OECD
Actual and Potential GDP for the UK
Potential Output Real GDPSource: Reuters EcoWin
80 82 84 86 88 90 92 94 96 98 00 02 04 06 08 10
tho
usa
nd
bill
ion
s
0.6
0.7
0.8
0.9
1.0
1.1
1.2
1.3
1.4G
BP
(th
ou
san
d b
illio
ns)
0.6
0.7
0.8
0.9
1.0
1.1
1.2
1.3
1.4

Investment and GDP GrowthAnnual % change in real GDP and real investment, 2009-10 forecast from OECD
Economic Growth and Capital Investment
United Kingdom, Real GDP, precentage change from previous period, Constant Prices Capital Investment Spending
Source: Reuters EcoWin
88 89 90 91 92 93 94 95 96 97 98 99 00 01 02 03 04 05 06 07 08 09 10
-10
-5
0
5
10
15
20P
erc
en
t
-10
-5
0
5
10
15
20

Profitability of Manufacturing and Service Sector Industries
Net percentage rate of return on capital employed, seasonally adjusted
Net Profit for Manufacturing and Service Businesses
Source: CBI Manufacturing Survey
90 91 92 93 94 95 96 97 98 99 00 01 02 03 04 05 06 07 08
2.0
4.0
6.0
8.0
10.0
12.0
14.0
16.0
18.0
20.0
22.0R
ate
of re
turn
(%
)
2.0
4.0
6.0
8.0
10.0
12.0
14.0
16.0
18.0
20.0
22.0
Manufacturing
Services
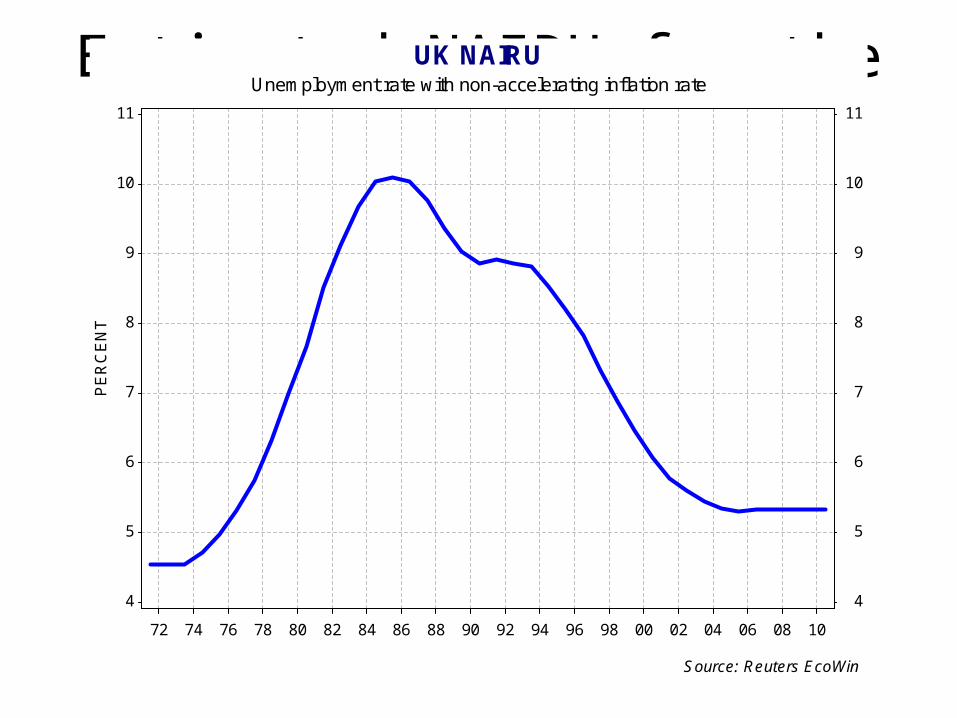
Estimated NAIRU for the UKUnemployment rate with non-accelerating inflation rate
UK NAIRU
Source: Reuters EcoWin
72 74 76 78 80 82 84 86 88 90 92 94 96 98 00 02 04 06 08 10
4
5
6
7
8
9
10
11P
ER
CE
NT
4
5
6
7
8
9
10
11
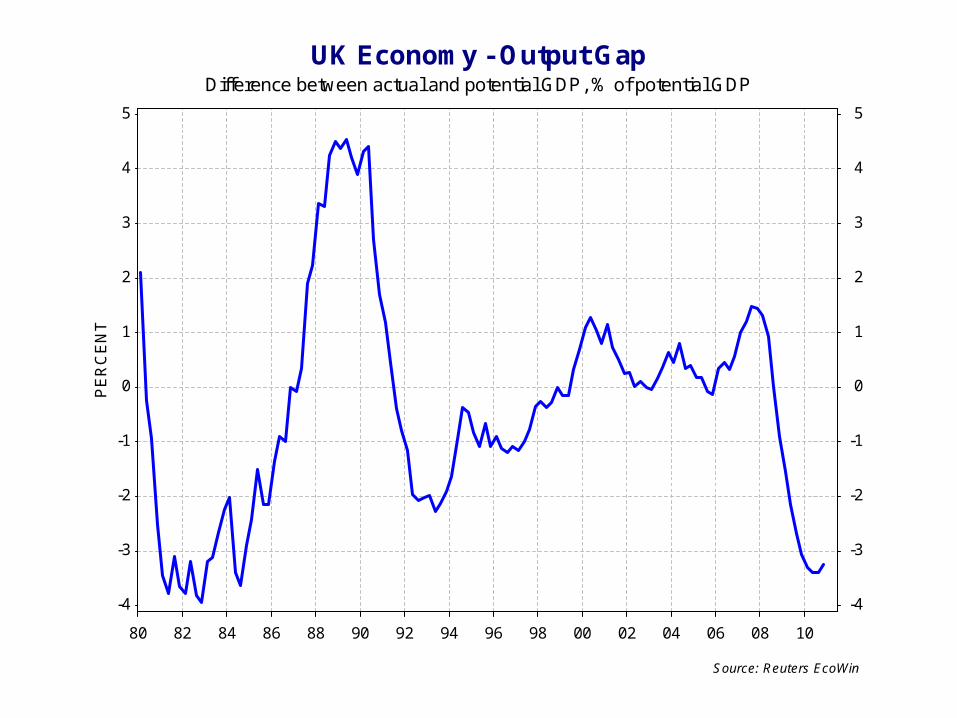
UK Output GapDifference between actual and potential GDP, % of potential GDP
UK Economy - Output Gap
Source: Reuters EcoWin
80 82 84 86 88 90 92 94 96 98 00 02 04 06 08 10
-4
-3
-2
-1
0
1
2
3
4
5P
ER
CE
NT
-4
-3
-2
-1
0
1
2
3
4
5
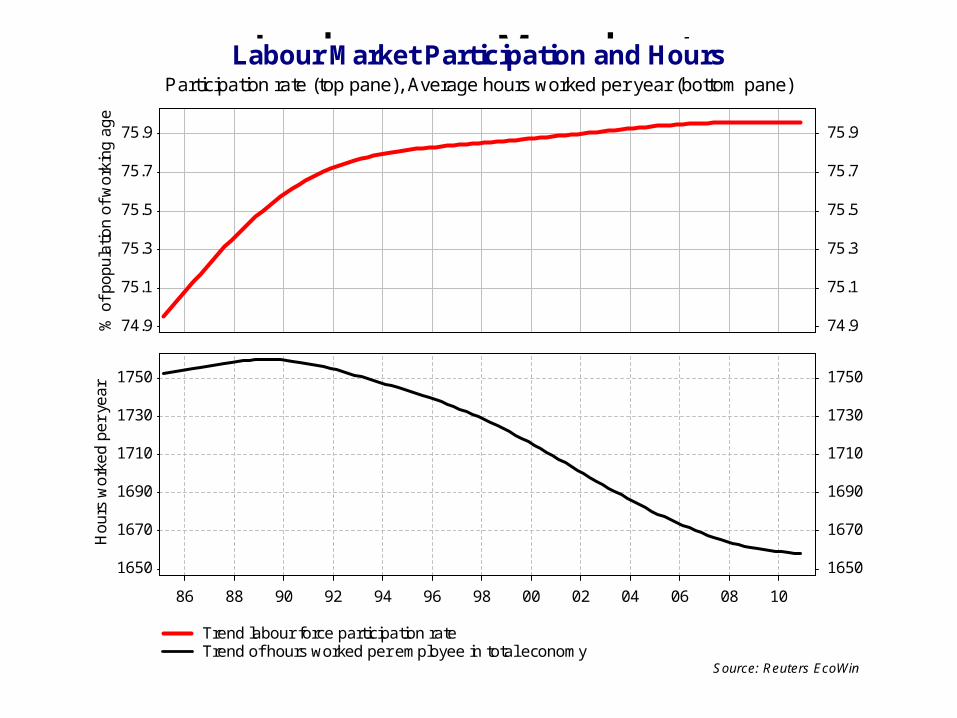
Labour Market ParticipationParticipation rate (top pane), Average hours worked per year (bottom pane)
Labour Market Participation and Hours
Trend labour force participation rate Trend of hours worked per employee in total economy
Source: Reuters EcoWin
86 88 90 92 94 96 98 00 02 04 06 08 10
1650
1670
1690
1710
1730
1750
Ho
urs
wo
rke
d p
er
yea
r
1650
1670
1690
1710
1730
1750
74.9
75.1
75.3
75.5
75.7
75.9
% o
f p
op
ula
tion
of
wo
rkin
g a
ge
74.9
75.1
75.3
75.5
75.7
75.9

Unemployment Ratespeople aged 16-59 (women) / 64 (men), seasonally adjusted
Unemployment in the UK Economy
Source: Reuters EcoWin
90 91 92 93 94 95 96 97 98 99 00 01 02 03 04 05 06 07 08 09
2
3
4
5
6
7
8
9
10
11p
er
cen
t o
f th
e la
bo
ur
forc
e
2
3
4
5
6
7
8
9
10
11
Claimant Count
Labour Force Survey
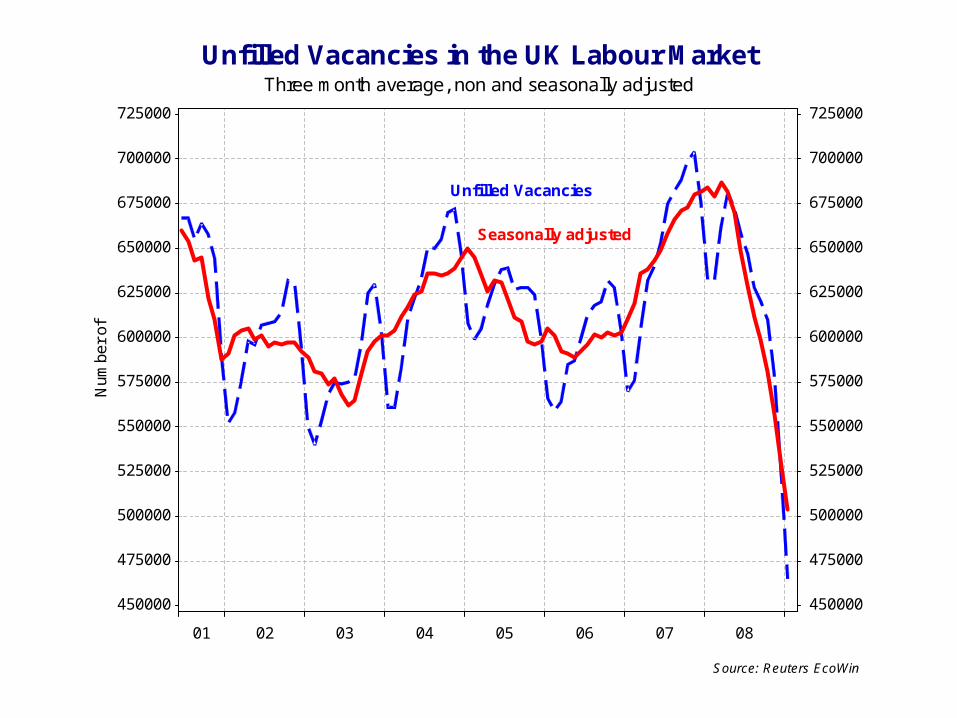
Unfilled VacanciesThree month average, non and seasonally adjusted
Unfilled Vacancies in the UK Labour Market
Source: Reuters EcoWin
01 02 03 04 05 06 07 08
450000
475000
500000
525000
550000
575000
600000
625000
650000
675000
700000
725000N
um
be
r o
f
450000
475000
500000
525000
550000
575000
600000
625000
650000
675000
700000
725000
Unfilled Vacancies
Seasonally adjusted
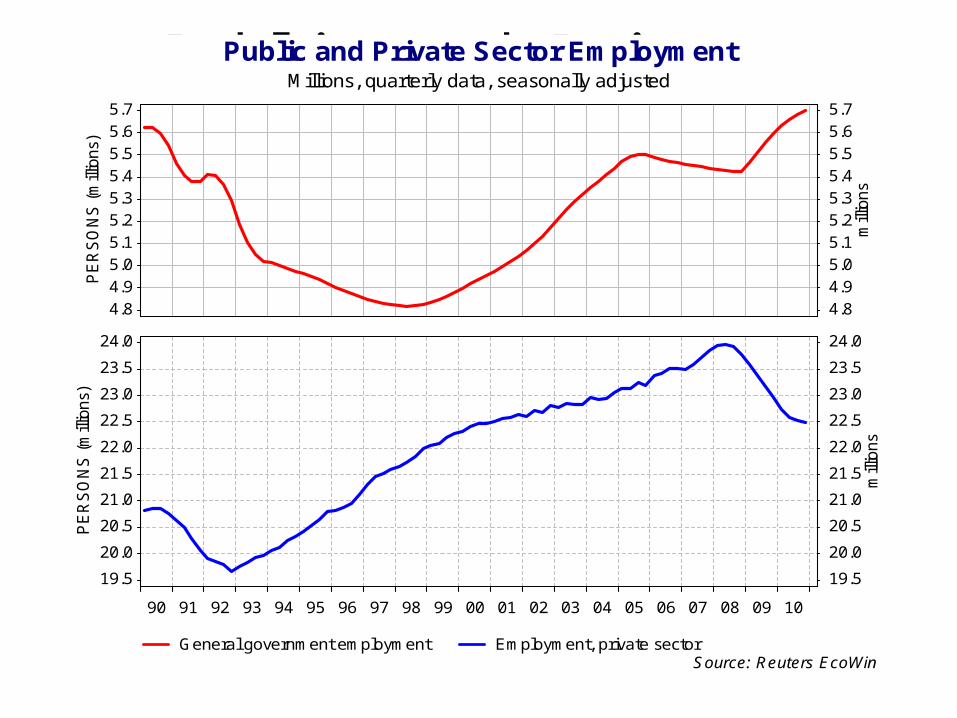
Public and Private Sector JobsMillions, quarterly data, seasonally adjusted
Public and Private Sector Employment
General government employment Employment, private sectorSource: Reuters EcoWin
90 91 92 93 94 95 96 97 98 99 00 01 02 03 04 05 06 07 08 09 10
mill
ions
19.5
20.0
20.5
21.0
21.5
22.0
22.5
23.0
23.5
24.0
PE
RS
ON
S (
mill
ions)
19.5
20.0
20.5
21.0
21.5
22.0
22.5
23.0
23.5
24.0
mill
ions
4.84.95.05.15.25.35.45.55.65.7
PE
RS
ON
S (
mill
ions)
4.84.95.05.15.25.35.45.55.65.7
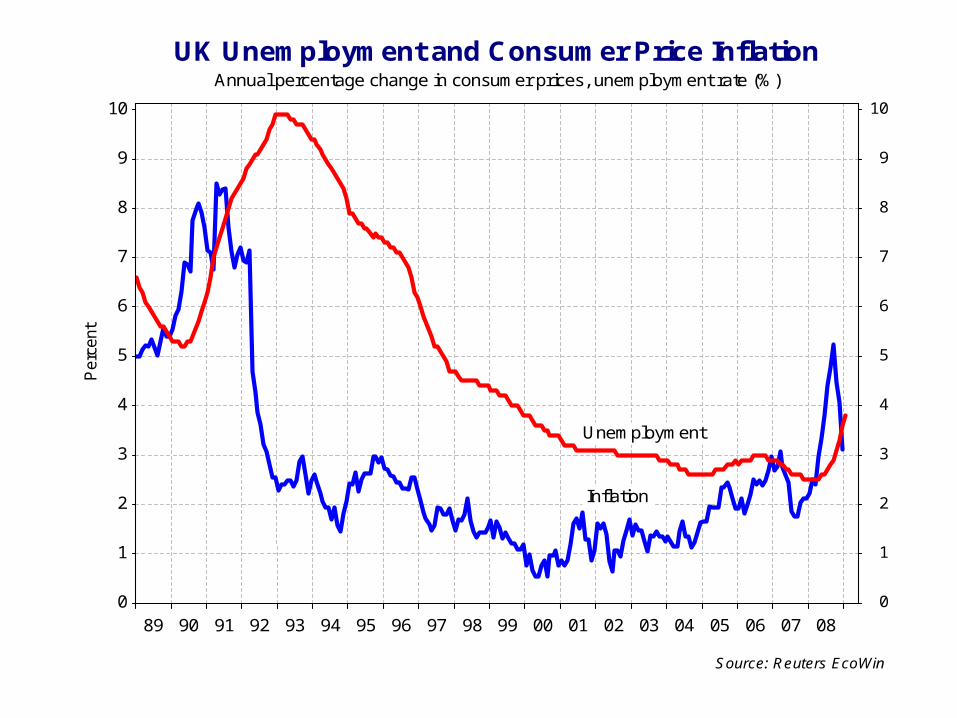
Inflation-Unemployment Trade OffAnnual percentage change in consumer prices, unemployment rate (%)
UK Unemployment and Consumer Price Inflation
Source: Reuters EcoWin
89 90 91 92 93 94 95 96 97 98 99 00 01 02 03 04 05 06 07 08
0
1
2
3
4
5
6
7
8
9
10P
erc
ent
0
1
2
3
4
5
6
7
8
9
10
Unemployment
Inflation
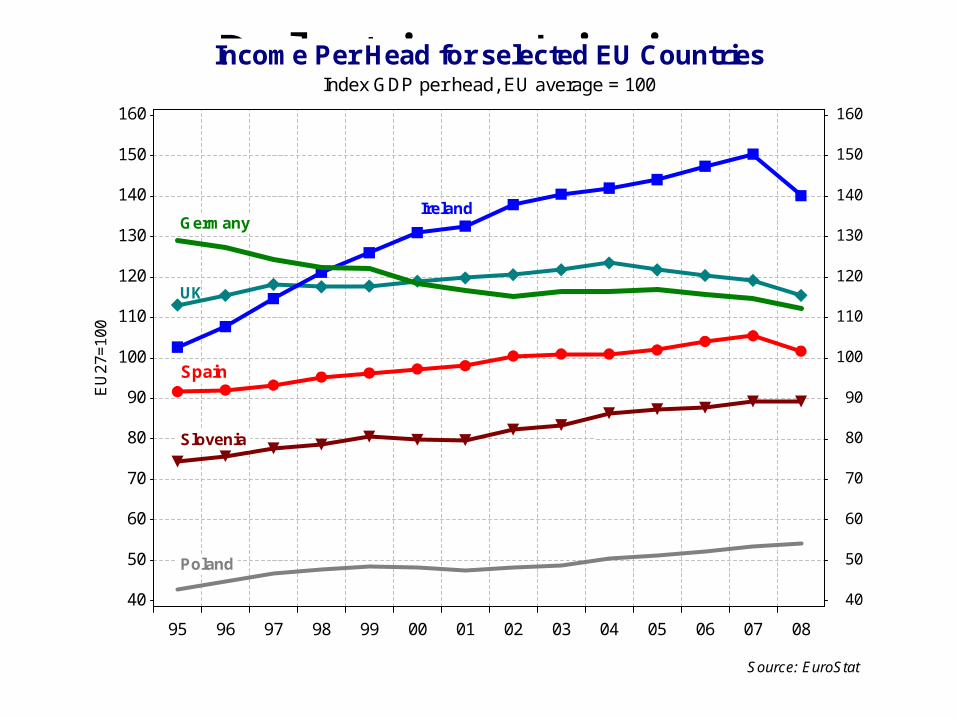
Relative Living StandardsIndex GDP per head, EU average = 100
Income Per Head for selected EU Countries
Source: EuroStat
95 96 97 98 99 00 01 02 03 04 05 06 07 08
40
50
60
70
80
90
100
110
120
130
140
150
160E
U2
7=
10
0
40
50
60
70
80
90
100
110
120
130
140
150
160
Germany
UK
Spain
Poland
Ireland
Slovenia