Supplementary Materials for -...
27
www.sciencemag.org/cgi/content/full/345/6204/1251086/DC1 Supplementary Materials for Epigenetic programming of monocyte-to-macrophage differentiation and trained innate immunity Sadia Saeed, Jessica Quintin, Hindrik H. D. Kerstens, Nagesha A. Rao, Ali Aghajanirefah, Filomena Matarese, Shih-Chin Cheng, Jacqueline Ratter, Kim Berentsen, Martijn A. van der Ent, Nilofar Sharifi, Eva M. Janssen-Megens, Menno Ter Huurne, Amit Mandoli, Tom van Schaik, Aylwin Ng, Frances Burden, Kate Downes, Mattia Frontini, Vinod Kumar, Evangelos J. Giamarellos-Bourboulis, Willem H. Ouwehand, Jos W. M. van der Meer, Leo A. B. Joosten, Cisca Wijmenga, Joost H. A. Martens, Ramnik J. Xavier, Colin Logie,* Mihai G. Netea,* Hendrik G. Stunnenberg* *Corresponding author. E-mail: [email protected] (H.G.S.); [email protected] (M.G.N.); [email protected] (C.L.) Published 26 September 2014, Science 345, 1251086 (2014) DOI: 10.1126/science.1251086 This PDF file includes: Materials and Methods Figs. S1 to S9 References Other Supporting Online Material for this manuscript includes the following: (available at www.sciencemag.org/content/345/6204/1251086/suppl/DC1) Tables S1 to S6 as Excel files
Transcript of Supplementary Materials for -...

www.sciencemag.org/cgi/content/full/345/6204/1251086/DC1
Supplementary Materials for
Epigenetic programming of monocyte-to-macrophage differentiation and trained innate immunity
Sadia Saeed, Jessica Quintin, Hindrik H. D. Kerstens, Nagesha A. Rao, Ali Aghajanirefah, Filomena Matarese, Shih-Chin Cheng,
Jacqueline Ratter, Kim Berentsen, Martijn A. van der Ent, Nilofar Sharifi, Eva M. Janssen-Megens, Menno Ter Huurne, Amit Mandoli, Tom van Schaik,
Aylwin Ng, Frances Burden, Kate Downes, Mattia Frontini, Vinod Kumar, Evangelos J. Giamarellos-Bourboulis, Willem H. Ouwehand, Jos W. M. van der Meer,
Leo A. B. Joosten, Cisca Wijmenga, Joost H. A. Martens, Ramnik J. Xavier, Colin Logie,* Mihai G. Netea,* Hendrik G. Stunnenberg*
*Corresponding author. E-mail: [email protected] (H.G.S.); [email protected] (M.G.N.); [email protected] (C.L.)
Published 26 September 2014, Science 345, 1251086 (2014) DOI: 10.1126/science.1251086
This PDF file includes:
Materials and Methods Figs. S1 to S9 References
Other Supporting Online Material for this manuscript includes the following: (available at www.sciencemag.org/content/345/6204/1251086/suppl/DC1)
Tables S1 to S6 as Excel files

2
Materials and Methods
Healthy volunteers
Healthy volunteers gave written informed consent with regard to scientific use
(Sanquin Blood bank, Nijmegen, the Netherlands)
Reagents
Ficoll-Paque (GE Healthcare) was used to isolate PBMCs by differential
centrifugation. The RPMI 1640 medium (Sigma-Aldrich) was supplemented with 10
µg/mL gentamycin, 10 mM L-glutamine and 10 mM pyruvate (Life Technologies).
β1,3(D)glucan (β-glucan) was kindly provided by Prof. David Williams (University
of Tennessee). Pam3Cys were purchased from EMC microcollections and LPS (E.
coli serotype 055:B5) were purchased from Sigma-Aldrich, with an additional
purification step (64). For “inhibition” experiments H89 (Sigma-Aldrich, B1427),
propranolol (Sigma-Aldrich, P0884), 2’,5’-dideoxyadenosine (Sigma-Aldrich,
D7408), human recombinant IL10 (Merck-Millipore) were used.
Isolation of primary monocytes for genome-wide sequencing analysis
Monocytes were obtained by depletion of CD3, CD19 and CD56 positive cells from
PBMCs obtained upon Ficoll isolation of a buffycoat. CD3 MicroBeads (130-050-
101), CD19 MicroBeads (130-050-301) and CD56 were purchased at Miltenyi Biotec
and used according to the manufacturer protocol. Efficacy of depletion was controlled
by flow cytometry (Fig. S1A). Samples were measured on a FACS FC500, and data
were analyzed using the CXP software (Beckman Coulter). Before and after the
depletion, cells were incubated in PBS supplemented with 1% PBA and the following
antibodies: anti-CD45-PeCy7 (Beckman Coulter), anti-CD14-FITC (Beckman
Coulter), anti-CD3-PC5 (Biolegend (ITK)), anti-CD19-ECD (Beckman Coulter) and
anti-56-PE (BD Bioscience). For the additional transcriptomic analysis of the pop-1
and pop-2 samples (Fig. S1A), additional CD14 positive cells selection was
performed on the CD3-, CD19- and CD56- population using CD14 MicroBeads (130-
050-201) from Miltenyi Biotec. By this selection monocytes population (Mo) was
further defined into monocytes highly expressing CD14 (pop-1, ~88% of the Mo) and
the rest of the Mo (pop-2, ~12% of the Mo) (Fig. S1 A, B).

3
For ChIP analysis and DNase I treatment, 10x106 of CD3-,CD19- and CD56-
depleted monocytes were plated on 100 mm dishes. Monocytes were pre-incubated
either with cell culture medium (RPMI), β-glucan (5 µg/mL) or with LPS (100
ng/mL), for 24 hours in a total volume of 10 mL. After wash-out, cells were cultured
in RPMI supplemented with 10% human pooled serum containing homeostatic
levels of M-CSF that induces monocyte differentiation. Cell samples were
collected at 0 hours and on 6th day, and counted before further treatment for
chromatin immunoprecipitation or DNase I treatment.
For RNASeq 5x10⁶ of CD3-CD19-CD56- depleted monocytes were seeded on 60 mm
dishes. Monocytes were pre-incubated either with cell culture medium (RPMI), β-
glucan (5 µg/mL) or with LPS (100 ng/mL) for 24 hours. After wash-out, cells were
cultured in RPMI supplemented with 10% human pool serum and further RNA
collection and library preparation (0 hours and 5 days after treatment) was done
according to standard BLUEPRINT protocols (www.blueprint-epigenome.eu) and
Illumina library preparation protocol.
For cytokines production, 1x10⁴ of CD3-CD19-CD56- depleted monocytes were
plated out in a 96 well flat bottom plate. Monocytes were pre-incubated as above for
24 hours in a total volume of 200 µL. After a wash-out, cells were cultured in RPMI
supplemented with 10% human pooled serum. Cells were then subjected after 5 days
to a second stimulation for 24 hours with (LPS 10 ng/mL) or P3C (10 µg/mL) for
cytokine measurements with ELISA (Fig. S4E). Each volunteer used in this assay
presented an efficient training or tolerant phenotype (data not shown).
Inhibition experiments
PBMCs were diluted to a concentration of 5x10⁶ cells per mL and 100 µL of this
suspension was added to the well of a 96-well plate. PBMCs were incubated for 1
hour at 37°C in 5% CO2 and adherent monocytes were selected by washing out non-
adherent cells with pre-warmed PBS. For training, monocytes were pre-incubated
with β-glucan (5 µg/mL) for 24 hours. For tolerance, cells were pre-incubated with
LPS (100 ng/mL) for 24 hours. Cells were then washed and maintained in RPMI
supplemented with 10% human pool serum. For cytokine measurements cells were
subjected to a second stimulation of cytokine production after a period of 6 days with
various stimuli in a volume of 200 µl of medium (LPS 10 ng/mL, Pam3Cys 10
4
µg/mL). After 24 hours, supernatants were collected and stored at -20°C until
assayed.
In the “inhibition of training” experiments, before the priming with β-glucan, adherent
monocytes were pre-incubated for 1 hour with H89 (30 µM), 2’,5’-dideoxyadenosine
(1 mM) or propranolol (200 µM).
Cytokine assays
TNFα, IL-6, Il-1β and IL10 were measured using ELISA according to the
manufacturer protocol (IL6, IL10: Sanquin; and TNFα, IL1β: R&D). For cytokines
production assays and qPCR analysis, the differences between groups were analyzed
using the Wilcoxon signed-rank test (unless otherwise stated). The level of
significance was defined as a p-value < 0.05.
Western-blot
Immunoblotting experiments were performed as previously described (17). The
quantification of protein expression was performed by densitometry (GS-670, Bio-
Rad, Hercules, CA) and signal analysis using Molecular Analyst software (Bio-Rad).
The ratio between the intensity of the protein of interest and β-actin was calculated.
The activation of caspase-1 was assessed by calculating the ratio between the p10 and
p45 fragments.
RNA-seq alignment and expression analysis
RNA-seq reads were aligned using GSNAP (65) using non-default parameters -m 1 -
N 1 -n 1 -Q -s Ensembl_splice_68. RNA-seq library data were initially subjected to a
quality control step, where, based on read distribution over the annotated genome,
libraries that are outliers were identified and discarded from further analysis. For
expression analyses reads were aligned to the Ensembl v68 human transcriptome
using Bowtie. Quantification of gene expression was performed using MMSEQ (31).
Differential expression
Differential expression was determined using MMDIFF (32). A two model
comparison was used to identify differentially expressed genes that confer cellular
identity Mo/Mf. Under the null-model the mean expression level is the same in both
cell types and under the alternative model the mean expression level is allowed to

5
differ between the two cell types. Genes with a larger posterior probability for the
second model, an RPKM value greater than 2 in any of Mo or Mf and minimally a
two-fold expression change were considered as differentially expressed.
Expression changes related to LPS and β-glucan were studied using a 15-model
comparison, a.k.a. polytomous comparison. Under the null-model, it is assumed that
the mean expression level is the same across differentiation and micro-organismal
ligand response. In the most complex model the mean expression level is assumed to
be different for all conditions (Mo, Mf, LPS-Mf, BG-Mf). Additionally, we defined 4
models that assume a mean expression in one condition that differs from the equal
expression in the three others, 3 models that assume two pairs of conditions with
equal mean expression within a pair but different between the two pairs and, 6 models
that assume the remaining possibility that two conditions have equal mean expression
while the two others have different mean expression levels that also differ from each
other. We calculated the Bayes factor for each model by comparing the differential
expression models to the (reference) null-model and applied Bayes’ theorem to
compute the posterior probability of each model per gene. The expression change
directionality of a gene was determined based on the model with the highest posterior
probability having to be at least 0.35 for the gene to be considered for downstream
analyses.
Condensing genes into six expression modules
Genes that were successfully assigned to expression models that assume differential
expression in monocyte-derived macrophages were grouped based on their expression
in LPS-Mf and BG-Mf relative to Mf. We applied a three group classification (up,
down and equal) to record the direction of expression change in LPS-Mf and BG-Mf
relative to Mf, resulting in eight possible expression scenarios. Scenarios “LPS-Mf is
down, BG-Mf is up” and “LPS-Mf is up, BG-Mf is down” were dropped because of
low (3 and 5 respectively) gene numbers. The six remaining scenarios were relabeled
as expression modules: M1=”LPS-Mf is down, BG-Mf is down”, M2=LPS-Mf is
down, BG-Mf is equal”, M3=”LPS-Mf is equal, BG-Mf is down”, M4=” LPS-Mf is
equal, BG-Mf is up”, M5=”LPS-Mf is up, BG-Mf is equal”, M6=”LPS-Mf is up, BG-
Mf is up.
ChIP-seq

6
H3K4me1, H3K4me3 and H3K27ac antibodies were extensively characterized (see
www.blueprint-epigenome.eu) and used for ChIP according to standard BLUEPRINT
protocols (www.blueprint-epigenome.eu).
Peak Calling and identification of differential regulatory regions
For peak calling the BAM files were first filtered to remove the reads with mapping
quality less than 15, followed by fragment size modeling
(http://code.google.com/p/phantompeakqual-tools/). The peak calling algorithm
MACS2 (http://github.com/taoliu/MACS/) was used to detect the binding sites for the
three studied histone marks at p-value of 10-10. H3K4me1 peaks were called using
the broad setting of MACS2 while H3K27ac and H3K4me3 were called using the
default (narrow) setting.
In order to identify differential H3K27ac-bound regulatory elements, initially,
H3K27ac peaks from different treatments were merged and sequenced reads were
counted from normalized data files (down scaling). H3K27ac peaks that do not
overlap with H3K4me3 marked promoters (transcription start site±2.5kb) were
regarded as distal regulatory elements (ACe’s) whereas those overlapping with
H3K4me3 marked promoters were labeled as active promoters (ACp’s, Table S3).
H3K27ac regions that show a change of mean ± 2x median absolute deviation (p-
vlaue < 0.05) acetylation signal in each data set were regarded as dynamic acetylated
regions. K-means clustering (Pearson correlation) was performed to identify different
clusters dynamic H3K27ac regions (ACe1-5 and ACp1-3). The same approach was
used to identify dynamic clusters of H3K4me1 (MM) or H3K4me3 (TM) marked
regions that lack H3K27ac (Fig. S2).
Principal Component Analysis
We performed principal component analysis (PCA) using prcomp function in R to
visualize differences between the cell types and examine reproducibility between
samples of the same cell type. Treating each histone modification separately, we
computed combinations of enrichment levels that capture a large proportion of the
variation between cell types (PC1 and PC2). This revealed that at the single histone
modification level monocytes and macrophages are distinguishable and cluster by
pattern similarity of a given cell type, suggesting a high degree of reproducibility
between the samples.
7
DNase I-seq
DNase I libraries were prepared for monocytes (Mo) and all three types of
differentiated macrophages (Mf, LPS-Mf and BG-Mf) as described (66). In brief
nuclei were isolated using Buffer A (15 mM NaCl, 60 mM KCl, 1 mM EDTA, pH
8.0, 0.5 mM EGTA, pH 8.0, 15 mM Tris-HCl, pH 8.0, 0.5 mM Spermidine)
supplemented with 0.015 % IGEPAL CA-630 detergent. DNase I treatment was done
for 3 minutes and the reaction was stopped with stop buffer (50 mM Tris-HCl, pH 8,
100 mM NaCl, 0.10 % SDS, 100 mM EDTA, pH 8.0, 1 mM Spermidine, 0.3 mM
Spermine). The sample was further fractionated on 9% Sucrose gradient for 24 hours
at 25000 rpm at 16 ºC. Fractions containing fragments smaller than 1kb were purified
and processed according to the Illumina library preparation protocol.
Hotspots analysis
DNase I hotspots (DHS) were scanned for the presence of TF-motifs, where a TF-
motif weight matrix was available. DHS of this study Mo, Mf, LPS-Mf and BG-Mf
(four donors merged) were collapsed and merged into a single set of DHS regions,
which were subsequently scanned for TF-motif occurrence. A non-redundant
collection of TF-motifs was generated from TF-motif repositories JASPAR,
UniPROBE, Jolma/Taipale and ht-SELEX
(http://dx.doi.org/10.6084/m9.figshare.819997). Out of a collection of 1406 motifs
(48), 544 motifs for which the assigned TF is expressed (>2 RPKM) in monocytes or
monocyte-derived macrophages, were obtained. The merged set of DHS regions were
scanned for TF-motif presence using Gimme motifs (48) with dynamic TF-motif
scoring cut-offs targeting a false discovery rate (FDR) of 0.01. To look at the motif
enrichments in each epigenetic cluster DHS were assigned to epigenomic clusters
ACe1-5 by intersection. Motif occurrences were acquired by intersection of the
assigned DHSs with the motif scanning results on the merged set of DHS. Enrichment
of motifs in each of the ACe’s was defined by applying a hypergeometric test using
the motif frequency in all distal (non-dynamic) H3K27ac regions as the background.
This results in TFs that putatively regulate the activity of the distal regulatory regions.
Subsequently, hierarchical clustering was performed (Euclidian distance) using the
motif occurrence frequencies in the ACe cluster. TF motifs that satisfy an arbitrary
8
cutoff of > 5% motif presence in at least one ACe cluster were used to generate the
heat map (Fig. 4D).
Animals
C57BL/6J female mice between 8 and 12 weeks of age were used (Jackson
Laboratories). Experiments were approved by the Ethics Committee on Animal
Experiments of the University of Athens. Mice were injected with a sublethal dose of
C. albicans yeast (2×10⁴ CFU/mouse) in a 100 µL volume of sterile pyrogen-free
phosphate-buffered saline (PBS) or with saline alone. Seven days later, mice were
infected intravenously with a lethal dose of C. albicans yeast (2×10⁶ CFU/mouse).
Animals received a daily intraperitoneal injections of either saline or propranolol (1
mg/kg) one day prior the sub-lethal dose C. albicans yeast up to 3 days after the lethal
Candida injection. Survival upon the lethal infection was monitored daily. Survival
curves were created using the product limit method of Kaplan and Meier. Comparison
of two survival curves was performed using the Logrank test. The level of
significance between groups was set at p-value < 0.05.
DNA replication analysis
EdU-incorporation was performed using the Click-iT EdU Imaging kit (Invitrogen)
according to the supplied protocol. Isolated monocytes were seeded on cover slips
placed in 6 well cell culture plates at density of 105 cells per each well. A day before
the EdU assay, HeLa cells were seeded at 25% confluence into control wells
containing cover slips. Both monocytes and HeLa cells were then exposed to EdU for
7 hours, followed by cell fixation, permeabilization and imaging according to the
manufacturer’s protocol.

9
Supplementary figure legends: Fig. S1. Representative flow cytometric analysis of CD3, CD56, CD19, and CD14
positive cells. (A) Cells were gated on CD45+ populations before and after
Microbead lymphocyte depletion (CD3, CD56, CD19) of PBMCs obtained from the
buffy coats. This Monocytes population (Mo) was further fractionated based on CD14
positive Mo (pop-1, ~88% of the Mo) and the rest of the Mo (pop-2, ~12% of the
Mo). (B) Transcriptome analysis of Mo, Mf, LPS-Mf and BG-Mf cells from different
donors. The most differential cell surface markers are plotted for cell populations pop-
1 and pop-2 along with the complete set of cell states obtained from the four donors
included for the transcriptome and polytomous analyses.
Fig. S2. Dynamic H3K4me DNA regions stratified by k-means clustering. (A)
H3K4me1-marked distal elements. (B) H3K4me3-marked elements. (C) Provenance
of the epigenetic clusters as assigned by Blueprint ChromHMM data for primary
human monocytes
(http://ftp.ebi.ac.uk/pub/databases/blueprint/releases/current_release/homo_sapiens/hu
b/hub.txt;. For comparison, the whole-genome distribution of epigenetic states is
rendered.
Fig. S3. Comparison of three epigenetic marks in monocyte and macrophage
populations. PCA plots comparing positively and negatively selected monocytes and
macrophages as a function of the histone marks H3K4me3, H3K4me1 and H3K27ac.
Note that the plots discriminate between monocyte and macrophage as well as
macrophages with different differentiation stimuli. (A) Tags were counted on a
merged peak set (minimal two occurrences) and normalized for effective library size
and peak length (B) The top 5000 most variable peaks were selected from the merged
peak set. The PCA was performed with the prcomp function in R.
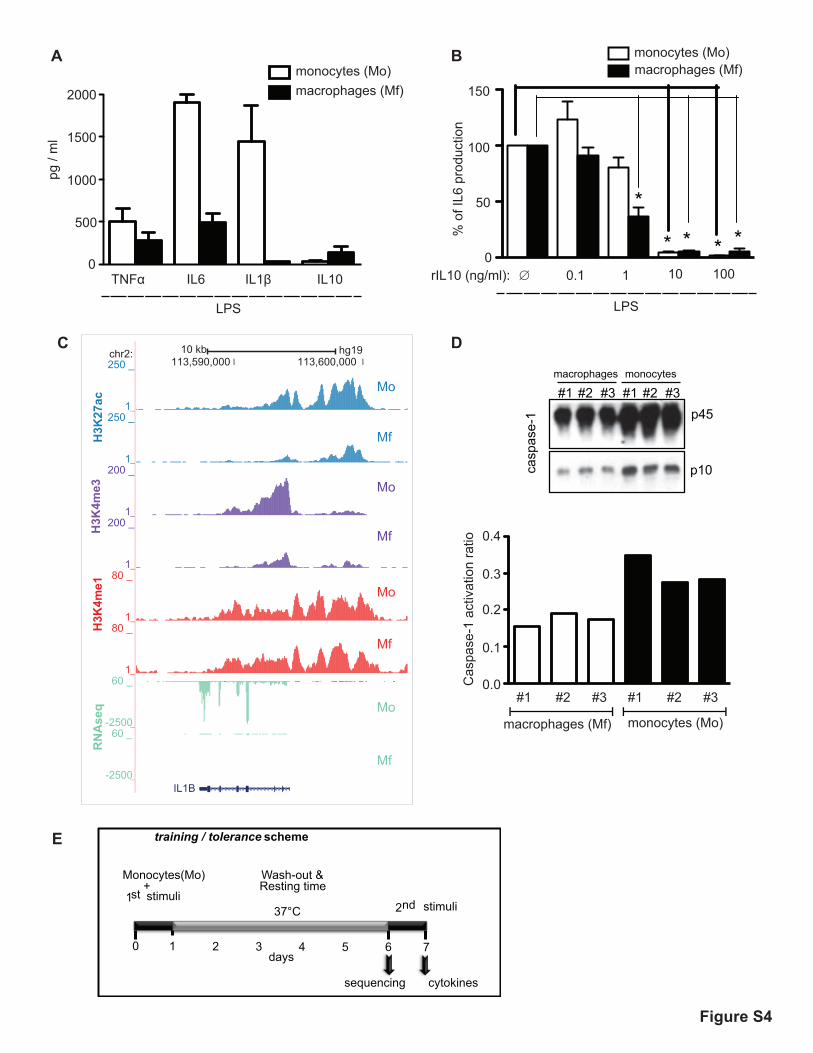
Fig. S4. Attenuation of innate immune defense pathways in resident
macrophages compared to circulating monocytes. Human primary monocytes were
obtained from PBMCs of healthy volunteers (Mo). Primary monocytes were
maintained in cell culture medium supplemented with 10% of human serum for a
week to obtain macrophages (Mf). (A) Secreted TNF-α, IL-6, IL-10, and IL-1β in
monocytes or macrophages upon 24 hours of LPS stimulation as determined by
ELISA. (B) Monocytes or macrophages were either stimulated with LPS alone (∅) or
co-stimulated with LPS and different doses of human IL10 recombinant protein

10
(rIL10). IL-6 production in supernatants was determined after 24 hours by ELISA.
Note the differential response at 1 ng/ml LPS. (C) Genome browser screen shot of the
IL-1β. Note the decreased H3K27ac signal over the promoter region of IL-1β in day 6
macrophages (Mf) as compared to naive monocytes (Mo) as well as an accompanying
decrease in the gene expression. (D) Caspase-1 activation in supernatants of
unstimulated monocytes and macrophages of three independent healthy volunteers
was analyzed by western blot using an antibody against the Caspase-1 p10 cleavage
product (upper panel). The caspase-1 activation ratio (p45/p10) is represented in the
lower panel. (E) Diagram showing the time line of the in vitro training and tolerance
experiment. Pure human primary monocytes are pre-exposed either to culture
medium, β-glucan (training) or to Lipopolysaccharide (LPS) for 24 hours (1st
stimulation). After the 1st stimuli is washed out the cells are further incubated for 5
days in culture medium supplemented with 10% human pooled serum. Cells are then
collected for genome-wide analysis. In parallel, a second in vitro stimulation (2nd
stimulation) of cytokine production with different pattern recognition receptor (PRR)
ligands is performed for an additional 24 hours.
Fig. S5. Absence of DNA replication in BG trained cells. The fluorescent
nucleotide analog EdU was used to label chromosomal DNA undergoing replication.
While HeLa cells efficiently incorporated EdU, in vitro monocyte-derived
macrophages (Mf) did not and nor did the β-glucan trained (BG-Mf) cells.
Fig. S6. Potentially drugable targets that are differentially regulated in
differentiating monocytes. (A-C) Kinases (A), G-coupled receptors (B) and histone
modifying enzymes (C) that display at least a 4-fold difference (RPKM) between Mo,
Mf, LPS-Mf and/or BG-Mf are plotted.
Fig. S7. Circadian cycle factors. The indicated GO terms were queried and
associated factors were stratified in four categories; (A) factors whose transcript level
is higher in monocytes than the derived macrophages, (B) those whose expression is
higher in macrophages, (C) those whose expression is relatively constant and (D)
those with low transcript levels.
Fig. S8. cAMP pathway factors. The average expression level (RPKM) of a selected
group of cAMP signaling pathway factors is shown. Error bars represent the standard
deviation across the four donors.
Fig. S9. The cAMP dependent protein kinase (PKA) inhibitor H89 had no effect
on the LPS-triggered immune response. The PKA inhibitor H89 did not modulate

11
the induction of IL-6 and TNFα, assayed as the response to LPS direct stimulation of
monocytes; p>0.05 (Wilcoxon signed rank test). Data show the cytokine production
(ELISA) upon LPS stimulation in the presence (H89) or absence (∅) of the PKA
inhibitor as mean ± SEM, n = 4 in 2 separate experiments. p>0.05.
Supplementary Tables
TableS1: List of genes that are differentially expressed during monocyte (Mo) to
macrophages (Mf) differentiation (Fig. 1J).
TableS2: Extended list of gene ontology terms associated with differentially
expressed genes during monocyte (Mo) to macrophage (Mf) differentiation (Fig 1J)
and genes assigned to the expression modules M1-6 (Fig. 3B).
TableS3: List of genomic loci associated with each epigenomic clusters (Fig. 2A-B,
Fig S2A-B).
TableS4: List of genes that fit into differential expression models and that are
assigned to expression modules (Fig. 3A).
TableS5: List of the 1581 human DNA sequence-specific transcription factors used in
this study (Fig. 4A).
TableS6: List of transcription factor motifs that are enriched in dynamic distal
regulatory elements (ACe, Fig. 4D).

pop−2
pop−2
pop−1
pop−1
Mo
Mo
Mo
Mo
Mf
Mf
Mf
Mf
LPS
-Mf
LPS
-Mf
LPS
-Mf
LPS
-Mf
BG
-Mf
BG
-Mf
BG
-Mf
BG
-Mf
MS4A6ACD36CD14CD163CXCR3KITCD200R1LCD27TNFSF4IL5RAKELIL18R1GP1BACD200R1CD177IL2RACLEC4CENPP3LILRA4SLC4A1CD3EIL18RAPGYPAITGA2BITGB3CD96GYPBICOSLGCD300LBTNFSF8CD1DCD93THBDCEACAM1IL3RACEACAM8MS4A3CEACAM6CCR3
−5
0
5
pop-1
pop-2
Total PBMCs Depleted (Mo) Total PBMCs Depleted (Mo)
A
B
Figure S1

A B
MM1
MM2
MM3
MM4
MM5
MM6
TM1TM2
TM4TM5
TM3
Transcribed region Inactive enhancer Active enhancer
Active promoter Repressed promoter
C
0
10
20
30
40
50
60
70
80
90
100
Whole genome
MM1 MM2 MM3 MM4 MM5 MM6 TM1 TM2 TM3 TM4 TM5
Heterochromatin C
Figure S2
H3K27ac H3K4me1 H3K4me3 DNaseIH3K27acDNaseI
Mo
Mf
LPS
-Mf
BG
-Mf
Mo
Mf
LPS
-Mf
BG
-Mf
Mo
Mf
LPS
-Mf
BG
-Mf
Mo
Mf
LPS
-Mf
BG
-Mf
Mo
Mf
LPS
-Mf
BG
-Mf
Mo
Mf
LPS
-Mf
BG
-Mf

PCA H3K4me1 − top 5000 peaks
PCA H3K27ac − top 5000 peaks
PCA H3K4me3 − top 5000 peaks
PCA All H3K27ac peaks
A B
PCA All H3K4me3 peaks
Cell typeMo: CD3- CD56- CD19-Mo: CD14+ CD16-MfLPS-Mf
BG-MfMf−M0Mf−M1Mf−M2
Figure S3
PC
2 (e
xpla
ins
21.8
%)
PC1 (explains 47.7%)PC1 (explains 27.3%)
PC
2 (e
xpla
ins
17.8
%)
PC1 (explains 38.0%)
PC
2 (e
xpla
ins
20.4
%)
PCA All H3K4me1 peaks
PC1 (explains 29.5%)
PC
2 (e
xpla
ins
16%
)
PC1 (explains 62.8%)
PC
2 (e
xpla
ins
15.1
%)
PC1 (explains 57.4%)
PC
2 (e
xpla
ins
14.2
%)
Cell typeMo: CD3- CD56- CD19-Mo: CD14+ CD16-MfLPS-Mf
BG-MfMf−M0Mf−M1Mf−M2
A B
2000
1500
1000
500
0TNFα IL6 IL1β IL10
LPS
pg /
ml
monocytes (Mo)macrophages (Mf)
monocytes (Mo)macrophages (Mf)
LPS
rIL10 (ng/ml): ∅ 0.1 1 10 1000
50
100
150
% o
f IL6
pro
duct
ion
C D
p45
p10
#1 #2 #3 #1 #2 #3 monocytes macrophages
casp
ase-
1
0.0
0.1
0.2
0.3
0.4
#1 #2 #3 #1 #2 #3
monocytes (Mo)macrophages (Mf)
Cas
pase
-1 a
ctiv
atio
n ra
tio
E
cytokines
training / tolerance scheme
Monocytes(Mo) +
1st stimuli 2nd stimuli 37°C
Wash-out & Resting time
days 0 1 7 2 3 4 5 6
sequencing
chr2: 10 kb hg19113,590,000 113,600,000
IL1B
250 _
1 _250 _
1 _200 _
1 _200 _
1 _80 _
1 _80 _
1 _60 _
-2500 _60 _
-2500 _
Mo
Mf
Mo
Mf
Mo
Mf
Mo
Mf
Figure S4
H3K
27ac
H3K
4me1
H3K
4me3
RN
Ase
q

EdU - DIC
EdU - DAPI
Hela Control (Mf) Trained ( BG-Mf)
A
Figure S5
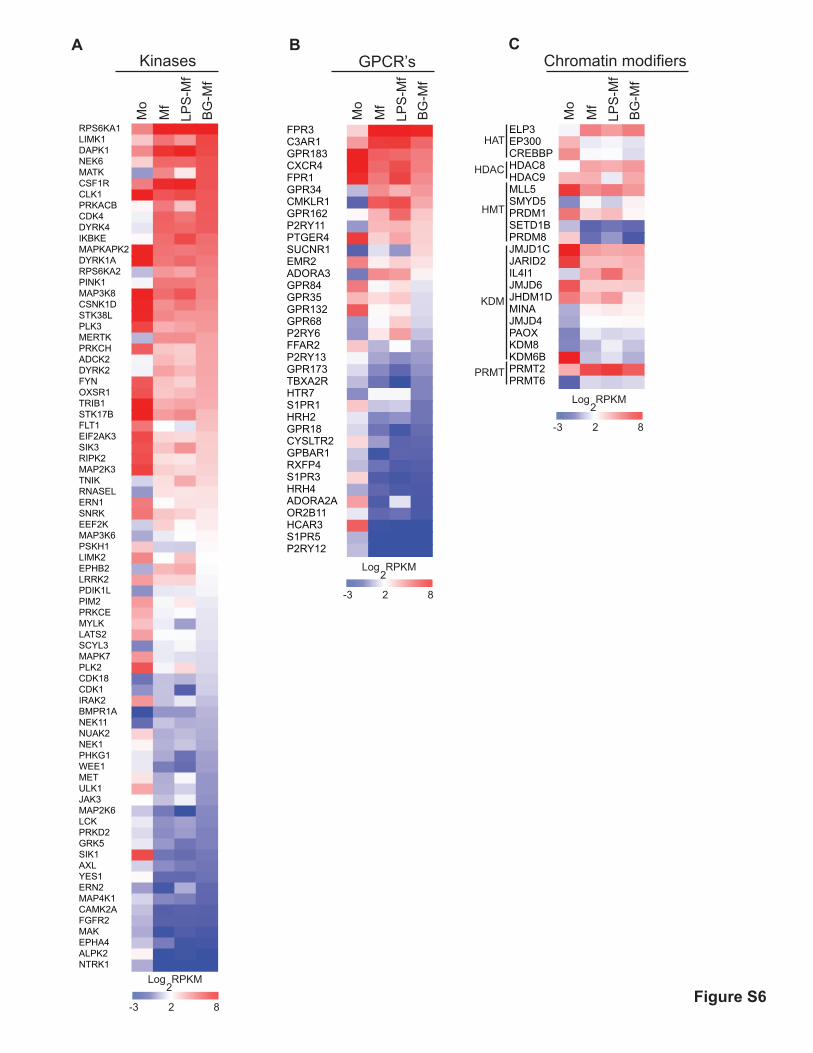
Figure S6
RPS6KA1LIMK1DAPK1NEK6MATKCSF1RCLK1PRKACBCDK4DYRK4IKBKEMAPKAPK2DYRK1ARPS6KA2PINK1MAP3K8CSNK1DSTK38LPLK3MERTKPRKCHADCK2DYRK2FYNOXSR1TRIB1STK17BFLT1EIF2AK3SIK3RIPK2MAP2K3TNIKRNASELERN1SNRKEEF2KMAP3K6PSKH1LIMK2EPHB2LRRK2PDIK1LPIM2PRKCEMYLKLATS2SCYL3MAPK7PLK2CDK18CDK1IRAK2BMPR1ANEK11NUAK2NEK1PHKG1WEE1METULK1JAK3MAP2K6LCKPRKD2GRK5SIK1AXLYES1ERN2MAP4K1CAMK2AFGFR2MAKEPHA4ALPK2NTRK1
Mo
Mf
LPS
-Mf
BG
-Mf
KinasesA B C
FPR3C3AR1GPR183CXCR4FPR1GPR34CMKLR1GPR162P2RY11PTGER4SUCNR1EMR2ADORA3GPR84GPR35GPR132GPR68P2RY6FFAR2P2RY13GPR173TBXA2RHTR7S1PR1HRH2GPR18CYSLTR2GPBAR1RXFP4S1PR3HRH4ADORA2AOR2B11HCAR3S1PR5P2RY12
Mo
Mf
LPS
-Mf
BG
-Mf
GPCR’s Chromatin modifiers
Mo
Mf
LPS
-Mf
BG
-Mf
ELP3EP300CREBBPHDAC8HDAC9MLL5SMYD5PRDM1SETD1BPRDM8JMJD1CJARID2IL4I1JMJD6JHDM1DMINAJMJD4PAOXKDM8KDM6BPRMT2PRMT6
-3 2 8
Log RPKM2
-3 2 8
Log RPKM2
-3 2 8
Log RPKM2
HAT
HDAC
HMT
KDM
PRMT

Circadian cycle genes with higher expression in Monocytes
Figure S7
Mo
Mf
LPS-Mf
BG-Mf
Mo
Mf
LPS-Mf
BG-Mf
Mo
Mf
LPS-Mf
BG-Mf
Query: GO:0007623 GO:0010841 GO:0022410 GO:0032922 GO:0042320 GO:0042321 GO:0042322 GO:0042323 GO:0042745 GO:0042747 GO:0042748 GO:0045187 GO:0045188 GO:0045475 GO:0045938 GO:0046005 GO:0046010 GO:0048512 GO:0060086 GO:0097167
0 200 400 600 800
1000 1200
CST3
NCOR1
PTEN
DHX9
RBM4
ARNTL JU
N
SETX
GSK3B
METTL3
CRY1 ADA
HEBP1
GHRL
RBM4B
HOMER1
RPK
M
Circardian cycle genes that are relatively constant
0 50
100 150 200 250 300 350 400 450 500
DDX5
JUND
DYRK1A
CSNK1D
PTGDS
BHLHE40
NFIL3
PER1
ADORA2A
CRY2
EGR1
EGR3
BTBD9
PER2
PROK2
TYMS IL6
RPK
M
1500
Mo
Mf
LPS-Mf
BG-Mf
0
20
40
60
80
100
120
140
HDAC3
CDK4 ADK
BHLHE41
NAGLU
KCNMA1
CLOCK
HS3ST2
HTR7
ARNTL2
PER3
TIMELE
SS
RPK
M
Circadian cycle genes with higher expression in Macrophages
0 1 2 3 4 5 6 7 8 9
10
TNFRSF11A
TPH1
ADIPOQ
TPH2
DRD4 CRX
RORA
NR1D1
RPK
M
Circardian cycle genes with a relatively low expression

0
100
200
300
400
500
600
700
GNB4
GNB5
GNA13
GNA15
GNAS
GNAI2
GNAI3
GNG2
GNG5
GNG10
GNGT2
GNG11
ADCY7
ADCY3
RP
KM
Mo
Mf
LPS-Mf
BG-Mf
0
50
100
150
200
250
300
350
PDE4B
PDE7A
PDE4D
PDE3B
PDE1B
PDE2A
PDE6B
AKAP8
AKAP8L
AKAP11
PRKAR1A
PRKAR2A
PRKAR2B
PRKAA1
PRKACB
PRKX
PRKACA
RP
KM
Mo
Mf
LPS-Mf
BG-Mf
0
100
200
300
400
500
600
700
ATF4
CREM
ATF3
CREB1
ATF6B
ATF6
ATF1
ATF2
CREB3
ATF5
CREB3L2
ATF7
CREB5
CREB3L4
RP
KM
Mo
Mf
LPS-Mf
BG-Mf
Figure S8
Intracellular cAMP signal transduction molecules

Figure S9

References 1. J. S. Lewis, J. A. Lee, J. C. Underwood, A. L. Harris, C. E. Lewis, Macrophage responses to
hypoxia: Relevance to disease mechanisms. J. Leukoc. Biol. 66, 889–900 (1999). Medline
2. F. Geissmann, M. G. Manz, S. Jung, M. H. Sieweke, M. Merad, K. Ley, Development of monocytes, macrophages, and dendritic cells. Science 327, 656–661 (2010). Medline doi:10.1126/science.1178331
3. C. Auffray, M. H. Sieweke, F. Geissmann, Blood monocytes: Development, heterogeneity, and relationship with dendritic cells. Annu. Rev. Immunol. 27, 669–692 (2009). Medline doi:10.1146/annurev.immunol.021908.132557
4. L. C. Davies, S. J. Jenkins, J. E. Allen, P. R. Taylor, Tissue-resident macrophages. Nat. Immunol. 14, 986–995 (2013). Medline doi:10.1038/ni.2705
5. F. Ginhoux, S. Jung, Monocytes and macrophages: Developmental pathways and tissue homeostasis. Nat. Rev. Immunol. 14, 392–404 (2014). Medline doi:10.1038/nri3671
6. C. Jakubzick, E. L. Gautier, S. L. Gibbings, D. K. Sojka, A. Schlitzer, T. E. Johnson, S. Ivanov, Q. Duan, S. Bala, T. Condon, N. van Rooijen, J. R. Grainger, Y. Belkaid, A. Ma’ayan, D. W. Riches, W. M. Yokoyama, F. Ginhoux, P. M. Henson, G. J. Randolph, Minimal differentiation of classical monocytes as they survey steady-state tissues and transport antigen to lymph nodes. Immunity 39, 599–610 (2013). Medline doi:10.1016/j.immuni.2013.08.007
7. E. Zigmond, C. Varol, J. Farache, E. Elmaliah, A. T. Satpathy, G. Friedlander, M. Mack, N. Shpigel, I. G. Boneca, K. M. Murphy, G. Shakhar, Z. Halpern, S. Jung, Ly6C hi monocytes in the inflamed colon give rise to proinflammatory effector cells and migratory antigen-presenting cells. Immunity 37, 1076–1090 (2012). Medline doi:10.1016/j.immuni.2012.08.026
8. A. Sica, A. Mantovani, Macrophage plasticity and polarization: In vivo veritas. J. Clin. Invest. 122, 787–795 (2012). Medline doi:10.1172/JCI59643
9. S. K. Biswas, E. Lopez-Collazo, Endotoxin tolerance: New mechanisms, molecules and clinical significance. Trends Immunol. 30, 475–487 (2009). Medline doi:10.1016/j.it.2009.07.009
10. J. Quintin, S. Saeed, J. H. Martens, E. J. Giamarellos-Bourboulis, D. C. Ifrim, C. Logie, L. Jacobs, T. Jansen, B. J. Kullberg, C. Wijmenga, L. A. Joosten, R. J. Xavier, J. W. van der Meer, H. G. Stunnenberg, M. G. Netea, Candida albicans infection affords protection against reinfection via functional reprogramming of monocytes. Cell Host Microbe 12, 223–232 (2012). Medline doi:10.1016/j.chom.2012.06.006
11. M. G. Netea, J. Quintin, J. W. van der Meer, Trained immunity: A memory for innate host defense. Cell Host Microbe 9, 355–361 (2011). Medline doi:10.1016/j.chom.2011.04.006
12. J. Quintin, S. C. Cheng, J. W. van der Meer, M. G. Netea, Innate immune memory: Towards a better understanding of host defense mechanisms. Curr. Opin. Immunol. 29, 1–7 (2014). Medline doi:10.1016/j.coi.2014.02.006
13. D. C. Ifrim, J. Quintin, L. A. Joosten, C. Jacobs, T. Jansen, L. Jacobs, N. A. Gow, D. L. Williams, J. W. van der Meer, M. G. Netea, Trained immunity or tolerance: Opposing functional programs induced in human monocytes after engagement of various pattern recognition receptors. Clin. Vaccine Immunol. 21, 534–545 (2014). Medline doi:10.1128/CVI.00688-13
14. J. Kleinnijenhuis, J. Quintin, F. Preijers, L. A. Joosten, D. C. Ifrim, S. Saeed, C. Jacobs, J. van Loenhout, D. de Jong, H. G. Stunnenberg, R. J. Xavier, J. W. van der Meer, R. van Crevel, M. G. Netea, Bacille Calmette-Guerin induces NOD2-dependent nonspecific protection from reinfection via epigenetic reprogramming of monocytes. Proc. Natl. Acad. Sci. U.S.A. 109, 17537–17542 (2012). Medline doi:10.1073/pnas.1202870109
15. C. S. Benn, M. G. Netea, L. K. Selin, P. Aaby, A small jab - a big effect: Nonspecific immunomodulation by vaccines. Trends Immunol. 34, 431–439 (2013). Medline doi:10.1016/j.it.2013.04.004
16. O. Takeuch, S. Akira, Epigenetic control of macrophage polarization. Eur. J. Immunol. 41, 2490–2493 (2011). Medline doi:10.1002/eji.201141792
17. M. Ishii, H. Wen, C. A. Corsa, T. Liu, A. L. Coelho, R. M. Allen, W. F. Carson 4th, K. A. Cavassani, X. Li, N. W. Lukacs, C. M. Hogaboam, Y. Dou, S. L. Kunkel, Epigenetic regulation of the alternatively activated macrophage phenotype. Blood 114, 3244–3254 (2009). Medline doi:10.1182/blood-2009-04-217620
18. R. Ostuni, V. Piccolo, I. Barozzi, S. Polletti, A. Termanini, S. Bonifacio, A. Curina, E. Prosperini, S. Ghisletti, G. Natoli, Latent enhancers activated by stimulation in differentiated cells. Cell 152, 157–171 (2013). Medline doi:10.1016/j.cell.2012.12.018
19. S. L. Foster, D. C. Hargreaves, R. Medzhitov, Gene-specific control of inflammation by TLR-induced chromatin modifications. Nature 447, 972–978 (2007). Medline
20. D. Adams, L. Altucci, S. E. Antonarakis, J. Ballesteros, S. Beck, A. Bird, C. Bock, B. Boehm, E. Campo, A. Caricasole, F. Dahl, E. T. Dermitzakis, T. Enver, M. Esteller, X. Estivill, A. Ferguson-Smith, J. Fitzgibbon, P. Flicek, C. Giehl, T. Graf, F. Grosveld, R. Guigo, I. Gut, K. Helin, J. Jarvius, R. Küppers, H. Lehrach, T. Lengauer, Å. Lernmark, D. Leslie, M. Loeffler, E. Macintyre, A. Mai, J. H. Martens, S. Minucci, W. H. Ouwehand, P. G. Pelicci, H. Pendeville, B. Porse, V. Rakyan, W. Reik, M. Schrappe, D. Schübeler, M. Seifert, R. Siebert, D. Simmons, N. Soranzo, S. Spicuglia, M. Stratton, H. G. Stunnenberg, A. Tanay, D. Torrents, A. Valencia, E. Vellenga, M. Vingron, J. Walter, S. Willcocks, BLUEPRINT to decode the epigenetic signature written in blood. Nat. Biotechnol. 30, 224–226 (2012). Medline doi:10.1038/nbt.2153
21. J. H. Martens, H. G. Stunnenberg, BLUEPRINT: Mapping human blood cell epigenomes. Haematologica 98, 1487–1489 (2013). Medline doi:10.3324/haematol.2013.094243
22. M. G. Netea, C. A. Nold-Petry, M. F. Nold, L. A. Joosten, B. Opitz, J. H. van der Meer, F. L. van de Veerdonk, G. Ferwerda, B. Heinhuis, I. Devesa, C. J. Funk, R. J. Mason, B. J. Kullberg, A. Rubartelli, J. W. van der Meer, C. A. Dinarello, Differential requirement for the activation of the inflammasome for processing and release of IL-1beta in monocytes and macrophages. Blood 113, 2324–2335 (2009). Medline doi:10.1182/blood-2008-03-146720
23. N. D. Heintzman, G. C. Hon, R. D. Hawkins, P. Kheradpour, A. Stark, L. F. Harp, Z. Ye, L. K. Lee, R. K. Stuart, C. W. Ching, K. A. Ching, J. E. Antosiewicz-Bourget, H. Liu, X. Zhang, R. D. Green, V. V. Lobanenkov, R. Stewart, J. A. Thomson, G. E. Crawford, M. Kellis, B. Ren, Histone modifications at human enhancers reflect global cell-type-specific gene expression. Nature 459, 108–112 (2009). Medline doi:10.1038/nature07829
24. A. Rada-Iglesias, R. Bajpai, T. Swigut, S. A. Brugmann, R. A. Flynn, J. Wysocka, A unique chromatin signature uncovers early developmental enhancers in humans. Nature 470, 279–283 (2011). Medline doi:10.1038/nature09692
25. R. E. Thurman, E. Rynes, R. Humbert, J. Vierstra, M. T. Maurano, E. Haugen, N. C. Sheffield, A. B. Stergachis, H. Wang, B. Vernot, K. Garg, S. John, R. Sandstrom, D. Bates, L. Boatman, T. K. Canfield, M. Diegel, D. Dunn, A. K. Ebersol, T. Frum, E. Giste, A. K. Johnson, E. M. Johnson, T. Kutyavin, B. Lajoie, B. K. Lee, K. Lee, D. London, D. Lotakis, S. Neph, F. Neri, E. D. Nguyen, H. Qu, A. P. Reynolds, V. Roach, A. Safi, M. E. Sanchez, A. Sanyal, A. Shafer, J. M. Simon, L. Song, S. Vong, M. Weaver, Y. Yan, Z. Zhang, Z. Zhang, B. Lenhard, M. Tewari, M. O. Dorschner, R. S. Hansen, P. A. Navas, G. Stamatoyannopoulos, V. R. Iyer, J. D. Lieb, S. R. Sunyaev, J. M. Akey, P. J. Sabo, R. Kaul, T. S. Furey, J. Dekker, G. E. Crawford, J. A. Stamatoyannopoulos, The accessible chromatin landscape of the human genome. Nature 489, 75–82 (2012). Medline doi:10.1038/nature11232
26. S. Hashimoto, T. Suzuki, H. Y. Dong, N. Yamazaki, K. Matsushima, Serial analysis of gene expression in human monocytes and macrophages. Blood 94, 837–844 (1999). Medline
27. F. O. Martinez, S. Gordon, M. Locati, A. Mantovani, Transcriptional profiling of the human monocyte-to-macrophage differentiation and polarization: New molecules and patterns of gene expression. J. Immunol. 177, 7303–7311 (2006). Medline doi:10.4049/jimmunol.177.10.7303
28. J. Li, D. K. Pritchard, X. Wang, D. R. Park, R. E. Bumgarner, S. M. Schwartz, W. C. Liles, cDNA microarray analysis reveals fundamental differences in the expression profiles of primary human monocytes, monocyte-derived macrophages, and alveolar macrophages. J. Leukoc. Biol. 81, 328–335 (2007). Medline doi:10.1189/jlb.0206124
29. C. Dong, G. Zhao, M. Zhong, Y. Yue, L. Wu, S. Xiong, RNA sequencing and transcriptomal analysis of human monocyte to macrophage differentiation. Gene 519, 279–287 (2013). Medline doi:10.1016/j.gene.2013.02.015
30. S. Vallabhapurapu, M. Karin, Regulation and function of NF-kappaB transcription factors in the immune system. Annu. Rev. Immunol. 27, 693–733 (2009). Medline doi:10.1146/annurev.immunol.021908.132641
31. F. Martinon, J. Tschopp, Inflammatory caspases: Linking an intracellular innate immune system to autoinflammatory diseases. Cell 117, 561–574 (2004). Medline doi:10.1016/j.cell.2004.05.004
32. J. M. Bruey, N. Bruey-Sedano, R. Newman, S. Chandler, C. Stehlik, J. C. Reed, PAN1/NALP2/PYPAF2, an inducible inflammatory mediator that regulates NF-kappaB and caspase-1 activation in macrophages. J. Biol. Chem. 279, 51897–51907 (2004). Medline doi:10.1074/jbc.M406741200
33. M. Jain, R. Nilsson, S. Sharma, N. Madhusudhan, T. Kitami, A. L. Souza, R. Kafri, M. W. Kirschner, C. B. Clish, V. K. Mootha, Metabolite profiling identifies a key role for glycine in rapid cancer cell proliferation. Science 336, 1040–1044 (2012). Medline doi:10.1126/science.1218595
34. B. Everts, E. Amiel, S. C. Huang, A. M. Smith, C. H. Chang, W. Y. Lam, V. Redmann, T. C. Freitas, J. Blagih, G. J. van der Windt, M. N. Artyomov, R. G. Jones, E. L. Pearce, E. J. Pearce, TLR-driven early glycolytic reprogramming via the kinases TBK1-IKKɛ supports the anabolic demands of dendritic cell activation. Nat. Immunol. 15, 323–332 (2014). Medline doi:10.1038/ni.2833
35. S. K. Biswas, A. Mantovani, Orchestration of metabolism by macrophages. Cell Metab. 15, 432–437 (2012). Medline doi:10.1016/j.cmet.2011.11.013
36. S.-C. Cheng, J. Quintin, R. A. Cramer, K. M. Shepardson, S. Saeed, V. Kumar, E. J. Giamarellos-Bourboulis, J. H. A. Martens, N. A. Rao, A. Aghajanirefah, G. R. Manjeri, Y. Li, D. C. Ifrim, R. J. W. Arts, B. M. J. W. van der Meer, P. M. T. Deen, C. Logie, L. A. O’Neill, P. Willems, F. L. van de Veerdonk, J. W. M. van der Meer, A. Ng, L. A. B. Joosten, C. Wijmenga, H. G. Stunnenberg, R. J. Xavier, M. G. Netea, mTOR/HIF1α-mediated aerobic glycolysis as metabolic basis for trained immunity. Science 345, 1250684 (2014).
37. J. Ernst, M. Kellis, Discovery and characterization of chromatin states for systematic annotation of the human genome. Nat. Biotechnol. 28, 817–825 (2010). Medline doi:10.1038/nbt.1662
38. E. Turro, S. Y. Su, Â. Gonçalves, L. J. Coin, S. Richardson, A. Lewin, Haplotype and isoform specific expression estimation using multi-mapping RNA-seq reads. Genome Biol. 12, R13 (2011). Medline doi:10.1186/gb-2011-12-2-r13
39. E. Turro, W. J. Astle, S. Tavaré, Flexible analysis of RNA-seq data using mixed effects models. Bioinformatics 30, 180–188 (2014). Medline doi:10.1093/bioinformatics/btt624
40. K. Kobayashi, L. D. Hernandez, J. E. Galán, C. A. Janeway Jr., R. Medzhitov, R. A. Flavell, IRAK-M is a negative regulator of Toll-like receptor signaling. Cell 110, 191–202 (2002). Medline doi:10.1016/S0092-8674(02)00827-9
41. L. Balaci, M. C. Spada, N. Olla, G. Sole, L. Loddo, F. Anedda, S. Naitza, M. A. Zuncheddu, A. Maschio, D. Altea, M. Uda, S. Pilia, S. Sanna, M. Masala, L. Crisponi, M. Fattori, M. Devoto, S. Doratiotto, S. Rassu, S. Mereu, E. Giua, N. G. Cadeddu, R. Atzeni, U. Pelosi, A. Corrias, R. Perra, P. L. Torrazza, P. Pirina, F. Ginesu, S. Marcias, M. G. Schintu, G. S. Del Giacco, P. E. Manconi, G. Malerba, A. Bisognin, E. Trabetti, A. Boner, L. Pescollderungg, P. F. Pignatti, D. Schlessinger, A. Cao, G. Pilia, IRAK-M is involved in the pathogenesis of early-onset persistent asthma. Am. J. Hum. Genet. 80, 1103–1114 (2007). Medline doi:10.1086/518259
42. D. S. Shouval, J. Ouahed, A. Biswas, J. A. Goettel, B. H. Horwitz, C. Klein, A. M. Muise, S. B. Snapper, Interleukin 10 receptor signaling: Master regulator of intestinal mucosal homeostasis in mice and humans. Adv. Immunol. 122, 177–210 (2014). Medline doi:10.1016/B978-0-12-800267-4.00005-5

43. A. Bessede, M. Gargaro, M. T. Pallotta, D. Matino, G. Servillo, C. Brunacci, S. Bicciato, E. M. Mazza, A. Macchiarulo, C. Vacca, R. Iannitti, L. Tissi, C. Volpi, M. L. Belladonna, C. Orabona, R. Bianchi, T. V. Lanz, M. Platten, M. A. Della Fazia, D. Piobbico, T. Zelante, H. Funakoshi, T. Nakamura, D. Gilot, M. S. Denison, G. J. Guillemin, J. B. DuHadaway, G. C. Prendergast, R. Metz, M. Geffard, L. Boon, M. Pirro, A. Iorio, B. Veyret, L. Romani, U. Grohmann, F. Fallarino, P. Puccetti, Aryl hydrocarbon receptor control of a disease tolerance defence pathway. Nature 511, 184–190 (2014). Medline doi:10.1038/nature13323
44. C. H. Khuu, R. M. Barrozo, T. Hai, S. L. Weinstein, Activating transcription factor 3 (ATF3) represses the expression of CCL4 in murine macrophages. Mol. Immunol. 44, 1598–1605 (2007). Medline doi:10.1016/j.molimm.2006.08.006
45. J. P. McMorrow, E. P. Murphy, Inflammation: A role for NR4A orphan nuclear receptors? Biochem. Soc. Trans. 39, 688–693 (2011). Medline doi:10.1042/BST0390688
46. T. Kohro, T. Nakajima, Y. Wada, A. Sugiyama, M. Ishii, S. Tsutsumi, H. Aburatani, I. Imoto, J. Inazawa, T. Hamakubo, T. Kodama, M. Emi, Genomic structure and mapping of human orphan receptor LXR alpha: Upregulation of LXRa mRNA during monocyte to macrophage differentiation. J. Atheroscler. Thromb. 7, 145–151 (2000). Medline doi:10.5551/jat1994.7.145
47. M. Boergesen, T. Å. Pedersen, B. Gross, S. J. van Heeringen, D. Hagenbeek, C. Bindesbøll, S. Caron, F. Lalloyer, K. R. Steffensen, H. I. Nebb, J. Å. Gustafsson, H. G. Stunnenberg, B. Staels, S. Mandrup, Genome-wide profiling of liver X receptor, retinoid X receptor, and peroxisome proliferator-activated receptor α in mouse liver reveals extensive sharing of binding sites. Mol. Cell. Biol. 32, 852–867 (2012). Medline doi:10.1128/MCB.06175-11
48. K. Endo-Umeda, K. Yasuda, K. Sugita, A. Honda, M. Ohta, M. Ishikawa, Y. Hashimoto, T. Sakaki, M. Makishima, 7-Dehydrocholesterol metabolites produced by sterol 27-hydroxylase (CYP27A1) modulate liver X receptor activity. J. Steroid Biochem. Mol. Biol. 140, 7–16 (2014). Medline doi:10.1016/j.jsbmb.2013.11.010
49. E. L. Gautier, A. Chow, R. Spanbroek, G. Marcelin, M. Greter, C. Jakubzick, M. Bogunovic, M. Leboeuf, N. van Rooijen, A. J. Habenicht, M. Merad, G. J. Randolph, Systemic analysis of PPARγ in mouse macrophage populations reveals marked diversity in expression with critical roles in resolution of inflammation and airway immunity. J. Immunol. 189, 2614–2624 (2012). Medline doi:10.4049/jimmunol.1200495
50. B. Hotz, A. Visekruna, H. J. Buhr, H. G. Hotz, Beyond epithelial to mesenchymal transition: A novel role for the transcription factor Snail in inflammation and wound healing. J. Gastrointest. Surg. 14, 388–397 (2010). Medline doi:10.1007/s11605-009-1068-3
51. M. Leptin, twist and snail as positive and negative regulators during Drosophila mesoderm development. Genes Dev. 5, 1568–1576 (1991). Medline doi:10.1101/gad.5.9.1568
52. K. Ozato, P. Tailor, T. Kubota, The interferon regulatory factor family in host defense: Mechanism of action. J. Biol. Chem. 282, 20065–20069 (2007). Medline doi:10.1074/jbc.R700003200

53. M. Miyamoto, T. Fujita, Y. Kimura, M. Maruyama, H. Harada, Y. Sudo, T. Miyata, T. Taniguchi, Regulated expression of a gene encoding a nuclear factor, IRF-1, that specifically binds to IFN-beta gene regulatory elements. Cell 54, 903–913 (1988). Medline doi:10.1016/S0092-8674(88)91307-4
54. H. Harada, T. Fujita, M. Miyamoto, Y. Kimura, M. Maruyama, A. Furia, T. Miyata, T. Taniguchi, Structurally similar but functionally distinct factors, IRF-1 and IRF-2, bind to the same regulatory elements of IFN and IFN-inducible genes. Cell 58, 729–739 (1989). Medline doi:10.1016/0092-8674(89)90107-4
55. R. Günthner, H. J. Anders, Interferon-regulatory factors determine macrophage phenotype polarization. Mediators Inflamm. 2013, 731023 (2013). Medline doi:10.1155/2013/731023
56. G. Servillo, M. A. Della Fazia, P. Sassone-Corsi, Coupling cAMP signaling to transcription in the liver: Pivotal role of CREB and CREM. Exp. Cell Res. 275, 143–154 (2002). Medline doi:10.1006/excr.2002.5491
57. A. Jolma, J. Yan, T. Whitington, J. Toivonen, K. R. Nitta, P. Rastas, E. Morgunova, M. Enge, M. Taipale, G. Wei, K. Palin, J. M. Vaquerizas, R. Vincentelli, N. M. Luscombe, T. R. Hughes, P. Lemaire, E. Ukkonen, T. Kivioja, J. Taipale, DNA-binding specificities of human transcription factors. Cell 152, 327–339 (2013). Medline doi:10.1016/j.cell.2012.12.009
58. S. J. van Heeringen, G. J. Veenstra, GimmeMotifs: A de novo motif prediction pipeline for ChIP-sequencing experiments. Bioinformatics 27, 270–271 (2011). Medline doi:10.1093/bioinformatics/btq636
59. K. Newton, V. M. Dixit, Signaling in innate immunity and inflammation. Cold Spring Harb. Perspect. Biol. 4, a006049 (2012). Medline doi:10.1101/cshperspect.a006049
60. T. Lange, S. Dimitrov, J. Born, Effects of sleep and circadian rhythm on the human immune system. Ann. N. Y. Acad. Sci. 1193, 48–59 (2010). Medline doi:10.1111/j.1749-6632.2009.05300.x
61. M. H. Sieweke, J. E. Allen, Beyond stem cells: Self-renewal of differentiated macrophages. Science 342, 1242974 (2013). Medline doi:10.1126/science.1242974
62. A. Aziz, E. Soucie, S. Sarrazin, M. H. Sieweke, MafB/c-Maf deficiency enables self-renewal of differentiated functional macrophages. Science 326, 867–871 (2009). Medline doi:10.1126/science.1176056
63. K. R. Stenmark, M. E. Yeager, K. C. El Kasmi, E. Nozik-Grayck, E. V. Gerasimovskaya, M. Li, S. R. Riddle, M. G. Frid, The adventitia: Essential regulator of vascular wall structure and function. Annu. Rev. Physiol. 75, 23–47 (2013). Medline doi:10.1146/annurev-physiol-030212-183802
64. G. D. Wenger, M. S. O’Dorisio, Induction of cAMP-dependent protein kinase I during human monocyte differentiation. J. Immunol. 134, 1836–1843 (1985). Medline
65. K. C. Bagley, S. F. Abdelwahab, R. G. Tuskan, T. R. Fouts, G. K. Lewis, Cholera toxin and heat-labile enterotoxin activate human monocyte-derived dendritic cells and dominantly
http://www.ncbi.nlm.nih.gov/entrez/query.fcgi?cmd=Retrieve&db=PubMed&list_uids=3409321&dopt=Abstract
http://www.ncbi.nlm.nih.gov/entrez/query.fcgi?cmd=Retrieve&db=PubMed&list_uids=3409321&dopt=Abstract
http://www.ncbi.nlm.nih.gov/entrez/query.fcgi?cmd=Retrieve&db=PubMed&list_uids=2475256&dopt=Abstract

inhibit cytokine production through a cyclic AMP-dependent pathway. Infect. Immun. 70, 5533–5539 (2002). Medline doi:10.1128/IAI.70.10.5533-5539.2002
66. M. Shen, T. Kawamoto, M. Teramoto, S. Makihira, K. Fujimoto, W. Yan, M. Noshiro, Y. Kato, Induction of basic helix-loop-helix protein DEC1 (BHLHB2)/Stra13/Sharp2 in response to the cyclic adenosine monophosphate pathway. Eur. J. Cell Biol. 80, 329–334 (2001). Medline doi:10.1078/0171-9335-00167
67. M. Shen, T. Kawamoto, W. Yan, K. Nakamasu, M. Tamagami, Y. Koyano, M. Noshiro, Y. Kato, Molecular characterization of the novel basic helix-loop-helix protein DEC1 expressed in differentiated human embryo chondrocytes. Biochem. Biophys. Res. Commun. 236, 294–298 (1997). Medline doi:10.1006/bbrc.1997.6960
68. T. A. Wynn, A. Chawla, J. W. Pollard, Macrophage biology in development, homeostasis and disease. Nature 496, 445–455 (2013). Medline doi:10.1038/nature12034
69. S. Gordon, P. R. Taylor, Monocyte and macrophage heterogeneity. Nat. Rev. Immunol. 5, 953–964 (2005). Medline doi:10.1038/nri1733
70. Materials and methods are available as supplementary materials on Science Online.


![[Supplementary materials]](https://static.fdocuments.net/doc/165x107/56816583550346895dd82b8a/supplementary-materials-56cd0e37cc26b.jpg)