Supplementary Information - Royal Society of Chemistry · Supplementary Information . Biogenic...
19
1 Supplementary Information Biogenic Manganese Oxide: Effective New Catalyst for Direct Bromination of Hydrocarbons Yuta Nishina,* Hideki Hashimoto,* Noriyasu Kimura, Naoyuki Miyata, Tatsuo Fujii, Bunsho Ohtani and Jun Takada Table of contents Methods 2 S1 Pore size distribution (Figure S1) 6 S2 Crystal structure (Figures S2 and S3) 7 S3 Elemental distribution (Figure S4) 10 S4 Average oxidation state and local structure (Figure S5) 11 S5 Culture vessels (Figure S6) 13 S6 Bromination of cyclohexane with other reagents (Table S1) 14 S7 Monochromatic irradiation-action spectrum analysis (Table S2) 15 References 18
Transcript of Supplementary Information - Royal Society of Chemistry · Supplementary Information . Biogenic...

1
Supplementary Information
Biogenic Manganese Oxide: Effective New Catalyst for Direct Bromination of Hydrocarbons
Yuta Nishina,* Hideki Hashimoto,* Noriyasu Kimura, Naoyuki Miyata, Tatsuo Fujii, Bunsho Ohtani and Jun Takada
Table of contents
Methods 2
S1 Pore size distribution (Figure S1) 6
S2 Crystal structure (Figures S2 and S3) 7
S3 Elemental distribution (Figure S4) 10
S4 Average oxidation state and local structure (Figure S5) 11
S5 Culture vessels (Figure S6) 13
S6 Bromination of cyclohexane with other reagents (Table S1) 14
S7 Monochromatic irradiation-action spectrum analysis (Table S2) 15
References 18

2
Methods
Cultivation of Mn-oxidizing microorganisms Mn-oxidizing enrichment culture
obtained from a riverbed biofilm[24,25 in the main text] was used for the production of BMO.
The enrichment culture consisted of a microbial community including diverse
Mn-oxidizing bacteria[27 in the main text]. Repeated batch cultivation was performed in a
35-L porypropylen vessel at ambient temperature under unsterilized conditions. The
vessel was filled with 20 L of a basal medium containing (per litre of tap water) 200 mg
CH3COONa∙3H2O, 80 mg soy peptone and 20 mg KH2PO4. The enrichment culture was
inoculated into the vessel, then stock solution of MnSO4 was added to obtain a
dissolved Mn2+ concentration of 5 mg/L and finally the vessel was aerated at a flow rate
of 4 L/min. After the first round of cultivation (3.5 days), the obtained suspended solid
was left to stand for 180 min, supernatant was removed, the vessel was filled with fresh
Mn2+ medium (5 mg/L) and 3-times-repeated batch cultivation was continued. After the
subsequent rounds of cultivation (3.5 days per round), these steps were repeated, but
with 4-times-diluted basal medium of the same Mn2+ concentration. Cultivation was
considered complete when sufficient black precipitate for our needs had been produced
on the vessel’s bottom and wall (Figures S6a–b). The concentration of dissolved Mn in
the cultures was monitored in the supernatants by a colorimetric method with potassium

3
periodate. After confirming that >95% of the initial dissolved Mn2+ had been removed,
stock solution of MnSO4 was added to achieve a Mn2+ concentration of 5 mg/L. The
obtained precipitate was washed with distilled water and vacuum dried (Figure S6c).
SEM measurements SEM measurements were performed on SEM (Hitachi S-4300 and
JEOL JSM-6700FE). Sample powder was coated with evaporated platinum.
STEM and TEM measurements STEM, TEM and HAADF-STEM images were
collected from sample powder dispersed on a carbon-coated copper grid.
Cross-sectional measurements were performed on ultrathin samples cut out by
ultramicrotome. A STEM microscope (JEOL JEM-2100F) equipped with a CEOS
spherical aberration corrector (Cs-corrector) was operated at an acceleration voltage of
200 kV.
Nitrogen-adsorption isotherm analysis Nitrogen-adsorption isotherms were measured
at 77 K (BEL Japan Belsorp-mini II). Before measuring, samples were degassed under
vacuum for 1 h at 120 °C and then for 4 h at 150 °C. Data analysis was performed by
the Brunauer–Emmet–Teller (BET) method[30] for surface area and the Dollimore–Heal
(DH) method[31,32] for pore size distribution.

4
EDX measurements EDX measurements were performed on an SEM (JEOL
JSM-6700FE) equipped with an energy-dispersive X-ray analyser (JEOL JED-2200F).
The atomic ratio of Mn:Ca:Mg:P:Al:Si:S:Cl (at%) was determined. Elemental mapping
was done with an STEM (JEOL JEM-2100F) equipped with an energy-dispersive X-ray
spectrometer (JEOL JED-2300T).
XRD measurements X-ray diffraction patterns were obtained on an X-ray powder
diffractometer (Rigaku RINT-2000) using Cu Kα radiation.
XAFS measurements XAFS data were collected using beamline BL9C at the Photon
Factory (IMMS, KEK, Tsukuba, Japan). Commercially available MnO2 and Mn2O3
were measured as standard samples. Data were analysed with the Athena software
program[33,34].
NMR measurements NMR spectra were recorded using a JEOL JNM-LA400
spectrometer. Proton chemical shifts are relative to solvent peaks [chloroform: 7.27
(1H), 77.00 (13C)]. The NMR spectra of organobromides 1′, 1′′, 2′, 2′′, 3′, 4′, 5′, and 6′
showed complete agreement with the known data.
Preparation of reference samples MnO2 with a large specific surface area (115 m2/g)
was synthesized by pouring a solution (2.2 ml) of 2.2 mmol KMnO4 heated at 55 °C
5
into a solution (1.3 ml) containing 3.3 mmol MnSO4 and 3.3 mmol H2SO4 under stirring
at 55 °C. The obtained suspension was aged for 1 h at 90 °C, filtered, washed with
distilled water and air-dried at 110 °C for 20 h.
Low-crystalline Na-birnessite was prepared by quickly pouring a solution (200 ml) of
1M H2O2 and 0.6M NaOH into a solution (100 ml) of 0.3M Mn(NO3)2, then stirring
rapidly at room temperature for 10 min. The reaction was completed immediately and a
black–brown suspension was obtained. The obtained suspension was aged for 1 day at
60 °C, filtered, washed with distilled water and vacuum dried.
Mn oxide with a chemical composition similar to that of BMO was prepared as follows.
MnO2 (99.99%, Kojundo Chemical Laboratory Co., Ltd.), CaCO3 (99.99%, Kanto
Chemical Co., Inc.), Ca(H2PO4)2∙H2O (90.0%, Nacalai Tesque, Inc.), KCl (99.5%,
Kanto Chemical Co., Inc.), SiO2 (Aerosil®, 97.87%, Nippon Aerosil Co., Ltd.),
Al2(SO4)3∙8H2O (100%, Nacalai Tesque, Inc.) and MgCl2∙6H2O (98.0%, Nacalai
Tesque, Inc.) were weighted by imitating the chemical composition of BMO as
described above, and then mixed with an alumina mortar. The resulting powder was
pelletized at a pressure of 1000 kg/cm2, heated at 400 °C for 2 h and crushed to a fine
powder. The chemical composition was determined to be Mn:Ca:K:Cl:S:P:Si:Al:Mg =
89.1:4.3:0.3:1.3:1.0:1.6:1.0:0.4:1.0, nearly equal to that of BMO.

6
The catalytic performances of the above samples were measured under the same
conditions as for BMO.

7
S1 Pore size distribution
Figure S1. Pore size distribution for BMO, calculated by the DH method from
nitrogen-adsorption isotherms. Pores are broadly distributed in the mesopore region rp =
1–100 nm. They most probably correspond to the irregular open channels in the spongy
structure of BMO and the multiple steps on the surface of BMO nanosheets, observed in
the HAADF-STEM and TEM images of Figures 1g and f, respectively.

8
S2 Crystal structure
Crystal structure analysis of BMO was performed with XRD measurements and
TEM-ED. It is commonly accepted that the crystal structure of biogenic manganese
oxides resembles that of birnessite (with layer structure) or todorokite (with tunnel
structure), consisting of edge-sharing MnO6 octahedral sheets[35-38]. Crystal structure
models of Na-birnessite and Mg-todorokite are shown in Figure S2. Na+ and Mg2+ exist
as interlayer and in-tunnel ions, respectively. We prepared Na-birnessite and
Mg-todorokite as reference samples according to the reports of Feng et al.[28] and Yang
et al.[39], respectively. Typical XRD pattern of BMO and the reference samples are
shown in Figure S3a; d-spacing values and the associated Miller indexes (hkl) of their
diffraction peaks are shown in Figure S3(B). Bragg diffractions with d-spacing values
of 0.957 and 0.483 nm, suggesting a layer and/or tunnel structure of (001) and (002)
planes, is observed in the XRD pattern of BMO. Diffraction peaks with d-spacing
values of 0.25 and 0.14 nm correspond to (20l) and/or (11l) and (02l) and/or (31l)
planes, respectively, indicating that BMO has edge-sharing MnO6 octahedral sheets.
To obtain more detailed structural information, we performed TEM-ED
measurements. Diffraction rings with d-spacing values of 0.248 and 0.145 nm are
observed in the ED pattern of a BMO nanosheet (Figure S3). These diffractions

9
correspond to in-plane diffractions of (20l) and/or (11l) and (02l) and/or (31l),
respectively, while interlayer diffraction of (001) and (002) are not observed. These
results indicate that BMO nanosheet corresponds to edge-sharing MnO6 octahedral
sheet (in-plane is ab plane), and MnO6 octahedral sheets are stacked to 00l direction.
Diffractions of (h00) planes being attributed to a tunnel structure are not observed in the
ED pattern, indicating that the crystal structure of BMO is layered birnessite-like
structure.
Figure S2. Crystal structure models of Na-birnessite and Mg-todorokite. Blue
polyhedra represent MnO6 octahedral units. Blue, red, green, large, and small ochre
balls represent manganese, oxygen, water, sodium and magnesium, respectively. (a)
Na-birnessite[40] with a layer structure of edge-sharing MnO6 octahedral sheets. (b)
a) b)
10
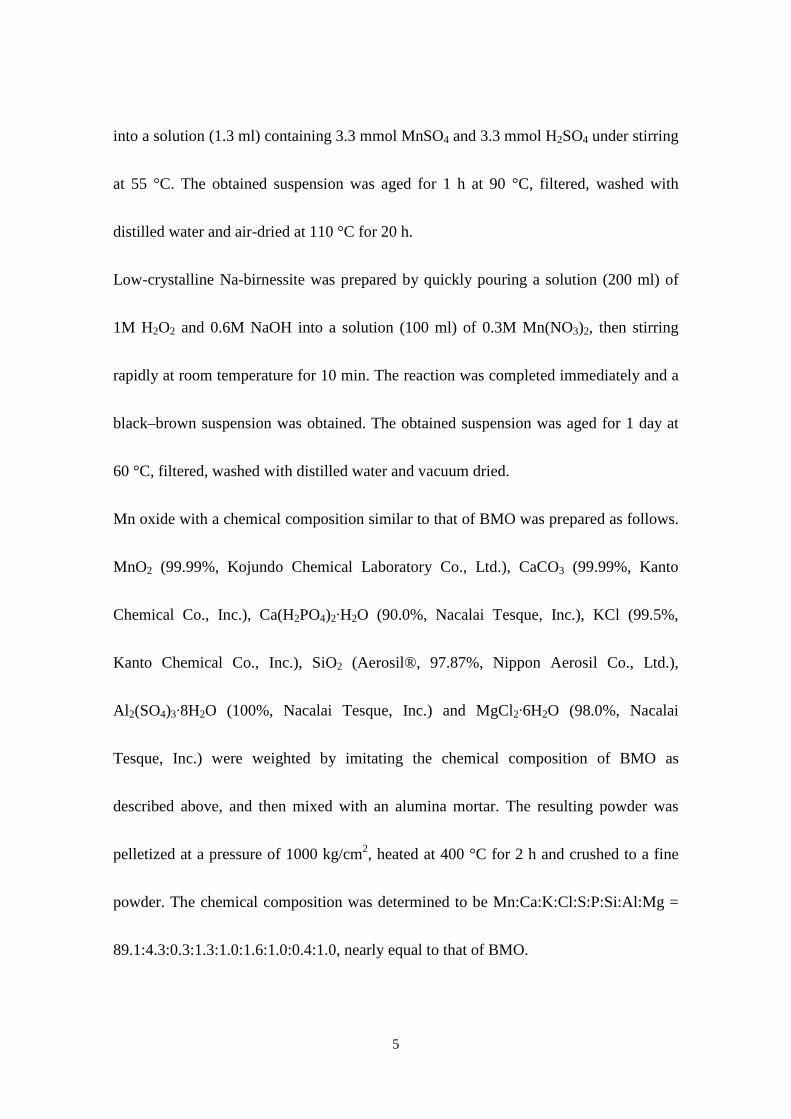
Mg-todorokite[41] with a [3×3] tunnel structure of edge-sharing MnO6 octahedral
sheets.
2θ /˚ d/nm 2θ /˚ d/nm 2θ /˚ d/nm 2θ /˚ d/nm 2θ /˚ d/nm
BMO 9.23 0.957 18.36 0.483 - - 36.61 0.245 65.60 0.142
Birnessite 12.27 0.721 24.84 0.358 - - 36.60 0.245 63.87 0.146
66.06 0.141
Todorokite 9.15 0.965 18.39 0.482 27.72 0.322 35.85 0.250 63.59 0.146
36.92 0.243 65.87 0.142
hkl 001 002 003 20l, 11l 02l, 31l
Figure S3. Crystal structure analysis of BMO. (a) Typical XRD pattern for BMO.
Synthetic Na-birnessite and Mg-todorokite are also measured as reference samples. (b)
2θ and d-spacing values of the observed diffraction peaks and the associated Miller
indexes. (c) TEM image of a BMO nanosheet and its ED pattern. The two rings of the
ED pattern correspond to d-spacing values of 0.248 and 0.145 nm, which are nearly
consistent with (20l) and/or (11l) and (02l) and/or (31l) planes, respectively.
c)
b)
a)

11
S3 Elemental distribution
Figure S4. Elemental distribution of BMO. (a) STEM image of a sectioned hollow
globule wall using high-angle annular dark-field (HAADF) detector and EDX imaging
(spatial resolution, 1.2 nm) for Mn, Ca, Cl, P and Mg (b–f) taken from (a). Bar, 100 nm.
a) b) c)
d) e) f)
12
S4 Average oxidation state and local structure
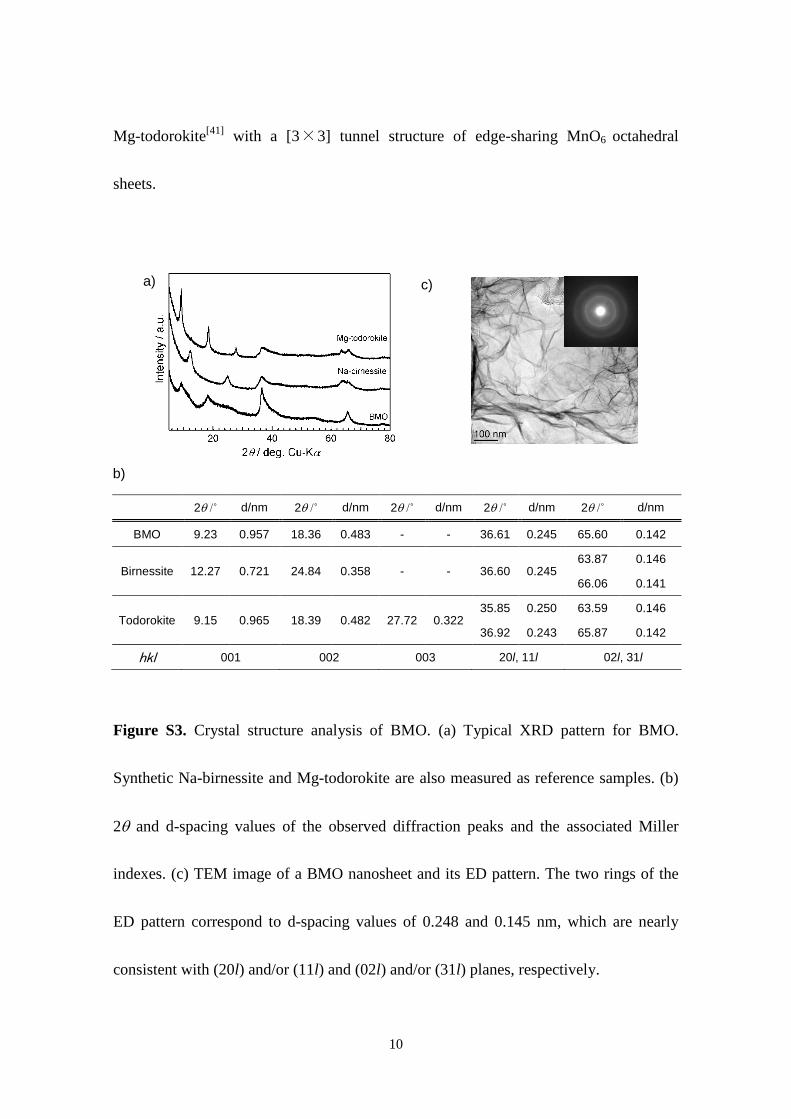
Figure S5. Mn K-edge XAFS results. (a) X-ray absorption near-edge-structure
(XANES) spectra of BMO and standard samples, Mn2+O, Mn3+2O3 and Mn4+O2. The
Mn K-edge absorption energy E0 is located between Mn3+2O3 and Mn4+O2. (b) The
average Mn oxidation state of BMO (+3.3) is determined by calibration of X-ray
absorption edge energies (E0) against spectra collected from Mn2+O, Mn3+2O3, and
Mn4+O2. (c) The radial structural functions (RSFs) of BMO, Na-birnessite and
Mg-todorokite, derived by Fourier transformation of XAFS vibrations. The first and
second peaks represent the correlation of Mn–O and Mn–Mn, respectively. All RSF
c)
b) a)

13
shapes are similar to each other, suggesting that all samples have a similar local
structure of MnO6 octahedra as primary units, which are consistent with XRD results.

14
S5 Culture vessels
Figure S6. Photos of the culture vessels used in this study. (a) The right-hand vessel
(volume 35 l) with transparent tubes for aeration was used in this study. (b) Vessel
interior with black BMO precipitate attached to the wall and bottom. (c) Dried BMO
powder.
a)
b) c)
15
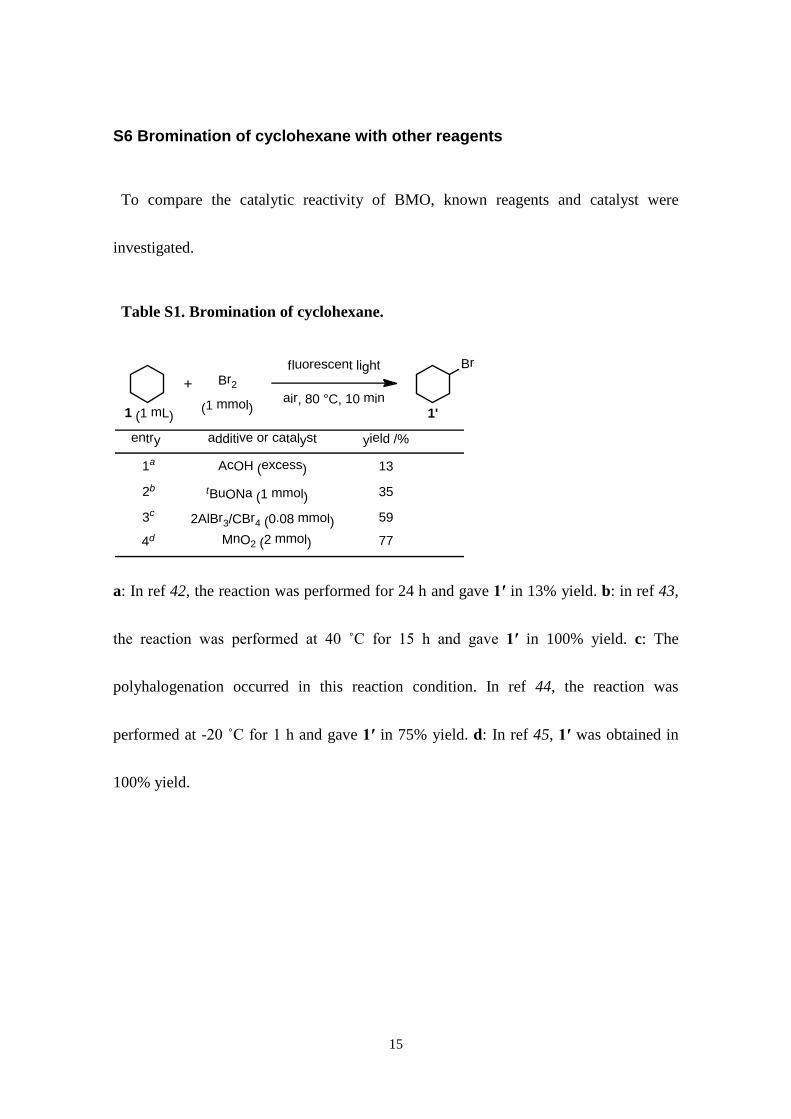
S6 Bromination of cyclohexane with other reagents
To compare the catalytic reactivity of BMO, known reagents and catalyst were
investigated.
Table S1. Bromination of cyclohexane.
a: In ref 42, the reaction was performed for 24 h and gave 1′ in 13% yield. b: in ref 43,
the reaction was performed at 40 ˚C for 15 h and gave 1′ in 100% yield. c: The
polyhalogenation occurred in this reaction condition. In ref 44, the reaction was
performed at -20 ˚C for 1 h and gave 1′ in 75% yield. d: In ref 45, 1′ was obtained in
100% yield.
Br2
1 (1 mL) (1 mmol)air, 80 °C, 10 min
additive or catalyst yield /%entry
1a
2b
3c
AcOH (excess)tBuONa (1 mmol)
2AlBr3/CBr4 (0.08 mmol)
Br
1'
13
35
59
fluorescent light
4d MnO2 (2 mmol) 77

16
S7 Monochromatic irradiation-action spectrum analysis
We speculated that formation of one molecule of bromocyclohexane (1′) requires
one photon, and formation of one molecule of dibromocyclohexane (1′′) requires two
photons.
+ Br2
cat. BMO or none
hn
Br Br
Br+
R H R + H+ + e-
Br2 + e- Br- + Br
1 1' 1''
We measured light intensity at various wavelengths with an optical power meter
(HIOKI Optical Power Meter 3664). We measured the numbers of product molecules 1′
and 1′′ with a gas chromatography (Shimadzu GC-2014) using dodecane as an internal
standard. Detailed analysis data were shown in Table S2.

17
Table S2. Calculation of apparent quantum efficiency. (A) and (B) Reactions were
performed in the presence of BMO (two runs). (C) Average apparent quantum
efficiency based on the two runs. (D) Reactions were performed in the absence of BMO.
(A) With BMO (run 1)
Wavelength
/nm
Light
intensity/W
Numbers of
irradiated
photon/s
Numbers of product molecule/s Number of
used
photon/s
Apparent
quantum efficiency 1' 1''
320 0.00989 1.59E + 16 3.73 E + 16 0.06 E + 16 3.84 E + 16 2.41
335 0.01245 2.10E + 16 6.34 E + 16 0.00E + 00 6.34 E + 16 3.02
365 0.01643 3.02 E + 16 5.85 E + 16 0.41 E + 16 6.68 E + 16 2.21
395 0.01563 3.10 E + 16 5.97 E + 16 0.39 E + 16 6.76 E + 16 2.18
425 0.01555 3.32 E + 16 5.12 E + 16 0.29 E + 16 5.70 E + 16 1.71
455 0.01745 3.99 E + 16 6.00 E + 16 0.42 E + 16 6.84 E + 16 1.71
485 0.01532 3.74 E + 16 3.73 E + 16 0.88 E + 16 3.91 E + 16 1.05
515 0.01406 3.64 E + 16 4.39 E + 16 0.26 E + 16 4.92 E + 16 1.35
545 0.01329 3.64 E + 16 4.27 E + 16 0.16 E + 16 4.59 E + 16 1.26
(B) With BMO (run 2)
Wavelength
/nm
Light
intensity/W
Numbers of
irradiated
photon/s
Numbers of product molecule/s Number of
used
photon/s
Apparent
quantum efficiency 1' 1''
320 0.00989 1.59 E + 16 3.56 E + 16 0.06 E + 16 3.66 E + 16 2.30
335 0.01245 2.10 E + 16 6.34 E + 16 0.23 E + 16 6.81 E + 16 3.25
365 0.01643 3.02 E + 16 6.67 E + 16 0.34 E + 16 7.35 E + 16 2.44
395 0.01563 3.10 E + 16 5.70 E + 16 0.34 E + 16 6.38 E + 16 2.28
425 0.01555 3.32 E + 16 4.89 E + 16 0.23 E + 16 5.34 E + 16 1.72
455 0.01745 3.99 E + 16 4.71 E + 16 0.40 E + 16 5.51 E + 16 1.76
485 0.01532 3.74 E + 16 3.78 E + 16 0.09 E + 16 3.97 E + 16 1.20
515 0.01406 3.64 E + 16 4.11 E + 16 0.26 E + 16 4.63 E + 16 1.37
545 0.01329 3.64 E + 16 4.38 E + 16 0.14 E + 16 4.65 E + 16 1.16

18
(C) Average of run 1 and 2
Wavelength/nm Apparent quantum efficiency
(average of runs 1 and 2)
320 2.37
335 3.15
365 2.34
395 2.24
425 1.73
455 1.75
485 1.13
515 1.37
545 1.22
(D) No catalyst
Wavelength
/nm
Light
intensity/W
Numbers of
irradiated
photon/s
Numbers of product molecule/s Number of
used
photon/s
Apparent
quantum efficiency 1' 1''
320 0.00989 1.59E + 16 0.50E + 15 0.04 E + 15 0.06E + 16 0.363
350 0.01387 2.44 E + 16 4.37 E + 15 1.00 E + 15 0.64 E + 16 0.261
380 0.01464 2.80 E + 16 7.77 E + 15 1.60 E + 15 1.10 E + 16 0.392
440 0.01532 3.39 E + 16 8.06 E + 15 1.59 E + 15 1.12 E + 16 0.331
500 0.01473 3.70 E + 16 8.38 E + 15 1.67 E + 15 1.17 E + 16 0.316
560 0.01066 3.00E + 19 5.48 E + 15 1.29 E + 15 0.81 E + 16 0.269

19
References and Notes
31. S. Brunauer, P. H. Emmett, E.Teller, J. Amer. Chem. Soc. 60, 309 (1938).
32. D. Dollimore, G. R. Heal, J. Applied Chem. 14, 109 (1964).
33. D. Dollimore, G. R. Heal, J. Colloid Interface Sci. 33, 508 (1970).
34. B. Ravel, M. Newville, J. Synchrotron Rad. 12, 537 (2005).
35. M. Newville, J. Synchrotron Rad. 8, 322 (2001).
36. I. Saratovsky et al., J. Amer. Chem. Soc. 128, 11188 (2006).
37. I. Saratovsky, S. J. Gurr, M. A. Hayward, Geochim. Cosmochim. Acta 73, 3291 (2009).
38. V. Petkov et al., ACS nano 3, 441 (2009).
39. S. Grangeon, B. Lanson, N. Miyata, Y. Tani, A. Manceau, Am. Mineral. 95, 1608 (2010).
40. X. Yang, H. Kanoh, W.Tang, Z. H. Liu, K. Ooi, Chem. Lett. 1192 (2000).
41. J. E. Post, D. R. Veblen, Am. Mineral. 75, 477 (1990).
42. J. F. Post, P. Heaney, J. Hanson, Am. Mineral. 88, 142 (2003).
43. T. M. Shaikh, A. Sudalai, Tetrahedron Lett. 46, 5587 (2005).
44. R. Montoro, T. Wirth, Synthesis 9, 1473 (2005).
45. I. S. Akhrem, A. V. Orlinkov, L. V. Afanas’eva, E. I. Mysov, M. E. Vol’pin, Tetrahedron
Lett. 36, 9365 (1995).
46. X. Jiang, M. Shen, Y. Tang, C. Li, Tetrahedron Lett. 46, 487 (2005).