SUPPLEMENTARY INFORMATION Lewis acidity - … INFORMATION Page S9 H2 cleavage by FLPs Equimolar...
18
SUPPLEMENTARY INFORMATION Page S1 Novel B(Ar') 2 (Ar'') hetero-tri(aryl)boranes: a systematic study of Lewis acidity Robin J. Blagg,* Trevor R. Simmons, Georgina R. Hatton, James M. Courtney, Elliot L. Bennett, Elliot J. Lawrence and Gregory G. Wildgoose* School of Chemistry, University of East Anglia, Norwich, NR4 7TJ, U.K. * [email protected] ; [email protected] Experimental B{3,5-(CF 3 ) 2 C 6 H 3 } 2 (OH) 1 H NMR (500.21 MHz, CD 2 Cl 2 , 25 ºC, δ): +8.20 (s, 4H, Ar F6 2,6-H), +8.10 (s, 2H, Ar F6 4-H), +6.61 (s, 1H, OH); 11 B NMR (160.49 MHz, CD 2 Cl 2 , 25 ºC, δ): +44.3 (br.s); 13 C{ 1 H} NMR (125.78 MHz, CD 2 Cl 2 , 25 ºC, δ): +134.9 (br.q, 3 J CF = 3.7 Hz, Ar F6 2,6-C), +131.9 (q, 2 J CF = 33.0 Hz, Ar F6 3,5-C), +125.8 (sept., 3 J CF = 3.7 Hz, Ar F6 4-C), +124.0 (q, 1 J CF = 273 Hz, Ar F6 3,5-CF 3 ); 19 F NMR (470.67 MHz, CD 2 Cl 2 , 25 ºC, δ): −63.4 (s, 12F, Ar F6 3,5-CF 3 ). B{3,5-(CF 3 ) 2 C 6 H 3 }(OMe) 2 1 H NMR (500.21 MHz, C 6 D 6 , 25 ºC, δ): +7.86 (s, 2H, Ar F6 2,6-H), +7.79 (s, 1H, Ar F6 4-H), +3.30 (s, 6H, OMe); 11 B NMR (160.49 MHz, C 6 D 6 , 25 ºC, δ): +27.2 (br.s); 19 F NMR (470.67 MHz, C 6 D 6 , 25 ºC, δ): −62.7 (s, 6F, Ar F6 3,5-CF 3 ). Electronic Supplementary Material (ESI) for Dalton Transactions. This journal is © The Royal Society of Chemistry 2015
Transcript of SUPPLEMENTARY INFORMATION Lewis acidity - … INFORMATION Page S9 H2 cleavage by FLPs Equimolar...
SUPPLEMENTARY INFORMATION
Page S1
Novel B(Ar')2(Ar'') hetero-tri(aryl)boranes: a systematic study of
Lewis acidityRobin J. Blagg,* Trevor R. Simmons, Georgina R. Hatton, James M. Courtney, Elliot L.
Bennett, Elliot J. Lawrence and Gregory G. Wildgoose*
School of Chemistry, University of East Anglia, Norwich, NR4 7TJ, U.K.
* [email protected] ; [email protected]
ExperimentalB{3,5-(CF3)2C6H3}2(OH)1H NMR (500.21 MHz, CD2Cl2, 25 ºC, δ): +8.20 (s, 4H, ArF6 2,6-H), +8.10 (s, 2H, ArF6 4-H), +6.61 (s,
1H, OH); 11B NMR (160.49 MHz, CD2Cl2, 25 ºC, δ): +44.3 (br.s); 13C{1H} NMR (125.78 MHz,
CD2Cl2, 25 ºC, δ): +134.9 (br.q, 3JCF = 3.7 Hz, ArF6 2,6-C), +131.9 (q, 2JCF = 33.0 Hz, ArF6 3,5-C),
+125.8 (sept., 3JCF = 3.7 Hz, ArF6 4-C), +124.0 (q, 1JCF = 273 Hz, ArF6 3,5-CF3); 19F NMR (470.67
MHz, CD2Cl2, 25 ºC, δ): −63.4 (s, 12F, ArF6 3,5-CF3).
B{3,5-(CF3)2C6H3}(OMe)2
1H NMR (500.21 MHz, C6D6, 25 ºC, δ): +7.86 (s, 2H, ArF6 2,6-H), +7.79 (s, 1H, ArF6 4-H), +3.30 (s,
6H, OMe); 11B NMR (160.49 MHz, C6D6, 25 ºC, δ): +27.2 (br.s); 19F NMR (470.67 MHz, C6D6, 25 ºC,
δ): −62.7 (s, 6F, ArF6 3,5-CF3).
Electronic Supplementary Material (ESI) for Dalton Transactions.This journal is © The Royal Society of Chemistry 2015

SUPPLEMENTARY INFORMATION
Page S2
X-ray CrystallographyTo ensure the refinement of 6 converged it was necessary to treat the boron atom as isotropic.
Additionally one of the CF3 groups is modelled with crystallographic disorder of the fluoride atoms
over two positions (58:42) due to rotation about the C(17)−C(20)F3 bond.
Figure S1a X-ray crystallographic structure of B{3,5-(CF3)2C6H3}2(C6Cl5) 5
Figure S1b X-ray crystallographic structure of B(C6Cl5)2{3,5-(CF3)2C6H3} 6

SUPPLEMENTARY INFORMATION
Page S3
Computational Calculations – DFT
Figure S2a DFT optimised structure of B(C6F5)3 1 (reproduced from reference 34)
Figure S2b DFT optimised structure of B(C6F5)2{3,5-(CF3)2C6H3} 2
Figure S2c DFT optimised structure of B{3,5-(CF3)2C6H3}2(C6F5) 3
SUPPLEMENTARY INFORMATION
Page S4
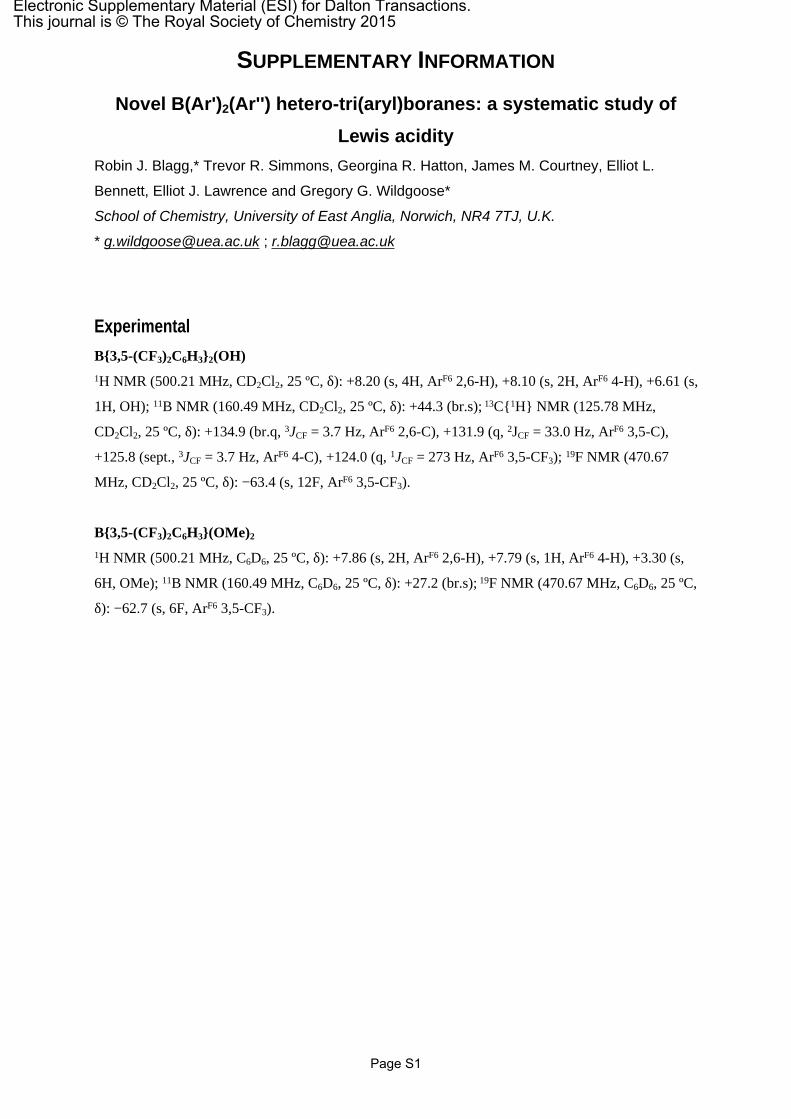
Computational calculations were performed using density functional theory (DFT) using the Gaussian
09 (revision C.01) computational package.S1 Calculations were carried out using the three-parameter
exchange functional of Becke (B3) with the correlation functional of Lee, Yang, and Parr (LYP),
B3LYP;S2, S3 together with applying the 6-311+G(d,p) basis set for all atoms.S4 Structures were
geometry optimised in the gas phase with the default convergence criteria, and confirmed as minima
through frequency calculations.
S1 Gaussian 09, Revision C.01, M. J. Frisch, G. W. Trucks, H. B. Schlegel, G. E. Scuseria, M. A.
Robb, J. R. Cheeseman, G. Scalmani, V. Barone, B. Mennucci, G. A. Petersson, H. Nakatsuji, M.
Caricato, X. Li, H. P. Hratchian, A. F. Izmaylov, J. Bloino, G. Zheng, J. L. Sonnenberg, M. Hada, M.
Ehara, K. Toyota, R. Fukuda, J. Hasegawa, M. Ishida, T. Nakajima, Y. Honda, O. Kitao, H. Nakai, T.
Vreven, J. A. Montgomery, Jr., J. E. Peralta, F. Ogliaro, M. Bearpark, J. J. Heyd, E. Brothers, K. N.
Kudin, V. N. Staroverov, T. Keith, R. Kobayashi, J. Normand, K. Raghavachari, A. Rendell, J. C.
Burant, S. S. Iyengar, J. Tomasi, M. Cossi, N. Rega, J. M. Millam, M. Klene, J. E. Knox, J. B. Cross,
V. Bakken, C. Adamo, J. Jaramillo, R. Gomperts, R. E. Stratmann, O. Yazyev, A. J. Austin, R. Cammi,
C. Pomelli, J. W. Ochterski, R. L. Martin, K. Morokuma, V. G. Zakrzewski, G. A. Voth, P. Salvador, J.
J. Dannenberg, S. Dapprich, A. D. Daniels, O. Farkas, J. B. Foresman, J. V. Ortiz, J. Cioslowski, and
D. J. Fox, Gaussian, Inc., Wallingford CT, 2010.S2 A. D. Becke, J. Chem. Phys., 1993, 98, 5648-5652.S3 C. Lee, W. Yang and R. G. Parr, Phys. Rev. B Condens. Matter, 1988, 37, 785-789.S4 P. C. Hariharan and J. A. Pople, Theor. Chim. Acta., 1973, 28, 213-222.
SUPPLEMENTARY INFORMATION
Page S5
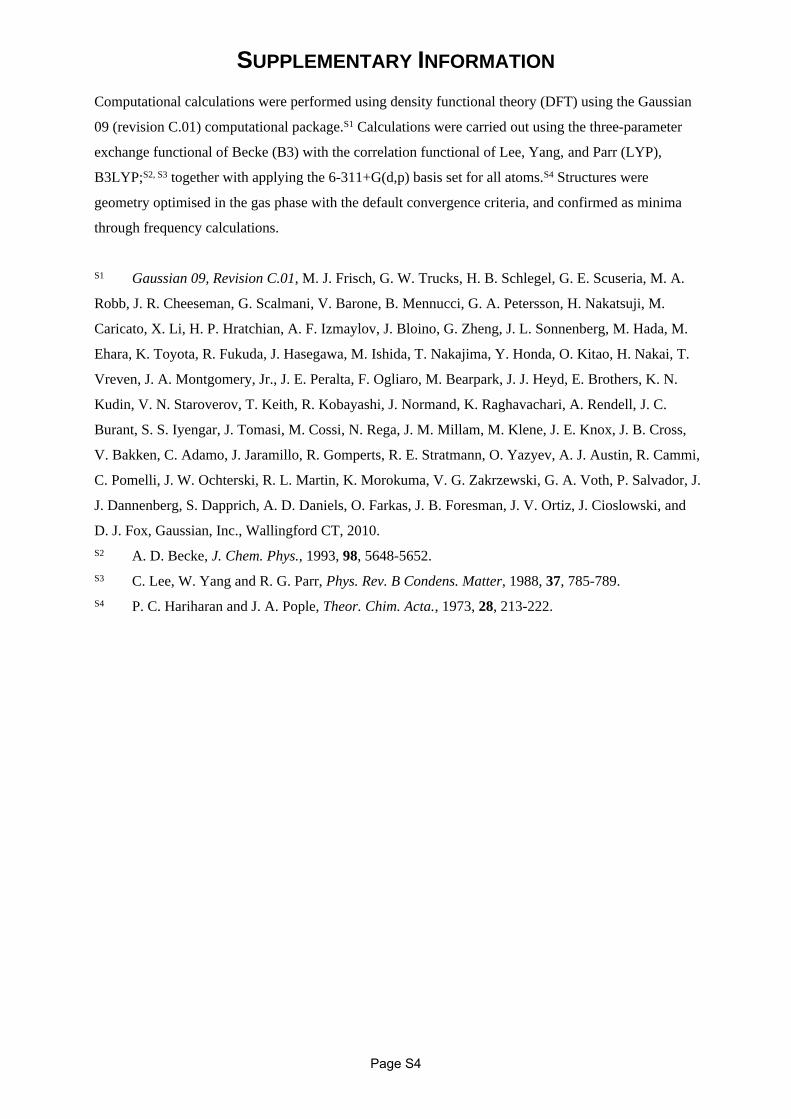
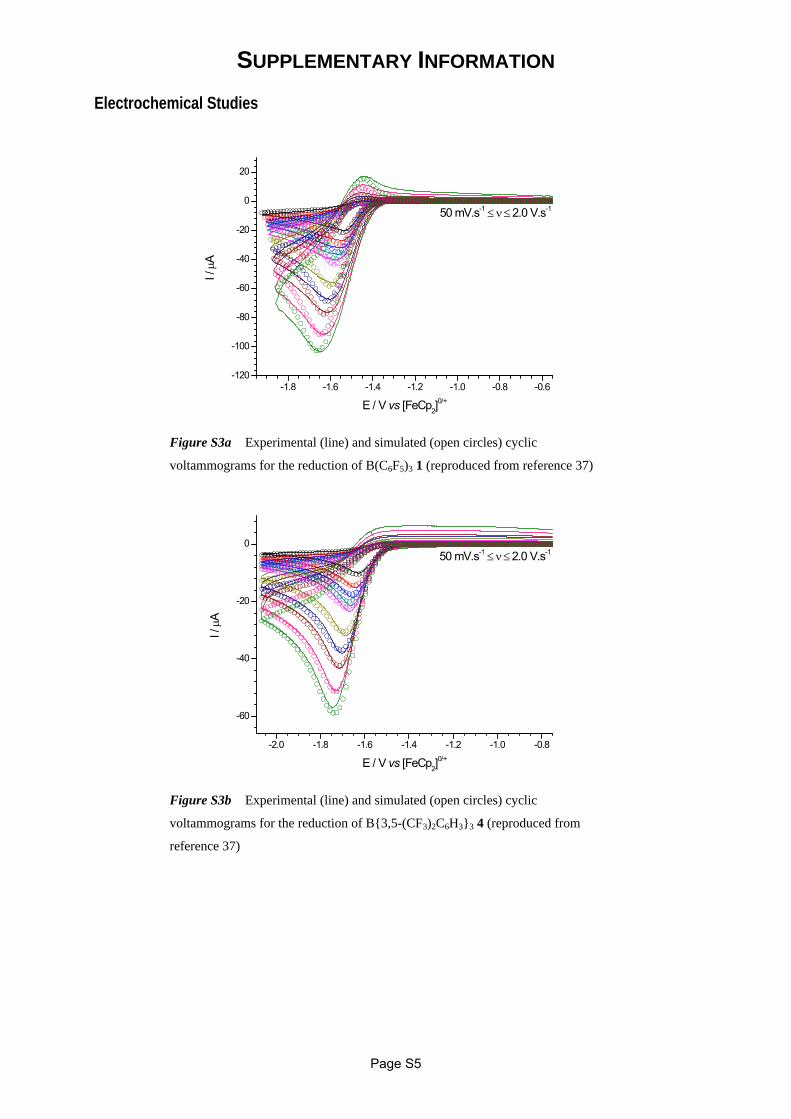
Electrochemical Studies
-1.8 -1.6 -1.4 -1.2 -1.0 -0.8 -0.6-120
-100
-80
-60
-40
-20
0
20
50 mV.s-1 2.0 V.s-1I /
A
E / V vs [FeCp2]0/+
Figure S3a Experimental (line) and simulated (open circles) cyclic
voltammograms for the reduction of B(C6F5)3 1 (reproduced from reference 37)
-2.0 -1.8 -1.6 -1.4 -1.2 -1.0 -0.8
-60
-40
-20
050 mV.s-1 2.0 V.s-1
I /
A
E / V vs [FeCp2]0/+
Figure S3b Experimental (line) and simulated (open circles) cyclic
voltammograms for the reduction of B{3,5-(CF3)2C6H3}3 4 (reproduced from
reference 37)

SUPPLEMENTARY INFORMATION
Page S6
Cyclic voltammograms were also obtained of a pure sample of B{3,5-(CF3)2C6H3}2(OH), showing a
one electron irreversible reduction at considerably more negative potentials (ca. −2.3 V vs [FeCp2]0/+)
than observed for any of the tri(aryl)boranes (Figure S4).
-2.4 -2.2 -2.0 -1.8 -1.6 -1.4 -1.2 -1.0-140
-120
-100
-80
-60
-40
-20
050 mV.s-1 2.0 V.s-1
I /
A
E / V vs [FeCp2]0/+
Figure S4 Experimental cyclic voltammograms for the reduction of B{3,5-
(CF3)2C6H3}2(OH)

SUPPLEMENTARY INFORMATION
Page S7
Measurements of Lewis acidity“Gutmann-Beckett Method” B(Ar')2(Ar") (Lewis acid) is combined with a three-fold excess of
OPEt3 (Lewis base) in ca. 0.8 cm3 CD2Cl2 in an NMR tube, rapidly generating the Lewis acid-base
adduct Et3POB(Ar')2(Ar"), and 1H, 11B, 19F and 31P{1H} NMR spectra obtained (Tables 3 & S1).
Table S1 NMR spectral data for the Lewis acid/base adducts 1−OPEt3 – 9−OPEt3
1−OPEt31H NMR (500.21 MHz, CD2Cl2, 25 ºC, δ): +1.92 (dq 4JHP = 12.2 Hz, 3JHH = 7.7 Hz, 6H), +1.11 (dt, 3JHP = 18.7 Hz, 3JHH = 7.7 Hz, 9H); 19F NMR (470.67 MHz, CD2Cl2, 25 ºC, δ): −134.4 (m, 6F), −159.1 (t, 3JFF = 19.9 Hz, 3F), −165.0 (m, 6F).
2−OPEt31H NMR (500.21 MHz, CD2Cl2, 25 ºC, δ): +7.79 (s, 2H), +7.68 (s 1H), +1.86 (dq, 4JHP = 12.0 Hz, 3JHH = 7.8 Hz, 6H); 19F NMR (470.67 MHz, CD2Cl2, 25 ºC, δ): −62.9 (s, 6F), −132.0 (m, 4F), −158.5 (t, 3JFF = 19.9 Hz, 2F), −164.1 (m, 4F).
3−OPEt31H NMR (500.21 MHz, CD2Cl2, 25 ºC, δ): +7.83 (s, 4H), +7.78 (s 2H), +1.68 (dq, 4JHP = 11.9 Hz, 3JHH = 7.6 Hz, 6H), +1.11 (dt, 3JHP = 18.4 Hz, 3JHH = 7.6 Hz, 9H); 19F NMR (470.67 MHz, CD2Cl2, 25 ºC, δ): −63.1 (s, 12F), −131.8 (m, 2F), −158.9 (t, 3JFF = 19.9 Hz, 1F), −163.9 (m, 2F).
4−OPEt31H NMR (500.21 MHz, CD2Cl2, 25 ºC, δ): +7.79 (s, 6H), +7.74 (s 3H), +1.68 (dq, 4JHP = 11.9 Hz, 3JHH = 7.7 Hz, 6H), +1.10 (dt, 3JHP = 18.2 Hz, 3JHH = 7.7 Hz, 9H); 19F NMR (470.67 MHz, CD2Cl2, 25 ºC, δ): −63.1 (s, 18F).
5−OPEt31H NMR (500.21 MHz, CD2Cl2, 25 ºC, δ): +7.90 (s, 4H), +7.75 (s 2H); 19F NMR (470.67 MHz, CD2Cl2, 25 ºC, δ): −63.1 (s, 12F).
6−OPEt31H NMR (500.21 MHz, CD2Cl2, 25 ºC, δ): +7.94 (s, 2H), +7.65 (s 1H); 19F NMR (470.67 MHz, CD2Cl2, 25 ºC, δ): −62.9 (s, 6F).
7−OPEt3 no adduct formation
8−OPEt31H NMR (500.21 MHz, CD2Cl2, 25 ºC, δ): +2.00 (br.m, 6H), +1.00 (br.m, 9H); 19F NMR (470.67 MHz, CD2Cl2, 25 ºC, δ): −130.0 (br.m, 1F), −133.1 (br.m, 1F), −158.5 (br.m, 1F), −164.0 (br.m, 1F), −165.9 (br.m, 1F).
9−OPEt31H NMR (500.21 MHz, CD2Cl2, 25 ºC, δ): +1.96 (dq 4JHP = 12.4 Hz, 3JHH = 7.7 Hz, 6H), +1.02 (dt, 3JHP = 18.8 Hz, 3JHH = 7.7 Hz, 9H);19F NMR (470.67 MHz, CD2Cl2, 25 ºC, δ): −133.1 (m, 2F), −158.8 (t, 3JFF = 20.3 Hz, 1F), −164.8 (m, 2F).
If resonances corresponding to the ethyl groups of the adduct are not specified, the resonances are co-incident
with / obscured by free Et3PO: 1H NMR (500.21 MHz, CD2Cl2, 25 ºC, δ): +1.64 (dq 4JHP = 11.7 Hz, 3JHH = 7.7
Hz), +1.11 (dt, 3JHP = 16.1 Hz, 3JHH = 7.7 Hz)11B NMR (160.49 MHz, CD2Cl2, 25 ºC, δ) and 31P{1H} NMR (202.49 MHz, CD2Cl2, 25 ºC, δ) spectral data
reported in Table 3

SUPPLEMENTARY INFORMATION
Page S8
Figure S5 Correlation between: (a) E°(borane) and δB(borane); (b) E°(borane) and δP(adduct); (c) E°(borane)
and δB(adduct); (d) δB(borane) and δP(adduct); (e) δB(borane) and δB(adduct); (f) δP(adduct) and δB(adduct).

SUPPLEMENTARY INFORMATION
Page S9
H2 cleavage by FLPsEquimolar quantities of B(Ar')2(Ar") (Lewis acid) and P(tBu)3 (Lewis base) are combined in ca. 0.8
cm3 CD2Cl2 (ca. 40 mM acid/base concentrations) in an NMR tube fitted with a J.Young valve. 1H, 11B, 19F and 31P{1H} NMR spectra are obtained. The solution is degassed in the NMR tube by three
freeze-pump-thaw cycles, before being frozen and the head-space of the NMR tube filled with dry H2.
The NMR tube is allowed to warm to room temperature (giving a H2 pressure of ca. 4 bar), shaken,
and the resulting reaction monitored by 1H and 11B NMR spectroscopy. (Spectra obtained at intervals
between 90 min and 12 hours until reaction reaches completion / spectra cease changes). Upon
completion of the reaction a final set of 1H, 11B, 19F and 31P{1H} NMR spectra are obtained (data
reported in Tables 4 and S2). Reaction mixture was maintained at room temperature (ca. +20 °C)
throughout.
Table S2 NMR spectral data for the terminal hydride, H2 cleavage products for the 1-9/P(tBu)3 FLPs
[HP(tBu)3]+ 1H NMR (500.21 MHz, CD2Cl2, 25 ºC, δ): +5.12 (d, 1JHP = 430 Hz, 1H), +1.58 (d, 3JHP = 15.7Hz, 27H); 31P{1H} NMR (202.49 MHz, CD2Cl2, 25 ºC, δ): +59.8 (s).
[H1]− 1H NMR (500.21 MHz, CD2Cl2, 25 ºC, δ): +3.60 (br.q, 1JHB = 93.9 Hz, 1H); 19F NMR (470.67 MHz, CD2Cl2, 25 ºC, δ): −133.6 (m, 6F), −163.4 (m, 3F), −166.7 (m, 6F).
[H2]− 1H NMR (500.21 MHz, CD2Cl2, 25 ºC, δ): +7.68 (s, 2H), +7.48 (s, 1H), +3.69 (br.q, 1JHB = 86.1 Hz, 1H); 19F NMR (470.67 MHz, CD2Cl2, 25 ºC, δ): −62.4 (s, 6F), −131.6 (m, 4F), −163.9 (t, 3JFF = 19.9 Hz, 2F), −166.8 (m, 4F).
[H3]− 1H NMR (500.21 MHz, CD2Cl2, 25 ºC, δ): +7.74 (s, 4H), +7.51 (s, 2H), +3.71 (br.q, 1JHB = 86.1 Hz, 1H); 19F NMR (470.67 MHz, CD2Cl2, 25 ºC, δ): −62.5 (s, 12F), −131.8 (br.m, 2F), −163.6 (t, 3JFF = 19.5 Hz, 1F), −166.0 (m, 2F).
[H4]− no terminal hydride formation
[H5]− 1H NMR (500.21 MHz, CD2Cl2, 25 ºC, δ): +7.75 (s, 4H), +7.48 (s, 2H), +4.22 (br.q, 1JHB = 86.1 Hz, 1H); 19F NMR (470.67 MHz, CD2Cl2, 25 ºC, δ): −62.5 (s, 12F).
[H6]− 1H NMR (500.21 MHz, CD2Cl2, 25 ºC, δ): +7.63 (br.s, 2H), +7.47 (s, 1H), +4.24 (br.q, 1JHB = 88.0 Hz, 1H); 19F NMR (470.67 MHz, CD2Cl2, 25 ºC, δ): −62.5 (s, 6F).
[H7]− no reaction
[H8]− 1H NMR (500.21 MHz, CD2Cl2, 25 ºC, δ): +4.11 (br.q, 1JHB = 86.1 Hz, 1H); 19F NMR (470.67 MHz, CD2Cl2, 25 ºC, δ): −133.9 (m, 4F), −164.8 (m, 2F), −167.7 (m, 4F).
[H9]− 1H NMR (500.21 MHz, CD2Cl2, 25 ºC, δ): +3.94 (br.q, 1JHB = 90.0 Hz, 1H); 19F NMR (470.67 MHz, CD2Cl2, 25 ºC, δ): −133.5 (m, 4F), −164.9(m, 2F), −167.6 (m, 4F).
11B NMR (160.49 MHz, CD2Cl2, 25 ºC, δ) spectral data reported in Table 4

SUPPLEMENTARY INFORMATION
Page S10
Figure S6a 1H NMR spectra showing the progress of H2 cleavage by the 1/P(tBu)3 FLP
post H2 addition spectra at ca. 90 min intervals
Figure S6b 11B NMR spectra showing the progress of H2 cleavage by the 1/P(tBu)3 FLP
post H2 addition spectra at ca. 90 min intervals

SUPPLEMENTARY INFORMATION
Page S11
Figure S7a 1H NMR spectra showing the progress of H2 cleavage by the 2/P(tBu)3 FLP
post H2 addition spectra at ca. 90 min intervals
Figure S7b 11B NMR spectra showing the progress of H2 cleavage by the 2/P(tBu)3 FLP
post H2 addition spectra at ca. 90 min intervals

SUPPLEMENTARY INFORMATION
Page S12
Figure S8a 1H NMR spectra showing the progress of H2 cleavage by the 3/P(tBu)3 FLP
post H2 addition, 12 spectra at ca. 90 min intervals, subsequently at ca. 12 hour intervals
Figure S8b 11B NMR spectra showing the progress of H2 cleavage by the 3/P(tBu)3 FLP
post H2 addition, 12 spectra at ca. 90 min intervals, subsequently at ca. 12 hour intervals
SUPPLEMENTARY INFORMATION
Page S13
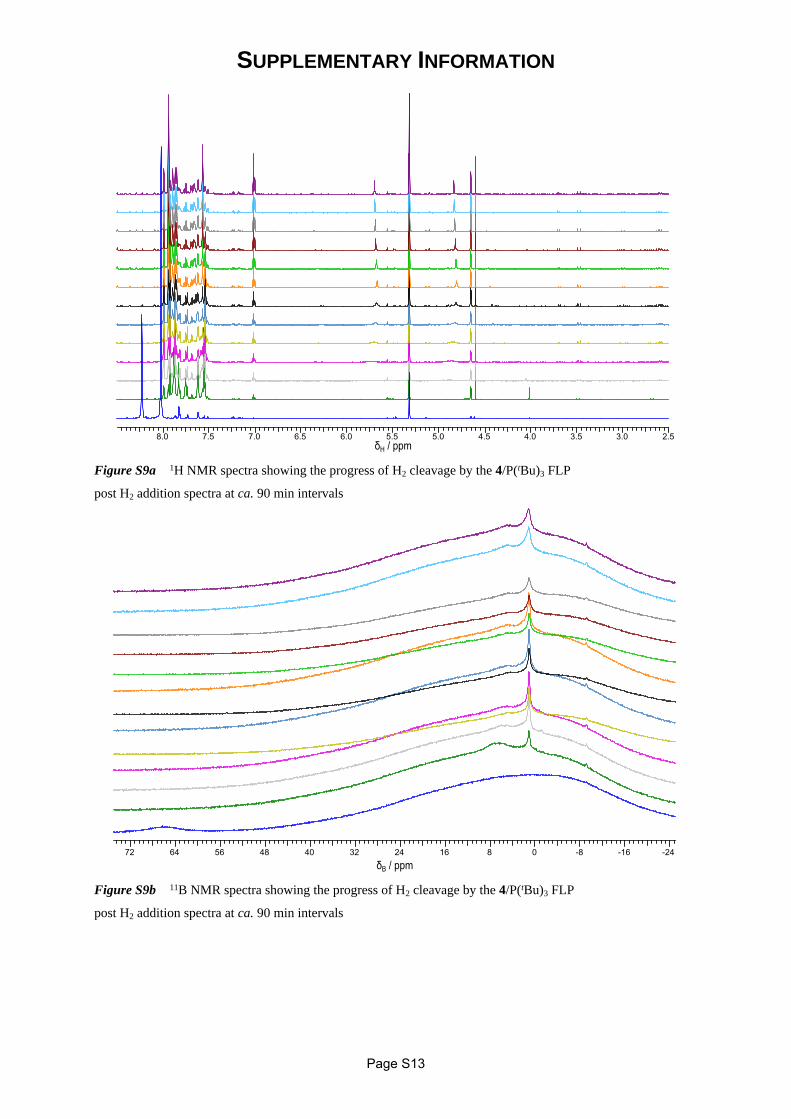
Figure S9a 1H NMR spectra showing the progress of H2 cleavage by the 4/P(tBu)3 FLP
post H2 addition spectra at ca. 90 min intervals
Figure S9b 11B NMR spectra showing the progress of H2 cleavage by the 4/P(tBu)3 FLP
post H2 addition spectra at ca. 90 min intervals

SUPPLEMENTARY INFORMATION
Page S14
Figure S10a 1H NMR spectra showing the progress of H2 cleavage by the 5/P(tBu)3 FLP
post H2 addition spectra at ca. 8 hour intervals
Figure S10b 11B NMR spectra showing the progress of H2 cleavage by the 5/P(tBu)3 FLP
post H2 addition spectra at ca. 8 hour intervals

SUPPLEMENTARY INFORMATION
Page S15
Figure S11a 1H NMR spectra showing the progress of H2 cleavage by the 6/P(tBu)3 FLP
post H2 addition spectra at ca. 8 hour intervals
Figure S11b 11B NMR spectra showing the progress of H2 cleavage by the 6/P(tBu)3 FLP
post H2 addition spectra at ca. 8 hour intervals

SUPPLEMENTARY INFORMATION
Page S16
Figure S12a 1H NMR spectra showing the progress of H2 cleavage by the 7/P(tBu)3 FLP
post H2 addition spectra at ca. 12 hour intervals
Figure S12b 11B NMR spectra showing the progress of H2 cleavage by the 7/P(tBu)3 FLP
post H2 addition spectra at ca. 12 hour intervals
SUPPLEMENTARY INFORMATION
Page S17
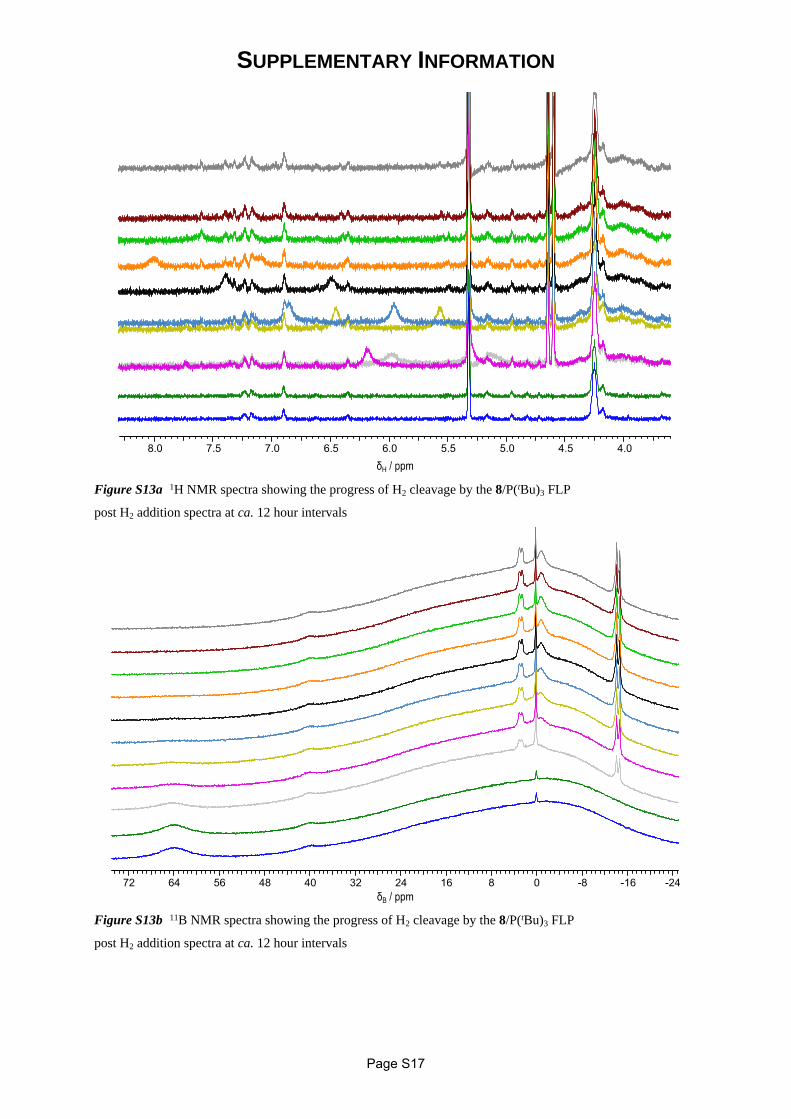
Figure S13a 1H NMR spectra showing the progress of H2 cleavage by the 8/P(tBu)3 FLP
post H2 addition spectra at ca. 12 hour intervals
Figure S13b 11B NMR spectra showing the progress of H2 cleavage by the 8/P(tBu)3 FLP
post H2 addition spectra at ca. 12 hour intervals

SUPPLEMENTARY INFORMATION
Page S18
Figure S14a 1H NMR spectra showing the progress of H2 cleavage by the 9/P(tBu)3 FLP
post H2 addition spectra at ca. 90 min intervals
Figure S14b 11B NMR spectra showing the progress of H2 cleavage by the 9/P(tBu)3 FLP
post H2 addition spectra at ca. 90 min intervals