Supplementary Information 20110927 fileGenome&wideassociationstudyidentifies* three*...
20
Genomewide association study identifies three new melanoma susceptibility loci Jennifer H Barrett, Mark M Iles, Mark Harland, John C Taylor, Joanne F Aitken et al. * * A full list of author names appears in the main paper. SUPPLEMENTARY INFORMATION 1. SUPPLEMENTARY FIGURES p.1 2. SUPPLEMENTARY TABLES p.6 3. SUPPLEMENTARY NOTE p.9 3.1 Samples p.9 3.2 Quality Control (QC) Methods p.10 3.3 QC Results p.11 3.4 Details of Supplementary Table 2 p.12 3.5 Imputation p.13 3.6 Replication p.13 3.7 CCND1 locus p.15 3.8 Power of the GWA Study p.16 3.9 GenoMEL Collaboration p.17 3.10 References p.19 Nature Genetics: doi:10.1038/ng.959
Transcript of Supplementary Information 20110927 fileGenome&wideassociationstudyidentifies* three*...

Genome-‐wide association study identifies three
new melanoma susceptibility loci
Jennifer H Barrett, Mark M Iles, Mark Harland, John C Taylor, Joanne F Aitken et al. *
* A full list of author names appears in the main paper.
SUPPLEMENTARY INFORMATION
1. SUPPLEMENTARY FIGURES p.1
2. SUPPLEMENTARY TABLES p.6
3. SUPPLEMENTARY NOTE p.9
3.1 Samples p.9
3.2 Quality Control (QC) Methods p.10
3.3 QC Results p.11
3.4 Details of Supplementary Table 2 p.12
3.5 Imputation p.13
3.6 Replication p.13
3.7 CCND1 locus p.15
3.8 Power of the GWA Study p.16
3.9 GenoMEL Collaboration p.17
3.10 References p.19
Nature Genetics: doi:10.1038/ng.959

1
Supplementary Figures and Legends
Supplementary Figure 1 (see Figure S1): a) Principal Components for the genome-‐wide study
combined with HapMap data. Plot of first two principal
components from analysis of study data (after QC)
combined with HapMap data. The ethnicity of the
HapMap samples is indicated by color. The legend uses
standard HapMap abbreviations (see
http://hapmap.ncbi.nlm.nih.gov); briefly
Chinese/Japanese samples are blue circles, African
populations are green circles, European are
red/magenta circles. Indian samples are yellow circles
and Mexican grey circles. The GenoMEL samples
declared to be of European ethnicity are black circles.
Those GenoMEL samples that were excluded are
represented by plus signs. Those colored green are
samples we later confirmed to be non-‐European; those
in red are from Phase 1 and those in black from Phase 2.
b & c) Plots of principal components 1 against 2 (b) and
3 against 4 (c) after QC for those GenoMEL samples
declared to be of European ethnicity. Regions indicated
by color: Scandinavia (magenta), Australia (orange),
Israel (pale blue), Poland (dark blue), Spain (light
green), Italy (dark green), France (black), UK and
Netherlands (brown).
Nature Genetics: doi:10.1038/ng.959

2
Supplementary Figure 2 (see Figure S2): Stratified Cochran-‐Armitage (CA) trend tests for four known melanoma-‐susceptibility regions on
chromosomes 5, 20 and 22. The log10 p-‐values are from the CA trend test (stratified by geographical
region) for genotyped and imputed SNPs. SNPs genotyped for all samples are shown in black, SNPs
imputed for all samples in red and SNPs genotyped for some samples and imputed for others (due to chip
differences) in green. The solid horizontal line indicates a p-‐value of 10-‐5. The horizontal lines at the top of
the figure indicate the extent of genes in the central region of interest. In particular those lines that are
colored (non-‐black) represent: (i) on chromosome 5, ADAMTS12 (red), RXFP3 (green), SLC45A2 (blue),
AMACR (orange), (ii) on chromosome 20, CHMP4B (red), RALY (green), EIF2S2 (blue), ASIP (orange), (iii)
on chromosome 22, PICK1 (brown), SLC16A8 (red), BAIAP2L2 (green), PLA2G6 (blue), MAFF (orange) and
(iv) on chromosome 5, SLC6A18 (red), TERT (green), CLPTM1L (blue), SLC6A3 (orange).
Nature Genetics: doi:10.1038/ng.959
3
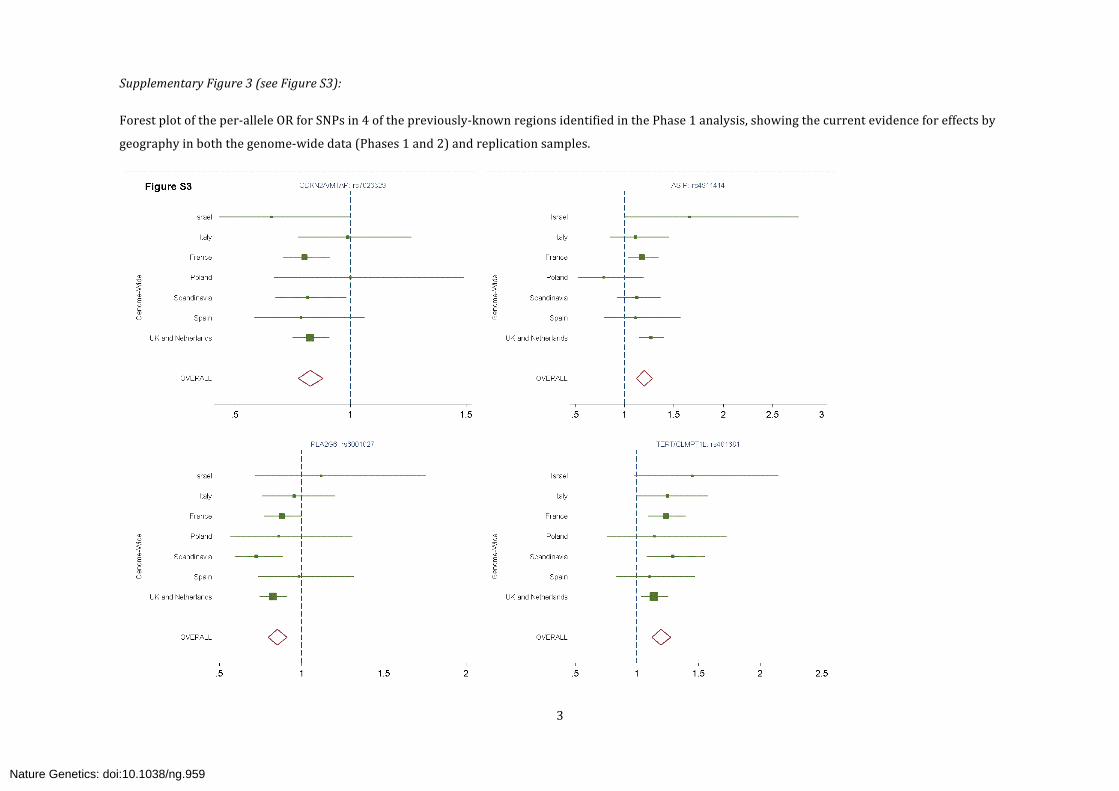
Supplementary Figure 3 (see Figure S3):
Forest plot of the per-‐allele OR for SNPs in 4 of the previously-‐known regions identified in the Phase 1 analysis, showing the current evidence for effects by
geography in both the genome-‐wide data (Phases 1 and 2) and replication samples.
Nature Genetics: doi:10.1038/ng.959
4
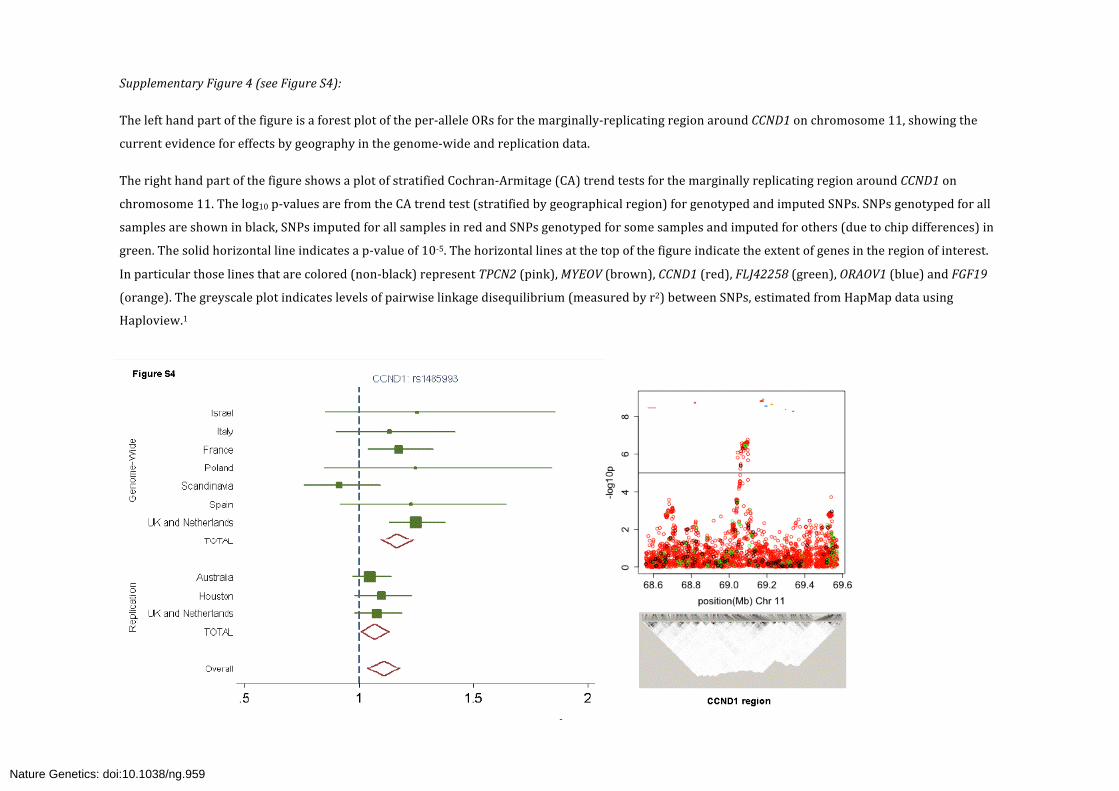
Supplementary Figure 4 (see Figure S4):
The left hand part of the figure is a forest plot of the per-‐allele ORs for the marginally-‐replicating region around CCND1 on chromosome 11, showing the
current evidence for effects by geography in the genome-‐wide and replication data.
The right hand part of the figure shows a plot of stratified Cochran-‐Armitage (CA) trend tests for the marginally replicating region around CCND1 on
chromosome 11. The log10 p-‐values are from the CA trend test (stratified by geographical region) for genotyped and imputed SNPs. SNPs genotyped for all
samples are shown in black, SNPs imputed for all samples in red and SNPs genotyped for some samples and imputed for others (due to chip differences) in
green. The solid horizontal line indicates a p-‐value of 10-‐5. The horizontal lines at the top of the figure indicate the extent of genes in the region of interest.
In particular those lines that are colored (non-‐black) represent TPCN2 (pink), MYEOV (brown), CCND1 (red), FLJ42258 (green), ORAOV1 (blue) and FGF19
(orange). The greyscale plot indicates levels of pairwise linkage disequilibrium (measured by r2) between SNPs, estimated from HapMap data using
Haploview.1
Nature Genetics: doi:10.1038/ng.959

5
Supplementary Tables
Supplementary Table 1:
Description of genome-‐wide samples. In total samples from 2,804 cases and 7,618 controls were included in the genome-‐wide analysis. Summary
information detailing samples contributed, genotyping laboratories and phase of study is given for participating GenoMEL groups. Also listed are the
numbers of samples genotyped by phase, the numbers excluded after quality control, and the remaining numbers of cases and controls. The genotyping
laboratory is either SXS (ServiceXS, Leiden, The Netherlands), CNG (Centre National de Génotypage, Evry, France), or SAN (Sanger Centre, Cambridge, UK).
387 Australian samples (most of which pass QC) are listed as being in Phase 1, but are excluded from the total number after QC and from our analysis,
because many are in the Australian replication set.
Group Country Lab Phase 1 Phase 2 Phase 1 Phase 2 Total % of genotyped Cases ControlsBrisbane* Australia SXS 191 0 20 0 0 0% 0 0Sydney* Australia SXS 196 0 17 0 0 0% 0 0Paris France CNG 477 0 18 0 459 96% 459 0Paris France SXS 197 135 24 11 297 89% 212 85Tel Aviv Israel SXS 0 216 0 29 187 87% 112 75Emilia-Romagna Italy SXS 200 0 11 0 189 95% 96 93Genoa Italy SXS 198 192 13 14 363 93% 179 184Leiden Netherlands SXS 199 199 9 6 383 96% 195 188Bergen-Oslo Norway SXS 0 397 0 9 388 98% 194 194Szczecin Poland SXS 0 195 0 7 188 96% 96 92Barcelona Spain SXS 199 195 39 13 342 87% 164 178Lund Sweden SXS 200 0 4 0 196 98% 99 97Stockholm Sweden SXS 193 204 29 19 349 88% 164 185Glasgow UK SXS 0 163 0 23 140 86% 75 65Leeds UK CNG 91 0 13 0 78 86% 78 0Leeds UK SXS 374 739 15 18 1080 97% 681 399TOTAL GenoMEL 2715 2635 212 149 4989 93% 2804 1835
Other Control SamplesFrench Controls France CNG 1824 364 282 1 1905 87% 0 1905WTCCC 1958 Birth cohort UK SAN 1333 1512 103 133 2609 92% 0 2609WTCCC NBS controls UK SAN 0 1393 0 124 1269 91% 0 1269TOTAL other control samples 3157 3269 385 258 5783 90% 0 5783
TOTAL Samples 5872 5904 597 407 10772 91% 2804 7618
* Samples included in first phase GWA but excluded from overall analysis because of overlap with other studies
Samples in final statistical analysisExcluded samplesGenotyped samples
Nature Genetics: doi:10.1038/ng.959

6
Supplementary Table 2:
Summary of SNPs and loci previously identified as associated with melanoma risk either in genome-‐wide association studies or in candidate gene studies.
For the genome-‐wide studies, Bishop et al.2 showed evidence for SNPs in the region of MC1R and TYR (both pigmentation genes). Further candidate gene
studies focused on other loci associated with pigmentation. Brown et al.3 showed evidence for a melanoma locus on chromosome 20 in the vicinity of the
pigmentation gene ASIP. The nevus loci were identified in genome-‐wide studies of melanoma or nevi4,5. Data provided in this Table are taken from
examination of the cumulative evidence from all cases and controls genotyped in the genome-‐wide component of this analysis. The TERT/CLPTM1L locus
was identified as being associated with a number of cancers and was shown to be associated with melanoma risk in a candidate SNP analysis6,7. Further
details of these results are in the text.
Chromosomal region Candidate Gene SNP/variant
Minor allele MAF
Per allele OR for melanoma in this study (95% CI) p
Reference Numbers Melanoma-‐associated phenotype
5p15.33 TERT/CLPTM1L rs401681 A 0.46 1.20 (1.12, 1.28) 2.98 x 10-‐8 5 None known 5p13.2 SLC45A2 rs35390 C 0.02 0.36 (0.23, 0.53) 2.38 x 10-‐7 6, 7 Pigmentation (black/blond Hair)
6p25-‐p23 IRF4 rs12203592 A 0.19 0.94 (0.84, 1.06) 0.32 10 Pigmentation (darker skin) and nevus count
rs872071 A 0.5 1.07 (1.00, 1.14) 0.04 10 9p21 CDKN2A/MTAP rs7023329 G 0.49 0.83 (0.78, 0.88) 7.35 x 10-‐9 1, 11 Nevus count
11q14-‐q21 TYR rs1393350 A 0.28 1.30 (1.21, 1.39) 1.77 x 10-‐13 1 Pigmentation (blond hair) & tanning response
16q24.3 MC1R rs258322 A 0.11 1.70 (1.54, 1.87) 2.70 x 10-‐27 1 Pigmentation (red hair) & sun sensitivity 20q11.2-‐q12 ASIP rs17305657 A 0.1 1.29 (1.11, 1.49) 0.00068 13 Pigmentation (red hair and fair skin)
rs2284378 G 0.33 1.21 (1.13, 1.29) 1.18 x 10-‐7 rs4911414 C 0.34 1.20 (1.12, 1.28) 1.62 x 10-‐7 8, 14
rs1015362 G 0.27 1.03 (0.96, 1.11) 0.40 8, 14
rs4911442 A 0.14 1.29 (1.14, 1.46) 0.000086 13 22q13.1 PLA2G6 rs6001027 G 0.35 0.85 (0.79, 0.91) 2.23 x10-‐6 1, 11 Nevus count
Nature Genetics: doi:10.1038/ng.959

7
Supplementary Table 3:
Detailed results from this study for the 7 regions targeted for replication, listing each SNP under consideration, their position and minor allele frequency
(MAF); the per-‐allele OR and p-‐value are given for the genome-‐wide study presented here and for the replication datasets. For each part of the study results
based only on genotype data are in bold, while those including any imputed data are in plain font. The Houston samples were genotyped on the Illumina
OMNI array, so any SNP not on this array is entirely imputed. The Australian samples were genotyped on one of two arrays so all SNPs are genotyped on
some samples and imputed in others: here the genotyped column includes only those samples that were genotyped for the SNP, while the imputed column
includes all genotyped and imputed samples. For SNPs with positive support from the GWA replication data further genotyping was conducted in samples
from the UK and Netherlands. Results are shown for the stratified analysis of the combined samples from the UK and Netherlands. Results of the fixed
effects meta-‐analysis of the combined replication samples and the combined genome-‐wide and replication analyses are given for both genotyped data only
and for genotyped and imputed data combined. Finally the results of the random effects meta-‐analysis and heterogeneity statistics are given for the
combined genome-‐wide and replication analyses.
Hypothesis Generating Replicating datasets
SNPChromo
some CoordinateMinor allele
MAF OR p OR p OR p OR p OR p OR and 95% CI P-value OR and 95% CI P-value OR and 95% CI P-value OR and 95% CI P-value OR and 95% CI P-value I2 (%)
Cochran's Q P-value
rs10931936 2 201852173 A 0.3 1.19 1.35E-06 1.10 0.112 1.14 0.018 1.09 0.036 1.21 0.005 1.17 (1.08, 1.28) 2.8E-04 1.12 (1.05, 1.19) 2.7E-04 1.18 (1.12, 1.25) 1.6E-09 1.15 (1.10, 1.20) 3.3E-09 1.15 (1.09, 1.21) 2.7E-08 8.5 0.35rs1035142 2 201861323 A 0.38 1.18 4.25E-07 1.12 0.043 1.04 0.614 1.07 0.076 1.16 0.0029 1.13 (1.05, 1.20) 5.7E-05 1.11 (1.05, 1.17) 1.3E-04 - - 1.14 (1.09, 1.19) 5.4E-10 1.14 (1.09, 1.19) 6.5E-08 19.3 0.29rs700635 2 201861470 G 0.28 1.19 1.26E-06 1.11 0.095 1.01 0.876 1.09 0.035 1.22 0.003 1.11 (1.00, 1.23) 5.2E-02 1.12 (1.06, 1.20) 1.9E-04 - - 1.15 (1.10, 1.21) 2.4E-09 1.15 (1.10, 1.21) 1.8E-08 8.0 0.50rs13016963 2 201871056 A 0.37 1.18 5.68E-07 1.129 0.035 1.11 0.045 1.07 0.077 1.17 0.0019 1.14 (1.06, 1.23) 2.8E-04 1.11 (1.06, 1.18) 9.2E-05 1.16 (1.11, 1.22) 1.3E-09 1.14 (1.09, 1.19) 8.6E-10 1.14 (1.09, 1.19) 6.8E-08 18.7 0.30rs10932444 2 213292933 C 0.23 1.17 5.19E-05 1.05 0.479 1.02 0.628 1.01 0.780 - - - - - - - - - - - - -rs11604821 11 69061318 G 0.36 1.17 4.23E-06 1.130 0.036 1.04 0.478 1.03 0.424 1.06 0.264 1.05 (0.98, 1.13) 1.9E-01 1.06 (1.01, 1.13) 2.9E-02 1.11 (1.06, 1.17) 2.0E-05 1.10 (1.06, 1.15) 3.8E-06 1.10 (1.03, 1.17) 3.1E-03 50.7 0.11rs1485993 11 69071595 A 0.37 1.19 4.15E-07 1.096 0.106 1.07 0.188 1.05 0.243 1.08 0.143 1.08 (1.00, 1.16) 4.9E-02 1.07 (1.01, 1.13) 1.7E-02 1.13 (1.08, 1.19) 5.0E-07 1.12 (1.07, 1.16) 4.6E-07 1.11 (1.04, 1.18) 1.2E-03 48.9 0.12rs497356 11 69076356 A 0.37 1.19 3.84E-07 1.09 0.149 0.95 0.540 1.05 0.241 - - - - - - - - - - - - -rs11263498 11 69091948 T 0.37 1.19 3.24E-07 1.08 0.171 1.03 0.692 1.06 0.192 1.10 0.076 1.08 (1.01, 1.15) 2.8E-02 1.08 (1.02, 1.14) 1.1E-02 - - 1.12 (1.07, 1.17) 1.7E-07 1.11 (1.05, 1.18) 4.6E-04 45.0 0.14rs1801516 11 107680672 A 0.13 0.79 4.80E-07 0.81 0.010 0.88 0.019 0.87 0.014 0.92 0.236 0.88 (0.81, 0.94) 4.9E-04 0.87 (0.81, 0.94) 3.4E-04 0.84 (0.79, 0.91) 4.7E-06 0.84 (0.79, 0.89) 3.4E-09 0.84 (0.78, 0.90) 1.7E-06 28.3 0.24rs7139314 12 109408254 A 0.10 1.24 5.76E-05 1.01 0.960 1.03 0.635 1.03 0.680 - - - - - - - - - - - - -rs9515125 13 109346424 G 0.46 0.81 4.85E-06 0.94 0.282 1.01 0.894 1.00 0.938 - - - - - - - - - - - - -rs45430 21 41667951 G 0.39 0.85 5.60E-07 0.91 0.091 0.90 0.008 0.91 0.013 0.91 0.064 0.91 (0.86, 0.96) 2.4E-04 0.91 (0.86, 0.96) 4.2E-04 0.88 (0.85, 0.92) 1.5E-09 0.88 (0.85, 0.92) 2.9E-09 0.88 (0.85, 0.92) 2.9E-09 0.0 0.41
GenoMELAustralia
(genotyped)
Australia (genotyped
and imputed) PC corr
MDA, Houston Heterogeneity
UK and Netherlands
Replication samples (genotyped)
Replication samples (genotyped + imputed)
Genome-wide plus Replication samples
(genotyped)
Genomel-wide plus replication samples
(genotyped + imputed) Random Effects
Genomel-wide plus replication samples
(genotyped + imputed)
Nature Genetics: doi:10.1038/ng.959

8
Supplementary Note
Samples
The data analysed here consist of a combination of Phase 1 (previously published 2) and Phase 2 of a GWA
study of melanoma cases and controls, contributed by GenoMEL participating groups. Groups were asked
to prioritise samples from melanoma cases with a family history (but confirmed as not having a germline
CDKN2A mutation), multiple primaries or onset before age 40 years in order to “enrich” the case series
for genetic susceptibility, thereby increasing power to identify germline variation affecting risk 8. Family
history was restricted to 3 cases within the family to reduce the risk of including individuals with a high-‐
penetrance mutation. Furthermore, persons with germline CDKN2A mutations were excluded
independently of their family history. Controls were recruited from the same populations as the cases by
the same research groups.
Genotyping was conducted in two phases. The Phase 1 genotyping of GenoMEL samples was conducted
through ServiceXS in Leiden, The Netherlands, using the Illumina HumanHap300 BeadChip version 2 duo
array (with 317k tagging SNPs), with the exception of the French samples (cases genotyped by Centre
National de Génotypage (CNG) in Paris using the Illumina Humancnv370k array and controls genotyped
by CNG on the Illumina HumanHap300 Beadchip version 2). Similarly, the majority of the GenoMEL Phase
2 samples were genotyped by ServiceXS on the Illumina 610k array, with the exception once more of the
French controls (genotyped by CNG on the Illumina 610k array). Both Phases 1 and 2 were supplemented
by UK controls from the WTCCC9; these were genotyped on the Illumina HumanHap 1.2 million array, but
any SNPs not on the 610k array were discarded. 1,333 controls from the WTCCC (1958 cohort) were used
in Phase 1, leaving 4,249 WTCCC controls (1958 cohort and blood donors) for inclusion in Phase 2. Given
that we had far more UK controls than cases in which to replicate any GWA findings (see below) we
excluded some of the WTCCC controls to supplement the replication series. We already held DNA on
1,344 of the WTCCC blood donor controls (allowing us to genotype SNPs not on any array), and power
calculations indicated that this split in data was close to optimal. Thus we used 2,905 WTCCC controls
(1,512 from the 1958 cohort and 1,393 blood donors) in Phase 2, retaining 1,344 blood donors for
replication.
We defined the research groups by their geographical locations, but to enhance power identified regions
within which the data from individual groups could be pooled. These regions were: Scandinavia (Lund,
Stockholm and Norway), Italy (Genoa and Emilia-‐Romagna), UK/Netherlands (Leeds, Leiden and
Glasgow), France, Spain, Israel and Poland. The Australian samples previously included in Phase 12 were
excluded from this analysis, as many of them are used in the Australian replication GWA set.
Nature Genetics: doi:10.1038/ng.959

9
Quality Control (QC) Methods
Genotypes were called using the proprietary software supplied by Illumina (BeadStudio, version 3.2),
with imported cluster centers based on HapMap samples (supplied by Illumina) and call threshold set at
0.15 as recommended by Illumina. Some problems with poor chip quality were identified, and where
possible samples with low (<97%) call rates were re-‐genotyped.
Sample exclusions
Samples were excluded for any of the following reasons: (a) a call rate of less than 97% (of the total
number of SNPs on the chip); (b) evidence of non-‐European origin from PCA (see PCA and Population
Stratification in Online Methods); (c) sex as ascertained by genotyping not matching reported sex; (d)
evidence of first degree relationship or identity with another sample in either Phase 1 or 2; (e)
recommendation to be excluded by the WTCCC. Sex was investigated by calculating the heterozygosity
rate on the X-‐chromosome markers within Beadstudio; persons with > 10% heterozygosity were
classified as female. Relationship analysis was carried out in PLINK10 using estimated identity-‐by-‐descent
sharing: when two persons were at least as related as first degree relatives, one of the samples was
excluded.
SNP QC
SNPs may be poorly genotyped on one platform but not on another. Similarly SNPs may be poorly
genotyped as a result of sample handling. Thus we applied QC to SNPs within each platform and
genotyping center, giving five sets of data:
(i) GenoMEL samples genotyped by ServiceXS on the Illumina 317k array, (ii) GenoMEL samples
genotyped by ServiceXS on the Illumina 610k array, (iii) French controls genotyped by CNG on the
Illumina 610k array, (iv) French samples genotyped by CNG on the on the Illumina 317k and 370k arrays,
(v) UK controls genotyped by the Wellcome Trust Sanger Institute on the Illumina 1.2M array. Within
each of these cohorts we excluded SNPs for one of two reasons: (a) HWE p-‐value<10-‐20 in controls, or (b)
callrate < 97%, or (for the final data set (v) only) (c) recommendation for exclusion by the WTCCC. SNPs
could therefore be excluded from just a subset of our entire sample.
When these data were combined, some SNPs that passed QC but were non-‐polymorphic in one or more of
the datasets differed greatly in frequency across datasets, a feature that seems to have arisen through
genotype software mis-‐specifying the allele for monomorphic SNPs in some centers. Thus, when
combining data we further excluded any SNP that differed in frequency between groups by >0.8. This
resulted in a final analysable dataset of 594,997 SNPs.
When interpreting results we also took into account the concordance of results with neighbouring SNPs
and the minor allele frequency (MAF) of the SNP.
Nature Genetics: doi:10.1038/ng.959

10
QC results
Sample exclusions
Samples were excluded for reasons of either (a) low callrate (431 samples), (b) non-‐European ethnicity
(131 samples), (c) genotyped sex not matching recorded sex (27 samples), (d) relatedness to another
sample (66 samples) or (e) recommendation for exclusion by WTCCC (349 samples). This resulted in the
exclusion of 330 (6.9%) GenoMEL samples, 314 (11.4%) samples genotyped at CNG and 360 (8.5%)
WTCCC samples.
SNP QC
SNPs were excluded as follows: (i) GenoMEL 317k samples (7,176 SNPs excluded -‐ 2.3%), (ii) GenoMEL
610k samples (38,063 SNPs excluded -‐ 6.1%), (iii) French 610k controls (49,489 SNPs excluded -‐ 8.0%),
(iv) French 370k samples (51,349 SNPs excluded -‐ 13.9%), (v) WTCCC NBS samples (27,052 SNPs
excluded -‐ 4.5%) and (vi) WTCCC 1958 cohort samples (28,563 SNPs excluded -‐ 4.7%). A further 931
SNPs were excluded because they varied greatly in frequency between cohorts (see above).
For the key SNPs in the four loci showing some evidence of replication we examined the cluster plots
from BeadStudio separately for the Phase 1 GenoMEL data (317k array) and Phase2 data (610k array),
showing clearly defined clusters. In addition approximately 1000 samples from the GWA analysis were
also genotyped using Taqman (as for the replication genotyping). The genotyping showed good
concordance: RS13016963 100% agreement from 1004 samples, RS1485993 one sample discordant
from 982, RS1801516 100% agreement from 1002, RS45430 5 samples discordant from 940.
Quantile-‐quantile plot and adjusted analyses
We produced quantile-‐quantile plots, using the results of the trend test. Estimates of over-‐dispersion
were λ=1.48 for the unstratified analysis, dropping to λ=1.27 when we exclude the Israeli samples. Our
final analysis, stratifying by geographic region gives λ=1.06. These results suggest that there was some
stratification in our sample but that this is adequately corrected for by incorporating regional
information. Further adjustment, for finer scale geographic region or by including principal components
brings no improvement in λ.
For the key SNPs in loci showing some evidence of replication the following p-‐values were attained when
performing i) a trend test stratified by region and phase: rs13016963 5.1 x 10-‐7, rs45430 5.5 x 10-‐7,
rs1801516 4.8 x 10-‐7, rs1485993 4.2 x 10-‐7, ii) a trend test stratified by region excluding Polish and Israeli
samples: rs13016963 1.3 x 10-‐5, rs45430 1.7 x 10-‐6, rs1801516 3.8 x 10-‐7, rs1485993 1.4 x 10-‐6, iii) a
logistic regression adjusted for region and the first four PCs: rs13016963 3.4 x 10-‐6, rs45430 1.9 x 10-‐7,
rs1801516 6.0 x 10-‐7, rs1485993 3.4 x 10-‐7.
Nature Genetics: doi:10.1038/ng.959
11
Details of Supplementary Table 2
Supplementary Table 2 shows the evidence for previously identified melanoma loci as found in this study.
The SNPs reported for each locus are either those which were identified in the original study or the
strongest hits in this study.
Phase 1 of this study2 reported genome-‐wide significance for three of these loci (CDKN2A/MTAP, TYR and
MC1R). About half of the samples used in our current study come from Phase 1 (see Supplementary Table
1)
The SNP rs401681 which is in the 5’ region of TERT and close to CLPTM1L was reported by Rafnar et al.6;
estimated effect sizes from that study are similar to those found here.
SLC45A2 has been examined by a number of groups; the only SNPs on the Illumina 610k array which have
also been examined previously are: rs2672211,12 (p=0.0003 for this study), rs3540113 (p=0.13) and
rs3541413 (p=0.06).
IRF4 is a known pigmentation gene14. The two SNPs listed have both been reported as being associated
with melanoma, although the effect of IRF4 on melanoma risk may be site-‐specific, with the strongest
effect observed for truncal melanoma4. Our results show an effect in the same direction as that previously
observed, but it is weaker and the lack of significance here may thus be due to low power.
The top SNPs for the 9p21 region containing CDKN2A and MTAP were both identified in genome-‐wide
studies of melanoma2 and nevi5; the top SNP for the chromosome 22 region adjacent to PLA2G6 was
identified in the genome-‐wide study of nevi5 and replicated for melanoma2.
The top SNP on chromosome 16 in our previous genome-‐wide study of melanoma, rs2583222, is distant
from MC1R, the pigmentation gene associated with red hair and skin sensitivity to the sun, but analysis of
MC1R variants in the same population showed that the signal from rs258322 is explained by multiple rare
MC1R variants, a number of which were red hair variants 15. Similarly rs1393350, the top SNP on
chromosome 11 in the TYR region, another pigmentation gene, was shown to be explained by a coding
variant of TYR2.
Finally, a genome-‐wide study using pooled DNA samples3, identified a locus on chromosome 20 in the
vicinity of ASIP. The two most significant SNPs here were rs910873 and rs1885120. However, a
haplotype in the vicinity of ASIP involving rs1015362 and rs4911414 were found to be associated with
pigmentation and melanoma risk; these may well be same signal but this remains to be proven13,16.
Nature Genetics: doi:10.1038/ng.959

12
Imputation
Imputation of ungenotyped SNPs was conducted using IMPUTEv217,18, which predicts the genotypes of
unobserved SNPs by means of a hidden Markov model using the genotype data at observed markers and a
set of known haplotypes (in this case European samples from HapMap release 2 (Feb 2009) and the 1000
Genomes pilot data (Mar 2010)). As the method is quite computationally intensive, it was applied only to
those regions in which at least one SNP reached a p-‐value <10-‐5 in the stratified CA trend test. We
imputed 0.5Mb either side of any SNP that reached the required p-‐value, as well as a 250kb buffer either
side to avoid end effects. More stringent QC was applied to genotyped SNPs for this analysis, excluding
any with HWE p-‐value in controls <10-‐4 or MAF<0.03. We assumed an effective population size of 11,400
and analysed the results by applying SNPTEST2 9,17 to the expected genotype counts assuming an additive
mode of inheritance. All four imputed SNPs that were followed up for replication had maximum posterior
probability of at least 0.9 in at least 97% of samples, suggesting they were well-‐imputed. Furthermore
almost 1,000 of the Leeds GenoMEL samples were independently genotyped at three of these four SNPs
(rs1035142, rs11263498 and rs700635).
The most likely imputed genotype and the directly genotyped samples were discrepant in only 0.3% of
comparisons (6/999, 2/971 and 2/997 samples respectively).
Replication
Replication samples
We sought to replicate our findings with two GWA datasets from Australia and Houston and further
samples consisting of case-‐control series from Leeds, Cambridge and the Netherlands, as well as UK
controls from WTCCC:
(i) Australia
926 cases and 3,956 controls were genotyped on the Illumina HumanHap610k array and 1,242 cases and
431 controls genotyped on the Illumina Human1M-‐OMNI array as part of a separate GWA study of
melanoma (19). Data were analysed by regressing case-‐control status on genotype (coded according to an
additive model) adjusting for the first 10 PCs. Imputed SNPs were estimated using MACH220,21.
(ii) Houston
1,804 cases and 1,026 controls were genotyped on the Illumina Human1M-‐OMNI array. Data were
analysed by regressing case-‐control status on genotype (coded according to an additive model) adjusting
Nature Genetics: doi:10.1038/ng.959

13
for the first 2 PCs (Amos et al., in preparation). SNPs not included on the arrays were imputed using
MACH 20,21.
(iii) Leeds case-‐control study
The Leeds-‐based case-‐control study recruited 1,897 population-‐based incident melanoma cases
diagnosed between September 2000 and December 2006 from a geographically defined area of Yorkshire
and the Northern region of the UK (63% response rate)2,5,22,23. Cases were identified by clinicians,
pathology registers and via the Northern and Yorkshire Cancer Registry and Information Service to
ensure overall ascertainment. For all but 18 months of the study period, recruitment was restricted to
patients with Breslow thickness of at least 0.75mm. Controls were ascertained by contacting general
practitioners to identify eligible individuals. These controls were frequency-‐matched with cases for age
and sex from general practitioners who had also had cases as part of their patient register. Overall there
was a 55% response rate for controls (513 subjects).
The first 960 of the cases recruited and all controls were examined by trained interviewers who
performed a standardised examination of the skin, recording nevi by anatomical site and size.
647 of the cases and 413 of the controls from this study were genotyped genome-‐wide in either Phase 1
(with the 317k array) or Phase 2 (the 610k array). The 937 cases who were not genotyped genome-‐wide
were genotyped in the replication phase of this study, as were 100 controls.
(iv) Cambridge case-‐control study
383 cases and 378 controls recruited by the University of Cambridge were genotyped in the replication
series. The cases and controls were recruited as part of the SEARCH study24,25, an ongoing population-‐
based study in Eastern England. Cases were ascertained through the Eastern Cancer Registry and
Information Centre, and were aged between 18 and 70 years at diagnosis. Controls were drawn from
SEARCH and EPIC-‐Norfolk. Details of these studies have been previously published24,25.
(v) Replication samples from Leiden, Netherlands
The Dutch case-‐control cohort consists of in total 259 consented melanoma patients and 214 friend or
spouse controls. The cohort was recruited in several hospitals in the Netherlands for which local ethical
approval was obtained.
(vi) WTCCC UK Blood Service Control Group
1,344 controls from the UK Blood Service Control Group genotyped as part of the WTCCC9 were also
included in the replication series.
Nature Genetics: doi:10.1038/ng.959

14
Replication Genotyping
The Leeds, Cambridge and Leiden samples in the replication phase of this study were genotyped for SNPs
of interest using Taqman SNP genotyping assays (Applied Biosystems, Foster City, USA). The SNPs
rs10931936, rs1035142, rs700635, rs13016963 (CASP8); rs11604821, rs1485993, rs11263498
(CCND1); rs1801516 (ATM); and rs45430 (MX2) were genotyped using the Taqman assays
C___2960444_10, C___8823871_10, C___8823870_1_, C__30787149_10, C___3033904_10, C___8762595_10,
C___3033901_10, C__26487857_10, and C___2564407_10 respectively (Applied Biosystems). 2ul PCR
reactions were performed in 384 well plates using 10ng of DNA (dried), using 0.05 ul assay mix and 1ul
Universal Master Mix (Applied Biosystems) according to the manufacturers’ instructions. End point
reading of the genotypes was performed using an ABI 7900HT Real-‐time PCR system (Applied
Biosystems).WTCCC samples were genotyped on the Illumina Human1M-‐OMNI array and, where the SNP
was not present on this array, by direct genotyping as above.
Replication Analysis
For each region, the SNP chosen as the primary SNP for replication was the most significant genotyped
SNP that is on both the Illumina Human1M-‐OMNI array and the HumanHap610 array (as replication
samples were genotyped on both arrays). If no such SNP existed in the region with p<10-‐4, the two most
significant genotyped SNPs were followed up, as were the two most significant imputed SNPs on the
Human1M-‐OMNI array. All SNPs chosen for replication were investigated in the two GWA datsets. Those
showing evidence of replication were further genotyped in the case-‐control datasets from the UK and
Netherlands. The UK and Netherlands data were analysed by regressing case-‐control status on genotype
(coded according to an additive model) combining the UK cases and controls (Leeds and Cambridge cases,
Leeds, Cambridge and WTCCC controls) into one “UK” series and performing a stratified analysis with the
Leiden case-‐control samples. As an additional QC measure we checked that there were no significant
differences in frequency for any of the 9 SNPs followed up for replication, between genotyping centers
within the same country (UK and France). For the 18 tests, the lowest p-‐value was 0.03 and frequencies
never differed between genotyping centers by more than 0.04, suggesting little difference between either
the samples or the genotyping quality at the different centers for these SNPs.
CCND1 locus
The CCND1 locus on chromosome 11 showed some evidence of replication (replication OR=1.07 (1.01,
1.13), p=0.017 for rs1485993, the most-‐strongly associated genotyped SNP from the GWA study, Table 1),
although this was not significant after adjusting for multiple testing. We have used imputation to examine
the evidence for association in the region in the GenoMEL GWA data (Supplementary Figure 4). The
associated SNPs are in a region of low LD, and genotyped or imputed SNPs showing association at p<10-‐5
are within a 55kb region within the CCND1 gene. The estimated effects show no evidence of heterogeneity
by region, with all centers in the genome-‐wide and replication samples apart from Scandinavia showing a
Nature Genetics: doi:10.1038/ng.959

15
per-‐allele OR above 1 (Figure S4). From analysis of the Leeds case-‐control study, there is no evidence of
an effect of this SNP on either nevus count (0.01% of variance explained, p=0.83) or pigmentation
phenotype (0.02% of variance explained, p=0.55). A genome-‐wide study of hair-‐color found a replicable
hit in the region of CCND1 with rs3750965, although this is about 500kb away and shows no significance
in our study26. More interestingly a genome-‐wide study of breast cancer found a hit (rs614367) within
60kb of our top hit which is nominally significant in our study (p=0.017)27.
Power of the GWA study
With the current sample size of the GWA discovery study, the power is good (>80%) to detect a SNP with
a genotype relative risk (GRR) above 1.3 and MAF>0.08 or GRR>1.2 and MAF>0.2 at a significance level of
10-‐5, while power to detect a GRR of 1.1 is never greater than 12%. For the four new regions of interest,
using effect size estimates from the genome-‐wide data, powers are 86%, 79%, 73%, and 91% for CASP8,
ATM, MX2 and CCND1 respectively. However, if instead we use the estimates of effect size from the
replication studies, powers are 17%, 7%, 9% and 1% for CASP8, ATM, MX2 and CCND1 respectively. The
estimates from the GWA study are subject to the expected inflation in effect sizes caused by the so-‐called
‘winner’s curse’ 28; the estimates from the replication studies are not subject to this bias. It should also be
noted that none of the estimates are derived from a representative set of incident cases, whereas
GenoMEL cases are genetically enriched, which may also increase the effect size. The low power to detect
a GRR of 1.1 suggests that there may be many other genetic regions with a similar effect on melanoma
risk, which we are currently underpowered to detect.
The power to reach a genome-‐wide significance level of 5x10-‐8 using the combined discovery and
replication data is 80% for a SNP with an OR of 1.2, but for an OR of 1.1 the maximum power attainable is
0.41 (when MAF=0.5); for an OR of 1.07 the maximum power possible is 0.04 (when MAF=0.5)
Nature Genetics: doi:10.1038/ng.959

16
GenoMEL Collaboration
Australian Melanoma Family Study: Graham J. Mann, John L. Hopper, Joanne F. Aitken, Bruce K.
Armstrong, Graham G. Giles, Richard F. Kefford, Anne Cust, Mark Jenkins, Helen Schmid.
Barcelona: The participants of GenoMEL in Barcelona: Paula Aguilera, Celia Badenas, Cristina Carrera,
Francisco Cuellar, Daniel Gabriel, Estefania Martinez, Melinda Gonzalez, Pablo Iglesias, Josep Malvehy,
Rosa Marti-‐Laborda, Montse Mila, Zighe Ogbah, Joan-‐Anton Puig Butille, Susana Puig and Other members
of the Melanoma Unit: Llúcia Alós, Ana Arance, Pedro Arguís, Antonio Campo, Teresa Castel, Carlos Conill,
Jose Palou, Ramon Rull, Marcelo Sánchez, Sergi Vidal-‐Sicart, Antonio Vilalta, Ramon Vilella.
Brisbane: The Queensland study of Melanoma: Environmental and Genetic Associations (Q-‐MEGA)
Principal Investigators are: Nicholas G. Martin, Grant W. Montgomery, David Duffy, David Whiteman,
Stuart MacGregor, Nicholas K. Hayward. The Australian Cancer Study (ACS) Principal Investigators
are: David Whiteman, Penny Webb, Adele Green, Peter Parsons, David Purdie, Nicholas Hayward.
Emilia-‐Romagna: Maria Teresa Landi, Donato Calista, Giorgio Landi, Paola Minghetti, Fabio Arcangeli,
Pier Alberto Bertazzi
Genoa: Department of Internal Medicine (DIMI), University of Genoa: Giovanna Bianchi-‐Scarra, Paola
Ghiorzo, Lorenza Pastorino, William Bruno, Linda Battistuzzi, Sara Gargiulo, Sabina Nasti, Sara Gliori,
Paola Origone, Virginia Andreotti; Medical Oncology Unit, National Institute for Cancer Research: Paola
Queirolo.
Glasgow: Rona Mackie, Julie Lang
Leeds: Julia A Newton Bishop, Paul Affleck, Jennifer H Barrett, D Timothy Bishop, Jane Harrison, Mark M
Iles, Juliette Randerson-‐Moor, Mark Harland, John C Taylor, Linda Whittaker, Kairen Kukalizch, Susan
Leake, Birute Karpavicius, Sue Haynes, Tricia Mack, May Chan, Yvonne Taylor, John Davies, Paul King.
Leiden: Department of Dermatology, Leiden University Medical Centre: Nelleke A Gruis, Frans A van
Nieuwpoort, Coby Out, Clasine van der Drift, Wilma Bergman, Nicole Kukutsch, Jan Nico Bouwes Bavinck.
Department of Clinical Genetics, Centre of Human and Clinical Genetics, Leiden University Medical Centre:
Bert Bakker, Nienke van der Stoep, Jeanet ter Huurne. Department of Dermatology, HAGA Hospital, The
Hague: Han van der Rhee. Department of Dermatology, Reinier de Graaf Groep, Delft: Marcel Bekkenk.
Department of Dermatology, Sint Franciscus Gasthuis, Rotterdam: Dyon Snels, Marinus van Praag.
Department of Dermatology, Ghent University Hospital, Ghent, Belgium: Lieve Brochez & colleagues.
Department of Dermatology, St. Radboud University Medical Centre, Nijmegen: Rianne Gerritsen &
colleagues. Department of Dermatology, Rijnland Hospital, Leiderdorp: Marianne Crijns & colleagues.
Dutch patient organisation, Stichting Melanoom, Purmerend. The Netherlands Foundation for the
detection of Hereditary Tumors, Leiden: Hans Vasen.
Nature Genetics: doi:10.1038/ng.959

17
Lund: Lund Melanoma Study Group: Håkan Olsson, Christian Ingvar, Göran Jönsson, Åke Borg, Anna
Måsbäck, Lotta Lundgren, Katja Baeckenhorn, Kari Nielsen, Anita Schmidt Casslén.
Norway: Oslo University Hospital: Per Helsing, Per Arne Andresen, Helge Rootwelt. University of
Bergen: Lars A. Akslen, Anders Molven.
Paris: Marie-‐Françoise Avril, Brigitte Bressac-‐de Paillerets, Valérie Chaudru, Nicolas Chateigner , Eve
Corda, Patricia Jeannin, Fabienne Lesueur, Mahaut de Lichy, Eve Maubec, Hamida Mohamdi, Florence
Demenais and the French Family Study Group including the following Oncogeneticists and
Dermatologists: Pascale Andry-‐Benzaquen, Bertrand Bachollet, Frédéric Bérard, Pascaline Berthet,
Françoise Boitier, Valérie Bonadona, Jean-‐Louis Bonafé, Jean-‐Marie Bonnetblanc, Frédéric Cambazard,
Olivier Caron, Frédéric Caux, Jacqueline Chevrant-‐Breton, Agnès Chompret (deceased), Stéphane Dalle,
Liliane Demange, Olivier Dereure, Martin-‐Xavier Doré, Marie-‐Sylvie Doutre, Catherine Dugast, Laurence
Faivre, Florent Grange, Philippe Humbert, Pascal Joly, Delphine Kerob, Christine Lasset, Marie Thérèse
Leccia, Gilbert Lenoir, Dominique Leroux, Julien Levang, Dan Lipsker, Sandrine Mansard, Ludovic Martin,
Tanguy Martin-‐Denavit, Christine Mateus, Jean-‐Loïc Michel, Patrice Morel, Laurence Olivier-‐Faivre, Jean-‐
Luc Perrot, Caroline Robert, Sandra Ronger-‐Savle, Bruno Sassolas, Pierre Souteyrand, Dominique Stoppa-‐
Lyonnet, Luc Thomas, Pierre Vabres, Eva Wierzbicka.
Philadelphia: David Elder, Peter Kanetsky, Jillian Knorr, Michael Ming, Nandita Mitra, Althea Ruffin,
Patricia Van Belle
Poland: Tadeusz Dębniak, Jan Lubiński, Aneta Mirecka, Sławomir Ertmański
Slovenia: Srdjan Novakovic, Marko Hocevar, Barbara Peric, Petra Cerkovnik
Stockholm: Veronica Höiom, Johan Hansson
Sydney: Graham J. Mann, Richard F. Kefford, Helen Schmid, Elizabeth A. Holland.
Tel Aviv: Esther Azizi, Gilli Galore-‐Haskel, Eitan Friedman, Orna Baron-‐Epel, Alon Scope, Felix Pavlotsky,
Emanuel Yakobson, Irit Cohen-‐Manheim, Yael Laitman, Roni Milgrom, Iris Shimoni, Evgeniya Kozlovaa
See also: www.genomel.org
Other Collaboration
Cambridge: Alison Dunning, Doug Easton, Liz Margerison, Karen Pooley, Phillip Smith.
Nature Genetics: doi:10.1038/ng.959

18
References
1. Barrett, J.C., Fry, B., Maller, J. & Daly, M.J. Haploview: analysis and visualization of LD and haplotype maps. Bioinformatics 21, 263-‐5 (2005).
2. Bishop, D.T. et al. Genome-‐wide association study identifies three loci associated with melanoma risk. Nat Genet 41, 920-‐5 (2009).
3. Brown, K.M. et al. Common sequence variants on 20q11.22 confer melanoma susceptibility. Nat Genet 40, 838-‐40 (2008).
4. Duffy, D.L. et al. IRF4 variants have age-‐specific effects on nevus count and predispose to melanoma. Am J Hum Genet 87, 6-‐16 (2010).
5. Falchi, M. et al. Genome-‐wide association study identifies variants at 9p21 and 22q13 associated with development of cutaneous nevi. Nat Genet 41, 915-‐9 (2009).
6. Rafnar, T. et al. Sequence variants at the TERT-‐CLPTM1L locus associate with many cancer types. Nat Genet 41, 221-‐7 (2009).
7. Turnbull, C. et al. Variants near DMRT1, TERT and ATF7IP are associated with testicular germ cell cancer. Nature Genetics 42, 604-‐U178 (2010).
8. Antoniou, A.C. & Easton, D.F. Polygenic inheritance of breast cancer: Implications for design of association studies. Genet Epidemiol 25, 190-‐202 (2003).
9. WTCCC. Genome-‐wide association study of 14,000 cases of seven common diseases and 3,000 shared controls. Nature 447, 661-‐78 (2007).
10. Purcell, S. et al. PLINK: a tool set for whole-‐genome association and population-‐based linkage analyses. Am J Hum Genet 81, 559-‐75 (2007).
11. Guedj, M. et al. Variants of the MATP/SLC45A2 gene are protective for melanoma in the French population. Hum Mutat 29, 1154-‐60 (2008).
12. Fernandez, L.P. et al. SLC45A2: a novel malignant melanoma-‐associated gene. Hum Mutat 29, 1161-‐7 (2008).
13. Nan, H., Kraft, P., Hunter, D.J. & Han, J. Genetic variants in pigmentation genes, pigmentary phenotypes, and risk of skin cancer in Caucasians. Int J Cancer 125, 909-‐17 (2009).
14. Sturm, R.A. Molecular genetics of human pigmentation diversity. Hum Mol Genet 18, R9-‐17 (2009).
15. Demenais, F. et al. Importance of sequencing rare variants after a genome-‐wide association study (GWAS): the MC1R gene, 16q24 region and melanoma story. in American Society of Human Genetics (2009).
16. Gudbjartsson, D.F. et al. ASIP and TYR pigmentation variants associate with cutaneous melanoma and basal cell carcinoma. Nat Genet 40, 886-‐91 (2008).
17. Marchini, J., Howie, B., Myers, S., McVean, G. & Donnelly, P. A new multipoint method for genome-‐wide association studies by imputation of genotypes. Nat Genet 39, 906-‐13 (2007).
18. Howie, B.N., Donnelly, P. & Marchini, J. A flexible and accurate genotype imputation method for the next generation of genome-‐wide association studies. PLoS Genet 5, e1000529 (2009).
19. Macgregor, S. et al. Genome-‐wide association study identifies a new melanoma susceptibility locus at 1q21.3. Nature Genetics In Press(2011).
20. Li, Y., Willer, C., Sanna, S. & Abecasis, G. Genotype imputation. Annu Rev Genomics Hum Genet 10, 387-‐406 (2009).
21. Li, Y., Willer, C.J., Ding, J., Scheet, P. & Abecasis, G.R. MaCH: using sequence and genotype data to estimate haplotypes and unobserved genotypes. Genet Epidemiol 34, 816-‐34 (2010).
22. Newton-‐Bishop, J.A. et al. Relationship between sun exposure and melanoma risk for tumours in different body sites in a large case-‐control study in a temperate climate. Eur J Cancer (2010).
23. Newton-‐Bishop, J.A. et al. Melanocytic nevi, nevus genes, and melanoma risk in a large case-‐control study in the United Kingdom. Cancer Epidemiol Biomarkers Prev 19, 2043-‐54 (2010).
24. Pooley, K.A. et al. Common single-‐nucleotide polymorphisms in DNA double-‐strand break repair genes and breast cancer risk. Cancer Epidemiol Biomarkers Prev 17, 3482-‐9 (2008).
Nature Genetics: doi:10.1038/ng.959

19
25. Pooley, K.A. et al. No association between TERT-‐CLPTM1L single nucleotide polymorphism rs401681 and mean telomere length or cancer risk. Cancer Epidemiol Biomarkers Prev 19, 1862-‐5 (2010).
26. Eriksson, N. et al. Web-‐based, participant-‐driven studies yield novel genetic associations for common traits. PLoS Genet 6, e1000993 (2010).
27. Turnbull, C. et al. Genome-‐wide association study identifies five new breast cancer susceptibility loci. Nat Genet 42, 504-‐7 (2010).
28. Lohmueller, K.E., Pearce, C.L., Pike, M., Lander, E.S. & Hirschhorn, J.N. Meta-‐analysis of genetic association studies supports a contribution of common variants to susceptibility to common disease. Nat Genet 33, 177-‐82 (2003).
Nature Genetics: doi:10.1038/ng.959