
Supplement to Centra's 2019/20 General Rate Application
21
Supplement to Centra's 2019/20 General Rate Application Index March 22, 2019 · 1 2 3 4 5 6 7 CENTRA GAS MANITOBA INC. 2019/20 GENERAL RATE APPLICATION SUPPLEMENT TO THE APPLICATION 8 9 INDEX 10 1.0 Overview ................................................................................................................................ 1 11 2.0 2018/19 Updated Financial Outlook ...................................................................................... 3 12 3.0 2019/20 Approved Budget .................................................................................................... 5 13 3.1 2019/20 Interest Rates & Exchange Rates ................................................................. 9 14 3.2 Revenue Requirement ................................................................................................ 9 15 4.0 Cost Allocation and Rate Design ........................................................................................... 10 16 5.0 Customer Bill Impacts ............................................................................................................ 15 17 6.0 Proposed Rate Schedules ....................................................................................................... 19 18 19 Schedules 20 Tab 6 Schedules (Updated) 21 Tab 10 Schedules (Updated) 22 Tab 11 Schedules (Updated) 23 24 Appendices 25 Appendix 3.6 - Gas Operations Projected Financial Statements and Financial Ratios Updated 26 for 2018/19 and 2019/20 27 Appendix 3.7 - Regulatory Deferral Accounts Appendix 3.4 Figures (Updated) 28 Appendix 3.8 - Manitoba Hydro's Forecast of Key Economic and Financial Indicators for 29 2018/19 and 2019/20 (Updated) 30 Appendix 5.8 - Financial Ratios (Updated) 31 Appendix 5.12 - Cost of Service (Updated) 32 Appendix 5.13 - Tab 5 Figures (Updated)
Transcript of Supplement to Centra's 2019/20 General Rate Application

Supplement to Centra's 2019/20 General Rate Application
Index
March 22, 2019 ·
1
2
3
4
5
6
7
CENTRA GAS MANITOBA INC.
2019/20 GENERAL RATE APPLICATION
SUPPLEMENT TO THE APPLICATION
8
9 INDEX
10 1.0 Overview ................................................................................................................................ 1
11 2.0 2018/19 Updated Financial Outlook ...................................................................................... 3
12 3.0 2019/20 Approved Budget .................................................................................................... 5
13 3.1 2019/20 Interest Rates & Exchange Rates ................................................................. 9
14 3.2 Revenue Requirement ................................................................................................ 9
15 4.0 Cost Allocation and Rate Design ........................................................................................... 10
16 5.0 Customer Bill Impacts ............................................................................................................ 15
17 6.0 Proposed Rate Schedules ....................................................................................................... 19
18
19 Schedules
20 Tab 6 Schedules (Updated)
21 Tab 10 Schedules (Updated)
22 Tab 11 Schedules (Updated)
23 24 Appendices
25 Appendix 3.6 - Gas Operations Projected Financial Statements and Financial Ratios Updated
26 for 2018/19 and 2019/20
27 Appendix 3.7 - Regulatory Deferral Accounts Appendix 3.4 Figures (Updated)
28 Appendix 3.8 - Manitoba Hydro's Forecast of Key Economic and Financial Indicators for
29 2018/19 and 2019/20 (Updated)
30 Appendix 5.8 - Financial Ratios (Updated)
31 Appendix 5.12 - Cost of Service (Updated)
32 Appendix 5.13 - Tab 5 Figures (Updated)

Supplement to Centra's 2019/20 General Rate Application Page 2of19
March 22, 2019
33 Appendix 5.14- MHEB Quarterly Report for 3rd Quarter of 2018-19
34 Appendix 7.6 - 2018 Natural Volume Gas Forecast
35 Appendix 10.1- Impact of Regulatory Deferral Accounts on Rate Base (Updated)
36 Appendix 11.1-Timeline - Base Rates and Riders (Updated)
37 Completeness Review Attachment 4- Manitoba Hydro Corporate Performance Dashboard
38 (Updated)
1
2
3
4
5
6 1.0
7
8
9
10
11
12
13
14
15
16
17
18
19
20
21
22
23
24
25
26
27
28
29
30
31
32
OVERVIEW
Supplement to Centra's 2019/20 General Rate Application Page 1of19
March 22, 2019
CENTRA GAS MANITOBA INC.
2019/20 GENERAL RATE APPLICATION
SUPPLEMENT TO THE APPLICATION
This Supplement to Centra Gas Manitoba lnc.'s ("Centra 11) November 30, 2018
General Rate Application ("Application" or "GRA11) provides an update to financial
information following the Manitoba Hydro-Electric Board approval of the 2019/20
budget on February 12, 2019. The CGM18 forecast for 2018/19 and 2019/20
provided in Appendix 3.1 of Centra's Application has been updated to reflect actual
financial results to September 30, 2018 for revenue and cost of gas. The updated
statements for the 2018/19 Current Outlook and 2019/20 Approved Budget are
provided in Appendix 3.6. The supplement also includes changes to select line items
on the operating statement, as well as updated planning assumptions for the:
• 2018 Natural Gas Volume Forecast,
• Preliminary update to planned 2019/20 Demand Side Management
expenditures and activities,
• December 2018 consensus forecast of interest and U.S. exchange rates, and
• Cost of Gas Forecast based on a futures market price strip date of October 1,
2018.
On February 20, 2019, the Public Utilities Board of Manitoba (11PUB 11) issued Order
24/19, establishing a timetable for the review of Centra's Application. Based on this
timetable, Centra recognizes that an August 1, 2019 implementation of rates will no
longer be possible, and as such is hereby amending its Application to request
approval to implement rates flowing from this Application effective November 1,
2019, concurrent with the November 1, 2019 Primary Gas rate change.
The forecast of non-Primary gas costs and balances of the non-Primary PGVA
accounts have not been updated as part of this Supplement. In accordance with the

Supplement to Centra's 2019/20 General Rate Application Page 2of19
March 22, 2019
1 t imetable approved by the PUB in Order 24/19, Centra intends to file a Pre-hearing
2 Update on or before July 24, 2019 providing updated information on actual and
3 forecast gas costs. Centra will provide details of the actual gas costs experienced for
4 the 2017/18 Gas Year, as well as an updated forecast of gas costs for the 2018/19
5 Gas Year. Recognizing that the timetable approved by the PUB in Order 24/19 does
6 not permit an August 2019 implementation, Centra also intends to amend its
7 Application to request approval of the disposition of its non-Primary Gas deferral
8 account balances for the 2018/19 Gas Year through rate riders, with actual
9 information to the end of April and forecast information to October 31, 2019, as well
10 as updated base rates reflecting the forecast of non-Primary Gas costs for the
11 2019/20 Gas Year.
12
13 The updated forecast of non-Primary Gas costs and balances of the non-Primary
14 PGVA accounts for 2018/19 reflected in the Pre-hearing update will also reflect a
15 recent decision issued by the National Energy Board ("NEB"} with respect to the
16 natural gas transportation tolls charged by TransCanada Pipelines Ltd. ("TCPL"} on its
17 Canadian Mainline. On December 13, 2018, the NEB issued a decision directing TCPL
18 to dispose of a $1.1 billion balance refundable to shippers in the Mainline's Long
19 Term Adjustment Account accumulated between January 1, 2015 and December 31,
20 2017. In addition, the NEB ordered TCPL to refund surplus revenue collected from
21 Mainline shippers resulting from the interim tolls charged from January 1, 2018 to
22 January 31, 2019. The resulting lower Mainline tolls will be in effect from February 1,
23 2019 to December 31, 2020, which will result in a net reduction in Centra's
24 transportation costs of approximately $14.1 million over this period.
25
26 As part of this Supplement, Centra is also providing the following information:
27 • Appendix 3.7 - Regulatory Deferral Accounts Appendix 3.4 Figures (Updated};
28 • Appendix 3.8 - Manitoba Hydro's Forecast of Key Economic and Financial
29 Indicators for 2018/19 and 2019/20 (Updated};
30 • Appendix 5.8 - Financial Ratios (Updated};
31 • Appendix 5.12 - Cost of Service (Updated};
32 • Appendix 5.13 -Tab 5 Figures (Updated};
33 • Appendix 5.14 - MHEB Quarterly Report for 3rd Quarter of 2018-19; and,
34 • Appendix 7.6 - 2018 Natural Volume Gas Forecast.

1
2
3
4
5
6
7
8
9
10
11
2.0
Supplement to Centra's 2019/20 General Rate Application Page 3of19
March 22, 2019
• Completeness Review Attachment 4- Manitoba Hydro Corporate Performance
Dashboard {Updated)
2018/19 UPDATED FINANCIAL OUTLOOK
As shown in Figure 1 below, Centra is projecting annual net income of $4.4 million in
the 2018/19 Current Outlook compared to net income of $3.3 million in the 2018/19
CGM18 forecast filed on November 30, 2018. The 2018/19 Current Outlook
incorporates actual financial results to September 30, 2018 for revenue and cost of
gas and an updated volume forecast. In addition, the Current Outlook incorporates
expected changes to other line items on the operating statement.

1
2
3
4
5
6
Supplement to Centra's 2019/20 General Rate Application Page 4of19
March 22, 2019
Figure 1: 2018/19 Current Outlook compared to the 2018/19 CGM18 forecast
For the year ended March 31
REVENUES
Domestic Revenue
Cost of Gas
Non-Gas Costs
Furnace Replacement Program Funding
Late Payment Charges and Broker Revenue
additional reven ue requ irement••
Weighted Average Cost of Gas Sold •
Gross Margin
Other
EXPENSES
Operating and Administrative
Finance Expense
Depreciation and Amortization
Capital and Other Taxes
Other Expenses
Corporate Allocation
Net Income before Net Movement in Regulatory Deferral
Net Movement in Regulatory Deferral •
Net Income
GAS OPERATIONS
PROJECTED OPERATING STATEMENT
(In Thousands of Dollars)
Current
Outlook
193.1 153.1
(3.8) 0.7
343.0
343.0 193.1 150.0
1.8 151.8
63.3 21.5 24.1 16.6 12.1 12.0
149.6
2.2
2.2
4.4
Increase I CGM18 (Decrease)
2019
158.7 34.4 152.2 0.9
(3.8) 0.5 0.1
307.6 35.4
307.6 35.4 158.7 34.4 148.9 1.1
1.7 0.1 150.6 1.2
63.3 21.7 (0.2)
24.1 16.9 (0.3) 12.1 0.1 12.0
150.0 (0.4)
0.6 1.6
2.6 (0.4)
3.3 1.2
•The adjusted gross margin reflects the cost of gas charged to customer through rates (WACOG). The PGVA has been
reclassified to the gross margin from net movement for rate setting purposes.
•• Additional Revenue Requirement
Percent Increase
Cumulative Percent Increase
0.00% 0.00%
0.00% 0.00%
The increase in net income of $1.2 million in the 2018/19 Current Outlook compared
to the 2018/19 CGM18 forecast filed on November 30, 2018 is primarily due to the
higher gross margin as well as, lower capital and other taxes and finance expense.

1
2
3
4
5
6
7
8
9
10
11
12
13
14
15
16
17
18
19
20
21
22
23
24
25
26
27
28
29
30
31
32
33
34
3.0
Supplement to Centra's 2019/20 General Rate Application Page 5of19
March 22, 2019
The increase in gross margin of $1.1 million is primarily a result of favourable
weather impacts to September 2018 as well as a change in the load volume forecast
for the remainder of year. The increase in domestic revenue of $35.4 million is
primarily a result of higher cost of gas of $34.4 million and higher natural gas
volumes. Revenue from non-gas costs increased by $0.9 million primarily on account
of favourable weather impacts and the change in load volume forecast.
The decrease in capital and other taxes of $0.3 million is primarily a result of
decreased property tax due to recent assessments that evaluated Centra properties
at a lower value.
The decrease in finance expense of $0.2 million is primarily due to the growth in the
PGVA balance refundable to customers and therefore less short term debt
requirements.
The increase in other expenses of $0.1 million is primarily a result of increased
consulting fees for tax review partially offset by the reduction in regulatory costs
due to a delay of planned expenditures. The decrease in regulatory costs is offset in
net movement in regulatory deferrals.
2019/20 APPROVED BUDGET
The 2019/20 Approved Budget was prepared and approved by the MHEB for
approval in advance of the PUB issuing Order 24/19 on February 20, 2019. At the
time the updated forecast was prepared, Centra continued to assume an August 1,
2019 implementation of rates flowing from this Application. As such, in the 2019/20
Approved Budget, consistent with the original filing, Centra continues to assume
that the Furnace Replacement Program will generate approximately $0.5 million to
July 31, 2019, as shown in Figure 2 (below) and Appendix 3.3 as originally filed. If
the Furnace Replacement Program were to continue to be funded until October 31,
2019, assuming implementation of rates flowing from this Application on November
1, 2019, this would provide additional funding of approximately $0.4 million. Centra
expects that this additional funding would have a negligible impact on its projected
level of net income in 2019/20.

Supplement to Centra's 2019/20 General Rate Application Page 6of19
March 22, 2019
1 As shown in Figure 2 below, Centra is projecting annual net income of $2.9 million in
2 the 2019/20 Approved Budget compared to net income of $2.3 in the 2019/20
3 CGM18 forecast filed on November 30, 2018. The 2019/20 Approved Budget
4 assumes normal weather and incorporates an updated volume forecast.

1 2
3 4
5
6
Supplement to Centra's 2019/20 General Rate Application Page 7of19
March 22, 2019
Figure 2: 2019/20 Approved Budget compared to the 2019/20 CGM18 forecast
GAS OPERATIONS
PROJECTED OPERATING STATEMENT
(In Thousands of Dollars)
For the year ended March 31
REVENUES
Domestic Revenue
Cost of Gas
Non-Gas Costs *
Furnace Replacement Program Funding
Late Payment Charges and Broker Revenue
additional revenue requirement***
Weighted Average Cost of Gas Sold **
Gross Margin
Other
EXPENSES
Operating and Administrative
Finance Expense
Depreciation and Amortization
Capital and Other Taxes
Other Expenses
Corporate Allocation
Net Income before Net Movement in Regulatory Deferral
Net Movement in Regulatory Deferral **
Net Income
Approved
Budget
173.7 149.1
(0.5) 0.6
322.8
322.8 173.7 149.2
1.7 150.9
61.2 22.6 25.5 17.1 10.7 12.0
149.1
1.8
1.1
2.9
CGM18
2020
158.4 149.6
(O.S) 0.6
308.1
308.1 158.4 149.7
1.7 151.4
61.2 23.5 25.5 17.4 12.8 12.0
152.4
(1.0)
3.3
2.3
*The Non-Gas Costs reflect the proposed discontinuance of FRP funding and removal of associated costs from rates for the SGS class, effective Aug 1, 2019
*' The adjusted gross margin reflects the cost of gas charged to customer through rates (WACOG). The PGVA has been
reclassified to the gross margin from net movement for rate setting purposes.
***Additional Revenue Requirement
Percent Increase
Cumulative Percent Increase
0.00% 0.00%
0.00% 0.00%
Increase I (Decrease)
15.3 (0.5)
14.8
14.8 15.3 (0.5)
(0.5)
(0.9)
(0.3) (2.1)
(3.3)
2.8
(2.3)
0.6
The increase in net income of $0.6 million is primary attributed to a decrease in
finance expense and capital and other taxes partially offset by lower gross margin.
The 2019/20 Approved Budget utilizes the 2018 Natural Gas Volume Forecast.

1
2
3
4
Supplement to Centra's 2019/20 General Rate Application Page 8of19
March 22, 2019
The decrease in finance expense of $0.9 million is primarily is due to $20 million less
in long-term debt issues as a result of the higher PGVA balance refundable to
customers.
5 The decrease of $0.3 million to capital and other taxes is primarily a result of
6 decreased property tax due to recent assessments that evaluated Centra properties
7 at a lower value.
8
9 The decrease in gross margin of $0.5 million is primarily a result of the change in the
10 volume forecast with respect to changes in the number of customers in each class
11 and their associated volumes. The increase in domestic revenue of $14.8 million
12 primarily relates to cost of gas increasing by $15.3 million based on a futures market
13 price strip date of October 1, 2018 (compared to January 12, 2018 forward market
14 strip included in CGM18). As discussed in Section 1.0 above, Centra will update its
15 forecast of non-Primary Gas costs in the Pre-hearing update to be filed in July 2019.
16
17 The decrease in other expenses of $2.1 million reflects lower planned Demand Side
18 Management (DSM) expenditures, largely due to adjustments to existing program
19 forecasts based on updated market information and maintaining a status quo
20 approach to DSM pending the transition to Efficiency Manitoba. The decrease was
21 partially offset by an increase in regulatory costs. These are offset in net movement
22 in regulatory deferral.
23
24
25
26
Centra has updated figures from Tab 5 to reflect the 2018/19 Current Outlook and
2019/20 Approved Budget in Appendix 5.13.
27 The forecast of total natural gas capital expenditures is unchanged from the original
28 application with the exception of DSM expenditures. Capital expenditures related to
29 planned DSM programing are expected to be lower by $2 million in 2019/20. The
30 2019/20 DSM plan reflects the continuation of current DSM program offerings with
31 adjustments to existing program forecasts based on updated market information
32 and maintaining a status quo approach to DSM pending the transition to Efficiency
33 Manitoba. Manitoba Hydro is currently in consultations with the Province as

Supplement to Centra's 2019/20 General Rate Application Page 9of19
March 22, 2019
1 required under The Energy Savings Act with the 2019/20 DSM plan expected to be
2 finalized in Spring 2019 following final consultations with the Province.
3
4
3.1 2019/20 Interest Rates & Exchange Rates
5 Figure 4 below compares the interest rate and exchange rate assumptions
6 underpinning the 2019/20 Approved Budget and 2019/20 CGM18 Budget filed on
7 November 30, 2018.
8 9 Figure 3: Comparison of Interest Rates & Exchange Rates
2019/20 2019/20 CGM18 Approved Budget (Summer 2018)
(Winter 2018)
Short Term Interest Rate* 2.20% 2.15% Long Term Interest Rate* 3.80% 3.90% 20 Year Weighted Average Term to Maturity (WATM)
U.S. - Cdn Exchange Rate 1.30 1.26 10 *Not including the 1% Provincial Guarantee Fee 11
12 While forecast interest rates are largely unchanged, Figure 4 shows a weakening of
13 the Canadian dollar since the summer of 2018.
14
15
3.2 Revenue Requirement
16 Figure 3.1 in the original Application shows a comparison of the Net Income
17 reflected in CGM18 under the cost of service methodology with Net Income
18 determined under the rate base rate of return methodology ("RBROR"). Figure 5
19 below has been updated for the 2018/19 Current Outlook and 2019/20 Approved
20 Budget, as well as corresponding updates to the assumptions underlying the Rate
21 Base Rate of Return methodology. The Net Income under the RBROR is a calculated
22 value based on the revenue requirement Surplus/{Shortfall) between the two
23 methodologies and the net income under the cost of service methodology.

1
2
3
4
5
6
7
8
9
10
11
12
13 4.0
14
15
16
17
18
19
20
21
22
23
24
25
26
Supplement to Centra's 2019/20 General Rate Application Page 10of19
March 22, 2019
Figure 5: Updated Revenue Requirement/ Net Income Comparison 2018/19 2019/20
In Millions Current Outlook Approved Budget Revenue Net Revenue Net
Approach Requirement Income Requirement Income
Cost of Service (A) 346.2 4.4 322.7 Rate Base Rate of Return (8.30% ROE) (B) 347.6 5.8 325.8
Surplus (Shortfall) (1.4) (1.4) (3.1)
(A) COS revenue requ i rement- Figure 1 - Appendix 5.12 (Update)
COS net i ncome- Figure 5.2, Appendi x 5.13 -Tab 5 Schedules (Update)
(B) RBROR revenue requirement- Schedule 6.0.0 (Update)
RBROR net income is a calculated net income
Centra has updated the following Tab 6 schedules to reflect the updated
outlook/forecast assumptions for 2018/19 and 2019/20:
• Schedule 6.0.0 Summary of Rate based Rate of Return;
• Schedule 6.5.7 and 6.5.8- Regulated Deferrals Continuity Schedules;
• Schedule 6.7.7 and 6.7.8- Working Capital Allowance Schedules;
• Schedule 6.8.7 and 6.8.8- Overall Rate of Return Schedules;
• Schedule 6.9.7 and 6.9.8- Average Debt Financing Schedules; and,
• Schedule 6.10.7 and 6.10.8- Return on Rate Base Schedules.
COST ALLOCATION AND RATE DESIGN
Centra has updated its 2019/20 Cost Allocation Study to reflect updates to:
• Revenue Requirement for the 2019/20 Test Year that were outlined in
Section 3.0;
• Working capital allowance included in Rate Base outlined in updated
Schedule 6.7.8; and,
• Load forecast reflecting 2018 Natural Gas Volume Forecast (filed as Appendix
7.6).
The result of the update is that the total Revenue Requirement for cost allocation
purposes of $325.8 million has been allocated to the various rate classes. This is
compared with a total Revenue Requirement for cost allocation purposes of $326.3
million that was reflected in Centra's GRA filed on November 30, 2018. The
2.9 6.0
(3.1)
1
2
3
4
5
6
7
8
9
10
11 12 13
14
15
Supplement to Centra's 2019/20 General Rate Application Page 11of19
March 22, 2019
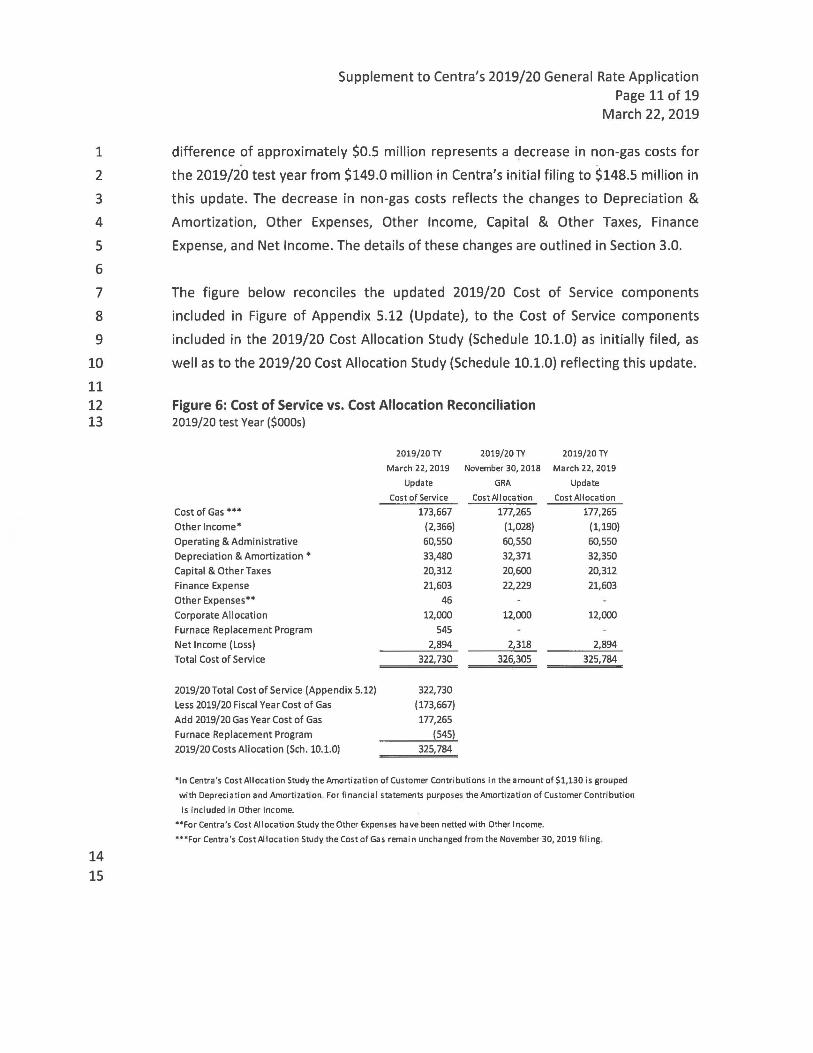
difference of approximately $0.5 million represents a qecrease in non-gas costs for
the 2019/20 test year from $149.0 million in Centra's initial filing to $148.5 million in
this update. The decrease in non-gas costs reflects the changes to Depreciation &
Amortization, Other Expenses, Other Income, Capital & Other Taxes, Finance
Expense, and Net Income. The details of these changes are outlined in Section 3.0.
The figure below reconciles the updated 2019/20 Cost of Service components
included in Figure of Appendix 5.12 (Update), to the Cost of Service components
included in the 2019/20 Cost Allocation Study (Schedule 10.1.0) as initially filed, as
well as to the 2019/20 Cost Allocation Study (Schedule 10.1.0) reflecting this update.
Figure 6: Cost of Service vs. Cost Allocation Reconciliation 2019/20 test Year ($000s)
2019/20 TY 2019/20 TY
March 22, 2019 November 30, 2018
Update GRA
Cost of Service Cost Allocation
Cost of Gas••• 173,667 177,265
Other Income• (2,366) {1,028)
Operating & Administrative 60,550 60,550
Depreciation & Amortization • 33,480 32,371
Capital & Other Taxes 20,312 20,600
Finance Expense 21,603 22,229
Other Expenses•• 46
Corporate Allocation 12,000 12,000
Furnace Replacement Program 545
Net Income (Loss) 2,894 2,318
Total Cost of Service 322,730 326,305
2019/20 Total Cost of Service (Appendix 5.12) 322,730
Less 2019/20 Fiscal Year Cost of Gas (173,667)
Add 2019/20 Gas Year Cost of Gas 177,265
Furnace Replacement Program (S45)
2019/20 Costs Allocation (Sch. 10.1.0) 325,784
2019/20 TY
March 22, 2019
Update
Cost Allocation
177,265
(1,190)
60,550
32,350
20,312
21,603
12,000
2,894
325,784
*In Centra's Cost Allocation Study the Amortization of Customer Contri butions in the a mount of $1,130 is grouped
with Depreciation and Amorti zation. For financial statements purposes the Amortization of Customer Contribution
is included in Other Income.
**For Centra's Cost Allocation Study the Other Expenses have been netted with Other Income.
•••for Centra's Cost Allocation Study the Cost of Gas remain unchanged from the November 30, 2019 filing.

1
2
3
4 5
6 7
8
9
10
11 12
13 14
Supplement to Centra's 2019/20 General Rate Application Page 12of19
March 22, 2019
The figure below provides an updated summary of the allocation of these costs to
the various rate classes compared to the GRA filed on November 30, 2018.
Figure 7: Cost of Service Allocation by Customer Class ($000s)
2019/20 TY 2019/20 TY Nm.ember 30, 2018 March 22, 2019 Increase/
GRA ~ (DeC~i!§l~)
SGS 135,565 134,975 (590)
LGS 56,859 57, 157 297 High Volume Finn 13,882 13,752 (130)
Co-op 20 20 (0)
Mainline Special Contract Power Stations le Interruptible Primary Gas* Supplemental Finn Supplemental Interruptible Fixed Rate Primary Gas 78 66 (12) Total Cost of Service 326,305 325,784 (521)
The figure below compares the allocation of the 2019/20 proposed non-gas costs of
$148.5 million to the various rate classes to non-gas costs of $149.0 million from the
original filing.
Figure 8: Comparison of Non-Gas Costs by Customer Class ($000s)
2019/20 TY 2019/20 TY
No1.ember 30, 2018 March 22, 2019 Increase/
GRA ~ <Decrei!Sel
SGS 103,098 102,633 (465)
LGS 32,357 32,456 99
High Volume Finn 6,919 6,824 (95)
Co-op 8 8 (0)
Mainline 2,000 2,058 58
Special Contract 2,282 2,247 (35)
Power Stations 167 158 (9)
Interruptible 810 770 (41)
Primary Gas* 1, 195 1,176 (19)
Supplemental Finn 162 159 (3)
Supplemental Interruptible 10 10 (0)
Fixed Rate Primary Gas 32 21 (10)
Total Non-Gas Costs of Service 149,040 148,519 (521)

1
2
3
4
5
6
7
8
9
10
11
Supplement to Centra's 2019/20 General Rate Application Page 13of19
March 22, 2019
As reflected in the Figure 8 above, non-gas costs decreased approximately $0.5
million relative to Centra's GRA filed on November 30, 2018. All classes with the
exception of LGS and Mainline customer classes experience a decrease in their
allocated portion of non-gas costs compared to Centra's original filing.
The increase in non-gas costs allocated to the LGS and Mainline customer classes
compared to the original filing is the result of changes in the load characteristic of
these classes flowing from the 2018 Natural Gas Volume Forecast. Primarily, the
change in the Peak and Average allocator(s) has increased the allocation of costs for
the LGS and Mainline customer classes.
12 Further, the non-gas costs to be included in the Primary Gas base rate will also
13 slightly change as a result of this update. Centra is requesting approval of a new
14 updated Primary Gas Overhead Rate (non-gas component) of $0.91/103m3
15 (Schedule 10.1.2, lines 47 and 49) compared to $0.94/103m3 from original filing
16 included in the GRA filed on November 30, 2018.
17
18 The non-gas cost components within the Supplemental Gas rates have also been
19 updated. The Firm Supplemental gas overhead component is proposed to be
20 $1.60/103m3 and the Interruptible Supplemental gas overhead component is
21 proposed to be $1.59/103m3. Figure 9 provides the calculation of overhead rates for
22 Supplemental Gas.
23

1 2
3 4
5
6
7
8
9
10
11
12
13
14
15
16
17
18
19
20
21
22
Supplement to Centra's 2019/20 General Rate Application Page 14of19
March 22, 2019
Figure 9: Calculation of Supplemental Gas Overhead Rate
Firm Supplemental OH rate
Non-gas al located ($)
Volumes {103m3}
Rate/103m3
rate/m3
INT Supplemental OH rate Non-gas allocated($)
Volumes (103m3}
Rate/la3m3
rate/m3
2019/20 2019/20 November 30, 2018 March 22, 2019
Filing Update
161,539 158,980
10,397 10,232
ld
ld
Centra has also updated its Fixed Rate Primary Gas Service ("FRPGS") Program Cost
Rate ("PCR"). The revised PCR is $37.67/103m3 (Schedule 10.1.2, line 49), which is
lower than the $55.12/103m3 included in the GRA filed on November 30, 2018 but
slightly higher than the $31.37 /103m3 currently approved by the PUB. The decrease
compared to the initial filing results primarily from a reduction in program
administration costs forecasted for this service for the 2019/20 test year.
The non-Primary gas costs and balances of the non-Primary PGVA accounts have not
been updated as part of this filing. Centra plans to update its Cost Allocation Study
to reflect a more current estimate of non-Primary gas costs for the 2019/20 gas year
and balances in the non-Primary PGVA accounts as part of the Pre-Hearing update in
July 2019. Although, the non-Primary Gas costs remain unchanged in this filing, the
allocation of these costs between customer classes have changed as a result of
changes in volumes, load factor and peak day requirements flowing from the 2018
Natural Gas Volume Forecast.
Figure 10 below provides a summary of the allocation of non-Primary gas costs to
the various customer rate classes compared to the original filing.

1 2
3
4
5
6
7
8
9
10
11
12
13
14
15
16
17
18
19
20
21
22
23
24
5.0
Supplement to Centra's 2019/20 General Rate Application Page 15of19
March 22, 2019
Figure 10: Comparison of Non-Primary Gas Costs by customer classes ($000s)
No1ember 30, 2018 March 22, 2019 GRA Update Increase/
2019/20 2019/20 (De!;;r!ilsi~e)
SGS 32,468 32,343 (125) LGS 24,502 24,701 198 High Volume Firm 6,963 6,927 (35) Co-op 12 12 (0) Mainline 225 224 (1) Special Contract 71 71 (0) Power Stations 82 82 (0) Interruptible 918 881 (36) Supplemental Firm 13,236 13,236 Supplemental Interruptible 852 852 Total Non-Primary Gas Costs 79,329 79,329 (O}
Schedules 11.3.0 a), b), c) and d) to Tab 11 remain unchanged from the GRA filed on
November 30, 2018. These schedules summarize the allocation of the non-Primary
Gas PGVA and gas deferral accounts as of October 31, 2018 (with carrying costs to
July 31, 2019} to various customer classes and continue to show a net refund to
customers of approximately $6.4 million. The calculation of the proposed rate riders
provided in the Schedule 11.3.1 has been updated to reflect changes to billing units
flowing from the 2018 Natural Gas Volume Forecast.
CUSTOMER BILL IMPACTS
The following figures summarize the annual bill impacts, in both dollar and
percentage terms, of the proposed Novemberl, 2019 sales rates that result from
this update. The annual bill comparisons are relative to the February 1, 2019 rates
approved in Order 16/19. Comparisons for the T-Service customers reflect delivery
service only. The impact resulting from changes to the Primary Gas overhead
component has not been reflected in the figures below or the Schedule 11.1.0. This
impact will be incorporated in the November 1, 2019 Primary Gas Application.
The annual consumption of a typical residential customer has been revised to 2,218
m3 from 2,246 m3 in the GRA filed on November 30, 2018 , for consistency with the

Supplement to Centra's 2019/20 General Rate Application Page 16of19
March 22, 2019
1 average usage forecast for a Residential system supply customer reflected in . .
2 Centra's 2018 Natural Gas Volume Forecast (filed as Appendix 7.6}.
3
4 The bill impacts for most customer classes flowing from this update result in a
5 slightly higher annual bill decrease (or slightly lower bill increase) compared to
6 Centra's initial filing with the exception of SGS class.
7
8 The bill impacts are a result of both cost changes and changes in the level of
9
10
11
12 compared to the Centra's initial filing for SGS
13 class.
14
15 The annualized bill impact resulting from base rate changes proposed for November
16 1, 2019 for the typical residential customer is a decrease of approximately 4.3% or
17 $29 per year compared to February 1, 2019 base rates. The change in the billed rates
18 results in a decrease for the typical residential customer of approximately 5.5% or
19 $38 per year compared to February 1, 2019 billed rates. Please refer to the Schedule
20 11.1.0 for details of the annual bill impacts.
21
22 Figure 11 below shows the annual bill impacts, by sales service customer class, of
23 the change in base rates proposed in this update compared to the February 1, 2019
24 rates (see Schedule 11.1.0, page 2).
ld

1 2
3
4
5
6
7
8
9
10 11
12
13
14
15
16
Supplement to Centra's 2019/20 General Rate Application Page 17of19
March 22, 2019
Figure 11: Annual Bill Impacts of the Proposed Base Rates for Sales Service Customers by Customer Class
2019/20 Test Year Annual Impacts
Base Rates
Customer Class Consumption (103M°3) Load Factor $Impact %Change 1.0 ($13) -3.3%
SGS 2.2 ($29) -4.3% 11.3 ($146) -5.3%
LGS 11.3 $31 1.1%
679.9 $1,849 1.5%
HVF 850 25% ($1,735) -1.1% 685 75% ($2,894) -2.8%
Mainline 41,000 75% ($293,827) -5.7% 2,833 75% ($34,517) -9.0%
Interruptible 850 25% ($3,890) -3.0%
14,164 75% ($85,748) -5.0%
Figure 12 below shows the annual bill impacts for Transportation Service ("T
Service") customers in each of the customer classes for the change in base rates
proposed in this Application, compared to the February 1, 2019 rates (see Schedule
11.1.0, page 2).
Figure 12: Annual Bill Impacts of the Proposed Base Rates for T-Service Customers by Customer Class
2019/20 Test Year
HVF (T-Service)
Mainline (T-Service)
Special Contract
Power Stations
Annual Impacts Base Rates
$Impact $9,523
$72,091 $35,176
$271 812
2d
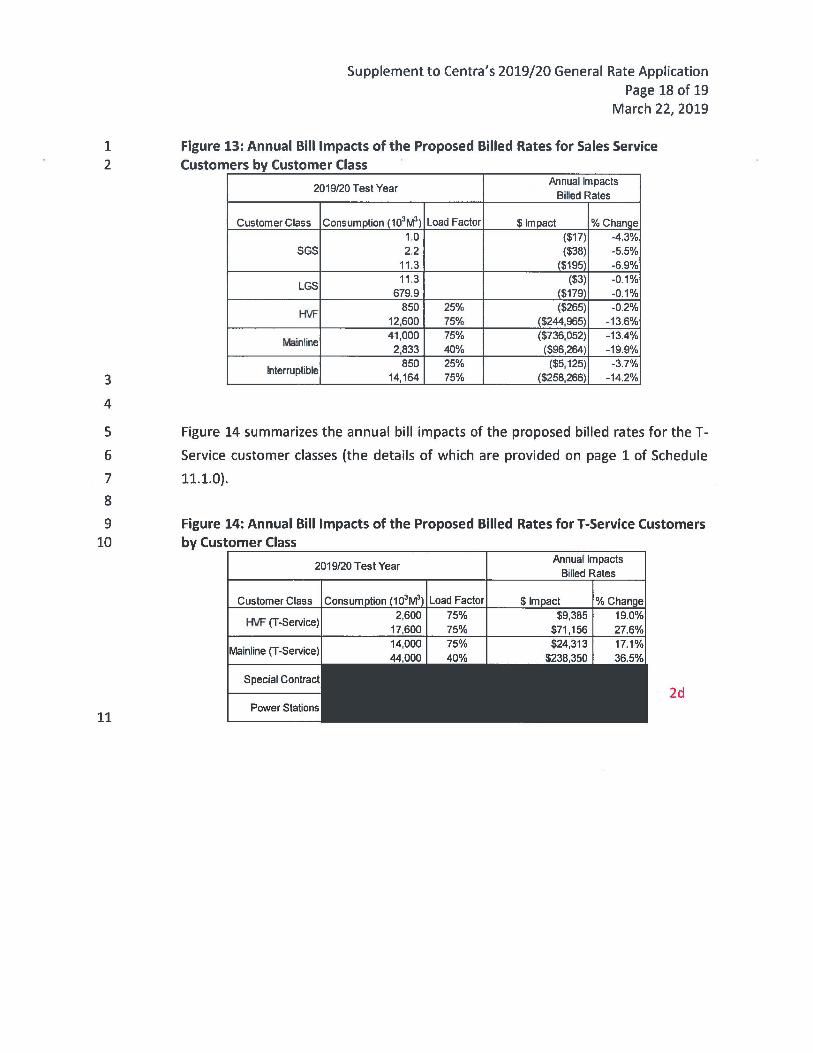
The annual bill impacts of the proposed billed rates for the sales service customer
classes are summarized in the Figure 13 below (the details of which are provided on
page 1 of Schedule 11.1.0).
1 2
3
4
5
6
7
8
9 10
11
Supplement to Centra's 2019/20 General Rate Application Page 18of19
March 22, 2019
Figure 13: Annual Bill Impacts of the Proposed Billed Rates for Sales Service Customers by Customer Class
2019/20 Test Year Annual Impacts
Billed Rates
Customer Class Consumption (103 M3) Load Factor $Impact % Cham:ie 1.0 ($17) -4.3%
SGS 2.2 ($38) -5.5% 11.3 ($195) -6.9%
LGS 11 .3 ($3) -0.1%
679.9 ($179) -0.1%
HVF 850 25% ($265) -0.2%
12,600 75% ($244,965) -13.6%
Mainline 41,000 75% ($736,052) -13.4%
2,833 40% ($96,264) -19.9%
Interruptible 850 25% ($5, 125) -3.7%
14,164 75% ($258,266) -14.2%
Figure 14 summarizes the annual bill impacts of the proposed billed rates for the T
Service customer classes {the details of which are provided on page 1 of Schedule
11.1.0).
Figure 14: Annual Bill Impacts of the Proposed Billed Rates for T-Service Customers by Customer Class
2019/20 Test Year
Customer Class Consumption (103M3) Load Factor 2,600 75%
17,600 75% HVF (T-Service)
Mainline (T-Service) 14,000 75% 44,000
Special Contract
Power Stations
Annual Impacts Billed Rates
$Impact $9,385
$71,156 $24,313
$238,350
2d

1
2
3
4
5
6
7
8
9
10
11
6.0
Supplement to Centra's 2019/20 General Rate Application Page 19of19
March 22, 2019
PROPOSED RATE SCHEDULES
Centra has also updated Schedules 11.2.0 and 11.2.1 to reflect changes flowing from
this update. Schedule 11.2.0 reflects the approved February 1, 2019 rates flowing
from Order 16/19. Schedule 11.2.1 provides the proposed November 1, 2019 rates
with the exception of Primary Gas rate which is expected to be updated as part of
Centra's Primary Gas Application that will be filed with PUB in October 2019 for
rates effective November 1, 2019. On July 24, 2019, as part of Centra's Pre-Hearing
update of non-Primary gas costs, Schedule 11.2.1 will be updated again, to reflect a
more current estimate of non-Primary gas costs for the 2019/20 gas year and non
Primary gas PGVA accounts balances (with carrying costs to October 31, 2019).


