Hydrogen Installation System For Transit Buses CONFIDENTIAL PRESENTATION August 2011
Upload
nguyentuyenCategory
view
220download
0
A national laboratory of the U.S. Department of EnergyOffice of Energy Efficiency & Renewable Energy
National Renewable Energy Laboratory Innovation for Our Energy Future
SunLine Transit Agency Hydrogen-Powered Transit Buses: Preliminary Evaluation Results K. Chandler Battelle
L. Eudy National Renewable Energy Laboratory
Technical Report NREL/TP-560-41001 February 2007
NREL is operated by Midwest Research Institute ● Battelle Contract No. DE-AC36-99-GO10337

SunLine Transit Agency Hydrogen-Powered Transit Buses: Preliminary Evaluation Results K. Chandler Battelle
L. Eudy National Renewable Energy Laboratory
Prepared under Task No. H270.8200
Technical Report NREL/TP-560-41001 February 2007
National Renewable Energy Laboratory1617 Cole Boulevard, Golden, Colorado 80401-3393 303-275-3000 • www.nrel.gov
Operated for the U.S. Department of Energy Office of Energy Efficiency and Renewable Energy by Midwest Research Institute • Battelle
Contract No. DE-AC36-99-GO10337

NOTICE
This report was prepared as an account of work sponsored by an agency of the United States government. Neither the United States government nor any agency thereof, nor any of their employees, makes any warranty, express or implied, or assumes any legal liability or responsibility for the accuracy, completeness, or usefulness of any information, apparatus, product, or process disclosed, or represents that its use would not infringe privately owned rights. Reference herein to any specific commercial product, process, or service by trade name, trademark, manufacturer, or otherwise does not necessarily constitute or imply its endorsement, recommendation, or favoring by the United States government or any agency thereof. The views and opinions of authors expressed herein do not necessarily state or reflect those of the United States government or any agency thereof.
Available electronically at http://www.osti.gov/bridge
Available for a processing fee to U.S. Department of Energy and its contractors, in paper, from:
U.S. Department of Energy Office of Scientific and Technical Information P.O. Box 62 Oak Ridge, TN 37831-0062 phone: 865.576.8401 fax: 865.576.5728 email: mailto:[email protected]
Available for sale to the public, in paper, from: U.S. Department of Commerce National Technical Information Service 5285 Port Royal Road Springfield, VA 22161 phone: 800.553.6847 fax: 703.605.6900 email: [email protected] online ordering: http://www.ntis.gov/ordering.htm
Printed on paper containing at least 50% wastepaper, including 20% postconsumer waste

Acknowledgements This evaluation at SunLine Transit Agency would not have been possible without the support and cooperation of many people. The authors thank the following: U.S. DOE Sigmund Gronich John Garbak National Renewable Energy Laboratory Keith Wipke George Sverdrup SunLine C. Mikel Oglesby Tommy Edwards Polo Del Toro Ed Gallardo Karen Thomas Mike Hayes UTC Power Mike Tosca Matthew Riley Sandy Lajewski ISE Thomas Blazek Tavin Tyler Paul Scott HyRadix Terry Schuster
iii
Table of Contents Executive Summary........................................................................................................................ 1
Alternative Fuels and Hydrogen at SunLine............................................................................... 1 Infrastructure and Facilities ........................................................................................................ 1 Evaluation Results ...................................................................................................................... 2 What’s Next for This Demonstration?........................................................................................ 4
Overview......................................................................................................................................... 5 Project Design and Data Collection............................................................................................ 6 Host Site Profile.......................................................................................................................... 7
Infrastructure and Facilities .......................................................................................................... 13 Natural Gas Fueling .................................................................................................................. 13 Natural Gas Fueling Experience ............................................................................................... 15 Hydrogen Fueling ..................................................................................................................... 15 Early Hydrogen Fueling Experience......................................................................................... 18 Maintenance Facilities .............................................................................................................. 20
Fuel Cell, Hydrogen Engine, and CNG Buses.............................................................................. 22 Fuel Cell Bus Propulsion System Description.......................................................................... 23 HHICE Bus Propulsion System Description ............................................................................ 24 CNG Bus Propulsion System Description ................................................................................ 25 Early Bus Experience................................................................................................................ 26
Evaluation Results ........................................................................................................................ 30 Route Descriptions.................................................................................................................... 30 Bus Use and Availability .......................................................................................................... 31 Fuel Economy and Cost ............................................................................................................ 33 Maintenance Analysis............................................................................................................... 35 Roadcall Analysis ..................................................................................................................... 39
What’s Next for This Demonstration?.......................................................................................... 40 Contacts......................................................................................................................................... 41 Acronyms and Abbreviations ....................................................................................................... 43 References and Related Reports ................................................................................................... 44 Appendix: Fleet Summary Statistics............................................................................................. 45 Appendix: Fleet Summary Statistics – SI Units ........................................................................... 51
iv

Executive Summary This report provides preliminary evaluation results for one prototype fuel cell bus and one prototype hydrogen hybrid internal combustion engine (HHICE) bus operating at the SunLine Transit Agency (SunLine) in Thousand Palms, California (Palm Springs/Coachella Valley area). Purchased for $3.1 million and manufactured by Van Hool and ISE Corp., the fuel cell bus features an electric hybrid drive system with a UTC Power PureMotionTM 120 Fuel Cell Power System and ZEBRA batteries for energy storage. Purchased for $1.2 million, the HHICE bus from New Flyer has essentially the same electric hybrid drive system from ISE Corp., but with ultracapacitors for energy storage and a Ford V10 Triton engine customized to operate on hydrogen fuel. SunLine has been operating both of these hydrogen-fueled transit buses in normal revenue service. The evaluation in this report is based on a comparison to five new compressed natural gas (CNG) buses operating from the same SunLine location. Purchased for $375,000 each, the new CNG buses from Orion Bus Industries use Cummins Westport C Gas Plus natural gas engines. This evaluation of prototype fuel cell and HHICE transit buses at SunLine is a part of the U.S. Department of Energy’s (DOE) Hydrogen, Fuel Cells & Infrastructure Technologies Program, which integrates activities in hydrogen production, storage, and delivery with transportation and stationary fuel cell applications. This evaluation focuses on documenting progress and opportunities for improving the vehicles, infrastructure, and procedures. There is no intent to consider the implementation of these hydrogen-fueled transit buses as commercial (or full revenue transit service). Alternative Fuels and Hydrogen at SunLine SunLine has been operating its entire fleet and support vehicles on CNG since May 1994. SunLine has remained fully committed to operating its fleet on alternative fuels and continues that commitment to this day with CNG and hydrogen-fueled transit buses. The importance of the demonstration of hydrogen-fueled fuel cell and internal combustion engines is to further the development and create enough hydrogen demand to make onsite production of hydrogen cost-effective. The fuel cell technology produces only emissions of water and a small amount of waste hydrogen. The use of hydrogen in internal combustion engines significantly reduces oxides of nitrogen emissions when used alone, as in the case of the HHICE bus and when used as a blend with CNG. Infrastructure and Facilities Fueling facilities at SunLine include private and public access for CNG, liquefied natural gas (LNG), compressed hydrogen, and a blend of hydrogen and CNG. SunLine has hydrogen production on site from a HyRadix natural gas reformer. When SunLine first began testing
1

hydrogen buses, it built a special onsite maintenance facility. The building is located behind the CNG bus maintenance building and is essentially a tent designed to vent hydrogen through its roof. This type of structure can provide a low-cost option to an agency in warmer climates, such as SunLine. Evaluation Results The evaluation periods presented in this report are as follows:
• Fuel Cell Bus – January 2006 through November 2006 (11 months of operation) • HHICE Bus – January 2006 through November 2006 (11 months of operation) • New CNG Buses – July 2006 through November 2006 (5 months of operation)
SunLine Routes – SunLine operates 12 fixed routes in the Coachella Valley along State Highway 111 and Interstate 10. Bus service averages 13.4 mph during the week and 12.7 mph on the weekend to give a weekly average of 13.2 mph. The fuel cell bus has been used on Line 50 and Line 111. The HHICE bus has been used almost exclusively on Line 50. The CNG buses in this evaluation have been used randomly on all routes/lines from the Thousand Palms operation. Bus Use and Availability – Bus use and availability are indicators of reliability. Lower bus usage may indicate downtime for maintenance, repair, or purposeful reduction of planned work for the buses. Availability is the percent of time that the buses are planned for operation compared to the time the buses are actually available for that planned operation. The availability goal is 85% for all buses. During the evaluation period, the CNG buses essentially met the goal. The HHICE bus was at or above the availability target except for July-August 2006. During this timeframe, the HHICE bus was held out of service because of a lack of hydrogen during the installation of the new HyRadix reformer unit. The fuel cell bus availability was much lower than the target during May through September 2006 because of problems with the air conditioning and fuel cell systems. When the air conditioning and fuel cell systems were operating properly, the availability was generally close to target. Fuel Economy and Cost – Figure ES-1 shows hydrogen and CNG fuel economy by month during the evaluation periods. Using the gasoline gallon equivalent (GGE) fuel economy (this is essentially the same as miles per kg for the hydrogen-fueled buses) with the CNG buses as the baseline, the fuel economy of the fuel cell bus was 149% higher than the CNG buses and the fuel economy of the HHICE bus was 46% higher than the CNG buses. The fuel economy of the fuel cell bus was 71% higher than the HHICE bus. Maintenance Costs – Total maintenance costs for the three study groups of buses are not intended to include warranty work; however, further study is planned for the final report to better assess the warranty work costs. The CNG buses have the lowest total maintenance cost at $0.25 per mile. The fuel cell bus and HHICE bus have per mile maintenance costs that are 76% higher ($0.44 per mile) and 2.2 times higher ($0.55 per mile), respectively, than the baseline/CNG buses.
2

0.00
1.00
2.00
3.00
4.00
5.00
6.00
7.00
8.00
9.00
10.00
Jan-06Feb
-06Mar-0
6Apr-0
6
May-06Jun-06
Jul-06
Aug-06
Sep-06Oct-0
6
Nov-06
Mile
s pe
r Gal
lon/
kg
FC1 miles/kg HHICE miles/kg CNG miles/GGE
Figure ES-1. Monthly average fuel economy (miles per kg or GGE) Specific Experience Fuel Cell Bus – The fuel cell bus was delivered in November 2005 and placed into revenue service in December 2005. Both ISE and UTC Power have a technician available to SunLine for warranty support of the fuel cell bus, and SunLine reports that this support has been excellent. There have been a few significant issues with the fuel cell bus so far:
1. ZEBRA batteries – These batteries have had significant problems in this application. The main challenges have been accommodating cell failures and optimizing the state of charge (SOC) algorithm.
2. Air conditioning – SunLine’s summer operation exposes buses to extreme heat conditions, with average high temperatures reaching the 110-120° F range. Also, this hybrid design is unique because the air conditioning unit is driven electrically instead of mechanically (by belt) like most vehicles. In this application, the system has experienced problems with failed evaporator and condenser motors.
3. UTC Power PureMotionTM 120 Fuel Cell Power System – UTC Power monitors the performance of the fuel cell power system remotely to analyze actual performance vs. predicted performance. In June 2006, UTC Power observed that the CSA (cell stack assembly) performance was decaying at high current densities at rates that were beyond what was predicted and required for a minimum 4,000-hour fuel cell life.
With the SunLine bus accumulating the most hours early on, the issue was observed there first. On June 30, 2006, the fuel cell power system in the SunLine bus was removed and sent to UTC Power in Connecticut for advanced testing. To minimize down time, a spare, developmental UTC Power fuel cell power system was installed on July 6, 2006.
3

An engineering investigation determined that contaminants were released from a CSA material due to a supplier quality control problem with that material. As part of UTC Power’s ongoing development, it has modified the CSAs, thus eliminating this condition for all builds. Between September 25 and 27, 2006, the developmental fuel cell power system was removed and replaced with a new unit that incorporated the new CSA design.
Specific Experience HHICE Bus – This bus is currently a one-of-a-kind application. It was developed in 2004 and delivered to SunLine for operation in December 2004. The HHICE bus did not stay long at SunLine before it was shipped to Winnipeg, Manitoba, Canada for winter/cold weather testing. The HHICE bus was away from SunLine from approximately January 16, 2005 through April 20, 2005 before resuming operation at SunLine in May 2005. The bus was test-driven in Canada during February and March 2005 on a regular Winnipeg Transit route. In later operation at SunLine, the HHICE bus engine experienced significant failure of components during October and November 2005. This failure was caused by an incorrectly installed crankshaft damper. A new engine was installed into the HHICE bus in December 2005. The bus resumed revenue service later that month. The evaluation results presented in this report are focused on the operation of the newer engine. Specific Experience with New CNG Buses – SunLine has been operating an all CNG fleet since May 1994; however, that fleet of buses is now reaching the end of its usable life. The bus bodies have done well in the desert climate, but the engines are a first generation natural gas design. A phased approach to the replacement of the CNG bus fleet was designed and the first 15 new CNG Orion V high floor buses were ordered as part of an existing order by Fresno Area Express. These new CNG buses were delivered in June 2006. SunLine reported that the new bus order had some minor quality control issues with the bus systems (as all bus orders seem to have), but start-up of operations with these 15 CNG buses went well. The main challenge for SunLine has been the fact that newer buses (regardless of propulsion) have significant upgrades, such as multiplexed controls onboard. While the mechanics have had to undergo additional training on these new systems, SunLine staff has reportedly embraced the new technology and is quickly catching up. Roadcall Analysis – A roadcall (RC) or revenue vehicle system failure (as named in the National Transit Database) is defined as a failure of an in-service bus that causes the bus to be replaced on route or causes a significant delay in schedule. The CNG buses have had very few RCs. The fuel cell and HHICE buses have had several RCs and lower vehicle usage (about half or less that of the baseline CNG buses), which is indicative of the prototype nature of these two buses. Compared to the fuel cell bus, the HHICE bus has a slightly higher miles-between-RC rate. What’s Next for This Demonstration? This report covers SunLine’s operation of the fuel cell, HHICE, and CNG buses through November 2006. The next evaluation report for this site will include at least 12 months of operation for the CNG buses, which will require the evaluation period to run through at least June 2007. The next evaluation report is planned for release around November 2007.
4

Overview This report provides preliminary results from an evaluation of prototype fuel cell and hydrogen internal combustion engine-equipped transit buses operating at SunLine in Thousand Palms, California. Preliminary evaluation results are also provided for new CNG transit buses for a baseline comparison to the prototype hydrogen-fueled transit buses. This report describes the equipment used (buses and infrastructure) and provides early experience details, lessons learned, and results from the operation of the buses and supporting hydrogen and CNG fuel stations through November 30, 2006. This evaluation is part of DOE’s Hydrogen, Fuel Cells & Infrastructure Technologies (HFCIT) Program, which integrates activities in hydrogen production, storage, and delivery with transportation and stationary fuel cell applications. DOE’s National Renewable Energy Laboratory (NREL) works with fleets and industry groups to test advanced technology, heavy-duty vehicles in service and provides unbiased information resources for fleet managers considering these technologies. Information collected during vehicle performance and operation evaluations is fed back to research programs to help shape future work. In early 2003, DOE initiated the Controlled Hydrogen Fleet and Infrastructure Demonstration and Validation Project, which focuses on light-duty fuel cell vehicles and supporting infrastructure. The purpose of the project is to examine the impact and performance of fuel cell vehicles and supporting hydrogen infrastructure in real-world applications. The data collected and analyzed during this “learning demonstration” are used to verify performance targets to assess technology readiness. To coordinate efforts, the fuel cell bus evaluation team is working closely with the light-duty demonstration project teams. The overall goal of this coordination is to ensure that similar data for heavy-duty fuel cell vehicles are collected with the intent that this will enable a more complete picture of fuel cell performance over a wider range of vehicle applications than just light-duty. In addition to the light-duty demonstration project, DOE and NREL are also working with the FTA, an agency of the U.S. Department of Transportation (DOT), and heavy vehicle operators (mostly transit agencies) to demonstrate heavy fuel cell and hydrogen vehicles and to collect operations experience data. This collaboration is directly supporting FTA’s National Fuel Cell Bus Program (NFCBP). This data collection and evaluation follows the DOE/NREL standardized evaluation protocol1 and detailed data collection templates based on the light-duty demonstration. A customized version of the General Evaluation Plan, created for fuel cell bus evaluations, is described in the draft Fuel Cell Transit Bus Evaluation Protocol of June 2005. Current heavy fuel cell vehicle evaluation sites are shown in Table 1. More information is available at www.eere.energy.gov/hydrogenandfuelcells/tech_validation/ca_transit_agencies.html.
1 General Evaluation Plan, Fleet Test & Evaluation Projects, July 2002, NREL/BR-540-32392, www.nrel.gov/vehiclesandfuels/fleettest/pdfs/32392.pdf.
5

This preliminary data report examines evaluation results from one prototype fuel cell bus, one prototype HHICE bus, and five new CNG baseline buses operating from the same SunLine bus depot. The evaluation periods presented in this report are as follows:
• Fuel Cell Bus – January 2006 through November 2006 (11 months of operation) • HHICE Bus – January 2006 through November 2006 (11 months of operation) • New CNG Buses – July 2006 through November 2006 (5 months of operation)
Table 1. DOE/NREL Heavy Vehicle Fuel Cell/Hydrogen Evaluations
Fleet Vehicle/Technology Evaluation Status Shuttle bus: Hydrogenics and Enova, battery-dominant fuel cell hybrid (one bus)
Shuttle bus in operation, data collection started U.S. Air Force/Hickam Air Force Base
(Honolulu, Hawaii) Delivery van: Hydrogenics and Enova, fuel cell hybrid (one van)
Van in operation, data collection started
Alameda-Contra Costa Transit District (AC Transit) (Oakland, California)
Van Hool/UTC Power fuel cell hybrid transit bus integrated by ISE Corp. (three buses)
Evaluation in process, all three buses in operation since March 2006, full service started in April 2006; preliminary evaluation results reported Feb 2007
New Flyer ISE Corp. hydrogen internal combustion engine transit bus (one bus-HHICE)
Evaluation in process, preliminary evaluation results reported here SunLine Transit Agency
(Thousand Palms, California) Van Hool/UTC Power fuel cell hybrid transit bus integrated by ISE Corp. (one bus-FCB)
Evaluation in process, preliminary evaluation results reported here
VTA (San Jose, California) and SamTrans (San Carlos, California)
Gillig/Ballard fuel cell transit bus (three buses) Completed and reported in 2006
SunLine Transit Agency (Thousand Palms, California)
ISE Corp./UTC Power ThunderPower hybrid fuel cell transit bus (one bus) Completed and reported in 2003
Project Design and Data Collection As mentioned earlier, DOE/NREL evaluation projects focus on using a standardized process for data collection and analysis, communicating results clearly, and providing an accurate and complete evaluation. The objectives of the data collection are to validate fuel cell and hydrogen technologies in bus applications to:
• Determine the status of fuel cell systems for buses and corresponding hydrogen infrastructure
• Provide feedback for DOE HFCIT Program research and development • Provide “lessons learned” on implementing next generation fuel cell systems into bus
operations. This evaluation includes prototype fuel cell-powered and hydrogen internal combustion engine-equipped transit buses (40 foot) operating at SunLine in Thousand Palms, California (buses shown in Figure 1). Five new CNG buses (shown in Figure 2) were selected from SunLine’s newest order of Orion CNG buses operating at the same depot (Thousand Palms). Data were collected in parallel for the two prototype buses during the evaluation periods, which ended in November 2006. The CNG baseline data were collected and analyzed along side the prototype transit buses to assess the progress of the hydrogen propulsion development (fuel cell and internal combustion engine) for heavy vehicles and specifically in this application at SunLine.
6

Figure 1. Fuel cell (left) and HHICE (right) transit buses at SunLine
Figure 2. New Orion V CNG bus at SunLine
Data for this evaluation were taken from SunLine’s data system. Data parameters included:
• CNG fuel consumption by vehicle and fill • Hydrogen fuel consumption by vehicle and fill • Mileage data and route assignments from every vehicle in the study • Preventive maintenance action work orders, parts lists, labor records, and related
documents • Records of unscheduled maintenance, including roadcalls and warranty actions by
vendors (when available in the data system). Additional information has been collected on the maintenance/operation experience, issues at the hydrogen fueling station and SunLine facilities, and lessons learned at the start-up and during the operation of the prototype buses. Host Site Profile SunLine (www.sunline.org) is located in the Palm Springs/Coachella Valley, Calif., area and serves an area greater than 1,100 square miles (Figure 3). The Coachella Valley is a desert valley region with annual rainfall around five inches per year. Average high temperatures are typically above 80° F for eight months of the year, and can get as high as 120° F. Transit bus operations started in 1977 with 22 vehicles. SunLine provides bus service from two locations in the Valley – one in Thousand Palms, which serves as headquarters, and another in Indio (both locations shown in Figure 4). In fiscal year 2006, ridership was reported as
7

approximately 3.5 million passengers, the fleet operated 2.8 million miles, and SunLine had an operating budget of $18.2 million.
Figure 3. SunLine operating area in the Coachella Valley, California
Figure 4. SunLine headquarters in Thousand Palms (left) and Indio bus garage (right)
SunLine is a Joint Powers Authority (JPA) created by its nine member cities as well as the county (Riverside). Each member city and the county have an appointed member on the SunLine board.
8

• Desert Hot Springs • Palm Springs • Cathedral City • Rancho Mirage • Palm Desert • Indian Wells • La Quinta • Indio • Coachella • Additional board member from Riverside County
SunLine operates 12 fixed routes (SunBus) and provides paratransit services (SunDial). The current bus fleet includes 48 full size transit buses (40 foot) including 46 CNG buses, one New Flyer HHICE bus, and one Van Hool fuel cell bus. The fleet also includes 23 CNG paratransit vehicles and 35 light- and medium-duty CNG vehicles. Alternative Fuels. SunLine started looking for a defining position on clean bus operations in 1991. At that time, a decision was made to convert the entire SunLine fleet (buses and support vehicles) to CNG in order to maximize the impact of potential emissions reductions and economic benefits. This decision was made at a very early stage in CNG bus development and deployment in the United States. For context, in 1991 approximately 25 heavy CNG buses had just been placed into service in this country, with another 70 on order. As background for SunLine’s interest in alternative fuels, the State of California has identified some severe air quality challenges, especially in the Los Angeles metropolitan area. The Coachella Valley, including Palm Springs, is located in Riverside County, which is one of the four counties (Los Angeles, Orange, Riverside, and San Bernardino counties) included in the Los Angeles metropolitan area. Starting in the late 1980s and early 1990s, the California Air Resources Board (CARB) began to strongly encourage alternative fuels for vehicles to help with emissions reductions. The South Coast Air Quality Management District (SCAQMD) launched several incentive programs for conversion of vehicles in the district to alternative fuels. One of these incentive programs focused on transit buses because of the potential significant emissions impact in urban areas. The SunLine board of directors approved a 100% alternative fuels approach in 1992 and took advantage of local and state incentives for purchasing alternative fuel vehicles. Natural gas vehicle training programs were developed at the College of the Desert’s Energy Technology Training Center, and the SunLine mechanics were the first “graduates” of that training. All SunLine employees received some natural gas vehicle safety familiarization training. SunLine was the nation’s first fleet to change to 100% CNG bus operations, which occurred essentially overnight in May 1994. An NREL report documenting SunLine’s first 10 years of CNG operations experience is available2. Since May 1994, SunLine has remained fully committed to
2 NREL, 2006, “Ten Years of Compressed Natural Gas Operations at SunLine Transit Agency,” http://www.nrel.gov/vehiclesandfuels/ngvtf/pdfs/39180.pdf
9

operating its entire fleet on alternative fuels and continues that commitment to this day with CNG and hydrogen-fueled transit buses. Experience with Hydrogen. SunLine has successfully taken advantage of its unique capabilities with gaseous fuels, small size, and high temperature/low humidity location for attracting testing projects with government and manufacturer partners. Over the years, many projects have involved natural gas, hydrogen, fuel cells, and various combinations of these technologies. The objectives for these projects have been to advance clean transit bus propulsion systems and leverage project funding to afford SunLine additional equipment and infrastructure. Table 2 provides a summary of several hydrogen-related projects at SunLine since the installation of onsite hydrogen production and dispensing in 2000. The Ballard P4 fuel cell bus (ZEBus) was demonstrated during 2000 and 2001 (shown in Figure 5), but was not used in actual revenue service3. The next major project was a development project with NREL and Cummins Westport, Inc. (CWI) to develop and demonstrate a natural gas engine capable of using hydrogen and CNG blended fuel4. The second fuel cell bus demonstrated at SunLine was the ISE integrated ThunderPower bus powered by UTC Power’s 60 kW fuel cell power system (shown in Figure 6) in 2002 through 20035. This fuel cell bus went on to be demonstrated in several locations, including AC Transit. SunLine and HyRadix (www.hyradix.com) worked together in 2004 to install a natural gas reformer to produce high purity hydrogen for use by vehicles. The testing of this HyRadix reformer was completed in 2006 and a commercial design was released for purchase. The SunLine unit was replaced with the new/commercial design and placed back into service in August 2006.
Figure 5. Ballard P4 ZEBus fuel cell bus Figure 6. ThunderPower fuel cell bus The ISE/New Flyer HHICE bus was introduced into service in late 2004. Soon after arriving at SunLine, the HHICE bus was shipped to Manitoba, Canada for cold weather testing in February and March 20056. In December 2005, SunLine received its third fuel cell bus; this one was developed by ISE, Van Hool, and UTC Power. The HHICE and Van Hool fuel cell bus are currently in operation and preliminary evaluation results are provided in this report. SunLine has
3 Ballard/Xcellsis, 2001, “Customer Report of ZEBus at SunLine Transit,” http://www.eere.energy.gov/hydrogenandfuelcells/tech_validation/pdfs/sunline_project_reports2.pdf 4 NREL, 2005, “Development and Demonstration of Hydrogen and Compressed Natural Gas Blend Transit Buses,” http://www.nrel.gov/vehiclesandfuels/ngvtf/pdfs/38707.pdf 5 NREL, 2003, “Fuel Cell Transit Buses, ThunderPower Bus Evaluation at SunLine Transit Agency,” http://www.eere.energy.gov/hydrogenandfuelcells/tech_validation/pdfs/sunline_report.pdf 6 Manitoba Energy Science and Technology, 2005, “Cold Weather Demonstration in Winnipeg, Manitoba, Canada”
10

expressed its interest in the successful operation of these hydrogen fueled buses and would like to add more to its fleet. SunLine has already secured funding for further development of fuel cell buses through FTA. SunLine would also like to purchase another HHICE bus if funding can be secured. Table 2. Hydrogen-Related Activities at SunLine Timeframe Activity Description 2000-2004 Addition of hydrogen dispensing A Stuart Energy electrolyzer was installed for testing and used
to produce hydrogen; decommissioned and removed in 2004 2000-2001 Ballard P4 Fuel Cell Bus
Demonstration (ZEbus) Demonstration of the Ballard phase 4 fuel cell bus from July 2000 through June 2001; still on site as a static display
2002-2004 Development and testing of a hydrogen and CNG blend engine
Support for development and testing of a Cummins natural gas engine to operate on a hydrogen CNG fuel blend. Buses in service during 10/2003 and 6/2004; buses retired in 2005.
2002-2003 Demonstration of ThunderPower fuel cell bus
Demonstration of a small transit bus integrated by ISE, power plant from UTC Power; bus demonstrated in other locations; currently static display at ISE
2004-2006 Addition of HyRadix natural gas reformer
Prototype HyRadix natural gas reformer was installed to produce high pressure hydrogen for use with the HHICE bus and other vehicles using hydrogen. Unit was replaced with commercial design in 2006.
2004-present Demonstration of HHICE bus Demonstration of ISE/New Flyer HHICE bus started in December 2004. The bus was tested in Manitoba, Canada during February and March 2005, and then returned to SunLine for operation.
2005-present Demonstration of fuel cell bus Demonstration of Van Hool/ISE/UTC Power fuel cell bus started in December 2005
2006-present Upgrade of HyRadix natural gas reformer to commercial product
HyRadix has introduced its natural gas reformer as a commercial product; the unit at SunLine was replaced with the commercial product design; on November 16, 2006 SunLine announced the availability of public hydrogen fueling at its Thousand Palms facility
2006-present FTA National Fuel Cell Bus Program announcement
SunLine received $2.8 million to develop a new fuel cell bus plus inclusion into other fuel cell bus studies
Current Advanced Propulsion Direction at SunLine. In 2003, SunLine’s CEO and CFO resigned amidst concerns of mismanagement of funds. Mr. C. Mikel Oglesby was hired as the new general manager of SunLine in 2004 and got to work restoring public confidence in SunLine, establishing a vision for the future, balancing the budget, and initiating enhancements to operations and service. Multiple enhancements to transit operations have been made at SunLine in a very short period of time. In 2006, SunLine gained control of its natural gas fueling infrastructure (from Clean Energy) and launched SunFuels as an alternative fuels provider. Another initiative was to complete a comprehensive operational analysis to evaluate and restructure both the fixed-route and paratransit services at SunLine. Along with the many hydrogen projects underway, the future of CNG bus operations at SunLine is also bright. In September 2006, SunLine announced the arrival of 15 new Orion V CNG buses with Cummins C Gas Plus engines (purchased on an existing order from Fresno Area Express transit agency). SunLine plans to replace the entire heavy CNG bus fleet by 2009. The next order of CNG buses includes five 30-foot buses and eight to ten 40-foot buses (depending on available funding), all from New Flyer and all low floor.
11

Hydrogen Fuel Use in Transit
Fuel cell propulsion systems provide an opportunity to reduce vehicular emissions to zero (except for water vapor and a small amount of waste hydrogen). Typically, transit bus demonstrations have been introduction points for new heavy-duty vehicle propulsion technologies (i.e., natural gas and hybrid electric). This is because:
Transit buses are centrally fueled and maintained. Transit buses typically operate on fixed routes in urban stop-and-go duty cycles. Transit bus size and weight can easily accommodate new technologies. Capital purchases of transit buses and supporting infrastructure are federally supported
(80% federal share and other funding programs). Transit buses have high visibility and impact because they operate in densely
populated areas* Development of fuel cell propulsion systems in full-size transit buses is progressing as shown in this evaluation report. At the same time, the development and production of high-purity hydrogen at a reasonable price must be a high priority for introduction of fuel cell propulsion to be successful (or even possible). Production of hydrogen fuel at a reasonable price requires development of large quantity production without large distribution/transportation costs. Using hydrogen fuel in transit buses is one opportunity for creating the demand for large quantity production and use close to the source (this is mostly focused on high-purity hydrogen production from reforming natural gas). The current price of a full-size, fuel cell transit bus is reported as $2 to $3 million depending on the quantity purchased. This high capital cost minimizes the number of fuel cell transit buses that can be purchased and placed into service at any given location. In order to continue increasing the use of hydrogen fuel, other lower purchase-price propulsion technologies/strategies have been introduced (and tested at SunLine). One strategy is to add hydrogen fuel to CNG, typically in an 80% CNG and 20% hydrogen blend. With some minor modifications to commercial CNG engines, the existing CNG bus fleet can use some hydrogen. Hydrogen/CNG blends also provide a significant benefit in terms of reducing oxides of nitrogen (NOx) emissions in the already low-emission CNG technology. The second strategy for development of hydrogen fuel use is to introduce hydrogen internal combustion engines (ICEs) that use hydrogen directly in the engine. Hydrogen-fueled ICEs, such as the engine in the HHICE bus, help build demand and support for hydrogen infrastructure while fuel cell technology is being perfected (and purchase prices come down). The HHICE bus can be a good candidate for transit agencies because fleet mechanics are familiar with the workings of combustion engines. This innate knowledge, therefore, frees up maintenance workers to focus on the nuances of using a new gaseous fuel. Hydrogen ICEs also have the potential for near-zero emissions. Because the fuel contains no carbon, the engine does not produce carbon dioxide or any other carbon compounds. The only undesirable emission is NOx. However, operating the ICE at ultra-lean conditions keeps the combustion temperature low enough to nearly eliminate NOx without using any aftertreatment device. * Information excerpted from an FTA presentation at the American Public Transportation Association Bus and Paratransit Conference committee meeting in Milwaukee, Wisconsin, May 2003.
12

Infrastructure and Facilities SunLine’s gaseous fuel experience began in the early 1990s when the agency switched its fleet to CNG. Protecting the air quality in the Coachella Valley was the primary reason the agency chose to abandon diesel for natural gas. To accomplish this conversion, SunLine sought out various partners. College of the Desert, a local community college, created a training program for alternative fuels. SunLine partnered with the local natural gas provider, Southern California Gas Company (SoCal Gas), to build the fueling infrastructure. The CNG station was completed and ready for operation by the end of 1993. The most unusual aspect of the station, from a transit perspective, ithe fact that it is open to the public. SunLine recently took over full ownership of the station, and now benefits fully from the sale of fuel. In addition to CNG, the station offers liquefied natural gas (LNG), a blend of CNG and hydrogen, and pure hydrogen. Diesel and gasoline are not available at SunLine. P
hoto
cou
rtesy
of S
unLi
nes
Natural Gas Fueling SunLine has two bus operations sites, and both locations have a CNG fueling station for the bus fleet and for public fueling. As mentioned earlier, SunLine and SoCal Gas built the original CNG fast fill station at the Thousand Palms facility with construction starting in 1993. In 1997, Clean Energy purchased the SoCal Gas portion of the fueling station and operation. The station has a public filling station on the outside of the facility at Thousand Palms (Figure 7) and piping is run underground to SunLine’s private bus filling station (Figure 8). The public and private stations provide CNG at 3,000 psi. SunLine has commitment for funding to upgrade this CNG fueling station to provide 3,600 psi fuel, but the funding is not in contract yet. LNG was added to this fueling station in 2001.
Pho
to c
ourte
sy o
f Sun
Line
Figure 7. Public fueling at SunLine’s Thousand Palms CNG fueling station
13

Figure 8. CNG fueling lane and bus wash (Thousand Palms)
The CNG fueling station at Thousand Palms includes two 400 hp natural gas compressors from Wilson Technologies (shown in Figure 9) and provides a 10-minute CNG fill for a transit bus. The station design includes six American Society of Mechanical Engineers (ASME) tubes for a buffer to help start the fast fill.
Figure 9. CNG compressor station (Thousand Palms) In 1995, SunLine opened a second operating location in Indio called the Clean Air Center, which now operates approximately 40% of SunLine’s service. A CNG fueling station was added at this location in 1995. This station includes both public and private fueling, with higher speed fueling behind the fence of the facility. One Sulzer and one IMW Industries natural gas compressor along with three ASME tubes for a buffer were installed at Indio (Figure 10). Fueling times range from 12 minutes up to 20 minutes, depending on demand. Some trucks and support vehicles are also fueled at this location from the public side of the station.
14

Figure 10. CNG fueling equipment (Indio) Natural Gas Fueling Experience SunLine personnel expressed that the CNG fueling times were acceptable at both stations. Transit agencies typically require fueling equipment that can fill a transit bus in 10 minutes or less. Overhauls of the compressors are performed on a 2-year basis, so one compressor is overhauled each year while the other compressor is kept in service. Drive-aways at the fueling dispenser have been the main safety issue at the public fueling station in Thousand Palms. New drivers of light-duty vehicles at the public station have regularly ripped hoses off the dispenser. As with public gasoline dispensers, the CNG dispenser hoses have a break-away point so that the dispenser is not damaged in the event of a drive-away. The hose pulls away from the dispenser and then can be repaired. However, one particular drive-away ripped the entire dispenser out because the hose had wrapped around the dispenser and did not have a chance to pull out at the break-away point. The transit buses do not generally present the drive-away problem because of a starter cut-out switch at the fueling door. When that fueling door is open, the bus cannot be started. All of the SunLine vehicles (including paratransit and support vehicles) have starter cut-out switches. SunLine has attempted to address the drive-away issue at the public station through training of public access consumers and its own employees. Labels with pictorial instructions were also added to the dispensers to help alleviate the problem. SunLine personnel reported that the small size of their fleet and staff has most likely made it easier to facilitate training and awareness than would be the case at a larger operation. Hydrogen Fueling SunLine has been providing hydrogen fuel for various vehicles on site since 2000. Acting as a “test bed” for advanced technologies, SunLine has partnered with various organizations to test and optimize hydrogen production technologies. The fleet has demonstrated hydrogen
15

production methods, including electrolyzers from two different manufacturers (using energy from solar and wind) and natural gas reformers. In 2004, HyRadix was selected to demonstrate its prototype natural gas reformer at SunLine under a project funded by DOE and SCAQMD. The objectives of the project included demonstrating the unit in real-world conditions, evaluating the fill rates for vehicles, and evaluating the cost of hydrogen production compared to DOE targets. During the demonstration, the reformer provided high purity hydrogen to SunLine and gave HyRadix the opportunity to fully test the unit’s capabilities for transit applications. Lessons learned during the demonstration have been used to optimize the system for commercialization. For more information on the results of the demonstration, refer to the 2005 DOE Annual Merit Review Proceedings at www.hydrogen.energy.gov/pdfs/review05/tvp_6_harness.pdf and the Annual Progress Report at www.hydrogen.energy.gov/pdfs/progress05/viii_c_3_harness.pdf. In June, 2006 SunLine awarded a contract to HyRadix to replace the existing unit with its commercial reformer, the Adéo. The cost of a new Adéo reformer from HyRadix starts around $750,000. This is the first HyRadix commercial unit to be installed in North America. The installation was completed and the unit went into service in August 2006. Funding for the new reformer was provided by SCAQMD and FTA. SunLine also purchased a 6-year service contract from HyRadix for operation and maintenance of the reformer ($300,000 total). On November 16, 2006, SunLine and HyRadix announced the opening of the first hydrogen fueling station available to the public. The SunLine public fueling station provides CNG, LNG, hydrogen, and blended hydrogen (20%) and CNG (80%) fuel to the public. SunLine estimates that this hydrogen fueling infrastructure can produce enough hydrogen to comfortably operate five full-size transit buses without running out of fuel for the small hydrogen vehicles expected to be fueled at this station. The HyRadix Adéo7 is a natural gas reformer that uses a proprietary catalytic auto-thermal reforming technology. The reformer generates hydrogen in four steps (as shown in Figure 11):
1. Sulfur removal – The natural gas is fed through an ambient temperature sulfur adsorption device to remove specific impurities, such as the odorant added for leak detection. These compounds can affect the performance of the catalysts used in the reforming process.
2. Reforming – The natural gas is converted into a hydrogen-rich product stream through auto-thermal reforming, which uses a bi-functional catalyst that promotes two reactions (partial oxidation reaction and steam reforming reaction) in the same catalyst bed.
3. Heat integration – To increase overall efficiency, heat recovered during the process is used to pre-heat the feed into the reactor and generate steam for the reforming reaction.
4. Purification – Pressure swing adsorption (PSA) technology is used to purify the hydrogen.
The resulting purified hydrogen is compressed to 6,000 psi for storage prior to dispensing into the buses. The reformer is capable of producing a maximum of 9 kg of hydrogen per hour; 7 HyRadix specifications 2-page handout, http://www.hyradix.com/common/documents/adeo_specs.pdf
16
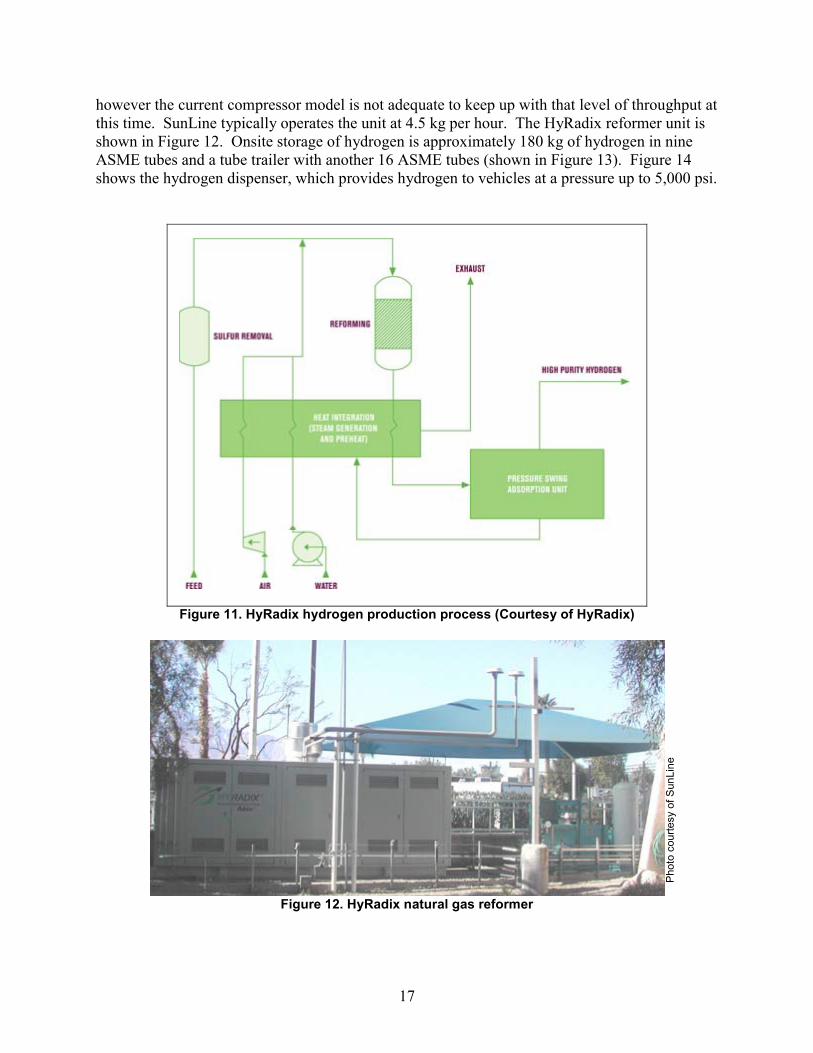
however the current compressor model is not adequate to keep up with that level of throughput at this time. SunLine typically operates the unit at 4.5 kg per hour. The HyRadix reformer unit is shown in Figure 12. Onsite storage of hydrogen is approximately 180 kg of hydrogen in nine ASME tubes and a tube trailer with another 16 ASME tubes (shown in Figure 13). Figure 14 shows the hydrogen dispenser, which provides hydrogen to vehicles at a pressure up to 5,000 psi.
Figure 11. HyRadix hydrogen production process (Courtesy of HyRadix)
Pho
to c
ourte
sy o
f Sun
Line
Figure 12. HyRadix natural gas reformer
17

Figure 13. Hydrogen storage at SunLine
Pho
to c
ourte
sy o
f Sun
Line
Figure 14. Hydrogen dispenser at SunLine
Early Hydrogen Fueling Experience SunLine credits its ease of permitting for the hydrogen station to its extensive work when first planning the CNG station. The time spent educating and building relationships with local fire marshals, emergency responders, and city and county officials in 1993 paid off when it was time to add hydrogen to the site. SunLine was given the green light to proceed based on the following facts:
18

• The agency was already dealing with flammable, compressed gases in high volumes. • Policies and procedures were in place to deal with flammable, compressed gases and
associated equipment. • Formal, ongoing training programs were conducted for all personnel in accordance with
the requirements for handling gaseous fuels and equipment. Figure 15 shows total monthly hydrogen dispensed from the SunLine hydrogen dispenser for December 2005 through November 2006. The total fuel used in December 2005 only represents about 10 days of bus fueling at the end of the month. The fuel cell bus was just being placed into operation at that time. The HHICE bus had undergone an engine replacement and was just returning to service (discussed later). March 2006 was a low point for hydrogen dispensing due to training completed on both the HHICE and fuel cell buses during the first half of the month (this reduced the amount of fuel typically used by each bus). The other low point in hydrogen consumption was August 2006. This low point occurred when the HyRadix reformer was out of service for its upgrade. At this time, SunLine was filling the tube trailer at a chemical plant to supply hydrogen. In order to maximize the hydrogen available for the fuel cell bus, the HHICE bus was held out of service for the second half of July 2006 and the first half of August 2006. A contributing factor to low hydrogen fuel use from July through September 2006 was downtime for the fuel cell bus caused mostly by air conditioning problems, but a few fuel cell issues contributed as well. Figure 16 shows the average daily hydrogen use from the station. This daily use rate only includes days in which hydrogen was dispensed from the station. The hydrogen fueling station was used at least once each day for 81% of the days during the period shown.
0
100
200
300
400
500
600
700
800
900
1000
Dec-05
Jan-06
Feb-06
Mar-06
Apr-06
May-06
Jun-06
Jul-0
6
Aug-06
Sep-06
Oct-06
Nov-06
Tota
l Mon
thly
H2
(kg)
Use
Figure 15. Total monthly hydrogen dispensed
19

0.0
5.0
10.0
15.0
20.0
25.0
30.0
35.0
40.0
Dec-05
Jan-06
Feb-06
Mar-06
Apr-06
May-06
Jun-06
Jul-0
6
Aug-06
Sep-06
Oct-06
Nov-06
H2
Am
ount
(kg)
/ D
ay
Figure 16. Average hydrogen dispensed per day (excluding 0 kg days)
Maintenance Facilities In order to support operations and maintenance of CNG buses, SunLine made some modifications and upgrades to the maintenance facility in 1995. These included the addition of combustible gas detectors and the upgrade of some of the electrical conduit, lighting, and ventilation in the maintenance bays. The fueling station and maintenance facility upgrade costs at the Thousand Palms location were reported to be $1.47 million in 1995. Figure 17 shows the maintenance facility at Thousand Palms. There were no additional costs for the outside bus parking areas. The combustible gas sensors and alarms in the maintenance facility are required by building codes for indoor maintenance of CNG vehicles. The combustible gas detection system is designed to alarm at a 20% lower flammability limit (LFL) in air with a siren and lights. At 40% LFL the siren and lights latch on, power in the building is turned off, and the vents are opened in the roof of the building. The proper operation of this system is tested quarterly and the combustible gas detectors are calibrated every six months.
20

Figure 17. CNG maintenance facility in Thousand Palms
When SunLine first began testing hydrogen buses, it built a special onsite facility for maintenance (shown in Figure 18). Located behind the CNG bus maintenance building, the facility is essentially a tent designed to vent hydrogen through its roof. It consists of an aluminum frame covered with fireproof canvas, which is ventilated along the ridgeline with an 18-inch gap and a 6-inch raised "rain cap" to allow hydrogen gas to safely escape if it is inadvertently released from the vehicle. All lighting within the tent structure and adjacent maintenance bay is rated Class 1, Division 1. The building is also equipped with sensors that sound an alarm if a hydrogen leak is detected. Construction of the building cost approximately $50,000 ($21,000 for the building, doors, and ventilation system, and $29,000 for the fire and combustible gas sensors and the alarm system). This type of structure can provide a low-cost option to an agency in warmer climates, such as SunLine. There have been no reported hydrogen leaks in the hydrogen maintenance facility, and no alarms have occurred. The system and sensors are checked and calibrated twice a year.
Figure 18. Hydrogen maintenance building
21

Fuel Cell, Hydrogen Engine, and CNG Buses Table 3 provides bus system descriptions for the fuel cell, HHICE, and new CNG buses that were studied in this evaluation. SunLine unveiled its Van Hool hybrid fuel cell bus from ISE Corporation on November 21, 2005 at the Thousand Palms facility. This fuel cell bus started revenue service at SunLine in late December 2005. The purchase, manufacturing, and packaging of the Van Hool fuel cell bus took about two years and cost approximately $3.1 million. This SunLine bus is a sister to three other Van Hool fuel cell buses developed for AC Transit. The ISE Corp./New Flyer HHICE bus was purchased by SunLine as part of a joint FTA/SCAQMD project in 2004. The bus went into service in December 2004. As mentioned earlier, soon after the HHICE bus started operation at SunLine, it was sent to Winnipeg, Manitoba, Canada for cold weather testing in February and March 2005, and then resumed operation at SunLine. A single new HHICE bus is estimated (by ISE Corp.) to cost between $1 million and $2 million to purchase today, depending on the number of buses purchased. The new CNG buses from Orion were purchased in 2005, and were delivered in June 2006. For this evaluation, five buses of an order of 15 new Orion V CNG buses were selected for a baseline comparison to the fuel cell and HHICE buses at SunLine. These CNG buses are operated from the Thousand Palms operating depot along with the two hydrogen-fueled buses. The purchase price reported for these CNG buses ($375,000 each) includes all preparation for SunLine service, such as the radio and farebox.
Table 3. Fuel Cell, HHICE, and CNG Bus System Descriptions Operation from Thousand Palms Depot Vehicle System
Fuel Cell Bus HHICE Bus CNG Bus Number of Buses 1 1 5 Bus Manufacturer and Model
Van Hool A330 Low floor
New Flyer TB-40 Low floor
Orion V High floor
Model Year 2005 2004 2006 Length/Width/Height 40 ft/102 in/139 in 40 ft/102 in/137 in 40 ft/102 in/135 in GVWR/Curb Weight 43,240 lb/36,000 lb 40,000 lb/32,032 lb 40,600 lb/29,600 lb Wheelbase 228 in 293 in 280 in
Passenger Capacity 30 seated or 26 seated
and two wheelchairs 15 standing
39 seated or 33 seated and two wheelchairs
13 standing
44 seated or 38 seated and two wheelchairs
21 standing
Engine Manufacturer and Model
UTC Power PureMotionTM 120 Fuel
Cell Power System
Ford 6.8 liter Triton V10 hydrogen Cummins C Gas Plus
Drive Motor Rated Power 170 kW 150 kW @ 3100 rpm 280 hp @ 2400 rpm
Rated Torque 220 Nm 400 lb-ft @ 3250 rpm 850 lb-ft @ 1400 rpm Accessories Electrical Electrical Mechanical Emissions Equipment None None Catalytic converter
Transmission/Retarder Gearbox/Flenders Regenerative braking
Gearbox/Flenders Regenerative braking
ZF 5HP592 Integrated retarder
Fuel Capacity 50 kg hydrogen 58 kg hydrogen 125 DGE Bus Purchase Cost $3.1 million $1 million to $2 million $375,000
22

Table 4 provides descriptions of some of the electric propulsion systems for the fuel cell and HHICE buses. The electric propulsion systems for these two buses are nearly identical except for the energy storage and slightly more hydrogen storage on the HHICE bus. Note that the CNG buses are not a hybrid configuration and do not have regenerative braking or energy storage for the drive system.
Table 4. Additional Electric Propulsion System Descriptions Propulsion Systems Fuel Cell Bus HHICE Bus
Manufacturer/Integrator ISE Corporation ISE Corporation Hybrid Type Series, charge sustaining Series, charge sustaining Drive System Siemens ELFA/ISE Siemens ELFA/ISE Propulsion Motor 2-AC induction, 85 kW each 2-AC induction, 85 kW each
Energy Storage Battery – 3 modules/216 cells sodium/nickel chloride ZEBRA®; 53 kWh capacity
Ultracapacitors – 2 packs/144 modules each; Maxwell; 0.6 kWh capacity
Fuel Storage Eight, roof mounted, SCI, type 3 tanks; 5,000 psi rated
Eight, roof mounted, SCI, type 3 tanks; 5,000 psi rated
Regenerative Braking Yes Yes Fuel Cell Bus Propulsion System Description The prototype fuel cell bus in service at SunLine is the result of a collaboration between ISE Corporation (www.isecorp.com), UTC Power (www.utcpower.com), and Van Hool (www.abc-companies.com/sales_vh.htm). The bus uses the PureMotionTM 120 Fuel Cell Power System manufactured by UTC Power in a hybrid electric drive system designed by ISE. The Van Hool A330 transit bus chassis was redesigned to integrate the fuel cell system. The bus has a low floor from front to back and three doors for easy passenger boarding. ISE’s hybrid system (shown in Figure 19) is a series configuration, meaning the fuel cell power system is not mechanically coupled to the drive axle. The fuel cell power system and energy storage system work together to provide power to two electric drive motors, which are coupled to the driveline through a combining gearbox. When the bus needs extra power, the fuel cell power system and energy storage provide power to the drive motors. When the power requirements of the bus are low, the fuel cell power system provides power and recharges the energy storage system. The hybrid system is also capable of regenerative braking, which captures the energy typically expended during braking and uses it to recharge the energy storage system. Each component of the propulsion system is carefully controlled through an ISE-developed operating system. ISE designed the system to be flexible. Depending on a client’s needs, a variety of powerplants and energy storage options can be integrated into the system. The bus at SunLine has a fuel cell powerplant and three ZEBRA® (sodium/nickel chloride) batteries (www.betard.co.uk/) as the energy storage system. The powerplant, which is the primary power source for the hybrid system is UTC Power’s PureMotionTM 120 Fuel Cell Power System which produces 120 kW from its proton exchange membrane (PEM) fuel cell stacks. UTC Power’s fuel cells operate at near-ambient pressure,
23

which eliminates the need for a compressor. This not only increases the efficiency of the system, but also results in very quiet operation.
Figure 19. ISE’s hybrid propulsion system
HHICE Bus Propulsion System Description The HHICE bus was developed by ISE Corporation with cooperation and support from New Flyer (www.newflyer.com). The major systems are shown in Figure 20. New Flyer delivered the bus to ISE as a “glider” without the power train. The HHICE bus features ISE’s ThunderVolt hybrid drive system (essentially the same hybrid system as described above for the fuel cell bus at SunLine) and Ford Motor Company’s Triton V10 engine, which is optimized to run on hydrogen. ISE’s hybrid system is a series configuration, meaning that the powerplant is not mechanically coupled to the drive axle. The powerplant and energy storage system work together to provide power to two electric drive motors that are connected to the driveline through a combining gearbox. As with the fuel cell bus, the hybrid system in the HHICE bus uses regenerative braking to recharge the energy storage system. The energy storage system on the HHICE bus consists of two packs of Maxwell ultracapacitors (www.maxwell.com). The benefit of using ultracapacitors over batteries is the speed at which energy can be stored and retrieved from the capacitors; the challenge with ultracapacitors is having enough energy density onboard a vehicle to enable efficient use of the energy storage system. Each component of the propulsion system is carefully controlled through an ISE-developed operating system.
24

Ford V10 H2 Engine
Control System
Energy Storage
Accessories
Inverter
Generator Drive Motor
Figure 20. Propulsion system for HHICE bus (courtesy of ISE Corp.)
CNG Bus Propulsion System Description SunLine is in the process of replacing its existing fleet of model year 1994 Orion V CNG buses. In June 2006, SunLine received 15 new CNG Orion V buses with Cummins Westport, Inc. (CWI, www.cumminswestport.com) C Gas Plus engines (engine shown in Figure 21). Development of the “Plus” version of the engine (modifications for better fuel and emission control) was supported by DOE and NREL8. Orion Bus Industries (www.orionbus.com) is located in Mississauga, Ontario, Canada and Oriskany, N.Y. Both the CNG engine and Orion V models are established, commercial products in the transit bus industry.
8 “On-Road Development of the C-Gas Plus Engine in Heavy-Duty Vehicles,” 2003, NREL/FS-540-32871; “An Emission and Performance Comparison of the Natural Gas C-Gas Plus Engine in Heavy-Duty Trucks,” 2003, NREL/SR-540-32863. Visit www.eere.energy.gov/afdc to obtain these publications.
25

Figure 21. CWI C Gas Plus engine
Early Bus Experience SunLine operators and mechanics are used to testing vehicles with new propulsion systems. First, they have operated and maintained CNG buses for more than 12 years. Second, SunLine staff has been working with hydrogen-fueled vehicles since 2000. The experience with gaseous fuels (i.e., CNG) has made the transition to using hydrogen much easier. SunLine has worked with the College of the Desert to develop9 and provide training to its entire staff. All new transit bus orders have some break-in issues after delivery. The buses in this evaluation are no exception. The following descriptions provide some initial/early experience details for the fuel cell, HHICE, and CNG buses operating at SunLine. Fuel Cell Bus. The fuel cell bus was delivered in November 2005 and placed into revenue service in January 2006. SunLine has only one fuel cell bus and reports that having the bus operate in revenue service is extremely important. Both ISE and UTC Power have technical support available to SunLine for warranty support of the fuel cell bus, and SunLine reports that this support has been excellent. SunLine is responsible for bus maintenance, and UTC Power and ISE are responsible for the propulsion and drive system; however, at least one SunLine mechanic follows the UTC Power or ISE technicians when repairs are made. The drivers of the fuel cell bus were excited about and really liked the bus. It offers a smooth, quiet ride and has a comfortable driver’s seat with good access to the controls. This new bus also has a hands-free public address system. There have been a few significant issues with the fuel cell bus so far:
1. ZEBRA batteries – These batteries have had significant problems in this application. The main challenges have been accommodating cell failures and optimizing the state of charge (SOC) algorithm. A cell failure in this serial string causes a short that decreases
9 Training materials developed by College of the Desert available on the DOE EERE Web site at http://www.eere.energy.gov/hydrogenandfuelcells/tech_validation/h2_manual.html
26

the overall voltage of a pack (in the group of three packs). Because these batteries operate at 300° C, it has also been difficult to make sure that a spare battery is available and up to operating temperature for efficient replacement of another battery in the set of three batteries. This issue will be discussed later in the evaluation results section.
2. Air conditioning – SunLine’s summer operation exposes buses to extreme heat
conditions, with average high temperatures reaching the 110-120° F range. Also, this hybrid design is unique because the air conditioning unit is driven electrically instead of mechanically (by belt) like most vehicles. In this application, the system has experienced problems with failed evaporator and condenser motors. Several changes and upgrades have been attempted and the problem seems to be resolved. However, this resolution did not occur until after the high heat of summer. Resolution of this issue will be revisited in the summer of 2007.
3. UTC Power PureMotionTM 120 Fuel Cell Power System – UTC Power monitors the
performance of the fuel cell power system remotely to analyze actual performance vs. predicted performance. In June 2006, UTC Power observed that the CSA (Cell Stack Assembly) performance was decaying at high current densities at rates that were beyond what was predicted and required for a minimum 4,000-hour fuel cell life. The performance manifested itself as lowered voltage for a given current at high power levels.
With the SunLine bus accumulating the most hours early on, the issue was observed there first. On June 30, 2006, the fuel cell power system in the SunLine bus (the unit had approximately 1,140 hours) was removed from the bus and sent to UTC Power in Connecticut for advanced testing that could not be accomplished in the field. Just prior to that removal, UTC Power asked SunLine to limit operation to hold the performance decay at its current state, which resulted in a short loss of availability. To minimize overall down time, the SunLine bus was retrofitted with a spare, developmental UTC Power fuel cell power system on July 6, 2006. During testing (back at UTC Power in Connecticut), it became apparent to UTC Power that the problem was with the CSAs and not a boundary condition issue (such as bad fuel). An engineering investigation determined that contaminants were released from a CSA material due to a supplier quality control problem with that material, which resulted in decayed performance. It should be noted that the issue was performance-related only and did not pose any safety issues nor was there a failure of the CSAs. As part of UTC Power’s ongoing development, UTC Power has incorporated corrective action into the CSAs thus eliminating this condition for all builds. UTC Power replaced the SunLine unit with a new fuel cell power system which incorporated the new CSA design as well as improvements to balance of plant hardware that were identified during the first year of operation. UTC Power wanted to use this opportunity to gain experience with the newly designed CSAs and balance of plant. On September 25, 2006, the spare fuel cell power system was removed from the SunLine bus after accumulating approximately 100 load hours at SunLine. It should be noted that
27

the number of load hours was significantly limited because of issues with the air conditioning system during that timeframe. The new fuel cell power system was installed over September 26 and 27, 2006. Now that the upgraded fuel cell power system has been installed in the SunLine bus, there is a desire to maximize/accelerate the use of this fuel cell bus. This accelerated testing is currently hampered by issues with the ZEBRA battery packs.
HHICE Bus. This bus is currently a one-of-a-kind application. This bus was developed in 2004 and delivered to SunLine for operation in December 2004. As mentioned earlier, the HHICE bus did not stay long at SunLine before it was shipped to Winnipeg, Manitoba, Canada for winter/cold weather testing. The HHICE bus was away from SunLine from approximately January 16, 2005 through April 20, 2005 before resuming operation at SunLine in May 2005. The bus was test-driven in Canada during February and March 2005 on a regular Winnipeg Transit route. The HHICE bus reportedly performed well in Canada, carrying more than 1,000 passengers and logging more than 300 miles in revenue service. A total of 1,800 miles were accumulated while operating in Canada. The bus was able to keep passengers sufficiently warm during operation, and was noticeably quieter than conventional diesel buses. As referenced earlier, the results of this cold weather testing have been published. Some of the lessons learned and needs identified from that testing are as follows:
• Develop permanent hydrogen facilities for storage, maintenance, and fueling • Reduce insurance costs based on continuing experience with operating hydrogen vehicles • Develop hydrogen safety training programs • Improve systems to measure and control water vapor in hydrogen fuel and reconsider
hydrogen fuel specification In later operation at SunLine, the HHICE bus engine experienced significant failure of components during October and November 2005. This failure was caused by an incorrectly installed crankshaft damper. A new engine was installed into the HHICE bus in December 2005. The bus resumed revenue service later that month. The evaluation results presented later in this report focus on the operation of this newer engine; however, some comparisons are made to the older engine/first year of operation. New CNG buses. SunLine has been operating an all CNG fleet since May 1994; however, that fleet of buses is now reaching the end of its usable life. The bus bodies have done well in the desert climate, but the engines are a first generation natural gas design. In 2004 the new SunLine general manager decided that the agency should stay on course with alternative fuels, but that the fleet needed to be replaced. A phased approach to the replacement of the CNG bus fleet was designed and the first 15 new CNG Orion V high floor buses were ordered as part of an existing order by Fresno Area Express. These new CNG buses were originally expected in January 2006, but a mix-up in the color scheme of the buses delayed delivery until June 2006. SunLine reported that the new bus order
28

had some minor quality control issues with bus systems (as all bus orders seem to have), but start-up of operations with these 15 CNG buses went well. The main challenge for SunLine has been the fact that newer buses (regardless of propulsion) have significant upgrades, such as multiplexed onboard controls. While the mechanics have had to undergo additional training, SunLine staff has reportedly embraced the new technologies and is quickly catching up. One of the changes with the new CNG buses is that SunLine is now able to use a single lube oil for the engine, transmission, and hydraulic systems. This has simplified maintenance and support (and hopefully cost) of the new CNG buses. Drivers do not appear to have any issues. They seem to like the new buses, including the acceleration and air conditioning systems. One of the new CNG buses had an engine oil consumption issue, but it was resolved by the Cummins dealer.
29

Evaluation Results The evaluation periods for the three study groups of buses ended in November 2006; however, the starting point was different for the CNG buses:
• Fuel Cell Bus – January 2006 through November 2006 (11 months) • HHICE Bus – January 2006 through November 2006 (11 months) • CNG Buses – July 2006 through November 2006 (5 months)
Both the fuel cell and HHICE buses were in service during a portion of December 2005, but this is not included in the evaluation because of low bus use during the month. This also helps remove some of the start-up issues at the very beginning of operation. This has also been done for the new CNG buses. These buses went into service near the end of June 2006, and the evaluation period started on July 1, 2006. In this evaluation report, both the fuel cell and HHICE buses are considered prototype technology that is in the process of being commercialized. The analysis and comparison discussions with standard/new CNG buses were done to help baseline the status and progress of these two hydrogen propulsion technologies. The intent of this analysis is to determine the status of this implementation and document the improvements that have been made over time at SunLine. There is no intent to consider this implementation of fuel cell or HHICE buses as commercial (or full revenue transit service). The evaluation focuses on documenting progress and opportunities for improvement of the vehicles, infrastructure, and procedures. Route Descriptions SunLine operates 12 fixed routes in the Coachella Valley along State Highway 111 and Interstate 10. Table 5 shows a weekly summary of bus usage at SunLine, and indicates that bus service operates at an average of 12.7 mph on the weekends and 13.4 mph during the week for an overall average of 13.2 mph. The weather plays a role in how the SunLine buses are operated. During the eight months in the year when the average high temperature is above 80° F, drivers typically idle on the shorter layovers to keep the buses cool for passengers. This causes the bus average speed to go down and the air conditioning load to go up, both of which have a significant impact on fuel efficiency.
Table 5. Summary of Total Weekly Bus Usage at SunLine Day of Week Total Miles Hours Average Speed Weekday 30,534.5 2,278.5 13.4 Weekend 8,777.4 693.8 12.7 Total 39,311.9 2,972.3 13.2
Buses at the two SunLine operating locations are generally dispatched randomly. However, the HHICE bus has been used almost exclusively on Line 50 (average speed of 14.1 mph), except for a few days on Line 30 and Line 31 in January 2006. The fuel cell bus has been used on Line 50 (operated 112 days) and Line 111 (operated 37 days, average speed of 14.3 mph). In-service
30

data indicates an average operating speed of 13.0 mph based on mileage and fuel cell system operating hours. The new CNG buses have been randomly dispatched. Bus Use and Availability Bus use and availability are indicators of reliability. Lower bus usage may be an indication of downtime for maintenance or purposeful reduction of planned work for the buses. This section provides a summary of bus usage and availability for the three study groups of buses. Figure 22 shows mileage and fuel cell system operating hour accumulation for the fuel cell bus during the evaluation period (January through November 2006). Total mileage accumulation for the evaluation period was 19,208 miles, and the fuel cell system accumulated 1,345 hours. These numbers indicate an overall average speed of operation at 13.0 mph, which is nearly the same as the overall SunLine operation speed of 13.2 mph.
02000400060008000
100001200014000160001800020000
Jan-06
Feb-06
Mar-06
Apr-06
May-06
Jun-06
Jul-0
6
Aug-06
Sep-06
Oct-06
Nov-06
Tota
l Mile
s
0200400600800100012001400160018002000
Tota
l FC
Sys
tem
Hou
rsTotal Miles Total FC System Hours
Figure 22. Cumulative mileage and fuel cell hours for one fuel cell bus
Table 6 summarizes average monthly mileage accumulation by bus and study group for the evaluation periods. Using the CNG buses as the baseline, the fuel cell bus had average monthly mileage 40% of CNG operation and the HHICE bus had average monthly mileage 50% of CNG operation. Another measure of reliability is availability – the percent of time that the buses are planned for operation compared to the time the buses are actually available for that planned operation. Figure 23 shows the monthly average availability for each of the three study bus groups. As shown on the chart, the availability goal is 85% for all buses. The chart shows that the CNG buses are essentially right on the goal; however, it should be noted that one CNG bus had availability at 63% and the other CNG buses were above the availability target. The HHICE bus
31

was at or above the availability target except for July-August 2006. During this timeframe, the HHICE bus was out of service because of a lack of hydrogen availability during the installation of the new HyRadix reformer unit. The fuel cell bus was much lower than the availability target during May through September 2006 because of problems with the air conditioning and the fuel cell systems, as discussed above in the early experience section. When the air conditioning and fuel cell systems were operating properly, the availability was generally close to target.
Table 6. Average Monthly Mileage (Evaluation Period)
Bus Starting Hubodometer
Ending Hubodometer
Total Mileage Months Monthly
Average FC1 2,865 22,073 19,208 11 1,746
550 HHICE 17,481 41,260 23,779 11 2,162 563 CNG 4,916 30,021 25,105 5 5,021 565 CNG 7,637 31,349 23,712 5 4,742 566 CNG 5,576 20,764 15,188 5 3,038 567 CNG 7,104 29,427 22,323 5 4,465 568 CNG 6,388 28,600 22,212 5 4,442
Total CNG 108,540 25 4,342
0
10
20
30
40
50
60
70
80
90
100
Jan-06
Feb-06
Mar-06
Apr-06
May-06
Jun-06
Jul-0
6
Aug-06
Sep-06
Oct-06
Nov-06
Perc
ent A
vaila
bilit
y
FC1 HHICE CNG
Availability Target 85%
Figure 23. Availability for all three study bus groups
Table 7 provides a summary of the availability and unavailability reasons for each of the three study bus groups. Overall during the evaluation periods, the average availability for the fuel cell bus was 61%, the HHICE bus was 80%, and the CNG buses were 86%. Issues that kept the fuel cell bus out of service included problems with the air conditioning (36%), fuel cell system
32

(33%), and ZEBRA batteries (15%). Issues that kept the HHICE bus out of service included problems with the drive system (55%), lack of hydrogen fuel (43%), and general maintenance activities (2%). Issues that kept the CNG buses out of service included general maintenance and some air conditioning repairs.
Table 7. Summary of Reasons for Availability and Unavailability of Buses for Service Fuel Cell Bus HHICE Bus CNG Buses Category
Number Percent Number Percent Number Percent Planned Work Days 263 284 690 Days Available 160 61 228 80 590 86 Available 160 100 228 100 590 100 On-Route 149 94 210 92 585 99 Event/Demonstration 3 2 3 1 0 0 Training 6 4 13 5 0 0 Not Used 2 0 6 2 5 1 Unavailable 103 100 56 100 100 100 Fuel Cell Propulsion 34 33 ISE Propulsion 9 9 31 55 ZEBRA Battery 16 15 Air Conditioning 36 35 0 0 6 6 Headsign 7 7 SunLine Maintenance 0 0 1 2 94 94 Fueling Unavailable 1 1 24 43
Fuel Economy and Cost Hydrogen fuel is supplied at SunLine by a HyRadix natural gas reformer for compression up to 5,000 psi into vehicles. CNG is brought into the SunLine property via a high-pressure natural gas line and then compressed up to 3,000 psi for delivery into vehicles. SunLine has approved funding to upgrade the Thousand Palms natural gas fueling infrastructure to dispense CNG up to 3,600 psi. SunLine provides both hydrogen and CNG for purchase at its public dispensing island. This has caused SunLine to track all of its fuels in gasoline gallon equivalent (GGE) units for state fuel sales regulations. In the case of hydrogen, the unit used is typically kilograms (kg), and this just so happens to be essentially the same energy equivalent as a GGE. The analysis in this report presents both GGE (or kg for hydrogen) and diesel gallon equivalent (DGE) for hydrogen and CNG fuel consumption. Energy conversion calculations for GGE and DGE are shown in the appendix. Table 8 shows hydrogen and CNG fuel consumption and fuel economy for the three study bus groups during the evaluation periods. Using the GGE fuel economy and the CNG buses as the baseline, the fuel cell bus has a fuel economy 2.5 times higher than the CNG buses and the HHICE bus has a fuel economy 46% higher than the CNG buses. The fuel cell bus has a fuel economy 71% higher than the HHICE bus. Figure 24 shows the average monthly fuel economies for each of the three study groups of buses. The average fuel economy line for the fuel cell bus fluctuates during May through September. This occurred because of the low number of fuelings and limited bus usage during those months due to significant down time, as discussed earlier.
33

SunLine has tracked the utility (electricity, natural gas, and water) costs along with the costs to maintain the HyRadix reformer since the prototype unit was placed into service. They report that hydrogen production has cost $4.26 per kg since the reformer started operation to present. This hydrogen fuel cost for production indicates that the fuel cell bus fuel cost is $0.58 per mile and the HHICE bus fuel cost is $0.99 per mile.
Table 8. Fuel Use and Economy (Evaluation Period)
Bus Mileage (Fuel Base)
Hydrogen (kg) or CNG (GGE)
Miles per kg or GGE
Diesel Equivalent Amount (Gallon)
Miles per Gallon (DGE)
FC1 19,208 2,622.2 7.33 2,320.5 8.28 550 HHICE 23,779 5,513.9 4.29 4,879.6 4.85 563 CNG 25,105 8,592.5 2.92 7,690.3 3.26 565 CNG 23,712 8,083.6 2.93 7,234.8 3.28 566 CNG 15,188 4,947.4 3.07 4,427.9 3.43 567 CNG 22,323 7,546.6 2.96 6,754.2 3.31 568 CNG 22,212 7,379.4 3.01 6,604.6 3.36
CNG Total 108,540 36,549.5 2.97 32,711.8 3.32
0.00
1.00
2.00
3.00
4.00
5.00
6.00
7.00
8.00
9.00
10.00
Jan-06Feb-06
Mar-06
Apr-06
May-06Jun-06
Jul-06
Aug-06
Sep-06Oct-0
6
Nov-06
Mile
s pe
r Gal
lon/
kg
FC1 miles/kg HHICE miles/kg CNG miles/GGE
Figure 24. Monthly average fuel economy (miles per kg or GGE) SunLine provides CNG fuel for its entire bus operation and sells CNG to the public. This large volume of CNG allows SunLine to provide CNG at a reasonable price compared to diesel fuel cost. Over the last six months (June through October 2006), the average price of CNG was $0.98 per gasoline gallon equivalent (GGE). This CNG cost indicates that the CNG buses have a fuel cost of $0.33 per mile. The fuel cell bus hydrogen cost per mile has been 76% higher, and the HHICE hydrogen cost per mile has been three times higher than for the CNG buses.
34

Maintenance Analysis The maintenance cost analysis in this section is only for the evaluation period (FC1 and HHICE: January 2006 through November 2006; CNG: July 2006 through November 2006). It is the intent that warranty costs not be included in the cost-per-mile calculations. More work is required for collecting warranty maintenance costs and ensuring that all these warranty-covered costs have been removed from the analysis. This will be a high priority for the final evaluation report for this site. All work orders for the study buses were collected and analyzed for this evaluation. For consistency, the maintenance labor rate was kept at a constant $50 per hour; this is not reflective of an average rate for SunLine. This section first covers total maintenance costs, then maintenance costs broken down by bus system. Total Maintenance Costs – Total maintenance costs include the price of parts and hourly labor rates of $50 per hour. Cost per mile is calculated as follows:
Cost per mile = ((labor hours * 50) + parts cost) / mileage Table 9 shows total maintenance costs for the fuel cell, HHICE, and CNG buses. The CNG buses have the lowest total maintenance cost per mile of the three study bus groups. The per mile maintenance costs for the fuel cell and HHICE buses are 76% higher and 2.2 times higher, respectively, than the baseline/CNG buses. All three study bus groups were under warranty during the entire evaluation period. Although the HHICE bus is still under warranty, it has higher costs than the fuel cell bus because the SunLine mechanics do much more of the work on the HHICE bus than the fuel cell bus. The fuel cell bus maintenance is done almost exclusively by ISE and UTC Power, except for routine and non-drivetrain maintenance.
Table 9. Total Maintenance Costs (Evaluation Period)
Bus Mileage Parts ($) Labor Hours
Cost ($) per Mile
FC1 19,208 99.80 168.8 0.44 550 HHICE 23,779 1,779.70 224.3 0.55 563 CNG 25,105 622.07 79.8 0.18 565 CNG 23,712 714.43 126.5 0.30 566 CNG 15,188 693.80 76.5 0.30 567 CNG 22,323 1,114.78 84.0 0.24 568 CNG 22,212 791.17 90.8 0.24
Total CNG 108,540 3,936.25 457.5 0.25 Avg. per Bus 21,708 787.25 91.5 --
Maintenance Costs Broken Down by System – Table 10 shows maintenance costs by vehicle system and bus study group (without warranty costs included). The vehicle systems shown in the table include the following:
35

• Cab, Body, and Accessories: Includes body, glass, and paint repairs following accidents; cab and sheet metal repairs on seats and doors; and accessory repairs such as hubodometers and radios
• Propulsion-Related Systems: Repairs for exhaust, fuel, engine, electric motors, fuel cell modules, propulsion control, non-lighting electrical (charging, cranking, and ignition), air intake, cooling, and transmission
• Preventive Maintenance Inspections (PMI): Labor for inspections during preventive maintenance
• Brakes • Frame, Steering, and Suspension • Heating, Ventilation, and Air Conditioning (HVAC) • Lighting • Air System, General • Axles, Wheels, and Drive Shaft • Tires.
The systems with the highest percentage of maintenance costs for the fuel cell bus were propulsion-related; HVAC; and cab, body, and accessories. For the HHICE bus, the three highest cost systems were propulsion-related; PMI; and cab, body, and accessories. The CNG buses had the same three systems as the HHICE bus, but in a slightly different ranking.
Table 10. Breakdown of Vehicle System Maintenance Cost per Mile (Evaluation Period) Fuel Cell HHICE CNG
System Cost per Mile ($)
Percent of Total (%)
Cost per Mile ($)
Percent of Total (%)
Cost per Mile ($)
Percent of Total (%)
Cab, Body, and Accessories 0.07 16 0.06 12 0.08 32
Propulsion-Related 0.17 39 0.33 60 0.06 24 PMI 0.05 11 0.09 16 0.08 32 Brakes 0.01 2 0.00 0 0.00 0 Frame, Steering, and Suspension 0.00 0 0.01 2 0.00 0
HVAC 0.13 30 0.00 0 0.01 4 Lighting 0.01 2 0.03 5 0.01 4 Axles, Wheels, and Drive Shaft 0.00 0 0.00 0 0.00 0
Tires 0.00 0 0.03 5 0.01 4 Total 0.44 100 0.55 100 0.25 100
The cab, body, and accessories category had similar costs/mile for each of the three study bus groups, although the percent of totals were significantly different. The propulsion-related maintenance costs were high for the HHICE and fuel cell buses compared with the CNG buses, with the HHICE bus having the highest cost per mile. For the PMI category, the HHICE and CNG buses had similar costs per mile. The fuel cell bus had significantly lower PMI than the other two study bus groups. This was caused by much of the PMI being done under warranty by the UTC Power and ISE technicians and not the SunLine mechanics. The only other system maintenance category of note is the HVAC system for the fuel cell bus. The air conditioning on the fuel cell bus has required significant maintenance attention and has
36

caused significant unavailability of the bus for service. The problem was with the evaporator and condenser motors, which were failing on a regular basis. SunLine was having difficulty keeping replacement motors in stock to keep the bus available for service. A redesign of the motors was implemented in September 2006, after the heat of the summer had passed. Although this issue appears to be resolved, proof of this will not be possible until next summer. Propulsion-Related Maintenance Costs – The propulsion-related vehicle systems include the exhaust, fuel, engine, electric propulsion, air intake, cooling, non-lighting electrical, and transmission systems. Table 11 categorizes the propulsion-related system repairs for the three study bus groups during the evaluation period (no warranty). Each of the three study groups of buses was under warranty during the entire evaluation period. Also, the fuel cell and HHICE buses were maintained by the UTC Power and ISE technicians when significant repairs to the fuel cell power system or drive system were required. In most cases, the only costs captured here are for support by the SunLine mechanics to the manufacturer technicians.
• Total propulsion-related – The HHICE bus had the highest maintenance costs for these systems, followed by the fuel cell bus. The CNG buses had very low maintenance costs for these systems (as expected because the buses were new and featured fully commercial technology).
• Exhaust – There were little or no costs for this system for the three study groups of buses.
• Fuel – The fuel cell bus had no reported fuel system maintenance costs. The HHICE bus is older than the fuel cell bus and had some maintenance costs for hydrogen fuel line leaks. The CNG buses had some maintenance for small leaks and rerouting of fuel lines (shakedown issues from the new buses).
• Powerplant and electric propulsion – The fuel cell bus maintenance reported here involved almost exclusively SunLine mechanics supporting UTC Power and ISE technicians’ work on the bus. One significant issue was the ZEBRA batteries and the number of problems and changeouts of the three battery packs. The HHICE bus had issues with injectors and the turbocharger, which were repaired under warranty with support from SunLine. The only other repairs were for preventive maintenance. The preventive maintenance for the CNG buses was almost exclusively in the powerplant category (and none for electric propulsion).
• Non-lighting electrical (charging, cranking, and ignition) – The fuel cell bus had almost no costs in this category. The HHICE bus had significant repairs with the standard batteries on the bus (at least 8 changeouts and 4 roadcalls). Other maintenance costs included 2 sets of spark plugs and 2 sets of coils. The CNG buses mostly had preventive maintenance repairs in this category for spark plugs at the 18,000 preventive maintenance cycle for each bus. Other repairs in this category included changeout of all 6 coil boots for one bus, one starter under warranty, and one voltage regulator under warranty.
• Air intake – The fuel cell bus costs in this category were just for support by SunLine mechanics. The HHICE and CNG buses only had air filter changeouts in this category.
37

Table 11. Propulsion-Related Maintenance Costs by System (Evaluation Period) Maintenance System Costs Fuel Cell HHICE CNG
Mileage 19,208 23,779 108,540Total Propulsion-Related Systems (Roll-up) Parts cost ($) 22.39 1,458.76 1,991.58Labor hours 65.0 127.3 77.5Total cost ($) 3,272.39 7,821.26 5,866.58Total cost ($) per mile 0.17 0.33 0.06Exhaust System Repairs Parts cost ($) 0.00 0.00 0.00Labor hours 0.0 0.0 3.0Total cost ($) 0.00 0.00 150.00Total cost ($) per mile 0.00 0.00 0.00Fuel System Repairs Parts cost ($) 0.00 4.00 38.54Labor hours 1.0 8.5 17.3Total cost ($) 50.00 429.00 901.04Total cost ($) per mile 0.00 0.02 0.01Powerplant System Repairs Parts cost ($) 10.01 139.70 1,242.31Labor hours 27.5 70.0 8.8Total cost ($) 1,385.01 3,639.70 1,679.81Total cost ($) per mile 0.07 0.15 0.02Electric Propulsion System Repairs Parts cost ($) 0.00 0.00 0.00Labor hours 23.5 0.8 0.0Total cost ($) 1,175.00 37.50 0.00Total cost ($) per mile 0.06 0.00 0.00Non-Lighting Electrical System Repairs (General Electrical, Charging, Cranking, Ignition) Parts cost ($) 0.00 1,201.26 223.77Labor hours 1.5 38.5 32.3Total cost ($) 75.00 3,126.26 1,836.27Total cost ($) per mile 0.00 0.13 0.02Air Intake System Repairs Parts cost ($) 0.00 104.80 284.89Labor hours 6.5 2.5 0.0Total cost ($) 325.00 229.80 284.89Total cost ($) per mile 0.02 0.01 0.00Cooling System Repairs Parts cost ($) 12.38 9.00 8.75Labor hours 5.0 7.0 15.5Total cost ($) 262.38 359.00 783.75Total cost ($) per mile 0.01 0.02 0.01Transmission System Repairs Parts cost ($) 0.00 0.00 193.32Labor hours 0.0 0.0 0.8Total cost ($) 0.00 0.00 230.82Total cost ($) per mile 0.00 0.00 0.00
38

• Cooling – The fuel cell bus had little cost in this category. The HHICE bus had maintenance for problems with the low coolant sensor (replaced 3 times and caused 2 roadcalls). The CNG buses only had shake down issues for new buses for securing coolant lines and alarms.
• Transmission – Only the CNG buses had costs in this category for filters under preventive maintenance.
Roadcall Analysis A roadcall (RC) or revenue vehicle system failure (as named in the National Transit Database) is defined as a failure of an in-service bus that causes the bus to be replaced on route or causes a significant delay in schedule. If the problem with the bus can be repaired during a layover and the schedule is kept, this is not considered a RC. The analysis provided here only includes RCs that were caused by “chargeable” failures. Chargeable RCs include systems that can physically disable the bus from operating on route, such as interlocks (doors and wheelchair lift), engine, etc. They do not include RCs for things such as radios, HVAC, or destination signs. Table 12 shows the RCs and miles between roadcalls (MBRC) for each study bus in two categories: all RCs and propulsion-related-only RCs. The CNG buses have had very few roadcalls. The fuel cell and HHICE buses have had several roadcalls and low vehicle usage, which is indicative of the prototype nature of these two buses. Compared to the fuel cell bus, the HHICE bus has slightly higher MBRC rates for both the all-roadcalls category and the propulsion-only category.
Table 12. Roadcalls and MBRC (Evaluation Period)
Bus Mileage All Roadcalls All MBRC Propulsion
Roadcalls Propulsion
MBRC FC1 19,208 22 873 17 1,130 550 HHICE 23,779 10 2,378 8 2,972 563 CNG 25,105 3 8,368 1 25,105 565 CNG 23,712 0 0 566 CNG 15,188 1 15,188 0 567 CNG 22,323 2 11,162 0 568 CNG 22,212 0 0 Total CNG 108,540 6 18,090 1 108,540
39

What’s Next for This Demonstration? This report covers SunLine operation of the fuel cell, HHICE, and CNG buses through November 2006. The next evaluation report for this site will include at least 12 months of operation for the CNG buses, which will require that the evaluation period run through at least June 2007. The next evaluation report is planned for release around November 2007. As described above, SunLine is also a recipient of a grant from the FTA for its National Fuel Cell Bus Program. This grant includes $2.8 million to support the development of a new fuel cell bus design and demonstration at SunLine. The partners in this effort are New Flyer Bus, ISE Corp., and UTC Power. SunLine was also listed as a partner for accelerated testing of the Van Hool fuel cell buses with AC Transit. FTA, DOE, and NREL plan to work together to continue evaluations of the NFCBP and other hydrogen and fuel cell-related transit operations.
40

Contacts DOE 1000 Independence Ave., SW Washington, DC 20585 Sigmund Gronich Technology Validation Manager Office of Hydrogen, Fuel Cells, and Infrastructure Technologies Phone: 202-586-1623 E-mail: [email protected] NREL 1617 Cole Boulevard Golden, CO 80401 Leslie Eudy Senior Project Leader Phone: 303-275-4412 E-mail: [email protected] SunLine 32-505 Harry Oliver Trail Thousand Palms, CA 92276 Tommy Edwards Director of Maintenance Phone: 760-343-3456 E-mail: [email protected] UTC Power 195 Governor’s Highway South Windsor, CT 06074 Michael Tosca Senior Product Manager Phone: 860-727-7324 E-mail: [email protected] Matthew Riley Systems Engineer Phone: 860-727-2864 E-mail: [email protected]
ISE Corporation 12302 Kerran Street Poway, CA 92064 Paul Scott Chief Scientific Officer Phone: 858-413-1742 E-mail: [email protected] Tavin Tyler Director of Prototype Programs Phone: 858-413-1745 E-mail: [email protected] Ford Motor Company Ford Scientific Research Laboratories 2101 Village Road Dearborn, MI 48121 Bob Natkin Technical & Group Leader for H2 IC Engine Applications Powertrain Research Dept. Phone: 313-322-1725 E-mail: [email protected] New Flyer Winnipeg, Manitoba Canada R2J 4B9 Paul Zanetel Chief Technical Advisor Phone: 204-982-8180 E-mail: [email protected] HyRadix 175 West Oakton Street Des Plaines, IL 60018 Terry Schuster Director of Sales Phone: 630-416-7425 E-mail: [email protected]
41

Van Hool Battelle Bernard Van Hoolstraat 58 505 King Avenue B-2500 Lier Koningshooikt Columbus, OH 43201 Belgium Kevin Chandler Paul Jenné Program Manager Automotive Relations Phone: 614-424-5127 Phone : +32 (3) 420 22 10 E-mail: [email protected] E-mail: [email protected]
42
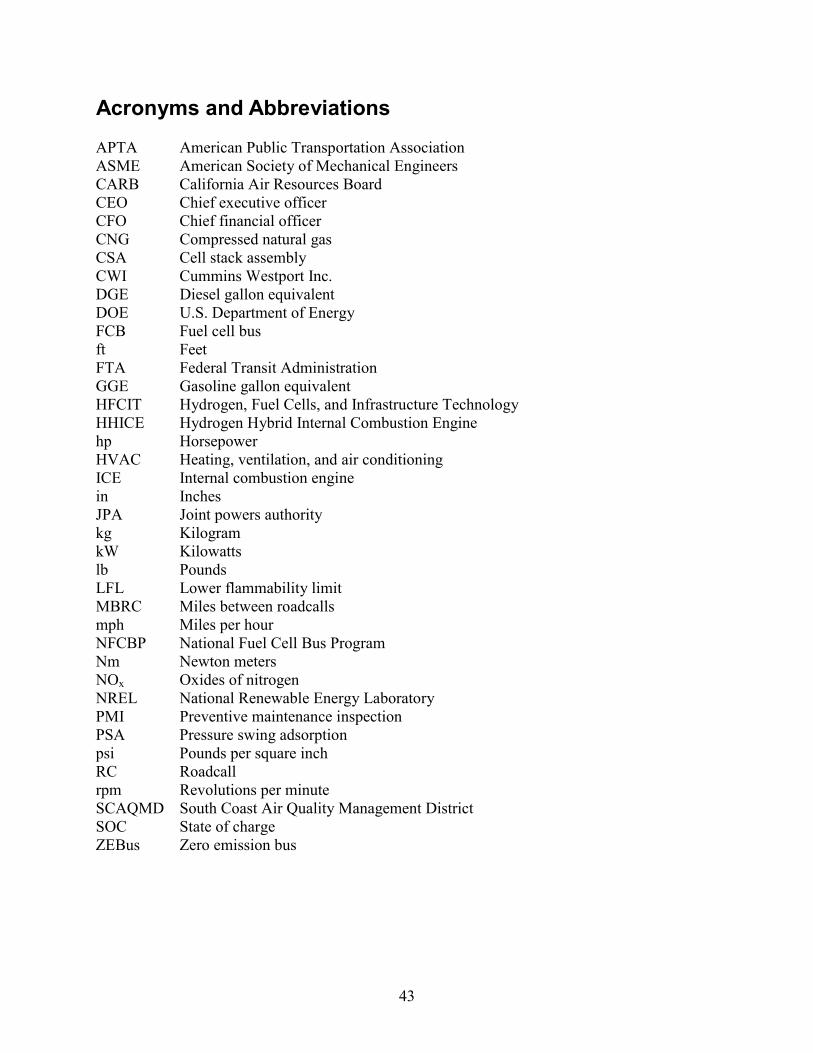
Acronyms and Abbreviations APTA American Public Transportation Association ASME American Society of Mechanical Engineers CARB California Air Resources Board CEO Chief executive officer CFO Chief financial officer CNG Compressed natural gas CSA Cell stack assembly CWI Cummins Westport Inc. DGE Diesel gallon equivalent DOE U.S. Department of Energy FCB Fuel cell bus ft Feet FTA Federal Transit Administration GGE Gasoline gallon equivalent HFCIT Hydrogen, Fuel Cells, and Infrastructure Technology HHICE Hydrogen Hybrid Internal Combustion Engine hp Horsepower HVAC Heating, ventilation, and air conditioning ICE Internal combustion engine in Inches JPA Joint powers authority kg Kilogram kW Kilowatts lb Pounds LFL Lower flammability limit MBRC Miles between roadcalls mph Miles per hour NFCBP National Fuel Cell Bus Program Nm Newton meters NOx Oxides of nitrogen NREL National Renewable Energy Laboratory PMI Preventive maintenance inspection PSA Pressure swing adsorption psi Pounds per square inch RC Roadcall rpm Revolutions per minute SCAQMD South Coast Air Quality Management District SOC State of charge ZEBus Zero emission bus
43

References and Related Reports Chandler, K., Eudy, L., 2006, Santa Clara Valley Transportation Authority and San Mateo County Transit District, Fuel Cell Transit Buses: Evaluation Results, National Renewable Energy Laboratory, Golden, CO, NREL/TP-560-40615 NREL, 2006, SunLine Tests HHICE Bus in Desert Climate, National Renewable Energy Laboratory, Golden, CO, DOE/GO-102006-2333 NREL, 2006, AC Transit Demos Three Prototype Fuel Cell Buses, National Renewable Energy Laboratory, Golden, CO, DOE/GO-102006-2286 NREL, 2006, SunLine Expands Horizons with Fuel Cell Bus Demo, National Renewable Energy Laboratory, Golden, CO, DOE/GO-102006-2287 Chandler, K., 2006, Ten Years of Compressed Natural Gas (CNG) Operations at SunLine Transit Agency, National Renewable Energy Laboratory, Golden, CO, NREL/SR-540-39180 NREL, 2005, VTA, SamTrans Look into Future with Bus Demo, National Renewable Energy Laboratory, Golden, CO, DOE/GO-102005-2147 NREL, 2005, Draft Fuel Cell Transit Bus Evaluation Plan, National Renewable Energy Laboratory, Golden, CO EvoBus GmbH, 2004, Clean Urban Transport for Europe (CUTE), A Fuel Cell Bus Project in Nine European Cities, EvoBus, Ulm, Germany Chandler, K., Eudy, L., 2003, ThunderPower Bus Evaluation at SunLine Transit Agency, National Renewable Energy Laboratory, Golden, CO, DOE/GO-102003-1786 NREL, 2003, SunLine Test Drives Hydrogen Bus, National Renewable Energy Laboratory, Golden, CO, DOE/GO-102003-1768 NREL, 2002, General Evaluation Plan, Fleet Test & Evaluation Projects, National Renewable Energy Laboratory, Golden, CO, NREL/BR-540-32392 College of the Desert, 2001, Hydrogen Fuel Cell Engines and Related Technologies (Course Materials, Modules 1-11), College of the Desert, Palm Desert, CA Reports from DOE/NREL evaluations can be downloaded via the following Web sites: Hydrogen and fuel cell related: www.nrel.gov/hydrogen/proj_fc_bus_eval.htmlHybrid and other technologies: www.nrel.gov/vehiclesandfuels/fleettest/publications_bus.html
44

Appendix: Fleet Summary Statistics Fleet Summary Statistics: SunLine Transit Agency FCB, HHICE, and CNG Study Groups Fleet Operations and Economics Fuel Cell HHICE CNG Number of Vehicles 1 1 5Period Used for Fuel and Oil Op Analysis 1/06-11/06 1/06-11/06 7/06-11/06Total Number of Months in Period 11 11 5Fuel and Oil Analysis Base Fleet Mileage 19,208 23,661 108,540Period Used for Maintenance Op Analysis 1/06-11/06 1/06-11/06 7/06/11/06Total Number of Months in Period 11 11 5Maintenance Analysis Base Fleet Mileage 19,208 23,779 108,540Average Monthly Mileage per Vehicle 1,746 2,162 4,342Availability 61% 80% 86%Fleet Fuel Usage in CNG GGE/H2 kg 2,622 5,514 36,550Roadcalls 22 10 6RCs MBRC 873 2,378 18,090Propulsion Roadcalls 17 8 1Propulsion MBRC 1,130 2,972 108,540 Fleet Miles/kg Hydrogen or CNG GGE 7.33 4.29 2.97(1.13 kg H2/gal Diesel Fuel) Representative Fleet MPG (energy equiv.) 8.28 4.85 3.32 Hydrogen Cost per kg 4.26 4.26 Cost per Gasoline Gallon Equivalent 0.98Fuel Cost per Mile 0.58 0.99 0.33 Total Scheduled Repair Cost per Mile 0.08 0.10 0.11Total Unscheduled Repair Cost per Mile 0.37 0.45 0.13Total Maintenance Cost per Mile 0.44 0.55 0.25 Total Operating Cost per Mile 1.03 1.54 0.58
Maintenance Costs Fuel Cell HHICE CNG Fleet Mileage 19,208 23,779 108,540 Total Parts Cost 99.80 1,779.20 3,936.25Total Labor Hours 168.8 224.3 457.5Average Labor Cost (@ $50.00 per hour) 8,437.50 11,212.50 22,875.00 Total Maintenance Cost 8,537.30 12,991.70 26,811.25Total Maintenance Cost per Bus 8,537.30 12,991.70 5,362.25Total Maintenance Cost per Mile 0.44 0.55 0.25
45
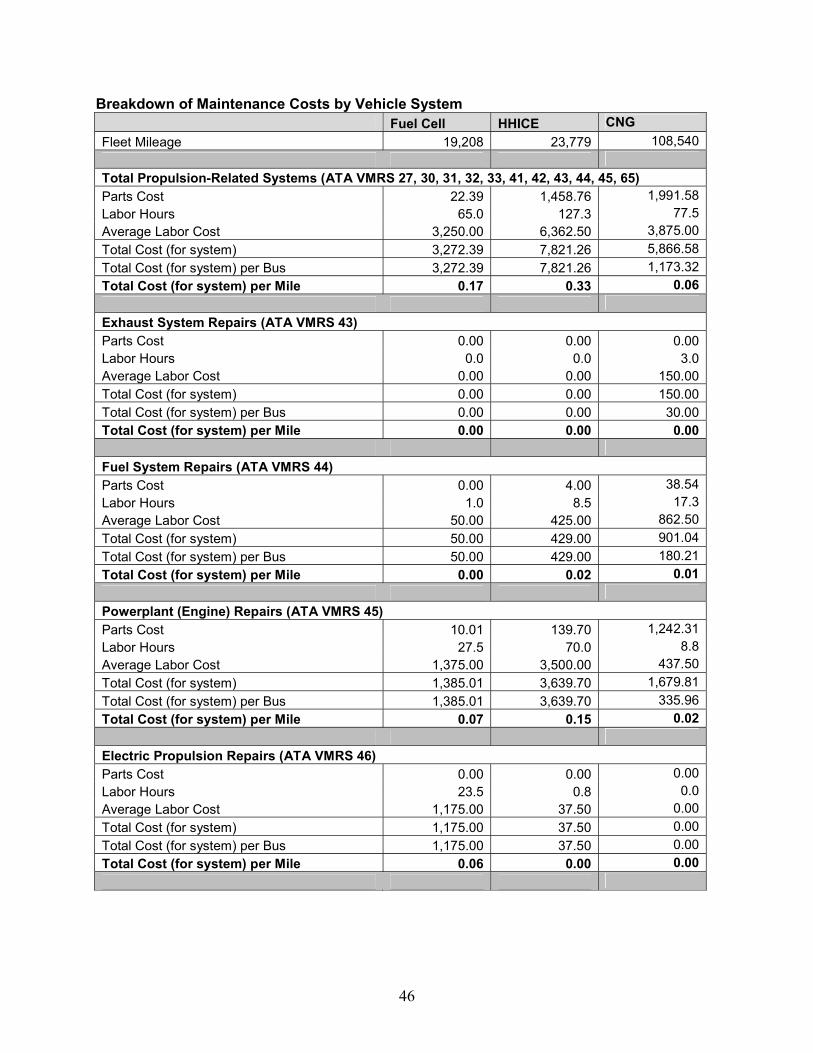
Breakdown of Maintenance Costs by Vehicle System Fuel Cell HHICE CNG Fleet Mileage 19,208 23,779 108,540 Total Propulsion-Related Systems (ATA VMRS 27, 30, 31, 32, 33, 41, 42, 43, 44, 45, 65) Parts Cost 22.39 1,458.76 1,991.58Labor Hours 65.0 127.3 77.5Average Labor Cost 3,250.00 6,362.50 3,875.00Total Cost (for system) 3,272.39 7,821.26 5,866.58Total Cost (for system) per Bus 3,272.39 7,821.26 1,173.32Total Cost (for system) per Mile 0.17 0.33 0.06 Exhaust System Repairs (ATA VMRS 43) Parts Cost 0.00 0.00 0.00Labor Hours 0.0 0.0 3.0Average Labor Cost 0.00 0.00 150.00Total Cost (for system) 0.00 0.00 150.00Total Cost (for system) per Bus 0.00 0.00 30.00Total Cost (for system) per Mile 0.00 0.00 0.00 Fuel System Repairs (ATA VMRS 44) Parts Cost 0.00 4.00 38.54Labor Hours 1.0 8.5 17.3Average Labor Cost 50.00 425.00 862.50Total Cost (for system) 50.00 429.00 901.04Total Cost (for system) per Bus 50.00 429.00 180.21Total Cost (for system) per Mile 0.00 0.02 0.01 Powerplant (Engine) Repairs (ATA VMRS 45) Parts Cost 10.01 139.70 1,242.31Labor Hours 27.5 70.0 8.8Average Labor Cost 1,375.00 3,500.00 437.50Total Cost (for system) 1,385.01 3,639.70 1,679.81Total Cost (for system) per Bus 1,385.01 3,639.70 335.96Total Cost (for system) per Mile 0.07 0.15 0.02 Electric Propulsion Repairs (ATA VMRS 46) Parts Cost 0.00 0.00 0.00Labor Hours 23.5 0.8 0.0Average Labor Cost 1,175.00 37.50 0.00Total Cost (for system) 1,175.00 37.50 0.00Total Cost (for system) per Bus 1,175.00 37.50 0.00Total Cost (for system) per Mile 0.06 0.00 0.00
46

Breakdown of Maintenance Costs by Vehicle System (continued) Fuel Cell HHICE CNG Electrical System Repairs (ATA VMRS 30-Electrical General, 31-Charging, 32-Cranking, 33-Ignition) Parts Cost 0.00 1,201.26 223.77Labor Hours 1.5 38.5 32.3Average Labor Cost 75.00 1,925.00 1,612.50Total Cost (for system) 75.00 3,126.26 1,836.27Total Cost (for system) per Bus 75.00 3,126.26 367.25Total Cost (for system) per Mile 0.00 0.13 0.02 Air Intake System Repairs (ATA VMRS 41) Parts Cost 0.00 104.80 284.89Labor Hours 6.5 2.5 0.0Average Labor Cost 325.00 125.00 0.00Total Cost (for system) 325.00 229.80 284.89Total Cost (for system) per Bus 325.00 229.80 56.98Total Cost (for system) per Mile 0.02 0.01 0.00 Cooling System Repairs (ATA VMRS 42) Parts Cost 12.38 9.00 8.75Labor Hours 5.0 7.0 15.5Average Labor Cost 250.00 350.00 775.00Total Cost (for system) 262.38 359.00 783.75Total Cost (for system) per Bus 262.38 359.00 156.75Total Cost (for system) per Mile 0.01 0.02 0.01 General Air System Repairs (ATA VMRS 10) Parts Cost 0.00 0.00 0.00Labor Hours 0.0 0.0 2.0Average Labor Cost 0.00 0.00 100.00Total Cost (for system) 0.00 0.00 100.00Total Cost (for system) per Bus 0.00 0.00 20.00Total Cost (for system) per Mile 0.00 0.00 0.00 Brake System Repairs (ATA VMRS 13) Parts Cost 0.00 0.00 1.82Labor Hours 5.5 1.5 2.5Average Labor Cost 275.00 75.00 125.00Total Cost (for system) 275.00 75.00 126.82Total Cost (for system) per Bus 275.00 75.00 25.36Total Cost (for system) per Mile 0.01 0.00 0.00
47

Breakdown of Maintenance Costs by Vehicle System (continued) Fuel Cell HHICE CNG Transmission Repairs (ATA VMRS 27) Parts Cost 0.00 0.00 193.32Labor Hours 0.0 0.0 0.8Average Labor Cost 0.00 0.00 37.50Total Cost (for system) 0.00 0.00 230.82Total Cost (for system) per Bus 0.00 0.00 46.16Total Cost (for system) per Mile 0.00 0.00 0.00 Inspections Only – No Parts Replacements (101) Parts Cost 0.00 0.00 0.00Labor Hours 21.0 40.5 177.0Average Labor Cost 1,050.00 2,025.00 8,850.00Total Cost (for system) 1,050.00 2,025.00 8,850.00Total Cost (for system) per Bus 1,151.00 2,025.00 1,770.00Total Cost (for system) per Mile 0.05 0.09 0.08 HVAC System Repairs (ATA VMRS 01) Parts Cost 0.00 0.00 220.22Labor Hours 51.3 1.5 18.0Average Labor Cost 2,562.50 75.00 900.00Total Cost (for system) 2,562.50 75.00 1,120.22Total Cost (for system) per Bus 2,562.50 75.00 224.04Total Cost (for system) per Mile 0.13 0.00 0.01 Cab, Body, and Accessories Systems Repairs (ATA VMRS 02-Cab and Sheet Metal, 50-Accessories, 71-Body) Parts Cost 65.91 123.46 1,598.68Labor Hours 24.0 27.3 149.0Average Labor Cost 1,200.00 1,362.50 7,450.00Total Cost (for system) 1,265.91 1,485.96 9,048.68Total Cost (for system) per Bus 1,265.91 1,485.96 1,809.74Total Cost (for system) per Mile 0.07 0.06 0.08 Lighting System Repairs (ATA VMRS 34) Parts Cost 11.50 196.98 56.65Labor Hours 1.5 9.3 11.8Average Labor Cost 75.00 462.50 587.50Total Cost (for system) 86.50 659.48 644.15Total Cost (for system) per Bus 86.50 659.48 128.83Total Cost (for system) per Mile 0.00 0.03 0.01
48

Breakdown of Maintenance Costs by Vehicle System (continued) Fuel Cell HHICE CNG Frame, Steering, and Suspension Repairs (ATA VMRS 14-Frame, 15-Steering, 16-Suspension) Parts Cost 0.00 0.00 67.30Labor Hours 0.5 3.5 3.3Average Labor Cost 25.00 175.00 162.50Total Cost (for system) 25.00 175.00 229.80Total Cost (for system) per Bus 25.00 175.00 45.96Total Cost (for system) per Mile 0.00 0.01 0.00 Axle, Wheel, and Drive Shaft Repairs (ATA VMRS 11-Front Axle, 18-Wheels, 22-Rear Axle, 24-Drive Shaft) Parts Cost 0.00 0.00 0.00Labor Hours 0.0 1.5 0.0Average Labor Cost 0.00 75.00 0.00Total Cost (for system) 0.00 75.00 0.00Total Cost (for system) per Bus 0.00 75.00 0.00Total Cost (for system) per Mile 0.00 0.00 0.00 Tire Repairs (ATA VMRS 17) Parts Cost 0.00 0.00 0.00Labor Hours 0.0 12.0 16.5Average Labor Cost 0.00 600.00 825.00Total Cost (for system) 0.00 600.00 825.00Total Cost (for system) per Bus 0.00 600.00 165.00Total Cost (for system) per Mile 0.00 0.03 0.01
49

Notes 1. To compare the hydrogen fuel dispensed and fuel economy to diesel, the hydrogen dispensed
was also converted into diesel energy equivalent gallons. The general energy conversions are as follows, actual energy content will vary by location:
Lower heating value (LHV) for hydrogen = 51,532 Btu/lb LHV for diesel = 128,400 Btu/lb 1 kg = 2.205 * lb 51,532 Btu/lb * 2.205 lb/kg = 113,628 Btu/kg Diesel/hydrogen = 128,400 Btu/gallon / 113,628 Btu/kg = 1.13 kg/diesel gallon The gasoline LHV or GGE is 115,000 Btu/gal, which is approximately 1% higher than 113,628 Btu/kg for hydrogen; these have been called equivalent for this report. Gasoline/Diesel = 115,000 Btu/gallon / 128,400 Btu/gallon = 0.896
2. The propulsion-related systems were chosen to include only those vehicle systems that could be directly impacted by the selection of a fuel/advanced technology.
3. ATA VMRS coding is based on parts that were replaced. If there was no part replaced in a given
repair, then the code was chosen by the system being worked on.
4. In general, inspections (with no part replacements) were only included in the overall totals (not by system). 101 was created to track labor costs for PM inspections.
5. ATA VMRS 02-Cab and Sheet Metal represents seats, doors, etc.; ATA VMRS 50-Accessories
represents things like fire extinguishers, test kits, etc.; ATA VMRS 71-Body represent mostly windows and windshields.
6. Average labor cost is assumed to be $50 per hour. 7. Warranty costs are not included.
50

Appendix: Fleet Summary Statistics – SI Units Fleet Summary Statistics: SunLine Transit Agency FCB, HHICE, and CNG Study Groups Fleet Operations and Economics Fuel Cell HHICE CNG Number of Vehicles 1 1 5Period Used for Fuel and Oil Op Analysis 1/06-11/06 1/06-11/06 7/06-11/06Total Number of Months in Period 11 11 5Fuel and Oil Analysis Base Fleet Kilometers 30,911 38,078 174,673Period Used for Maintenance Op Analysis 1/06-11/06 1/06-11/06 7/06-11/06Total Number of Months in Period 11 11 5Maintenance Analysis Base Fleet Kilometers 30,911 38,268 174,673Average Monthly Kilometers per Vehicle 2,810 3,479 6,988Availability 61% 80% 86%Fleet Fuel Usage in Gasoline L/H2 kg 2,622 5,514 138,342Roadcalls 22 10 6Kilometers between Roadcalls (KBRC) 1,405 3,827 29,112Propulsion Roadcalls 17 8 1Propulsion KBRC 1,818 4,784 174,673 Fleet kg Hydrogen/100 km 8.48 14.48 Representative Fleet MPG (L/100 km) 32.11 54.81 79.20 Hydrogen Cost per kg 4.26 4.26 CNG Cost per Liter (based on GGE) 0.26Fuel Cost per Kilometer 0.36 0.62 0.21 Total Scheduled Repair Cost per Kilometer 0.05 0.06 0.07Total Unscheduled Repair Cost per Kilometer 0.23 0.28 0.08Total Maintenance Cost per Kilometer 0.28 0.34 0.15 Total Operating Cost per Kilometer 0.64 0.96 0.36
Maintenance Costs Fuel Cell HHICE CNG Fleet Kilometers 30,911 38,078 174,673 Total Parts Cost 99.80 1,779.20 3,936.25Total Labor Hours 168.8 224.3 457.5Average Labor Cost (@ $50.00 per hour) 8,437.50 11,212.50 22,875.00 Total Maintenance Cost 8,537.30 12,991.70 26,811.25Total Maintenance Cost per Bus 8,537.30 12,991.70 5,362.55Total Maintenance Cost per Kilometer 0.28 0.34 0.15
51

REPORT DOCUMENTATION PAGE Form Approved OMB No. 0704-0188
The public reporting burden for this collection of information is estimated to average 1 hour per response, including the time for reviewing instructions, searching existing data sources, gathering and maintaining the data needed, and completing and reviewing the collection of information. Send comments regarding this burden estimate or any other aspect of this collection of information, including suggestions for reducing the burden, to Department of Defense, Executive Services and Communications Directorate (0704-0188). Respondents should be aware that notwithstanding any other provision of law, no person shall be subject to any penalty for failing to comply with a collection of information if it does not display a currently valid OMB control number. PLEASE DO NOT RETURN YOUR FORM TO THE ABOVE ORGANIZATION. 1. REPORT DATE (DD-MM-YYYY)
February 2007 2. REPORT TYPE
Technical Report 3. DATES COVERED (From - To)
5a. CONTRACT NUMBER
DE-AC36-99-GO10337
5b. GRANT NUMBER
4. TITLE AND SUBTITLE SunLine Transit Agency, Hydrogen-Powered Buses: Preliminary Evaluation Results
5c. PROGRAM ELEMENT NUMBER
5d. PROJECT NUMBER NREL/TP-560-41001
5e. TASK NUMBER H270.8200
6. AUTHOR(S) K. Chandler, Battele L. Eudy, NREL
5f. WORK UNIT NUMBER
7. PERFORMING ORGANIZATION NAME(S) AND ADDRESS(ES) National Renewable Energy Laboratory 1617 Cole Blvd. Golden, CO 80401-3393
8. PERFORMING ORGANIZATION REPORT NUMBER NREL/TP-560-41001
10. SPONSOR/MONITOR'S ACRONYM(S) NREL
9. SPONSORING/MONITORING AGENCY NAME(S) AND ADDRESS(ES)
11. SPONSORING/MONITORING AGENCY REPORT NUMBER
12. DISTRIBUTION AVAILABILITY STATEMENT National Technical Information Service U.S. Department of Commerce 5285 Port Royal Road Springfield, VA 22161
13. SUPPLEMENTARY NOTES
14. ABSTRACT (Maximum 200 Words) This paper provides preliminary results from an evaluation by DOE's National Renewable Energy Laboratory of hydrogen-powered transit buses at SunLine Transit Agency.
15. SUBJECT TERMS hydrogen-powered transit buses; hydrogen bus; technology validation; SunLine Transit Agency; hydrogen fuel cell bus evaluation
16. SECURITY CLASSIFICATION OF: 19a. NAME OF RESPONSIBLE PERSON a. REPORT
Unclassified b. ABSTRACT Unclassified
c. THIS PAGE Unclassified
17. LIMITATION OF ABSTRACT
UL
18. NUMBER OF PAGES
19b. TELEPONE NUMBER (Include area code)
Standard Form 298 (Rev. 8/98) Prescribed by ANSI Std. Z39.18