Summary Report THE COAST OF HAWKE’S BAY: · PDF fileTHE COAST OF HAWKE’S BAY:...
32
Summary Report THE COAST OF HAWKE’S BAY: PROCESSES & EROSION PROBLEMS Paul D. Komar, Ph.D. Coastal Oceanographer January 2007 Report No. AM 07/02 HBRC Plan No. 3918
Transcript of Summary Report THE COAST OF HAWKE’S BAY: · PDF fileTHE COAST OF HAWKE’S BAY:...

Summary Report
THE COAST OF HAWKE’S BAY:PROCESSES &
EROSION PROBLEMS
Paul D. Komar, Ph.D.Coastal Oceanographer
January 2007Report No. AM 07/02HBRC Plan No. 3918

Asset Management Group
Technical Report
ISSN 1174 3085
Asset Management
Summary Report THE COAST OF HAWKE’S BAY: PROCESSES & EROSION PROBLEMS
Prepared by: Paul D. Komar, Ph.D. Coastal Oceanographer
January 2007
Report No. AM 07/02 HBRC Plan No. 3918
© Copyright: Hawke’s Bay Regional Council

1
Summary Report
THE COAST OF HAWKE’S BAY:
PROCESSES & EROSION PROBLEMS
Paul D. Komar, Ph.D. Coastal Oceanographer
January 2007
The coast has a unique position on the Earth, being the location where the three great realms of our planet meet — the land, ocean and atmosphere. In this critical position the coast is an extremely dynamic environment. Rivers drain the land and deliver sediments to its shore, which accumulate in beaches and build out the land. In conflict with this expansion of the land is the action of the ocean, assisted by the atmosphere whose storms generate waves that travel across the sea with the seeming intent of expending their energy in the destruction of the land. A fourth factor has entered into this conflict — the desire of people to live within the coastal zone and to "control" the natural processes that oppose our aspirations and developments. This conflict is evident on the coast of Hawke’s Bay. For thousands of years, rivers such as the Tukituki carried gravel and sand to its shore, building out the Heretaunga Plains and forming its beaches. Every few years a major storm generates high tides and extreme waves that combine to cut back the shore and flood the low-lying areas of the Plains. The shoreline has migrated tens of kilometres, back and forth under the varying levels of the sea caused by the cycles between the growth and melting of glaciers during Earth’s Ice Ages. At times earthquakes have shaken the Hawke’s Bay region, abruptly changing the elevations of the land and shoreline positions, sometimes lowering the land, at other times raising it. Humans reached is shores, first the Maori about eight hundred years ago and then European settlers beginning in the 19th century, with each group having altered the environments of Hawke’s Bay. These alterations affected the watersheds of the rivers and the quantities of sediments that are delivered to the coast, and affected the coast itself by the extraction of beach sediments and in the construction of the harbour facilities in Napier. For many individuals settlement included the desire to have their home front onto the ocean shore, providing a view of the sea and with the beach being an extension of their domain. At times this has brought them into the zone of conflict between the land and sea, with the tides and waves of storms threatening the loss of their homes. Programs of coastal-zone management have been developed to be the negotiator between Nature, with its arsenal of potentially destructive forces, and humans who choose to live along the ocean’s shore. To serve in that role, it is necessary to have a firm understanding of those forces of Nature, for example to be able to predict the most extreme combinations of waves and tides that might attack the properties, and to assess longer-term changes such as future sea levels during the next 50 to 100 years, the expected life of homes being constructed along the shore. This has been the role of the agencies responsible for the management of the Hawke’s Bay shore, and in this capacity they have undertaken programs to monitor the coast, including annual surveys of the beaches to determine whether they are undergoing progressive erosion under the storms over the years, or have been gaining width wherever sediments have been supplied faster than the waves could carry it away. These agencies have also sponsored investigations by coastal scientists and engineers to study the ocean processes, and ultimately to utilize their data to establish hazard zones along the shores of Hawke’s Bay, in effect to map out the potential zone of conflict between the ocean and land in order to keep people’s homes out of that zone.

2
In 2003 I was hired to be the Independent Facilitator for Coastal Issues, to work with the Hawke’s Bay Regional Council, the Napier City Council, and the Port of Napier Ltd, advising them on issues dealing with investigations of the Hawke’s Bay coast and its management. This led to my preparing a report, HAWKE’S BAY, NEW ZEALAND: ENVIRONMENTAL CHANGES, SHORELINE EROSION AND MANAGEMENT ISSUES, a comprehensive review that includes aspects of the tectonics and geology of the region, the ocean processes of waves, tides and changing sea levels, and the consequences of human settlement and our modifications of the region’s environments that have affected the coast. By necessity that report became rather long, and included technical material derived from the scientific and engineering studies. The objective here is to present a much condensed version of that report, more suited to a general audience who wish to know more about the ocean processes and other factors that affect the shores of Hawke’s Bay, and specifically might represent a threat to the safety of their homes.
Tectonics & Geology The foundation of any coast depends on its tectonics and geology — the geology of the region refers to the types of rocks found there, while its tectonics represent the Earth’s forces that are responsible for the occurrence of earthquakes and the formation of the mountains that contain those rocks. This is true for New Zealand, with the geology and tectonics of Hawke’s Bay being especially important to the evolution of its coast, and to the present-day hazards of living there. In the 1960s scientists began to develop a fuller awareness of the mobility and impermanence of the Earth's surface. The concept of what has become known as plate tectonics arose primarily from discoveries in the ocean's depths, where chains of mountains were found forming continuous ridges circling the Earth. These ridges are characterized by high earthquake activity and unusual rates of heat flow from within the interior of the Earth, evidence for their ongoing tectonic activity. This chain of ridges is now recognized as the zone where new ocean crust is being formed as molten rock arrives from the interior of the Earth, filling the fracture zone at the spreading ridges where the crust is being pulled apart. This newly formed crust moves in opposite directions away from the ridge, giving rise to areas of tectonic plates that completely cover the Earth's surface (there are 12 major plates, with a number of small plates). With the continents being less dense than the ocean rocks, they are in effect rafted along within these moving plates. Taken alone, the formation of new crust at the ocean ridges might imply that the surface area of the Earth is slowly increasing. This would be the case except that crust is simultaneously being destroyed by a process termed "subduction", occurring in zones where adjacent plates are colliding. This collision results in the down buckling of one of the plates as it gives way and slides beneath the other, forming a submarine trench in the sea floor as the surface expression of this subduction. The slab of descending ocean crust scrapes against the underside of the plate that is not being subducted, resulting in a zone of intense earthquake activity, including the strongest quakes experienced on Earth (magnitudes greater than 9).
3
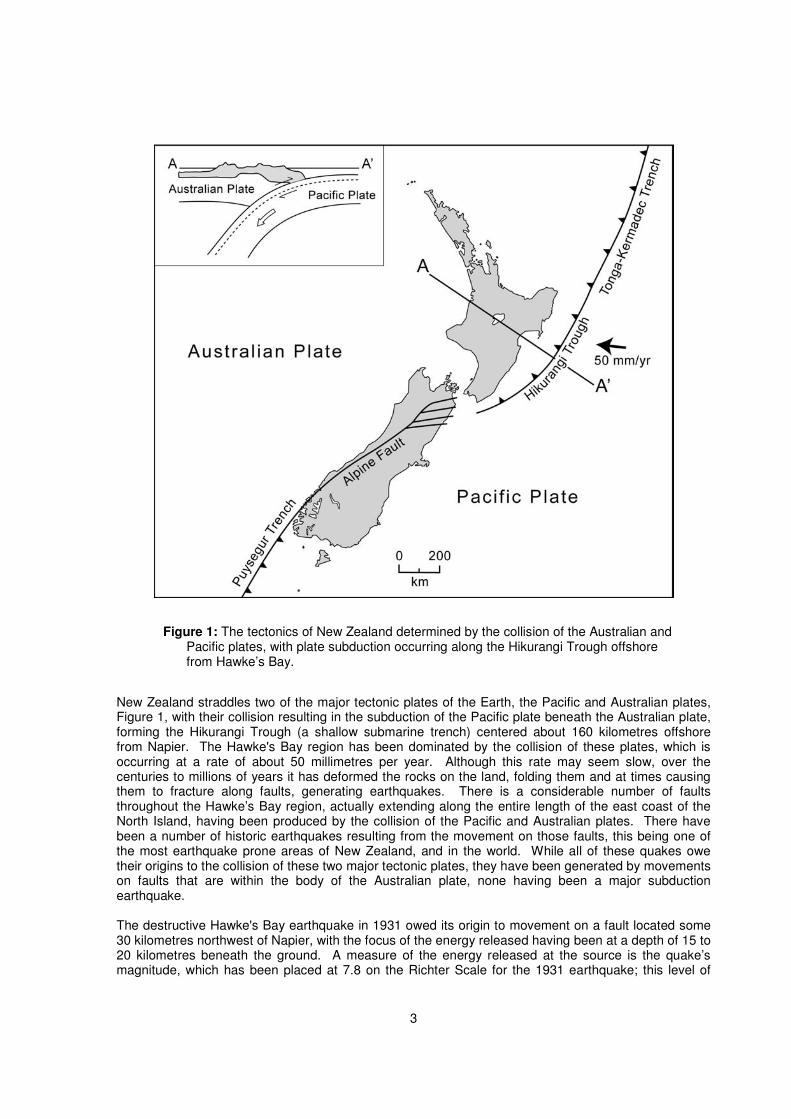
Figure 1: The tectonics of New Zealand determined by the collision of the Australian and Pacific plates, with plate subduction occurring along the Hikurangi Trough offshore from Hawke’s Bay.
New Zealand straddles two of the major tectonic plates of the Earth, the Pacific and Australian plates, Figure 1, with their collision resulting in the subduction of the Pacific plate beneath the Australian plate, forming the Hikurangi Trough (a shallow submarine trench) centered about 160 kilometres offshore from Napier. The Hawke's Bay region has been dominated by the collision of these plates, which is occurring at a rate of about 50 millimetres per year. Although this rate may seem slow, over the centuries to millions of years it has deformed the rocks on the land, folding them and at times causing them to fracture along faults, generating earthquakes. There is a considerable number of faults throughout the Hawke’s Bay region, actually extending along the entire length of the east coast of the North Island, having been produced by the collision of the Pacific and Australian plates. There have been a number of historic earthquakes resulting from the movement on those faults, this being one of the most earthquake prone areas of New Zealand, and in the world. While all of these quakes owe their origins to the collision of these two major tectonic plates, they have been generated by movements on faults that are within the body of the Australian plate, none having been a major subduction earthquake. The destructive Hawke's Bay earthquake in 1931 owed its origin to movement on a fault located some 30 kilometres northwest of Napier, with the focus of the energy released having been at a depth of 15 to 20 kilometres beneath the ground. A measure of the energy released at the source is the quake’s magnitude, which has been placed at 7.8 on the Richter Scale for the 1931 earthquake; this level of

4
energy is greater than the energy of a 50-megaton hydrogen bomb detonated underground. The actual ground motions resulting from the earthquake are reduced as the energy spreads out with distance from its source, with the local intensity measured by the Mercalli scale; in Napier the 1931 earthquake achieved an intensity ranking that denotes "general panic, wooden buildings seriously damaged, landslides widespread, and rivers slop over banks", accounting for the extreme damage to Napier and nearby communities. It was immediately apparent at the time of the earthquake that significant changes had occurred in the elevations of the land. In particular, the uplift of the Ahuriri Lagoon caused it to rapidly drain into the sea, permanently reducing its area. As reported at that time
1:
At Port Ahuriri the tide had just begun to ebb. It has been stated by the Harbourmaster (Captain White-Parsons) that for some minutes the ebb maintained its ordinary flow, but it soon gathered force, and within a few minutes flowed with an estimated velocity of fifteen miles per hour, and this was maintained until well past the proper time of low water, and even past the next period of high water.
Several scientists were involved in a reconnaissance of the region during the weeks immediately following the earthquake, to document the resulting changes to the environments of Hawke’s Bay. One of them, P. Marshall, documented the elevation changes of the land relative to the mean level of the sea. Of special interest was the degree of uplift of the Port's breakwater and the entrance to the Ahuriri Lagoon
2:
The rise in level at the breakwater tide-gauge was 6 ft., and this appears to have been uniform throughout its extent. Calcareous seaweeds were growing generally on the surface of the piles of the wharf that extended northwards from the shoreward part of the breakwater. After the elevation these became bleached by the sun and indicated clearly the previous sea-level. Between the breakwater and the entrance to Port Ahuriri the effect of the 6 ft uprise was most evident. The shore here had a wide apron of limestone boulders which had been shed from Scinde Promontory. Beneath the low-tide level these had become coated with calcareous algae, which died when exposed after the elevation. The remains of these soon bleached . . .
Marshall made similar observations along the entire shoreline of Hawke’s Bay, based mainly on the altered high-tide strand lines found on the beaches and rocks, finding that the 6-foot [1.8 metres] uplift of the land at Napier gradually increased to the north, reaching approximately 6 feet 6 inches [2.0 metres] at Tangoio, and having achieved a maximum uplift of 9 feet [2.7 metres] at Moeangiangi; still further to the north along the shore, the amount of uplift rapidly decreased. To the south of Napier the degree of uplift of the land relative to the sea also progressively decreased from its 6-foot [1.8 metres] rise measured at the Port’s breakwater, until just south of Awatoto no change in the land elevation could be found (Figure 2). Still further to the south, along the shores of the communities of Haumoana, Te Awanga and Clifton, the level of the land had dropped at the time of the 1931 earthquake, by nearly a metre. The effect on that stretch of shore to this reduction in the elevation of the land is basically the same as would occur today if the level of the sea were to suddenly rise by a metre; as will be related later, this drop in the level of the land south of Haumoana initiated the progressive erosion of that shore, and it is likely that the continuing problems with erosion in those communities is in part the lingering consequence of the Hawke’s Bay earthquake, even though 75 years have passed. In contrast, the uplift of the shores to the north, from Awatoto to Tangoio and beyond, improved their stability and resistance to erosion and flooding. Prior to that uplift in 1931, most of those beaches were sufficiently low in elevations that during storms the high tides and waves were able to wash completely over their crests, largely precluding settlement along those shores. The early history of Napier records the frequent flooding of its downtown, and today one can still find deposits of gravel that had been washed inland from the beach along what was then the Western Spit, which today is the site of the Westshore development.

5
Figure 2: Land elevation changes along the shore of Hawke's Bay produced by the 1931 earthquake
3.
The Hawke’s Bay Beaches and Ocean Processes The collision of the Australian and Pacific plates along the east coast of the North Island produced the extreme deformation of the rocks on the land, and the uplift of mountains such as the Ruahine Range in Hawke’s Bay that rises to over 1,700 metres elevation. The erosion of these mountains has served as the source of gravel and sand to the rivers, which flow to the coast and deliver those sediments to the ocean’s shore. The gravel found on the beaches of Hawke’s Bay for the most part originated in those mountains, arriving today via the Tukituki River, with some of the beach gravel also being contributed by the erosion of Cape Kidnappers. This beach gravel consists almost entirely of a type of rock geologists call greywacke, which was derived from sediments originally deposited in the ocean during the age of the dinosaurs, fine-grained sediment consisting of silt and very small particles of sand. Later this sediment was compressed and heated during the formation of the mountains, so it was transformed into a rock that is resistant to erosion and therefore tends to form the highest elevations of the mountains. When it is eroded from these mountains by the rain and occurrences of landslides, it yields angular cobbles and gravel. When that material is transported to the coast by the rivers, their angular edges are worn away by abrasion during transport, so that by the time they reach the beaches they have become rounded and smooth. This abrasion continues under the action of the waves on the beaches, so the sizes of the cobbles and gravel are progressively reduced with time. Coastal scientists have undertaken laboratory experiments to measure the rates of loss to abrasion of the greywacke gravels, demonstrating that it progresses at a reasonably rapid rate in spite of the perceived hardness of this rock. As will be reviewed later, this abrasion actually represents a significant natural loss of gravel from the Hawke’s Bay beaches. These experiments also demonstrated that the abrasion of the greywacke gravel yields sand. Initially that sand can be quite coarse, so it is able to remain on the beaches, but fairly rapidly this coarse sand is in turn broken down into those silt and very-fine particles of sand that millions of years ago had been deposited in the ocean. These fine sediments are quickly carried away from the beach by the ocean waves and currents, and deposited offshore, some of it just seaward from the beaches. The consequence is that sand usually forms only a small portion of the Hawke’s Bay beaches, instead being dominated by the greywacke gravel; the exception are stretches of shore sheltered from the full forces

6
of the ocean’s waves, an example being the beach at Westshore which is protected from the waves by the combined sheltering of Bluff Hill and the Port’s breakwater. The ocean waves are responsible for the development of the beaches in that they rework the sediments that have been delivered to the coast by the rivers and from sea-cliff erosion, carrying away the silt and fine sand into the offshore, concentrating the gravel and piling it into a sloping beach that acts to dissipate the energy of the storm waves as they break and swash up the face of the beach. When the waves break at angles to the shore, they produce a longshore transport of the beach gravel, carrying it along the coast away from its sources to form beaches distant from those sources. For example, the primary sources today of gravel to the beaches are recognized to be the Tukituki River and the erosion of Cape Kidnappers, located at the south end of the stretch of shore, but the waves then transport that gravel to the north so it eventually reaches the Napier shore south of Bluff Hill and the Port’s breakwater, where it has built out a beach. During that northward transport, the sizes of the gravel particles are reduced by abrasion, such that on average they are smaller when they finally reach Napier. In order to understand these processes of beach formation and the rates of longshore transport of the gravel, it is necessary to have measurements of the waves that reach the coast of Hawke’s Bay. A sufficiently long record of wave data is needed to permit assessments of the most extreme wave conditions that can be expected along this shore, those generated by the most severe storms. This assessment is required because these extreme waves pose the primary threat to homes and other infrastructure constructed along the Hawke’s Bay coast — the high waves together with the elevated tides also produced by the storm represent the ocean’s forces that assault the land, resulting in its erosion and flooding. In August 2000 the Port of Napier installed a buoy in 15 metres water depth seaward from their breakwater, containing instruments that each hour, 24 hours a day, record the wave conditions — their heights, periods, and the direction of their movement as they approach the shore. Each hour a range of individual wave heights is measured due to the variability of the sea state, but these are routinely reported as the “significant wave height”, which is the average of the highest one-third of the measured wave heights, it being assumed that these higher waves are more significant in terms of hazards to ships and to beach erosion. The results to date of 5 years of wave measurements have shown that the highest wave conditions generally occur during July and August, when the average significant wave height is on the order of 1.2 metres. However, the highest waves generated by the stronger storms variously occur during June through September, when they typically achieve significant wave heights on the order of 2.5 to 3.5 metres. It needs to be recognized these values are still averages, though of the highest one-third of the waves, and that higher individual waves will occur during those storms. For example, during a storm that generates a 3.5-metre significant wave height, the highest waves would be on the order of 6 to 7 metres. This provides some notion of the ocean’s wave forces existent along the Hawke’s Bay coast, those that could attack the homes along its shores. However, these results are based on only 5 years of wave measurements by the Port’s buoy, and the real hazard and concern are the waves that might be generated by the strongest storm expected in 50 to 100 years (the 100-year wave conditions having a 1% probability of occurring each year). Unfortunately, many more years of wave measurements by the Port’s buoy are required before assessments of these extreme wave conditions can be made with confidence [statistical analyses indicate that about 35 years of measurements are needed to project the 100-year waves, not requiring a full 100 years of data]. Until a sufficiently long record of actual wave measurements has been collected, coastal scientists and engineers base their analyses on hindcast wave conditions, assessed from the past intensities of storms. A considerable extent of research has been directed toward the prediction of the waves that are generated by storms, yielding techniques wherein we can now predict the heights and periods of the waves generated, depending on the strength of the winds, the area of the storm (its fetch), and how long the storm lasts (its duration). Relatively long records are available of the storms that have occurred over the years, and these wave-generation analysis techniques are employed by scientists and engineers to hindcast the waves that have occurred. Such analyses were undertaken for the entire coast of New Zealand by Dr. Richard Gorman and his colleagues at NIWA
4, based on 20 years of storm

7
records from 1979 through 1998 that occurred in proximity to its coast (but did not include waves generated by cyclones). The resulting histogram of significant wave heights for Hawke Bay, assessed at 3-hour intervals, is graphed in Figure 3. It is seen that the most frequent occurrences are waves on the order of 1.5 metres height, but there is a long tail in the histogram that represents the more extreme wave conditions, those that are rare but are most important in that they represent the principal hazard to the coast, causing the episodes of beach and property erosion. The distribution shown in Figure 3 extends to hindcasted waves having a significant wave height of 6 metres, but the maximum for that 20-year record actually reached 8.6 metres. Recalling again that this significant wave height is something of an average, it can be expected that the very highest waves at the time of that storm had been on the order of 15 metres! This shows the potential for very extreme storm-wave conditions along the Hawke’s Bay coast, much greater than have been measured by the Port’s buoy since it was installed in August 2000. It is this level of wave conditions that is of concern to developments along the shores of Hawke’s Bay, it clearly representing a potential hazard to homes and other infrastructure.
Figure 3: The hindcast deep-water significant wave heights directly seaward from the Hawke’s Bay shore
4.
The hindcast wave heights plotted in Figure 3 are for deep water at the seaward edge of Hawke Bay. The heights of the waves, and the directions of their approach to the shore, are altered as they cross the shallower water depths of the continental shelf. In general, when waves reach shallow water they tend to increase in height until they break on the beaches, so there is the potential for the deep-water wave heights obtained in the hindcasts, those graphed in Figure 3, to become even larger at the shore. In Hawke Bay this potential increase is partially offset by the refraction of the waves as they cross the continental shelf, which alters their directions of approach to the coast and acts to spread out their energy so it is reduced somewhat along the beaches, reducing the wave heights. This is illustrated in Figure 4 from the analyses of Dr. Jeremy Gibb
5, showing the patterns of the wave crests as they arrive
from the south, when they are still in deep water outside of the Bay. As the waves cross Hawke Bay, it is seen that their crests bend in such a way that they become more nearly parallel to the shore. This bending of the wave crests is greatest where they pass around headlands such as Cape Kidnappers, and this results in the greatest reduction in the heights of the waves in the sheltered lee of headlands, such that the smallest waves along the coast are found there. Similar to the Cape, the refraction of the waves around Bluff Hill in Napier, and the direct sheltering of the shore by the Port’s breakwater, significantly reduce the heights of the waves along the beach of Westshore; it is clear that this sheltering has acted to protect that community from the extreme hazards of the storm waves.

8
Figure 4: Examples of the refraction of waves as they cross Hawke Bay5,
with their crests becoming nearly parallel with the shore. In addition to generating high waves, the strong winds and low atmospheric pressures of a storm can create a storm surge, a super-elevation of the water level along the coast above the predicted levels of the tide. Having a range of about 2.0 metres between the lowest and highest levels reached by the predicted tides, the highest predicted tides for Hawke Bay reach about 1 metre above mean sea level, while the surge of a moderately severe storm can add another metre, raising the water to 2 metres above mean sea level. The extreme 50- and 100-year storms, with their much stronger winds and reduced atmospheric pressures (which in effect “suck” up the level of the water, as in a straw), can be expected to raise the water levels still higher than experienced in recent decades during storms. With the high waves superimposed on this super-elevated tide of the storm surge, the 50- and 100-year events clearly represent major threats to the Hawke’s Bay coast from erosion and flooding, much greater than has been experienced since homes were constructed along its shore. It is just such an event that coastal scientists and engineers consider when they develop hazard zones for the coast, to maintain homes and other developments safe for the next 50 to 100 years. Still another factor in the establishment of hazard zones is the changing level of the sea, the global rise in sea level that is estimated to presently be about 1.5 to 2.0 millimetres per year (15 to 20 centimetres per century). This rise is produced by the melting of glaciers and the thermal expansion of the ocean’s water as it warms. Also important at a specific coastal site is the changing level of the land, since it is

9
the combination of the global rise in sea level and the local land elevation change that is significant to occurrences of coastal erosion and flooding. This combination is usually determined from long-term records from tide gauges, which can be averaged each year to determine the mean level of the sea for that year, with many years of such records showing how it has changed and the rate of that change. Although the Port of Napier does have a tide gauge, it unfortunately has been recording quality data for less than a decade, an insufficient length of time to determine the local change in relative sea level. Elsewhere in New Zealand, where tide gauges do have long records (Auckland, Wellington, and Lyttelton), the rates of sea-level rise during the past century have ranged from 1.3 to 2.1 millimetres per year, but the results for Hawke’s Bay could be expected to differ due to its higher degree of tectonic activity and associated land elevation changes. In the not too-distant future measurements of land-elevation changes throughout Hawke’s Bay will likely be established by research that is underway using the Global Positioning System (GPS), and once that has been determined we will be able to derive good assessments for the rates of sea-level change along the Hawke’s Bay coast, and better evaluate their potential consequences to future shoreline erosion. Those assessments are very much needed in view of the predictions for accelerated rates of sea-level rise during the next 100 years as a result of global warming, with the best-estimate prediction being a rise on the order of 40 centimetres, more than double the rise that occurred during the 20th century (Figure 5)
6. This clearly represents a threat to shore-front properties, to homes and other developments
constructed to hopefully last for 50 to 100 years. For this reason, when coastal scientists and engineers determine hazard zones for the development of the coast, this probable increase in the mean sea level in the future is added to the effects of the storm surge and wave-swash runup, to derive the recommended hazard-zone elevations and widths.

10
Figure 5: Mean sea level at Auckland based on the tide-gauge measures in its
harbour, with a projected of the future rise expected to result from global warming
6.
Human Settlement & Environmental Change With our growing population humans have become a force of change to the environment, in many areas exceeding those of Nature. This has been particularly true along the world’s coastlines where our cities are concentrated, and where our alterations of the environment in many cases have had negative consequences; indeed, we are often the cause of coastal erosion, as well as being its victim. Our impacts in the coastal zone itself are usually readily apparent — the construction of seawalls, groynes and harbours, or the commercial extraction of sand and gravel from the beaches. We sometimes fail to recognize that our alterations of the inland environments can also have consequences on the coast, even those that occur hundreds of kilometres from the shore. In particular, alterations in the watersheds of the rivers that drain to the coast can profoundly affect the quantities of sediments that are delivered to the shore, so that over the years the volumes of gravel and sand on the beaches may slowly diminish. A healthy beach containing sufficient volumes of sediment is recognized to be the best form of shore protection, as it provides a natural buffer for our coastal developments from the waves and high tides of extreme storms. The loss of that sediment and the resulting narrowed beaches is commonly a primary factor in bringing about the destructive erosion and flooding of coastal developments, of our homes and other infrastructure. People reached the shores of Hawke’s Bay beginning with the Maori about eight hundred years ago and then Europeans in the 19th century, with each group having altered the environment as we established our settlements. Our greatest impacts initially affected the watersheds of the rivers and the quantities of sediments delivered to the coast. The Maori were active hunters in the forests, with the moa having been their primary source of protein during the first two centuries of their settlement, leading to its extinction. There is evidence that the Maori intentionally burned areas of forest in their pursuit of the moa and other game, and later to clear lands for agricultural use. This clearing of the

11
forests greatly increased with the arrival of Europeans in Hawke’s Bay, many of whom chose to settle inland to raise sheep and cattle. The trees were sometimes harvested as there was a considerable demand for timber in the construction of homes for the rapidly expanding population, and also to be used in the construction of the hundreds of kilometers of fencing needed to contain their cattle. In many cases fires were set to more rapidly remove the forests, or to clear the land where the trees had been cut. Runaway fires were common during this early period of settlement, with devastating consequences. Particularly disastrous fires occurred in March 1888 in the dense bush at Norsewood
7:
. . . it was said that the whole countryside was in flames which, driven by a furious gale, spread with dreadful rapidity. . . "As the main body of the fire swept on and past Norsewood," wrote an eyewitness, "the higher bush, parallel with the road to Ormondville, presented the appearance of a vast furnace." The terror caused by the flames and smoke were heightened by the roaring of the wind, which lifted huge tongues of fire skyward, and bore before it heavy masses of smoke, lit up by continuous showers of sparks, and flakes of burning scrub. To add to the terror, as the fire swept along, and the daylight began to die, a fearful storm of lightening, accompanied by thunder, came rolling along overhead from the direction of the Ruahine mountains.
Vast tracks of forest were lost during this period of settlement, and with this loss the land was less able to absorb the water of heavy rains, leading to increased discharges in the rivers and the flooding of the lower watersheds. Deforestation together with the use of the land for grazing sheep and cattle would have resulted in increased rates of soil erosion, and on the steeper slopes the more frequent occurrences of landslides. This would have added greater quantities of sediments to the rivers, mostly silt and sand, but also gravel and cobbles from the erosion of the rocks and landslides in the upper watersheds. One response of the settlers to these floods was the construction of levees throughout the Heretaunga Plain, to confine the water to the river channels where it would more rapidly flow into the bay, keeping the water out of the settlements and pasturelands. These levees were constructed of gravel and sand extracted from the river channels, this practice also having the benefit of deepening those channels so they had an improved capacity to contain the river's discharges at times of floods. It is also likely that sand and gravel was mined from the river channels, beginning during the earliest times of settlement, to be used in a great many ways such as the filling of marshes and ponds across the Plain to further improve the grazing lands, and perhaps even transported to the growing community of Napier to raise its land elevations and expand the area of developable land. We can only guess at the volumes of gravel and sand mined from the rivers during this settlement period, as there was essentially no regulation of this activity and therefore no monitoring. At any rate, it undoubtedly was viewed as a positive activity, as this sediment extraction from the rivers would have deepened their channels and reduced the flooding impacts. Even today large volumes of gravel and sand are being extracted from the rivers, in part to reduce the hazards of floods. It is apparent from this history that some of our alterations to the environments of the Hawke’s Bay watersheds over the centuries have acted to increase the quantities of gravel and sand that reached the ocean beaches, while other alterations of the watersheds would have decreased those quantities. In balance it is probable that the quantities have decreased, especially in view of the fact that due to the diversions of the channels of the Tutaekuri and Ngaruroro Rivers during the 20th century, at present they do not even supply the beaches with gravel, and it will be more than a century before they do so. Of the rivers, only the Tukituki now supplies significant volumes of gravel and coarse sand to the beaches, estimated to average about 28,000 cubic metres per year, but with large variations from year to year depending on the occurrences of floods. If all of the sediment extraction were halted in its watershed, this volume potentially could be increased to 75,000 cubic metres per year, but the resulting sediment accumulation in the channel would likely lead to increased problems with flooding. Thus there are tradeoffs, with the extraction of the gravel and sand from the rivers continuing to be a positive management strategy to reduce flooding, but with this practice having negative consequences to the bay's beaches, being one factor in causing shoreline erosion and the inundation of low-lying backshore properties under the high tides and waves generated by storms.

12
To make matters worse, there also has been a long history of mining gravel directly from the beaches of Hawke’s Bay, beginning during the earliest period of settlement. Not having been monitored, there is only anecdotal information concerning these early beach-mining activities. For example, large volumes were extracted during the construction of the railway, needed to raise its bed. This extraction was not limited to local needs of sand and gravel; for example, in the construction of the huge concrete pier in Tolaga Bay north of Gisborne, the gravel in its concrete came from the Hawke's Bay beaches. In recent years the most significant extraction of beach sediment has taken place at Awatoto, which has averaged 47,800 cubic metres per year; during the 30 years from 1973 to 2002, for which we have the best records, this extraction removed a total volume of nearly 1,500,000 cubic metres of beach sediment, and continues today although this annual removal is scheduled to decrease during the next ten years, and to cease altogether after that. The significance of this commercial extraction at Awatoto is that it has exceeded the quantities of gravel reaching this stretch of shore, from the Tukituki River and from sea-cliff erosion along Cape Kidnappers. As a result, the total quantity of gravel and sand contained within the beach between the Cape in the south and Bluff Hill and the Port’s breakwater in Napier has significantly decreased over the years, making this stretch of shore more susceptible to property erosion and flooding. When one considers the impacts of humans on the coastal zone, we primary think of the consequences of having constructed harbours. The reason for this is that there are many examples from the world's coastlines where the construction of moles (jetties) to stabilize and deepen an inlet for safer navigation, or the development of a breakwater on the open coast to serve as a harbour, have resulted in significant erosion of nearby beaches and the loss of shore-front properties. These impacts are mainly the result of the structures having blocked the natural movement of beach sediment along the shore, their construction having prevented the former passage of the sediment to downdrift beaches so there is a prolonged period of nearly continuous erosion. Such occurrences of erosion associated with the construction of moles and breakwaters are so common, there is the tendency to attribute any occurrence of beach erosion to a nearby harbour. In some cases this initial claim has been refuted or moderated by further investigation. This has been the situation with the development of the Port of Napier, including the construction of the moles at the entrance to the Ahuriri Lagoon in 1876-1879, followed soon thereafter by the development of the Port's breakwater in 1887-1890. Although the beach accumulated sediment along both the Eastern Spit and Western Spit (Westshore) when the Ahuriri moles were constructed, this reverted to erosion on the Western Spit when the breakwater was built. There has been a difference of opinions amongst coastal scientists and engineers as to the cause of that erosion at the time the breakwater was constructed, and of the lesser degree of erosion at Westshore in more recent years. Some have assumed it represented another example of downdrift beach erosion, with the breakwater having blocked the previous passage of beach gravel around Bluff Hill, the sediment that had arrived from the south to supply gravel to the Western Spit (Westshore)
8. Other coastal scientists
9 have pointed to the
importance of different causes of the erosion at the time of the breakwater’s construction, including the fact that this was a period of unusually intense storms that produced erosion and flooding at other sites along the Hawke’s Bay shore, with another contributing factor having been the decision to halt (in 1888) the practice of disposing the sand dredged from the Ahuriri Inner Harbour along the shore of the Western Spit. Because of these divergent opinions, I undertook a detailed examination of this issue in my full report. With the construction of the Ahuriri moles and the Port’s breakwater having been completed more than a century in the past, any analysis of their effects on the environment depends in large part on a historic reconstruction of the beach responses, but viewed with our present-day knowledge of what can happen when moles or breakwaters are constructed, this knowledge having been acquired through detailed studies of the effects such structures have had throughout the world. In undertaking this review I considered three basic questions:
1. Was the gravel on the beach to the south of Bluff Hill able to bypass that headland prior to the construction of the breakwater, having been a source of sediment to the Eastern

13
and Western Spits? Expressed another way, was there a net northward longshore transport of gravel along this shore that would have been blocked by the Ahuriri moles and later by the construction of the breakwater?
2. Is there evidence that when the Ahuriri moles were constructed, they actually did block a northward transport of the beach sediment that was occurring at that time?
3. Did the later construction of the Port’s breakwater also block the northward transport of gravel on the beach, so it was no longer able to bypass Bluff Hill and reach the shores of the Eastern and Western Spits, with the erosion experienced there at the time of the construction being another example of downdrift erosion? Or were there other causes of the erosion?
Answering these questions involved my delving into the historic record, the written reports from the decades prior to and during the harbour development. Particularly informative were the reports
10 by F.
Saunders in 1882 and J. T. Carr in 1893, the Chief Engineers of the Napier Harbour Board, with Saunders’ report coming immediately after the completion of the Ahuriri moles but prior to the breakwater’s construction, while Carr’s report was written soon after the completion of the breakwater. Also of historic interest were the charts of the coast prepared during that period, as they document the conditions of the beaches and shorelines prior to and following the harbour construction. Also important have been the more recent investigations of these beaches; for example, the thesis research by Mr. Keith Smith
11 of the beach gravel, permitting comparisons of the gravels to the north and south
of Bluff Hill. With respect to the first of the above questions, I concluded that prior to any harbour development, that is before 1875, it is likely that some beach gravel was able to bypass Bluff Hill, carried from the Marine Parade beach to the Eastern and Western Spits, but this involved only relatively small volumes of gravel and with the occurrences of bypassing having been infrequent, there having been no bypassing during most years. Circumstantial evidence for this conclusion comes from an 1873 chart that shows the Eastern Spit (the Hardinge Road shore) and its relationship to the rocky shore of Bluff Hill. Within that rocky shore were two localized pockets where the chart reported the presence of shingle, presumably greywacke gravel that had been trapped there as it was bypassing this headland. But particularly informative are the differences in the gravels north and south of the headland found by the study of Keith Smith
11, differences in their grain sizes, shapes and degrees of surface polish. Along the
stretch of shore north of Bluff Hill the beach gravel was found by Smith to be smaller in size than that to the south, generally less angular in its shapes, and having acquired a polished surface from being acted upon by the waves for a long period of time. This led him to characterize the beach gravel to the north of Bluff Hill as being “old”, in contrast to the comparatively young gravel to the south where it had more recently reached the beach from the Tukituki River and erosion of Cape Kidnappers. While the presence of the shingle (gravel) in the pockets along the rocky shore of Bluff Hill suggested that some bypassing had occurred, the distinct differences found by Smith in the gravels north and south of that headland provided evidence that the quantities must have been small and that the bypassing only occasionally occurred. Both Saunders and Carr examined the shoreline changes that had occurred along the Western Spit prior to the harbour development, and found that it had gradually eroded from 1854 to 1876, that is during the two decades before the construction of the Ahuriri moles. This occurrence of erosion indicates that there must have been little if any bypassing of gravel around Bull Hill during that period. The erosion appears to have been induced largely by the removal of limestone boulders along the shore of the inlet, to be used as ballast in departing ships. Saunders commented in his 1882 report
10:
. . . from 1855 until the training groins [the Ahuriri moles] were erected at the entrance, the distance between the Eastern and Western Spits gradually increased from 380 to 960 feet at low water. The widening of the channel was principally caused by the limestone boulders being taken from the Western Spit as ballast for vessels, which practice was allowed until 1860. The shingle thus left unprotected was gradually worn away by the action of the tides.

14
This widening of the Ahuriri inlet resulted in it’s shoaling, so it became a hazard to navigation; this was the primary inducement for having constructed the moles in 1876-1879. The moles were completed with a spacing of 122 metres, close to the original 115 metres (380 feet) of the natural width of the inlet, so as to initially increase the speed of the tidal currents flowing between them, until the bottom was scoured to a depth that permitted safer navigation.
Figure 6: The shoreline changes associated with jetty construction on an inlet: (Upper) Where the jetties block a net longshore transport of the beach sediment; (Lower) The symmetrical pattern of shoreline change where there is not a net longshore transport
12.
Of interest are the patterns of shoreline changes that occurred when the Ahuriri moles were under construction. As depicted in Figure 6, different patterns have been found on coasts where there is a net longshore transport of beach sediment that would be blocked by the construction (upper diagram), compared with a coast where there is not a net longshore transport (lower diagram)
12. Where there is a
net longshore transport the construction of jetties (moles) blocks the sediment movement so the beach expands along the updrift shore, while erosion occurs on the downdrift beach. This trend continues until potentially so much sediment accumulates on the updrift beach that it is finally able to pass around this obstacle and reach the downdrift beach (this eventuality is sometimes prevented by periodic dredging of sediment from the updrift beach, and its placement on the downdrift beach, in effect artificially restoring the longshore transport that had been interrupted by the jetty construction). These extreme consequences resulting from jetty construction contrast with the symmetrical changes diagramed in Figure 6 (lower) where the jetties are placed on a shore where there is not a net longshore transport of sediment to be blocked. In this case the sediment has been found to accumulate

15
in the sheltered zones adjacent to the jetties, on both sides such that the patterns of change are approximately symmetrical. This accumulating sediment is derived in part from a small degree of beach erosion that occurs further alongshore, and also from the onshore movement of sediment that had been in the bay-mouth bar immediately offshore from the inlet’s mouth. This involves only a local rearrangement of the beach sediments, which transpires within a few years, not resulting in the long-term impacts found when jetties block a net longshore sediment transport. Of interest is which of these two patterns of shoreline change diagramed in Figure 6 occurred when the Ahuriri moles were constructed, that is, whether there was gravel bypassing around Bluff Hill to supply a longshore gravel transport that was blocked by the moles. In his 1882 report, Saunders commented that the Marine Parade Beach south of Bluff Hill was "much reduced" in its width and sediment volume at that time, indicating that it was inadequate to support bypassing. The absence of bypassing and the existence of a net-zero longshore gravel transport along the Eastern and Western Spits is confirmed by the observed shoreline responses adjacent to the moles as they were being constructed, with gravel accumulation to both the east and west sides of the moles; that is, the shoreline changes conformed with the symmetry in the lower diagram in Figure 6, not with the upper diagram where a net transport of beach sediment has been blocked. Most of the focus of past investigators has been on the rapid accumulation of gravel on the beach to the east of the constructed moles, along the Eastern Spit. According to Saunders, the rate of gravel accumulation to the east of the moles was so rapid it kept pace with the extension of the moles, with the rate of accumulation having been equivalent to an annual rate of longshore transport of 50,000 cubic metres per year. However, such an extreme rate of gravel accumulation is totally unrealistic for the volumes of gravel that could have bypassed Bluff Hill, in view of the estimated transport rates along the Marine Parade that have been on the order of only 6,000 cubic metres per year
13. My interpretation is that the rapid accumulation of gravel adjacent to the
Ahuriri moles in response to their construction came instead from the onshore movement of the bay-mouth bar, a response that has been found on other coasts when jetties were constructed. Furthermore, beach accretion also took place along the Western Spit at the time of the construction of the Ahuriri moles, there not having been an occurrence of downdrift erosion, expected if the moles had actually blocked a net longshore transport of the gravel. This accumulation along the Western Spit may in part have been due to the practice at that time of disposing the sediments dredged from the Inner Harbour to the west of the moles, but that disposal would mainly have involved sand, whereas it appears that most of the accretion involved the arrival of gravel. The accumulation of gravel on the beaches to both the east and west sides of the constructed moles is therefore best interpreted as having been the response to jetty construction on a shoreline that has a zero net longshore transport of sediment, as depicted in the lower diagram of Figure 6. The construction of the breakwater came in 1887-1890, a decade after the completion of the Ahuriri moles. It has a design typical of breakwaters, with an arcuate shape that provides a large area of water sheltered from the high ocean waves. Construction began as a groyne-like projection extending seaward from the Bluff Hill shore, but then bent toward the north to follow a trend that is essentially parallel to the orientation of the coast to its south; the length of this segment has progressively increased over the years to expand the Port's facilities. Having this form the breakwater extends the area sheltered from the waves that predominantly arrive from the south to southeast, beyond that naturally provided by Bluff Hill to the shores along Hardinge Road and Westshore. This pattern of sheltered shore is the product of wave refraction and diffraction to the north of Bluff Hill and the breakwater. Of significance, analyses of those processes have demonstrated that the construction of the breakwater has resulted in the heights of the waves now reaching Westshore being on the order of half their heights prior to the breakwater’s construction. This fact alone is evidence for the breakwater having provided some protection to the Western Spit at the time of its construction, just as today it shelters Westshore from the erosive forces of the storm waves. At first inspection, the breakwater’s construction did give the appearance of its having blocked a net northward transport of the beach sediment that would otherwise have bypassed Bluff Hill, with beach accretion having occurred south of the breakwater and extending along the Marine Parade, while erosion took place along the Western Spit. It is this pattern that was interpreted by some coastal

16
scientists8 as having been another example of updrift accretion and downdrift erosion when harbour
construction blocks a net longshore sediment transport. But this interpretation does not hold up under closer examination. Alterations in the coast produced by the construction of breakwaters are more complex than those caused by jetties (moles), in particular in creating the sheltered zone where wave refraction and diffraction largely control the responses of the shoreline to the construction. In the case of the Port of Napier’s breakwater, its groyne-like projection out from Bluff Hill had the effect of lengthening that headland, altering the balance of wave energies reaching that shore, this being a factor in its having produced the observed localized seaward progradation of the shoreline to its south. The results of these processes are complicated further by the fact that the beaches are mixed sand and gravel, there being an offshore deposit of fine sand and silt immediately seaward from the beach, which is composed primarily of gravel with a small percentage of sand that is coarser grained than the sand found in the offshore. The beach sediment accumulation to the south of the breakwater occurred during the earliest stages of its construction, as it was being extended out from the Bluff Hill shore. Analyses have been undertaken of its rate of accumulation, which was found to be equivalent to an annual rate of about 6,000 cubic metres per year
13. This accumulation has been interpreted by some coastal scientists as being the
updrift blockage by the breakwater, with the 6,000 cubic metres per year being the northward longshore transport of the beach sediment along the Marine Parade, which was prevented from having reached the Western Spit in the past, and Westshore today. However, there is a significant problem with this interpretation; in spite of more than a century having passed since the completion of the breakwater, the beach gravel that presumably continues to arrive from the south has not moved along the arm of the breakwater and entered the Fairway navigation channel leading into the Outer Harbour behind the breakwater. The only sediment that has been trapped in the Fairway has been the fine sand that is present in the offshore throughout Hawke Bay; apparently, not even the coarser sand of the Marine Parade beach has managed to bypass the breakwater to reach the Fairway. While some beach gravel may be transported by the waves to reach the beach to the south of the breakwater, its volume is likely less than the 6,000 cubic meters per year in the original assessment. Having reached this beach, this greywacke gravel is lost by abrasion, which wears down both the gravel and coarse sand on the beach, reducing it to fine sand and silt that is lost offshore, and only then is able to bypass the breakwater. The scientists who had concluded that this beach accretion south of the breakwater at the time of its construction represented updrift accretion, logically also concluded that the erosion along the Western Spit at the time of its construction represented the downdrift erosion. It appeared to them to be a safe assumption that the responses of the shorelines were just another example seen throughout the world where jetties or breakwaters had blocked a longshore transport of the beach sediment. We have already seen that there are problems with this interpretation, both in the shoreline changes that occurred when the Ahuriri moles were constructed, conforming to the symmetrical pattern in Figure 6 (lower diagram) where the construction does not block a net longshore transport, and in the fact that beach gravel has not bypassed the breakwater’s arm in the past century, which it certainly should have if the construction had blocked a significant northward transport that previously had bypassed Bluff Hill. The history of erosion at Westshore also argues against its having been caused by the breakwater, representing downdrift erosion. As seen in examples from throughout the world, and close by in the occurrence of downdrift erosion north of the Timaru breakwater on the South Island, had the Port of Napier’s breakwater actually blocked a northward sediment transport, there would have been be a continuation of significant downdrift erosion along Westshore throughout the 20th century, continuing today. Instead, the erosion at Westshore has been relatively minor, and it can be accounted for by causes other than the breakwater. This question of alternative causes of the erosion along the Western Spit (Westshore) at the time of the breakwater’s construction was first explored in a report by Professor Robert Kirk and Dr. Martin Single
9,
and I also considered this issue in detail in my full report. It was noted that this period of breakwater construction was a time of unusually severe storms, and coincided with the decision to halt the practice of disposing the sand dredged from the Inner Harbour along the Spit’s shore. That decade appears to

17
have been characterized by an extraordinary series of severe storms, possibly the most extreme during the period of early European settlement up to the present. In his 1977 book on the history of the Port of Napier, Stevenson
14 related the problems in constructing the breakwater in the face of those storms,
and included photographs showing the incredible waves that had overtopped the completed sections of the breakwater. Those storms also produced extensive erosion along the Marine Parade beach and the flooding of downtown Napier
15, again indicative of their severity and the fact that erosion occurred
elsewhere along the Hawke’s Bay coast, not just at the Western Spit. As discussed above, following the completion of the Ahuriri moles in 1879 there was a decade during which it was the practice to dispose of the sand dredged from that harbour onto the beach to the northwest of the western mole, on the Western Spit. This practice would have acted to form a sand beach in front of the gravel ridge that had accreted in response to the construction of the moles, shifting the shoreline seaward. This practice was halted in 1888, corresponding in time with the early phase of constructing the breakwater. It is not surprising that this sand accumulation would then have rapidly dispersed and the shoreline retreated, but this would have been the response to the extreme waves of the storms that occurred at that time, not to the breakwater whose construction was underway. Indeed, had the breakwater already been completed, its sheltering of this shore from the storm waves might actually have reduced the rate of loss of that sand, just as the breakwater today permits the accumulation of larger quantities of sand at Westshore than found on the beaches elsewhere along this coast. In conclusion, the occurrence of severe storms at the time of the breakwater’s construction provides an explanation for the erosion that occurred along the Western Spit, with the resulting rapid loss of the sand that had been disposed of there being one component of this erosion, one that would account for the very rapid retreat of the shore. There is no firm evidence that the construction of the Ahuriri moles and then the Port's breakwater blocked large quantities of a longshore transport of beach gravel that had bypassed Bluff Hill; instead, there is significant evidence to the contrary. At the time of its construction, the breakwater was unlikely to have been an important factor in the erosion of the Western Spit, and its presence during more than a century has not been the cause of the subsequent erosion at Westshore. On the contrary, the shelter provided to that shore by the breakwater, protecting it from the storm waves that predominantly arrive from the southeast, has been a significant factor in having reduced the beach erosion and hazards from flooding at Westshore.
The Hawke’s Bay Beaches — Sediment Budgets and Erosion Problems The beaches of Hawke’s Bay have been the focus of a considerable amount of research undertaken by coastal scientists and engineers. Also important has been the monitoring program underway for many years, which has surveyed on an annual basis profiles of the beaches at numerous sites extending along this shore. This combined effort toward research and monitoring has yielded an understanding of the coastal processes that is fundamental in serving as the basis for the sound management of the Hawke’s Bay coast. The bulk of these studies have centered on two stretches of beaches, that extending from Tangoio in the north to Bluff Hill in Napier, and the beach south of Bluff Hill to Cape Kidnappers. Coastal scientists and engineers frequently divide coasts into what is termed "littoral cells", representing stretches of shore containing a beach that can be considered to be partially to completely isolated from other beaches. For example, assessments of the beach sediment gains and losses (its sediment budget) is usually based on a littoral cell, as will be seen below for the Hawke’s Bay coast. Littoral cells are most easily defined where rocky headlands provide barriers at the ends of the beach, and this is the situation found at Hawke's Bay. Figure 7 shows the two littoral cells that have been the primary interest of research and the monitoring program, and were the focus of my review; they are respectively referred to as the Bay View Littoral Cell and Haumoana Littoral Cell, following the usual convention of naming littoral cells by centrally located communities.

18
The rocky headlands that define the limits of these cells provide varying degrees of isolation, that is, they appear to differ in the extent to which they inhibit sediment exchange between the beaches of the cells. The Waipatiki stretch of rocky coast north of Tangoio is clearly effective in preventing an exchange of sediment between the Bay View Cell and the beach along Wairoa up to the Mahia Peninsula (the Wairoa Littoral Cell), indicated by distinct differences in their beach sediment compositions and grain sizes. Similarly, Cape Kidnappers clearly isolates the Haumoana Cell from the small pocket beaches further to the south. The headland of Bluff Hill in Napier forms the natural barrier that separates the Bay View and Haumoana Littoral Cells, now augmented by the construction of the Port’s breakwater. As reviewed above, and at greater length in my full report, while it appears that small quantities of beach gravel were able to bypass Bluff Hill prior to the breakwater’s construction, carrying gravel from the Haumoana Cell to the Bay View Cell, there is no evidence for any bypassing having occurred subsequent to its construction. Therefore, at present these two littoral cells can be considered to be effectively isolated from one another.
19
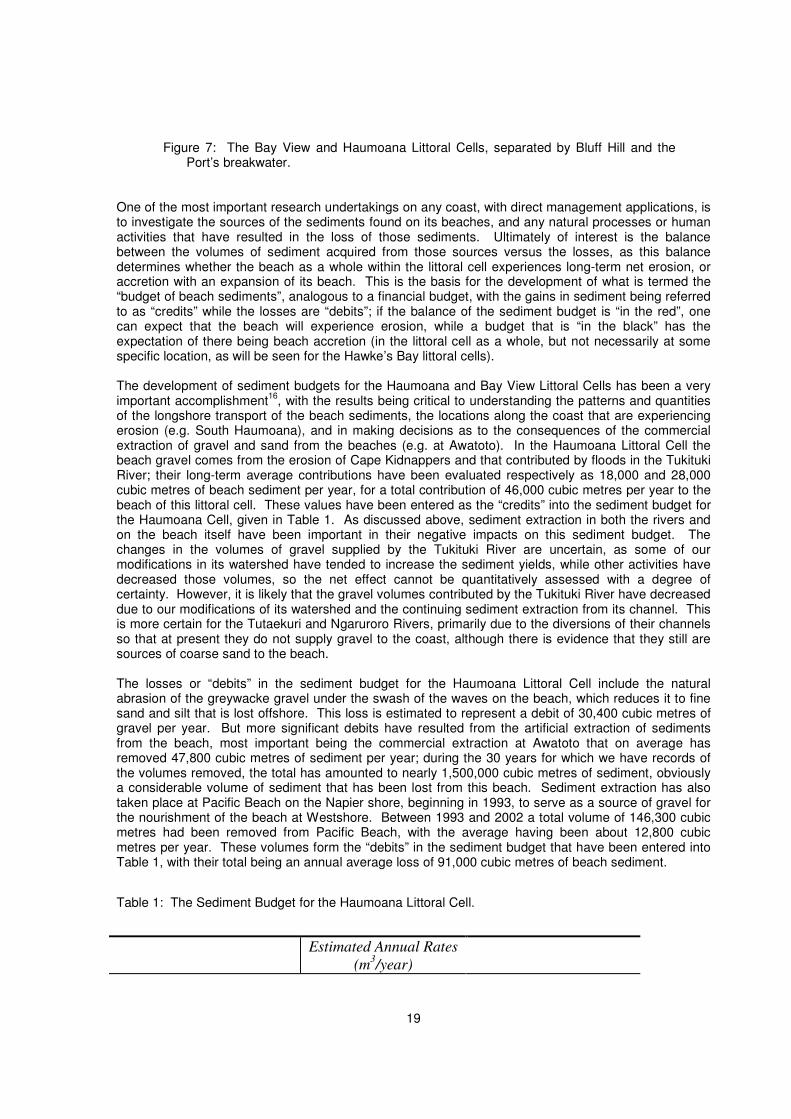
Figure 7: The Bay View and Haumoana Littoral Cells, separated by Bluff Hill and the Port’s breakwater.
One of the most important research undertakings on any coast, with direct management applications, is to investigate the sources of the sediments found on its beaches, and any natural processes or human activities that have resulted in the loss of those sediments. Ultimately of interest is the balance between the volumes of sediment acquired from those sources versus the losses, as this balance determines whether the beach as a whole within the littoral cell experiences long-term net erosion, or accretion with an expansion of its beach. This is the basis for the development of what is termed the “budget of beach sediments”, analogous to a financial budget, with the gains in sediment being referred to as “credits” while the losses are “debits”; if the balance of the sediment budget is “in the red”, one can expect that the beach will experience erosion, while a budget that is “in the black” has the expectation of there being beach accretion (in the littoral cell as a whole, but not necessarily at some specific location, as will be seen for the Hawke’s Bay littoral cells). The development of sediment budgets for the Haumoana and Bay View Littoral Cells has been a very important accomplishment
16, with the results being critical to understanding the patterns and quantities
of the longshore transport of the beach sediments, the locations along the coast that are experiencing erosion (e.g. South Haumoana), and in making decisions as to the consequences of the commercial extraction of gravel and sand from the beaches (e.g. at Awatoto). In the Haumoana Littoral Cell the beach gravel comes from the erosion of Cape Kidnappers and that contributed by floods in the Tukituki River; their long-term average contributions have been evaluated respectively as 18,000 and 28,000 cubic metres of beach sediment per year, for a total contribution of 46,000 cubic metres per year to the beach of this littoral cell. These values have been entered as the “credits” into the sediment budget for the Haumoana Cell, given in Table 1. As discussed above, sediment extraction in both the rivers and on the beach itself have been important in their negative impacts on this sediment budget. The changes in the volumes of gravel supplied by the Tukituki River are uncertain, as some of our modifications in its watershed have tended to increase the sediment yields, while other activities have decreased those volumes, so the net effect cannot be quantitatively assessed with a degree of certainty. However, it is likely that the gravel volumes contributed by the Tukituki River have decreased due to our modifications of its watershed and the continuing sediment extraction from its channel. This is more certain for the Tutaekuri and Ngaruroro Rivers, primarily due to the diversions of their channels so that at present they do not supply gravel to the coast, although there is evidence that they still are sources of coarse sand to the beach. The losses or “debits” in the sediment budget for the Haumoana Littoral Cell include the natural abrasion of the greywacke gravel under the swash of the waves on the beach, which reduces it to fine sand and silt that is lost offshore. This loss is estimated to represent a debit of 30,400 cubic metres of gravel per year. But more significant debits have resulted from the artificial extraction of sediments from the beach, most important being the commercial extraction at Awatoto that on average has removed 47,800 cubic metres of sediment per year; during the 30 years for which we have records of the volumes removed, the total has amounted to nearly 1,500,000 cubic metres of sediment, obviously a considerable volume of sediment that has been lost from this beach. Sediment extraction has also taken place at Pacific Beach on the Napier shore, beginning in 1993, to serve as a source of gravel for the nourishment of the beach at Westshore. Between 1993 and 2002 a total volume of 146,300 cubic metres had been removed from Pacific Beach, with the average having been about 12,800 cubic metres per year. These volumes form the “debits” in the sediment budget that have been entered into Table 1, with their total being an annual average loss of 91,000 cubic metres of beach sediment.
Table 1: The Sediment Budget for the Haumoana Littoral Cell.
Estimated Annual Rates
(m3/year)

20
Sources ("Credits") Tukituki River 28,000 Cape Kidnappers
Erosion 18,000
Total 46,000 Losses ("Debits")
Awatoto Extraction -47,800 Pacific Beach
Extraction -12,800
Gravel Abrasion -30,400 Total -91,000
Net Balance of Beach
Sediment Volumes -45,000
It is seen that the debits are substantially greater than the credits, with their difference yielding a net balance of -45,000 cubic metres per year; the budget is seriously “in the red”, so we can expect that over the length of the beach within the Haumoana Littoral Cell there would be problems with beach erosion, locally threatening shore-front properties. This net balance for the volumes of beach sediments contained within this littoral cell was actually determined directly from the beach monitoring program, with its repeated surveys of profiles over the years having shown that there has been a net loss of 45,000 cubic metres per year of beach sediment in the cell as a whole. The importance in having developed this sediment budget is therefore not in its having determined the net balance from the evaluated credits and debits, but instead that it provides evidence as to why this budget is significantly in the red. An examination of the credits and debits in Table 1 immediately reveals the significance of the commercial extraction at Awatoto, which alone removes all of the beach sediment that on average is being supplied to the beach by the Tukituki River and erosion of Cape Kidnappers. It was in large part because of this evidence that a decision was made to gradually phase out the commercial extraction of beach sediment at Awatoto, with its eventual cessation bringing the budget close to being balanced. However, as will be discussed below, even when the sediment budget for the Haumoana Littoral Cell becomes balanced in the future, it will not halt the problems with beach and property erosion that have been experienced along this shore, specifically those that have occurred in its southern half, in the communities of South Haumoana, Te Awanga and Clifton. The erosion there is due to the occurrence of a net longshore transport of the beach sediment to the north, caused by the prevailing waves that arrive from the southeast, carrying the beach sediment from the southern half of this shore to its northern half. The analyses of the beach profiles acquired in the monitoring program in fact show an average net loss of -48,800 cubic metres of sediment per year along the shore south of the mouth of the Tukituki River (and of the groyne that has been constructed just south of its mouth), while there has been a small net accretion of the beaches to the north with the monitoring profiles yielding an average value of +3,800 cubic metres per year; together these values yield a net balance of -45,000 cubic metres per year for the cell as a whole, the value that is listed in Table 1 for the sediment budget. The budget of beach sediments for the Bay View Littoral Cell is much simpler as seen in Table 2, due to the limited natural supply of gravel to this beach and with its loss to abrasion being the only debit. At present, the one natural source of gravel is the Esk River, but several studies have found that it amounts to a mere 2,000 cubic metres per year of pea-size gravel. Its contribution again would have been somewhat greater in the past, as it is now reduced by sediment extraction from the river’s channel. The beach nourishment program at Westshore is seen in Table 2 to now be the primary

21
sediment credit for this littoral cell, such that the total credits amount to 12,000 cubic metres per year, while the best estimate of the loss from gravel abrasion is -27,000 cubic metres per year, yielding a net balance of -15,000 cubic metres per year, so the sediment budget of the Bay View Cell is also in the red, but not nearly as bad as that for the Haumoana Cell. Furthermore, there is a degree of uncertainty in this balance due to the difficulty of assessing the rate of gravel abrasion; examinations of these uncertainties indicate that the net balance could be as great as -16,800 cubic metres per year, or could actually be close to being in balance. If the -15,000 cubic metres of net erosion is assumed to occur uniformly over the 18-kilometre shoreline length of the Bay View Cell, it amounts to a loss that is slightly less than 1 cubic metre per year of sediment along each metre of shoreline length.
Table 2: Sediment Budget for the Bay View Littoral Cell.
Estimated Annual Rates
(m3/year)
Sources ("Credits") Esk River 2,000 Beach Nourishment at
Westshore
10,000
Total 12,000 Losses ("Debits")
Gravel Abrasion -27,000 Net Balance of Beach
Sediment Volumes -15,000
It is apparent that there are fundamental differences between the Haumoana and Bay View Littoral Cells in terms of their sediment sources and overall budgets. This in turn results in different patterns of the longshore transport of the gravel on their beaches, produced by the waves that reach their respective shores. These differences are highlighted in Figure 8. In the Haumoana Cell the two sources of beach sediment — Cape Kidnappers and the Tukituki River — are located in the southern half of its stretch of shore, but that sediment is then transported to the north to supply the beaches up to Bluff Hill. As depicted schematically by the arrows along its shore, the volumes of sediments involved in this longshore transport progressively decrease toward the north, from the volumes initially supplied by these sources and from the net beach erosion that occurs in the southern portion of the cell, to a minimum in the north at Napier, the decrease being due to the sediment losses along the way to gravel abrasion and its extraction from the beach. This longshore sediment transport is brought about by the waves, with the sediment volumes transported depending on the heights of the waves and the angles at which they break on the beaches. It is seen in Figure 8 that the shoreline of the Haumoana Cell is oriented such that the waves dominantly arrive from the east-southeast and break at angles to the shore so there is a net longshore sediment transport to the north. Furthermore, the shoreline curves so that the breaker angles are largest in the south, progressively decreasing to the north, accounting for the greater transport rates of the beach sediments in the south, decreasing to a minimum in the north. Thus the orientation and curvature of the beach depends on the locations and volumes of the sediment sources, and on the subsequent losses of those sediments; the shape of the beach therefore depends on the sediment budget. This dependence of the beach’s orientation and curvature on the sediment budget is particularly significant in the Bay View Littoral Cell. It was seen in Table 2 that the Esk River supplies very little sediment to this beach, and the recent initiation of beach nourishment at Westshore still involves relatively small volumes of sediment. With there being only small volumes of new sediments

22
contributed to this shore, the waves in turn need to produce only very minor longshore transport rates to distribute those sediments from the sources to the remaining stretches of shore. As a result, the orientation and curvature of the Bay View Cell’s shoreline is close to representing an equilibrium zero-transport condition. This equilibrium is accomplished by the crests of the waves on average breaking parallel to the shore, there not being breaker angles to produce a longshore sediment transport. It is seen in Figure 8 that this is the condition found along the shore of the Bay View Cell, with its orientation rotated so it faces directly into the arrival directions of the predominant waves from the east-southeast. However, it needs to be recognized that at times waves will arrive from the northeast, causing some sediment transport to the south, while waves more from the southeast than depicted in Figure 8 will produce a transport of the sediment back to the north. Therefore, on a daily basis there can be a reversing longshore sediment transport, sometimes to the north and sometimes to the south, but with the long-term net transport being essentially zero, and that is the condition depicted in Figure 8, corresponding to the predominant directions of the waves.
Figure 8: The patterns of the longshore transport of beach sediments (dark arrows) in
relationship to their sources and directions of wave approach, resulting in the different orientations of the shorelines.

23
The areas along the Hawke’s Bay coast that are presently experiencing beach and property erosion are understandable in terms of their sediment budgets, the directions of the longshore transport of those sediments on the beaches, and the increase in sea level relative to the land. The stretch of shore that has been subjected to the greatest beach erosion and property damage is that of South Haumoana, Te Awanga and Clifton, with the recent impacts seen in Figure 9. It will be recalled that this stretch of shore experienced nearly 1 metre of land subsidence at the time of the 1931 earthquake, whereas to the north the elevations of the land were raised (Figure 2). The expected consequence is that this shore at the south end of the Haumoana Cell would undergo a prolonged period of erosion, and coastal scientists have attributed its continuing recession in part to that event, even though it occurred 75 years ago. However, more important today is that its local sediment budget is significantly in the red. The sediment budget for the entire Haumoana Cell has been presented in Table 1, but we can develop a budget for only this southerly portion of the cell, basically that to the south of the Haumoana groyne. Extracting the relevant components from Table 1, this limited sediment budget becomes: Credits Cape Kidnappers erosion 18,000 m
3/year
Debits Gravel Abrasion -4,400 m
3/year
Longshore Transport to the North -62,400 m3/year
Net Balance -48,800 m3/year
The only credit for the south end of the cell is the erosion of Cape Kidnappers that supplies 18,000 cubic metres of sediment per year to the beach; the Tukituki River is not a source, since its mouth is located to the north of the groyne. There is only a small loss of gravel to abrasion, but here we have to include the net longshore sediment transport to the north as another debit in the budget, as it represents a net loss of sediment from this stretch of shore (but a gain or credit for the beach to the north of the groyne). This longshore sediment transport is estimated to average 62,400 cubic metres per year, based on the volume of gravel that had accumulated to the south of the Haumoana groyne when it was constructed in 1999; that transport now bypasses the groyne, since the shoreline to its south has built out to its end. The net balance in this budget is -48,800 cubic metres per year, very much in the red. As seen earlier, this value is based on the beach profiles that have been surveyed in this area by the monitoring program, so it represents a fairly accurate assessment. This local budget reveals that this balance, and the resulting erosion experienced along this stretch of shore, is caused by the longshore sediment transport to the north being substantially greater than the rate at which the erosion of Cape Kidnappers supplies gravel and coarse sand to this beach.

24
Figure 9: Erosion and failed shore-protection structures at South Haumoana.
Although these factors are clearly important as causes of the erosion along the southern shore of the Haumoana Littoral Cell, the solution to this problem is less certain. The response to the erosion of shore-front properties generally involves one of the following options, or sometimes combinations of these options
17:
(a) take no action (b) retreat and relocation (c) beach nourishment (the "soft" solution) (d) stabilization structures (the "hard" solution).
These responses are ordered from the most passive to the most active in terms of hardening the coast with structures. The most extreme measure (d) involves the construction of seawalls of timber or concrete, revetments built of large quarry stone, groynes constructed perpendicular to the shore having the objective of trapping and retaining a portion of the sediment that is being transported along the beach, or the construction of offshore breakwaters or artificial reefs that are placed parallel to the shore to block the waves before they can impact the beach and properties. The traditional approach for shore protection has been the construction of "hard" structures, mainly seawalls and revetments, as they provide the highest certainty of success. However, they have the drawback of at times adversely affecting neighboring properties by transferring the erosion problem, and can also result in the loss of the beach fronting the structures due to their reflection of the waves. In recognition of these potentially adverse impacts of hard structures, many coastal communities have limited their use or banned them outright, opting instead for the "soft" solution of beach nourishment. A major advantage of beach nourishment is that it has the dual advantage of maintaining a recreational beach at the same time it increases the beach width and sediment volumes, which act as a natural buffer between the storm waves and shore-front properties. The downside of beach nourishment is that the sediment placed on the beach will not generally stay there indefinitely, but instead may be carried along the shore by the waves to neighboring beaches (where it then benefits that shore). As a result, a beach nourishment program is usually a long-term investment that requires periodic re-nourishments of the eroding shore. In some cases groynes might be installed to prolong the period of retention of the nourished sediment on the beach, a combination of options (c) and (d). In extreme cases of erosion, it may be best to get out of its way, selecting the option (b) retreat and relocation; there are increasing examples throughout the world of this option being chosen, it being the most rational and cost-effective strategy in those cases. The photograph in Figure 9 of the erosion in South Haumoana illustrates the variety of "hard" structures that have been installed in an attempt to protect the houses from the forces of the storm waves, but with nearly all having failed. As analyzed above, the sediment budget for this stretch of shore is very much in the red, reflecting its high rate of beach erosion. With this balance, it can be expected that the erosion problems will continue indefinitely into the future, with the probable eventual loss of the homes. With the erosion in South Haumoana representing the greatest threat of loss of homes, having sustained additional damage during recent storms, the problem there has the most immediacy. The failures of past hard structures suggest that the retreat and relocation option would be the most rational response. The "soft" solution of beach nourishment would require the import annually of a sediment volume of at least 48,800 cubic metres per year, adding that credit to the budget so it becomes balanced. Such an operation would be very expensive, and the demand for such large volumes of gravel on an annual basis would not likely be sustainable. This could be an instance where the construction of groynes might be valid, a series of short groynes spaced along this stretch of shore that would act to retain part of the nourished gravel placed in front of the properties threatened by the erosion. This sediment would be impounded updrift from each of the groynes, filled to capacity so that the gravel and sand eroded from the Cape could then bypass each of the groynes and continue to be transported to the north, reducing the downdrift erosion associated with the groyne construction. However, even then the presence of the groyne field would still result in some enhanced erosion to the north, assuming that they are effective in halting the shoreline recession. That recession was seen to

25
be caused primarily by the longshore sediment transport to the north, amounting to about 62,400 cubic metres per year, which now bypasses the Haumoana groyne where it then becomes a sediment input (credit) for the beaches to the north. If the erosion to the south were successfully halted, the longshore transport past the Haumoana groyne and its credit to the beaches to the north would be reduced, so it could be expected that there would be enhanced erosion at East Clive. These are obviously complicated issues, involving tradeoffs, so the various options require detailed analyses of the processes, followed by management decisions as to which shore-protection strategy offers the best cost-effective choice. The 62,400 cubic metres per year transport of gravel and coarse sand northward past the Haumoana groyne represents the principal credit in the sediment budget for the beaches to the north, augmented by the sediment contributed to the beach by the Tukituki River, estimated to average 28,000 cubic metres per year. Together these credits amount to about 90,000 cubic metres per year, which would be the average net longshore sediment transport to the north, potentially supplying those beaches. But as seen in the sediment budget for the Haumoana Littoral Cell (Table 1), this sediment volume is progressively reduced by the natural abrasion of the gravel, and especially by its commercial extraction at Awatoto, which on average has amounted to a debit of -47,800 cubic metres per year in the budget. It is estimated that of the original 90,000 cubic metres per year of sediments being transported into this northerly stretch of shore, only about 6,000 cubic metres reaches the Napier shore each year, and it could very well be less than that. Most indicative of the status and potential stability of this northern half of the Haumoana Littoral Cell are the profiles obtained in the monitoring program. Collectively they yield an average net accretion of +3,800 cubic metres per year for this 13-kilometre stretch of shore, which amounts to a mere 0.3 cubic metres of sediment accretion per metre of shoreline length if assumed to occur uniformly along that shore. This is a very low rate of accumulation, likely insufficient to raise the elevations of this shore fast enough to maintain its level relative to the global rise in sea level. As a result, although there has been a history of this beach gaining new sediment, it continues to be susceptible to erosion and flooding hazards. This is apparent in the frequent occurrence of seawater washing into the parking lot of the Aquarium during even moderate storms. Of concern is the eventuality and consequences of much more severe storms, the 100-year event discussed earlier, which can be expected to produce extensive flooding and some erosion along this still susceptible stretch of shore, in spite of its net accretion. The shoreline of the Bay View Littoral Cell is significantly more stable than that of the Haumoana Cell, with no sites having experienced erosion problems in recent years comparable to those at South Haumoana, Te Awanga and Clifton. Its stability primarily came about at the time of the 1931 earthquake when this stretch of shore was raised by about 2 metres (Figure 2). Prior to that event, with its low elevations the gravel beach ridge along this shore was frequently overtopped by storm waves, eroding the gravel from the seaward face of the beach and transporting it over the top to its landward side. Under such hazardous conditions there could have been little development of this shore without the expectation of its eventual loss during a storm. In contrast, the 2-metre uplift resulted in a ridge of gravel that has not been overtopped by storms during the subsequent 75 years, a condition that has permitted the development of this shore with a fair expectation of its safety. However, there is a long-term danger from the progressive loss of the beach gravel through its abrasion, placing the sediment budget in the red (Table 2), with the certainty of there being still greater storms in the future than experienced in recent decades, and the expectation of a more rapid rise in sea level during this century due to global warming. Another factor enhancing the stability of this shore is the absence of a significant net longshore transport of the beach sediment, which was seen to be the process most important in causing erosion along the southern shoreline of the Haumoana Cell. As discussed earlier, while there can be daily reversals in the directions of the gravel transport along the Bay View shore under the changing wave directions from day to day, the long-term net transport of the sediment is close to being zero. However, in response to these reversing directions of the daily transport, sometimes to the north and at other times to the south, there can be “end effect” cycles at the extreme ends of the cell’s shoreline, at Westshore in the south and at Tangoio in the north. During any one year there might be a slight dominance of waves arriving from the northeast, causing slightly more sediment transport to the south

26
than to the north, with that sediment accumulating on the beach at Westshore. During other years there could be more transport to the north, with the loss of beach sediment at Westshore, but a gain at Tangoio. There is some evidence that such cycles correspond with strong El Niños versus La Niñas, with an El Niño tending to produce the southerly transport and beach accretion at Westshore, while La Niñas cause erosion, but documentation of this requires additional research to be verified. Such cycles in sediment transport directions and “end-effect” beach erosion versus accretion appear to have been important in the episodic erosion of the Westshore beach, evident in the beach profiles collected along that shore and analyzed by Keith Smith
18. The profiles he analyzed were surveyed on
nearly an annual basis from 1916 to 1961 along a 4-kilometre stretch of shore at the south end of the Bay View Littoral Cell, including Westshore. The results revealed the occurrence of significant shifts between net erosion and accretion from year to year. The largest cycle occurred during the mid 1950s; between the surveys in 1955 and 1956 this beach gained 40,000 cubic metres of sediment, but in the following year between 1956 and 1957 it lost 40,100 cubic metres. If this cycle occurred uniformly along this 4-kilometre stretch of shore, it was equivalent to first gaining 10 cubic metres of sediment per metre of shoreline length, and then the next year loosing that volume. This is a rather extreme example, with the cycle between erosion and accretion more commonly being on the order of 10,000 to 20,000 cubic metres per year, about 2.5 to 5 cubic metres of beach sediment per metre of shoreline length. This cycle between the growth and loss of the beach fronting Westshore is important to the susceptibility to erosion of the backshore, the presence of the beach acting as a buffer between the forces of the waves and the low bluff along the backshore. The actual episodes of erosion occur during major storms, when the high tide augmented by a storm surge plus the swash runup of the high storm waves cut back the beach and reach the bluff, resulting in its erosion. The most significant storms in recent years that produced erosion in the Westshore area occurred in 1978 and 1985. Smith
19
analyzed the extent of the beach and bluff erosion utilizing a set of 22 profile lines extending along a 1.1-kilometre stretch of The Esplanade, finding that the sediment losses were some 5,000 and 7,600 cubic metres respectively during those two storms (4.5 and 6.9 cubic metres of sediment loss per metre of shoreline length). Those losses included the erosion of the bluff, the seaward edge of the uplifted gravel beach ridge, which retreated by 2.1 metres in 1978 and 3.1 metres in 1985, with six years of stability between. This degree of erosion during those two storms is comparatively small, in view of its episodic nature and the tendency of the beach to recover between the erosion events. Furthermore, there is a wide, largely undeveloped Reserve between this area affected by the erosion and the homes in Westshore, so they were not threatened by this small (total of 5 metres) erosion of the Reserve. Accordingly, in analyzing the impacts of the 1985 storm erosion, O'Callaghan
20 concluded that the
erosion at Westshore "has not been severe in coastal engineering terms" and is "relatively minor". Its occurrence apparently did alarm those living in Westshore, as there immediately followed a number of investigations and reports dealing with the problem, leading to the decision to undertake a beach nourishment program to replace the lost sediment. The first nourishment undertaken at Westshore occurred in February 1987, and involved the importation of 22,000 cubic metres of sediment that had been excavated for Wildlife Ponds in the Ahuriri area, so it consisted of some silt and fine sand that would not be expected to remain on the beach, but with most of the volume being gravel. Later the source of the nourishment sediment shifted to Pacific Beach, supplying more suitable gravel sizes, with the annual rate of nourishment having been on the order of 10,000 cubic metres (not counting the sediment used to elevate the backshore Reserve). Several studies have been undertaken to document the movement of this nourished gravel and to assess the overall success of this operation in rebuilding the Westshore beach and protecting the Reserve from subsequent erosion. The conclusion is that the nourishment program has been a success. The sediment placed on the beach has moved to the north, so it is progressively lost from the South Westshore beach, but it has accumulated along the shore of The Esplanade and perhaps further to the north, enhancing their protection from storm erosion and flooding. It has been recommended that more of the nourished sediment be placed on the South Westshore beach to serve as a “feeder beach” in its movement to the north, a practice that should reduce the small remaining degree of erosion that has been experienced at South Westshore.

27
With the erosion and flooding hazards now largely under control along Westshore, future developments can focus on improvements that would support an increased recreational use of its beach, which at the same time could provide a still greater level of protection from erosion. Interest in recreational improvements has primarily centered on the development of a sand beach. As reviewed in my full report, this could involve the proposed construction of a groyne that trends obliquely to the shoreline along Whakarire Avenue in South Westshore, having the purpose of replacing the existing seawall in protecting the properties there, but also having the benefit of establishing a sheltered pocket where a stable sand beach could form. There has also been interest in the installation of an artificial surfing reef further along the shore to the north, positioned to act as a groyne to help retain sediment placed along the shores of South Westshore and The Esplanade. However, at this stage the potential for these undertakings and their expected success are speculative, as only initial investigations have been undertaken to examine the basic concepts, with no advanced design having been provided. But if further study does indicate that they are feasible, such undertakings would benefit the community as a whole through the establishment of an improved recreational beach, one that might attract more tourists to Hawke’s Bay.
Summary & Discussion
The objective of this report has been to provide a summary of the much longer and more technical report I completed while undertaking a review of the Hawke’s Bay coast and its management. My hope is that this condensed version is more in tune with the general audience who wish to know more about the ocean processes and other factors that affect the shores of Hawke’s Bay, and might represent a threat to the safety of their homes. If additional information is desired, this brief report hopefully has served as the gateway to the presentation of the material found in my full report. The past research investigations and beach monitoring have led to a much better understanding of the Hawke’s Bay coast than can be said for most other coasts of the world. The accumulation of data on the processes acquired in those studies now serves as the basis for the sound management of this coast. These investigations have demonstrated that by and large the Hawke’s Bay coast is relatively stable, with less threat from the ocean’s waves and tides than experienced elsewhere. This is at least true along the stretch of shore that experienced uplift and increased elevations at the time of the 1931 earthquake. In particular, the 2 metre uplift of the Bay View Littoral Cell converted a beach that had been prone to being completely overtopped by the ocean’s water during storms, into an elevated gravel beach ridge that no longer experiences such events that would cause the destruction of shore-front dwellings. In contrast, the shores of the Haumoana Littoral Cell still remain susceptible to erosion and flooding, the beaches having experienced smaller levels of uplift in 1931, or subsidence of up to 1 metre in the communities of South Haumoana, Te Awanga and Clifton, where problems with beach and property erosion continue to be the most extreme in Hawke’s Bay. The investigations further documented that the erosion in those communities is primarily due to its local sediment budget being seriously “in the red”, with greater volumes of beach sediment being transported northward by the waves than are supplied to the beach by the erosion of Cape Kidnappers. Greater attention of future investigations needs to be placed on the erosion at South Haumoana, Te Awanga and Clifton. The potential solution to this problem is not readily apparent, particularly in South Haumoana where most of the seawalls and other hard structures built in the past have failed, and the threat to several homes is immediate. Beach nourishment alone to balance the sediment budget would require large volumes of imported gravel each year, unrealistic quantities that would not be sustainable. Another option discussed here is the construction of groynes to help retain the gravel placed on the beach, reducing the volumes required, but this possible solution likely would cost more than the values of the properties being defended. These various options require investigations to determine how feasible they might be, but in the end the most rational option might be that of retreat and relocate, to move the houses inland or to tear them down.

28
Beginning in the late 1970s a significant portion of the research investigations were directed toward the perceived erosion problem at Westshore, generated by storms in 1978 and 1985 that cut back the bluff backing the beach by a total of about 5 metres. With respect to the degree of erosion that is experienced on other coasts, and seen nearby in South Haumoana, this loss at Westshore can be viewed as having been “relatively minor” (as expressed by the coastal engineer who was involved in the investigations
20). There has been a degree of confusion regarding the causes of the erosion at
Westshore, as well as of the extent of its impacts and threat to the homes there. The conclusion of my investigation is that rather than the breakwater having caused erosion at Westshore, it instead has served to reduce the erosion losses over the years by its having sheltered this shore from the attack of storm waves. Indeed, the reasonable stability of the beach along Westshore can be attributed to the presence of the Port’s breakwater, it acting to reduce the heights of the waves by half from the heights that would have occurred without the sheltering by the breakwater. It is time to put aside the placement of blame on the construction of the Port’s breakwater; instead, it is now important to consider the improved recreational development of this shore, as discussed in my full report and briefly considered here. Although much of the Hawke’s Bay coast is now fairly stable, thanks in large part to its uplift and elevations acquired at the time of the 1931 earthquake, it still faces hazards from extreme storms, the projected rise in sea level during the next one hundred years, and also from the potential occurrence of a tsunami (reviewed in my full report, but not discussed here). It can be expected that sometime in the future this coast will experience a much more severe storm than it has faced during the decades since the development of its shore, with the construction of homes backing the beaches. This extreme event is defined by the 100-year storm, but is better thought of as an event having a 1% probability of occurring during any given year; that is, it might actually occur this year, even though the probability is low. The probability is greater that it will occur during the next 10 years, and becomes a significant possibility for the next 25 to 50 years. Analyses of the waves that have been generated in the past by storms off the coast of Hawke’s Bay lead to the projection that the 100-year storm could generate deep-water significant wave heights on the order of 10 metres, with the largest waves being on the order of 18 meters! The high winds and low atmospheric pressures of the storm would simultaneously generate a storm surge that raises the water levels by 2 metres above the predicted tides, which alone would flood many shore-front properties and shift the forces of those extreme storm waves to higher elevations and shoreward positions, where they could wash directly against the homes that have been constructed too close to the shore. It is the occurrence of extreme events having such magnitudes that are of concern in the management of this coast, to maintain developments safe from the resulting erosion and flooding. Such events are therefore included in the development of hazard zones for the backshore properties, which also account for the long-term progressive erosion of the shore as governed by the balance in the sediment budget. The objective of these hazard zones is to keep homes and other developments built along the ocean’s shores out of the zone of conflict between the ocean and land, the area that is susceptible to future erosion and flooding. They are established to prevent the destructive loss of shore-front homes, and need to be recognized as such by developers and the individuals who own those dwellings. It is in their interest not to suffer the consequences of the destructive forces of storms, a continuation of the erosion of their shore front that has occurred in recent decades, the rise in the level of the sea expected during this century, and perhaps the occurrence of a catastrophic event such as a tsunami. Endnotes 1 Marshall, P. (1933) Effects of the earthquake on the coastline near Napier: New Zealand Journal
of Science and Technology, v. 15, p. 79-92. Quote from page 80. 2 Marshall, P. (1933) Effects of the earthquake on the coastline near Napier: New Zealand Journal
of Science and Technology, v. 15, p. 79-92. Quote from page 83. 3 Single, M. B. (1985) Post-Earthquake Beach Response, Napier, New Zealand: Masters of Arts
thesis, University of Canterbury, 150 pp.

29
4 Gorman, R. M., K. R. Bryan and A. K. Laing (2003) A wave hindcast for the New Zealand region — Deep water wave climate: New Zealand Journal of Marine and Freshwater Research, v. 37, p. 589-611.
5 Gibb, J. G. (1962) Wave refraction patterns in Hawke Bay: New Zealand Journal of Marine and
Freshwater Research, 5: 435-444. 6 Bell, R. G., T. M. Hume and D. M. Hicks (2001) Planning for Climate Change: Effects on Coastal
Margins: New Zealand Climate Change Programme, Ministry for the Environment, Wellington, 100 pp.
7 Reed, A. H. (1958) The Story of Hawke’s Bay: published by A. H. & A. W. Reed, Wellington, pages 264-265.
8 The primary proponents of the opinion that the breakwater prevented gravel from bypassing Bluff Hill and therefore was the cause of the erosion of the Western Spit and later Westshore have been Mr. Keith Smith and Dr. Jeremy Gibb: Gibb, J. G. (1996) Coastal Hazard Zone Assessment for the Napier City Coastline between the Ahuriri Entrance and Esk River Mouth: Report prepared for Napier City Council, C.R. 96/2, 80 pp.; Smith, R. K. (1993) Westshore Beach Erosion Review: Report to Napier City Council, NIWA, Hamilton, Consultancy Report No. NAP004, December 1993, 17 pp.
9 Kirk, R. M., and M. B. Single (1999) Coastal Change at Napier with Special Reference to Erosion at Westshore: A Review of Causative Factors: Land and Water Studies International Ltd., Christchurch, 55 pp. + diagrams.
10 Saunders, F. (1882) Memoranda on the Port of Napier: Napier Harbour Board Report, 5 pp.; Carr, J. T. (1893) Report to the Board by the Chief Engineer: Napier Harbour Board, 18 July 1893, Port of Napier Ltd.
11 Smith, R. K. (1968) South Hawke Bay Beaches: Sediments and Morphology: Masters of Arts thesis, University of Canterbury, Christchurch.
12 A review of the effects of jetties (moles) and breakwaters can be found in my 1998 textbook Beach Processes and Sedimentation (Prentice-Hall), while the nearly symmetrical pattern of shoreline changes that occurs when jetties are constructed on shorelines where there is not a net longshore transport of the sediment is the condition found on the Oregon coast where I have undertaken most of my research (Komar, P. D., and others, 1976, Oregon coast shoreline changes due to jetties: Journal of Waterways, Harbors, and Coastal Engineering Division, Amer. Society of Civil Engineers, 102: 13-30).
13 Finch, F. (1919) Engineers Report to the Harbour Board, Napier; Port of Napier Ltd.; Fisher, S. M. (1976) Hawke's Bay Harbour Board, Breakwater Harbour South Groyne: Report to Napier Harbour Board, Napier, 4 typed pages plus diagrams and Appendix.
14 Stevenson, H. K. (1977) Port and People: Century at the Port of Napier: Hawke's Bay Harbour Board.
15 Campbell, M. D. N. (1975) Story of Napier 1874-1974 (Footprints Along the Shore): Published by the Napier City Council, 252 pp.
16 The principal investigations of the sediment budgets for the Hawke’s Bay beaches are found in two reports: Gibb, J. G. (2003) Review of the Westshore Nourishment Scheme - Napier City: Report prepared for Napier City Council, 40 pp + diagrams; Tonkin & Taylor (2005) Shoreline Modelling Report: report to the Hawke's Bay Regional Council.
17 Komar, P.D. (1998) Beach Processes and Sedimentation: Prentice-Hall Inc., Upper Saddle River, New Jersey, 544 pp.
18 Smith, R. K. (1993) Westshore Beach Erosion Review: NIWA Consultancy Report No. NAP004. 19 Smith, R. K. (1986) Coastal Erosion at Westshore, Hawke Bay: Ministry of Works and
Development, Water Quality Centre, Hamilton, Internal Report No. IR/85/11. 20 O’Callaghan, R. B. (1986) Report on the Coastal Protection of Westshore Beach, Napier. _____________________________________________
Dr. Paul D. Komar is Professor Emeritus of Oceanography at Oregon State University in Corvallis, Oregon. His specialty as a Coastal Oceanographer has focused his research on the ocean processes of waves, tides and changing sea levels, and their effects on beaches and roles in the erosion of coastal properties. This research has been undertaken primarily on the West Coast of the United States, but he has also been involved in studies of the erosion along the Nile Delta of Egypt and in New

30
Zealand. He has authored more that 150 scientific papers in professional journals, and is author of the textbook Beach Processes and Sedimentation published in 1998 by Prentice-Hall.