Peer Editing, A Good Idea? Zainab Al Balushy Sultan Qaboos University.

SQU Journal for Science, 2019, 24(1), 23-35 DOI: 10.24200/squjs.vol24iss1pp1-23-35
Sultan Qaboos University
23
Preparation and Characterization of Acidic, Basic and Hydrophobic Dehydrated Carbons and their Capability for Methylene Blue Adsorption
El-Said I. El-Shafey*, Syeda N.F. Ali, Haider Al-Lawati, Saleh N. Al-Busafi
Department of Chemistey, College of Science, Sultan Qaboos University, P.O. Box 36, PC 123, Al-Khod, Muscat, Sultanate of Oman. *Email: [email protected].
ABSTRACT: Dehydrated carbon (DC) was prepared from date palm leaflets via sulfuric acid treatment. DC was
functionalized via amide coupling using ethylene diamine (EDA) and propylene diamine (PDA) to produce basic
dehydrated carbons (BDCs): BDC-EDA and BDC-PDA, respectively, and using ethylamine (EA) and aniline (AN) to
produce hydrophobic dehydrated carbons (HDCs): HDC-EA and HDC-AN, respectively. Surface areas were found
low, between 6.7-16 m2/g with mesoporosity domination. FTIR shows that –COOH content on DC almost disappeared
after surface functionalization. Faster adsorption of methylene blue with larger adsorption capacity was found on HDC-
EA than other adsorbents because of stronger hydrophobic interaction forces.
Keywords: Dehydrated carbon; Acidic; Basic; Hydrophobic; Methylene blue.
إمتزاز الميثيلين الازرق ىتحضير وتوصيف الكربون المنزوع المياه الحمضي والقاعدي والكاره للمياه وقدرتهم عل
البوصافيالسعيد إبراهيم الشافعي ، سيده ناهيج فرقان علي ، حيدر اللواتي و صالح
من سعف النخيل عن طريق المعالجة بحمض الكبريتيك. وقد تم إضافة مجموعات سطحية بواسطة (DC)تم تحضير الكربون منزوع المياه :صلخمال
-BDC و BDC-PDAلانتاج الكربون القاعدي منزوع المياه (PDA)وبروبيلين ثنائي الأميد (EDA)اقتران الأميد مستخدما ايثيلين ثنائي الأميد
EDA وتم ايضا استخدام أمين الايثيل(EA) والانيلين(AN) لانتاج الكربون الكاره للمياهHDC-EA و HDC-ANأن مساحة سطح . بينت الدراسة
متر 67و 7.6الكربون كانت منخفضة وتتراوح بين 2
إختفاء مجموعات /جم وتغلب عليها المسامية المتوسطة. وبينت دراسة الاشعة تحت الحمراء
بعد عملية تحوير السطح وظيفيا. وأظهرت الدراسة أيضا أن امتزاز الميثيلين الازرق كان (DC)الكربون منزوع المياه الكربوكسيل من علي سطح
وذلك لوجود قوي تجاذب كارهة للماء. HDC-EAالاسرع والاكثر سعة علي الكربون الكاره للمياه
.الميثيلين الازرق ،الكاره للمياه ،القاعدي ،الحمضي ،الكربون المنزوع المياه : مفتاحيةالكلمات ال
1. Introduction
ulfuric and phosphoric acids, as dehydrating agents, are capable of carbonizing celluloses and hemicelluloses via
the removal of water [1,2]. Hanzawa and Satonaka, in their early studies, prepared chars from raw materials such
as filter papers, saw-dust and mandarin orange peel using sulfuric and phosphoric acids [3,4]. The carbon was named
as “shitsujunkasseitan” (moistened active charcoal) and later as “suikakasseitan” (hydrated active charcoal) [3,4]. In
recent studies, carbon produced by dehydration was called “chemically prepared” [5] or “chemically carbonized” [6]
and “dehydrated carbon” [7]. Different agricultural resources have been utilized for the production of dehydrated
carbon (DC) using sulfuric acid, including flax shive [8], rice husk [5], peanut shell [9] and date palm leaflets [1,3,10].
Phosphoric acid has also been utilized to produce dehydrated carbon from date palm leaflets [1,11]. Previous studies
have shown that DC, prepared by sulfuric acid treatment, is acidic and possesses a high content of acidic functional
groups (carboxylic, lactonic and phenolic) with low pHzpc [2,10]. DC is cheaply prepared [10] and due to its high
carboxylic content it can be functionalized directly via amide coupling. On the other hand, activated carbon is costive
as it requires high energy to prepare and an oxidation step to insert carboxylic groups on its surface before surface
functionalization [12].
S

EL-SAID IBRAHIM EL-SHAFEY ET AL
24
In this study, DC was prepared from date palm leaflets using sulfuric acid dehydration/oxidation followed by
surface functionalization using amines and diamines to produce hydrophobic and basic dehydrated carbons,
respectively. DC and functionalized DCs were surface characterized and tested for methylene blue (MB) adsorption in
terms of kinetics and equilibrium.
2. Materials and Methods
2.1 Materials
Chemicals used were of analytical grade. Dry date palm leaflets (Phoenix Dactylifera L.) were collected from a
local farm in Muscat. The leaflets, after cleaning with deionized water, were dried and cut to small pieces (1 cm length)
before use in dehydrated carbon preparation.
2.2 Dehydrated carbon preparation and surface functionalization
An amount of 50 g of concentrated sulfuric acid was added dropwise with constant stirring to a mixture of 25 g of
clean dry leaflets and ~ 200 ml deionized water. The mixture was left to carbonize at 200 ˚C in an oven for 8 hours.
The DC produced was left to cool and residual acid was filtered in a Buchner funnel. The DC was washed several
times with deionized water until the wash water showed no change in methyl orange color, indicating that the DC had
become acid free. The DC was allowed to dry to constant weight at 120 ˚C. After cooling in a desiccator, it was kept in
a well-closed polyethylene jars.
Amide coupling surface functionalization follows a method published earlier for oxidized activated carbon [12].
Ethylene diamine (1,2-diaminoethane), EDA, and propylene diamine (1,3-diamino propane), PDA, were immobilized
on the surface of DC to produce basic dehydrated carbons (BDCs) as follows. A mixture of 15 g dry DC and 100 ml of
25 % thionyl chloride in toluene was kept under reflux for 6 hours at 70 ˚C, during which time -COOH groups were
converted to -COCl groups. Residual reagents were allowed to evaporate using a rotary evaporator. The sample was
dried at 85 ˚C for 2 hours in an oven, followed by reacting with 100 ml (0.75 M) EDA or PDA at 90 ˚C for 24 hours
under reflux. On completion of the reaction, nitrogen-containing functional groups were immobilized on the DC
surface via amide coupling. For the preparation of hydrophobic dehydrated carbons (HDCs), 15 g of dry DC was
allowed to undergo reflux with 200 ml of 50 % thionyl chloride in toluene at 70˚C for 6 hours in a 250 ml round
bottomed flask. The product was allowed to cool and the solvents were dried using a rotary evaporator. After
evaporation, 100 ml ethylamine (EA) or aniline (AN) were immediately mixed with the carbon and the mixture was
left under reflux for 2 hours at 90 oC. The carbons were purified via soxhlet extraction with 150 ml acetone for 6 hours,
followed by washing with deionized water. Residual amines or diamines were removed via washing using 1 M HCl.
Another washing using 1 M NaOH was carried out to deprotonate amine groups. Finally, the carbons were washed
with deionized water to remove residual base. The carbons were left to dry at 70 ˚C in an oven under vacuum (0.1 atm)
until constant weight was obtained. BDCs produced using EDA and PDA are referred as BDC-EDA and BDC-PDA,
respectively, and HACs produced using EA and AN are named HDC-EA and HDC-AN, respectively. A schematic
illustration for surface functionalization of DC is shown in Figure 1.
Figure 1. Schematic representation of DC surface functionalization.

PREPARATION AND CHARACTERIZATION OF ACIDIC
25
2.3 Surface characterization
The surface area of dehydrated carbons was measured using ASAP 2020 (Micrometrics, USA) via nitrogen
adsorption at 77 K with degassing at 70 ˚C for 24 hours under vacuum. Higher degassing temperature was avoided to
prevent possible changes on the carbon surface structure. Apparent density was determined using a standard method
[13]. X-ray powder diffraction was conducted using a Philips PW 1830 generator with a Philips PW 1050 powder
goniometer (Philips, USA) and copper Kα as the incident radiation. Scanning electron microscopy (SEM) was carried
out using a JEOL/EO JSM 5600 with 20 kV accelerating voltage. Using acetanilide as a reference, CHN analysis was
carried out using a Euro EA 3000 elemental analyzer (Eurovector, Italy). Infrared analysis was carried out using a FT-
IR spectrometer Spectrun BX, Berkin Elmer, (Germany). Surface zero point of charge (pHzpc) was determined
following the procedure of Moreno-castilla et al. [14]. Quantification of carboxyl, lactone, phenol and carbonyl groups
on the carbon surface was carried out using Boehm titrations [15]. Surface basicity was determined following a method
published earlier [12]. Cation exchange capacity (CEC) was determined following the procedure of a standard method
[16]. Thermogravimetric analysis was conducted using SDT Q600 Simultaneous DSC-TGA apparatus (TA
instruments, USA) under nitrogen in a flow rate of 100 ml/min with a heating rate of 20 ˚C/min from room temperature
to 785 ˚C. Zeta potential was determined as a function of pH using a SurPASSTM
electrokinetic analyzer (UK) as
follows. ~ 0.05 g of carbon was mixed with 0.001 M KCl solution (prepared in CO2-free water). The pH was adjusted
using drops of 0.05 M of NaOH and 0.05 M HCl.
2.4 Adsorption of methylene blue
A stock solution of MB (1000 mg/L) was prepared in deionized water. Standard and test solutions were prepared
by suitable dilution in deionized water. Kinetic and equilibrium studies were conducted at 25 ˚C with pH 7.0 as initial
pH. Initial pH was adjusted using drops of 0.1 M HCl or 0.1 M NaOH before carbon mixing. In the kinetic study, 0.1 g
of carbon was added to 50 ml of MB (100 mg/L) at 25 ˚C. At different periods of time, an aliquot of supernatant was
withdrawn for analysis and the adsorption process was followed for ~60 hours under mechanical agitation (100
rpm/min). For the equilibrium study, 0.05 g of carbon was mixed with 25 ml of MB solution (10–700) mg/L at 25 ˚C
under mechanical agitation (100 rpm/min) until the equilibrium was reached. Residual MB concentration was
determined using a Varian/Cary/50 Conc UV-visible spectrophotometer at λmax 665 nm with deionized water as blank.
All the experiments and analysis were carried out at least twice.
3. Results and Discussion
3.1 Surface area and porosity
The adsorption desorption isotherms of nitrogen at 77 K, shown in Figure 2, exhibit characteristics of both Type I
and Type IV isotherms according to the classification of Sing et al. [17], but with more dominant characteristics of type
IV and a larger extent of mesoporosity [18]. Based on the IUPAC classification, the adsorption isotherms show an H3
hysteresis loop type (Figure 2).
Figure 2. Nitrogen adsorption isotherms at 77 K on DC and modified DCs.
Total surface area (SBET) was calculated using the BET equation [19]. According to the Gurvich rule [20], total
pore volume (Vt) can be determined from the amount of nitrogen adsorbed at a high relative pressure such as P/Po=
0.98. Micropore volume (Vmicro) and mesopore surface area (Smeso) were estimated using the t-plot method [20] taking

EL-SAID IBRAHIM EL-SHAFEY ET AL
26
into consideration the theoretical thickness of the adsorbed nitrogen layer (t) on carbon black [21] as a reference
isotherm (Eq.1). It is more appropriate to use that reference isotherm for carbon-like adsorbents [12,20,22,23].
t= 0.88(P/Po)2 + 6.45(P/Po) + 2.98 A
o (1)
Smeso is determined from the slope of the straight line, but Vmicro is determined from its intercept.
The micropore surface area (Smicro) can be determined from Eq. 2 [20,24] while mesopore volume (Vmeso) can be
estimated from Eq. 3, [12,25].
Smicro= SBET - Smeso (2)
Vmeso =Vt-Vmicro (3)
Fig. 3
Figure 3. Pore size distribution of DC and functionalized DCs.
(DC) )BDC-EDA)
)BDC-PDA) )HDC-EA)
)HDC-AN)

PREPARATION AND CHARACTERIZATION OF ACIDIC
27
Table 1. Surface textural properties of DC and functionalized DCs.
Carbon SBET
(m2/g)
BET-C Vt
(ml/g)
D (Ao) Smeso
(m2/g)
Smicro
(m2/g)
Vmicro
(ml/g)
Vmeso
(ml/g)
Apparent
density
(cm3/g)
DC 11.55 48.29 0.431 149.1 10.59 0.963 0.0002 0.0428 0.190
BDC-EDA 10.727 270.4 0.0472 176.1 6.985 3.74 0.00164 0.04557 0.254
BDC-PDA 9.884 104.8 0.0319 125.8 8.496 1.388 0.0006 0.0305 0.230
HDC-EA 6.717 308.5 0.0166 98.85 4.74 1.977 0.0009 0.0157 0.290
HDC-AN 15.82 98.21 0.0408 103.3 14.58 1.245 0.0005 0.0403 0.289
During DC preparation, as water evaporates, sulfuric acid concentrates carbonizing the leaflets via the
dehydration of cellulose and hemicelluloses with partial fragmentation to lignin and partial oxidation to the surface
[8,10]. The surface area of DC and modified DCs is low, as presented in Table 1, unlike activated carbon [12]. Similar
low values of surface area were reported previously for dehydrated carbons prepared via sulfuric acid treatment from
flax shive (19 m2/g) [8], rice husk (66 m
2/g) [26] and date palm leaflets (24 m
2/g) [27]. The low surface area of DC is
related to the higher content of carbon-oxygen hydrophilic groups that occupy a large fraction of its surface, restricting
the adsorption of the non-polar nitrogen molecules [10]. The surface area of BDC-EDA, BDC-PDA and HDC-EA is
slightly decreased as a result of surface functionalization. This is probably because the chemically-immobilized chains
block, or limit to some extent, the access of nitrogen molecules to some active sites on their surfaces. For HDC-AN, a
slight rise in surface area was noticed. The anilide groups on its surface perhaps provided some active sites for nitrogen
adsorption. Mesoporosity dominates the surface texture of DC and functionalized DCs (Table 1). In a previous study
[12], the surface area of activated carbon was high (823 m2/g). However, on surface functionalization, it was
tremendously decreased [12].
Pore size distribution was investigated using the Barrett–Joyner–Halenda (BJH) model for mesopores and the
Horvath–Kawazoe (HK) model for micropores [12,28] showing bimodal pore structure (micro and meso), Figure 3.
DC and modified DCs possess different ranges of mesopores with a common peak at ~ 38 A˚ and limited
microporosity. As shown in Figure 2, nitrogen adsorption on DC and modified DCs show H3 hysteresis type with no
plateau at high P/P˚ values. Thus, Vt values are, to an extent, unreliable [19,20] and thus, the parameters associated with
Vt including D, Vmeso and pore size distribution may not be accurate [19,20]. The apparent density is generally low
ranging between 0.19 - 0.29 cm3/g (Table 1).
3.2 X-ray powder diffraction and SEM
The general structure of dehydrated carbons is amorphous, with a common peak at 2θ of 22˚ which can be related
to amorphous silica [10,30]. The X-ray diffraction pattern of DC as representative of all DCs is presented in Figure 4.
SEM micrographs of carbons (Figure 5) show that DC and modified DCs keep to some extent the fibrous features of
the plant morphology with wide pores on their surfaces. The SEM photographic method of identifying pores depends
on the sections selected for imaging. In addition, the currently achievable resolution levels make the characterization of
most micropores in carbons difficult [29].
Figure 4. X-ray diffraction of DC.
3.3 FTIR
The broad band between 3400 – 3000 cm-1
, Figure 6, for DC corresponds to -OH stretching vibration. Other
functionalized DCs show weak and broad bands, in the same region, that can be related to N-H stretching vibrations in

EL-SAID IBRAHIM EL-SHAFEY ET AL
28
amide and amines on BDCs, and to amide on HDCs. The bands in that region are broad probably because of H-
bonding involved among those groups [31].
Figure 5. SEM photographs of DC and functionalized DCs.
The bands at 2920 and 2850 cm-1
refer to C-H asymmetric and symmetric stretching vibration in the –CH2 group,
respectively. A strong band at ~1700 cm-1
for DC indicates the presence of –COO- on its surface. This band almost
disappeared for BDCs and HDCs as a result of amide coupling. The bands between 1600-1540 cm-1
correspond to C=O
and the skeletal C=C aromatic vibrations in all carbons [31]. The band that appears at 1460 cm-1
for DC refers to C-H
bending vibration for the –CH2 group. The small band that appears around 1440 cm-1
for functionalized DCs refers to
C−N stretching vibrations in amine and amide groups in BDCs, and amide in HDCs. However, such a band is not
(DC-EDA)
(DC-PDA) (DC-EA)
(DC-AN)
(DC)

PREPARATION AND CHARACTERIZATION OF ACIDIC
29
available for DC (Figure 6). The bands between 1400–1000 cm−1
are assigned to the O−H bending and C−O stretching
vibrations such as phenols, ether, ester and carboxylic acids [31].
Figure 6. FTIR of DC and functionalized DCs.
3.4 Surface chemical characterization
CHN analysis, presented in Table 2, shows a high content of elemental carbon for DC. However, after surface
functionalization, a decrease in carbon content is observed except for HDC-AN. Nitrogen content is higher for BDCs
than HDCs and is the minimum for DC. The high nitrogen content on BDCs is attributed to the presence of amide and
amine groups immobilized on their surfaces. DC shows more carboxylic and CEC with lower pHzpc than functionalized
DCs, indicating the acidic nature of DC (Table 2). Although there is no significant variation of lactone, phenol and
carbonyl groups after surface functionalization, the carboxyl content and CEC were clearly decreased by surface
functionalization. pHzpc values for BDCs fall within an alkaline range, but for HDCs it is around neutrality (Table 2).
BDCs possess more surface basicity than other carbons because of the presence of amine groups immobilized on their
surfaces.
Table 2. Surface chemical properties of DC and functionalized DCs.
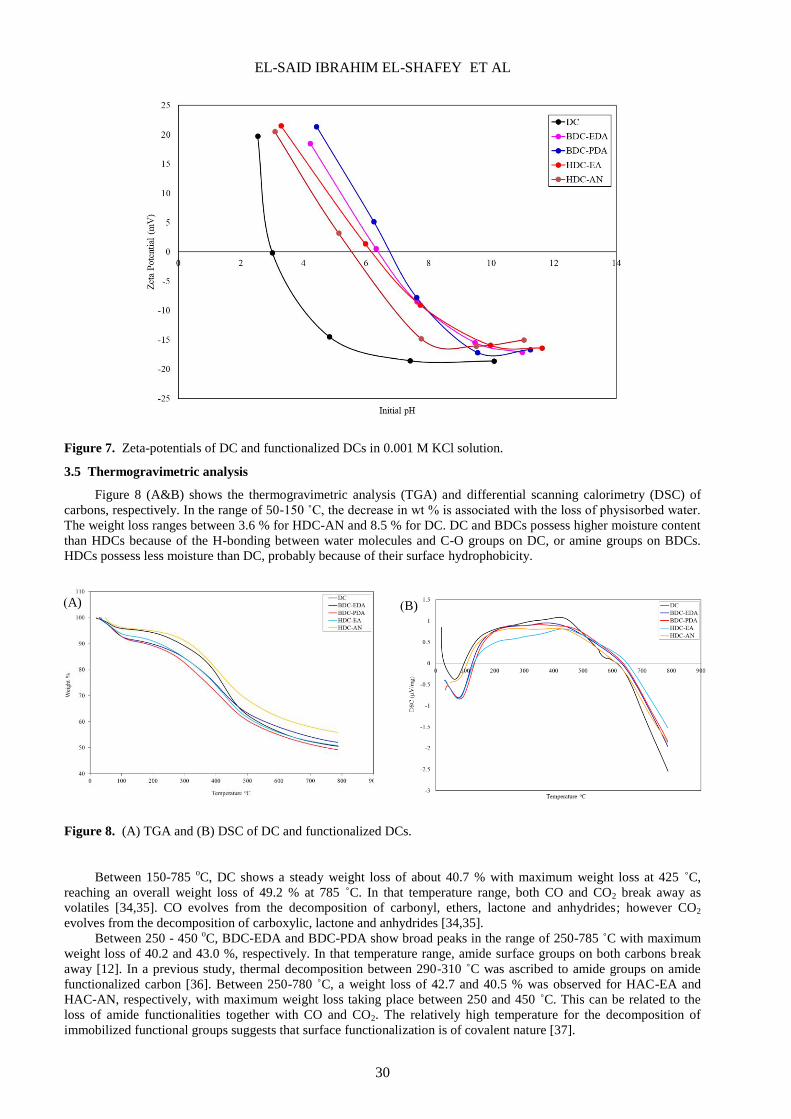
As shown in Figure 7, as pH increases, zeta-potential becomes more negative because of OH- deposition on the
carbon surface [32]. The pH of the isoelectric point (pHIEP) for DC is the lowest (~ 3). This is related to the
deprotonation of carboxylic groups, which are abundant on DC, and which mainly occur in the pH range of 2-6 [33].
Surface functionalization has led to a decrease in carboxylic group content and accordingly, zeta-potentials of HDCs
and BDCs have become less negative than DC. pHIEP shifts to higher values of 6.2, 5.6, 6.5 and 6.8 for HDC-EA,
HDC-AN, BDC-EDA and BDC-PDA, respectively (Figure 7). The shifts in pHIEP are related to the decrease in surface
acidity.
Carbon pHzpc
CEC
(meq/
100 g)
Surface functionality (meq/g) Surface
basicity
(meq/g)
CHN analysis (%)
carboxyl lactone phenol carbonyl C H N
DC 3.24 87.1 2.45 0.23 0.82 1.65 0.36 51.72 4.24 0.52
BDC-EDA 7.7 23.0 0.62 0.21 0.86 1.234 1.52 44.3 4.17 6.15
BDC -PDA 7.6 16.5 0.63 0.23 0.83 0.927 1.9 46.73 4.47 5.82
HDC-EA 7.03 21.4 0.61 0.22 0.81 0.824 0.23 45.71 4.29 3.65
HDC-AN 6.82 26.3 0.62 0.24 0.82 0.88 0.19 64.03 4.22 4.87
EL-SAID IBRAHIM EL-SHAFEY ET AL
30
Figure 7. Zeta-potentials of DC and functionalized DCs in 0.001 M KCl solution.
3.5 Thermogravimetric analysis
Figure 8 (A&B) shows the thermogravimetric analysis (TGA) and differential scanning calorimetry (DSC) of
carbons, respectively. In the range of 50-150 ˚C, the decrease in wt % is associated with the loss of physisorbed water.
The weight loss ranges between 3.6 % for HDC-AN and 8.5 % for DC. DC and BDCs possess higher moisture content
than HDCs because of the H-bonding between water molecules and C-O groups on DC, or amine groups on BDCs.
HDCs possess less moisture than DC, probably because of their surface hydrophobicity.
Figure 8. (A) TGA and (B) DSC of DC and functionalized DCs.
Between 150-785 oC, DC shows a steady weight loss of about 40.7 % with maximum weight loss at 425 ˚C,
reaching an overall weight loss of 49.2 % at 785 ˚C. In that temperature range, both CO and CO2 break away as
volatiles [34,35]. CO evolves from the decomposition of carbonyl, ethers, lactone and anhydrides; however CO2
evolves from the decomposition of carboxylic, lactone and anhydrides [34,35].
Between 250 - 450 oC, BDC-EDA and BDC-PDA show broad peaks in the range of 250-785 ˚C with maximum
weight loss of 40.2 and 43.0 %, respectively. In that temperature range, amide surface groups on both carbons break
away [12]. In a previous study, thermal decomposition between 290-310 ˚C was ascribed to amide groups on amide
functionalized carbon [36]. Between 250-780 ˚C, a weight loss of 42.7 and 40.5 % was observed for HAC-EA and
HAC-AN, respectively, with maximum weight loss taking place between 250 and 450 ˚C. This can be related to the
loss of amide functionalities together with CO and CO2. The relatively high temperature for the decomposition of
immobilized functional groups suggests that surface functionalization is of covalent nature [37].
)A) )B)

PREPARATION AND CHARACTERIZATION OF ACIDIC
31
3.6 Methylene blue adsorption
In the kinetic experiment, HDCs and BDCs show the fastest and the slowest MB adsorption, respectively (Figure
9). Pseudo first and pseudo second order kinetic models [38] were tested for the adsorption kinetic data, Equations 4
and 5.
Log(qe-qt) = log qe – k1t/2.303 (4)
t/qt =1/k2qe2 + t/qe (5)
where k1 and k2 are rate constants for pseudo first and second order models, respectively. qt is the amount of MB
adsorbed per gram of adsorbent (mg/g) at time t. The initial adsorption rate is calculated from k2 using Eq. 6 [38].
h = k2qe2
(6)
The pseudo second order model, presented in Figure 10, better fits the adsorption data with high R2 values than the
pseudo first order model, Table 3, suggesting a mechanism of sharing or exchange of electrons between the carbon
surface and MB molecules [38]. The values of k2 and initial rate h follow the order: HDCs> DC> BDCs (Table 3). The
mechanism of interaction of MB with the carbon surface depends mainly on the surface nature of the carbons. HDCs
exhibit strong hydrophobic interaction with MB molecules. DC is negatively charged at pH 7 and, thus, interacts with
the cationic MB molecules via electrostatic forces. MB adsorption on BDCs involves H-bonding between amine
groups on BDCs and MB molecules.
Figure 9. Kinetics of methylene blue adsorption on DC and functionalized DCs at 25 ˚C. (Initial pH 7.0).
Figure 10. Pseudo second order model application for methylene blue adsorption on DC and functionalized DCs at
25 ˚C. (Initial pH 7.0).

EL-SAID IBRAHIM EL-SHAFEY ET AL
32
Table 3. Kinetic models’ parameters of methylene blue adsorption on DC and functionalized DCs.
Carbon Pseudo second order model Pseudo first order model
Rate const k2
(g/mg/hr)
Initial
adsorption rate,
h (mg/g/hr)
qe (mg/g) R2 k1
(hr-1
) qe (mg/g) R
2
DC 0.0056 7.41 36.36 0.9987 0.0912 34.51 0.9144
BDC-EDA 0.0047 5.85 35.09 0.9972 0.0795 32.98 0.9066
BDC-PDA 0.0048 5.01 32.47 0.9982 0.0949 39.78 0.8271
HDC-EA 0.0223 89.3 63.29 0.9999 0.117 36.67 0.9221
HDC-AN 0.0130 8.18 25.13 0.9995 0.0679 21.03 0.9464
Equilibrium adsorption data follow well the L-type adsorption isotherm (Figure 11). The equilibrium
adsorption data were tested for the Langmuir and Freundlich equations (Eqs.7and 8).
Ce/qe = 1/b.q + Ce/q (7)
log qe = log K + 1/n log Ce (8)
where K (L1/n
mg1-1/n
/g) and 1/n are Freundich constants which are considered to be relative indicators of
adsorption capacity and adsorption intensity, respectively. q and b are the Langmuir constants which are related
to the monolayer adsorption capacity (mg/g) and the relative energy of adsorption (L/mg), respectively.
Figure 11. Methylene blue adsorption on DC and functionalized DCs at 25 ˚C. (Initial pH 7.0).
The equilibrium adsorption data better fit the Langmuir model (Figure 12) with high R2 values than the
Freundlich model indicating the formation of a monolayer of MB molecules on carbon surfaces at equilibrium
(Table 4). Maximum uptake (q) follows the order: HAC-EA> DC > BDC-EDA > BDC-PDA > HDC-AN.
[39] used a dimensionless factor, Rs, Eq. 9, to indicate the favorability of an adsorption system. Rs is the
separation factor which is a direct function of the Langmuir constant b.
Rs = 1/(bCo +1) (9)
Rs values indicate the shape of the isotherm: Rs >1 (unfavorable), Rs = 1 (linear), 1>Rs>0 (favorable) and Rs = 0
(irreversible) [39]. As presented in Table 4, Rs values are all between 0 and 1 indicating ‘favorable adsorption’. Strong
binding between the MB and HDC-EA, in particular, shows the lowest Rs values. MB adsorption onto the different
carbons involves different dominating adsorption forces depending on the nature of the carbons’ surfaces. HDC-EA
shows the largest MB adsorption capacity involving strong hydrophobic interactions between the ethyl chains on its
surface and MB molecules. Although HDC-AN shows a high adsorption rate of MB, its adsorption capacity is the
lowest. This is probably due to a steric effect provided by the immobilized anilide groups on HDC-AN [12]. On the

PREPARATION AND CHARACTERIZATION OF ACIDIC
33
other hand, DC is acidic and negatively charged at pH 7. It adsorbs the MB (cationic dye) dominantly via electrostatic
attraction. BDCs probably involves H-bonding (between the amine groups on MB and -NH2 groups on BDCs surface)
and hydrophobic forces involving the ethylene and propylene chains and MB molecules.
Figure 12. Langmuir adsorption isotherm for the adsorption of Methylene blue on DC and functionalized DCs
at 25 ˚C (Initial pH 7).
Table 4. Equilibrium parameters for Methylene blue adsorption on DC and modified DCs.
Adsorbent Langmuir Constants Separation
factor, Rs
R2
Freundlich Constants R2
q (mg/g) b (L/mg) 1/n K
DC 196.1 0.0372 0.029-0.73 0.9989 0.482 12.9 0.8803
BDC-EDA 153.8 0.0252 0.038-0.80 0.9989 0.468 9.60 0.9214
BDC-PDA 133.3 0.0262 0.026-0.62 0.9990 0.453 8.99 0.9260
HDC-EA 294.1 0.0626 0.016-0.61 0.9997 0.475 23.8 0.8941
HDC-AN 34.36 0.0447 0.022-0.69 0.9998 0.310 5.40 0.8488
The low surface area of DC and functionalized DCs is not the main factor of MB adsorption. However, the
surface chemistry that involves different interaction forces with MB has the most influence on MB adsorption. In our
previous study, hydrophobic activated carbon by ethylamine surface area (9.9 m2/g) showed better performance in MB
removal than activated carbon surface area (823 m2/g) [12]. HDC-EA, in this study (surface area 6.7 m
2/g) shows
faster adsorption of MB and larger adsorption capacity (294 mg/g) than activated carbon (surface area 823 m2/g) with
an adsorption capacity of 270 mg/g for MB [12]. In other studies, the adsorption capacity of MB was 47.6 and 126.9
mg/g on activated carbon developed from Ficus carica bast [40] and that developed from biomass waste by H2SO4
activation, respectively [41]. The adsorption capacity of MB on activated carbon in those studies is still lower than that
of HDC-EA in this study.
4. Conclusion
DC and modified DCs, in this study, possess low surface area. DC is acidic with low pHzpc. The procedure used
for surface functionalization to produce BDCs and HDCs is successful as shown from pHzpc, FTIR, TGA and CHN.
The dominating interaction forces between methylene blue and carbon surface depend strongly on the nature of carbon
surfaces: electrostatic interaction for DC, hydrophobic interaction for HDCs, and hydrogen bonding for BDCs are the
dominating forces. Despite the fact that HAC-EA possesses low surface area (by nitrogen adsorption), it shows
outstanding performance for methylene blue adsorption. In addition to being cheap to prepare if compared with
activated carbon, DC can be functionalized to improve its efficiency for methylene blue removal.
Acknowledgement
The authors would like to thank the Research Council, Sultanate of Oman for funding (RC/SCI/CHEM/2013/01).

EL-SAID IBRAHIM EL-SHAFEY ET AL
34
References
1. El-Shafey, E.I, Al-Hashmi, A.H.R. Sorption of lead and silver from aqueous solution on phosphoric acid
dehydrated carbon. Journal of Environmental Chemical Engineering, 2013, 1, 934-44.
2. El-Shafey, E.I., Al-Lawati, H.A, Al-Saidi, W.S. Adsorption of lisinopril and chlorpheniramine from aqueous
solution on dehydrated and activated carbons. Carbon Letters, 2016, 19, 12-22.
3. Hanzawa, M.; Satonaka, S. Crabonization of wood by dehydrating agent. I. Preparation and decolourizing power
of hydrated active charcoal from wood. Research Bulletin of The College Experiment Forests Hokkaido
University, 1955, 17, 439-463.
4. Hanzawa, M.; Satonaka, S., Crabonization of wood by dehydrating agent. II. Preparation and decolourizing
power of hydrated active charcoal from Betula tauschii wood. Research Bulletin of The College Experiment
Forests Hokkaido University, 1956, 18, 13-16.
5. El-Shafey, E.I. Removal of Zn(II) and Hg(II) from aqueous solution on a carbonaceous sorbent chemically
prepared from rice husk. Journal of Hazardous Materials, 2010, 175, 319-327.
6. El-Shafey, E.I.; Al-Kindy, S.M.Z. Removal of Cu2+
and Ag+ from aqueous solution on a chemically-carbonized
sorbent from date palm leaflets. Environmental Technology, 2013, 34, 395-406.
7. El-Shafey, E.I., Al-Busafi, S., Al-Lawati, H., Al-Shibli, S. Competitive removal of heavy metals from spiked
hospital wastewater on acidic and chelating dehydrated carbons. Separation Science and Technology, 2016, 51,
2348-2359.
8. Cox, M., El-Shafey, E.I., Pichugin, A.A., Appleton, Q. Preparation and characterisation of a carbon adsorbent
from flax shive by dehydration with sulfuric acid. Journal of Chemical technology & Biotechnology, 1999, 74,
1019-1029.
9. El-Shafey, E.I. Removal of Se(IV) from aqueous solution using sulphuric acid-treated peanut shell. Journal of
Environmental Management, 2007, 84, 620-627.
10. El-Shafey, E.I., Al-Lawati, H.A.J., Al-Husaini, A. Adsorption of fexofenadine and diphenhydramine on
dehydrated and activated carbons from date palm leaflets. Chemistry and Ecology, 2014, 30, 765-783.
11. El-Shafey, E.I. Immobilization of Hg(II) to Hg(0) on reducing dehydrated carbons. Journal of Medical and
Biomedical Engineering, 2014, 3, 292-296.
12. El-Shafey, E.I., Ali, S.N., Al-Busafi, S., Al-Lawati, H.A. Preparation and characterization of surface
functionalized activated carbons from date palm leaflets and application for methylene blue removal. Journal of
Environmental Chemical Engineering, 2016, 4, 2713-2724.
13. Standard test method for apparent density of activated carbon. Annual book of ASTM Standards, 1996, D 2854-
96.
14. Moreno-Castilla, C., Lopez-Ramon M.V., Carrasco-Marın F. Changes in surface chemistry of activated carbons
by wet oxidation. Carbon, 2000, 38, 1995-2001.
15. Boehm, H.P. Chemical Identification of Surface Groups. In Advances in Catalysis. Academic Press, 1966, 16,
179-274.
16. Thorpe, A. Collaborative study of the cation exchange capacity of peat materials. Journal of the Association of
Official Analytical Chemists, 1973, 56, 154-156.
17. Sing, K.S.W., Everett, D.H., Haul, R.A.W., Moscou, L., Pierotti, R.A., Rouquerol, J., Siemienewska, T.
Reporting physisorption data for gas–solid systems, Pure and Applied Chemistry, 1985, 57, 603–619.
18. Giraldo, L., Moreno-Piraján, J.C. Synthesis of activated carbon mesoporous from coffee waste and its application
in adsorption zinc and mercury ions from aqueous solution. E-Journal of Chemistry, 2012, 9, 938-948.
19. Thommes, M. Physical adsorption characterization of nanoporous materials. Chemie Ingenieur Technik, 2010,
82, 1059-1073.
20. Lowell, S., Shields, J.E., Thomas, M.A. and Thommes, M. Characterization of porous solids and powders:
surface area, pore size and density. Springer Science & Business Media, 2012, 16, 58-254.
21. Standard test method for carbon black- Total and external surface area by nitrogen adsorption, Annual book of
ASTM standards, 2012, D-6556-01.
22. Miura, K., Yanazawa, H., Nakai, K. The effect of burn-off on the adsorption of N2 and Ar on a natural graphite.
Adsorption, 2007, 13, 139-147.
23. Razdyakonova, G.I., Kokhanovskaya, O.A., Likholobov, V.A. Influence of environmental conditions on carbon
Black oxidation by reactive oxygen intermediates. Procedia Engineering Journal, 2015, 113, 43-50.
24. Zhao, C., Liu, L., Zhao, H., Krall, A., Wen, Z., Chen, J., Hurley, P., Jiang, G., Li, Y. Sulfur-infiltrated porous
carbon microspheres with controllable multi-modal pore size distribution for high energy lithium–sulfur batteries.
Nanoscale, 2014, 6, 882-888.
25. Hesas, R.H., Arami-Niya, A., Daud, W.M.A.W., Sahu, J.N., Preparation and characterization of activated carbon
from apple waste by microwave-assisted phosphoric acid activation: application in methylene blue
adsorption. Bioresources, 2013, 8, 2950-2966.
26. El-Shafey, E.I. Sorption of Cd(II) and Se(IV) from aqueous solution using modified rice husk. Journal of
Hazardous Materials, 2007, 147, 546-555.

PREPARATION AND CHARACTERIZATION OF ACIDIC
35
27. El-Shafey, E.I.; Al-Lawati, H.; Al-Sumri, A.S. Ciprofloxacin adsorption from aqueous solution onto chemically
prepared carbon from date palm leaflets. Journal of Environmental Science, 2012, 24,1579-1586.
28. Gregg, S.J. and Sing, K.S.W. Adsorption, surface area and porosity, 2nd
ed., Academic Press, London, UK,
1982.
29. Achaw, O.W. A study of the porosity of activated carbons using the scanning electron microscope. In Scanning
Electron Microscopy, INTECH, 2012, Chapter 24, 473-490.
30. Mopoung, S. Surface image of charcoal and activated charcoal from banana peel. Journal of the Microscopy
Society of Thailand, 2008, 22, 15-19.
31. Gómez-Serrano, V., Acedo-Ramos, M., López-Peinado, A.J., Valenzuela-Calahorro, C. Oxidation of activated
carbon by hydrogen peroxide. Study of surface functional groups by FT-i.r. Fuel, 1994, 43, 387-395.
32. Lu, C., Chiu. H., Liu, C., Removal of zinc (II) from aqueous solution by purified carbon nanotubes: kinetics and
equilibrium studies. Industrial Engineering Chemistry Research, 2006, 45, 2850-2855.
33. Harry, I.D., Saha, B., Cumming, I.W. Effect of electrochemical oxidation of activated carbon fiber on
competitive and noncompetitive sorption of trace toxic metal ions from aqueous solution. Journal of Colloid and
Interface Science, 2006, 304, 9-20.
34. Moreno-Castilla, C., Ferro-Garcia, M.A., Joly, J.P., Bautista-Toledo, I., Carrasco-Marin, F., Rivera-Utrilla, J.
Activated carbon surface modifications by nitric acid, hydrogen peroxide, and ammonium peroxydisulfate
treatments. Langmuir, 1995, 11, 4386-4392.
35. Figueiredo, J.L., Pereira, M.F.R., Freitas, M.M.A., Orfao, J.J.M. Modification of the surface chemistry of
activated carbons. Carbon, 1999, 37, 379-1389.
36. Niyogi, S., Bekyarova, E., Itkis, M.E., McWilliams, J.L., Hamon, M.A, Haddon, R.C. Solution properties of
graphite and grapheme. Journal of the American Chemical Society, 2006, 128, 7720-7721.
37. Collins, W.R., Lewandowski, W., Schmois, E., Walish, J., Swager, T.M. Claisen rearrangement of graphite
oxide: a route to covalently functionalized graphenes. Angewandte Chemie-International Edition, 2011, 123,
9010-9014.
38. Ho, Y.S., Mckay, G. Sorption of dye from aqueous solution by peat. Chemical Engineering Journal, 1998, 70,
115-124.
39. Hall, K.R., Eagleton, L.C., Acrivos, A., Vermeulen, T. Pore-and solid-diffusion kinetics in fixed-bed adsorption
under constant-pattern conditions. Industrial & Engineering Chemistry Fundamentals, 1966, 5, 212-223.
40. Pathania, D., Sharma, S., Singh, P. Removal of methylene blue by adsorption onto activated carbon developed
from Ficus carica bast. Arabian Journal of Chemistry, 2017, 10, 1445-1451.
41. Jawad, A.H., Rashid, R.A., Ishak, M.A.M., Wilson, L.D., 2016. Adsorption of methylene blue onto activated
carbon developed from biomass waste by H2SO4 activation: kinetic, equilibrium and thermodynamic
studies. Desalination and Water Treatment, 2016, 57, 25194-25206.
Received 17 September 2018
Accepted 5 February 2019